• Data exploration to better understand data and uncover relationships otherwise unseen (for example, identifying leading indicators of money laundering). • Quick insight to understand patterns, trends, and anomalies that will lead to better decisions and more effective actions (for example, identifying declining service levels). • Interactive analysis to answer the second and third questions you may not have had initially, but discovered through the visual inspection of your data. • Predictive analytics through regression and clustering to anticipate and mitigate future events such as fraud or loan delinquency. • Visual storytelling to engage senior management and effectively communicate the most important information. Bring your data into focus with visualization. At a time when data volumes continue to expand unchecked, FI Consulting and Tableau are partnering to offer data visualization solutions that help our clients gain clarity and actionable insight from the ever-expanding sea of big data. FI Consulting’s data visualization solutions help our clients achieve results through: www.ficonsulting.com | 1500 Wilson Blvd. | 4th Floor | Arlington, VA 22209 | Phone: 571.255.6900 Analyzing and Visualizing your Data with Tableau Case Study USDA approached FI with a problem: they needed to ensure that rural communities have sufficient access to low income housing. To do this, USDA needed to proactively monitor properties to gain an understanding of which properties were scheduled to leave their Rural Development Multi-Family Section 515 Housing Program, and in what time frame, over the next several years. FI had the answer: we conducted an analysis to determine the best way to forecast when borrowers would repay their loan and exit the program. Using Tableau and R, FI created a dashboard that allowed business users to see which borrowers were projected to leave the program, and when. Additionally, users could drill into the underlying data to see current loan terms and loan history, allowing for deeper borrower insights. A state view was added so that state offices could see which properties were scheduled to leave by year of expected exit. The work done by FI was so valuable that USDA sought to provide even greater transparency by providing access to the dashboard to a broader audience, eventually posting it on Tableau Public. External stakeholders outside of USDA use the analysis in decision making related to low income housing in rural areas. You can view the dashboard by visiting www.ficonsulting.com/tableau. As a leader in analytics and data visualization, FI Consulting applies our unique blend of domain acumen, analytical expertise, and technological know-how to deliver impactful results.
Transcript
• Dataexploration to better understand data and uncover relationships otherwise unseen (for example, identifying leading indicators of money laundering).
• Quickinsight to understand patterns, trends, and anomalies that will lead to better decisions and more effective actions (for example, identifying declining service levels).
• Interactiveanalysis to answer the second and
third questions you may not have had initially, but discovered through the visual inspection of your data.
• Predictiveanalyticsthrough regression and clustering to anticipate and mitigate future events such as fraud or loan delinquency.
• Visualstorytellingto engage senior management and effectively communicate the most important information.
www.ficonsulting.com | 1500 Wilson Blvd. | 4th Floor | Arlington, VA 22209 | Phone: 571.255.6900
Analyzing and Visualizing your Data with Tableau
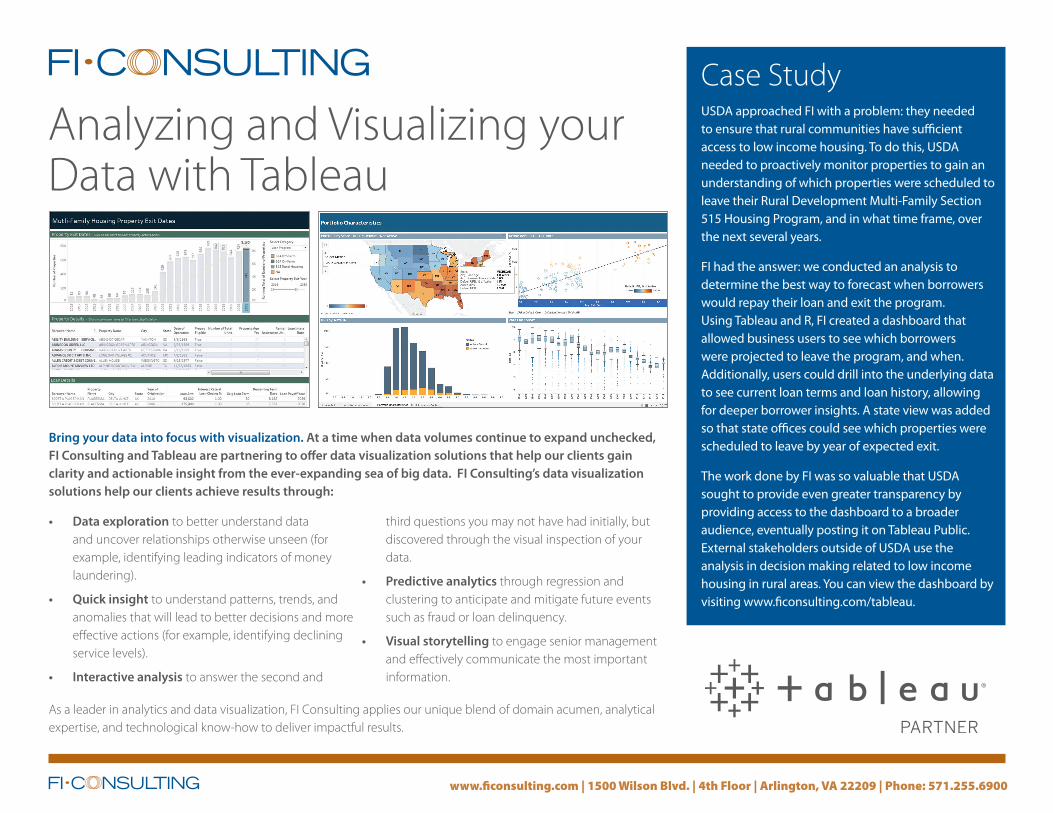
Case StudyUSDA approached FI with a problem: they needed to ensure that rural communities have sufficient access to low income housing. To do this, USDA needed to proactively monitor properties to gain an understanding of which properties were scheduled to leave their Rural Development Multi-Family Section 515 Housing Program, and in what time frame, over the next several years.
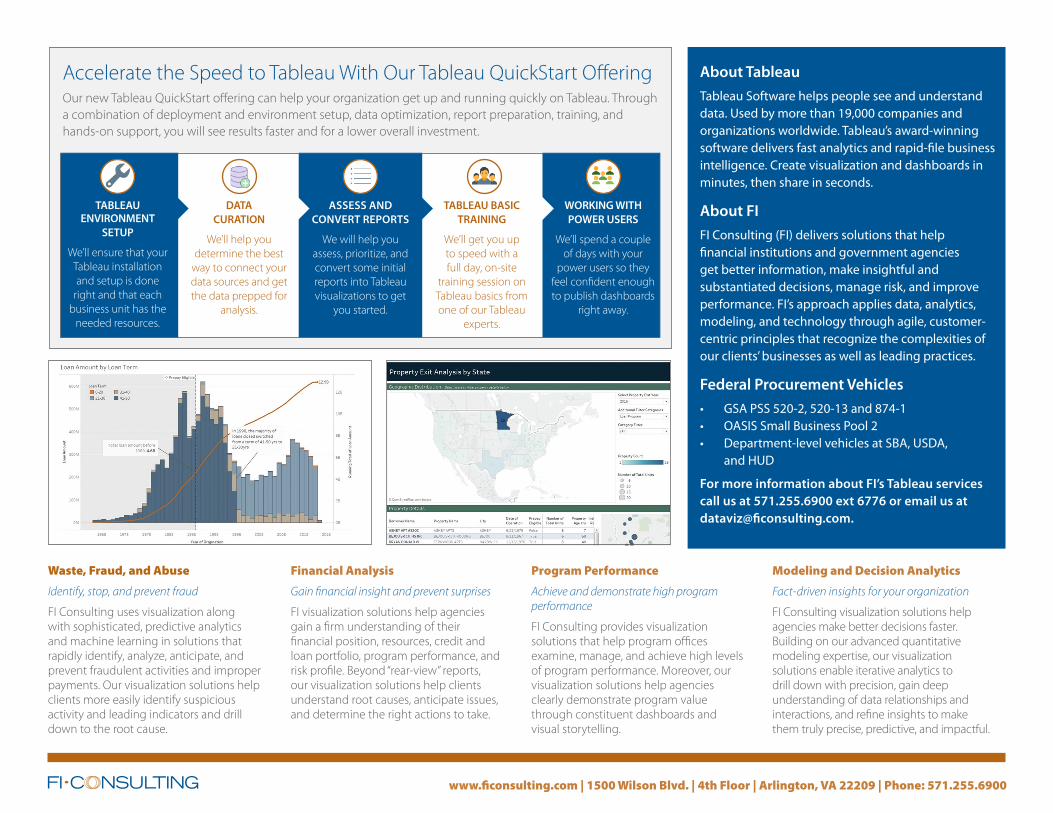
FI had the answer: we conducted an analysis to determine the best way to forecast when borrowers would repay their loan and exit the program. Using Tableau and R, FI created a dashboard that allowed business users to see which borrowers were projected to leave the program, and when. Additionally, users could drill into the underlying data to see current loan terms and loan history, allowing for deeper borrower insights. A state view was added so that state offices could see which properties were scheduled to leave by year of expected exit.
The work done by FI was so valuable that USDA sought to provide even greater transparency by providing access to the dashboard to a broader audience, eventually posting it on Tableau Public. External stakeholders outside of USDA use the analysis in decision making related to low income housing in rural areas. You can view the dashboard by visiting www.ficonsulting.com/tableau.
As a leader in analytics and data visualization, FI Consulting applies our unique blend of domain acumen, analytical expertise, and technological know-how to deliver impactful results.
www.ficonsulting.com | 1500 Wilson Blvd. | 4th Floor | Arlington, VA 22209 | Phone: 571.255.6900
AboutTableauTableau Software helps people see and understand data. Used by more than 19,000 companies and organizations worldwide. Tableau’s award-winning software delivers fast analytics and rapid-file business intelligence. Create visualization and dashboards in minutes, then share in seconds.
AboutFIFI Consulting (FI) delivers solutions that help financial institutions and government agencies get better information, make insightful and substantiated decisions, manage risk, and improve performance. FI’s approach applies data, analytics, modeling, and technology through agile, customer-centric principles that recognize the complexities of our clients’ businesses as well as leading practices.
FederalProcurementVehicles• GSA PSS 520-2, 520-13 and 874-1• OASIS Small Business Pool 2• Department-level vehicles at SBA, USDA,
Accelerate the Speed to Tableau With Our Tableau QuickStart OfferingOur new Tableau QuickStart offering can help your organization get up and running quickly on Tableau. Through a combination of deployment and environment setup, data optimization, report preparation, training, and hands-on support, you will see results faster and for a lower overall investment.
TABLEAUENVIRONMENT
SETUP
We’ll ensure that your Tableau installation and setup is done
right and that each business unit has the
needed resources.
DATACURATION
We’ll help you determine the best
way to connect your data sources and get the data prepped for
analysis.
ASSESSANDCONVERTREPORTS
We will help you assess, prioritize, and convert some initial reports into Tableau visualizations to get
you started.
TABLEAUBASICTRAINING
We’ll get you up to speed with a full day, on-site
training session on Tableau basics from one of our Tableau
experts.
WORKINGWITHPOWERUSERS
We’ll spend a couple of days with your
power users so they feel confident enough to publish dashboards
right away.
4
Waste, Fraud, and Abuse
Identify, stop, and prevent fraud
FI Consulting uses visualization along with sophisticated, predictive analytics and machine learning in solutions that rapidly identify, analyze, anticipate, and prevent fraudulent activities and improper payments. Our visualization solutions help clients more easily identify suspicious activity and leading indicators and drill down to the root cause.
Financial Analysis
Gain financial insight and prevent surprises
FI visualization solutions help agencies gain a firm understanding of their financial position, resources, credit and loan portfolio, program performance, and risk profile. Beyond “rear-view” reports, our visualization solutions help clients understand root causes, anticipate issues, and determine the right actions to take.
Program Performance
Achieve and demonstrate high program performance
FI Consulting provides visualization solutions that help program offices examine, manage, and achieve high levels of program performance. Moreover, our visualization solutions help agencies clearly demonstrate program value through constituent dashboards and visual storytelling.
Modeling and Decision Analytics
Fact-driven insights for your organization
FI Consulting visualization solutions help agencies make better decisions faster. Building on our advanced quantitative modeling expertise, our visualization solutions enable iterative analytics to drill down with precision, gain deep understanding of data relationships and interactions, and refine insights to make them truly precise, predictive, and impactful.