Case study: beer microfiltration Ruud van der Sman 1 , Martijntje Vollebregt 1 , Gerard van Willigenburg 2 , Verena Eisner 1 1 Food Biobased Research, 2 Systems & Control Wageningen Research & University
Transcript
Case study: beer microfiltration
Ruud van der Sman1, Martijntje Vollebregt1, Gerard van Willigenburg2, Verena Eisner1
1Food Biobased Research, 2Systems & Control Wageningen Research & University
Aims
Example of “food separation process” Industrial application (Pentair Xflow):
clarification of pilsner beer (e.g. Heineken) Use of crossflow microfiltration with membranes Unfiltrated beer contains particles fouling membrane Project aim:
develop model-based control to minimize energy costs and chemical cleaning
Current process
Constant process conditions: permeate flux and cross flow flux Transmembrane pressure is measured and controlled:
mild cleaning (BW) if TMP exceeds threshold Filtration time is measured and controlled:
harsher cleaning (CIP) if too short filtration time
Pores (20-0.5μm) & selective pores (0.2-0.5 μm)
feed
permeate
Time ->
TMP
->
F BW F BW F BW CIP
Approach
Define objective function Develop first principles model (physics based) Perform scouting experiments to verify hypotheses Model reduction (scale analysis; integration) Parameter estimation from experiment Develop and verify optimization and control strategy
Objective function
Goal: minimize costs Problem:
scheduling of BF and CIP and determining process setting for cross flow and permeate flux -> mixed integer problem Assumption: identical behaviour between CIPs:
- membrane as new after CIP - feed composition the same after each CIP
Cost function and constraints
Cost function: Constraints:
● Given volume of beer must be filtered in given time ● Filtration duration is bounded ● TMP may not exceed maximum value ● Fluxes are bounded
( )Costs of one CIP cycle
: Costs of filtering beer : to be minimized (o) : Number of CIP's (CIP cycles) during full run (o): Number of backflushes in between every two
c E bf bf c
c
bf
J N J N C C
JNN
= + +
CIP's (o)
: Electricity costs pumping (o) : Costs single backflush (g)
: Costs single CIP (g)
E
bf
c
JCCo: unknown; g: given
Hypotheses for beer filtration with Xflow membranes
Cake layer is formed by yeast + permanent haze (monodisperse) Shear-induced diffusion Removable by backwash (BW)
Small aggregates screened by the cake layer, clog the membrane: support layer + pore blocking Removable by harsher cleaning (CIP)
No macromolecules fouling
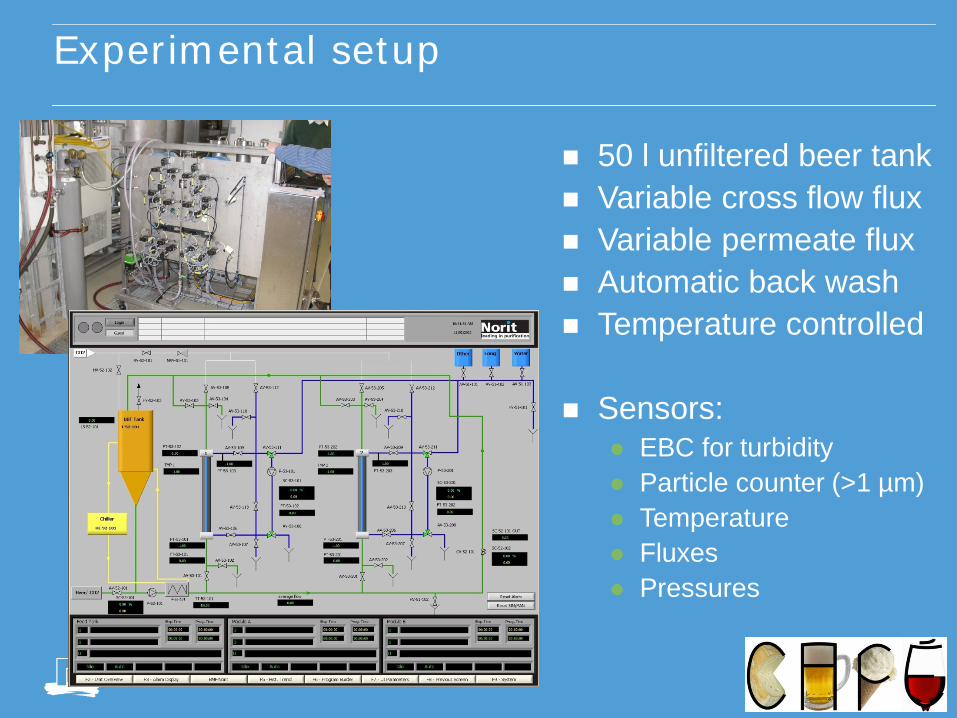
Experimental setup
50 l unfiltered beer tank Variable cross flow flux Variable permeate flux Automatic back wash Temperature controlled
Sensors:
EBC for turbidity Particle counter (>1 µm) Temperature Fluxes Pressures
Ontology and experimental database
Store data in it’s context to enable: ● Human interpretation of the data ● Automated identification and use of relevant data ● Allowing access of models to data
Allow flexible set-up of ontology and database such that changes can easily be made without redesigning Experimental database:
● Save storage of experimental results
● Connect hypotheses to experiments
● Use for parameter estimation
Model development
Shear-induced diffusion state-of-the-art model using effective temperature
Vollebregt, van der Sman, Boom Soft Matter, 2010
Model reduction: scale analysis
Scale analysis = integration
Model reduction: integration x-direction
Boundary layer problem: integrate over height bulk region + boundary layer
Complete reduced model
Romero & Davis model
Fouling modes Fluid dynamics
Simulation results: sample output
Important parameter for cake formation
xcr/L ~ (Jcross/Jwall)3
Experimental design
Vary Jcross/Jwall (constant cross flow flux, or constant permeate flux) Different batches of beer (phiyeast, phiaggr) Important parameter for practice = filtration time
0 200 400 600 800 10000
0.2
0.4
0.6
0.8
1
1.2
time (minutes)
TMP
(bar
)
Beer type 1
0 100 200 300 400 500 6000
0.2
0.4
0.6
0.8
1
1.2
time (minutes)
TMP
(bar
)
Beer type 2
TMP profiles in time for two different beer types. Red: module 1, black: module 2
Filtration time for different CFV / permeate flux ratios for filtration period 1 to 7
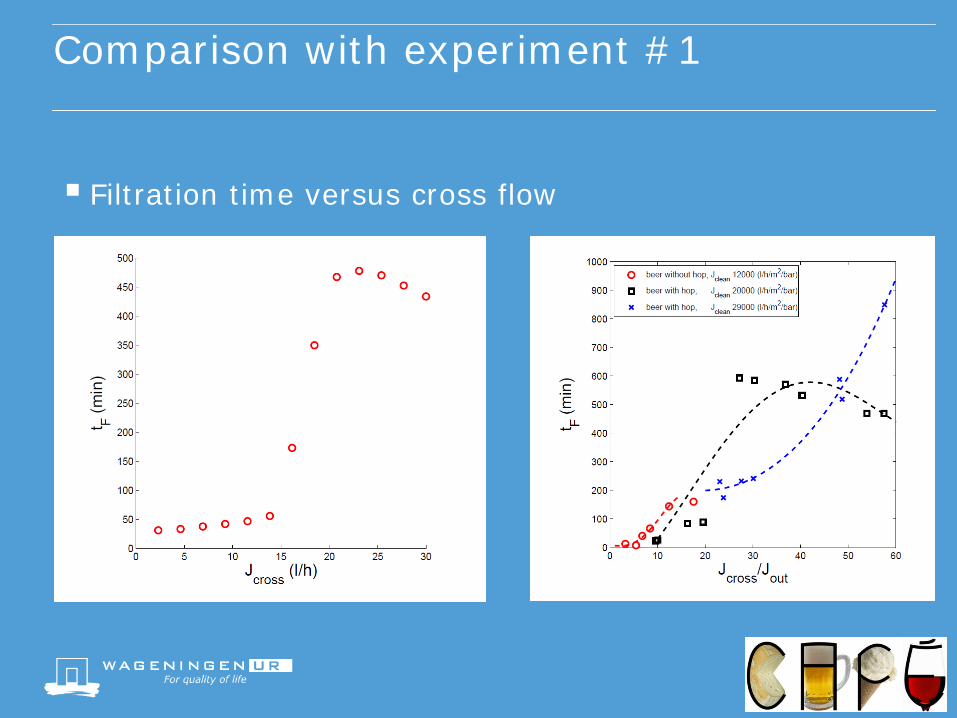
Comparison with experiment #1
Filtration time versus cross flow
Comparison with experiment #2
Filtration at various cross flow fluxes (2.5 – 15 l/h) Permeate flux = 0.26 l/h
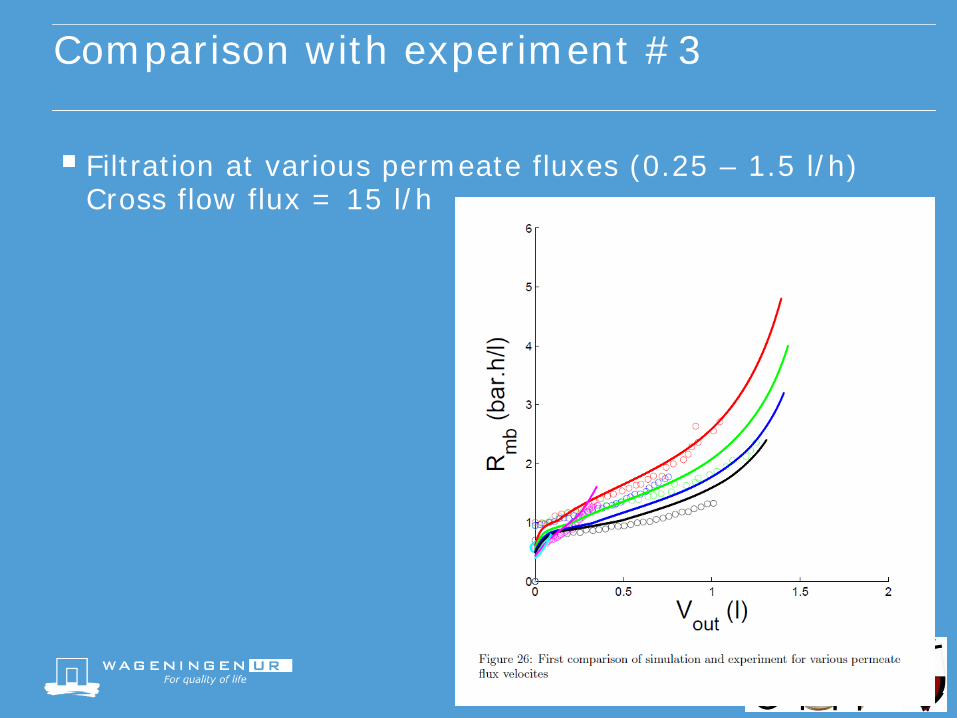
Comparison with experiment #3
Filtration at various permeate fluxes (0.25 – 1.5 l/h) Cross flow flux = 15 l/h
Comparison with experiment #4
TMP during multiple filtration runs
Optimization and control strategy
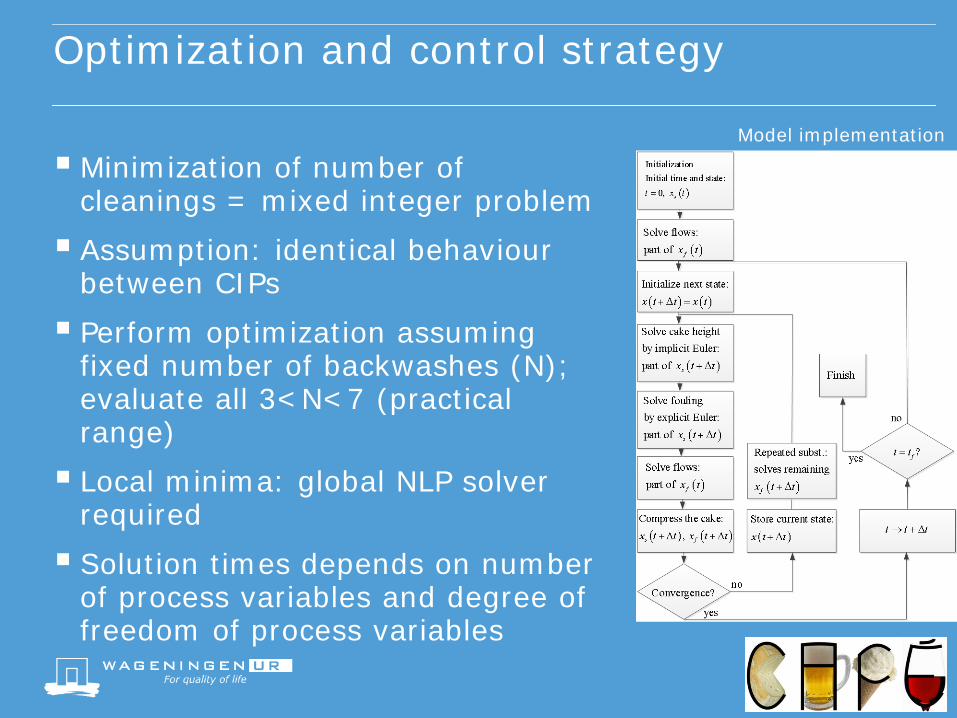
Minimization of number of cleanings = mixed integer problem Assumption: identical behaviour
between CIPs Perform optimization assuming
fixed number of backwashes (N); evaluate all 3<N<7 (practical range) Local minima: global NLP solver
required Solution times depends on number
of process variables and degree of freedom of process variables
Model implementation
Optimization and control strategy
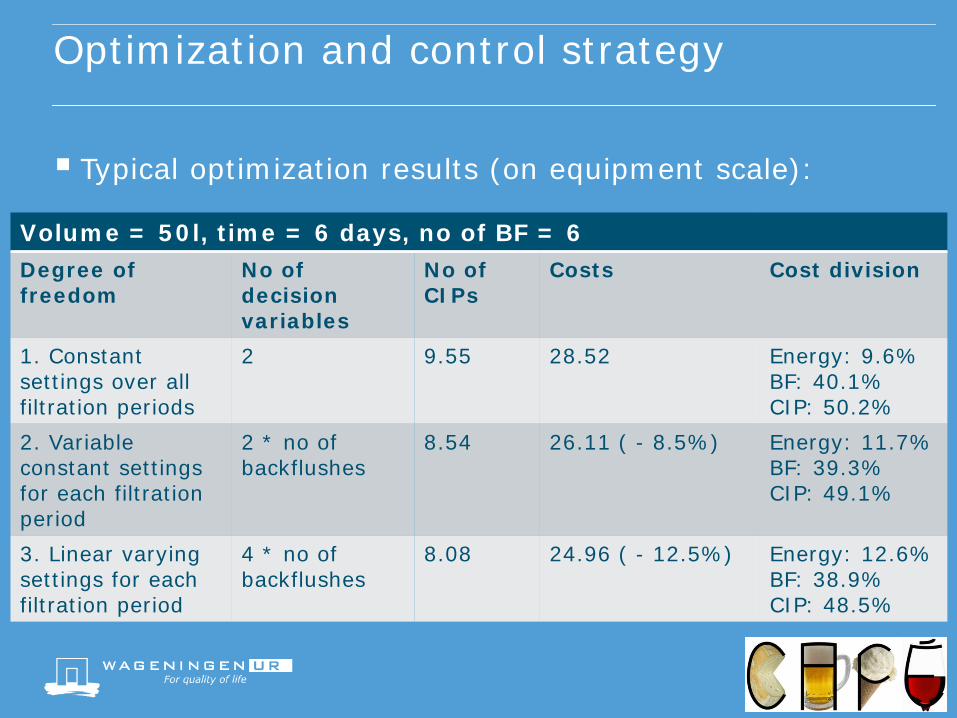
Typical optimization results (on equipment scale):
Volume = 50l, time = 6 days, no of BF = 6 Degree of freedom
No of decision variables
No of CIPs
Costs Cost division
1. Constant settings over all filtration periods
2 9.55 28.52 Energy: 9.6% BF: 40.1% CIP: 50.2%
2. Variable constant settings for each filtration period
Typical optimization results (on equipment scale):
Cross flow flux (left) and permeate flux (right) settings in time for given assignment of filtering 50 liter beer in 6 days.
0 5 10 150
5
10
15J = 24.97, OCh = 1, Nbf = 6, Nc = 8.08, Total time: 142 h
time [h]
J cros
s [l/h
]
0 5 10 150
0.1
0.2
0.3
0.4
J = 24.97, OCh = 1, Nbf = 6, Nc = 8.08, Total time: 142 h
time [h]
J out [l
/h]
Optimization and control strategy
Optimization shows that cost reduction > 10% Control strategy:
● Start filtration assignment ● Estimate essential parameters from first filtration ● Calculate optimal process settings for next filtration
periods ● Upon too much deviation with reality: re-estimate
parameters
Conclusions
Unfiltrated beer is a complex fluid Multiple, interacting modes of membrane Backtransport by shear-induced diffusion
described by state-of-the-art model (effective temp.) Model predicts TMP(t) reasonably well Particle size distribution sensor has much promise Control problem is mixed-integer problem New paradigm: Optimal policy with varying cross flow