13
Case Study Food Contact: Leachables in Tea Released by: Mark Jordi, Ph.D. President Job Number: Tea Case Study CONFIDENTIAL
Case Study Food Contact: Leachables in Tea
Released by:
Mark Jordi, Ph.D. President
Job Number: Tea Case Study
CONFIDENTIAL

October 26, 2017 Customer Phone Contact Email Address Dear Customer, Please find enclosed the test results for your samples described as:
1. 100% pure black tea, Single Serving Cup 2. 100% pure black tea, Loose Tea Leaves 3. 100% pure black tea, Tea Bag
The following tests were performed:
1. Quadrupole Time-of-Flight Gas Chromatography Mass Spectrometry (QTOF GCMS) 2. Quadrupole Time of Flight Liquid Chromatography Mass Spectrometry (QTOF-LCMS)
Objective The goal of this analysis was to compare leachables from the tea leaves with different brewing methods. Summary of Results Three Black Tea extracts were prepared via different brewing methods (labeled as Single Serving Cup, Tea Bag, and Loose Tea Leaves), and analyzed by QTOF-GCMS and QTOF-LCMS. Compounds detected in all three extracts were generally consistent, most of which are common natural compounds in tea leaves, such as caffeine, theophylline, and gallic acid. In addition, the Single Serving Cup was found to have trace levels of compounds consistent with cyclohexanone and 2-Hydroxy-iso-butyrophenone. A compound consistent with 2,4,6-tri-tert-butyl-phenol (antioxidant) was only detected in samples Tea Bag and Loose Tea Leaves. Individual Test Results A summary of the individual test results is provided below. All accompanying data, including spectra, has been included in the data section of this report.

Next Steps The compounds unique to the Single Serving Cup, Tea Bag and Loose Tea Leaves samples can be quantitated by GCMS. Sample Preparation The brewing apparatus was first brewed with no Single Serving Cup installed five times in order to rinse the machine. Then 6 oz of hot water was collected from the brewing apparatus and used as a control blank. Three different formats for the tea (Single Serving Cup, Tea Bag or Loose Team Leaves) were compared. The same brand and type of tea was examined for all sample formats. For sample Single Serving Cup, the Black Tea in a Single Serving Cup was brewed with 6 oz of hot water using the brewing apparatus, and the extract was collected. For sample Tea Bag, the Black Tea in a tea bag was placed in a 250 mL glass container, and 6 oz of hot water from the brewing apparatus was added, and the tea bag was removed after 4 minutes. For sample Loose Tea Leaves, the Black Tea in a tea bag were taken out from the tea bag, and the tea leaves were placed in a 250 mL glass container followed by adding 6 oz of hot water from the brewing apparatus. After 4 minutes, the tea extracted was collected by vacuum filtration using a paper filter. QTOF GCMS GCMS analysis was performed in electron impact modes. The spectra collected using electron impact (EI) ionization can be compared to the NIST mass spectral database for identification. In addition fragments can be identified using the accurate mass data collected. This ionization mode is high energy and generally causes a large amount of analyte fragmentation. In many cases the EI mass spectra collected only contain fragment ions making definitive unknown identification impossible for compounds not present in the mass spectral database. Chemical ionization (CI) provides less energy and causes significantly less fragmentation. The CI data collected can, in most cases, be used to determine the molecular formula for a particular compound using the molecular formula generation (MFG) algorithm. Sample Preparation An aliquot of each sample extract and the control blank was extracted with DCM at 1:1 ratio, and the DCM extracts were collected and analyzed by QTOF-GCMS without further preparation.

Results Compounds detected in all three samples were generally consistent. The major compound detected in all three tea extracts was consistent with caffeine. Several trace level compounds consistent with cyclohexanone and 2-Hydroxy-iso-butyrophenone were only detected in sample Single Serving Cup, while a compound consistent with 2,4,6-tri-tert-butyl-phenol (antioxidant) was only detected in samples Tea Bag and Loose Tea Leaves. The GCMS results are summarized in Table 1. Figure 1 and Figure 2 show overlays of chromatograms of the samples and a control blank.
Table 1 GCMS Results
RT Possible Identification CAS
Samples Single
Serving Cup
Tea Bag Loose Tea Leaves
7.986
Cyclohexanone
108-94-1 X N.D. N.D.
10.260
Benzyl alcohol
100-51-6 X X X
11.312
Phenylethyl alcohol
60-12-8 X X X
11.527
3-Piperidinone, 1-ethyl-
43152-93-8 X X X
12.583
1H-Pyrrole-2,5-dione, 3-ethyl-4-methyl-
20189-42-8 X X X
12.808 Unknown with fragment of m/z 111 (C6H9NO) -- X X X
13.187
2-Hydroxy-iso-butyrophenone
7473-98-5 X N.D. N.D.
15.554
2(4H)-Benzofuranone, 5,6,7,7a-tetrahydro-4,4,7a-trimethyl-
17092-92-1 X X X
16.435 Unknown with fragment of m/z 119 -- X X X

Table 1 GCMS Results
RT Possible Identification CAS
Samples Single
Serving Cup
Tea Bag Loose Tea Leaves
(C9H11), and m/z 121 (C9H13)
16.616
2,6-Diisopropylnaphthalene
24157-81-1 X N.D. X
16.660 2,6-Diisopropylnaphthalene isomer -- X X X
16.771 Unknown with fragment of m/z 99 (C6H11O) -- X N.D. N.D.
16.952 2,6-Diisopropylnaphthalene isomer -- X N.D. X 16.982 2,6-Diisopropylnaphthalene isomer -- X N.D. X 17.012 2,6-Diisopropylnaphthalene isomer -- X N.D. X
17.334
6-Hydroxy-4,4,7a-trimethyl-5,6,7,7a-tetrahydrobenzofuran-2(4H)-one
73410-02-3 X X X
17.934
Caffeine
58-08-2 X X X
18.025
Theophylline
58-55-9 X X X
18.238
Phenol, 2,4,6-tri-tert-butyl-
732-26-3 N.D. X X
X – Detected; N.D. – Not Detected

Figure 1- Overlay of GCMS chromatograms of the samples and a control blank.
Figure 2- Overlay of GCMS chromatograms of the samples and a control blank, expanded.

QTOF LCMS Background: QTOF-LCMS combines high mass accuracy time of flight mass spectroscopy with the power of a liquid chromatography separation to provide detailed information about the elemental composition of unknowns. The presence of an additional quadrupole mass spectrometer (Q) provides the added capability to perform fragmentation experiments. This increases the confidence of unknown identification. It is preferable that a standard of the suspected unknown be analyzed under identical conditions as the sample. If the fragmentation patterns, high accuracy mass data, isotope patterns and LC retention times match for the unknown and standard then there is a very high probability that the identification is correct. It is possible to gain significant information about the structure of an unknown, even in cases in which standards are not available by using the molecular formula generation (MFG) algorithms contained in the Mass Hunter qualitative software. LCMS requires that the molecule of interest be ionized. Thus, data is typically plotted in positive and negative modes indicating the charge on the ions. Ion formation is accomplished through the formation of a molecular adduct using a charge carrying species. Typical charge carriers in positive ion mode include H+, Na+, K+, NH4
+ etc. Thus the observed mass is typically the mass of the compound plus the mass of the charge carrier. The nature of the mobile phase and the ionization conditions determine the ions formed. In negative ion, the loss of hydrogen is generally observed which results in the loss of one mass unit (1.0078 amu). Other transformations are also possible including dehydration, dimer formation, etc. A number of plots are used to aid in interpreting QTOF-LCMS data. This includes Base Peak Chromatograms (BPC), Extracted Ion Chromatograms (EIC), Extracted Compound Chromatogram (ECC), Mass spectra (MS) and Product Ion Spectra (MSMS). A BPC is formed by plotting the most intense ion at a given retention time. This spectrum is particularly useful for identifying the retention time of unknowns. EICs are formed by plotting a single mass at all retention times. This could be considered a plot of peak intensity (~compound concentration) for a single compound (and its isomers) versus retention time. ECC’s are the sum of all the ions determined to be related to a single compound. MS spectra plot the observed masses and their intensities at a single retention time. MS/MS spectra show the fragmentation pattern for a single compound. Mass Spectra plot the mass to charge ratio (m/z) and not the mass of the compound. All structures indicated represent best estimates based on the data observed. In most cases the MS/MS fragmentation spectra have been consulted briefly to aid in identification of possible structures.

Sample Preparation The sample extracts and the control blank were diluted 10 times with water prior to the injection. Results Major compounds detected in all three samples were general consistent, most of which are common natural compounds in tea leaves, such as caffeine, theophylline, and gallic acid. No compounds consistent with common polymer degradants or polymer additives were detected in the samples. Table 2 provides a summary of the LCMS results for the samples. Figure 3 and Figure 4 provide overlays of the base peak chromatograms (BPCs) obtained in positive and negative ionization modes, respectively.

Table 2. Summary of LCMS Results
RT Positive m/z
Negative m/z Mass Best Match Score Diff. Possible ID
Single Serving
Cup Tea Bag Loose Tea
Leaves
0.253 128.9595 129.967 C2 H3 K O4 76.23 -1.11 Potassium salt X N.D. X
0.254 104.1068 103.0995 C5 H13 N O 99.27 1.64 2-(Propylamino)ethanol
X X N.D.
0.273 381.0801 358.0904 C15 H18 O10 85.28 -1.25 Natural compound in tea leaves X X N.D.
0.275
193.0700 210.0966 215.0535 231.0261
191.0571 237.0608 192.0643 C7 H12 O6 95.36 -4.67 Natural compound in tea leaves X X X
0.275 215.033 180.0639 C6 H12 O6 94.92 -2.99
Glucose
X X N.D.
0.275 387.1148 342.1164 C12 H22 O11 98.54 -0.56
Sucrose
X X N.D.
0.276 118.0864 140.0684 156.0424
117.0791 C5 H11 N O2 90.04 -0.85
Valine
N.D. N.D. X
0.306 311.0981 347.0742 357.1037
312.1054 C11 H20 O10 97.97 0.71 Natural compound in tea leaves X X X
0.343 175.1078 197.0895 213.0640
173.0934 174.1005 C7 H14 N2 O3 89.09 -0.35 Amino acid, Natural compound in tea leaves X X X
0.352 337.1577 359.1391 375.1131
336.1505 C13 H24 N2 O8 79.02 8.31 Natural compound in tea leaves X X X

Table 2. Summary of LCMS Results
RT Positive m/z
Negative m/z Mass Best Match Score Diff. Possible ID
Single Serving
Cup Tea Bag Loose Tea
Leaves
0.426 169.0145 283.0072 170.0217 C7 H6 O5 89.11 -1.17
Gallic acid
X X X
0.533 146.0810 168.0627 184.0372
145.0735 C6 H11 N O3 92.83 2.6 Amino acid, Natural compound in tea leaves N.D. N.D. X
0.542 268.1041 290.0900 267.0968 C10 H13 N5 O4 99.89 -0.25
Adenosine
N.D. X X
0.559 132.1015 154.0834 170.0591
131.0942 C6 H13 N O2 93.89 3.27 Natural compound in tea leaves X X X
0.588 130.0861 152.0680 168.0410
129.0788 C6 H11 N O2 89.6 1.36 Natural compound in tea leaves X X X
0.588 166.0860 188.0681 165.0786 C9 H11 N O2 87.45 2.06 Natural compound in tea leaves X X N.D.
0.683 153.0193 267.0119 154.0266 C7 H6 O4 89.8 0.11
Protocatechuic acid
N.D. N.D. X
0.700 181.0722 203.0538 219.0255
180.065 C7 H8 N4 O2 86.96 -1.61
Theophylline
X X X
1.876 365.1216 342.1323 C16 H22 O8 97.37 -2.48 Natural compound in tea leaves X X N.D.

Table 2. Summary of LCMS Results
RT Positive m/z
Negative m/z Mass Best Match Score Diff. Possible ID
Single Serving
Cup Tea Bag Loose Tea
Leaves
1.984 195.0892 217.0696 194.0818 C8 H10 N4 O2 81.61 -7.29
Caffeine
X X X
2.026 337.0932 451.0870 338.1004 C16 H18 O8 98.27 -0.72 Natural compound in tea leaves X X X
2.545 401.158 378.1689 C20 H26 O7 91.93 -2.73 Natural compound in tea leaves X X X
2.545 609.1458 723.1348 610.1529 C27 H30 O16 95 0.73 Natural compound in tea leaves X X N.D.
2.581 465.1026 487.0843 503.0578
463.0878 577.0803 464.0945 C21 H20 O12 81.23 2.14 Natural compound in tea leaves X X X
2.590
197.1173 214.1447 219.0992 235.0738
196.1101 C11 H16 O3 89.58 -0.57
3-tert-butyl-4,5-dihydroxyanisole
X X N.D.
2.747 595.1674 617.1474 633.1296
593.1503 707.1416 594.1582 C27 H30 O15 99.71 0.54 Natural compound in tea leaves X X N.D.
2.784 449.1077 471.0897 487.0758
447.0927 561.0847 448.0992 C21 H20 O11 93.19 3.12 Natural compound in tea leaves X X N.D.
3.403 181.1224 198.1501 203.1023
180.1151 C11 H16 O2 88.18 -0.54
Butylated hydroxyanisole
X N.D. N.D.
4.013 263.1279 285.1098 301.0855
262.1207 C15 H18 O4 98.41 -0.81 Natural compound in tea leaves N.D. X X
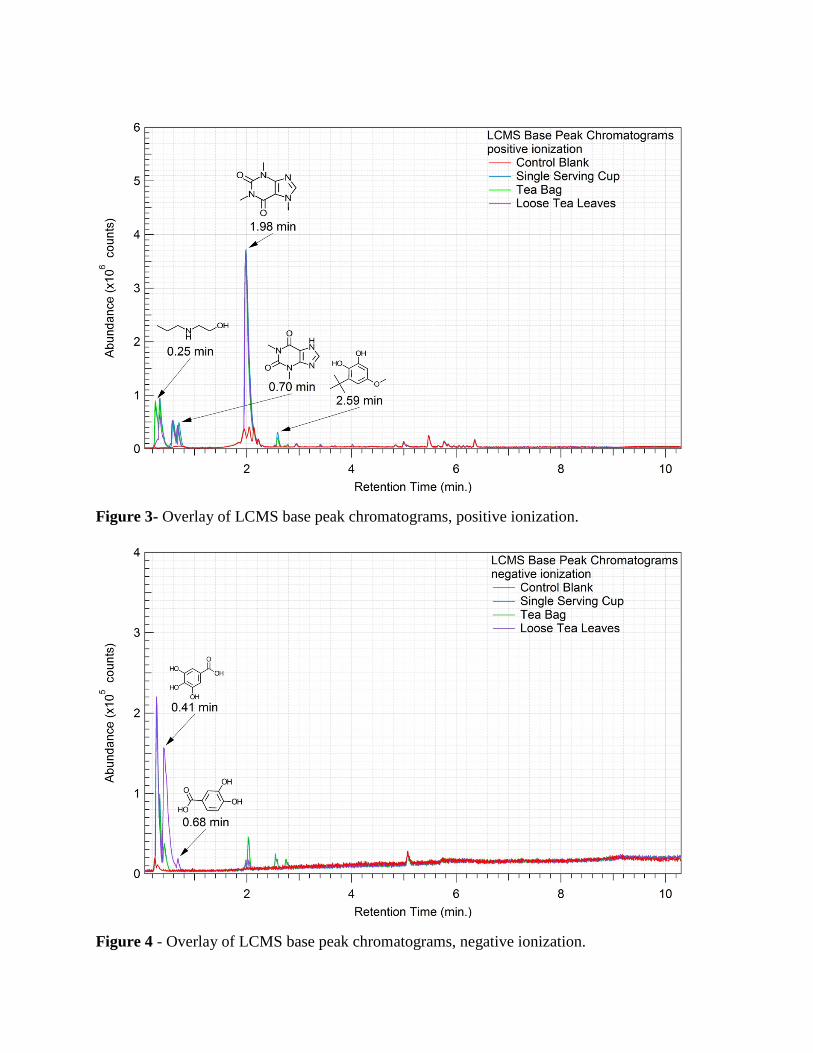
Figure 3- Overlay of LCMS base peak chromatograms, positive ionization.
Figure 4 - Overlay of LCMS base peak chromatograms, negative ionization.

Analysis Conditions This section of a Jordi report provides information on the methods used including instrument type, temperatures, solvents, sample preparation, etc. The specific conditions have been removed for this case study. Closing Comments Jordi Labs’ reports are issued solely for the use of the clients to whom they are addressed. No quotations from reports or use of the Jordi name is permitted except as authorized in writing. The liability of Jordi Labs with respect to the services rendered shall be limited to the amount of consideration paid for such services and do not include any consequential damages. Jordi Labs specializes in polymer testing and has 30 years experience doing complete polymer deformulations. We are one of the few labs in the country specialized in this type of testing. We will work closely with you to help explain your test results and solve your problem. We appreciate your business and are looking forward to speaking with you concerning these results. Sincerely, Zejing Xu Zejing Xu, Ph. D. Senior Scientist Jordi Labs LLC
Mark Jordi Mark Jordi, Ph. D. President Jordi Labs LLC


