Page 1
Case Study: “Hair meets Design”: The Application of Storytelling in the Context of Long-Distance Collaboration and Virtual Teamwork
RIVERA-CHANG, Jose
Available from Sheffield Hallam University Research Archive (SHURA) at:
http://shura.shu.ac.uk/538/
This document is the author deposited version. You are advised to consult the publisher's version if you wish to cite from it.
Published version
RIVERA-CHANG, Jose (2009). Case Study: “Hair meets Design”: The Application of Storytelling in the Context of Long-Distance Collaboration and Virtual Teamwork. In: Undisciplined! Design Research Society Conference 2008, Sheffield Hallam University, Sheffield, UK, 16-19 July 2008.
Copyright and re-use policy
See http://shura.shu.ac.uk/information.html
Sheffield Hallam University Research Archivehttp://shura.shu.ac.uk
Page 2
Undisciplined! Proceedings of the Design Research Society Conference 2008.
Sheffield, UK. July 2008
277/1
Case Study: “Hair meets Design”: The Application of Storytelling in the Context of Long-Distance
Collaboration and Virtual Teamwork.
Jose Rivera-Chang, California State University Long Beach, USA
Abstract Virtual teamwork and long distance collaboration is an increasingly attractive
option in design education especially when students and other participants,
(for example, industry guests or sponsors) cannot meet in the same physical
place or classroom.
The constant improvement in technology allows this type of electronic
communication to be increasingly accepted as an appropriate format for
collaboration and evaluation of student projects.
This paper discusses the collaboration between members of a company in
Germany and a group of industrial design students in California. It will present
the work flow, the evaluation tools and the formats introduced during the
process.
Since the participants of this project could not meet physically to discuss and
evaluate ideas, it was imperative for the teams to develop standard visual
formats that were easy to understand and re-utilize. These formats had to be
flexible enough for the purpose of adding comments from the evaluators.
Because the physical presence of the presenter is missing, it is necessary to
adjust the content and layout of the messages in order to make them more
relevant and self-explanatory. The message has to be easy to understand
without the help of a presenter or lecturer.
One of the most significant questions in this project was how to present
multiple “layers of information” in one single image at the same time (for
example, how to depict work flow, time sequence and object hierarchy in
one single frame.)
In a normal situation (where the presenter is physically present in front of an
audience) he/she can verbally add secondary information that would not be
visually included but it is necessary in order to understand the relevance of the
image being presented. This additional verbal information could be related to
time, hierarchy, etc.
This paper will discuss the development and evaluation of visual formats that
present multiple layers of information in one single image. It describes the
methods used and reports the solutions. Ultimately, this paper explains the
relevance of using storytelling in the context of long-distance design
collaboration.
Keywords
Virtual Teamwork; Long-Distance Collaboration; Storytelling; Infographics
Page 3
Undisciplined! Proceedings of the Design Research Society Conference 2008.
Sheffield, UK. July 2008
277/2
Creating the project
The first contacts
Members of a German company in the beauty industry contacted several
industrial design schools in California. They were looking to sponsor a student
project in America.
This German company is specialized in hair products and wanted to create its
own line of hair salon furniture. The aim of the project was to develop ideas for
a hair salon moving cart (with wheels) created by industrial design students in
California.
Working with design students during research and concept development
added a new challenge to the overall process. The German company
decided to call the project “Hair meets Design” to highlight the collaboration
between a company in the hair product industry and an industrial design
school.
This company already had experience sponsoring student projects in
Germany. Working with local design schools was a natural choice because of
the location. They usually worked with either 3rd or 4th year Industrial Design
students.
The German company was interested in a school-partner that could
collaborate in a long-distance situation. This was especially critical since
travelling from Germany to California on a weekly basis was simply not
possible.
Only one trip to California was scheduled during the whole student project
(the kick-off session). The rest was going to be a combination of conference
calls, email attachments and delivery of packages by mail.
The role of the design educator
The role of the professor or educator in this project was the one of a mediator
/ facilitator between both teams. It was critical that the professor understood
the culture of each team and developed a set of rules for interaction
between both parties.
A team may have a form of preferred communication format depending on
their particular culture. For example, some design companies rely heavily on
drawings in order to communicate because most of their team members are
designers themselves and have no problems understanding hand drawings,
technical drawings, and so on.
Other companies, in addition to drawings, rely heavily on a combination of
drawings, prototypes and video. Again, it is important that the educator
understands the culture of the company that is sponsoring the student project
so he can organize and establish the appropriate communication channels
and formats.
Understanding the challenge
During the initial discussions about the scope of the project, there was an
understanding among participants that the use of some sort of standard visual
Page 4
Undisciplined! Proceedings of the Design Research Society Conference 2008.
Sheffield, UK. July 2008
277/3
format was necessary, but it was not clear yet what type of format was
needed.
Since the participants of this project could not meet physically at the same
time to discuss and evaluate ideas, it was imperative for the teams to develop
a standard visual format that was self-explanatory and easy to understand.
Additionally, this format had to be re-usable for the purpose of adding
comments from the evaluators.
Selected forms of telecommunication like conference calls and email
attachments were natural options but they have their own specific limitations.
For example, conference calls are appropriate if the participants want to
interact in real time -obtaining instant feedback during the process-. But, if
both teams are separated by 9 time zones (9 hours difference) because they
are located in different continents, then the opportunities to interact in real-
time are very limited.
Another example is the use of email or email attachments. This application is
relevant and convenient for distance collaboration because is not time
dependent. When one team is sleeping in one continent, the team in the
other continent is working, thus creating a 24-hour work cycle.
The real advantage in the use of emails is that, in addition to text, images and
video could be added and sent to the other team (by using email
attachments).
Images and video are powerful communication tools but they need to be
organized in a manner that is easy to understand otherwise they are not
relevant. Since both teams have never worked together before, it was not
clear what kind of format or protocol should be used. The educator should
also consider the fact that one team is a group of professionals and the other
team, a group of students.
Methods used
Developing a visual format
Since the team in Germany was a mixed group of professionals from different
backgrounds (design, marketing, legal, technicians, etc.), then we considered
the development of a visual format that could be easily understood not only
by designers but by non-designers as well.
Since the group of students in California are design students, they would be in
charge of executing the visual formats in coordination with their professor. The
execution of this format was also considered part of their design challenge.
Due to the fact that this project involved virtual teamwork and long-distance
collaboration, the teams would have to take full advantage of the
technology available for this purpose like conference calls, internet/email and
also design-related software applications like Adobe Creative Suite and
Autodesk Alias Studio.
The development of a visual format in our industry-sponsored student project
implied (by agreement with sponsor) the creation of an image or a sequence
of images that convey a particular message related to the project. These
Page 5
Undisciplined! Proceedings of the Design Research Society Conference 2008.
Sheffield, UK. July 2008
277/4
images had to be arranged in a manner that conveyed multiple layers of
information and had to be self-explanatory because the students would not
be physically present to explain the content of the images.
Although there were no specific guidelines regarding the way the images
should be created or edited, the professor provided information about a
technique called storytelling in combination with infographics. Students were
encouraged to use this type of graphic technique.
A more graphical form of storytelling is also identified as design scenarios by
some authors. Welker and Sanders (1997) utilized design scenarios extensively
as part of their research work conducted at Fitch Inc. an American design firm.
Joe (1997) used scenarios as storyboard frames to describe user interactions.
Another concern was the number of images in one given sequence. Since,
the same electronic file-sequence (for example a MS PowerPoint file) had to
be shared by members of the German team, then it was recommended not
to exceed 12 slides per file (about 5-10 minutes.)
Finally, it was agreed upon that the resulting visual file-format could be re-
utilized for feedback purposes. Members of the German team would add their
own comments on top of the same images that were delivered by students.
Application of storytelling and infographics
During the initial phase of the project, the design students were assigned to
conduct research in order to understand and document the hair dressing
process (a process they were not familiar with). The research included image
documentation of the hair dressing process plus interview of the primary user:
hair dressers or stylists.
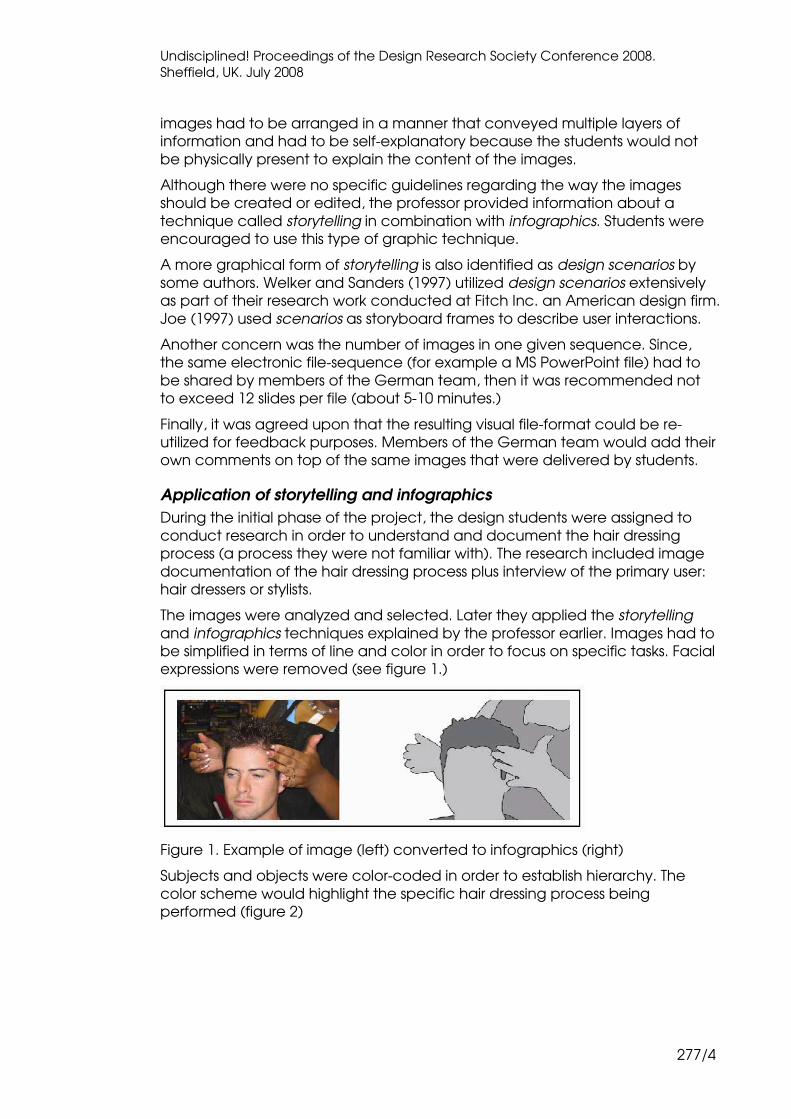
The images were analyzed and selected. Later they applied the storytelling
and infographics techniques explained by the professor earlier. Images had to
be simplified in terms of line and color in order to focus on specific tasks. Facial
expressions were removed (see figure 1.)
Figure 1. Example of image (left) converted to infographics (right)
Subjects and objects were color-coded in order to establish hierarchy. The
color scheme would highlight the specific hair dressing process being
performed (figure 2)
Page 6
Undisciplined! Proceedings of the Design Research Society Conference 2008.
Sheffield, UK. July 2008
277/5
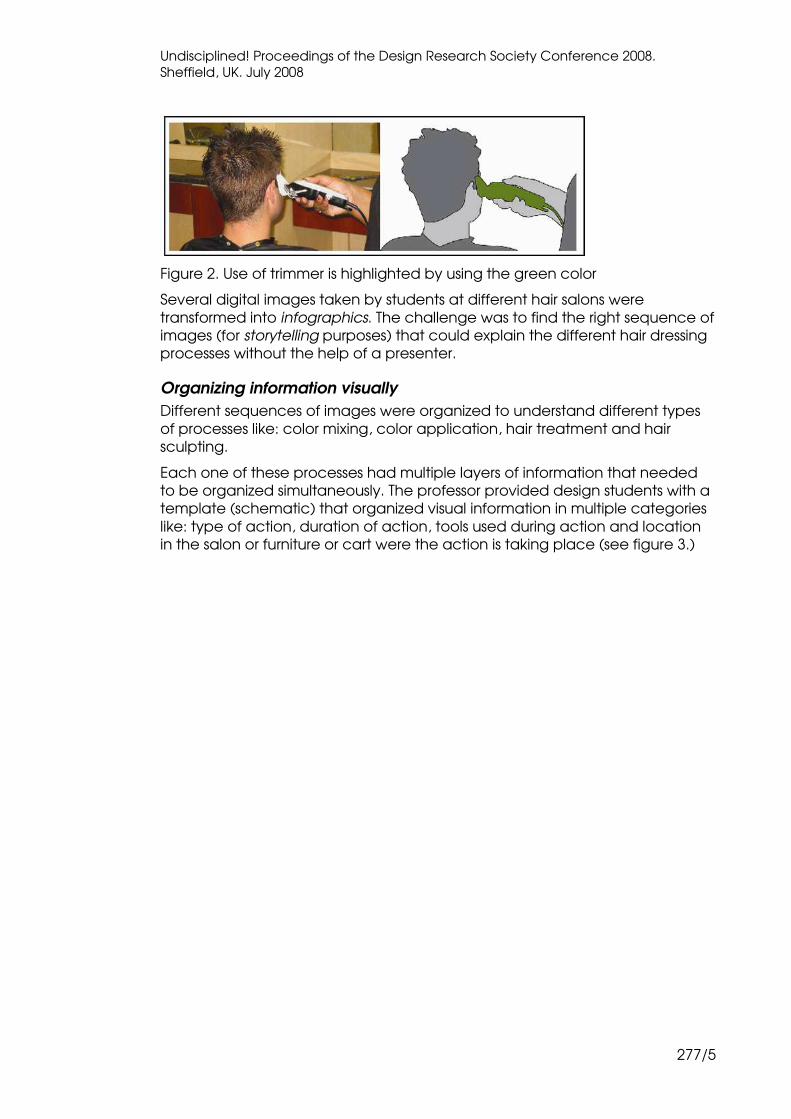
Figure 2. Use of trimmer is highlighted by using the green color
Several digital images taken by students at different hair salons were
transformed into infographics. The challenge was to find the right sequence of
images (for storytelling purposes) that could explain the different hair dressing
processes without the help of a presenter.
Organizing information visually
Different sequences of images were organized to understand different types
of processes like: color mixing, color application, hair treatment and hair
sculpting.
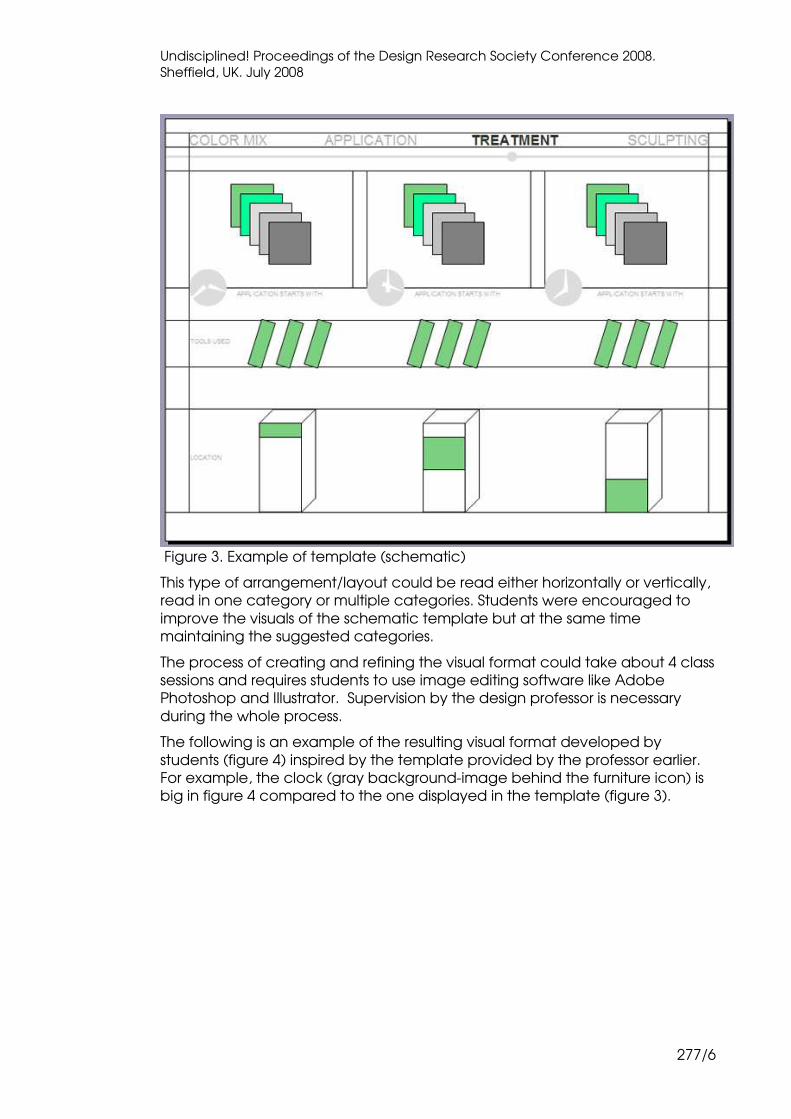
Each one of these processes had multiple layers of information that needed
to be organized simultaneously. The professor provided design students with a
template (schematic) that organized visual information in multiple categories
like: type of action, duration of action, tools used during action and location
in the salon or furniture or cart were the action is taking place (see figure 3.)
Page 7
Undisciplined! Proceedings of the Design Research Society Conference 2008.
Sheffield, UK. July 2008
277/6
Figure 3. Example of template (schematic)
This type of arrangement/layout could be read either horizontally or vertically,
read in one category or multiple categories. Students were encouraged to
improve the visuals of the schematic template but at the same time
maintaining the suggested categories.
The process of creating and refining the visual format could take about 4 class
sessions and requires students to use image editing software like Adobe
Photoshop and Illustrator. Supervision by the design professor is necessary
during the whole process.
The following is an example of the resulting visual format developed by
students (figure 4) inspired by the template provided by the professor earlier.
For example, the clock (gray background-image behind the furniture icon) is
big in figure 4 compared to the one displayed in the template (figure 3).
Page 8
Undisciplined! Proceedings of the Design Research Society Conference 2008.
Sheffield, UK. July 2008
277/7
Figure 4. Example of visual format created by students (showing hair sculpting
process)
When the format is read horizontally and vertically the different layers of
information will combine and produce a complete understanding of a given
process. For example, Figure 4 refers to the process of hair sculpting. This
process is subdivided in 3 stages: 1.client consultation, 2.color rinse and
3.trimming sides.
Because the images are self-explanatory, there is no need for a conference
call to help the German team understand the sequence prepared by
students. Presenters are not necessary.
For example, the left-vertical area of Figure 4 refers to the client consultation
that takes about 3 minutes and suggests that the counter top area is being
used.
The center-vertical area of Figure 4 refers to the color rinse process that takes
an additional 10 minutes, utilizing hair products located at the bottom of the
backwash cabinet.
Finally, the right-vertical area of Figure 4 refers to the trimming process that
takes an additional 5 minutes, utilizing a trimmer that is normally stored in one
drawer of the cart.
The following are examples of visual formats that were created by students to
explain different processes to the team in Germany (see Figure 5 and 6).
Page 9
Undisciplined! Proceedings of the Design Research Society Conference 2008.
Sheffield, UK. July 2008
277/8
Figure 5. Example of visual format created by students (hair treatment, dry hair)
Page 10
Undisciplined! Proceedings of the Design Research Society Conference 2008.
Sheffield, UK. July 2008
277/9
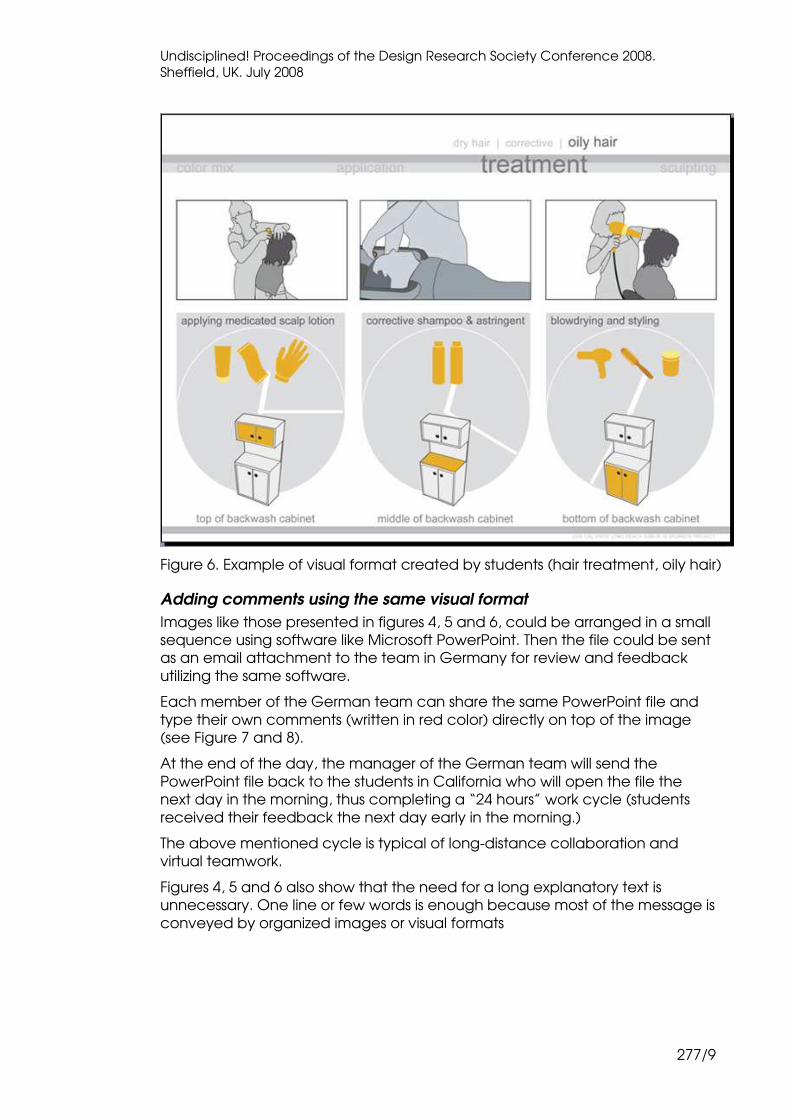
Figure 6. Example of visual format created by students (hair treatment, oily hair)
Adding comments using the same visual format
Images like those presented in figures 4, 5 and 6, could be arranged in a small
sequence using software like Microsoft PowerPoint. Then the file could be sent
as an email attachment to the team in Germany for review and feedback
utilizing the same software.
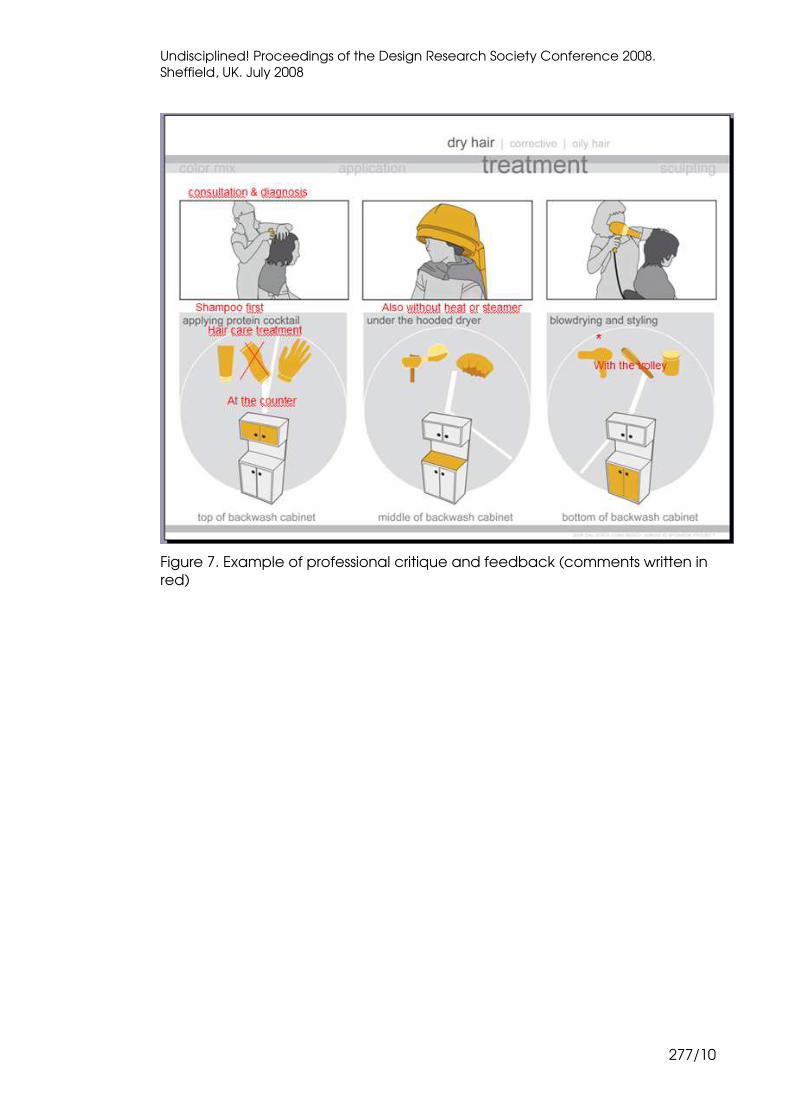
Each member of the German team can share the same PowerPoint file and
type their own comments (written in red color) directly on top of the image
(see Figure 7 and 8).
At the end of the day, the manager of the German team will send the
PowerPoint file back to the students in California who will open the file the
next day in the morning, thus completing a “24 hours” work cycle (students
received their feedback the next day early in the morning.)
The above mentioned cycle is typical of long-distance collaboration and
virtual teamwork.
Figures 4, 5 and 6 also show that the need for a long explanatory text is
unnecessary. One line or few words is enough because most of the message is
conveyed by organized images or visual formats
Page 11
Undisciplined! Proceedings of the Design Research Society Conference 2008.
Sheffield, UK. July 2008
277/10
Figure 7. Example of professional critique and feedback (comments written in
red)
Page 12
Undisciplined! Proceedings of the Design Research Society Conference 2008.
Sheffield, UK. July 2008
277/11
Figure 8. Example of professional critique and feedback (comments written in
red)
Figures 7 and 8 show that the feedback provided by the German team
(written in red) was short and direct to the point. The written feedback was a
building process in which each member of the German team added his/her
own text to the same visual format.
The re-utilization of the same visual format between members of both teams
to communicate back and forth is what made this long-distance
collaboration relevant. The format proved to be an effective tool in this type
of situation reducing the need for real-time conference calls.
Other examples of visual formats
The professor encouraged design students to create additional examples of
visual formats in which the images are not only arranged following a color
scheme but also arranged following a theme with different proportions. He
suggested students to review storytelling examples from the book The Work of
the Sony Design Center by P. Kunkel (1999). It presents different ways of
arranging graphic elements following a theme, following a color scheme,
following proportion, etc.
The professor also explained to students that design firms like Ideo in California
have documented their use of storytelling as part of their research and
concept development process (Ideo Masters of Innovation, 2002)
Page 13
Undisciplined! Proceedings of the Design Research Society Conference 2008.
Sheffield, UK. July 2008
277/12
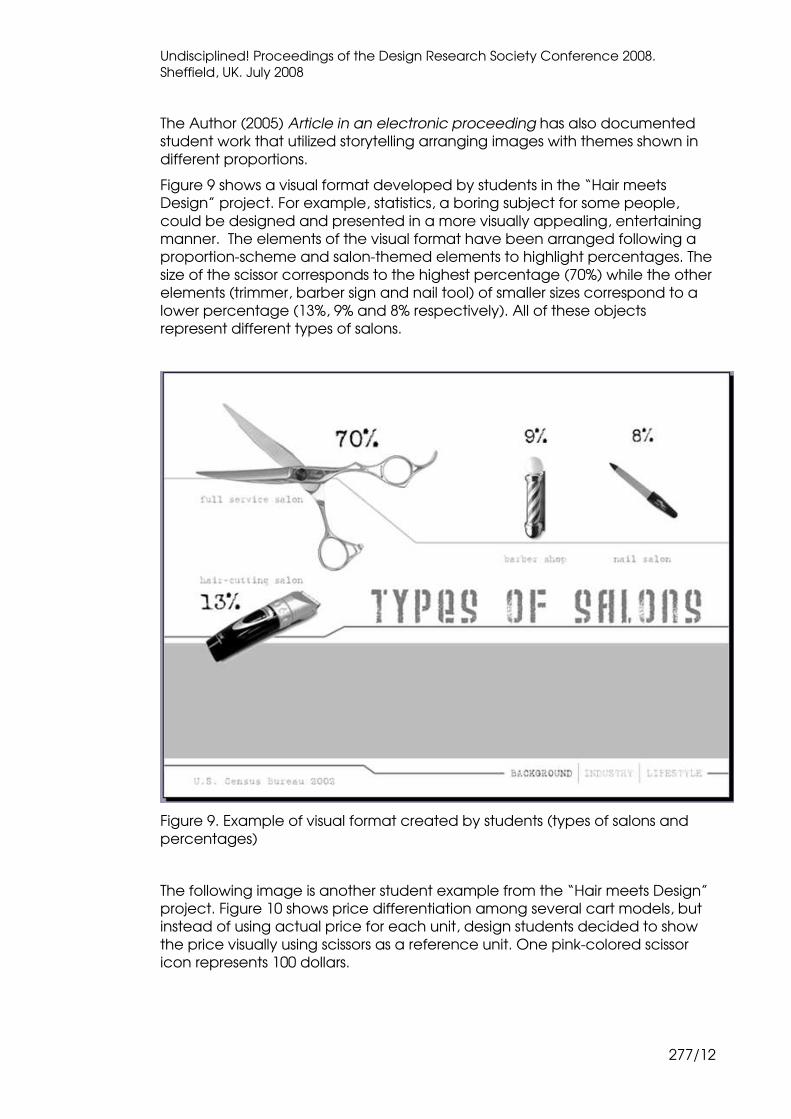
The Author (2005) Article in an electronic proceeding has also documented
student work that utilized storytelling arranging images with themes shown in
different proportions.
Figure 9 shows a visual format developed by students in the “Hair meets
Design” project. For example, statistics, a boring subject for some people,
could be designed and presented in a more visually appealing, entertaining
manner. The elements of the visual format have been arranged following a
proportion-scheme and salon-themed elements to highlight percentages. The
size of the scissor corresponds to the highest percentage (70%) while the other
elements (trimmer, barber sign and nail tool) of smaller sizes correspond to a
lower percentage (13%, 9% and 8% respectively). All of these objects
represent different types of salons.
Figure 9. Example of visual format created by students (types of salons and
percentages)
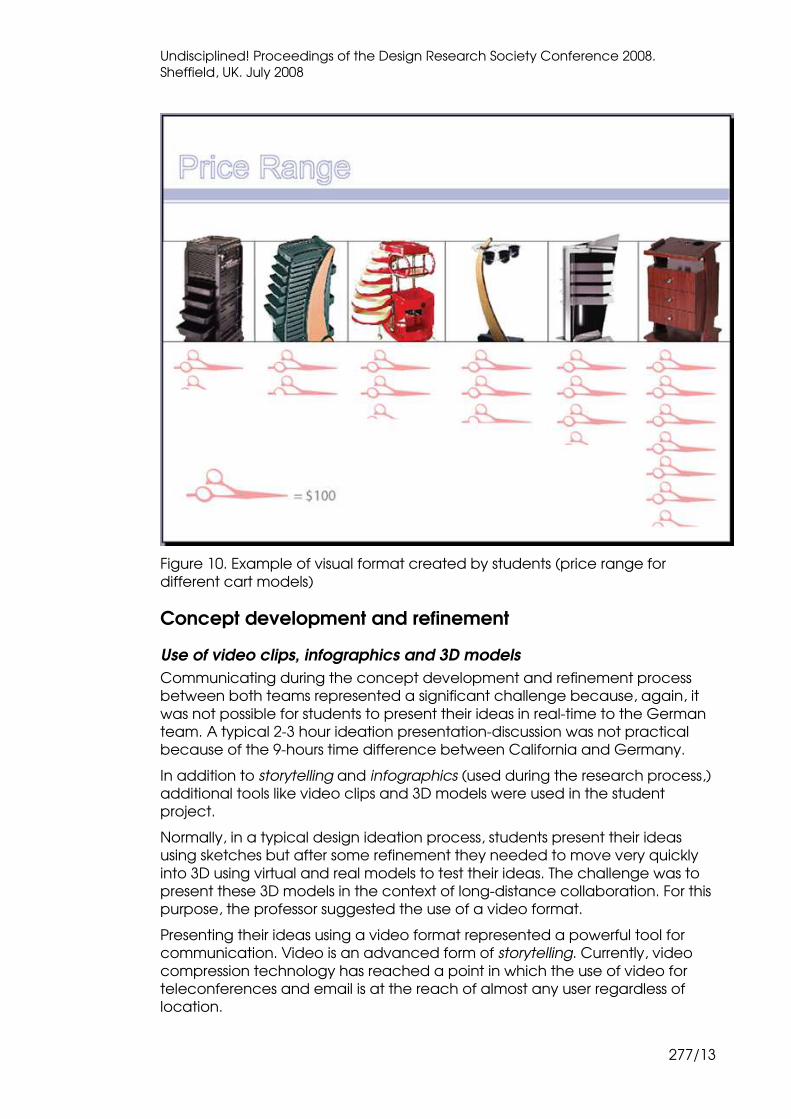
The following image is another student example from the “Hair meets Design”
project. Figure 10 shows price differentiation among several cart models, but
instead of using actual price for each unit, design students decided to show
the price visually using scissors as a reference unit. One pink-colored scissor
icon represents 100 dollars.
Page 14
Undisciplined! Proceedings of the Design Research Society Conference 2008.
Sheffield, UK. July 2008
277/13
Figure 10. Example of visual format created by students (price range for
different cart models)
Concept development and refinement
Use of video clips, infographics and 3D models
Communicating during the concept development and refinement process
between both teams represented a significant challenge because, again, it
was not possible for students to present their ideas in real-time to the German
team. A typical 2-3 hour ideation presentation-discussion was not practical
because of the 9-hours time difference between California and Germany.
In addition to storytelling and infographics (used during the research process,)
additional tools like video clips and 3D models were used in the student
project.
Normally, in a typical design ideation process, students present their ideas
using sketches but after some refinement they needed to move very quickly
into 3D using virtual and real models to test their ideas. The challenge was to
present these 3D models in the context of long-distance collaboration. For this
purpose, the professor suggested the use of a video format.
Presenting their ideas using a video format represented a powerful tool for
communication. Video is an advanced form of storytelling. Currently, video
compression technology has reached a point in which the use of video for
teleconferences and email is at the reach of almost any user regardless of
location.
Page 15
Undisciplined! Proceedings of the Design Research Society Conference 2008.
Sheffield, UK. July 2008
277/14
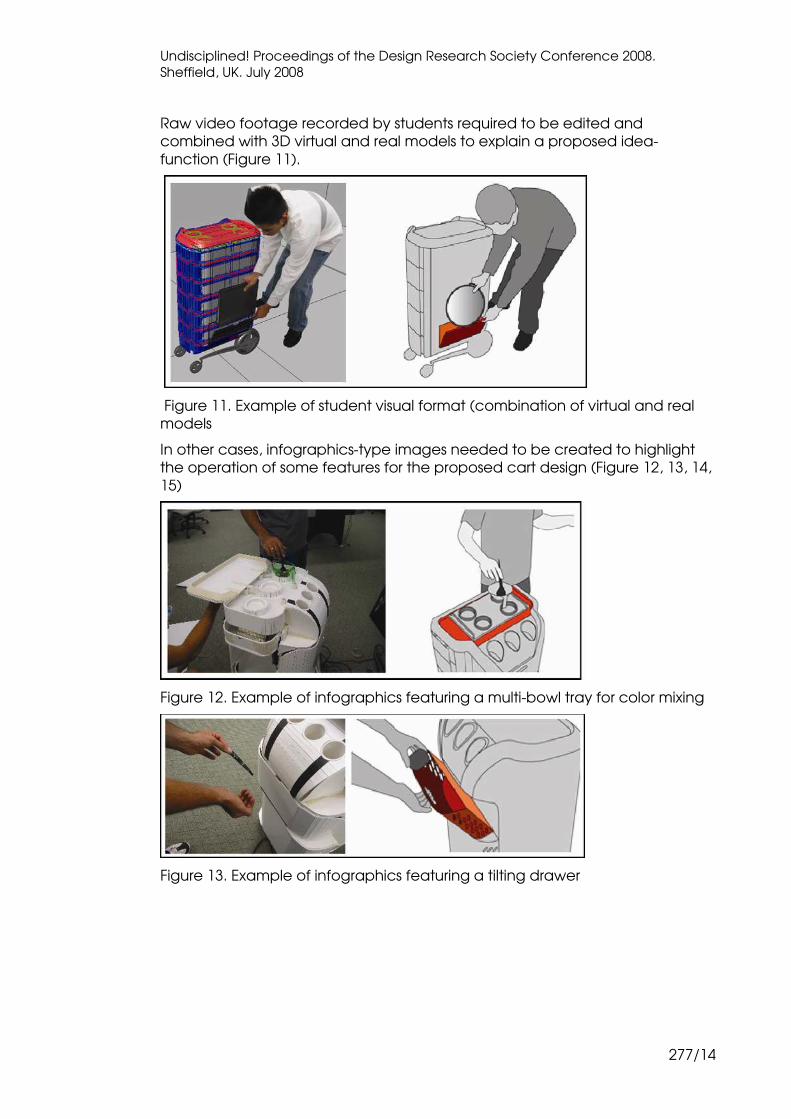
Raw video footage recorded by students required to be edited and
combined with 3D virtual and real models to explain a proposed idea-
function (Figure 11).
Figure 11. Example of student visual format (combination of virtual and real
models
In other cases, infographics-type images needed to be created to highlight
the operation of some features for the proposed cart design (Figure 12, 13, 14,
15)
Figure 12. Example of infographics featuring a multi-bowl tray for color mixing
Figure 13. Example of infographics featuring a tilting drawer
Page 16
Undisciplined! Proceedings of the Design Research Society Conference 2008.
Sheffield, UK. July 2008
277/15
Figure 14. Example of infographics featuring a hair dryer holder
Figure 15. Example of infographics featuring multi-purpose compartment
Once the infographics were finished, students assembled a sequence using
MS PowerPoint software utilizing the infographics images as individual frames.
Each frame explained one feature of the cart (Figure 15A). Later, the file was
sent to the German team for evaluation.
Figure 15A. Example of sequence using infographics (individual cart design
features shown)
After the evaluation of the PowerPoint file by the German team, the file was
sent back to the students including professional feedback. Their comments
were written in red color (Figure 15B)
Figure 15B. Example of professional feedback (comments written in red)
Page 17
Undisciplined! Proceedings of the Design Research Society Conference 2008.
Sheffield, UK. July 2008
277/16
Regarding the utilization of video, any compression format like AVI, MP4 or
MOV is appropriate for long-distance collaboration. Small compressed files
are easy to attach to an email message. Most digital pocket cameras can
handle this type of formats. The use of expensive cameras was completely
unnecessary.
It was recommended that each video clip was limited to no more than one
minute in length. There are two reasons for this:
The file size could increase significantly after the first minute making it
impractical for email use.
Small size videos are easier to edit and handle by the computer.
Due to the complexity of the proposed designs, the professor recommended
students to use both: 3D virtual models and 3D cardboard models for their
video clips (figure 16 and 17)
Figure 16. Example of video clip created by a group of students (virtual 3D
model presented by one industrial design student)
Figure 17. Example of video clip created by a group of students using a 3D
cardboard model
A conference call was scheduled at the end of the concept development
stage. The German team already received and evaluated all the necessary
documentation sent by email: the research files, the ideation files and the
video clips. It was time for them to make a decision and to give a
recommendation before the final models were built.
The professor input is critical at this point. He provided an assessment and
gave a recommendation about what scale should be used for the model
construction and the degree of complexity for the proposed features.
Finally, the German team, in consultation with the industrial design professor,
recommended that full-size models be built as part of the final execution. The
purpose of the models was to test student ideas in different categories:
aesthetics, ergonomics, functionality and overall design.
Page 18
Undisciplined! Proceedings of the Design Research Society Conference 2008.
Sheffield, UK. July 2008
277/17
Final execution and delivery
Construction of 3D model-prototypes
The professor, after evaluating the complexity of each design proposal,
estimated what level of execution should be achieved for each student
model-prototype.
Since these models had to be evaluated in 4 areas (aesthetics, ergonomics,
functionality and overall design), the level of execution had to be very close
to a working prototype with emphasis on appearance and functionality.
The industrial design professor, in consultation with the professor of the
prototypes class, recommended a schedule-plan for students to follow.
The final execution of prototypes had to be closely monitored by the design
and prototype professors to ensure that material selection, structure, color and
overall appearance follow the initial recommendations.
The communication of students with the German team at this stage was
minimal. They were focused on prototype execution and delivery in a timely
manner.
After several weeks of work and under supervision by their design professors,
the team of students was ready to test their prototypes. A camera was used
to document the process.
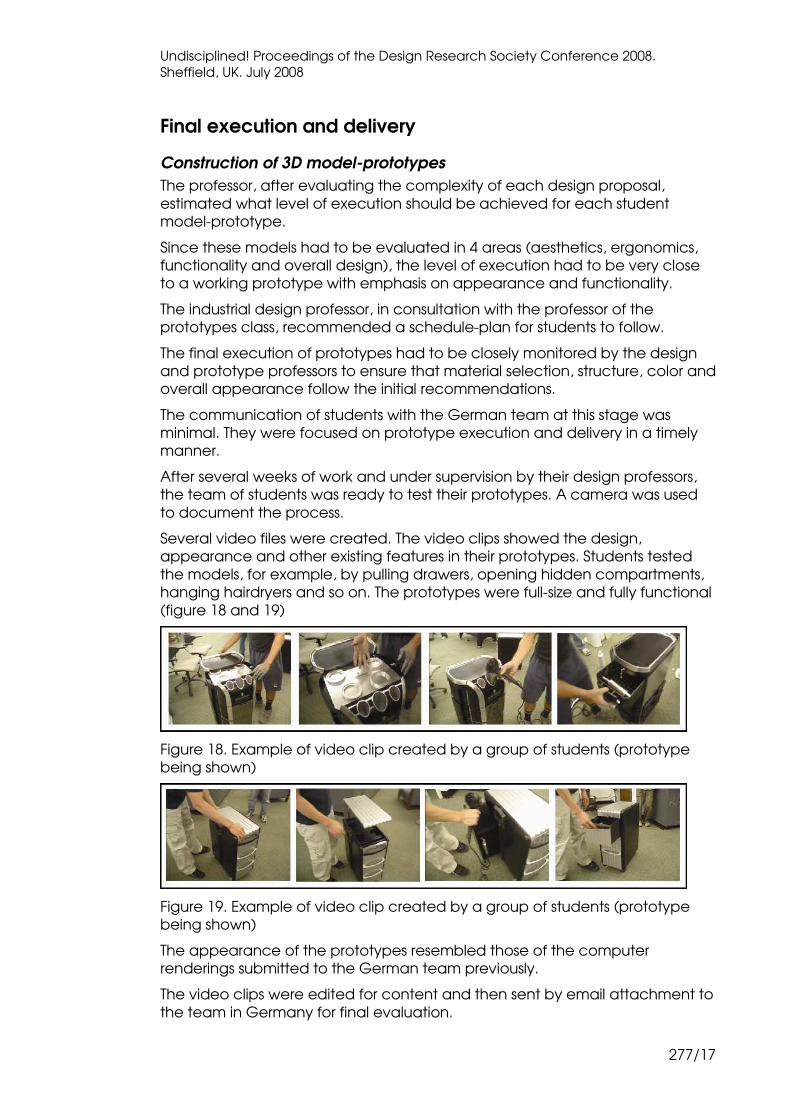
Several video files were created. The video clips showed the design,
appearance and other existing features in their prototypes. Students tested
the models, for example, by pulling drawers, opening hidden compartments,
hanging hairdryers and so on. The prototypes were full-size and fully functional
(figure 18 and 19)
Figure 18. Example of video clip created by a group of students (prototype
being shown)
Figure 19. Example of video clip created by a group of students (prototype
being shown)
The appearance of the prototypes resembled those of the computer
renderings submitted to the German team previously.
The video clips were edited for content and then sent by email attachment to
the team in Germany for final evaluation.
Page 19
Undisciplined! Proceedings of the Design Research Society Conference 2008.
Sheffield, UK. July 2008
277/18
A conference call was scheduled at the end of the prototyping stage. The
German team already received the necessary documentation: the
prototypes video clips. It was time for them to provide the final feedback to
students and to wrap-up the project.
Finally, all students in the class were commended for their high level of
execution and received scholarships sponsored by the German company.
Their prototypes were later sent to Europe for additional evaluation by the
German team.
Conclusion Conference calls, email messages, computer images and videos are some of
the tools that could be used by virtual design teams in the context of long-
distance collaboration.
All of these formats are powerful communication tools for students and
professionals but they have to be edited and visually formatted for content
and delivery.
Because students in this project could not travel to Germany to present their
ideas in person, it was necessary to create these visual formats in order to
make them more relevant and self-explanatory for the German team.
Storytelling combined with infographics was one way to visually format this
content. It helped students to deliver their message across in a faster and
more efficient manner. It also helped the German sponsor to better
understand student’s proposals and to provide them with quicker feedback
by re-utilizing the same formats.
Collaborating with overseas sponsors in the context of long-distance
collaboration added relevance to the project. Industrial Design students,
professors and sponsors could work as virtual teams regardless of time and
location. Virtual teamwork resembles current business practices conducted by
global companies around the world.
References
Welker, K. & Sanders, E. (1997, Fall). To understand the user. Innovation, 24-27.
Joe, P. (1997, Fall). Stories for success. Innovation, 20-23.
Kunkel, P. (1999). Digital Dreams: The Work of the Sony Design Center, New
York: Universe Publishing.
Rivera-Chang, J. (2005). Schools of Creativity and Innovation: Drawing Table
Out, Storytelling In. Proceedings of the Joining Forces Conference, World
Design Congress ERA 05 [CD-ROM]. Helsinki: University of Art and Design.
Myerson J. (2001). IDEO Masters of Innovation. New York: Teneues Publishing.
Jose Rivera-Chang
An associate professor of Industrial Design at California State University Long
Beach. Previously, he collaborated with firms in Southern California and
Page 20
Undisciplined! Proceedings of the Design Research Society Conference 2008.
Sheffield, UK. July 2008
277/19
Michigan. Professor Rivera-Chang has published on the subject of multi-
disciplinary collaboration and Design Scenarios.