1 Faculty of Korea Institute of Maritime and Fisheries Technology, Busan 49111, Korea; [email protected] Faculty of Korea Maritime and Ocean University, Busan 49112, Korea; [email protected]* Correspondence: [email protected]
Abstract: In 2019, the International Maritime Organization (IMO) prescribed guidelines to standard-ize the user interface (UI) of navigation equipment such as radio detection and ranging (RADAR)and the electronic chart display and information system (ECDIS), which mandate the unificationof various terminologies and icons to improve usability. However, comprehensive studies on theoperability and standardization of global positioning system (GPS) plotters, which are auxiliaryequipment installed across various domestic and commercial vessels for navigational purposes,have not been conducted. Therefore, we performed a case study to identify the user requirementsfor standardizing the UI of GPS plotters in South Korea. Additionally, we conducted a survey toascertain the frequency of use of the navigational functions in a GPS plotter, in which, several deckofficers and captains participated. The frequently used navigational functions that were subsequentlyidentified confirmed the need for standardization of the UI. Furthermore, the users requested thestandardization of the menus of these functions using Korean terminologies. Hence, we attemptedto derive standardized items that can be applied to both the functions of the GPS plotters and thenavigation information obtained, which can contribute to the improvement of the UI across thedifferent types of plotters.
Keywords: GPS plotter; user interface; standardization; usability; navigational function
1. Introduction
The International Maritime Organization (IMO) introduced e-Navigation in 2006 toincrease the efficiency of maritime trade and transport along with the infrastructure anddigital information necessary for its implementation. Accordingly, the guidelines for thestandardization of the user interface (UI) design in navigation equipment (“guidelines”)were developed for the integrated navigation system (INS), electronic chart display andinformation system (ECDIS), and radio detection and ranging (RADAR) system. Theseguidelines were approved by the IMO in June 2019 at the 101st session of the MaritimeSafety Committee (MSC) and are effective from January 2024 [1]. Additionally, the per-formance standards for the presentation of navigation-related information on shipbornenavigational displays (MSC.191(79)) were amended, and the terminologies of the functionmenu and display information groups included in appendices 2 and 3 of the guidelineswere mandated. The upgraded navigational displays would be installed on bridges fromJuly 2025 [2]; therefore, the bridge system would also be required to incorporate theimprovements prescribed by the newly introduced guidelines [3,4].
The guidelines aim to improve the usability of navigational equipment and systems—such as ECDIS and RADAR—by standardizing the interface, facilitating easy access toinformation and enhancing situational awareness. They achieve this by including standardterminologies and icons in the UI to aid the development of a user-friendly design [5].
Currently, several shipboard users, such as the captains and deck officers of domesticand commercial vessels, primarily utilize electronic chart systems (ECS), such as global
J. Mar. Sci. Eng. 2021, 9, 57. https://doi.org/10.3390/jmse9010057 https://www.mdpi.com/journal/jmse
positioning system (GPS) plotters, for navigation [6]. GPS plotters are widely installed insuch vessels with varying functionalities such as fishing [4], and are developed by multiplemanufacturers. However, they are excluded from the scope of standardization becausethey are not considered as the mandatory equipement under international conventionfor the Safety Of Life At Sea(SOLAS), which specifies minimum standards for ships’ theconstruction, equipment and operation regarding to their safety. Therefore, systematicawareness and training programs to improve the quality of the UI are not mandatory.In addition, the dissimilarities among the various interfaces provided by the differentmanufacturers can cause further challenges in operating the equipment. To address theseissues, the requirements of shipboard users, who constitute the majority of GPS-plotterusers, must be investigated. Moreover, considering that the guidelines would be applied toall navigation equipment from July 2025, collating user opinions on the standardization ofthe UI is essential to enhance the operability of GPS plotters and could encourage furtherresearch on obtaining the necessary information and developing the relevant functions andmenus to improve the overall quality of these systems.
Although several studies related to the improvement of GPS-plotter UI exist, extensiveresearch on user requirements has not been conducted. Hence, the purpose of this studywas to collate and evaluate these requirements to improve the quality of GPS-plotter UI interms of standardization. Accordingly, a survey was conducted, wherein deck officers andcaptains tested both frequently and sparsely used navigational functions in GPS plotters.Subsequently, we conducted interviews to identify the standardization requirements forUI enhancement. Based on the participants’ inputs, the operability of the frequently usednavigational functions of existing GPS plotters was evaluated. These results can contributeto the standardization of user interfaces in different GPS plotters.
2. GPS Plotters: Background2.1. Literature Review
To identify the user requirements for the effective operation of navigational equipment,a questionnaire was developed using the IMO ECDIS performance standard [7]. Addition-ally, upon conducting an investigation on the user requirements for advancing existingguidelines, we concluded that the guidelines are crucial to develop standardized displaysand user-friendly menu systems [8]. After the introduction of the ECDIS, a study [9] wasconducted with 402 mariners during the period of 2012–2018 to gain user insight on the op-erability of the system compared with nautical paper charts, which confirmed the potentialproblems associated with the transition to electronic charts. In addition, the opinions ofofficers on the watch regarding the experience of using the ECDIS were presented [10]. Toevaluate the usability of the various navigational functions, the quantitative technique of aquestionnaire was conducted to analyze the effectiveness of introducing the ECDIS [11].Alternatively, an eye-tracking device was employed to perform the usability test on theECDIS [12–14].
Human factors that contribute to the level of operability of marine equipment werealso studied in certain usability testing methods, where navigational tasks were monitoredthrough simulations to capture human errors [15]. Similarly, a standard set of navigationaltasks were derived and evaluated to improve the UI of navigation equipment [16]. Toidentify the basic functions of ECDIS and RADAR that require standardization, 22 naviga-tional tasks for voyage planning, route monitoring, and collision prevention were selectedbased on the performance standards and 26 navigators contributed to the experiment usingship-control simulators by three manufacturers. An analysis of the main task executiontime and differences in the operability of the equipment for each task presented a significanttime difference in the performance of each simulator for eight tasks, including the line ofposition function, route correction, and safety contour change. This study highlighted thenecessity of enhancing these functions by adopting standardized terminologies and icons.
An area-of-interest analysis was conducted based on the data collected from thenavigational systems, wherein deck officers utilized eye-tracking devices on a passenger
J. Mar. Sci. Eng. 2021, 9, 57 3 of 22
ship operating from Busan, Korea, to Osaka, Japan [17]. Consequently, the ratio of externalvisual observation was calculated at 49.2%, and the rate of using ECDIS and RADARreached 44.6% during the experiment. In addition, it was confirmed that the navigatorprimarily used own-ship data (heading direction, ship speed, great guideway, groundspeed, etc.), other-ship data (target number, ground speed, ground course, nearest point,closest time, etc.), automatic identification system (AIS) information (e.g., ship name), andthe indication of the electronic azimuth line. The aforementioned studies contribute tothe development of international standardization guidelines of the IMO, chiefly targetingECDIS and RADAR used in ocean-going vessels.
Compared with previous research cases related to ECDIS and RADAR, there wasno study conducted to improve GPS-plotter UI. However, a study was conducted on theusability evaluation of ECS in yachts and boats, and relevant guidelines were presented forstakeholders such as manufacturers and boat owners [18]. Another study identified thatGPS plotters installed and used in domestic ships in Korea lack navigational information,and suggested the need for functions, such as alarms, particularly when the voyage speedexceeded the limit [19]. Several studies concluded that although GPS plotters are widelyused in small- and medium-sized ships, they cause marine accidents owing to failuresin implementing the latest updates [20,21]. Moreover, a geographic information systemplotter based on common Linux was developed for small fishing vessels, similar to theGPS plotter [22].
The Korean government ruled that ECS for the intelligent maritime traffic informationservice would be installed as mandatory equipment on national ships from 2021 [23]. Ac-cording to the Promotion of the Provision and Use of Intelligent Marine Traffic InformationServices Act, the equipment is expected to improve navigation safety and provide optimalroute information services based on electronic charts transmitted in real-time through longterm evolution networks. This is considered to be an alternative to GPS plotters. The ECSshall be installed with type approval in accordance with the law. The recently revisedtype-approval standard includes the interface of the terminal and the test criteria for therequirements to implement e-Navigation service functions. It calls for compliance with theinternational standard for navigation information and terminologies established by theIMO [24]. However, there are no requirements for the guidelines to introduce standardizedmenu names or icons to implement navigational functions. In other words, performancetest requirements for navigational functions exist; however, specific UI requirements, suchas menu names or icons, that contribute to the usability of the functions, are not present.
To summarize, numerous studies related to the usability of ECDIS, along with surveysand experiments on the functions of ECDIS and RADAR have been conducted to developinternational standardization guidelines. Conversely, there exist limited studies on thecurrent status, problems, and solutions for the use of GPS plotters; compared to ECDIS,opinion surveys, and user evaluation experiments conducted for GPS-plotter users arerelatively few. Therefore, this study seeks to highlight the importance of understandingthe requirements for improving UI standardization by focusing on user feedback andevaluations on utilizing a type of ECS-GPS plotters.
2.2. Status of Type Approval Specifications and Equipment Related to GPS Plotters
A review of the government type-approval standard in Korea determined that the in-stallation of ECS can be type-approved in accordance with the standards for type-approvaltests and inspections for marine products (“type-approval standard”) mandated by Article18 of the Ship Safety Act. This standard requires 34 items to be checked before the test,divided as 5 items including appearance and components; 15 items such as salt spray testand vibration test for environmental tests; and 14 items including standard symbol andsafety depth indication for performance tests. The navigational function of the GPS plottermust test the performance of eight items: standard symbol, safe depth, and over-scale indi-cations; planning, correction, and monitoring of routes; and the track record and electronicchart update function [25].
J. Mar. Sci. Eng. 2021, 9, 57 4 of 22
To analyze the actual interface, equipment that passed government type approval wasinvestigated. When the status of the GPS plotter type approval by the Ministry of Oceansand Fisheries was inquired through the shipping and port logistics information system,only models B and C produced by company A were type-approved. The product has anelectronic chart that uses the existing paper chart symbols and certain symbols establishedby company A.
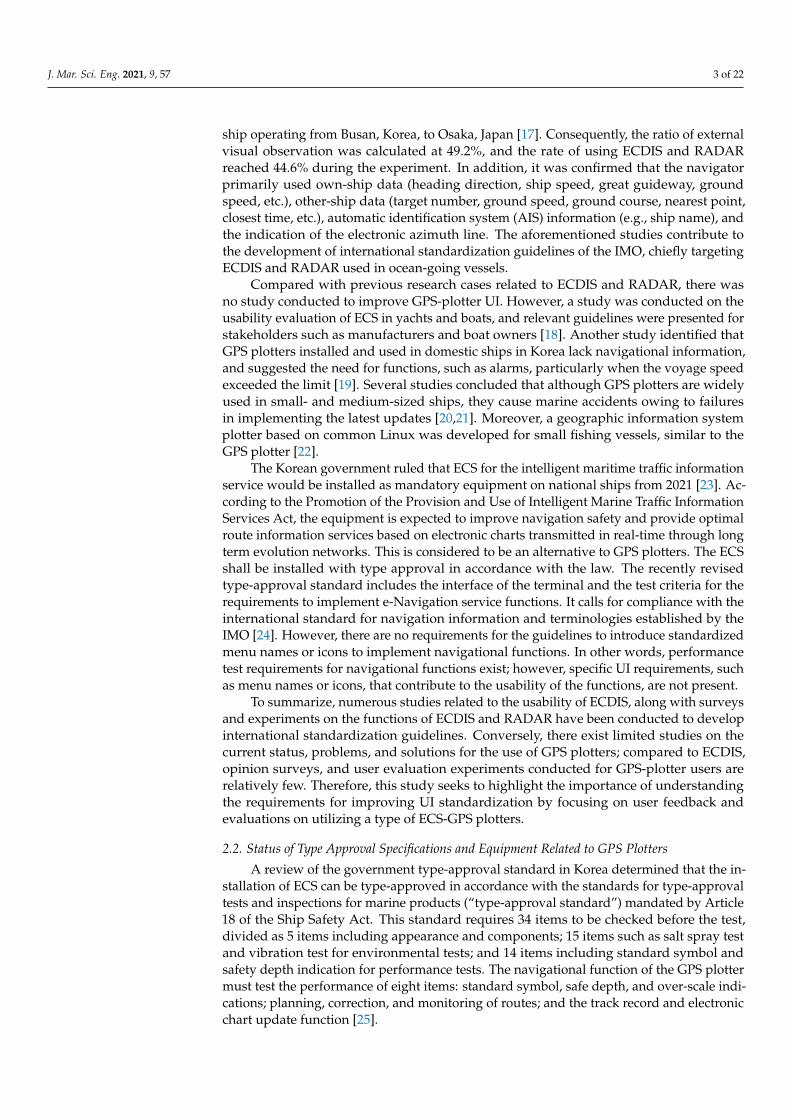
Figure 1 presents a default screen, wherein the menu structure of model B has afixed window for displaying the position, speed, and course over the ground, whereasthe symbol and vector of the own ship are displayed in the center of the screen. Detailedfunctions such as route setting can be operated using the menu tree obtained from themenu button, and the shape and definition of private symbols established by the companycan be viewed by executing the command “View submarine symbols” [26].
J. Mar. Sci. Eng. 2021, 9, x FOR PEER REVIEW 4 of 22
before the test, divided as 5 items including appearance and components; 15 items such
as salt spray test and vibration test for environmental tests; and 14 items including
standard symbol and safety depth indication for performance tests. The navigational
function of the GPS plotter must test the performance of eight items: standard symbol,
safe depth, and over-scale indications; planning, correction, and monitoring of routes;
and the track record and electronic chart update function [25].
To analyze the actual interface, equipment that passed government type approval
was investigated. When the status of the GPS plotter type approval by the Ministry of
Oceans and Fisheries was inquired through the shipping and port logistics information
system, only models B and C produced by company A were type-approved. The product
has an electronic chart that uses the existing paper chart symbols and certain symbols
established by company A.
Figure 1 presents a default screen, wherein the menu structure of model B has a
fixed window for displaying the position, speed, and course over the ground, whereas
the symbol and vector of the own ship are displayed in the center of the screen. Detailed
functions such as route setting can be operated using the menu tree obtained from the
menu button, and the shape and definition of private symbols established by the com-
pany can be viewed by executing the command “View submarine symbols” [26].
Figure 1. Standard display of model B.
The review of the type-approval standard resulted in only a few basic navigational
function performance tests that require 18 standard symbols to be displayed on the GPS
plotter chart. However, requirements for menu names and information items were not
displayed on the screen. In addition, no equipment received the type approval except for
the models included in this study, as the type approval for GPS plotters in not manda-
tory. Nevertheless, GPS plotters are widely used in domestic ships; therefore, a thorough
investigation of the users’ opinions is essential to validate the actual scenario and pro-
pose a method for improving the usability of the equipment.
2.3. Comparison Between GPS-Plotter UI and the Guidelines
It is essential to check the current status of the GPS plotter by comparing the dif-
ferences with the guidelines to be applied to the future navigation equipment and ana-
lyzing them. Therefore, one GPS-plotter model was selected as a case, and the detailed
requirements of the guidelines and its interface were compared and analyzed. The
equipment to be compared was a GPS plotter type approved by the Korean government,
which is also the equipment to be tested in this paper. The scope of analysis of the
Figure 1. Standard display of model B.
The review of the type-approval standard resulted in only a few basic navigationalfunction performance tests that require 18 standard symbols to be displayed on the GPSplotter chart. However, requirements for menu names and information items were notdisplayed on the screen. In addition, no equipment received the type approval except forthe models included in this study, as the type approval for GPS plotters in not mandatory.Nevertheless, GPS plotters are widely used in domestic ships; therefore, a thoroughinvestigation of the users’ opinions is essential to validate the actual scenario and proposea method for improving the usability of the equipment.
2.3. Comparison between GPS-Plotter UI and the Guidelines
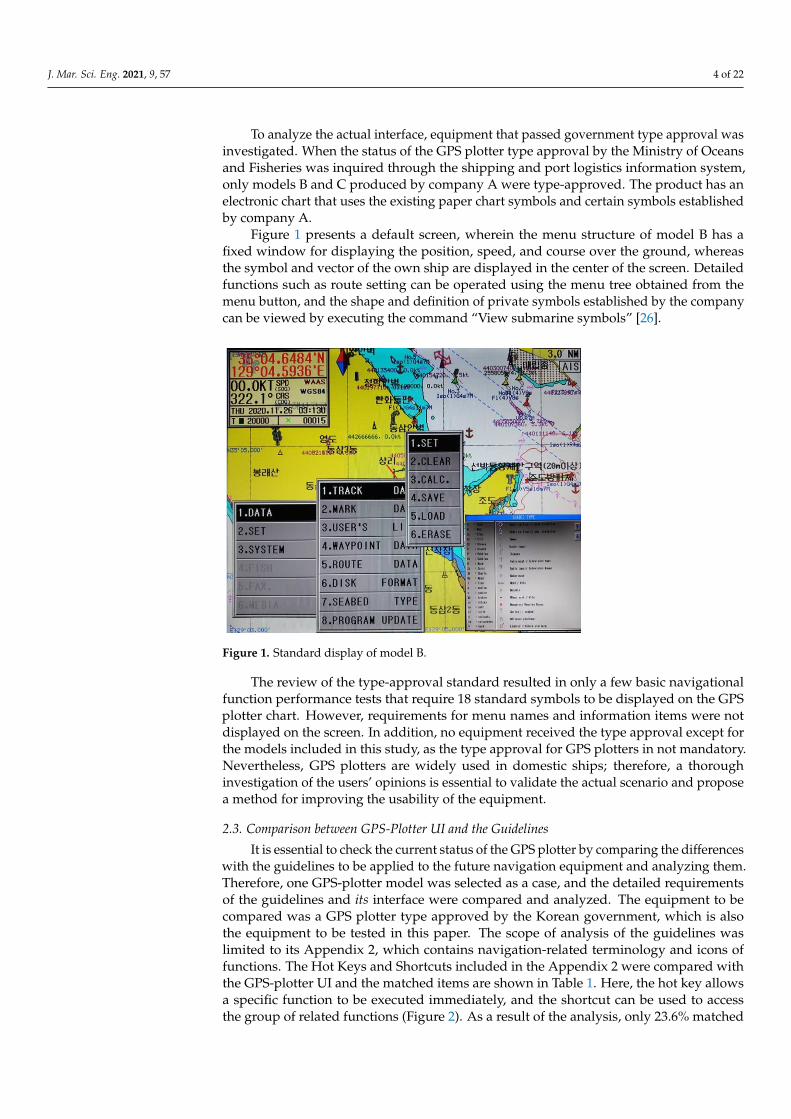
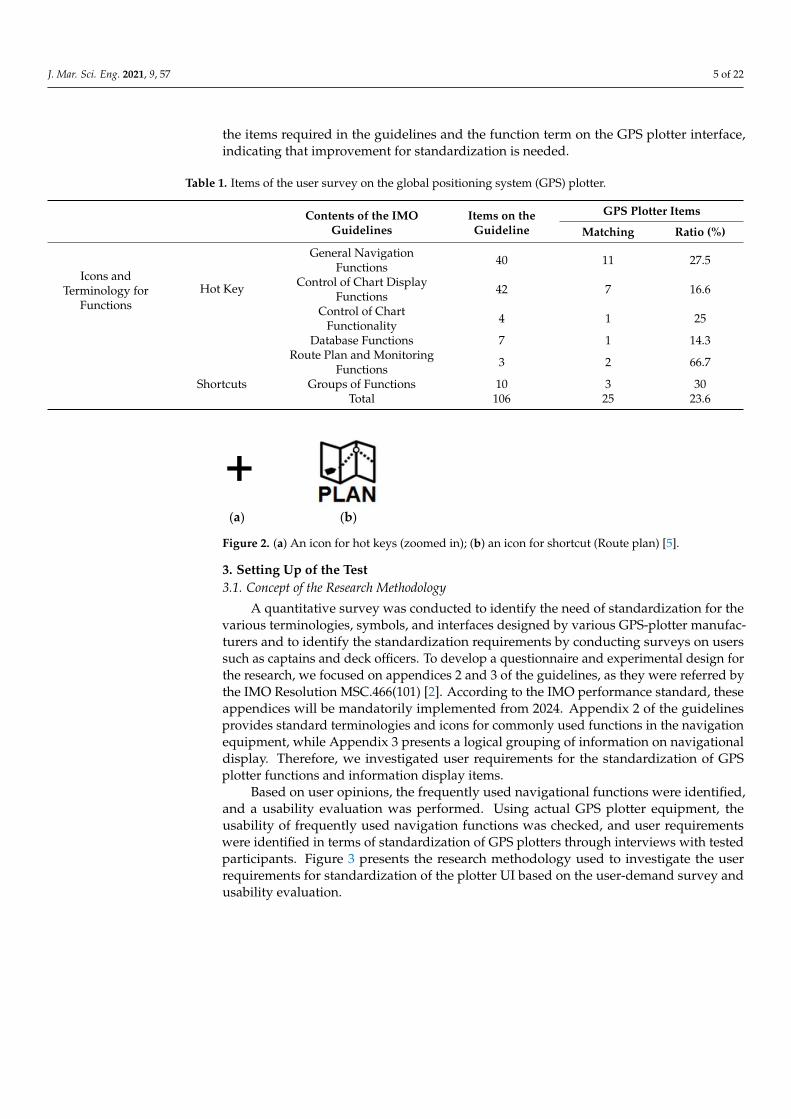
It is essential to check the current status of the GPS plotter by comparing the differenceswith the guidelines to be applied to the future navigation equipment and analyzing them.Therefore, one GPS-plotter model was selected as a case, and the detailed requirementsof the guidelines and its interface were compared and analyzed. The equipment to becompared was a GPS plotter type approved by the Korean government, which is alsothe equipment to be tested in this paper. The scope of analysis of the guidelines waslimited to its Appendix 2, which contains navigation-related terminology and icons offunctions. The Hot Keys and Shortcuts included in the Appendix 2 were compared withthe GPS-plotter UI and the matched items are shown in Table 1. Here, the hot key allowsa specific function to be executed immediately, and the shortcut can be used to accessthe group of related functions (Figure 2). As a result of the analysis, only 23.6% matched
J. Mar. Sci. Eng. 2021, 9, 57 5 of 22
the items required in the guidelines and the function term on the GPS plotter interface,indicating that improvement for standardization is needed.
Table 1. Items of the user survey on the global positioning system (GPS) plotter.
Contents of the IMOGuidelines
Items on theGuideline
GPS Plotter Items
Matching Ratio (%)
Icons andTerminology for
FunctionsHot Key
General NavigationFunctions 40 11 27.5
Control of Chart DisplayFunctions 42 7 16.6
Control of ChartFunctionality 4 1 25
Database Functions 7 1 14.3Route Plan and Monitoring
Functions 3 2 66.7
Shortcuts Groups of Functions 10 3 30Total 106 25 23.6
J. Mar. Sci. Eng. 2021, 9, x FOR PEER REVIEW 5 of 22
guidelines was limited to its Appendix 2, which contains navigation-related terminology
and icons of functions. The Hot Keys and Shortcuts included in the Appendix 2 were
compared with the GPS-plotter UI and the matched items are shown in Table 1. Here,
the hot key allows a specific function to be executed immediately, and the shortcut can
be used to access the group of related functions (Figure 2). As a result of the analysis,
only 23.6% matched the items required in the guidelines and the function term on the
GPS plotter interface, indicating that improvement for standardization is needed.
(a) (b)
Figure 2. (a) An icon for hot keys (zoomed in); (b) an icon for shortcut (Route plan) [5].
Table 1. Items of the user survey on the global positioning system (GPS) plotter.
Contents of the IMO
Guidelines
Items on the
Guideline
GPS Plotter Items
Matching Ratio (%)
Icons and
Terminology for
Functions
Hot Key
General Navigation
Functions 40 11 27.5
Control of Chart
Display Functions 42 7 16.6
Control of Chart
Functionality 4 1 25
Database Functions 7 1 14.3
Route Plan and
Monitoring
Functions
3 2 66.7
Shortcuts Groups of Functions 10 3 30
Total 106 25 23.6
3. Setting Up of the Test
3.1. Concept of the Research Methodology
A quantitative survey was conducted to identify the need of standardization for the
various terminologies, symbols, and interfaces designed by various GPS-plotter manu-
facturers and to identify the standardization requirements by conducting surveys on us-
ers such as captains and deck officers. To develop a questionnaire and experimental de-
sign for the research, we focused on appendices 2 and 3 of the guidelines, as they were
referred by the IMO Resolution MSC.466(101) [2]. According to the IMO performance
standard, these appendices will be mandatorily implemented from 2024. Appendix 2 of
the guidelines provides standard terminologies and icons for commonly used functions
in the navigation equipment, while Appendix 3 presents a logical grouping of infor-
mation on navigational display. Therefore, we investigated user requirements for the
standardization of GPS plotter functions and information display items.
Based on user opinions, the frequently used navigational functions were identified,
and a usability evaluation was performed. Using actual GPS plotter equipment, the usa-
bility of frequently used navigation functions was checked, and user requirements were
identified in terms of standardization of GPS plotters through interviews with tested
participants. Figure 3 presents the research methodology used to investigate the user
Figure 2. (a) An icon for hot keys (zoomed in); (b) an icon for shortcut (Route plan) [5].
3. Setting Up of the Test3.1. Concept of the Research Methodology
A quantitative survey was conducted to identify the need of standardization for thevarious terminologies, symbols, and interfaces designed by various GPS-plotter manufac-turers and to identify the standardization requirements by conducting surveys on userssuch as captains and deck officers. To develop a questionnaire and experimental design forthe research, we focused on appendices 2 and 3 of the guidelines, as they were referred bythe IMO Resolution MSC.466(101) [2]. According to the IMO performance standard, theseappendices will be mandatorily implemented from 2024. Appendix 2 of the guidelinesprovides standard terminologies and icons for commonly used functions in the navigationequipment, while Appendix 3 presents a logical grouping of information on navigationaldisplay. Therefore, we investigated user requirements for the standardization of GPSplotter functions and information display items.
Based on user opinions, the frequently used navigational functions were identified,and a usability evaluation was performed. Using actual GPS plotter equipment, theusability of frequently used navigation functions was checked, and user requirementswere identified in terms of standardization of GPS plotters through interviews with testedparticipants. Figure 3 presents the research methodology used to investigate the userrequirements for standardization of the plotter UI based on the user-demand survey andusability evaluation.
J. Mar. Sci. Eng. 2021, 9, 57 6 of 22
J. Mar. Sci. Eng. 2021, 9, x FOR PEER REVIEW 6 of 22
requirements for standardization of the plotter UI based on the user-demand survey and
usability evaluation.
Figure 3. Concept of the methodology.
3.2. Designing the Survey Questionnaire
To identify the user requirements for the standardization of GPS plotters and im-
prove usability, we investigated the frequently used navigational information and func-
tions. Therefore, seven items of navigational function terms and abbreviations in the GPS
plotter interface approved by the government national standards were considered to
render the screen layout and arrangement. A questionnaire was prepared based on 25
functions of the GPS plotter; the functions to be standardized and the user’s under-
standing of each major function and standardization requirements were identified based
on the frequently used navigational functions. The main questionnaire items test the
understanding of the menu name for the navigational functions of the GPS plotter, in-
quiring the need to standardize terms and apply the standard icons while determining
the frequency of use of the navigational functions, as shown in (Table 2).
Table 2. Items of user survey on GPS plotter.
No. Contents
1 The need to apply standardized icons; if not, why?
2 Understanding of navigation-related terms and abbreviations (7 items)
3 Users’ preference for applying icons to navigational functions
4 Preference for GPS plotter display size
5 Frequency of use of navigational functions (25 items)
6 Additional usage of functions except the aforementioned list
3.3. Designing the User Test
To evaluate the user familiarity of the GPS plotter and collect user needs for stand-
ardization, simulation experiments and user interviews were conducted using actual
equipment. According to the method of performing usability evaluation from the user
experience perspective established by the Information Communication Standardization
Committee [27], it is recommended that at least five participants take part in the usability
evaluation. In addition, the selected task for an experiment must be representative with
the functional, error, and temporal aspects considered based on the frequency of use,
existence of a problem, and time measurement [28]. Based on these criteria, 10 frequently
used navigational tasks were selected based on the results of the initial survey of 132 us-
ers (Table 3) to identify the representative navigational functions.
Figure 3. Concept of the methodology.
3.2. Designing the Survey Questionnaire
To identify the user requirements for the standardization of GPS plotters and improveusability, we investigated the frequently used navigational information and functions.Therefore, seven items of navigational function terms and abbreviations in the GPS plotterinterface approved by the government national standards were considered to render thescreen layout and arrangement. A questionnaire was prepared based on 25 functions ofthe GPS plotter; the functions to be standardized and the user’s understanding of eachmajor function and standardization requirements were identified based on the frequentlyused navigational functions. The main questionnaire items test the understanding ofthe menu name for the navigational functions of the GPS plotter, inquiring the need tostandardize terms and apply the standard icons while determining the frequency of use ofthe navigational functions, as shown in (Table 2).
Table 2. Items of user survey on GPS plotter.
No. Contents
1 The need to apply standardized icons; if not, why?2 Understanding of navigation-related terms and abbreviations (7 items)3 Users’ preference for applying icons to navigational functions4 Preference for GPS plotter display size5 Frequency of use of navigational functions (25 items)6 Additional usage of functions except the aforementioned list
3.3. Designing the User Test
To evaluate the user familiarity of the GPS plotter and collect user needs for stan-dardization, simulation experiments and user interviews were conducted using actualequipment. According to the method of performing usability evaluation from the userexperience perspective established by the Information Communication StandardizationCommittee [27], it is recommended that at least five participants take part in the usabilityevaluation. In addition, the selected task for an experiment must be representative with thefunctional, error, and temporal aspects considered based on the frequency of use, existenceof a problem, and time measurement [28]. Based on these criteria, 10 frequently usednavigational tasks were selected based on the results of the initial survey of 132 users(Table 3) to identify the representative navigational functions.
J. Mar. Sci. Eng. 2021, 9, 57 7 of 22
Table 3. User survey results on the frequency of use for GPS-plotter functions.
FunctionsFrequency of Use
FunctionsFrequency of Use
Point Ratio (%) Point Ratio (%)
Selection of Day/Night Mode 4.00 80.0 System Set 3.16 63.2Route Display On/Off 4.00 80.0 Mark Clear 3.14 62.8
Track On/Off 3.58 71.6 Chart Set 3.14 62.8Distance Measure 3.48 69.6 Mark Color Select 3.12 62.4
Mark Input 3.46 69.2 Mark Save/Load/Erase 3.07 61.4Waypoint List Save/Load/Erase 3.41 68.2 Route Edit 2.87 57.4
Track Save/Load/Erase 3.38 67.6 Mark Number Display 2.79 55.8
Other Ship’s Position Measure 3.33 66.6 Coastal LineSave/Load/Erase 2.78 55.6
Track Clear 3.27 65.4 Route On, Save 2.78 55.6Mark Select 3.24 64.8 Track Line Shape 2.72 54.4
User Coast Line On/Off 3.24 64.8 Chart Information 2.69 53.8Track Line Color 3.20 64.0 Coastal Line Drawing 2.66 53.2
Alarm Set 3.16 63.2 - - -
In total, five shipboard users including deck officers and captains of incumbent fishingand domestic vessels participated in the experiment. Each participant performed 10 typicalsailing tasks using a GPS plotter and confirmed the usability by measuring the time requiredto perform each task. In addition, based on the experience of performing the task, useropinions on the improvement requirements of terms and symbols, understanding of termsand abbreviations, and functions requiring improved usability were collected. Moreover,group interviews and discussions were conducted on the convenience of performingnavigational functions, preferences for displaying information on the navigation screen,and the need for standard terms.
4. Test Results and Discussions4.1. Results of the Questionnaire Survey
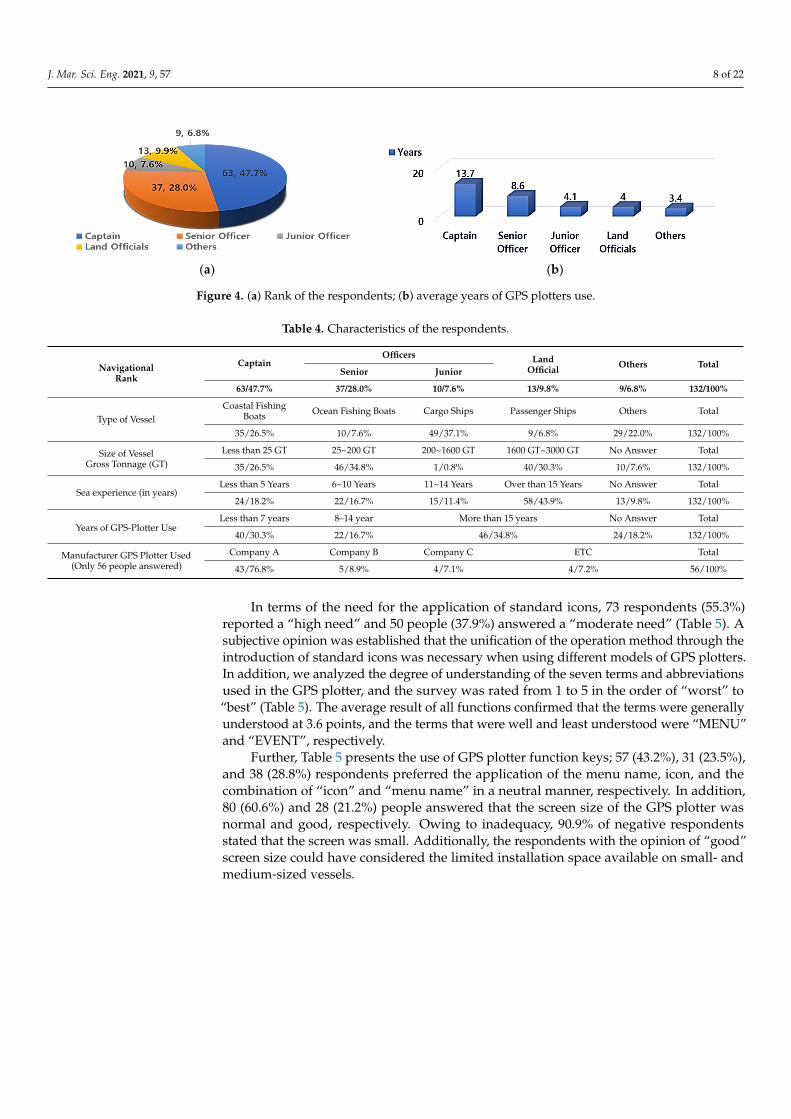
A survey of 182 users, primarily mariners experienced in using GPS plotters, wasconducted in Korea Institute Maritime and Fisheries Technology (KIMFT) from June toAugust 2019, and 132 effective questionnaires were retrieved. The personnel compositionof the respondents (Figure 4) included captains (47.7%), navigators (35.6%), land officials(9.9%), and others (6.8%). In addition, the survey showed that they were engaged in coastalfishing boats (26.5%), cargo ships (37.1%), ocean fishing boats (7.6%), passenger ships (6.8%),and others (22.0%). The experience of respondents onboard averaged 16.4 years, whereinand they have sufficiently used GPS plotters (Figure 4). The survey of 132 questionnairesdetermined that 77% (43 of the 56 that responded) participants used the GPS plottersmanufactured by company A. In addition, other manufacturers were identified; five,four, and four respondents used products from companies B, C, and others, respectively(Table 4).
J. Mar. Sci. Eng. 2021, 9, 57 8 of 22J. Mar. Sci. Eng. 2021, 9, x FOR PEER REVIEW 8 of 22
(a) (b)
Figure 4. (a) Rank of the respondents; (b) average years of GPS plotters use.
Years of GPS-Plotter UseLess than 7 years 8–14 year More than 15 years No Answer Total
40/30.3% 22/16.7% 46/34.8% 24/18.2% 132/100%
Manufacturer GPS Plotter Used(Only 56 people answered)
Company A Company B Company C ETC Total
43/76.8% 5/8.9% 4/7.1% 4/7.2% 56/100%
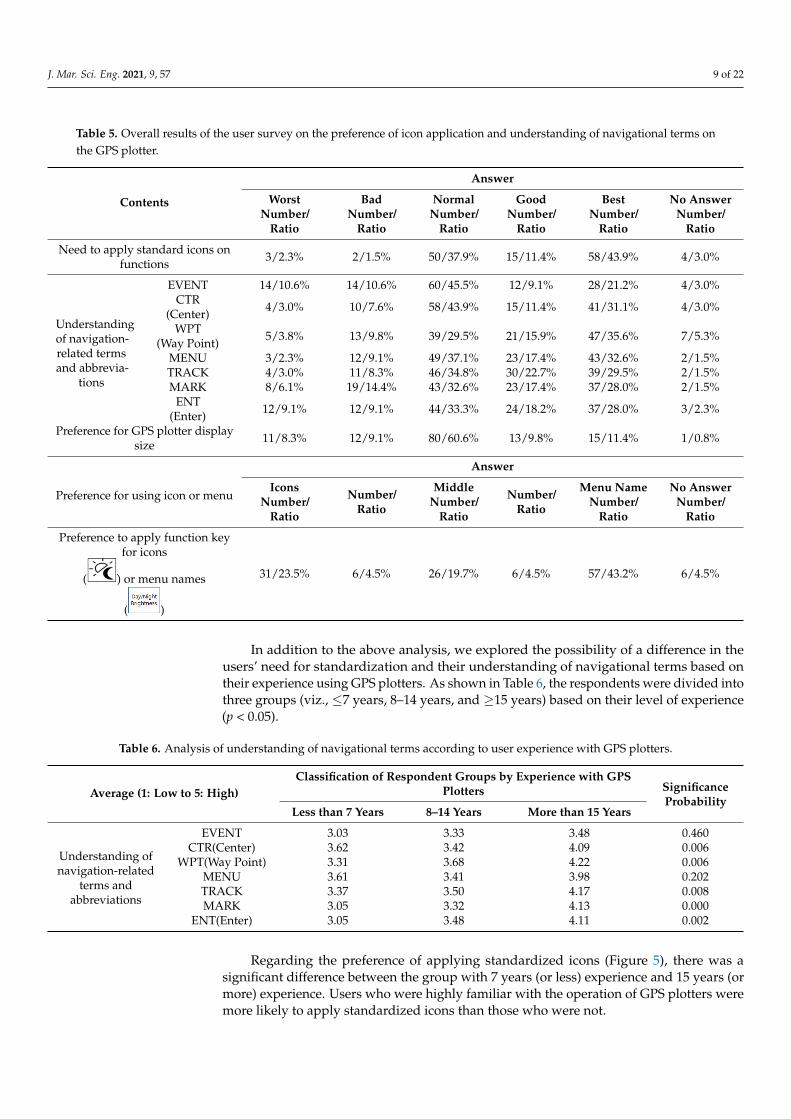
In terms of the need for the application of standard icons, 73 respondents (55.3%)reported a “high need” and 50 people (37.9%) answered a “moderate need” (Table 5). Asubjective opinion was established that the unification of the operation method through theintroduction of standard icons was necessary when using different models of GPS plotters.In addition, we analyzed the degree of understanding of the seven terms and abbreviationsused in the GPS plotter, and the survey was rated from 1 to 5 in the order of “worst” to“best” (Table 5). The average result of all functions confirmed that the terms were generallyunderstood at 3.6 points, and the terms that were well and least understood were “MENU”and “EVENT”, respectively.
Further, Table 5 presents the use of GPS plotter function keys; 57 (43.2%), 31 (23.5%),and 38 (28.8%) respondents preferred the application of the menu name, icon, and thecombination of “icon” and “menu name” in a neutral manner, respectively. In addition,80 (60.6%) and 28 (21.2%) people answered that the screen size of the GPS plotter wasnormal and good, respectively. Owing to inadequacy, 90.9% of negative respondentsstated that the screen was small. Additionally, the respondents with the opinion of “good”screen size could have considered the limited installation space available on small- andmedium-sized vessels.
J. Mar. Sci. Eng. 2021, 9, 57 9 of 22
Table 5. Overall results of the user survey on the preference of icon application and understanding of navigational terms onthe GPS plotter.
Contents
Answer
WorstNumber/
Ratio
BadNumber/
Ratio
NormalNumber/
Ratio
GoodNumber/
Ratio
BestNumber/
Ratio
No AnswerNumber/
Ratio
Need to apply standard icons onfunctions 3/2.3% 2/1.5% 50/37.9% 15/11.4% 58/43.9% 4/3.0%
In addition to the above analysis, we explored the possibility of a difference in the
users’ need for standardization and their understanding of navigational terms based on
their experience using GPS plotters. As shown in Table 6, the respondents were divided
into three groups (viz., ≤7 years, 8–14 years, and ≥15 years) based on their level of expe-
rience (p < 0.05).
Regarding the preference of applying standardized icons (Figure 5), there was a
significant difference between the group with 7 years (or less) experience and 15 years
(or more) experience. Users who were highly familiar with the operation of GPS plotters
were more likely to apply standardized icons than those who were not.
)
31/23.5% 6/4.5% 26/19.7% 6/4.5% 57/43.2% 6/4.5%
In addition to the above analysis, we explored the possibility of a difference in theusers’ need for standardization and their understanding of navigational terms based ontheir experience using GPS plotters. As shown in Table 6, the respondents were divided intothree groups (viz., ≤7 years, 8–14 years, and ≥15 years) based on their level of experience(p < 0.05).
Table 6. Analysis of understanding of navigational terms according to user experience with GPS plotters.
Average (1: Low to 5: High)Classification of Respondent Groups by Experience with GPS
Regarding the preference of applying standardized icons (Figure 5), there was asignificant difference between the group with 7 years (or less) experience and 15 years (ormore) experience. Users who were highly familiar with the operation of GPS plotters weremore likely to apply standardized icons than those who were not.
J. Mar. Sci. Eng. 2021, 9, 57 10 of 22J. Mar. Sci. Eng. 2021, 9, x FOR PEER REVIEW 10 of 22
(a)
(b)
Figure 5. (a) Respondents composition based on their experience of GPS plotters; (b) their preference on applying
standard icons on the menu.
As a result of analyzing the degree of understanding of terms (Table 6), the menus
showing significant differences (p < 0.05) in their perception by group were EVENT,
CENTER, WPT, TRACK, MARK, and ENT, among the seven items surveyed. For the
five identified items, we discovered that the degree of understanding of terms differed
according to the experience of using the equipment between the groups, and further
concluded that the users who operated the equipment for long periods had a better un-
derstanding than those who operated them for short periods. Further details are pro-
vided in the Appendix A.
Table 6. Analysis of understanding of navigational terms according to user experience with GPS plotters.
Average (1: Low to 5: High)
Classification of Respondent Groups by Ex-
perience with GPS Plotters Significance
Probability Less than 7
Years
8–14
Years
More than 15
Years
Understanding of
navigation-related
terms and abbrevia-
tions
EVENT 3.03 3.33 3.48 0.460
CTR(Center) 3.62 3.42 4.09 0.006
WPT(Way Point) 3.31 3.68 4.22 0.006
MENU 3.61 3.41 3.98 0.202
TRACK 3.37 3.50 4.17 0.008
MARK 3.05 3.32 4.13 0.000
ENT(Enter) 3.05 3.48 4.11 0.002
The frequency of use of the 25 items that form the representative functions of GPS
plotters, was evaluated on a five-point scale with one and five points attributed to least
and most frequent use, respectively. Consequently, 18 items were detected to be used at
frequencies above normal (3 points), including selection of day or night mode, route edit,
and track on or off (Table 3). Therefore, these features must be designed in a user-friendly
manner. Moreover, the participants suggested functions and position accuracy identical
to ECDIS as requirements for improving the GPS plotter user interface. Furthermore,
distance measurement and the need for additional estimated time of arrival (ETA) dis-
play functions were suggested.
4.2. Results of User Testing
A total of five incumbent captains and navigators (the testees) with sufficient expe-
rience of using GPS plotters measured the frequency of use for 10 tasks and the time re-
Figure 5. (a) Respondents composition based on their experience of GPS plotters; (b) their preference on applying standardicons on the menu.
As a result of analyzing the degree of understanding of terms (Table 6), the menusshowing significant differences (p < 0.05) in their perception by group were EVENT, CEN-TER, WPT, TRACK, MARK, and ENT, among the seven items surveyed. For the fiveidentified items, we discovered that the degree of understanding of terms differed accord-ing to the experience of using the equipment between the groups, and further concludedthat the users who operated the equipment for long periods had a better understandingthan those who operated them for short periods. Further details are provided in theAppendix A.
The frequency of use of the 25 items that form the representative functions of GPSplotters, was evaluated on a five-point scale with one and five points attributed to leastand most frequent use, respectively. Consequently, 18 items were detected to be used atfrequencies above normal (3 points), including selection of day or night mode, route edit,and track on or off (Table 3). Therefore, these features must be designed in a user-friendlymanner. Moreover, the participants suggested functions and position accuracy identical toECDIS as requirements for improving the GPS plotter user interface. Furthermore, distancemeasurement and the need for additional estimated time of arrival (ETA) display functionswere suggested.
4.2. Results of User Testing
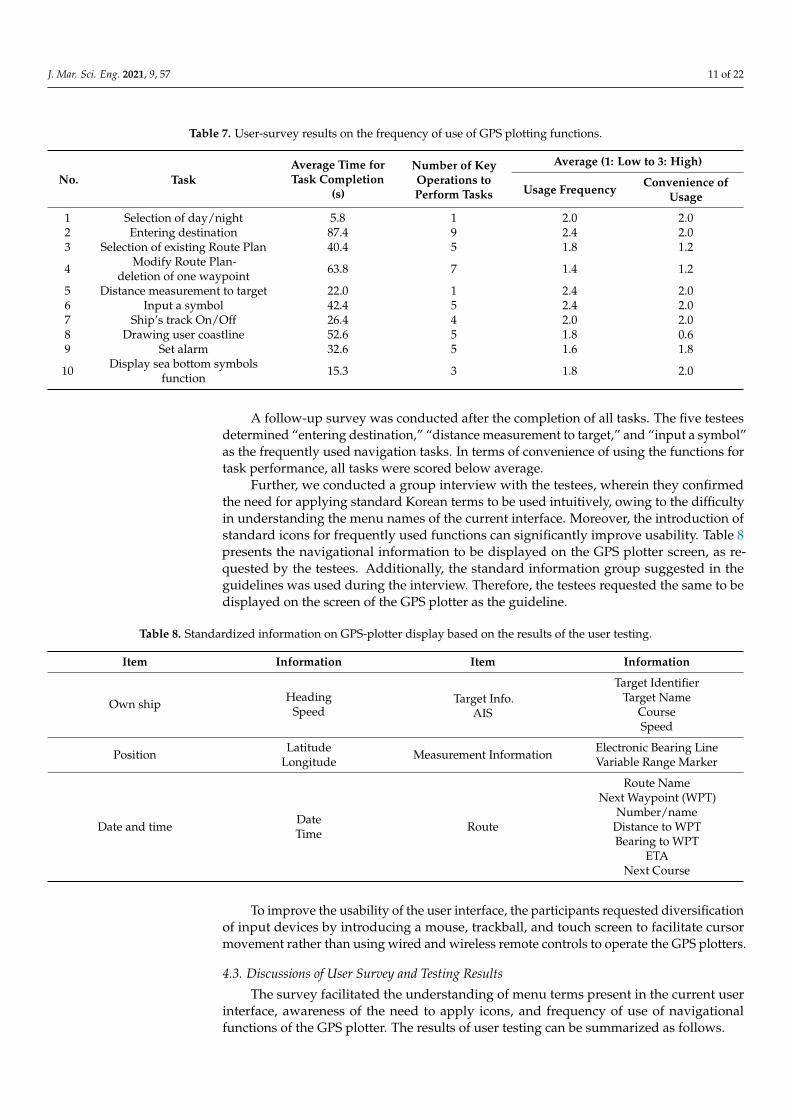
A total of five incumbent captains and navigators (the testees) with sufficient ex-perience of using GPS plotters measured the frequency of use for 10 tasks and the timerequired to perform the tasks. To increase familiarity with the experimental equipment,pre-familiarization training on GPS plotters was conducted for the testees. Table 7 presentsthe experimental results obtained using the ship handling simulator and GPS plotter in-stalled at the KIMFT. The time required to complete the task was considered as a measureto evaluate the usability of the task. In the first task, the average task completion time forthe five testees was 5.8 s, with the longest time being 87.4 s for the task of entering thedestination.
J. Mar. Sci. Eng. 2021, 9, 57 11 of 22
Table 7. User-survey results on the frequency of use of GPS plotting functions.
No. TaskAverage Time forTask Completion
(s)
Number of KeyOperations toPerform Tasks
Average (1: Low to 3: High)
Usage Frequency Convenience ofUsage
1 Selection of day/night 5.8 1 2.0 2.02 Entering destination 87.4 9 2.4 2.03 Selection of existing Route Plan 40.4 5 1.8 1.2
4 Modify Route Plan-deletion of one waypoint 63.8 7 1.4 1.2
5 Distance measurement to target 22.0 1 2.4 2.06 Input a symbol 42.4 5 2.4 2.07 Ship’s track On/Off 26.4 4 2.0 2.08 Drawing user coastline 52.6 5 1.8 0.69 Set alarm 32.6 5 1.6 1.8
A follow-up survey was conducted after the completion of all tasks. The five testeesdetermined “entering destination,” “distance measurement to target,” and “input a symbol”as the frequently used navigation tasks. In terms of convenience of using the functions fortask performance, all tasks were scored below average.
Further, we conducted a group interview with the testees, wherein they confirmedthe need for applying standard Korean terms to be used intuitively, owing to the difficultyin understanding the menu names of the current interface. Moreover, the introduction ofstandard icons for frequently used functions can significantly improve usability. Table 8presents the navigational information to be displayed on the GPS plotter screen, as re-quested by the testees. Additionally, the standard information group suggested in theguidelines was used during the interview. Therefore, the testees requested the same to bedisplayed on the screen of the GPS plotter as the guideline.
Table 8. Standardized information on GPS-plotter display based on the results of the user testing.
Item Information Item Information
Own ship HeadingSpeed
Target Info.AIS
Target IdentifierTarget Name
CourseSpeed
Position LatitudeLongitude Measurement Information Electronic Bearing Line
Variable Range Marker
Date and time DateTime Route
Route NameNext Waypoint (WPT)
Number/nameDistance to WPTBearing to WPT
ETANext Course
To improve the usability of the user interface, the participants requested diversificationof input devices by introducing a mouse, trackball, and touch screen to facilitate cursormovement rather than using wired and wireless remote controls to operate the GPS plotters.
4.3. Discussions of User Survey and Testing Results
The survey facilitated the understanding of menu terms present in the current userinterface, awareness of the need to apply icons, and frequency of use of navigationalfunctions of the GPS plotter. The results of user testing can be summarized as follows.
J. Mar. Sci. Eng. 2021, 9, 57 12 of 22
We determined that despite users typically understanding the main menus of GPSplotters, the need for applying standard icons to the menus was high. Although GPS plotterusers generally favor the application of standard icons, contradicting results were derivedowing to the convenience of using terminologies in the menu, which is the current method,rather than the icon application method to operate the function keys. This is possibly theeffect of intuitively recalling the names of the menu used in the GPS plotter.
Through the analysis of the respondents’ experience of using the GPS plotter, weinferred that users who used the equipment for a long time preferred the introduction oficons. Based on the shipboard user experience with GPS plotters, it can be understoodthat the respondents prefer the introduction of standardized icons to improve usability. Interms of understanding navigation-related terms, comparing the level of understandingby the respondents’ experience using the equipment enabled us to identify differences inthe understanding level of the specific menu terms (CRT, WPT, MENU, TRACK, MARK,ENG). For users exhibiting a low understanding of items but demonstrating no significantdifference in the user experience, the necessity of improving the usability of the menuEVENT is considered to be highly significant. Apart from the results of the analysisperformed based on the level of expertise using the equipment, we demonstrated thatif the overall average comprehension is 3.6 out of 5, the overall understanding of theterm is considered normal; therefore, it can be said that there is a great need to improveunderstanding in the users. Further, we learned that “EVENT”, an item on which usersdisplayed low understanding without significant differences in usage experience, is crucialto improving usability.
Through the above studies, the frequently used navigational functions in the GPS plot-ter and their usability were identified. In total, 10 frequently used navigational functionswere prioritized and the test was done by measuring the time to achieve each task.
Frequently used functions identified by these experiments can be used in two aspects.One is to prioritize functions in GPS plotters needed to improve usability. For example,navigation features can be improved than other features to apply standard terms and iconsin practice. The other aspect is these frequently used functions can be a crucial part to setup test cases for testing equipment [29,30].
Target tasks to test were discussed for this research and were advised by the navigationexperts and users selected in this study. The results of questionnaire survey over navigationexperts and the Bridge procedures guide [31] were contemplated and related tasks of GPSplotters are found out. The 10 tasks were decided after reducing duplication, integratingsimilar ones.
Times for task completion was specified for individual task and measured as a meansof checking usability performance. This is to know that if it takes longer than the given timeto complete any task, that means the functions involved in that task need to be improved.
Finally, the interviews of the five participants confirmed the need for intuitive Koreanterms to be introduced in the menu names of the GPS-plotter UI and the standardizedinformation (Table 8) items to be displayed on the screen were identified. The GPS plottermanufacturers can utilize the data to display necessary information on the user interface.
5. Conclusions
As the international standardization guidelines for navigation equipment will beapplied from 2024, the standardized terms, icons, and navigational information groupswill be introduced in the ECDIS, RADAR, and INS UIs to improve their usability. However,implementing these guidelines of IMO for the standardization of ECS such as GPS plottersis not yet considered. Although the installation of GPS plotters is not legally mandated,almost every domestic vessel utilizes this equipment. However, no application has yetbeen prepared to designate standard menu names or icons for major navigational servicesand functions for intelligent marine traffic devices, which are to be introduced in Korea in2021. Therefore, it is essential to consider the standardization of menu names and iconsfocusing on user opinions to improve user familiarity and enhance safety.
J. Mar. Sci. Eng. 2021, 9, 57 13 of 22
In this regard, we conducted a case study targeting GPS plotters as the equipmentrequiring usability improvement in terms of standardization. Studies on GPS plottersused by several Korean shipboard users as auxiliary navigation equipment [32] recognizedthe need for improvement in terms of standardization. Therefore, the user needs for theintroduction of standardization were investigated to improve the primary navigationalinformation and function status along with their usability. To this end, a questionnairesurvey was conducted for 182 coastal ship users, and a usability evaluation based on actualequipment was performed with the aid of five incumbent captains and sailors.
In this study, we determined the frequently used navigational functions in the GPSplotter and the level of users’ convenience and familiarity with them. Based on the usertests of 10 major navigation tasks in GPS plotters, the convenience for performing taskswas evaluated below normal, indicating that usability improvement is necessary. Particu-larly, entering destinations, editing route plans such as changing waypoints, and editingcoastline drawing functions were found to have poor usability, highlighting the need forimprovement. The interview that followed the user testing validated the need for standard-ization of the Korean terminology in the navigational functions; this is consistent with thesurvey results. Therefore, to improve usability, it is necessary to enhance the user interfaceof the current GPS plotter by applying standard Korean terminology to the menu names orintroducing icons.
We believe that this study is the first to conduct a user requirement survey and asimulation test on a GPS plotter interface for incumbent ship navigators. Subsequently,comparative experiments must be conducted by introducing different types of plottersfrom multiple manufacturers.
Author Contributions: Conceptualization, M.J. and J.K.; methodology, S.L.; validation, M.J., J.K., andS.L.; formal analysis, J.K.; investigation, M.J.; resources, S.L.; data curation, S.L.; writing—originaldraft preparation, M.J.; writing—review and editing, M.J.; visualization, J.K.; supervision, S.L.; projectadministration, M.J. All authors have read and agreed to the published version of the manuscript.
Funding: This article is a result of a study on the “Leaders in Industry–University Cooperation (LINC)+” project supported by the Ministry of Education and National Research Foundation of Korea.
Conflicts of Interest: The authors declare no conflict of interest.
Appendix A
Appendix A.1. Survey Outline
Appendix A.1.1. Identifying Survey Respondents
The survey target was selected for masters and officers who are the practical usersof GPS plotters on domestic and commercial vessels to aid them in navigating withindomestic waters or on a fishing vessel. To better understand/identify the types of vesselsthat include GPS plotters, the gross tonnage along with ships types were surveyed.
Onboard experience and past experience on using GPS plotters were further surveyedto identify the level of GPS-plotter operational proficiency and previous usage experience.During this process, in addition, the various GPS plotter manufacturers were identified.
Appendix A.1.2. Identifying the Standardization Requirements
Questionnaires were structured to allow for the identification of the navigation func-tions frequently used in GPS plotters and included questions on the level of understandingof terms/acronym used in the system and the preferred size of the navigation screen. Basedon this, the responses were structured as shown in Table 1.
J. Mar. Sci. Eng. 2021, 9, 57 14 of 22
Appendix A.1.3. Survey Result
Standardization Requirements (Application of Icons and Understanding ofTerm Abbreviations)
After analyzing the 132 valid responses to our questionnaires, we found that theresponse rate on the need for introducing standardized icons were significantly higherthan that of menu names in navigational functions on the GPS plotter UI (Figure A1), andthat the level of comprehension on terms/abbreviations displayed on the GPS plotter wasfairly good except for the specific event.
J. Mar. Sci. Eng. 2021, 9, x FOR PEER REVIEW 14 of 22
vision, S.L.; project administration, M.J. All authors have read and agreed to the published version
of the manuscript.
Funding: This article is a result of a study on the “Leaders in Industry–University Cooperation
(LINC) +” project supported by the Ministry of Education and National Research Foundation of
Korea.
Conflicts of Interest: The authors declare no conflict of interest.
Appendix A
Appendix A.1. Survey Outline
Appendix A.1.1. Identifying Survey Respondents
The survey target was selected for masters and officers who are the practical users of
GPS plotters on domestic and commercial vessels to aid them in navigating within do-
mestic waters or on a fishing vessel. To better understand/identify the types of vessels
that include GPS plotters, the gross tonnage along with ships types were surveyed.
Onboard experience and past experience on using GPS plotters were further sur-
veyed to identify the level of GPS-plotter operational proficiency and previous usage
experience. During this process, in addition, the various GPS plotter manufacturers were
identified.
Appendix A.1.2. Identifying the Standardization Requirements
Questionnaires were structured to allow for the identification of the navigation
functions frequently used in GPS plotters and included questions on the level of under-
standing of terms/acronym used in the system and the preferred size of the navigation
screen. Based on this, the responses were structured as shown in Table 1.
Appendix A.1.3. Survey Result
Standardization Requirements (Application of Icons and Understanding of Term Ab-
breviations)
After analyzing the 132 valid responses to our questionnaires, we found that the
response rate on the need for introducing standardized icons were significantly higher
than that of menu names in navigational functions on the GPS plotter UI (Figure A1), and
that the level of comprehension on terms/abbreviations displayed on the GPS plotter was
fairly good except for the specific event.
(a) (b)
Figure A1. (a) Preference to apply function key for icons or menu terms; (b) Understanding of navigation-related terms
and abbreviations.
Figure A1. (a) Preference to apply function key for icons or menu terms; (b) Understanding of navigation-related terms andabbreviations.
Results of Survey Analysis Depending on Respondents’ GPS Equipment Usage Experience
The survey analysis was also focused on identifying significant differences (or correla-tions) between user requirements on standardization and the level of comprehension ofmenu terminology depending on the level of experience using GPS plotters. Excluding24 non-respondents who did not include their experience level, the analysis was conductedfor the remaining respondents on the preference of the standardized icons, understandingof menu terminologies by categorizing their usage experience (Table A1).
Table A1. Characteristic of respondents by the experience of GPS plotter usage.
GPS Plotter Usage Experience Number of Respondents Percentage
Less than 7 Years 40 30.3%More than 8 years ~ Less than 14 years 22 16.7%
More than 15 years 46 34.8%Non-respondent 24 18.2%
Total 132 100.0%
Is it necessary to apply standardized icons to functions frequently used for GPSplotters?
After analyzing the preference of applying standardized icons depending on users’usage experience (Figure A2), a difference was observed between the groups with less than7 years and the group with more than 15 years of experience using GPS plotters (p < 0.05).
It was found that people who used the GPS plotter for a longer period of time aremore inclined to make positive judgments about the application of standardized icon thanthose who used the GPS plotter for a shorter period of time.
J. Mar. Sci. Eng. 2021, 9, 57 15 of 22
J. Mar. Sci. Eng. 2021, 9, x FOR PEER REVIEW 15 of 22
Results of Survey Analysis Depending on Respondents’ GPS Equipment Usage Experi-
ence
The survey analysis was also focused on identifying significant differences (or cor-
relations) between user requirements on standardization and the level of comprehension
of menu terminology depending on the level of experience using GPS plotters. Excluding
24 non-respondents who did not include their experience level, the analysis was con-
ducted for the remaining respondents on the preference of the standardized icons, un-
derstanding of menu terminologies by categorizing their usage experience (Table A1).
Table A1. Characteristic of respondents by the experience of GPS plotter usage.
GPS Plotter Usage
Experience Number of Respondents Percentage
Less than 7 Years 40 30.3%
More than 8 years ~ Less
than 14 years 22 16.7%
More than 15 years 46 34.8%
Non-respondent 24 18.2%
Total 132 100.0%
Is it necessary to apply standardized icons to functions frequently used for GPS
plotters?
After analyzing the preference of applying standardized icons depending on users’
usage experience (Figure A2), a difference was observed between the groups with less
than 7 years and the group with more than 15 years of experience using GPS plotters (p <
0.05).
Figure A2. User preference for applying standards icons on frequently used functions by experi-
ence of using GPS plotters. Average (1: Worst to 5: Best).
It was found that people who used the GPS plotter for a longer period of time are
more inclined to make positive judgments about the application of standardized icon
than those who used the GPS plotter for a shorter period of time.
The Level of Comprehension and the Usability of GPS Plotter for Navigation Functional
Terms
(i) EVENT
As a result of the analysis on understanding of terminologies in the GPS plotter’s
EVENT functions based on users’ GPS usage experience (Figure A3), no significant dif-
ference was found between groups (p > 0.05).
Figure A2. User preference for applying standards icons on frequently used functions by experienceof using GPS plotters. Average (1: Worst to 5: Best).
The Level of Comprehension and the Usability of GPS Plotter for NavigationFunctional Terms
(i) EVENT
As a result of the analysis on understanding of terminologies in the GPS plotter’sEVENT functions based on users’ GPS usage experience (Figure A3), no significant differ-ence was found between groups (p > 0.05).
J. Mar. Sci. Eng. 2021, 9, x FOR PEER REVIEW 16 of 22
Figure A3. Users’ understanding on the term ‘EVENT’ based on experience of GPS plotter usage.
Average (1: Worst to 5: Best).
(ii) CNT–CENTER
As a result of the analysis on understanding of terminologies in the GPS plotter’s
CENTER function based on users’ GPS usage experience, differences were found be-
tween the group with 8 to 14 years of experience and the group with over 15 years of
experience (p < 0.5). Those with more experience show a higher level of comprehension
on terminologies related to CNT (Figure A4).
Figure A4. Users’ understanding on the term ‘CNT’ by experience of GPS plotter usage. Average
(1: Worst to 5: Best).
(iii) WPT–WAY POINT
As a result of the analysis on understanding of terminologies in the GPS plotter’s
WAY POINT function based on users’ GPS usage experience, differences were found
between the group with less than 7 years of experience and the group with more than 15
years of experience (p < 0.05).
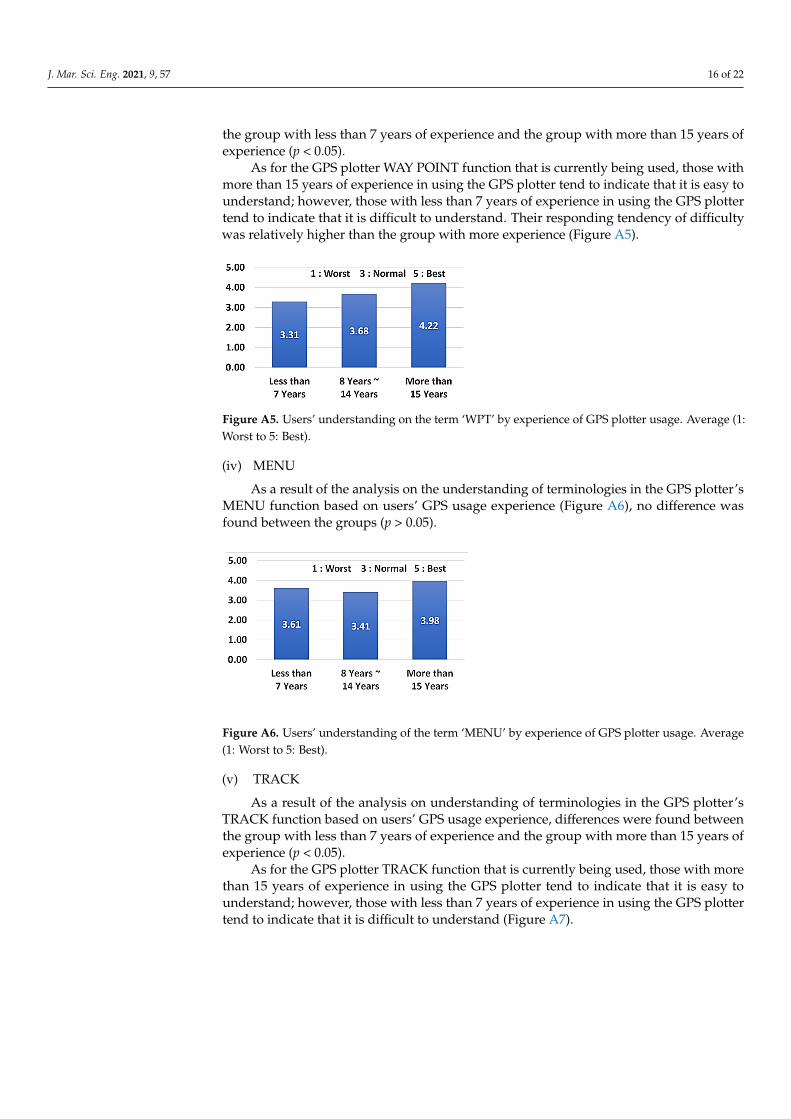
As for the GPS plotter WAY POINT function that is currently being used, those with
more than 15 years of experience in using the GPS plotter tend to indicate that it is easy to
understand; however, those with less than 7 years of experience in using the GPS plotter
tend to indicate that it is difficult to understand. Their responding tendency of difficulty
was relatively higher than the group with more experience (Figure A5).
Figure A5. Users’ understanding on the term ‘WPT’ by experience of GPS plotter usage. Average
(1: Worst to 5: Best).
Figure A3. Users’ understanding on the term ‘EVENT’ based on experience of GPS plotter usage.Average (1: Worst to 5: Best).
(ii) CNT–CENTER
As a result of the analysis on understanding of terminologies in the GPS plotter’sCENTER function based on users’ GPS usage experience, differences were found betweenthe group with 8 to 14 years of experience and the group with over 15 years of expe-rience (p < 0.5). Those with more experience show a higher level of comprehension onterminologies related to CNT (Figure A4).
J. Mar. Sci. Eng. 2021, 9, x FOR PEER REVIEW 16 of 22
Figure A3. Users’ understanding on the term ‘EVENT’ based on experience of GPS plotter usage.
Average (1: Worst to 5: Best).
(ii) CNT–CENTER
As a result of the analysis on understanding of terminologies in the GPS plotter’s
CENTER function based on users’ GPS usage experience, differences were found be-
tween the group with 8 to 14 years of experience and the group with over 15 years of
experience (p < 0.5). Those with more experience show a higher level of comprehension
on terminologies related to CNT (Figure A4).
Figure A4. Users’ understanding on the term ‘CNT’ by experience of GPS plotter usage. Average
(1: Worst to 5: Best).
(iii) WPT–WAY POINT
As a result of the analysis on understanding of terminologies in the GPS plotter’s
WAY POINT function based on users’ GPS usage experience, differences were found
between the group with less than 7 years of experience and the group with more than 15
years of experience (p < 0.05).
As for the GPS plotter WAY POINT function that is currently being used, those with
more than 15 years of experience in using the GPS plotter tend to indicate that it is easy to
understand; however, those with less than 7 years of experience in using the GPS plotter
tend to indicate that it is difficult to understand. Their responding tendency of difficulty
was relatively higher than the group with more experience (Figure A5).
Figure A5. Users’ understanding on the term ‘WPT’ by experience of GPS plotter usage. Average
(1: Worst to 5: Best).
Figure A4. Users’ understanding on the term ‘CNT’ by experience of GPS plotter usage. Average (1:Worst to 5: Best).
(iii) WPT–WAY POINT
As a result of the analysis on understanding of terminologies in the GPS plotter’s WAYPOINT function based on users’ GPS usage experience, differences were found between
J. Mar. Sci. Eng. 2021, 9, 57 16 of 22
the group with less than 7 years of experience and the group with more than 15 years ofexperience (p < 0.05).
As for the GPS plotter WAY POINT function that is currently being used, those withmore than 15 years of experience in using the GPS plotter tend to indicate that it is easy tounderstand; however, those with less than 7 years of experience in using the GPS plottertend to indicate that it is difficult to understand. Their responding tendency of difficultywas relatively higher than the group with more experience (Figure A5).
J. Mar. Sci. Eng. 2021, 9, x FOR PEER REVIEW 16 of 22
Figure A3. Users’ understanding on the term ‘EVENT’ based on experience of GPS plotter usage.
Average (1: Worst to 5: Best).
(ii) CNT–CENTER
As a result of the analysis on understanding of terminologies in the GPS plotter’s
CENTER function based on users’ GPS usage experience, differences were found be-
tween the group with 8 to 14 years of experience and the group with over 15 years of
experience (p < 0.5). Those with more experience show a higher level of comprehension
on terminologies related to CNT (Figure A4).
Figure A4. Users’ understanding on the term ‘CNT’ by experience of GPS plotter usage. Average
(1: Worst to 5: Best).
(iii) WPT–WAY POINT
As a result of the analysis on understanding of terminologies in the GPS plotter’s
WAY POINT function based on users’ GPS usage experience, differences were found
between the group with less than 7 years of experience and the group with more than 15
years of experience (p < 0.05).
As for the GPS plotter WAY POINT function that is currently being used, those with
more than 15 years of experience in using the GPS plotter tend to indicate that it is easy to
understand; however, those with less than 7 years of experience in using the GPS plotter
tend to indicate that it is difficult to understand. Their responding tendency of difficulty
was relatively higher than the group with more experience (Figure A5).
Figure A5. Users’ understanding on the term ‘WPT’ by experience of GPS plotter usage. Average
(1: Worst to 5: Best).
Figure A5. Users’ understanding on the term ‘WPT’ by experience of GPS plotter usage. Average (1:Worst to 5: Best).
(iv) MENU
As a result of the analysis on the understanding of terminologies in the GPS plotter’sMENU function based on users’ GPS usage experience (Figure A6), no difference wasfound between the groups (p > 0.05).
J. Mar. Sci. Eng. 2021, 9, x FOR PEER REVIEW 17 of 22
(iv) MENU
As a result of the analysis on the understanding of terminologies in the GPS plotter’s
MENU function based on users’ GPS usage experience (Figure A6), no difference was
found between the groups (p > 0.05).
Figure A6. Users’ understanding of the term ‘MENU’ by experience of GPS plotter usage. Average
(1: Worst to 5: Best).
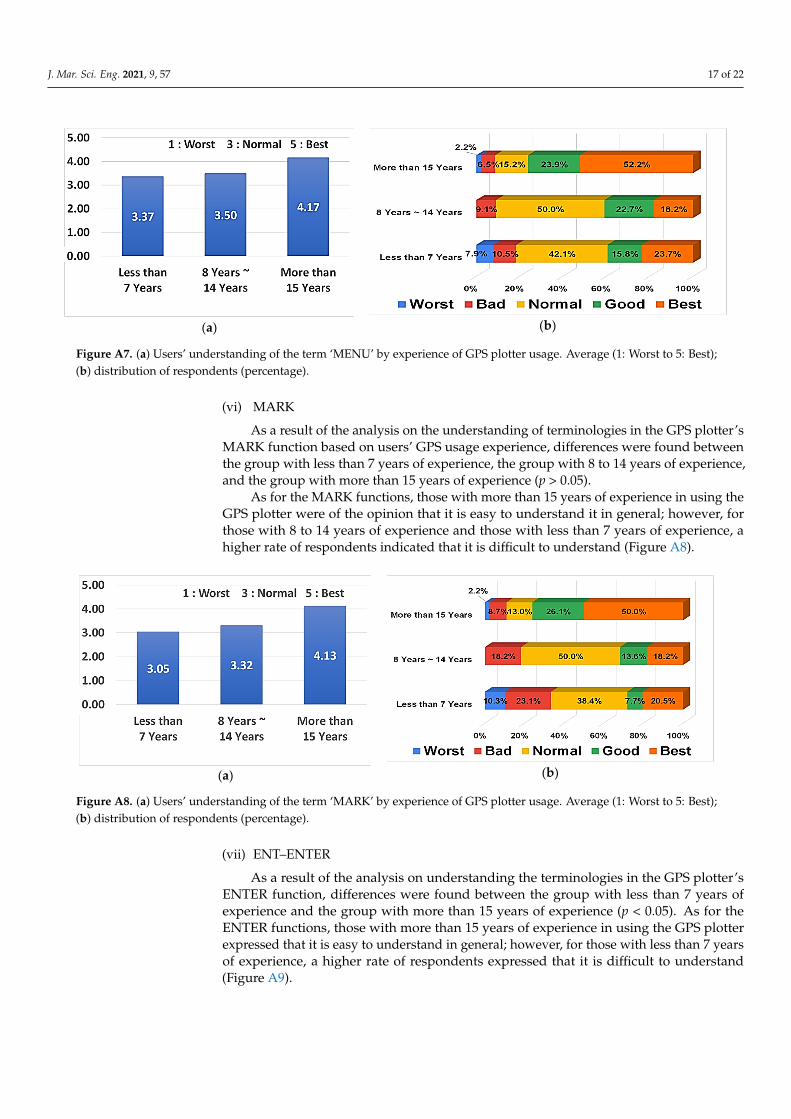
(v) TRACK
As a result of the analysis on understanding of terminologies in the GPS plotter’s
TRACK function based on users’ GPS usage experience, differences were found between
the group with less than 7 years of experience and the group with more than 15 years of
experience (p < 0.05).
As for the GPS plotter TRACK function that is currently being used, those with more
than 15 years of experience in using the GPS plotter tend to indicate that it is easy to
understand; however, those with less than 7 years of experience in using the GPS plotter
tend to indicate that it is difficult to understand (Figure A7).
(a)
(b)
Figure A7. (a) Users’ understanding of the term ‘MENU’ by experience of GPS plotter usage. Average (1: Worst to 5:
Best); (b) distribution of respondents (percentage).
(vi) MARK
As a result of the analysis on the understanding of terminologies in the GPS plotter’s
MARK function based on users’ GPS usage experience, differences were found between
the group with less than 7 years of experience, the group with 8 to 14 years of experience,
and the group with more than 15 years of experience (p > 0.05).
As for the MARK functions, those with more than 15 years of experience in using the
GPS plotter were of the opinion that it is easy to understand it in general; however, for
those with 8 to 14 years of experience and those with less than 7 years of experience, a
higher rate of respondents indicated that it is difficult to understand (Figure A8).
Figure A6. Users’ understanding of the term ‘MENU’ by experience of GPS plotter usage. Average(1: Worst to 5: Best).
(v) TRACK
As a result of the analysis on understanding of terminologies in the GPS plotter’sTRACK function based on users’ GPS usage experience, differences were found betweenthe group with less than 7 years of experience and the group with more than 15 years ofexperience (p < 0.05).
As for the GPS plotter TRACK function that is currently being used, those with morethan 15 years of experience in using the GPS plotter tend to indicate that it is easy tounderstand; however, those with less than 7 years of experience in using the GPS plottertend to indicate that it is difficult to understand (Figure A7).
J. Mar. Sci. Eng. 2021, 9, 57 17 of 22
J. Mar. Sci. Eng. 2021, 9, x FOR PEER REVIEW 17 of 22
(iv) MENU
As a result of the analysis on the understanding of terminologies in the GPS plotter’s
MENU function based on users’ GPS usage experience (Figure A6), no difference was
found between the groups (p > 0.05).
Figure A6. Users’ understanding of the term ‘MENU’ by experience of GPS plotter usage. Average
(1: Worst to 5: Best).
(v) TRACK
As a result of the analysis on understanding of terminologies in the GPS plotter’s
TRACK function based on users’ GPS usage experience, differences were found between
the group with less than 7 years of experience and the group with more than 15 years of
experience (p < 0.05).
As for the GPS plotter TRACK function that is currently being used, those with more
than 15 years of experience in using the GPS plotter tend to indicate that it is easy to
understand; however, those with less than 7 years of experience in using the GPS plotter
tend to indicate that it is difficult to understand (Figure A7).
(a)
(b)
Figure A7. (a) Users’ understanding of the term ‘MENU’ by experience of GPS plotter usage. Average (1: Worst to 5:
Best); (b) distribution of respondents (percentage).
(vi) MARK
As a result of the analysis on the understanding of terminologies in the GPS plotter’s
MARK function based on users’ GPS usage experience, differences were found between
the group with less than 7 years of experience, the group with 8 to 14 years of experience,
and the group with more than 15 years of experience (p > 0.05).
As for the MARK functions, those with more than 15 years of experience in using the
GPS plotter were of the opinion that it is easy to understand it in general; however, for
those with 8 to 14 years of experience and those with less than 7 years of experience, a
higher rate of respondents indicated that it is difficult to understand (Figure A8).
Figure A7. (a) Users’ understanding of the term ‘MENU’ by experience of GPS plotter usage. Average (1: Worst to 5: Best);(b) distribution of respondents (percentage).
(vi) MARK
As a result of the analysis on the understanding of terminologies in the GPS plotter’sMARK function based on users’ GPS usage experience, differences were found betweenthe group with less than 7 years of experience, the group with 8 to 14 years of experience,and the group with more than 15 years of experience (p > 0.05).
As for the MARK functions, those with more than 15 years of experience in using theGPS plotter were of the opinion that it is easy to understand it in general; however, forthose with 8 to 14 years of experience and those with less than 7 years of experience, ahigher rate of respondents indicated that it is difficult to understand (Figure A8).
J. Mar. Sci. Eng. 2021, 9, x FOR PEER REVIEW 18 of 22
(a)
(b)
Figure A8. (a) Users’ understanding of the term ‘MARK’ by experience of GPS plotter usage. Average (1: Worst to 5:
Best); (b) distribution of respondents (percentage).
(vii) ENT–ENTER
As a result of the analysis on understanding the terminologies in the GPS plotter’s
ENTER function, differences were found between the group with less than 7 years of
experience and the group with more than 15 years of experience (p < 0.05). As for the
ENTER functions, those with more than 15 years of experience in using the GPS plotter
expressed that it is easy to understand in general; however, for those with less than 7
years of experience, a higher rate of respondents expressed that it is difficult to under-
stand (Figure A9).
(a)
(b)
Figure A9. (a) Users’ understanding of the term ‘ENT’ by experience of GPS plotter usage. Average (1: Worst to 5: Best);
(b) distribution of respondents (percentage).
Frequently Used Functions
Users were asked five-point scale questions regarding the functions frequently used
when using GPS plotters. They were asked to assign 5 points for a function that was
frequently used and 1 point for a function that was rarely used (Figure A10). The results
indicated that the day/night mode changes and the route indication settings were the
most frequently used functions.
Figure A8. (a) Users’ understanding of the term ‘MARK’ by experience of GPS plotter usage. Average (1: Worst to 5: Best);(b) distribution of respondents (percentage).
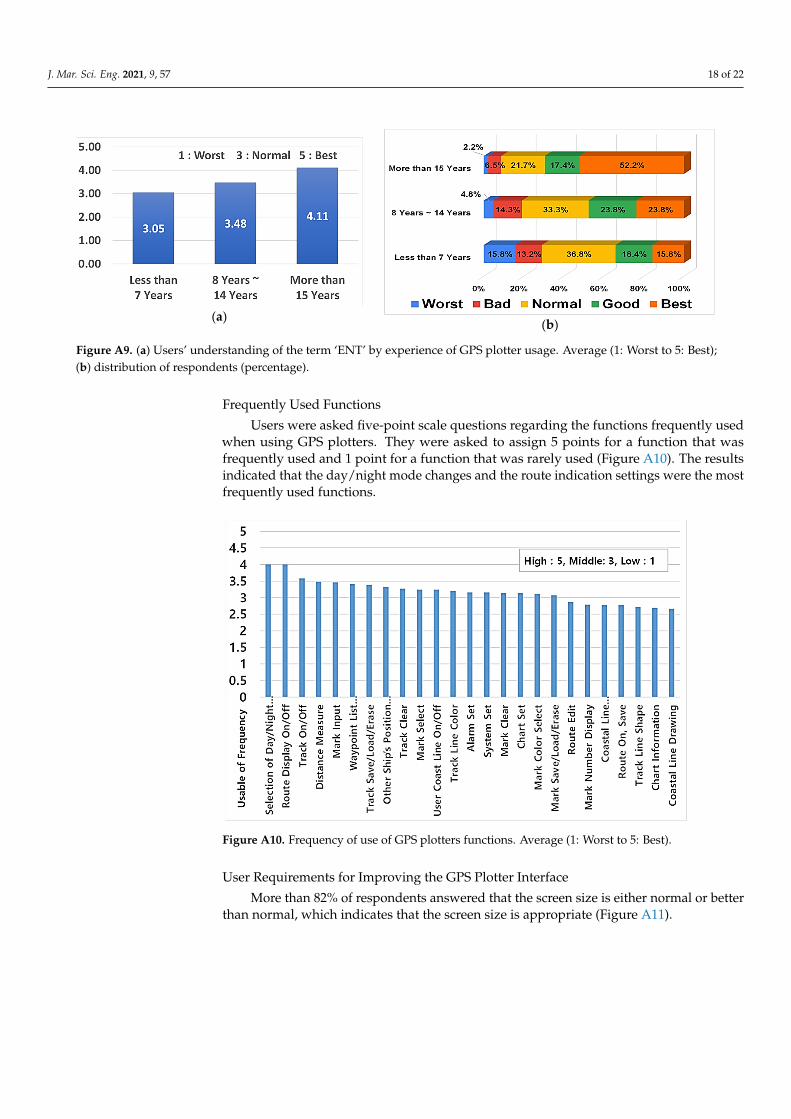
(vii) ENT–ENTER
As a result of the analysis on understanding the terminologies in the GPS plotter’sENTER function, differences were found between the group with less than 7 years ofexperience and the group with more than 15 years of experience (p < 0.05). As for theENTER functions, those with more than 15 years of experience in using the GPS plotterexpressed that it is easy to understand in general; however, for those with less than 7 yearsof experience, a higher rate of respondents expressed that it is difficult to understand(Figure A9).
J. Mar. Sci. Eng. 2021, 9, 57 18 of 22
J. Mar. Sci. Eng. 2021, 9, x FOR PEER REVIEW 18 of 22
(a)
(b)
Figure A8. (a) Users’ understanding of the term ‘MARK’ by experience of GPS plotter usage. Average (1: Worst to 5:
Best); (b) distribution of respondents (percentage).
(vii) ENT–ENTER
As a result of the analysis on understanding the terminologies in the GPS plotter’s
ENTER function, differences were found between the group with less than 7 years of
experience and the group with more than 15 years of experience (p < 0.05). As for the
ENTER functions, those with more than 15 years of experience in using the GPS plotter
expressed that it is easy to understand in general; however, for those with less than 7
years of experience, a higher rate of respondents expressed that it is difficult to under-
stand (Figure A9).
(a)
(b)
Figure A9. (a) Users’ understanding of the term ‘ENT’ by experience of GPS plotter usage. Average (1: Worst to 5: Best);
(b) distribution of respondents (percentage).
Frequently Used Functions
Users were asked five-point scale questions regarding the functions frequently used
when using GPS plotters. They were asked to assign 5 points for a function that was
frequently used and 1 point for a function that was rarely used (Figure A10). The results
indicated that the day/night mode changes and the route indication settings were the
most frequently used functions.
Figure A9. (a) Users’ understanding of the term ‘ENT’ by experience of GPS plotter usage. Average (1: Worst to 5: Best);(b) distribution of respondents (percentage).
Frequently Used Functions
Users were asked five-point scale questions regarding the functions frequently usedwhen using GPS plotters. They were asked to assign 5 points for a function that wasfrequently used and 1 point for a function that was rarely used (Figure A10). The resultsindicated that the day/night mode changes and the route indication settings were the mostfrequently used functions.
J. Mar. Sci. Eng. 2021, 9, x FOR PEER REVIEW 19 of 22
Figure A10. Frequency of use of GPS plotters functions. Average (1: Worst to 5: Best).
User Requirements for Improving the GPS Plotter Interface
More than 82% of respondents answered that the screen size is either normal or
better than normal, which indicates that the screen size is appropriate (Figure A11).
Figure A11. User preference for GPS plotter display size.
In addition, with regard to subjective responses to various functions of the GPS
plotter, it was found that some users were not fully aware of all the functions provided.
Some respondents requested that specific functions should be added such as anchor
watch functions when the vessel is at anchor, a distance measuring function that can
measure the distance from their vessel to the object, and a navigational function that
displays the estimated time of arrival.
Appendix B
Appendix B.1. Brief of User Test
Appendix B.1.1. Introduction of User Test
(1) Test participants: three captains and two first officers, a total of five individuals, all
with more than 10 years of experience in using a GPS plotter participated in the ex-
periment.
(2) Test scenario: vessel’s navigation from Busan Port to Ulsan Port.
Figure A10. Frequency of use of GPS plotters functions. Average (1: Worst to 5: Best).
User Requirements for Improving the GPS Plotter Interface
More than 82% of respondents answered that the screen size is either normal or betterthan normal, which indicates that the screen size is appropriate (Figure A11).
J. Mar. Sci. Eng. 2021, 9, 57 19 of 22
J. Mar. Sci. Eng. 2021, 9, x FOR PEER REVIEW 19 of 22
Figure A10. Frequency of use of GPS plotters functions. Average (1: Worst to 5: Best).
User Requirements for Improving the GPS Plotter Interface
More than 82% of respondents answered that the screen size is either normal or
better than normal, which indicates that the screen size is appropriate (Figure A11).
Figure A11. User preference for GPS plotter display size.
In addition, with regard to subjective responses to various functions of the GPS
plotter, it was found that some users were not fully aware of all the functions provided.
Some respondents requested that specific functions should be added such as anchor
watch functions when the vessel is at anchor, a distance measuring function that can
measure the distance from their vessel to the object, and a navigational function that
displays the estimated time of arrival.
Appendix B
Appendix B.1. Brief of User Test
Appendix B.1.1. Introduction of User Test
(1) Test participants: three captains and two first officers, a total of five individuals, all
with more than 10 years of experience in using a GPS plotter participated in the ex-
periment.
(2) Test scenario: vessel’s navigation from Busan Port to Ulsan Port.
Figure A11. User preference for GPS plotter display size.
In addition, with regard to subjective responses to various functions of the GPS plotter,it was found that some users were not fully aware of all the functions provided. Somerespondents requested that specific functions should be added such as anchor watchfunctions when the vessel is at anchor, a distance measuring function that can measurethe distance from their vessel to the object, and a navigational function that displays theestimated time of arrival.
Appendix B
Appendix B.1. Brief of User Test
Appendix B.1.1. Introduction of User Test
(1) Test participants: three captains and two first officers, a total of five individuals, allwith more than 10 years of experience in using a GPS plotter participated in theexperiment.
(2) Test scenario: vessel’s navigation from Busan Port to Ulsan Port.(3) Tested Equipment: The GPS plotter installed in the ship-handling simulator was used
(Figure A12). This GPS plotter type was a model approved by the Ministry of Oceansand Fisheries and was the same model that the previous user survey was based on.The equipment was operated by remote control.
(4) A preliminary simulation was conducted to familiarize users to the equipment.(5) Navigational tasks for the test: 10 frequently used navigational functions.(6) A fill-out questionnaire was provided, and an interview session was conducted for all
participants (Figure A13).
Appendix B.1.2. Experimental Method
(1) To measure the usability of a function, the time spent on performing a task by a userwas measured (Figure A14).
(2) The number of key strokes/clicks was measured to evaluate task performance.(3) An interview was conducted with regard to standardization requirements of the terms
of the information displayed on the GPS plotter screen and the navigational functions.
J. Mar. Sci. Eng. 2021, 9, 57 20 of 22
J. Mar. Sci. Eng. 2021, 9, x FOR PEER REVIEW 20 of 22
(3) Tested Equipment: The GPS plotter installed in the ship-handling simulator was
used (Figure A12). This GPS plotter type was a model approved by the Ministry of
Oceans and Fisheries and was the same model that the previous user survey was
based on. The equipment was operated by remote control.
(4) A preliminary simulation was conducted to familiarize users to the equipment.
(5) Navigational tasks for the test: 10 frequently used navigational functions.
(6) A fill-out questionnaire was provided, and an interview session was conducted for
all participants (Figure A13).
Appendix B.1.2. Experimental Method
(1) To measure the usability of a function, the time spent on performing a task by a user
was measured (Figure A14).
(2) The number of key strokes/clicks was measured to evaluate task performance.
(3) An interview was conducted with regard to standardization requirements of the
terms of the information displayed on the GPS plotter screen and the navigational
functions.
(a) (b)
Figure A12. (a) Ship-handling simulator; (b) a chart table equipped with GPS plotter.
(a) (b)
Figure A13. (a) User test; (b) discussion after the test.
Figure A12. (a) Ship-handling simulator; (b) a chart table equipped with GPS plotter.
J. Mar. Sci. Eng. 2021, 9, x FOR PEER REVIEW 20 of 22
(3) Tested Equipment: The GPS plotter installed in the ship-handling simulator was
used (Figure A12). This GPS plotter type was a model approved by the Ministry of
Oceans and Fisheries and was the same model that the previous user survey was
based on. The equipment was operated by remote control.
(4) A preliminary simulation was conducted to familiarize users to the equipment.
(5) Navigational tasks for the test: 10 frequently used navigational functions.
(6) A fill-out questionnaire was provided, and an interview session was conducted for
all participants (Figure A13).
Appendix B.1.2. Experimental Method
(1) To measure the usability of a function, the time spent on performing a task by a user
was measured (Figure A14).
(2) The number of key strokes/clicks was measured to evaluate task performance.
(3) An interview was conducted with regard to standardization requirements of the
terms of the information displayed on the GPS plotter screen and the navigational
functions.
(a) (b)
Figure A12. (a) Ship-handling simulator; (b) a chart table equipped with GPS plotter.
(a) (b)
Figure A13. (a) User test; (b) discussion after the test. Figure A13. (a) User test; (b) discussion after the test.
1
Figure A14. Result of user testing on performance of each task.
Appendix B.2. Key Outcomes
Through a simulation test with five participants, the time required to perform 10 tasksand the number of function key strokes/clicks were measured and recorded (Figure A14).
After the scenario was complete, interviews were conducted with the participants.Participants said that they felt difficulties when modifying the route, drawing user shorelines that involved the handling of a variety of functional keys, or finding the menu forspecific tasks, which takes a certain time. In addition, items that must be displayed on theGPS plotter screen were identified, as shown in Table 5.
The participants discussed the menu name of the GPS plotter interface and gaveparticular attention to frequently used functions, which they hoped they could apply
J. Mar. Sci. Eng. 2021, 9, 57 21 of 22
standard icons or standard terminology in their own language to, so that navigators couldintuitively recognize them, thereby improving usability.
References1. Zalewski, P. A Critical Analysis of IMO S-Mode Guidelines. Trans. Nav. Int. J. Mar. Navig. Saf. Sea Transp. 2019, 13, 841–846.
[CrossRef]2. International Maritime Organization. MSC.466 (101), Amendments to the Performance Standards for the Presentation of Navigation-
related Information on Shipborne Navigational Displays; IMO: London, UK, 2000.3. Jung, M.; Lee, S.J. UI standard for navigation system. Sea Technol. 2020, 50–55. Available online: https://lsc-pagepro.
mydigitalpublication.com/publication/?m=60787&i=686620&p=24 (accessed on 15 December 2020).4. Patriko, D.; Doherty, R.; Lemon, N.; Vu, V.D.; Lee, S.; Lutzhoft, M. Getting to S-Mode. Seaw. Int. J. Naut. Inst. 2019, 6–12.5. International Maritime Organization. MSC.1/Circ.1609 Guidelines for the Standardization of User Interface Design for Navigation
Equipment; IMO: London, UK, 2019.6. Liu, Q.; Zhang, Y.L. Development and Application of Electronic Chart System in Ocean Navigation. Adv. Mater. Res. 2014, 875,
1972–1975. [CrossRef]7. Jung, M.; Park, Y.S.; Kang, S.Y. Analysis of User Requirement for the Improvement of ECDIS to Enhance Navigational Safety and
Work Efficiency. J. Navig. Port Res. 2015, 39, 141–147. [CrossRef]8. Jung, M.; Chae, B.G.; Ahn, Y.J. User Requirement Analysis of ECDIS for the Development on S-Mode Guideline. J. Navig. Port Res.
2016, 40, 89–95. [CrossRef]9. Car, M.; Brcic, B.; Žuškin, S.; Svilicic, B. The Navigator’s Aspect of PNC before and after ECDIS Implementation: Facts and
Potential Implications towards Navigation Safety Improvement. J. Mar. Sci. Eng. 2020, 8, 842. [CrossRef]10. Bakalar, G.; Baggini, M.B. Bridge Officers’ Operational Experiences with Electronic Chart Display and Information Systems on
Ships. J. Marit. Trans. Sci. 2016, 52, 49–61. [CrossRef]11. Lee, B.K. Usability Test and Investigation of Improvements of the ECDIS. J. Korean Soc. Mar. Environ. 2018, 24, 146–156. [CrossRef]12. Arslan, O.; Atik, O.; Kahraman, S. Eye tracking in usability of electronic chart display and information system. J. Navig. 2020,
1–11. [CrossRef]13. Hareide, O.S.; Ostnes, R. Maritime usability study by analysing eye tracking data. J. Navig. 2017, 70, 927–943. [CrossRef]14. Bjørneseth, F.B.; Clarke, L.; Dunlop, M.; Komandur, S. Towards an Understanding of Operator Focus Using Eye-Tracking in
Safety-Criticalmaritime Settings. Proc. Int. Conf. Hum. Factors Ship Des. Oper. 2014. Available online: http://citeseerx.ist.psu.edu/viewdoc/download?doi=10.1.1.639.8311&rep=rep1&type=pdf (accessed on 12 November 2020).
15. Žagar, D.; Svetina, M.; Košir, A.; Dimc, F. Human Factor in Navigation: Overview of Cognitive Load Measurement duringSimulated Navigational Tasks. J. Mar. Sci. Eng. 2020, 8, 775. [CrossRef]
16. Jung, J.E.; Jung, M.; Jeon, J.H.; Jeon, G.J.; Lee, S.J. Development and User Test of Standard Navigational Tasks to Improve UserInterface of Navigational Equipment. J. Digit. Contents Soc. 2018, 19, 1981–1988. [CrossRef]
17. Jung, J.E.; Jung, M.; Lee, S.J. Eye Gaze Analysis of Ferry Navigators for Improving Usability of Navigational Equipment. J. Digit.Contents Soc. 2018, 19, 2211–2217. [CrossRef]
18. Gisela, M.; Jung, D.; Martin, M. Research-Based Design and Usability Guidelines for Electronic Charting Systems (ECS)in Yachting and Boating. Int. J. Navig. Marit. Econ. 2018, 10. Available online: https://www.researchgate.net/profile/Gisela_Mueller-Plath/publication/331559553_Research-Based_Design_and_Usability_Guidelines_for_Electronic_Charting_Systems_ECS_in_Yachting_and_Boating/links/5c804ab292851c69505c69c9/Research-Based-Design-and-Usability-Guidelines-for-Electronic-Charting-Systems-ECS-in-Yachting-and-Boating.pdf (accessed on 17 November 2020).
19. Kim, D.H. Speed Limit Violation Warning Function in Trade Ports and Fairways—GPS Plotter and ECDIS Enhancements. J.Korean Soc. Mar. Environ. 2019, 25, 841–850. [CrossRef]
20. Kim, H.Y.; Yoo, Y.H. A Study on the Problems and Improvement of GPS Plotter Usage for Coastal Ships through the Analysis ofMarine Accident. J. Korean Soc. Mar. Environ. 2014, 4, 21–42.
21. An, K. E-navigation Services for Non-SOLAS Ships. Int. J. Navig. Marit. Econ. 2016, 4, 13–22. [CrossRef]22. Saitoh, Y.; Wada, M. A development of GIS plotter for small fishing vessels running on common Linux. In Proceedings of the 3rd
International Conference on Computer Research and Development, Shanghai, China, 11–13 March 2011; pp. 107–111. [CrossRef]23. Ministry of Oceans and Fisheries. Legislative Notice (2020–1085). 2020. Available online: https://www.mof.go.kr/iframe/
article/view.do?articleKey=34914&boardKey=36&menuKey=333¤tPageNo=1 (accessed on 17 November 2020).24. IMO. SN.1/Circ.243/Rev.2 Guidelines for the Presentation of Navigation-Related Symbols, Terms and Abbreviations. 2019, pp.
1–33. Available online: https://iho.int/uploads/user/About%20IHO/International_Organisations/ECDIS-ENC/English/SN_Circ243-Rev.2%20-%20Guidelines%20For%20The%20Presentation%20Of%20Navigation-Related%20Symbols%20Terms%20And%20Abbreviations.pdf (accessed on 17 November 2020).
25. Ministry of Oceans and Fisheries. Standards for Type Approval Tests and Inspections for Marine Products, Legal InformationCenter. 2019. Available online: http://www.law.go.kr/admRulSc.do?tabMenuId=tab107&query=%EC%84%A0%EB%B0%95%EC%9A%A9#liBgcolor1 (accessed on 17 November 2020).
26. Samyung ENC. GPS plotter_manual_NAVIS 3800. 2019. Available online: http://www.samyungenc.com (accessed on 17 Novem-ber 2020).
27. ICT Standardization Committee. The Usability Evaluation Performing Method based on User Experience; Technical Report TTAR-10.0099; 2018; pp. 18–22. Available online: https://committee.tta.or.kr/data/standard_view.jsp?order=t.standard_no&by=asc&nowPage=10&pk_num=TTAR-10.0099&commit_code=PG415 (accessed on 10 November 2020).
28. IMO. MSC.1/Circular.1512 Guideline on Software Quality Assurance and Human Centred Design for E-navigation. 2015.Available online: https://www.imorules.com/MSCCIRC_1512.html (accessed on 10 November 2020).
29. Lützhöft, M.H.; Dekker, S.W.A. On your watch: Automation on the bridge. J. Navig. 2002, 55, 83–96. [CrossRef]30. Mallam, S.C.; Lundh, M.; MacKinnon, S.N. Evaluating a digital ship design tool prototype: Designers’ perceptions of novel
ergonomics software. Appl. Ergon. 2017, 59, 19–26. [CrossRef]31. International Chamber of Shipping. Bridge Procedures Guide, 5th ed.; Marisec: London, UK, 2016; pp. 58–119.32. Kim, M.S.; Shin, H.O.; Lee, J.H.; Hwang, B.K. Characteristics of bridge task in Korean coastal large trawler. J. Korean Soc. Fish