University of Cape Town Case Study Review of Advanced Water Metering Applications in South Africa Department of Civil Engineering Masters Dissertation By: Ngabirano Lillian Supervisor: Prof. Kobus Van Zyl October 2017
Transcript
Univers
ity of
Cap
e Town
Case Study Review of Advanced Water Metering Applications in
South Africa
Department of Civil EngineeringMasters Dissertation
By: Ngabirano LillianSupervisor: Prof. Kobus Van Zyl
October 2017
The copyright of this thesis vests in the author. No quotation from it or information derived from it is to be published without full acknowledgement of the source. The thesis is to be used for private study or non-commercial research purposes only.
Published by the University of Cape Town (UCT) in terms of the non-exclusive license granted to UCT by the author.
Univers
ity of
Cap
e Tow
n
PLAGIARISM DECLARATION
ACKNOWLEDGMENTS
This research on which this report was based formed part of the project funded by the Water Research Commission, entitled “State-of-art in Advanced Water Metering” (WRC Project No K5/2370).
This dissertation and the work accruing to it would therefore not have been possible without financial support from the Water Research Commission. I sincerely express my profound gratitude to the Water Research Commission and the project leader Prof. J.E. van Zyl for according me the opportunity to carry out this work.
I would also like to extend my gratitude to the National Research Fund (NRF) for their additional financial support without which I would have been unable to complete this work.
Enormous gratitude is also given to my Supervisor; Prof. J.E. van Zyl for his continued guidance, support and encouragement throughout the entire duration of my Masters degree. I owe him the success of this project.
The Civil Engineering Department of UCT provided me with all necessary facilitation to ensure this thesis project was completed and I am indebted to them for this. My fellow Masters and PhD colleagues also provided me with the encouragement and support to reach the finish line.
Last but not least, a great thank you to all my family and friends for always encouraging me to finish what I start.
ABSTRACT
INTRODUCTION
Advanced water metering is part of a much larger movement towards smart networks and intelligent infrastructure. However, where advanced metering technology is focused more towards the need to obtain meter readings without human intervention in other parts of the world, in South Africa and other developing countries, advanced water metering (in the form of prepaid meters or water management devices) has been developing along a parallel path, driven by the need to provide services to previously unserved communities and deal with the problems caused by rapid urbanisation.
In this report, conventional water metering is defined as systems using water meters that display their readings on the meters themselves and advanced water metering as systems that add additional components or functionality to a metering system.
Advanced metering has the potential to provide substantial benefits if appropriately applied. However, compared with conventional metering, these systems are considerably more expensive and complicated, and often rely on technology that is still being developed. Advanced metering systems therefore carry a higher risk of failure, poor service delivery and financial losses unless the system is implemented with careful design and thorough planning.
This report describes a number of case studies of the application of advanced metering in South Africa. The case studies were evaluated according to the evaluation framework described in Appendix A and their detailed evaluations are included in each relevant chapter.
Evaluations were done in four areas: technical, environmental, social and economic. The technical evaluation is based on the systems complying with the relevant national metering standards and good metering practice, the environmental evaluations on battery disposal and water savings and the social evaluation on broad socio-economic indicators. It should be recognised that social issues are particularly complex and that no general evaluation framework can accurately predict whether an advanced metering system will be accepted by a particular community.
The economic evaluations were based on reductions of the current system cost and not absolute values. Economic performance indicators included the effective surplus (income minus expenses over averaged over the meter service life) and capital repayment period.
An overview of lessons learned and conclusions from the case studies are provided in Chapters 8 and 9 of the report.
CASE STUDIES
Four case studies were evaluated as part of this report: Water management devices in Cape Town, Prepaid meters in iLembe District Municipality and Olievenhoutbosch, and automatic meter reading in the Epping Industrial Area in Cape Town.
Water Management Devices in Cape Town. The City of Cape Town has been using water management devices to assist low income consumers to manage their consumption
since 2006 with over 160 000 devices installed. These water management devices have resulted in substantial savings in water consumption, but these meters were not found to be economically feasible. Thus the additional cost of implementing advanced meters seems to be a price the City of Cape Town is willing to pay to reduce consumption levels.
Prepaid Meters in iLembe Municipality. Prepaid meters were installed in iLembe in 2013 to improve revenue collection and reduce debts, but none of the benefits anticipated were realised. In particular, the scheme was found not to be economically feasible. A considerable number of challenges in running the new advanced schemes were faced by the municipality calling into question the durability of the different advanced metering products and their technology. These issues further emphasized the need for feasibility studies before advanced meters are installed.
Prepaid Meters in Olievenhoutbosch. In 2003, prepaid meters were rolled out in Olievenhoutbosch with some benefits obtained from the advanced meters in large part due to the lower rates for users on the prepaid compared to conventional schemes. However, proprietary vending issues were one of the distinct challenges in utilising the scheme. The need to train sufficient trained municipal personnel to handle any problems with the scheme was also realised. The prepaid meters were not found to be economically feasible. In addition it was found that using conventional meters instead of advanced meters would have made the scheme economically feasible even at much lower payment rates.
Automatic Meter Reading in the Epping industrial area. Advanced Meter Reading technology was piloted in a metering scheme in Epping Cape Town in 2008. This case study focuses on industrial and not domestic consumption as in the other case studies. The major distinctions this caused were that the social feasibility didn’t play a big role and the individual consumption for this scheme was much higher than the other domestic cases. However in spite of the increased consumption rates, the advanced meter reading system remained prohibitively expensive and incurred operational deficits for Cape Town. It was thus discontinued and the area was returned to conventional metering.
KEY FINDINGS
It was observed for all four case studies investigated that the challenges in using advanced meters generally outweighed the benefits. The ability of other alternatives to meet the primary objectives of these advanced meter installations should therefore be examined with advanced metering viewed not as a goal, but as part of many alternative solutions to a particular problem. There may be cases where the additional cost of advanced metering is justified by the benefits in another area such as reduced consumption, but it is unlikely that advanced metering itself will be economically feasible.
Most case studies revealed that community involvement is critical in changing attitudes towards advanced meters and therefore extensive stakeholder engagement must be carried out before any new scheme roll out.
It was also realised that there are currently a number of policy issues that need to be clarified in order to better guide future advanced metering upgrades in South Africa. These include uniform communication and payment system standards that will protect
municipalities from being tied in to one supplier and encourage competition, qualification standards for staff supporting advanced metering systems, legality of advanced meter records for billing purposes and labour reallocation.
Although the cost of advanced metering is high, its advantages in terms of leak detection and consumption monitoring makes it an attractive option on bulk and zonal meters.
Since the technology of advanced meters is still developing, strict procurement specifications should be set in order for utilities to obtain more durable metering products with minimal failure rates. Finally, it is recommended that suppliers are bound by medium and not short term performance guarantees to ensure that municipalities don’t carry the risk for inherently flawed products.
CONCLUSION AND WAY FORWARD
The entire project lifecycle should be considered when determining the feasibility of advanced metering, including product selection, project implementation and operation & maintenance. This will enable utilities make more realistic projections of economic, environmental, social and technical benefits, if any, before the scheme is put into place.
Setting performance objectives is key to both selection of appropriate advanced meters to meet utility needs as well as determining their feasibility using the evaluation framework developed. Some objectives may affect each other, for example, environmental benefits such as consumption reduction may reduce economic viability. It may therefore not be possible to meet all objectives and that may be acceptable in cases where one objective is traded off against another.
The evaluation framework presented in this report offer guidelines that should be adopted to each situation by competent technical staff. It is critically important that proper engineering planning is conducted using tools like the ones developed in this project before an advanced metering project is specified. Just as important is the continual monitoring of the system performance and the comparison of actual to projected performance. Suppliers should be required to carry the risk of their products malfunctioning on a medium (3 to 8 years) basis to ensure that this is not borne by the public.
Taking into consideration the overall benefits gained compared to the challenges faced in most of the case studies above, it is critical that utilities approach advanced metering as part of many alternative solutions to a particular problem, not as a goal in itself.
UCT MASTERS THESIS CASE STUDY REVIEW OF ADVANCED WATER METERING APPLICATIONS IN SOUTH AFRICA
MASTERS DISSERTATION | OCTOBER 2017 Page | (i)
TABLE OF CONTENTS PAGE(S)
PLAGIARISM DECLARATION ............................................................................................ I
ACKNOWLEDGMENTS ................................................................................................... II
ABSTRACT .................................................................................................................... III
1 INTRODUCTION ............................................................................................... 1 1.1 Background .......................................................................................................................... 1 1.2 Defining Advanced Metering ............................................................................................... 1 1.3 Goals and Objectives ........................................................................................................... 2 1.4 Scope of the Study ............................................................................................................... 3 1.5 Layout of this Document ..................................................................................................... 3
2 LITERATURE REVIEW ........................................................................................ 5 2.1 Current Water Policy and Regulatory Framework .............................................................. 5
Stakeholders in the Water Industry in South Africa ............................................. 5 Water Quality Standards and Metering Technical Specifications ........................ 6
2.2 Types of Water Meters ........................................................................................................ 7 Conventional Water Meters ................................................................................. 7 Advanced Water Meters ...................................................................................... 8 Overall Benefits of Advanced Meters ................................................................ 10
2.3 Summary of South African and International case studies from literature ...................... 11 Operation Gcin’ amanzi in Soweto ..................................................................... 12 Klipheuwel Prepaid Metering ............................................................................. 12 Nkomazi Prepaid Metering Project .................................................................... 13 Burbank AMI Project .......................................................................................... 13 Pinetop Waters Advanced Metering Project ..................................................... 14 Melbourne AMI Case Study................................................................................ 14
2.4 Challenges Experienced in AM Implementation ............................................................... 15 Social Challenges ................................................................................................ 16 Environmental Challenges .................................................................................. 18
UCT MASTERS THESIS CASE STUDY REVIEW OF ADVANCED WATER METERING APPLICATIONS IN SOUTH AFRICA
MASTERS DISSERTATION | OCTOBER 2017 Page | (ii)
3.5 Task 5: Pilot Field study ..................................................................................................... 27 3.6 Task 6: Continuation of Field Studies ................................................................................ 28 3.7 Task 7: Data analysis of Field Findings ............................................................................... 28
4 WATER MANAGEMENT DEVICES IN CAPE TOWN ............................................ 29 4.1 Introduction ....................................................................................................................... 29 4.2 Reasons for Implementation ............................................................................................. 31 4.3 Project Implementation Process ....................................................................................... 32 4.4 Technical Specifications of Main WMDs Installed ............................................................. 34
Aqualoc Water Demand Management Systems ................................................ 34 Utility Systems Water Management Devices ..................................................... 34
4.5 Benefits of the WMD Implementation .............................................................................. 36 4.6 Challenges Encountered .................................................................................................... 36
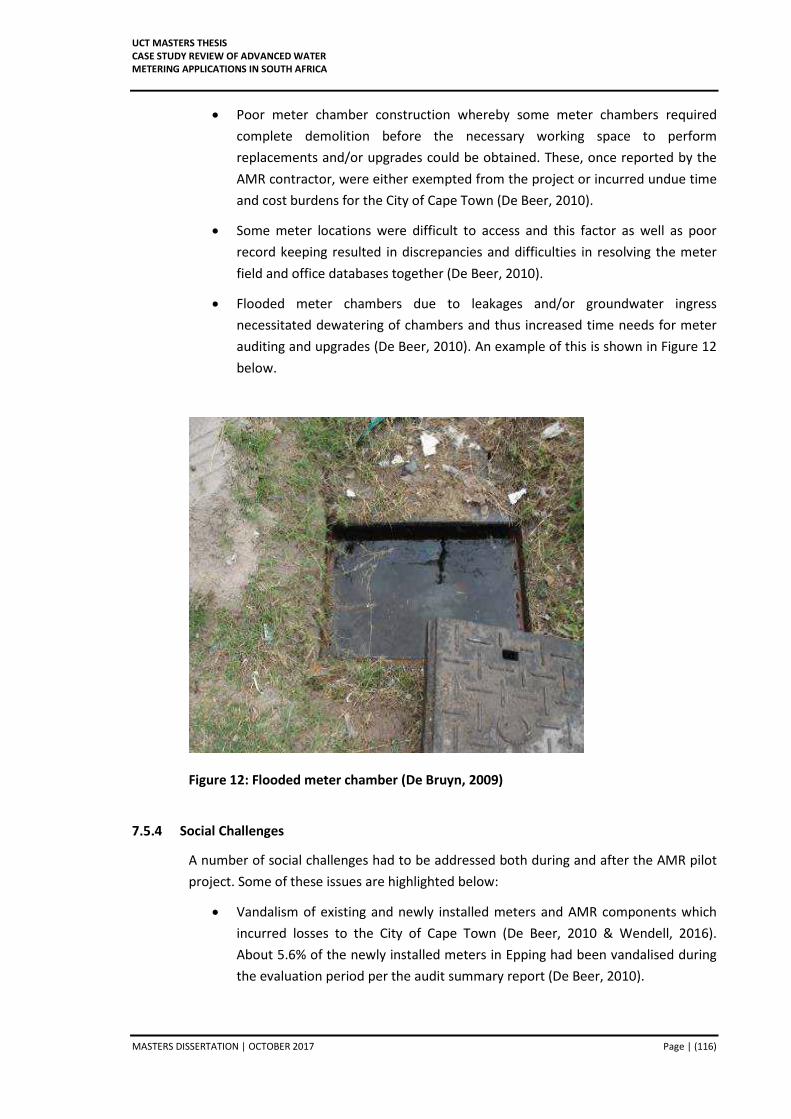
4.7 Current Status of Water Management Device Implementation in CoCT .......................... 42 4.8 Evaluation of Water Management Devices (WMD) Case Study in Cape Town ................. 42
Model Input Parameters .................................................................................... 42 Results ................................................................................................................ 52
5 PREPAID WATER METERS IN ILEMBE DISTRICT MUNICIPALITY ........................ 59 5.1 Introduction ....................................................................................................................... 59 5.2 Reasons for Implementation ............................................................................................. 59 5.3 Technical Specifications of Utility Systems Prepaid Water Metering System ................... 60
Water Management Devices (WMD) ................................................................. 60 User Interface Unit (UIU).................................................................................... 61 Vending Infrastructure ....................................................................................... 61 Data Collection Hard and Software Interfaces ................................................... 62
5.4 Project Implementation Process ....................................................................................... 63 5.5 Benefits of the Prepaid System ......................................................................................... 64 5.6 Challenges Encountered .................................................................................................... 64
5.7 Current Status of iLembe Prepaid Metering Project ......................................................... 69 5.8 Evaluation of Prepaid Metering in iLembe Municipality ................................................... 69
Model Input Parameters .................................................................................... 69 Results ................................................................................................................ 80
6 PREPAID METER INSTALLATION IN OLIEVENHOUTBOSCH, TSHWANE .............. 85 6.1 Introduction ....................................................................................................................... 85 6.2 Project Implementation Process ....................................................................................... 85
UCT MASTERS THESIS CASE STUDY REVIEW OF ADVANCED WATER METERING APPLICATIONS IN SOUTH AFRICA
MASTERS DISSERTATION | OCTOBER 2017 Page | (iii)
6.3 Technical Specifications of Elster Kent Prepaid Metering System Installed ...................... 86 Domestic Water Dispenser (DWD) ..................................................................... 86 Above-ground Meter Box ................................................................................... 87 Tokens ................................................................................................................ 87 Hardware System Components .......................................................................... 89 Cash flow Management System ......................................................................... 89 System Requirements ........................................................................................ 89 Management Information .................................................................................. 90 Prepaid Meter Display ........................................................................................ 90
6.4 Benefits of the Prepaid Metering Implementation ........................................................... 91 6.5 Challenges Encountered .................................................................................................... 91
6.6 Current Status of Prepaid Metering Installation in Olievenhoutbosch ............................. 93 6.7 Evaluation of Prepaid Meter Installation in Olievenhoutbosch, Tshwane ........................ 94
Model Input Parameters .................................................................................... 94 Results .............................................................................................................. 104
7 AUTOMATIC METER READING IN EPPING INDUSTRIAL AREA ........................ 109 7.1 Introduction ..................................................................................................................... 109 7.2 Reasons for Implementation ........................................................................................... 109 7.3 Project Implementation Process ..................................................................................... 111
Consumer Awareness ....................................................................................... 111 Meter Audits .................................................................................................... 111
7.4 Benefits of the AMR System ............................................................................................ 113 7.5 Challenges Encountered .................................................................................................. 114
7.6 Current Status of Epping Pilot Project ............................................................................. 118 7.7 Evaluation of Epping AMR Case Study in Cape Town ...................................................... 118
Model Input Parameters .................................................................................. 118 Results .............................................................................................................. 128
8.5 Social Considerations ....................................................................................................... 145 Community Involvement .................................................................................. 145 Multipronged Method...................................................................................... 145 Stakeholder Engagement ................................................................................. 145 Labour Reallocation .......................................................................................... 146
8.6 Environmental Considerations ........................................................................................ 146 Water Savings ................................................................................................... 146 Energy Use and Battery Disposal ..................................................................... 146
9 CONCLUSIONS ............................................................................................. 149 9.1 Key Conclusions ............................................................................................................... 149 9.2 Recommendations for further Research ......................................................................... 150 9.3 Contribution to Knowledge ............................................................................................. 151
10 REFERENCES ................................................................................................ 152 APPENDIX A: EVALUATION FRAMEWORK USER GUIDE APPENDIX B: ADVANCED METERING CASE STUDY UPDATE QUESTIONNAIRE SUPPLIED SEPARATELY: APPENDIX A CASE STUDY FRAMEWORK MODELS A1-A4 which can be viewed at the link below: https://drive.google.com/open?id=0B95j3tcHaqWAbUoxc083S1Bibzg
UCT MASTERS THESIS CASE STUDY REVIEW OF ADVANCED WATER METERING APPLICATIONS IN SOUTH AFRICA
MASTERS DISSERTATION | OCTOBER 2017 Page | (v)
TABLE INDEX PAGE(S)
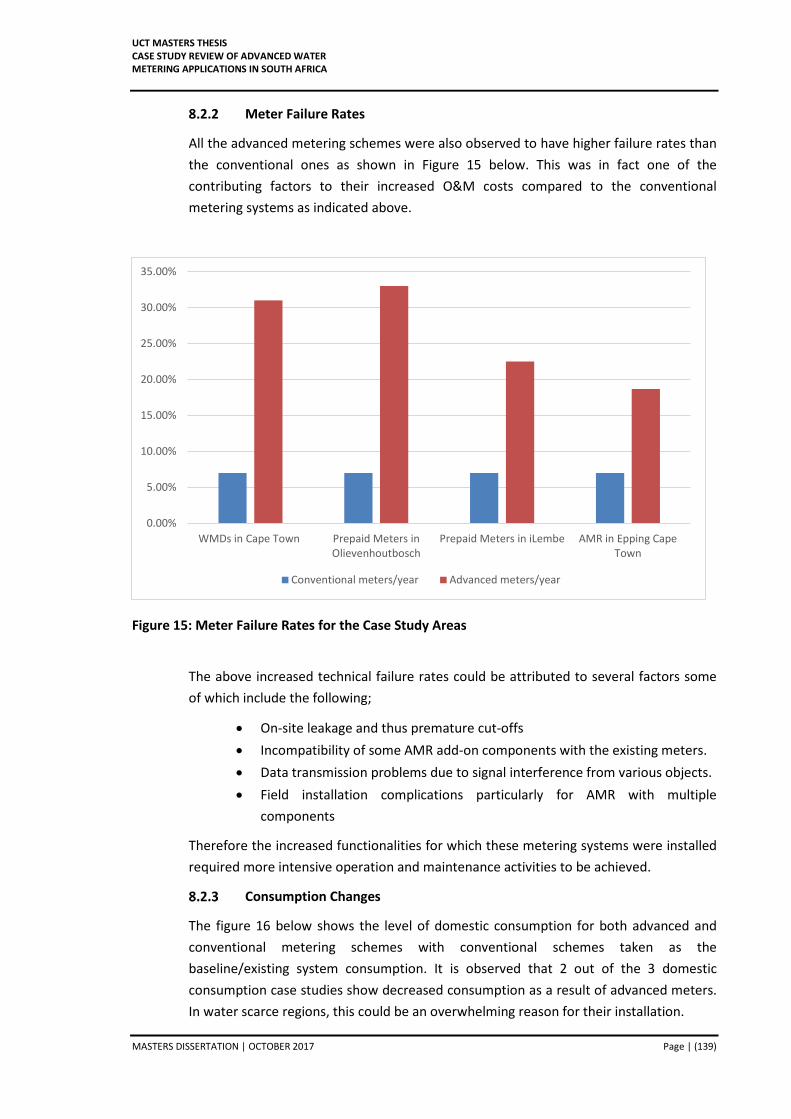
Table 1: South African Case Study Database based on Literature Review .....................................19 Table 2: Table showing the main input parameters of the Evaluation Framework ......................23 Table 3 : Global Parameters .............................................................................................................43 Table 4: Water Consumption before Advanced Meter Implementation .......................................43 Table 5: Conventional Metering Scheme Parameters ....................................................................46 Table 6: Proposed Advanced Metering Scheme Parameters ..........................................................49 Table 7: Technical result for WMD Case Study in Cape Town ........................................................53 Table 8: Social result of the WMD Case Study in Cape Town .........................................................53 Table 9: Environmental result of the WMD Case Study in Cape Town ..........................................54 Table 10: Economic Viability of WMD Case Study in Cape Town .............................................. 54 Table 11: Global Parameters for iLembe District Municipality .......................................................70 Table 12: Water Consumption before Advanced Meter Implementation .....................................71 Table 13: Proposed Conventional Metering Scheme Parameters ..................................................73 Table 14: Proposed Advanced Scheme Parameters ........................................................................76 Table 15: Technical Result for case study in iLembe................................................................. 80 Table 16: Social result of the Prepaid Case Study in iLembe ..................................................... 80 Table 17: Environmental result of the Prepaid Case Study in iLembe ...........................................81 Table 18: Economic viability of Prepaid case study in iLembe .................................................. 82 Table 19: Global Parameters ............................................................................................................94 Table 20: Water Consumption before Advanced Meter Implementation .....................................95 Table 21: Conventional Metering Scheme Parameters ..................................................................98 Table 22: Proposed Advanced Metering Scheme Parameters......................................................100 Table 23: Technical result for Prepaid Case Study in Olievenhoutbosch .....................................104 Table 24: Social result of the Prepaid Case Study in Olievenhoutbosch ......................................104 Table 25: Environmental result of the Prepaid Case Study in Olievenhoutbosch .......................105 Table 26: Economic Viability Results for prepaid metering in Olievenhoutbosch .................... 105 Table 27: Global Parameters ..........................................................................................................119 Table 28: Water Consumption before Advanced Meter Implementation ...................................119 Table 29: Modified Conventional Metering Scheme Parameters ................................................121 Table 30: Proposed Advanced Metering Scheme Parameters......................................................124 Table 31: Technical result for AMR Case Study in Cape Town ......................................................129 Table 32: Social result of the AMR Case Study in Cape Town .......................................................129 Table 33: Environmental result of the AMR Case Study in Cape Town ........................................129 Table 34: Economic Viability of AMR case study in Cape Town .............................................. 130 Table 36: Effective surplus of conventional and advanced metering schemes ...........................138
UCT MASTERS THESIS CASE STUDY REVIEW OF ADVANCED WATER METERING APPLICATIONS IN SOUTH AFRICA
MASTERS DISSERTATION | OCTOBER 2017 Page | (vi)
FIGURE INDEX PAGE(S)
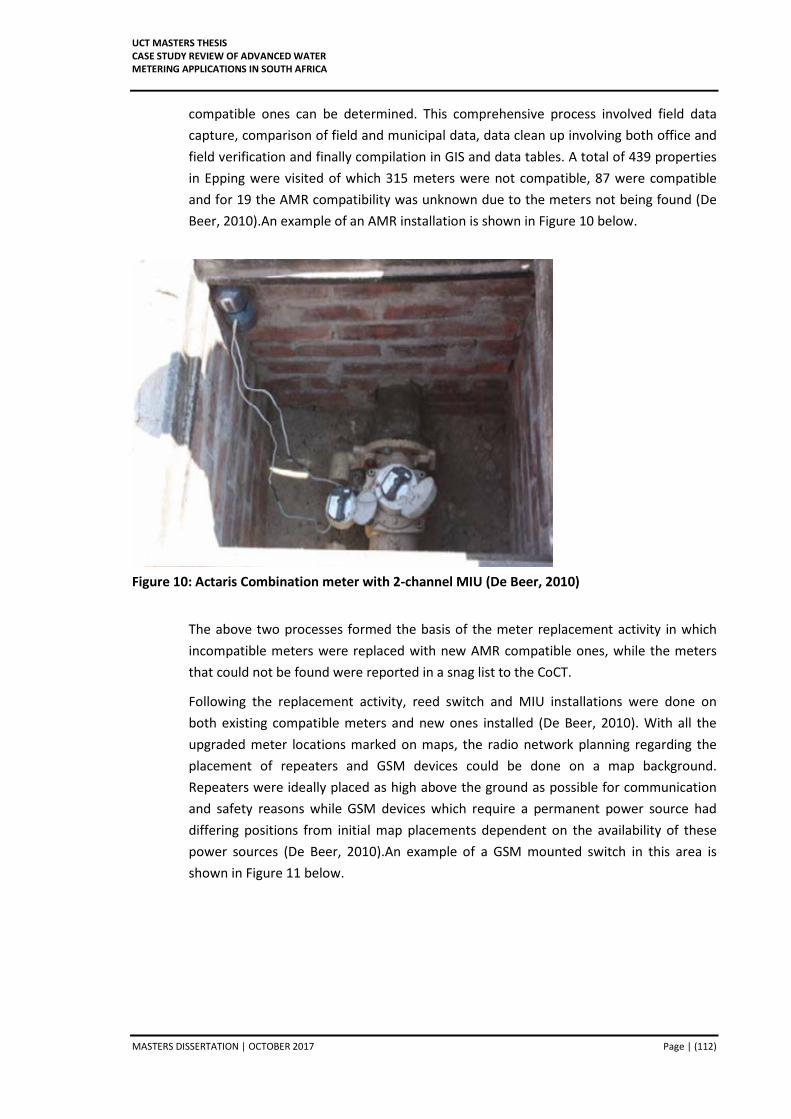
Figure 1: U Utility Systems Water Management Device (courtesy of Utility Systems) ............... 35 Figure 2: Utility Systems Water Management Device (courtesy of Utility Systems) .................. 61 Figure 3: Utility Systems User Interface Unit (courtesy of Utility Systems) ............................... 61 Figure 4: Vending and communication infrastructure of USC prepaid metering system (courtesy
of Utility Systems) ........................................................................................................... 62 Figure 5: Prepaid Meter Above-ground box (Elster Kent, 2014)................................................ 87 Figure 6: Consumer Token (Elster Kent, 2014) ......................................................................... 88 Figure 7: Maintenance Token (Elster Kent, 2014) .................................................................... 88 Figure 8: Engineering Token (Elster Kent, 2014) ...................................................................... 88 Figure 9: Epping Industrial Pilot Area (De Bruyn, 2009) .......................................................... 111 Figure 10: Actaris Combination meter with 2-channel MIU (De Beer, 2010) ........................... 112 Figure 11: GSM unit mounted with Isolating switch (De Beer, 2010) ...................................... 113 Figure 12: Flooded meter chamber (De Bruyn, 2009) ............................................................. 116 Figure 13: Meter chamber filled with rubbish (De Bruyn, 2009) ............................................. 117 Figure 14: Economic Results of the different case study areas) .............................................. 138 Figure 15: Meter Failure Rates for the Case Study Areas ........................................................ 139 Figure 16: Domestic Consumption of existing conventional case and advanced metering systems
UCT MASTERS THESIS CASE STUDY REVIEW OF ADVANCED WATER METERING APPLICATIONS IN SOUTH AFRICA
MASTERS DISSERTATION | OCTOBER 2017 Page | (vii)
ABBREVIATIONS AMI Advanced Metering Infrastructure AMR Automatic Meter Reading CDMA Code-Division Multiple-Access CoCT City of Cape Town CoT City of Tshwane DWD Domestic Water Dispenser GSM Global System for Mobile for communication HAN Home Area Network LAN Local Area Network MIU Meter Interface Unit NIST United States National Institute for Standards and Technology PLC Power Line Communication RF Radio Frequency SEP Smart Energy Profile STS Standard Transfer Specification UMTS Universal Mobile Telecommunications System (UMTS) WAN Wide Area Network WBKMS Web-based Knowledge Management system WCDMA Wideband code-division multiple-access WMD Water Management Device WMN Wireless Mesh Network WRC Water Research Commission of South Africa
UCT MASTERS THESIS CASE STUDY REVIEW OF ADVANCED WATER METERING APPLICATIONS IN SOUTH AFRICA
MASTERS DISSERTATION | OCTOBER 2017 Page | (1)
1 INTRODUCTION
1.1 Background
Advanced water metering is part of a much larger movement towards smart networks and intelligent infrastructure. However, where advanced metering technology is focused more towards the need to obtain meter readings without human intervention in other parts of the world, in South Africa and other developing countries, advanced water metering (in the form of prepaid meters or water management devices) has been developing along a parallel path, driven by the need to provide services to previously unserved communities and deal with the problems caused by rapid urbanisation.
Advanced metering has the potential to provide substantial benefits if appropriately applied. However, compared with conventional metering particularly in developing countries, these systems are considerably more expensive and complicated. Advanced metering systems therefore carry a higher risk of failure, poor service delivery and financial losses unless the system is implemented with careful design and thorough planning.
The development of advanced metering technology in South Africa was largely centred on prepaid meters. As cited by Masoabi, 2017, the first prepaid meter was developed in 1980s by South African electrical engineer Peter Clark in response to the widespread anti-apartheid rent boycotts in the townships during the 1980s whose consequent increased fiscal shortages forced engineers to look for technical solutions to the crisis of non-payment (Schnitzler, 2012). However over time, even as these meters have been implemented in a number of areas in South Africa largely to assist in cost recovery and debt management, other functionalities like water demand management, leak detection, automatic fraud alerts and others have endeared this technology even further to utilities. Several pilots and large scale projects have therefore been carried in South Africa; four of which will be included in this report.
1.2 Defining Advanced Metering
With the introduction of advanced metering systems into the previously predominantly conventional metering market in South Africa, a number of new terms have been introduced. Since different municipalities apply these terms inconsistently, their definition in the context of this report is provided below:
• Conventional water metering is defined as systems using water meters thatdisplay their readings on the meters themselves and have no additionalfunctionality. Meter reading data from conventional water meters is obtained byphysically visiting each meter and taking a manual reading.
• Advanced water metering is defined as systems using water meters withadditional components and functionality over and above those used byconventional water meters. Advanced water metering systems often require
UCT MASTERS THESIS CASE STUDY REVIEW OF ADVANCED WATER METERING APPLICATIONS IN SOUTH AFRICA
MASTERS DISSERTATION | OCTOBER 2017 Page | (2)
additional infrastructure, such as specialised communication systems or tokens to operate. Added components may allow the meter to perform functions such as processing and storing data, sending and receiving signals from a remote station and automatically shutting off the water supply using a valve.
It is also useful to distinguish between two types of advanced water meters based on whether they include an automatic valve or not:
• Water management devices (WMDs) are advanced meters with a valve that can be automatically activated by the meter to shut off or limit the water supply. These devices, depending on the activation protocol employed, can be adapted to either pre-paid or post-paid systems. Therefore in this report, where these devices are used in pre-payment systems, the WMDs will be referred to as pre-paid water meters.
• Smart water meters are advanced meters that cannot control the flow delivered to the consumer, but include advanced technology to communicate the meter reading to the municipality and/or consumer.
1.3 Goals and Objectives
The goal of this study was to evaluate a number of case studies in which advanced metering technology had been used in South Africa. Case studies are recorded reports on projects and schemes that have been previously implemented to solve a certain problem or improve on the current situation. They are therefore very useful tools for assessing the success or failure of a project and scheme (Mwangi, 2017).
The objectives based on this goal include the following;
• Conduct a literature review on advanced metering and its applications.
• Document advanced metering case studies both within and outside South Africa
• Update a previously developed evaluation framework for use in determining the feasibility of advanced meter implementation in different parts of South Africa.
• Carry out field work in each area chosen for a case study on advanced meter use in South Africa.
• Utilise the case study findings to identify different social, economic, environmental and technical factors affecting advanced meter use in South Africa.
• Develop recommendations for municipal guidelines and further research in implementation of advanced metering in South Africa.
UCT MASTERS THESIS CASE STUDY REVIEW OF ADVANCED WATER METERING APPLICATIONS IN SOUTH AFRICA
MASTERS DISSERTATION | OCTOBER 2017 Page | (3)
1.4 Scope of the Study
This study focuses on the experiences of advanced metering in South Africa. Information is obtained from four different case study areas and used to analyse the feasibility of advanced metering projects in South Africa. These areas are City of Cape Town, iLembe District Municipality, Olievenhoutbosch in Tshwane and Epping Industrial Area in Cape Town. With the exception of Cape Town, the other areas represent different provinces and the different technologies of advanced metering used in these parts of South Africa
The analysis of the advanced schemes for each of these areas is done using a previously developed evaluation framework in which conventional and advanced metering schemes are compared in terms of four main indicators; Technical, Social, Environmental and Economic (Masoabi,2017). The results of the framework application for each area are used to form conclusions that can guide the planning of future implementations of these advanced meters in South Africa.
1.5 Layout of this Document
This dissertation consists of the following main chapters;
• CHAPTER 2: A few notable international and local case studies in advanced water metering are summarised in this chapter.
• CHAPTER 3: The methodology used in achieving the study objectives is provided and a description of the evaluation framework that will be used to test the viability of the advanced metering schemes chosen.
• CHAPTER 4: A case study on Water management devices in Cape Town is described in this chapter.
• CHAPTER 5: A case study on prepaid meters installed in the iLembe District Municipality of Kwazulu-Natal is described in this chapter.
• CHAPTER 6: A case study on prepaid meters installed in the Olievenhoutbosch area of Tshwane is described in this chapter.
• CHAPTER 7: A case study on Automatic meter reading in the Epping industrial area of Cape Town is described in this chapter.
• CHAPTER 8: A discussion of the results and overview of the lessons learnt from all the case studies is provided in this chapter.
• CHAPTER 9:- Conclusions are provided in this chapter.
APPENDIX A: This is a user guide which provides detailed descriptions of the different input parameters used in the spreadsheet-based evaluation framework. Typical ranges for these parameters based on published literature, interviews with experts and case studies are also discussed here. This Appendix further contains the Excel Spreadsheet models for the four case study areas A1 to A4 which can be viewed at
UCT MASTERS THESIS CASE STUDY REVIEW OF ADVANCED WATER METERING APPLICATIONS IN SOUTH AFRICA
APPENDIX B: This contains the survey questionnaire that was designed to collect information from different case study areas in the early stages of this research project.
UCT MASTERS THESIS CASE STUDY REVIEW OF ADVANCED WATER METERING APPLICATIONS IN SOUTH AFRICA
MASTERS DISSERTATION | OCTOBER 2017 Page | (5)
2 LITERATURE REVIEW
The Literature review chapter will be divided into four main sections as summarized below.
The first section will introduce the current water policy and regulatory framework around water meter use in South Africa.
The second section will highlight the different types of advanced water meters available and their benefits to utilities and consumers.
The third section will use case studies to retrospectively assess how these technologies have been implemented in the past and highlight the impacts and results of these implementations.
The fourth section will give a brief overview of the main implementation challenges to the success of advanced metering highlighted in the case studies above and other literature.
2.1 Current Water Policy and Regulatory Framework
The policy and regulatory framework in South Africa addresses various stakeholder roles as well as compliance standards in different aspects of water resource management.
Stakeholders in the Water Industry in South Africa
In South Africa, the Department of Water Affairs (DWA) is governed by two Acts: the National Water Act (NWA), Act 36 of 1998 and the Water Services Act (WSA) 1997. The NWA redefined water rights in the country and established a new framework to mandate and regulate water resources (Green Cape, 2014a)
Acting under the framework established by the NWA are several stakeholders, and the WSA promulgated in 1994 defined the role of DWA as regulator, the role of water boards as bulk providers and the role of municipalities as service providers (Green Cape, 2014a).
The DWA’s main roles are to lead and regulate the water sector, develop policies and strategies and provide support to the sector. However, the DWA does not execute all of these functions as some are constitutionally assigned to appropriate sector partners (Green Cape, 2014a)
Regional bulk water distribution for example is managed by water boards, municipalities and the DWA. Water boards and some of the larger metropolitan municipalities (metros) are also responsible for purifying water to potable standards. Providing water services – which means water supply and sanitation – is the constitutional responsibility of local authorities such as metros, local or district municipalities. These local authorities act as Water Services Authorities (WSAs) and sometimes also as water service providers (WSPs) for all communities in their areas of jurisdiction. (Green Cape, 2014a)
UCT MASTERS THESIS CASE STUDY REVIEW OF ADVANCED WATER METERING APPLICATIONS IN SOUTH AFRICA
MASTERS DISSERTATION | OCTOBER 2017 Page | (6)
There are only 152 designated WSAs out of the 278 municipalities across the country. In the Western Cape, the Cape metro and 24 municipalities are all designated WSAs (Green Cape, 2014a).
Also important to note is that the 1996 South African Constitution states that all citizens have the right to an adequate amount of safe water. The Free Basic Water Policy (FBW) was implemented to ensure that these rights are fulfilled, and that the inequalities in service provision which were established during the apartheid era are reduced (Farrar, et al., 2014). With this policy, the Government is responsible for supplying each household with 6000 litres of potable water, accessible within 200m of the home as per RDP standards, free of charge each month (Farrar, et al., 2014).This is approximately set at 25 litres per person per day, or 6000 litres per household of 8 people per month (Farrar, et al., 2014).
Water Quality Standards and Metering Technical Specifications
The quality standards / requirements of potable water in South Africa are listed in the South African National Standard (SANS) 241-1: 2011, 241-2: 2011 Drinking Water. Generally, the presidential targets for drinking water quality are to:
• “Achieve 99% drinking water quality compliance by 2013” (Green Cape, 2014a)
• “Reduce water losses by half by 2014” (Green Cape, 2014a)
There is a range of projects in place to help maintain a sufficient supply of good quality water to meet South Africa’s needs. That said, the sector faces two key challenges: loss of water caused by leaks, broken infrastructure and billing system failure; and lack of adequate skills to maintain the water infrastructure (Green Cape, 2014a).As such, the use of advanced water meters offers possible long term solutions to the challenge of water loss even as it requires more advanced skills for management.
The South African Bureau of Standards (SABS) is the national institution responsible for regulating the quality of South African goods and services. In the South African National Standards 1529 (SANS 1529), it outlines different technical specifications for water meters in South Africa (Mwangi, 2017). The specifications per SANS 1529 Part 1 apply to mechanical meters not exceeding 100m and those larger will usually require testing outside South Africa(Van Zyl,2011).
It is easy to determine whether locally manufactured meters are SANS compliant as they have a SABS mark on them. However, determining SANS compliance for products that are manufactured abroad and newly evolving is quite a challenge as they comply with the standards of the country of origin in the first instance (Van Zyl, 2011). Some of the important basic parameters to check compliance with SANS are outlined in the following subsections as per SANS 1529:
UCT MASTERS THESIS CASE STUDY REVIEW OF ADVANCED WATER METERING APPLICATIONS IN SOUTH AFRICA
MASTERS DISSERTATION | OCTOBER 2017 Page | (7)
2.1.2.1 Materials
It is a legislative requirement that housings for all outdoor components of the metering system are durable and if metallic, they should be protected against corrosion (SANS, 2006 cited in Mwangi, 2017)
2.1.2.2 Operational Conditions
It is a legislative requirement that a meter designed to operate when installed horizontally only or vertically only must be marked to indicate the operation orientation (SANS, 2006 cited in Mwangi, 2017). Also domestic water meters must be designed to operate under a nominal working pressure of 1 600 kPa and where designed for a different working pressure, they must be marked (SANS, 2006 cited in Van Zyl, 2011).
2.1.2.3 Metrology
It is also a requirement that meters be designed such that they can withstand accidental reverse flow and indicate it (Van Zyl, 2011).
The maximum permissible error (MPE) of a meter is also outlined in the standards and can be positive or negative. This maximum permissible error envelope is divided into two zones namely the lower and upper zones, and SANS 1529 specifies a minimum permissible relative error of 5% in the lower zone, and 2% in the upper zone. This must be ensured after every installation. However, meters in the field are capable of errors of up to 1.5 times those of the new ones (Van Zyl, 2011).
2.1.2.4 Indication of the meter reading
It is required by legislation that two clearly contrasting colours (for example, black and red) are used for the numbering and scale marks of the indicator elements of a meter, to differentiate between full m3 values and fractions of a m3 (Van Zyl, 2011).
2.2 Types of Water Meters
A brief description of the types of conventional and advanced water meters introduced in Section 1.2 above is as follows.
Conventional Water Meters
Conventional water meters display their readings on the meters themselves and have no additional functionality. These meters use different mechanisms to measure flow through them and their different types are thus based on these different mechanisms (Van Zyl, 2011). The three classifications of conventional meters are:
• Mechanical meters:- These use motion of parts i.e. impellers or pistons tomeasure the water flow (Van Zyl, 2011)
• Electromagnetic Meters :- These make use of Electromagnetism principles tomeasure velocity of water passing through them (Van Zyl, 2011)
• Ultrasonic Meters :- These use sound waves properties to measure waterpassing through them(Van Zyl, 2011)
UCT MASTERS THESIS CASE STUDY REVIEW OF ADVANCED WATER METERING APPLICATIONS IN SOUTH AFRICA
MASTERS DISSERTATION | OCTOBER 2017 Page | (8)
Advanced Water Meters
As stated in Section 1.2 above, advanced meters are defined as any water meter that has added functionality. Two types of advanced water meters are used in this report based on whether the meter has the ability to control the flow through it (i.e. has a valve that can be automatically controlled). Advanced meters that cannot control the flow are called smart water meters, and those that can are called water management devices (Masoabi, 2017).
Advanced meters have multiple capabilities depending on the specific components and support infrastructure attached to each. Some of their capabilities are as listed below:
• They have storage capacity which enables them log multiple measurements and archive them (Mwangi, 2017)
• They can send measurement records both on demand as well as at a programmed frequency i.e. monthly, yearly, etc (Mwangi,2017)
• Some can also be remotely connected or disconnected depending on the need for example to reduce energy use(Mwangi, 2017)
• They can be remotely re-programmed to allow new tariffs applications (Mwangi, 2017)
• New functions can also be programmed into these meters through remote upgrades(Mwangi, 2017)
• Automatic tamper detection and alarms can be set on these meters (Mwangi, 2017)
• Bi-directional capability whereby messages to and from a remote receiver can be sent and received respectively(Mwangi, 2017)
• Where valves are attached, remote control of these valves can be done (Electa, et al., 2008)
Four main components make up an advanced meter as stated below.
2.2.2.1 Transmitters
Transmitters are the most basic components of advanced meters and they make use of radio waves to send water meter readings to remote locations (Blom, et al., 2010). The typical range of these transmitters using wireless radio is about 1 kilometre (Blom, et al., 2010).
2.2.2.2 Data Loggers
Data loggers are devices used to store the data recorded as well as send interval data (Blom, et al., 2010). Data loggers can be adjusted to log at different time intervals. However, they also simplify leak detection whereby sustained constant water flows over long durations imply presence of leaks (Blom, et al., 2010).
UCT MASTERS THESIS CASE STUDY REVIEW OF ADVANCED WATER METERING APPLICATIONS IN SOUTH AFRICA
MASTERS DISSERTATION | OCTOBER 2017 Page | (9)
2.2.2.3 Gateways
Gateways are devices where multiple data signals from different transmitting devices are received and then relayed at once to a remote location. In essence, these gateways can be viewed as loggers which store multiple data and relay them in packets to the utility thereby reducing the frequency of information relay over long distances (Blom, et al., 2010).
2.2.2.4 Consumer Interfaces
A consumer interface is a link through which a user is able to interact with the technology. Different interfaces ranging from in-home displays, online portals, digital or printed bills can be utilized in enabling the consumers view and be aware of their water consumption (Blom, et al., 2010).
The above components make use of different communication systems to relay information to and from the meter. These communication systems are therefore important features of advanced metering technologies (Lipošüak, et al., 2013).A brief summary of the different communication systems used in advanced meters is given below.
2.2.2.5 Communication Services and Infrastructure
Different communication infrastructures enable information travel on the different networks below (Mwangi, 2017);
• Home Area Networks (HAN)
• Local Area Networks (LAN)
• Wide Area Networks (WAN)
The above different networks work with the different meter components and utility locations to form the different advanced meter categories below;
• Advanced Meter Reading (AMR)
• Advanced Meter Infrastructure (AMI)
• Advanced Meter Management (AMM)
Advanced Meter Reading AMR refers to the one way system in which data from the meter is collected but no feedback is sent back (Electa, et al., 2008).
Advanced Meter Infrastructure (AMI) is a two- way system unlike the above and includes all the communication, data management and metering infrastructure (Hanley et al., 2009).
Advanced Meter Management (AMM) is similar to AMI but has more advanced software systems that enable the utility to more easily manage the meters remotely (Electa, et al., 2008).
UCT MASTERS THESIS CASE STUDY REVIEW OF ADVANCED WATER METERING APPLICATIONS IN SOUTH AFRICA
MASTERS DISSERTATION | OCTOBER 2017 Page | (10)
The water metering manufacturers in South Africa have different product ranges and services in the above categories which are available on the market. Detailed descriptions of these are available through the product brochures and manufacturer websites. In South Africa, some of the water metering manufacturers worth mentioning include the below. It is important to note that although some of these manufacturers deal in only particular advanced water metering system components manufacture, they have been included below for comprehensiveness.
• Elster Kent
• Aqua Loc
• Sensus
• RealSens
• Lesira Teq
• Kamstrup
• Itron
• Utility systems
Overall Benefits of Advanced Meters
The two main beneficiaries of advanced meters are the utilities and the water consumers. The possible benefits of advanced meters herein stated will therefore be looked at in terms of these two categories i.e. customer benefits and utility benefits. Although the benefits to each of these often overlap, this section shall separate them based on the party that gains the direct benefit (Green Cape, 2014c).
2.2.3.1 Possible Benefits to the Utility
• Increased revenue from previous non-revenue water (House, 2010).This is through leak detection capabilities, improved accuracy in consumption measurement and tampering protection and alarms, depending on the advanced meter in use.
• Reduced meter reading costs (House, 2010):This is because fewer meter readers are required and thus significant reduction in costs such as salaries, benefits, vehicle costs and other general expenses is experienced (House, 2010).
• Safety and security benefits (House, 2010): The self-disconnection function of some prepaid meters eliminates potential conflict between consumers and municipal personnel related to manual disconnection for conventional meters. There is a potential for arguments and social problems especially if the personnel is from the same area as the consumer.
• Reduced greenhouse gas emissions (House, 2010): This is because fewer vehicles in the meter-reading process reduces pollutants and dust. Furthermore,
UCT MASTERS THESIS CASE STUDY REVIEW OF ADVANCED WATER METERING APPLICATIONS IN SOUTH AFRICA
MASTERS DISSERTATION | OCTOBER 2017 Page | (11)
reduction in water consumption and leakage leads to less water being treated and supplied to customers, and therefore less energy and chemicals for water treatment being used.
• Help in identifying and pinpointing customer and system losses (House, 2010): This is because some AMI allow utilities to set up predictive analytics to regulate supply and also set up adjustable alarm notifications to predict/prevent end point anomalies (Cutler, 2014)
• The risk of arrears or debt (which might end up unpaid) for water service providers is reduced by use of prepaid meters because customers pay for water in advance, facilitating better cash flow and revenue (Heymans, et al., 2014).
• Prepaid meters can also be used as tools to recover unpaid debts through connecting consumers who are in arrears to them with a portion of their arrears deducted from each credit they purchase. (Heymans, et al., 2014).
• With prepaid meters, the responsibility of securing access to water becomes the burden of the individual consumer and no longer that of the municipality (Ruiters, 2007). From an administrative point of view, municipalities save on costs as there are no meter readings, no billing statements, and no arrears and credit control. Lastly, automatic water supply cut-offs (for prepaid meters) due to non-payment eliminates the travelling costs (for municipal personnel) for manual disconnection in conventional meters.
• Smart meters eliminate the risk of revenue loss through human reading error and corruption between meter readers and illegal users. (Md. Wasiur- Rahman, 2009).
2.2.3.2 Possible Benefits to Customers
• Smart meter interfaces allow users to be more alert about their consumption and consequently take proactive measures to control and reduce it (Blom, et al., 2010). Household budgeting is therefore made easier (Heymans, et al., 2014)
• Smart meters reduce conflict amongst household members through quick leak detection and therefore mitigate quarrels between consumers and municipalities over high or inaccurate bills (Heymans, et al., 2014).
The above benefits form some of the key drivers for implementation of these advanced metering technologies both within and outside South Africa. A desk review of some international and South African experiences with advanced metering is provided in the next section.
2.3 Summary of South African and International case studies from literature
Case studies are recorded reports on projects and schemes that have been previously implemented to solve a certain problem or improve on the current situation (Mwangi,
UCT MASTERS THESIS CASE STUDY REVIEW OF ADVANCED WATER METERING APPLICATIONS IN SOUTH AFRICA
MASTERS DISSERTATION | OCTOBER 2017 Page | (12)
2017). They are therefore very useful tools for assessing the success or failure of a project and scheme.
Different advanced metering projects both within and outside of South Africa have had varying levels of success with some falling short of meeting their implementation objectives. Since different areas place emphasis on different benefits of smart metering, the primary objective for implementing smart water meters varies from one area to another.
The different areas’ experiences with these meters show both the multitude of functions and improvements that can be achieved with advanced metering as well as the significant challenges they pose particularly when implemented in low-income areas. Considerations prior to implementation should therefore be made on a case-by-case basis as will be inferred from the different case studies below.
Operation Gcin’ amanzi in Soweto
This case study summary is based on a report by Singh & Xaba, 2006.
Rand Water Board supplies water primarily to Gauteng and the North West up to Rustenburg. In 2003, Johannesburg Water (JW) one of its big clients was delivering 1/3 of its purchased water to Soweto, a township in the South West of Johannesburg with a population of about 1.3 million people. 70% of this water delivered by JW was unbilled and therefore in an attempt to conserve water and reduce on the volumes of Non-Revenue Water (NRW) in Soweto, Operation Gcin'amanzi was started in July 2003. A total of 170 000 properties were expected to benefit from this project which included installation of prepaid meters, and other interventions like plumbing fixture repairs on private properties, upgrading of individual connections and upgrading of network pipes in the area. The prepaid meters were programmed to dispense 6 Kl per month FBW allocation and an additional amount of water depending on the consumer credits purchased.
This project was considered as successful due to the 83% reduction in bulk water savings; and about R 13 million revenue from the purchase of water above the FBW amount above. Debt write offs for prepaid meter recipients and other lessons in soliciting community buy-in, improving the technical standards of prepaid meter units purchased to minimise failure rates and tariff application in the use of these meters were also learnt from this project. These lessons were used to ease the roll out process of these prepaid meters in other parts of Gauteng and South Africa.
Klipheuwel Prepaid Metering
This case study summary is based on a report by Kumwenda, 2006.
Klipheuwel is a low income community found in the Western Cape, north of Durbanville. A prepaid metering pilot project was launched here in 2001 by City of Cape Town to deal with the city problems of inefficient dispensation of free basic water, poor payment
UCT MASTERS THESIS CASE STUDY REVIEW OF ADVANCED WATER METERING APPLICATIONS IN SOUTH AFRICA
MASTERS DISSERTATION | OCTOBER 2017 Page | (13)
levels for water services and rapidly increasing water demand and wastage. 138 households of the 147 found in the formal housing area of Klipheuwel were fitted with prepaid meters programmed to dispense 6 kilolitres of water per month, an additional 200 litre emergency reserve and thereafter an amount purchased by the consumer. This pilot if successful was to prelude similar implementations in Bishop Lavis, Netreg and Richwood. Unfortunately, the city abandoned this project in 2005 and reverted back to the old conventional system. The technology was found to be largely accepted by the community for its ability to dispense the FBW as well as enable them manage consumption and therefore control demand. Its abandonment therefore speaks to issues on the municipality side; possibly the economic infeasibility of maintaining these meters which had significantly high failure rates; especially in light of the reduced consumption to FBW allotment and therefore reduced revenue for the utility to offset these maintenance costs.
Nkomazi Prepaid Metering Project
This case study summary is based on a report by Marah,et al., 2004.
Nkomazi Municipality is located approximately 350 Km east of Gauteng and consists of five local councils with an approximate population of 430 500 residents. The municipality had accrued debts of about R1.4 million from 1996 – 1998 and yet many residents were finding the flat rate of R50 per month (regardless of consumption) unaffordable. Prepaid meters were therefore installed in 1,374 households, most of which belonged to municipal staff in an attempt to find a more affordable option to the flat rate billing system in use and therefore recover water costs.
On installation, a high failure rate of about 40% of installed units was experienced forcing the municipality to try about 4 different metering technologies in an attempt to cope with and alleviate these failure rates. In spite of this however, the community was accepting of the system and a significant reduction in consumption from about 40kl per household to 7kl per household observed. Furthermore, financial benefits were achieved with the reversal of an annual loss of about R 540 000 to an average income gain of about R 320 000. With a more technically reliable prepaid meter therefore, the future of this technology in Nkomazi was deemed feasible.
Burbank AMI Project
This case study summary is based on a report by Fletcher, 2013.
Burbank is a city in California whose economy heavily relies on the entertainment industry. Its service provider; Burbank Water and Power supplies about 45,000 residences and 6,000 businesses with water and electricity. In 2008, the city launched a sustainability plan meant to improve energy efficiency as well as reduce water losses in response to California’s drought induced water crisis. A smart grid initiative was therefore put in place with installation of advanced electric and water meters that could
UCT MASTERS THESIS CASE STUDY REVIEW OF ADVANCED WATER METERING APPLICATIONS IN SOUTH AFRICA
MASTERS DISSERTATION | OCTOBER 2017 Page | (14)
allow bi-directional communication through a wireless mesh network. The meter data management system that formed part of this AMI enabled verification of readings prior to the formulation of bills and also improved the monitoring ability of the utility; an aspect key to reduction of water losses. This smart grid system was supplied by a joint venture partnership of Siemens Energy, Inc and eMeter Corporation.
The major benefits realised from the AMI system were improved billing accuracy and thus shorter customer query response time. Regular interval data provided by the system could also enable the utility carry out leak detection and spot illegal connections. This system also enabled the utility carry out updates to improve the functionality and scale of both water and energy infrastructure monitoring. New regulations and information requirements could thus easily be actualised.
Pinetop Waters Advanced Metering Project
This case study summary is based on a report by Sensus, 2013b.
Pinetop is a small town in Arizona whose economy heavily relies on summer tourists to the various lakeside retreats. Its winters however are very cold with snow covering most of the town rivers and lakes. It has five main water supply sites, which consist of both tanks and wells. Pinetop Water, the utility responsible for water resource management and supply in the town faced significant challenges in fulfilling their mandate. These included costly and time-consuming monitoring of water source levels and functionality, manual meter reading which could be hampered by the icy weather conditions or buried meters in winter; and consequent billing inaccuracies or water losses at source sites or at undetected leakage points. An automated water metering technology, which could allow the utility better manage source and network monitoring was therefore sought, and the Sensus smart water network solution eventually chosen for installation.
This Sensus system used the FlexNet communication network for remote meter reading and was equipped with automation controls for monitoring the well and tank levels. It therefore enabled the utility staff free up time for other tasks since remote reading of all meters now took 5 minutes as opposed to the previous 4 days per month. Furthermore, the risks to municipal staff in reading meters particularly in winter were now minimised and automatic versus manual open and closing of valves at the supply stations could be done depending on the system-monitored levels. Increased revenue from low flow detection and recording of the new water meters as well as reduced water consumption due to timely leak detection were the other benefits realised from this system.
Melbourne AMI Case Study
This case study summary is based on a report by Nicholson, et al., 2012.
Melbourne, Australia has 3 main water and sewerage utilities and Yarra Valley Water is one of them. It supplies water and sewerage services to more than 1.6 million people
UCT MASTERS THESIS CASE STUDY REVIEW OF ADVANCED WATER METERING APPLICATIONS IN SOUTH AFRICA
MASTERS DISSERTATION | OCTOBER 2017 Page | (15)
with 660,000 properties and 50,000 businesses within its operating areas to the South and East of Melbourne. Following the division of its network into about 140 distribution zones with multiple flow and pressure sensors, Yarra Water required an automated network monitoring facility that could better process and analyse the amount of data continually received for identification of anomalies and consequent action. The utility therefore chose a cloud based AMI system supplied by TaKaDu for this purpose and within a 3-month installation period from June to August 2011, several large leaks were detected with alerts received on average 14 days earlier than they would have in the manual monitoring case. In fact, about 70 mega litres, which translated to AUD 60 000 were saved during this period. Meter faults and hydraulic malfunctions could also easily be detected and rectified with this system.
2.4 Challenges Experienced in AM Implementation
Several of the drawbacks to successful implementation of advanced metering that can be gleaned from the above case studies and other literature reviewed are provided below. The drawbacks are grouped into Economic, Social, Technical and Environmental sub-sections.
2.4.1.1 Economic challenges
• For the municipalities there are financial and infrastructural challenges as they may not have the finances to implement such technologies and in some areas the existing infrastructure may not support this type of technology (Malete, 2010). These challenges make feasibility of AMI in low-income communities questionable because the payment level for water services is relatively low; therefore financing the technology may be a burden to the municipality. For example managing and storing large volumes of data may require the installation of new software and accompanying training of personnel in this. Furthermore, ensuring the safety or security of the more detailed data collected would need to be considered and this has further cost implications on the municipality or utility agency.
• In many cases, advanced metering technologies rely on communication networks that are controlled by different entities (Van Zyl, et al., 2015). This is especially challenging for prepaid water systems which use proprietary hardware and software, and municipalities may find themselves locked into a technology that is relatively inflexible and expensive to maintain and change (Heymans, et al., 2014). If municipalities are not satisfied with the performance of their systems, it is often hard to invest in additional vending sites. This only leaves them with the option to move on and try another make of prepaid meter in a new area, and set up a new proprietary vending system to serve new customers there.
UCT MASTERS THESIS CASE STUDY REVIEW OF ADVANCED WATER METERING APPLICATIONS IN SOUTH AFRICA
MASTERS DISSERTATION | OCTOBER 2017 Page | (16)
2.4.1.2 Technical Challenges
• The technical sophistication of AMI makes it difficult to maintain as with a multitude of components such systems are more likely to fail. (Mwangi, 2017). In the case of prepaid meters, even though technologies are improving, they are more vulnerable to faults and failure than conventional meters (Heymans, et al., 2014). They are more complicated and have higher maintenance costs and a shorter average life cycle (seven years is generally the outer limit, which is half that of conventional meters) (Heymans, et al., 2014). According to Malete, 2010, the battery of prepaid meters lasts up to five years and then has to be replaced. Batteries fail, valve diaphragms and seals wear, moisture disrupts the circuitry, and communication errors between the credit token reader and meter can affect supply. These factors make advanced water meter management more demanding as compared to conventional meters.
• Advanced prepaid meters have a non-return valve which shuts off the water when installed incorrectly (Malete, 2010).
• Municipalities have a major challenge in maintaining reliable water supply, plus managing and maintaining the interdependent electronic, mechanical and software components of prepaid metering systems at each connection site and vending point (Heymans, et al., 2014). It requires a network of credit vendors selling prepaid water that must be equipped, serviced and managed. A credit transfer device is needed: either a physical token or a smartcard which can get lost, stolen or broken, or a numerical credit key, printed on paper or sent by mobile phone, and entered via a keypad that must communicate reliably with the device (Heymans, et al., 2014).
• The main component of prepaid water metering is a mechanical meter which is prone to errors caused by air and grit in the water network. This fault is common across all metering applications, but the impact is more serious in a prepaid meter. Air in the system after a supply interruption can spin the counters and erode credit, and grit can jam the meter (Heymans, et al., 2014).
• Due to inadequate understanding of the operational and maintenance requirements of prepaid water meters, technical failures are inevitable, making meters unreliable. Unreliable meters invite vandalism, bypassing and tampering (Heymans, et al., 2014). Customers who have paid in advance for their water have a legitimate expectation that it will be available and that any faults will be repaired swiftly (Heymans, et al., 2014). Prepaid water metering systems may result in intolerance from consumers.
Social Challenges
• Installation of prepaid metering results in greater awareness among consumers of what they pay and what they get; which can lead to discontent (Heymans, et
UCT MASTERS THESIS CASE STUDY REVIEW OF ADVANCED WATER METERING APPLICATIONS IN SOUTH AFRICA
MASTERS DISSERTATION | OCTOBER 2017 Page | (17)
al., 2014). Consumers who buy credit more than once a month regard water charges as inconsistent as they get less credit on subsequent purchases than on the first instance. Some consumers never understand the reality of rising block tariffs and remain dissatisfied with the system.
• The apartheid history and prevalent social economic conditions as a result led to a culture of widespread conventional metering among the white population and wide application of flat-rate systems and free water in urban black townships, and the culture of non-payment still survives (Marah, et al., 2004). This affects prepaid water metering implementation in low income communities resulting in riots and vandalism of meters particularly when they are installed without community involvement in the decision making process.
• A fundamental danger associated with prepaid meters is that they are intended to serve as a means of replacing termination procedures governed by existing regulatory frameworks (Marah, et al., 2004). This makes poor communities sensitive to the impact of the meters and therefore develops their negative perception of water meters.
• In many cases, prepaid water meter systems are made financially sustainable through the use of the progressive block tariffs where low consumption is effectively subsidised by high consumption which earns a higher charge (McDonald, et al., 2002). This makes the water consumption in access of the 6kl free basic allocation unaffordable for most households in low-income communities. The block tariff restricts households to 6kl free basic allocation which is not adequate particularly for large households. Restriction to free basic allocation causes a number of social discomforts.
• Where prepaid water meters are installed, they impact in a number of ways on the lives of low-income communities. According to Hellberg, 2005, the installation of prepaid water meters impacts on hygiene and safety as well as on social relationships in low-income communities where people can hardly afford to pay for water but their household consumption exceeds the free basic allocation. Examples of these impacts on social relationships include making special events such as community gatherings for festive events and rituals impossible. Managing the free allocation can also lead to arguments and blame among household members for exhausting the free allocation and to some household members (e.g. children) being restricted from activities like bathing. Other households resort to begging for water from more wealthy neighbours. This can also lead to tension between households if no water can be spared to give to neighbours.
• Hygiene and safety risks can also be increased by the adoption of advanced meters. This is because technical problems and the exhaustion of free basic water allocation lead to a lack of water supply in most low-income households. As a result, many households are in desperate need of more water and thus
UCT MASTERS THESIS CASE STUDY REVIEW OF ADVANCED WATER METERING APPLICATIONS IN SOUTH AFRICA
MASTERS DISSERTATION | OCTOBER 2017 Page | (18)
resort to the traditional unpurified water sources, rivers and streams (McDonald, et al., 2002). Provision of a backup or alternative water supply such as boreholes and tanks is therefore necessary to prevent the health crises that could result.
• Illegal connection and water theft also impact on the success of advanced metering. This is because a high rate of disconnection due to the exhaustion of free basic water allocation by households makes illegal reconnection of water one of the popular strategies adopted by activists in South Africa (Bond, et al., 2008). Illegal connections could be considered a better option for consumers as they are aware of the health risk of resorting to other water sources. Also due to the common delay of water service providers in attending to problems, people tamper with prepaid water meters and in some cases resort to removing or breaking them (McDonald et al.,2002).
Environmental Challenges
• AMI relies on power and is mostly powered by batteries which add to the maintenance requirements as batteries have short life spans; it also makes it less environmentally friendly (Mwangi,2017).
The above challenges point to the need for a more detailed evaluation process to ensure that the advanced meters are in fact necessary; and that the choice of advanced meter fulfils the primary objectives for implementation while concurrently minimizing any negative impacts or shortfalls in meeting the other requirements.
The Chapter below delves into the methodology used in this research report and the different considerations in determining the feasibility of the advanced water metering case study projects chosen using an evaluation framework.
UCT MASTERS THESIS CASE STUDY REVIEW OF ADVANCED WATER METERING APPLICATIONS IN SOUTH AFRICA
MASTERS DISSERTATION | OCTOBER 2017 Page | (19)
3 METHODOLOGY
The methodology required for project completion consisted of seven main tasks each of which is described below;
3.1 Task 1: Literature Review
This task involved collection of literary works including published, online and any other sources on the range of topics related to the thesis.
A detailed analysis of the literature collected and its consequent impact on the thesis was done. This included a perusal of existing case studies both within and outside South Africa to gain an overall understanding of how these meters have been performing in different areas. In addition to the Literature Review chapter above, a precursory case study database for the different advanced metering projects in South Africa shown in the Table 1 below was made. This database however only included basic information on the schemes with pending information on the current status of the different schemes required from the area staff. Nonetheless, the database offered possible areas that could be approached for more detailed information to formulate a case study.
ID Province Area Project brief 1 Free State Mangaung
Municipality Prepaid and AMR (Elster Kent and Utility Systems) meters installed in FY 2014/2015 for cost recovery, Leak detection and demand management
2 Free State Letsemeng Prepaid meters were installed in 1994-1995 for cost recovery and debt management
3 Free State Bloemfontein National Real Estate Complex
AMR and Water Management devices (Utility Systems) installed in 2013 for demand management and leak detection
4 Free State Woodland Hills Estate , Bloemfontein
AMR meters (Utility Systems) installed in 2012 for demand management and accurate measurement of consumption
5 Gauteng Soweto Phiri Gcinamanzi I –Prepaid meters installed in 2004 for demand management and cost recovery
6 Gauteng Soweto Superblock III Soweto SuperBlock Project III – Prepaid and AMR meters installed in 2014/2015 for cost recovery
7 Gauteng Ekurhuleni Bulk meters (Kent H5000) installed in FY2014/2015 for accurate measurement of consumption
8 Gauteng Emfuleni Meters installed in 2010 primarily for data logging 9 Gauteng Hothespoort AMR (Sensus) meters installed in 2015 for cost
recovery , debt management and Leak detection 10 Gauteng Johannesburg
(Meadowlands and Chiawelo)
Prepaid and AMR (Lesira Teq) meters installed in 2015 for cost recovery and Leak detection
11 Gauteng Tshwane Prepaid meters installed in 1994 and 2014 for cost recovery
12 Gauteng Tshwane Water Management Devices (WMDs) installed in 2012 for cost and debt recovery
Table 1: South African Case Study Database based on Literature Review
UCT MASTERS THESIS CASE STUDY REVIEW OF ADVANCED WATER METERING APPLICATIONS IN SOUTH AFRICA
MASTERS DISSERTATION | OCTOBER 2017 Page | (20)
13 Gauteng West Rand Johannesburg
Prepaid (Elster Kent ) meters installed in 2012 for cost recovery
14 Gauteng Mogale City Prepaid meters(Lesira Teq) were installed in 1999 for cost recovery and debt management
15 Northwest Rustenburg (Rustenburg Extension 19)
Domestic and Bulk AMR meters (mainly Sensus Meistream) installed in 2013 -2014 for accurate measurement of consumption
16 North West Madibeng Local 17Municipality
Prepaid meters(Lesira Teq) were installed in 2012 for cost recovery and debt management
17 North West Ngaka Modiri Molema District Municipality
Prepaid meters(Lesira Teq) were installed in 2012 for cost recovery and debt management
18 KwazuluNatal Durban AMR Meters installed in 2014 -2016 and 2016 for leak detection and demand management
19 KwaZulu Natal
Ugu District Municipality
Prepaid standpipes were installed from 2008 for cost recovery
20 KwaZulu Natal
Durban Flow limiters and Water management devices (Utility Systems) installed from 2004 for demand management and cost recovery
21 KwaZulu Natal
Umbumbulu Water management devices (Utility Systems) installed from FY2007/2008 for cost recovery, demand management and leak detection
22 KwaZulu Natal
Umlazi Water management devices (Utility Systems) installed from FY2007/2008 for cost recovery, demand management and leak detection
23 KwaZulu Natal
Ngwelezane Prepaid stand pipes (Bumpenaze) were installed from 1997 for cost recovery
24 Northern Cape
Ga-Segonyana Local Municipality
Prepaid meters(Lesira Teq) were installed for cost recovery and debt management
25 Northern Cape
Moshaweng Local Municipality
Prepaid meters(Lesira Teq) were installed for cost recovery and debt management
26 Mpumalanga Nkomazi Prepaid meters were installed in 1998 for cost recovery and debt management.
27 Eastern Cape Umzimvubu Prepaid meters were installed in 1997 for cost recovery and debt management
28 Eastern Cape Jansenville AMR (Elster Kent ) meters installed in 2014 for cost recovery
29 Limpopo Polokwane Prepaid (Teqnovo) meters installed in 2001 for cost recovery
30 Limpopo Lephalale Remote reading advanced meters (Kamstrup) installed in FY2014/2015 for leak detection
31 Limpopo Thulamela Local Municipality
Prepaid meters(Lesira Teq) were installed in 2012 for cost recovery and debt management
32 Western Cape
Verdlevei AMR (Elster Kent ) meters installed for cost recovery
33 Western Cape
Mandela Rhodes AMR (Elster Kent ) meters installed in 2012 for accurate measurement and data management
34 Western Cape
Beaufort West Prepaid (Elster Kent ) meters installed from 1980s (Bambamanzi/Conlog &later Elster Kent) for cost recovery
35 Western Cape
Tamberskloof Prepaid (Elster Kent ) meters installed in 2012 for cost recovery
UCT MASTERS THESIS CASE STUDY REVIEW OF ADVANCED WATER METERING APPLICATIONS IN SOUTH AFRICA
MASTERS DISSERTATION | OCTOBER 2017 Page | (21)
36 Western Cape
Theewaterskloof Prepaid Elster Kent & Utility System Water Management Devices meters installed from 2009 for cost recovery
37 Western Cape
Swartland Municipality Water management devices (Aqualoc) installed in FY2014/2015 for debt management and cost recovery
38 Western Cape
Stellenbosch Municipality
Water Management Devices (Utility Systems) were installed from 2009 for cost recovery and debt management
39 Western Cape
Mossel Bay Municipality
Water Management Devices (Utility Systems) were installed from 2009 for cost recovery and debt management
40 Western Cape
Samora Machel
Water management devices (Utility Systems) installed from FY2007/2008 for cost recovery, demand management and leak detection
41 Western Cape
Saxonsea Water management devices (Utility Systems) installed from FY2007/2008 for cost recovery, demand management and leak detection
42 Western Cape
Drankenstein Municipality
Water management devices (Utility Systems) installed from 2008 for cost recovery, demand management and leak detection
43 Western Cape
Hermanus town Prepaid combined water and electricity meter installed from 1996 for cost recovery, demand management and leak detection.
44 Western Cape
Ravensmead Water Management Devices (Utility Systems) were installed from 2008 for cost recovery and debt management
45 Western Cape
Fisantekraal Water Management Devices (Utility Systems) were installed from 2008 for cost recovery and debt management
46 Western Cape
Swartland Prepaid meters were installed from 1997-2001 for cost recovery.
47 Western Cape
Kannaland Prepaid meters were installed from the 1980s for cost recovery.
3.2 Task 2: Survey Instrument Design
The first step taken in approaching the areas identified in Task 1 above was design of a questionnaire whose responses would provide more specific information on the different projects. This questionnaire is attached as Appendix B of this report and it was sent to the different manufacturers, municipalities and even private organisations in South Africa whom the Literature Review indicated were involved in the implementation of the advanced metering schemes identified.
On sending this questionnaire, a dialogue was started with the concerned parties on the possibility of using the areas as a case study for this research report. However, in spite of the multiple contacts reach out to for this information, only a few responses were received and in many instances, not much information about the projects or willingness to utilise them as case study areas was shown.
UCT MASTERS THESIS CASE STUDY REVIEW OF ADVANCED WATER METERING APPLICATIONS IN SOUTH AFRICA
MASTERS DISSERTATION | OCTOBER 2017 Page | (22)
Even so, within the few respondents with information on these schemes, four schemes were chosen for review in this report.
3.3 Task 3: Scheme Selection
As stated above, four major schemes were chosen based on the responses obtained.
Cape Town, the main coastal city in the Western Cape Province was one of these. It was considered suitable for the research purposes both due to the willingness of the municipality to assist in this research and also due to its proximity which would make it ideal as the first field data collection testing ground.
Two case studies in Cape Town were identified that is the Water Management Devices (WMDs) project carried out from 2006 throughout different parts of the city and the Advanced Meter Reading (AMR) pilot project in Epping Industrial area carried out in 2008.The detailed case studies are provided in Chapters 4 and 7 of this report.
The WMD installation would not only provide a broadness of project scope since they were installed throughout the city but also enable us investigate and understand the reason for the city’s continued expansion of the project to the present time.
The Epping case study on the other hand would provide information on the robustness of the advanced metering (AM) technology under different consumption categories by providing insight into the AMR performance under an industrial demand scenario.
For a more representative spatial distribution of these AM experiences in South Africa, two other areas i.e. ILembe Municipality in KwaZulu-Natal province and Olievenhoutbosch, Tshwane in Gauteng Province were chosen as the final two case study areas. Both of these areas had installed prepaid meters in 2013 and 2003 respectively.
iLembe District Municipality is located in Kwazulu Natal along the north coast where it covers an approximately 1 455km2 area (the water dialogues, 2008). It contains two rural municipalities of Maphumulo and Ndwedwe and two more urbanized municipalities of Mandeni and Kwadukuza housing an overall population of 606 809 (Statistics South Africa, 2012a).
Olievenhoutbosch is a formalized township located in the Southern Region of City of Tshwane with an area of about 11.39 km2 housing a population of approximately 70 863 residents, (City of Tshwane, 2010 & Statistics South Africa, 2012).
These two areas were not only divergent in geography but also in socio-economic characteristics and therefore could be used to test the advanced metering scheme feasibility under divergent community and municipal operating conditions from those in Cape Town. The detailed case studies are provided in Chapters 5 and 6 of this report.
UCT MASTERS THESIS CASE STUDY REVIEW OF ADVANCED WATER METERING APPLICATIONS IN SOUTH AFRICA
MASTERS DISSERTATION | OCTOBER 2017 Page | (23)
3.4 Task 4: Evaluation Framework Update
To test the feasibility of the above chosen advanced metering schemes against the typically used conventional meters, an evaluation framework was chosen.
The Evaluation framework developed to assess these case studies is a composite framework. This type of framework is useful in showing the relationship between a number of variables to create an overall understanding of a phenomenon when all its contingent variables are looked at as a whole (Mainguet, et al., 2006 & Jabareen, 2009).
The concept of sustainability in water services defined by the Department of Water Affairs (DWA) is a “vision of a community’s future where the vision is community oriented and focused on long-term goals. It takes into account linkages between the social, economic, institutional and environmental aspects of the community” (Carden, et al., 2005).The context of this study that is; reviewing different South African municipalities experiences of advanced metering through case studies; therefore necessitated the use of this sustainability concept. The four main indicators for the composite framework chosen were therefore Technical, Social, Environmental and Economic indicators.
This framework which was developed by Masoabi, 2017 and Mwangi, 2017 aimed at measuring the Technical, Social, Environmental and Economic feasibility of different advanced metering versus conventional metering schemes. In order to calculate the required indicators under each category above, different user inputs parameters are required for each case study. Appendix A is a User Guide which provides definitions of each of these input parameters and a typical range of values for each parameter to assist users in instances where this information for a particular area is not available.A brief description of the main input parameters under each indicator category is provided in Table 2 below.
Category Input Parameter Brief Description Global Parameters
No. of Properties The number of consumer connections included in the project
Billed metered consumption(kl/property/month)
All properties that are metered and billed based on their actual consumption.
Billed unmetered consumption(kl/property/month)
All properties that are not metered but are billed for water consumption, or are metered but not billed based on their actual consumption. This category is also known as flat rate billing.
Unauthorised Consumption
Illegal/ unbilled consumption(kl/property/month)
All properties that have illegal or unregistered connections to the distribution system.
Technical Parameters SANS 1529-1 Compliance Refers to whether the mechanical meter part
conforms to the national standards for mechanical water meters for potable water.
SANS 1529-9 Compliance Refers to whether the electronic components
Table 2: Table showing the main input parameters of the Evaluation Framework
UCT MASTERS THESIS CASE STUDY REVIEW OF ADVANCED WATER METERING APPLICATIONS IN SOUTH AFRICA
MASTERS DISSERTATION | OCTOBER 2017 Page | (24)
of the metering system conforms to the national standards for electronic components of water meters.
Mean battery life(years) The average time the meter battery is expected to last.
Meter service life(years) The expected service life of the water meter, including all components except for the battery.
Water meter failure (%/year) The expected fraction of meters that will need replacement annually due to failure of the meter itself.
Electronic and other components failure(%/year)
The expected fraction of meters that will need replacement annually due to failure of the electronic and other components of the meter
Vandalism The expected fraction of meters that will need replacement annually due to damage caused by vandalism.
Social Parameters Average Household Income(R/month)
This is the household income per month. It is used to calculate the water bill as a fraction of income which indicates a willingness or unwillingness to pay.
Volatility of the Community The no of protests/mass action incidents per year
Economic Parameters Applicable Water Tariff (R/Kl) The average price that consumers pay to the
municipality for water consumed. Payment Rate Fraction of billed properties who are paying
their full water bill. Water Meter Price (R/meter) The cost of purchasing a water meter Meter Installation Cost(R/meter) The cost of installing the water meter Communication Infrastructure Cost The total cost of communication
infrastructure required for the metering system.
Payment Infrastructure Cost The total cost of payment infrastructure, including vending terminals, billing software, computer hardware and additional staff that will be required.
Water Cost Price (R/Kl) The cost the municipality incurs in the abstraction and treatment of water before it is supplied to the system.
Meter reading cost(R/meter) The cost of reading a meter including all related costs, such as transport and labour and equipment.
Meter operation & maintenance cost (R/meter/month)
The cost of operating and maintaining water meters after installation.
Billing cost (R/month) The cost of entering the meter reading data into the billing system, generating, printing and mailing a water bill.
Battery replacement cost (R/meter) The cost of replacing a battery in advanced water meters, including the cost of the new battery, disposal cost of the old battery and labour.
Water meter failure (%/year) The expected fraction of meters that will need replacement annually due to failure of
UCT MASTERS THESIS CASE STUDY REVIEW OF ADVANCED WATER METERING APPLICATIONS IN SOUTH AFRICA
MASTERS DISSERTATION | OCTOBER 2017 Page | (25)
the meter itself. Electronic and other components failure(%/year)
The expected fraction of meters that will need replacement annually due to failure of the electronic and other components of the meter
Vandalism The expected fraction of meters that will need replacement annually due to damage caused by vandalism.
The above parameters for each case study are fed into the framework model which is in the form of an excel spread sheet divided into three main sheets; an Instructions sheet, a Data input sheet and a Results sheet. The Instructions sheet is just a preliminary sheet which provides a legend of the different categories of both inputs and results obtained. For the inputs, required values are differentiated from calculated values while for the results; good, normal and bad results are differentiated from each other through different colour schemes.
The data input sheet is the first and only sheet where the different input parameters above for each case study area are recorded by the user. These parameters are then used to calculate the different items or indicators in the Results worksheet of the model. The Results worksheet thus automatically calculates the required indicators based on the parameters filled into the Data Input sheet.
It is important to note that since the evaluation framework and user guide had already been developed, for the purposes of this study a few updates were made prior to its use. These included;
• Updating of a few formulas in the Results Sheet to provide more accurateresultant indicators.
• Adding a few details to the Instructions Sheet in order to better guide the user.• Deletion of redundant or unnecessary items to compact the model.• Updating of some input parameter definitions in the User Guide and their typical
range of values per new information obtained from the Literature Review.
The updated framework would be applied to each case study in this report to measure the four different feasibility elements described below.
The Technical and Social Indicators can be considered as preliminary steps in testing the feasibility of the proposed scheme. This means that where the scheme fails to comply in these aspects, no further feasibility should be tested and the scheme should be abandoned. Where the scheme passes the above 2 stages, then the environmental and economic considerations can come into play.
The different input parameters used to determine each of the feasibility indicators below have already been briefly described above with more detailed information on each provided in Appendix A.
UCT MASTERS THESIS CASE STUDY REVIEW OF ADVANCED WATER METERING APPLICATIONS IN SOUTH AFRICA
MASTERS DISSERTATION | OCTOBER 2017 Page | (26)
Technical Feasibility
This looks at two main factors; if the meters under consideration are SABS Compliant and how many meter replacements are required per month. Where the latter varies considerably with failure rates for different metering technologies, the former is either compliant (true) or non-compliant (false) and therefore tantamount to immediate failure or acceptance of the scheme. The input parameters used are described in each case study report.
Social Feasibility
All the contributing factors that determine social feasibility cannot be conclusively discussed in this framework. The municipality must rely on their own knowledge of the area with comprehensive community engagement programmes carried out to determine the receptivity of their consumers to any new metering scheme. For the purposes of this framework therefore, two main factors were looked at; the willingness to pay for water and the volatility of the community. Willingness to pay is calculated as the fraction of the household monthly income required to pay the water bill; with any fraction over 5% considered unfavourable especially with highly volatile communities (Littlefair, 1998).As such where indicators at this stage show a low probability of community acceptance of the scheme, it should be reconsidered with more efforts focused on social rather than on technological interventions. The input parameters used are described in each case study report.
Environmental Feasibility
As in the above two cases, two main factors are also under consideration here. These are the percentage reduction in consumption and the number of batteries to be disposed of per year. While the conventional scheme is taken as the baseline consumption for the former indicator, it is inapplicable to the latter since most conventional meters are mechanical in nature and so have no batteries requiring disposal. This indicator therefore largely focuses on whether the advanced schemes can change water behaviour to more conservative and sustainable use; and what requirements in terms of battery disposal they will incur.
Economic Feasibility
The economic feasibility of the project delves into the lifecycle costs of each proposed scheme and consequently their feasibility in terms of return on investment. In obtaining these lifecycle costs, three main cost categories i.e. total income, total capital costs and finally total O&M costs are required. These categories are then used to calculate the critical parameters for this indicator i.e. capital payment period and effective surplus. A brief of each of these cost categories and what they entail is provided below;
• Total Income: - This is a product of the total consumption, average tariff and the payment rate. Details of what each of these parameters include can be obtained from Appendix A and the input parameters used are described in each case study report.
UCT MASTERS THESIS CASE STUDY REVIEW OF ADVANCED WATER METERING APPLICATIONS IN SOUTH AFRICA
MASTERS DISSERTATION | OCTOBER 2017 Page | (27)
• Total Capital Costs: - For the capital costs; a sum of the meter purchase and installation costs as well as the communication and payment infrastructure costs is required. Details of what each of the above entails are provided in Appendix A and the input parameters used described in each case study report. Conventional meter capital costs are typically restricted to purchase and installation where the advanced meters require additional infrastructure and hence additional costs.
• Total Operation and Maintenance Costs: - Like the capital costs above, a sum of different scheme expenses from meter reading, billing and component or whole meter replacements make up the operation and maintenance costs. Details of how these are obtained can be found in Appendix A and the input parameters used described in each case study report.
As stated, the operational surplus, effective surplus and capital payback period can be calculated once the above 3 cost categories are obtained.
It is important to note however that in spite of the four feasibility indicators described above, the evaluation framework emphasizes the economic analysis of these schemes over all the other aspects. Consequently while a more in-depth understanding of the advanced versus conventional metering economics can be obtained from the evaluation framework, the same level of understanding of the three other parameters cannot be expected from it. The field visits to the different case study areas and the interview and literature data obtained of the different areas were therefore used to offer a more in-depth understanding of the different social, environmental and technical issues to be considered in using these advanced metering schemes.
3.5 Task 5: Pilot Field study
This task consisted of conducting field work in the most proximal case study area of Cape Town. Personal interviews with the municipal personnel involved with the metering work were carried out with a significant amount of information on the two case studies in Cape Town obtained through these interviews. Note that additional questions to accompany the previously developed case study questionnaire were used in these interviews since more information on the evaluation framework parameters and not just the overall AM project status and experience would be needed for the case study reports.
These interviews enabled a better understanding of the gaps in information obtained directly from municipal personnel versus what was needed for the case studies to be ascertained.
As such, in addition to the direct interviews with the municipal personnel assigned to assist with the project, more intensive desk studies of the relevant municipality resources in particular as well as other pertinent resources were done to obtain the information necessary for application of the evaluation framework. Nevertheless, in
UCT MASTERS THESIS CASE STUDY REVIEW OF ADVANCED WATER METERING APPLICATIONS IN SOUTH AFRICA
MASTERS DISSERTATION | OCTOBER 2017 Page | (28)
some instances, the actual extent of information on ground available from both the different municipal personnel and literature sources for the area were still insufficient requiring that assumptions of some parameter values based on similar studies are made.
More adequate preparations for field and desk data collection in the subsequent case study areas were consequently made.
3.6 Task 6: Continuation of Field Studies
This task consisted of application of the revised information collection approach to the other two case study areas chosen. Field visits to both iLembe and Tshwane municipalities were carried out. Personal interviews with the municipal office and field personnel in each area were done to obtain relevant information about the case studies. Further literature reviews to obtain information not readily available from the municipal personnel were also done with follow up phone interviews and emails to validate some of the information so obtained.
A collation of case study findings from both literature and the field interviews was done with reasonable assumptions where necessary made to form the case study reports.
3.7 Task 7: Data analysis of Field Findings
This task involved interpretation of field results using the data analysis model i.e. the updated evaluation framework described in Section 3.4 above.
The calculation of the different evaluation framework indicators for each of the case study areas was done by inputting the field findings into the model. The results obtained were then discussed in terms of what they meant for the feasibility of the project in each of these areas.
Recommendations based on the above detailed case study report results were made to assist consultants or other municipal personnel in determining the feasibility of future advanced water metering projects.
UCT MASTERS THESIS CASE STUDY REVIEW OF ADVANCED WATER METERING APPLICATIONS IN SOUTH AFRICA
MASTERS DISSERTATION | OCTOBER 2017 Page | (29)
4 WATER MANAGEMENT DEVICES IN CAPE TOWN
4.1 Introduction
According to the Draft Water By-law (City of Cape Town, 2009), a “water management device is a device that controls the quantity of water flowing through a water meter over a certain time period”. These Water Management Devices (WMDs) are an advanced meter type which from 2006 have been rolled out by the City Council in several parts of Cape Town. The primary reasons for their use are to reduce debt and to save water by helping consumers manage their usage (Saayman, 2016).
The areas in which these devices are in use include the following; Du Noon, Khayelitsha, Lotus River, Langa, Manenberg, Mitchell’s Plain , Samora Machel, Hanover Park, Factreton, Fisantekraal , Ravensmead, Bloekombos, Wallacedene , Mfuleni , Maccassar, Wesbank, Phillipi, Atlantis and Delft (EMG,2016; Nkomo, 2012; Booysen, 2016; Phaliso, et al., 2010; news24, 2015; Ntwana, 2015; City of Cape Town, 2012a; City of Cape Town, 2013a; De Sousa-Alves, 2013; Pereira, 2009., & Donne, 2009). It is also worth mentioning that currently, when replacements are carried out on defective or aged conventional meters in most parts of Cape Town, the replacement meters installed in all cases are Water Management Devices (Saayman, 2016). As such, the true magnitude of these WMDs presence in Cape Town is larger than depicted in the areas above.
This case study will therefore look at the roll out of WMDs in City of Cape Town as a whole instead of focusing on just one of the above areas. City of Cape Town Metropolitan Municipality is located in the southern peninsula of the Western Cape Province stretching from Gordon's Bay to Atlantis. It has a coastline of 294km and the adjacent municipalities to it are Swartland and West Coast to the north; Drakenstein, Cape Winelands and Stellenbosch to the north-east; and Theewaterskloof, Overberg and Overstrand to the south-east. It is also bounded by the Atlantic Ocean to the south and west (The Local Government Handbook, 2012).
In 2011 the population of Cape Town was 3,740,025 and the number of households was 1,068,572 (Statistics South Africa, 2012). More recent statistics of 2016 indicate a population and average household size of about 4 million people and 3.17 respectively (City of Cape Town, 2015c). The average household size in Cape Town has declined from 3.72 to 3.50 since 2001 and per the 2011 Census Results, the following socio-economic characteristics describe Cape Town; it is mainly comprised of a 42% Coloured and 39% Black African (42%) population. Education levels indicate that 30.3% in 2015 have completed Grade 12 or higher (City of Cape Town, 2015c). Of the labour force (aged 15 to 24), about 76% are employed with approximately 47% of households living on a monthly income of R3, 200 or less.
Since the WMDs are mainly being used in residential areas as mentioned above, the meter sizes used typically vary from 15mm to 25mm (Van Zyl, 2011) and were installed in line with the city Draft Water By-laws (City of Cape Town, 2009) quoted here:
UCT MASTERS THESIS CASE STUDY REVIEW OF ADVANCED WATER METERING APPLICATIONS IN SOUTH AFRICA
MASTERS DISSERTATION | OCTOBER 2017 Page | (30)
“General Conditions of Supply
(6) The Director may –
(a) install a Water Management Device at any premises as part of the water meter and its associated apparatus to encourage water demand management; or
(b) control debt, thereby ensuring that no person is denied access to basic water services for non-payment, where that person proves to the satisfaction of the Director, that he or she is unable to pay for basic services.
(7) Where a Water Management Device has been installed at any premises, a consumer may request to enter into an agreement with the Director to set the drinking water supply to their premises to a predetermined daily volume.”
Even as implementation of these devices precluded the aforementioned by-laws, their formulation gave lee-way for mass roll out of these devices in various areas of Cape Town for some of the reasons explained in the section below. A more detailed breakdown of this case study’s evaluation inputs and results is provided in Section 4.8 of this Chapter.
UCT MASTERS THESIS CASE STUDY REVIEW OF ADVANCED WATER METERING APPLICATIONS IN SOUTH AFRICA
MASTERS DISSERTATION | OCTOBER 2017 Page | (31)
4.2 Reasons for Implementation
The initial installations were part of a pilot project to reduce some of the service delivery gaps in informal settlements, particularly for backyard dwellers living in the backyards of Council rental stock (City of Cape Town, 2012a). This programme was piloted in three areas i.e. Hanover Park, Factreton and Langa, and included construction of a waterborne toilet structure in the backyard with a tap outside it to which a water management device was installed. This WMD was to enable control of water dispensed to the unit based on the number of backyard units on each property and sum of FBW allotments to each (City of Cape Town, 2012a).
Another prompt for the city to embark on WMDs was the increasing arrears accrued on water and sanitation services. This technology was seen as a means for the city to pre-empt these arrears by restricting people to the FBW amount and what they could afford outside of it. WMD use would also provide a debt cancellation option for those who maintained their use within affordable limits and to this effect, R 61 million worth of arrears had been written off by CoCT by Feb 2009 (Papier, 2009).
Supply side management has resource sustainability issues attached to it that limit the extent to which the City can safely abstract from water resources to meet growing demand (Turton, et al., 1999). Consequently, demand side management has gained increasing momentum in South Africa as well as the rest of the world.
Domestic consumption makes up about 47.8% of the overall water use in the CoCT per 2011/2012 figures (De Sousa-Alves, 2013). Technological advancements like the WMD are thus seen as one means to control and minimise domestic and consequently overall water demand as well as have the potential for use as monitoring and enforcement tools for water restrictions in the future.
A culture of “non-payment” for services is considered as one of the historical results of the rent and service delivery boycotts during apartheid, particularly amongst previously heavily marginalised and unserved areas (McDonald, 2002). This history has not only impacted the current service level delivery to these informal settlements whereby different service levels that is basic, intermediate and full are designated to low, middle and high income consumers (McDonald, 2002), but has also consequently further entrenched these non-payment attitudes by alienating low income dwellers them from the idea of citizenship attached to service provision and its consequent roles and responsibilities to the state (Rodina, et al., 2016). As such the self-disconnection or flow restriction capability of these WMDs endear themselves to the city as a move in combating the culture of non-payment and starting a dialogue of debt management and value of water in these areas.
UCT MASTERS THESIS CASE STUDY REVIEW OF ADVANCED WATER METERING APPLICATIONS IN SOUTH AFRICA
MASTERS DISSERTATION | OCTOBER 2017 Page | (32)
4.3 Project Implementation Process
City of Cape Town in a memorandum to representatives of the South African Communist Party, African National Congress, and their alliance partners dated 20 March 2009 (Plato, 2009) clarified the salient issues with regard to the WMD implementation policy in CoCT as follows;
i. The Water Management Devices were being implemented on a voluntary basis in homes across Cape Town.
ii. The WMDs would not require pre-payment to deliver a free basic 6 000 litres of water per month to households, plus a further 4 000 litres to households registered on the indigency database.
iii. The WMDs could also be set to deliver more if owners consent to paying a certain amount at the end of each month.
iv. At the time, the WMDs provided a minimum of 44 litres per person per day of free basic water, based on an estimated average household of eight people. Where more people live in a household, CoCT would increase the amount of free water accordingly.
v. In an attempt to save residents from accumulating unmanageable debts, especially through leaks, the city had not only fixed leaks free of charge in homes where the WMDs had been installed to enable them manage consumption but also for residents on the indigency database who have the Device installed and for six months stick within their daily limit and pay a contribution toward their debts, these debts would be written off after this period, regardless of the amount.
vi. Water under WMD use was never deliberately cut off to people who registered as indigent and made arrangements to pay their debt, however big it was. Their water was only restricted to 6 000 litres per month in terms of the trickle and later WMD system; and 10 000 litres free if they were on the CoCT indigency database.
vii. If water was cut off in a household, this implied a problem which should immediately be reported to the City so that their 24 hour response team could go out and fix it.
According to Pereira, 2009, qualification for indigency requires one to be the registered owner of their property and earn less than R2 880 per month. Other salient issues regarding WMD implementation in CoCT gleaned from CoCT promotional material and cited in the Pereira 2009 text include the following;
i. Those not on the indigency register can pay a once off fee for installation which allows them 6 000 litres per month free, and any additional amount they commit to pay for.
UCT MASTERS THESIS CASE STUDY REVIEW OF ADVANCED WATER METERING APPLICATIONS IN SOUTH AFRICA
MASTERS DISSERTATION | OCTOBER 2017 Page | (33)
ii. The WMDs are configured to switch on at 04.00 am every morning, and switch off only once one has used their set quota for that day. If one utilises less than their daily quota for that day, the remaining amount which was not used will be carried over to the next day only until the end of the month after which any unused allocation for that month is cancelled, and the next month’s quota reset to the original amount.
iii. In case of any problems with a water management device already installed in one’s home, or other appurtenant city water delivery infrastructure, one should send an SMS to the number 31373 for only 80c per SMS’.
iv. In case water has been interrupted for more than 24 hours, one is advised to contact the Technical Operations Centre on 0860 103 054, at the cost of a local call.
The above give a summation of the current implementation procedures of WMDs in the CoCT. In addition, the current Application for Water Management Devices Form details the different device setting options and also includes the different liabilities and responsibilities taken up by both the City and the individual in the use of this device.
With regard to the more technical aspects of WMD procurements and installations, Chapter 7 of the Service Guidelines and Standards for the Water and Sanitation Department of CoCT (City of Cape Town, 2015b) details specifications for an electronic flow limiter valve fitted to a meter with its associated meter in box and fittings. This Chapter includes specifications on features, the valve body, the meter in box, the after assembly test, the Electronic PCB controller, Software and operating features, Training, Tamper proof, Display functions, AMR feature, Battery, General and Software/Hardware (City of Cape Town, 2015b).
An issue worthy of note and alluded to in one of the procedures above is that a once-off leakage repair and plumbing retrofitting programme later formed a preliminary aspect of WMD installation in CoCT. This is because significant losses of water prior to any consumer use had been noted to happen frequently in informal settlements and other areas resulting in a huge public outcry against these meters and their exclusion of the poor from their rights to access water. For example one resident in Mitchell’s Plain, Tanya Smith, with a household of about six other family members with one sick complained that the WMD system caused frequent water cut offs – sometimes for weeks at a time and for no apparent reason (Donne, 2009). Her objections were also supported by other residents from Atlantis, Delft and Mfuleni who said they were experiencing cut-offs after using only about 20 litres of water (Donne, 2009).
Leak repair and retrofitting, technical evaluation of these WMDs as well as several communication and awareness programmes on individual household leak detection therefore remain a critical part of the WMD implementation process and other water loss reduction programmes in CoCT.
UCT MASTERS THESIS CASE STUDY REVIEW OF ADVANCED WATER METERING APPLICATIONS IN SOUTH AFRICA
MASTERS DISSERTATION | OCTOBER 2017 Page | (34)
The two main WMD meter makes currently used in Cape Town are Utility Systems and Aqualoc, with Aqualoc used mainly for 20mm size meters and Utility Systems used mainly for 15mm size (Pontia, 2016).The technical specifications of these meter types are given in the section below.
4.4 Technical Specifications of Main WMDs Installed
As stated above, the Aqualoc and Utility systems WMDs described below form the majority of WMD meters currently installed in CoCT.
Aqualoc Water Demand Management Systems
The Aqualoc WMD manufacture’s brochure states two typical meter sizes of 15mm and 20mm. Per the manufacturer’s claim, these WMDs have the following characteristics;
• “Fully sealed housing with pop up lid. Easy leak detection in one piece moulded housing”.
• “Mud and roots contamination free”
• “Repair and replacement of all components in-situ , using unique non-standard tools”
• “Fundamental product that is easily upgraded from basic management (no meter) to 15mm or 20mm with/without flow regulating device”
• “Upgradable to automatic meter reading as and when required”
• “Pressure independent with IFRD (Intelligent Flow Regulating Device)”
• “Pressure management with IFRD”
• “Dual housing available offer cost savings in product and installation”
Meter specifications in terms of Nominal bore, Flow Rate, Pressure, Installation and Class are also provided in the Brochure with accompanying Head Loss and Flow curve Diagrams.
The Dimensions Table also provided in the brochure details the installation depth, meter box dimensions required as well as end connectors and compression fittings needed to successfully install these meters.
Utility Systems Water Management Devices
Per the manufacturer’s claim, the Utility Systems WMD is a low-cost, intelligent, electronic control valve that is capable of controlling the flow of water for its full pressure range (See Figure 1 below).
It can be installed in domestic as well as small commercial properties and when linked to a pulse output water meter, the device is claimed to enable the following;
• “Time and volume based control of water flow”
UCT MASTERS THESIS CASE STUDY REVIEW OF ADVANCED WATER METERING APPLICATIONS IN SOUTH AFRICA
MASTERS DISSERTATION | OCTOBER 2017 Page | (35)
• “Leak and tamper detection”
• “Management of delinquent customers”
• “Remote data capture and meter control”
• “Automatic Meter Reading (AMR) with the ability to provide control of water flow, the essence of Advanced Metering Infrastructure (AMI)”
• “The implementation of STS prepayment water metering”
The manufacturer’s claim is that the WMD configurations are multiple whereby it not only can be set to dispense FBW, but also allows configuration to dispense other higher or lower quantities of water either daily or monthly. The WMD settings also allow it to be linked to a flat tariff structure for consumers who voluntarily choose to limit their consumption.
The WMD main Features, Technical Specifications and Benefits to the service provider are also provided in the manufacturer’s brochure. With regard to conformance, these meters are claimed to be both SANS certified and STS approved; and have an average battery life of 10 years dependent on use.
Of interest is that another WMD for bulk mains has been developed by this manufacturer known as the Bulk WMD.
The project implementation process mentioned above included a leak fixing and retrofitting project. The water savings figure quoted as achieved with the Retrofitting and Leak fixing project was approximately 10Kl/month per targeted area and a financial saving of between R1.2 – R1.7 Million/year per targeted area (City of Cape Town, 2013). Since this retrofitting can be done with conventional meters, it hasn’t been included as one of the benefits of WMD installation provided below.
Figure 1: Utility Systems Water Management Device (courtesy of Utility Systems)
UCT MASTERS THESIS CASE STUDY REVIEW OF ADVANCED WATER METERING APPLICATIONS IN SOUTH AFRICA
MASTERS DISSERTATION | OCTOBER 2017 Page | (36)
4.5 Benefits of the WMD Implementation
The following benefits were realised by CoCT in installing WMDs in various areas throughout the city;
i. An estimated monthly saving of 156 000 000 litres of water worth R 519 000 was quoted by City of Cape Town as a result of the WMD installations in CoCT by March 2009 (Plato, 2009). These figures indicate a potential for both financial sustainability and water demand growth control in municipal water service provision when WMDs are installed (Saayman, 2016).
ii. In addition, the above reduced consumption also contributes to municipal budgetary savings by deferring water infrastructure augmentation projects which would otherwise need to be done to meet increased demand. Up to approximately 2 billion rand worth of capital investment in desalination and other supply side solutions has been extended due to the consumption reduction from WMD installation. (Saayman, 2016).
iii. For some end-consumers, WMDs offer an opportunity for controlled and budgeted consumption. An example is Gideon Shubani in Sqekezana Street, Makahaza who welcomed the WMDs implementation on account of being able to control his water usage with them in place (Nkomo, 2012).
iv. Another positive attitudinal shift in valuing water as a resource can be surmised from the WMD implementation and other concurrent conservation and demand strategies. A study in Khayelitsha for example found that some residents, in relating rural to urban experiences of water provision, evoked the improved water quality and infrastructural investments in water delivery made by the city as justification for the need to pay for water services (Rodina, et al., 2016). Furthermore, many residents also asserted that payment for water services also acted as a means of incentivising individuals to value it as opposed to the irresponsibility of use rife with free water consumption (Rodina, et al., 2016).
4.6 Challenges Encountered
Even as the above benefits of WMDs were realised, the implementation process of these devices in Cape Town faced a number of challenges. These challenges are sub-divided into the Technical, Social and Economic sub-sections below.
Technical Challenges
4.6.1.1 Failure Rates
WMD implementation studies in four areas i.e. Saxon Sea, Samora Machel, Umlazi and Umbubulu of Cape Town were performed by Thompson, L., et al., 2013 and give an average technical failure rate of the WMDs installed of approximately 21% per annum (GIBB, 2015).These failure rates and the inconvenience as a result inflame the resistance
UCT MASTERS THESIS CASE STUDY REVIEW OF ADVANCED WATER METERING APPLICATIONS IN SOUTH AFRICA
MASTERS DISSERTATION | OCTOBER 2017 Page | (37)
to these meters, making vandalism of them justifiable to some communities. One community leader in Mitchell’s Plain for example was lobbying for mass action to “rip out” the WMDs due to the poor service delivery problems experienced with them (Donne, 2009).
4.6.1.2 Slow response time
A significant lag in the response to some of the WMD complaints made by residents is highlighted in different studies. These times are varied and range from one week (Pereira, 2009) up to a month (Phaliso, et al., 2010) that some residents have had to go without water due to WMD malfunctions and other supply interruptions. Unhealthy coping mechanisms as well as interruptions to informal home industries therefore result from this; further discrediting WMDs in the consumer’s eyes.
4.6.1.3 Emergency Water Reserves
The lack of emergency water reserves in case of fires and other medical related incidents is one of the major shortfalls of WMDs, with residents in areas like Kleinvlei worried about what will happen in case of such incidents (Pereira, 2009). Technological advancements that allow contingency supplies for emergency incidents of this nature are therefore critical in alleviating risks associated with these disasters and endearing these technologies more to the consumers. An example of this is in Hermanus where prepaid meters piloted as part of the Greater Hermanus Water Conservation Programme were fitted with a panic button linked to a 24hour volunteer group who would provide police or fire support in case of any such instances (Turton, et al., 1999).
4.6.1.4 Leakage
Leakages from old and poor quality plumbing in informal settlements are another major cause of failure of WMD implementation. This is because significant losses of water from leaks result in premature cut-offs when only minimal amounts of water have been used by the consumer. For example, a 61 year old in Makhaza complained about getting only about 20 litres of water a day (Donne, 2009). These frequent cut-offs not only debilitate the meters but also result in huge public outcries against these meters and their exclusion of the poor from their rights to access water.
Social Challenges
The significant number of social challenges associated with these WMDs are summarised as follows.
4.6.2.1 Political Landscape
Significant bias and disparity in the hydro-political scope around the implementation of WMDs has oftentimes negatively impacted community attitudes to them. Derogatory terms like “water apartheid” (Carty, 2003) and “weapons of mass destruction” (Donne, 2009) are rife in reference to the WMDs and thus add to the apprehension of different communities about their installation. These attitudes are further reflected in the
UCT MASTERS THESIS CASE STUDY REVIEW OF ADVANCED WATER METERING APPLICATIONS IN SOUTH AFRICA
MASTERS DISSERTATION | OCTOBER 2017 Page | (38)
suspicion around the credibility of the water scarcity assertion made by CoCT with some residents attributing the implementation of these meters to be more attuned to financial scarcity for water infrastructure projects as opposed to physical scarcity of water (Pereira, 2009 & Rodina, et al., 2016). The extent of this intrigue even necessitated a memorandum on March 20, 2009 from City of Cape Town to SACP and ANC Alliance Partners who had conducted a march to the Civic Centre (Plato, 2009). The main subject of this memorandum was to request that these parties cease spreading misinformation about municipal services and in particular the Water Management Devices implementation in Cape Town (Plato, 2009).
Implementing these devices in these largely hostile and pre-biased communities presents several challenges to the City.
4.6.2.2 Mass Action
South Africa has had numerous protests over basic services in recent years. In Wilson, et al., 2008, it is stated that the Minister of Safety and Security released figures showing 5,085 legal and 881 illegal gatherings and demonstrations for the 2004/05 financial year with many of them related to basic services. The ANC protest march cited in the paragraph above is one of a number of similar protests or rejections of WMDs in different communities in Cape Town. These incidents are further exacerbated by minimal consultation prior to implementation and insufficient discussion between municipalities and consumers on the way forward after the WMD installations (Wilson, et al., 2012).
4.6.2.3 Indigency Prerequisites
Another cause of contention in WMD installation is the indigency policy and how it is applied. Rodina, et al., 2016 in reference to a 2012 interview with a City official mentions the challenging nature of the indigent policy implementation as well as the low level of awareness of residents about it. Wilson, J., et al., 2012 also corroborates this by stating that even for the few residents of CoCT who are aware of this indigent policy, a complete understanding of the rebate system it entails has not yet been grasped. In the absence of this knowledge therefore, the benefits of WMDs to many residents still remains unknown further entrenching more popular attitudes of aversion to them.
4.6.2.4 Litigation
The Water By-Laws (City of Cape Town, 2009) required the CoCT to give a compliance two notices prior to disconnection of one’s water supply, with each notice providing a time period for settlement of arrears. However, with WMDs, supply cut-offs outside of the FBW amount for inability to pay or non-payment are a foregone conclusion. This poses a seeming contradiction of By-Laws and their practical implementation which can be used for litigation as well as incentivise mass action protests against the city. For example in March 2009, the City received a memorandum highlighting grievances from the SACP and ANC delegation including the unconstitutional nature of WMDs implementation (Plato, 2009).The above stipulation has been revised in the more recent
UCT MASTERS THESIS CASE STUDY REVIEW OF ADVANCED WATER METERING APPLICATIONS IN SOUTH AFRICA
MASTERS DISSERTATION | OCTOBER 2017 Page | (39)
2010 By-laws to one notice of contravention to be provided to the consumer containing a timeline within which the consumer is required to comply.
4.6.2.5 Consumption Monitoring
One of the main issues with some WMDs which have resulted in their nickname “Umfudo” which is isiXhosa for tortoise regards their physical appearance (Wilson, et al., 2012). The black opaque shell cover in which a few of these devices are contained while serving a protective purpose, is also perceived by consumers as a deliberate way of making it impossible for them to monitor their consumption (Wilson, et al., 2012). This has served to increase the suspicion and level of distrust of these devices in some communities like Khayelitsha for the CoCT that installed them (Nkomo, 2012).
4.6.2.6 Distrust
A 43% probability of failure per year due to vandalism and other causes was obtained from a study of the use of these devices in eThekwini (GIBB, 2015).High levels of vandalism of these WMDs also exist in CoCT and these failure rates can be attributed to the technical challenges above which resulted in supply cut-offs and thus increased social burdens on residents without water. These burdens served to further alienate and perpetuate distrust between the city and its residents whereby in some instances, not only meter vandalism but active threats to harm CoCT employees meant to do this work were made (Saayman, 2016).
4.6.2.7 Health Risks
Due to the water supply interruptions as well as slow response times in addressing them; consumers have adopted several unhealthy strategies in order to survive on the minimal water amounts that they obtain. These include sharing bath water, recycling dish water, going to the toilet in outside bushes to avoid flushing (Pereira 2009 & Kumwenda, 2006) and other unhealthy measures which pose health risks to these residents. The water-borne diseases and other health complications that arise from this consequently place additional resource burdens on the municipal health sector.
4.6.2.8 Social Tensions
The water restrictions imposed by WMDs both in their typical functioning and also in cases of malfunction have various effects on the social relationships of consumers. For instance, in case of supply interruptions or shortages, an increased burden is placed on women and children to find alternative water sources as well as ensure safety of children in using outside toilets and other instances of this nature (McDonald, et al., 2002). In other cases, begging for water from neighbours in order to survive causes embarrassment and also strains relations between community members (Phaliso, et al., 2010 & Nkomo, 2012).The Anti-Privatisation Forum’s research cited in GIBB 2015 also found that increased stress and tension within households on account of rationing individual member’s use resulted from flow restrictions of this nature (GIBB,2015). These tensions can thus incite violence both amongst community members as well as against the city.
UCT MASTERS THESIS CASE STUDY REVIEW OF ADVANCED WATER METERING APPLICATIONS IN SOUTH AFRICA
MASTERS DISSERTATION | OCTOBER 2017 Page | (40)
Economic Challenges
The negative economic impacts and challenges affecting WMD implementation are explained below;
4.6.3.1 Affordability
The DWA Report on Water Boards as Regional Water Utilities mentions affordability of water as a major problem in municipal cost recovery (DWA, 2014). A household income of R38 200 per annum is considered as the minimum income below which houses are typically considered to be unable to pay for water (DWA, 2014). The Overberg Water Board under which Cape Town falls is listed as having a 53% amount of households with incomes of less than R38 200 per annum (DWA, 2014). This implies that payment for water outside of the FBW allotted by WMDs is highly unlikely for the majority of people in these communities and consequently increased incidences of illegal connections to the water supply for additional water needs are observed. In Witsand, Atlantis for example where WMDs have been installed, households with leaks or other supply cut-offs and interruptions make use of an unmetered standpipe in a neighbouring informal settlement to collect water to meet their needs (Pereira, 2009).
4.6.3.2 Increased Investment Costs
WMDs are usually installed as a supplementary component to a typical conventional meter. This means that the overall capital and operation costs of WMD metering systems are much higher in comparison to conventional metering systems (GIBB, 2015). Additionally, the operation and maintenance of these devices owing to the increased failure rates alluded to in Section 4.6.1 above place more resource strains on the city operation and maintenance response teams. Nevertheless when these meters are installed and activated in low income areas, due to unaffordability, residents will typically reduce their consumption to remain within the FBW allotment or seek alternative water sources (Pereira, 2009). This suggests that the City’s ability to recuperate the increased investment costs for these devices is further diminished and this affects the financial viability of these projects.
4.6.3.3 Billing Inconsistencies
There are a number of billing policy discrepancies that require attention in order for successful implementation of WMDs to be achieved. Disparities in billing frequency for example in Witsand Atlantis where a family residing there for 2.5 years had only received two bills in this duration, none of which they could afford to pay (Pereira, 2009). Exorbitant bills for some and none for others are additional disparities that occur in CoCT. For example, interviews with City staff revealed that payment for water services for some residents in Site C of Khayelitsha where WMDs are installed in newly built RDP houses would only be required after the formalisation process and associated upgrades are completed (Rodina, et al., 2016). In other areas like Mitchell’s Plain however, residents believe that WMDs accrue higher bills with some who are classified as indigents claiming to receive bills of up to R 1 400 (U$100) per month for homes with
UCT MASTERS THESIS CASE STUDY REVIEW OF ADVANCED WATER METERING APPLICATIONS IN SOUTH AFRICA
MASTERS DISSERTATION | OCTOBER 2017 Page | (41)
only one tap (Donne, 2009). Varied reasons like leakages, inherited debts from previous owners or multiple persons using the water could explain these exorbitant bills (Wilson, et al., 2012). However, the above varied experiences with billing not only amplify the worry of residents but also create more mistrust and reluctance to accept WMD installations in homes. Also important to note is that due to low literacy levels in some implementation areas, consumers are unable to comprehend the bills they receive (Wilson, et al., 2012) and thus cannot act on them. The city’s revenue streams from the WMDs implementations could prove inconsistent and difficult to track as a result.
4.6.3.4 Debt Cancellation
The policy and execution of debt write-offs for several recipients of WMDs has in some cases been found to be ineffective. Some Makhaza residents for instance expressed fear to go to the city and negotiate their debts due to stories that on going forward, they would be required to pay immediately or face instant disconnection of water supply (Wilson, et al., 2012 & Nkomo, 2012). More local authorities’ involvement and awareness campaigns of the debt write off terms should be done to build trust and avoid even larger debt accruements of fearful consumers.
4.6.3.5 Home Industry
Informal home industries are also be affected by water restrictions imposed by WMDs. For example a sixty-six year-old crèche owner in Langa lost children she was taking care of to other crèches due to lack of water at her property for about a month (Phaliso, et al., 2010). The stifling of this and several other minor industries on which these low income consumers sustain themselves therefore serves to further entrench them in a state of indigence.
UCT MASTERS THESIS CASE STUDY REVIEW OF ADVANCED WATER METERING APPLICATIONS IN SOUTH AFRICA
MASTERS DISSERTATION | OCTOBER 2017 Page | (42)
4.7 Current Status of Water Management Device Implementation in CoCT
Continued roll out of Water Management devices is being carried out to-date in CoCT; particularly of the standardised 20mm Aqualoc and 15mm Utility Systems WMDs. In fact, when repairs or replacements to conventional meters are done, the replacement meters currently installed are WMDs, regardless of the area of Cape Town in which works are done (Saayman, 2016). The only divergence is that in more economically viable residential areas, these WMDs when installed are not activated as they are in areas with accruing arrears to CoCT (Saayman, 2016).
Some areas like Khayelitsha and Dunoon however still have significant political and community resistance to these devices and therefore the city continues to struggle to have WMDs fully rolled out there (Saayman, 2016).
4.8 Evaluation of Water Management Devices (WMD) Case Study in Cape Town
The subsequent section delves into the different input parameters used to generate the evaluation model for the WMD rollout project in City of Cape Town. As explained in the evaluation framework Appendix A; two scenarios are taken into account; the conventional and WMD advanced technology implementation.
Model Input Parameters
The input parameters used to calculate the indicators for the evaluation factors were obtained from various sources and are discussed in this section under the headings of:
• global parameters
• existing system (which caters for the situation before new meter implementation ) and
• proposed scheme (which caters for both the new conventional and new advanced metering systems proposed)
The input parameters are given in tables linked to the evaluation framework, which is provided in Appendix A.
4.8.1.1 Global Parameters
The global parameters used in the analysis are summarised in Table 3, with the values chosen, sources of information and a brief comment. A more detailed explanation of how these model values were selected is provided in the subsequent paragraphs. The rollout of 160,000 WMDs in Cape Town to date was taken to be the project scope for this study (Saayman, 2016).
UCT MASTERS THESIS CASE STUDY REVIEW OF ADVANCED WATER METERING APPLICATIONS IN SOUTH AFRICA
MASTERS DISSERTATION | OCTOBER 2017 Page | (43)
No Parameter Value Source Comment 2.1 Number of
properties 160,000 Saayman, 2016
2.2 Water cost price R8.00 /kl De Sousa-Alves, 2013
2.3 Applicable water tariff
R8.33 /kl City of Cape Town, 2015
CoCT Water and Sanitation Tariffs. 6 kl= free 4.5 kl at R11.07 / kl = R49.82 5 kl at R15.87 / kl = R79.35 Thus the total cost for 15.5 kl is R129.17, which gives an average tariff of R8.33 / kl.
2.4 Billed unmetered tariff (R/month)
R0/month City of Cape Town, 2015
This denomination does not currently exist under the city tariff structure
The number of properties is based on the total number of WMDs in Cape Town in June 2016 (Saayman, 2016).
The water cost price is the water production cost and includes only raw water and purification costs. It was adopted as R8.00 as a fraction of the water reticulation cost provided in the De Sousa-Alves, 2013 Cape Town report.
The applicable water tariff of R8.33 / kl is based on a weighted average of the 1st FBW tier, the 2nd and 3rd tier tariffs of Water and Sanitation Tariffs 2015-2016-CoCT for the Domestic Consumer category (City of Cape Town, 2015) as in the table 1 above.
Per City of Cape Town, 2011; for domestic controlled areas, no charge was levied on the FBW amount. However, water in excess of this amount was previously charged a flat rate based on the Average Historical Cost of water (AHCW).Currently however, no such denomination exists under the city tariff structure and therefore 0 was adopted as the representative billed unmetered tariff value for CoCT
4.8.1.2 Existing System (Situation before Metering System Upgrade)
This section describes the situation before the metering system upgrade. The values used are summarised in Table 4 as follows.
No Parameter Value Source Comment
3.1 Billed metered consumption
150,400 properties
Sivatho, et al., 2016
Based on 94% of overall 160,000 properties
3.1 Billed metered unit consumption
15.5 kl/property /month
Viljoen, 2015 Domestic consumption estimates
3.2 Billed unmetered 1,600 properties Sivatho, et al., Based on 1% of overall
Table 3 : Global Parameters
Table 4: Water Consumption before Advanced Meter Implementation
UCT MASTERS THESIS CASE STUDY REVIEW OF ADVANCED WATER METERING APPLICATIONS IN SOUTH AFRICA
MASTERS DISSERTATION | OCTOBER 2017 Page | (44)
No Parameter Value Source Comment
consumption 2016 160,000 properties 3.2 Billed unmetered unit
consumption 15.5 kl/property /month
Viljoen, 2015 Same consumption estimates as 3.1 above
3.3 Illegal or unbilled connections
8,000 properties Based on remaining 5% of overall 160,000 properties
3.3 Illegal connections unit consumption
15.5 kl/property /month
Viljoen, 2015 Same consumption estimates as 3.1 above
Fraction of properties paying for water 3.5 Billed metered
consumption 40% Papier, 2009
3.6 Billed unmetered consumption
0% N/A Same as 3.5 above
Other parameters before Advanced Meter Implementation 3.8 Fraction of demand that is
on-site leakage 6% De Sousa-Alves,
2013 Table showing Opportunities in Reducing demand
3.9 Ave time between meter readings (months)
1 Saayman, 2016 Adopted since congruent with monthly billing cycles.
3.10 Meter reading cost R8 /meter Saayman, 2016 3.11 Billing cost R10 /bill GIBB, 2015 Inclusive of
administrative, printing and postage costs.
3.12 Meter operation & maintenance cost
R7/meter/month N/A Estimated as a ratio overall capital cost.
Fraction of meters failing due to 3.13 Meter failure (/year) 5% Wendell,2016 3.14 Vandalism and other
(/year) 2% Wendell, 2016
3.16 Average household income (/month)
R3200 /month Statistics South Africa, 2012
Based on Census 2011 City of Cape Town Results
3.17 Unemployment rate 24% Statistics South Africa, 2012
Based on Census 2011 City of Cape Town Results
3.18 Volatility of community (No of protest or mass action incidences per year)
129 Centre for Civil Society, 2016
Social Protest Observatory records 2016.
The 150,400 properties under billed metered consumption were based on applying a fraction of 94% to the total WMDs as per the Domestic User Connection Profile 2014/15 category for billed metered consumption in Cape Town (Sivatho, et al., 2016).
UCT MASTERS THESIS CASE STUDY REVIEW OF ADVANCED WATER METERING APPLICATIONS IN SOUTH AFRICA
MASTERS DISSERTATION | OCTOBER 2017 Page | (45)
In the absence of billed metered unit consumption data for these areas, an estimate had to be made. Viljoen, 2015 contains a figure showing average daily water consumption of properties with main and additional households in low income areas of Cape Town. Since service delivery to backyarders was a key issue in the implementation of WMDs (City of Cape Town, 2012), it was assumed that these devices were installed both on main and backyard dwellings. In addition, even though these devices are being installed in different low and middle income areas across the city, their flow restriction function is usually only activated in low income areas with debt management backlogs (Saayman, 2016). It is why the unit consumption value of 0.5 kl/day for low income category of single households surveyed as in Figure 6 of the study (Viljoen, 2015) was adopted and applied over a period of 31 days to get an average monthly unit consumption of 15.5 kl/property/month.
The 1,600 value for billed unmetered consumption properties was obtained by applying a fraction of 1% to the overall 160,000 properties as per the Domestic User Connection Profile 2014/15 category for billed unmetered consumption in Cape Town (Sivatho, et al., 2016).
A similar billed unmetered unit consumption of 15.5 kl/property/month as in the billed metered unit consumption case was adopted in the absence of more conclusive information from City of Cape Town.
The 8,000 value for illegal or unbilled connections was obtained by applying the remaining fraction of 5% to the overall 160,000 properties on the assumption that this un-captured fraction represents these types of connections in Cape Town.
A similar illegal connections unit consumption of 15.5 kl/property/month as in the billed metered unit consumption case was adopted in the absence of more conclusive information from City of Cape Town.
A fraction of billed metered properties paying for water of 40% was adopted as a representative value based on the fact that a high amount of arrears are accrued in low income areas from non-payment for water services (Papier, 2009).
CoCT was assumed to have a poor collection efficiency for unmetered properties since difficulty in collection from billed properties was already rampant. A fraction of billed unmetered properties paying for water of 0% was therefore adopted.
The fraction of demand that is on-site leakage of 6% was based on an estimate of on-site leakage in residential areas made by the City of Cape Town (De Sousa-Alves, 2013).
The R8 /meter value for meter reading cost was obtained from the City of Cape Town municipal personnel (Saayman, 2016).
It was not possible to get the billing cost from City of Cape Town. However from a feasibility study for eThekwini, billing costs were estimated as R10 per month per meter (GIBB, 2015) made up of R 6 administrative cost, R 1 printing cost and R 3 postage cost. This estimated R10 /bill was thus adopted as the billing cost for Cape Town.
UCT MASTERS THESIS CASE STUDY REVIEW OF ADVANCED WATER METERING APPLICATIONS IN SOUTH AFRICA
MASTERS DISSERTATION | OCTOBER 2017 Page | (46)
To estimate the typical meter operation and maintenance costs, a ratio of 15% of the overall capital cost of the conventional meter per annum was used due to the absence of more conclusive information on this. An estimate of about R75 per annum and thus R6.25 /month was obtained, which value was rounded off to approximately R7 /meter/month.
The meter failure rate of 5% for conventional meters in Cape Town was obtained from the City of Cape Town (Wendell, 2016).
The failure rate due to vandalism and other reasons of 2% for conventional meters in Cape Town was also obtained from the City of Cape Town (Wendell, 2016).
As stated above in the discussion of the socio-economic characteristics for Cape Town, the average household income of R3 200 /month reported in Census 2011 City of Cape Town Results (Statistics South Africa, 2012) was adopted.
Similar to the above, the unemployment rate of 24% based on the Census 2011 City of Cape Town Results (Statistics South Africa, 2012) was adopted.
About 43 protest/ mass action incidents have been recorded in the Centre for Civil Society Social Protest Observatory as having occurred in Cape Town area in just the course of January to April of the year 2016 (Centre for Civil Society, 2016). This indicates a high community volatility of about 129 protest incidents per year.
4.8.1.3 Proposed Scheme for Conventional Metering (baseline)
In the evaluation framework, the proposed scheme consists of two parallel categories, i.e. conventional and advanced metering. This is useful in evaluating the benefits of replacing the existing meters with advanced meters over conventional meters.
The parameters for the proposed conventional metering scheme are summarised in Table 5 below and discussed in the rest of the section under the headings of ‘proposed system parameters’, ‘failure rates’, ‘costs’ and ‘expected consumption’.
No Parameter Value Source Comment Proposed system parameters 4.1 Meter make Variable including Elster
Kent, Actaris, Sensus De Beer, 2010 Similar residential
meters assumed 4.2 Meter model Variable including Rotary
piston, Single jet and Multi-jet meters
De Beer, 2010 See 4.1 above
4.3 SANS 1529-1 compliant?
True N/A Meets legal requirements.
4.7 Meter service life (years)
18 Van Zyl, 2011 & De Sousa-Alves, 2013
Fraction of meters expected to fail due to 4.9 Water meter 5% Wendell, 2016 As in Section 4.8.1.2
Table 5: Conventional Metering Scheme Parameters
UCT MASTERS THESIS CASE STUDY REVIEW OF ADVANCED WATER METERING APPLICATIONS IN SOUTH AFRICA
MASTERS DISSERTATION | OCTOBER 2017 Page | (47)
No Parameter Value Source Comment failure (/year) above
4.11 Vandalism (/year) 2% Wendell, 2016 As in Section 4.8.1.2 above
4.12 Other(/year) N/A N/A Included in 4.11 above Costs 4.14 Meter price R500 /meter De Beer, 2016
R7 /meter/month N/A Based on capital cost of the meter
4.21 Billing cost R10 /bill GIBB, 2015 Inclusive of administrative, printing and postage costs.
Expected New Consumption 4.24 Billed metered
consumption 160,000 properties Saayman, 2016
4.24 Billed metered Unit Consumption
15.5 kl/property/month N/A No change assumed
4.26 Illegal consumption or unbilled connections
N/A N/A Illegal connections are assumed to have been identified and metered.
4.26 Illegal connections unit consumption
N/A N/A Based on above
Fraction of Properties Paying for Water 4.29 Billed metered
consumption 40% Papier, 2009 Same as Section
4.8.1.2 4.31 Ave time
between meter readings
1 per month Saayman, 2016 Congruent with monthly billing cycle.
a) Proposed System Parameters
CoCT has different types of meters spread out in different areas per the various contractors who are awarded tenders for water infrastructure delivery. In the absence of aggregated information on all meter types in Cape Town, the meter make and model stated were based on the De Beer, 2010 AMR report since it referred to a water meter
UCT MASTERS THESIS CASE STUDY REVIEW OF ADVANCED WATER METERING APPLICATIONS IN SOUTH AFRICA
MASTERS DISSERTATION | OCTOBER 2017 Page | (48)
supply tender for the whole City of Cape Town and also stated some of the existing meter types in a few residential areas of the pilot study in Cape Town.
The value for SANS 1529-9 compliance was omitted from Table 3 since it deals with requirements for electronic indicators that in most cases are not part of a typical conventional meter.
A conventional meter service life of 18 years was adopted as explained in Section 7.7.1.3 of the Epping Industrial AMR Case study.
b) Failure Rates
In assessing the water meter failure rate a value of 5% meter failure per year as abovewas used (Wendell, 2016).
The value of 2% failure per year due to vandalism and other causes was used.
c) Costs
The typical conventional meter price used was R500 /meter based on the originalconventional meter price adopted by comparison of two sources explained in Section 7.7.1.3 of the Epping Industrial AMR Pilot project.
No information on the installation cost of conventional meters could be found. As such, an estimate of R800 / meter per municipal staff experience in the Pretoria case study was adopted here to account for all the materials and labour required for meter installation.
Since the administrative portion of the billing cost is expected to cover all payment system operational costs, no payment infrastructure costs are expected.
The meter reading, billing and meter operation and maintenance costs were adopted from the existing values discussed above.
d) Expected Consumption
All 160,000 properties were assigned to billed metered consumption as part of the newmeter implementation process.
Since the proposed meter type here is the same as the existing conventional one, the consumption was assumed to remain unchanged as in Section 4.8.1.2 above.
A fraction of billed metered consumption properties paying for water of 40% as in the Section 4.8.1.2 above was maintained since the same meters are used.
UCT MASTERS THESIS CASE STUDY REVIEW OF ADVANCED WATER METERING APPLICATIONS IN SOUTH AFRICA
MASTERS DISSERTATION | OCTOBER 2017 Page | (49)
4.8.1.4 Proposed Scheme for Advanced Metering
The parameters for the WMD advanced metering scheme in Cape Town are summarised in Table 6 and are discussed in the rest of the section under the headings of ‘proposed system parameters’, ‘failure rates’, ‘costs’ and ‘expected consumption’.
No Parameter Value Source Comment Proposed System Parameters 4.1 Meter make Water Management
Devices Saayman, 2016
4.2 Meter model Variable including Aqualoc, Utility Systems,
Pontia, 2016 & Booysen, 2016
4.3 SANS 1529-1 compliant?
True N/A Meets legal requirements
4.4 SANS 1529-9 compliant?
True N/A Meets legal requirements
4.5 Mean battery life (years)
7 years Pontia , 2016 Adopted from field experience
4.6 Battery replaceable in field?
True Not available Preference for modular units assumed
4.7 Meter service life (years)
7 years Pontia, 2016
Fraction of meters expected to fail due to 4.9 Water meter failure 21% Thompson et
al., 2013 & GIBB,2015
From Cape Town WMD experience in 4 areas
4.10 Electronics and other components (e.g. valve) failure
See above See above Assumed to be included in above water meter failure rate
4.11 Vandalism 10% GIBB 2015 4.12 Other See above See above Assumed to be
included in above vandalism failure rate
Costs for Advanced Metering 4.14 Meter price R1 500 /meter GIBB 2015 4.15 Installation cost R1 000 /meter GIBB 2015 4.16 Communication
infrastructure cost N/A N/A Meters not
automatically read 4.18 Battery replacement
cost R220 /meter Made in
China.com, 2016 & GIBB, 2015
Estimate from product price list as in Epping Industrial case study.
4.19 Meter reading cost R2 /meter Saayman, 2016 Meters can be pre-set so advantageous over conventional
UCT MASTERS THESIS CASE STUDY REVIEW OF ADVANCED WATER METERING APPLICATIONS IN SOUTH AFRICA
MASTERS DISSERTATION | OCTOBER 2017 Page | (50)
No Parameter Value Source Comment 4.20 Meter operation &
maintenance cost R19 /meter/month N/A Based on capital cost
of meter 4.21 Billing cost R10 /bill GIBB, 2015 Expected new Consumption for Advanced Metering 4.24 Billed metered
consumption 160,000 Saayman, 2016
4.24 Billed metered unit consumption
10.5 kl/property/month
Marah, L., et al., 2004
FBW allotment
4.26 Illegal consumption N/A N/A All assumed to have been identified and removed
4.26 Illegal connections unit consumption
N/A N/A See above
Fraction of Properties Paying for Water 4.29 Billed metered
consumption 90% Sivatho, et al.,
2016 & GIBB,2015
4.31 Ave time between meter readings (months)
1 N/A Congruent with monthly billing cycle
a) Proposed System Parameters
• Water Management Devices are the advanced meter type considered in this case study (Saayman, 2016).
• The variable meter models listed above were obtained from some of the WMD area implementation articles (Booysen, 2016) as well as information from Cape Town on the current implementations (Pontia, 2016).
• Both SANS 1529-1 and SANS 1529-9 compliance are applicable to advanced metering technology and therefore it is a legal requirement for the advanced meters to comply with these standards. The system and meters installed complied with these standards in all cases.
• A mean battery life of 7 years obtained from City of Cape Town (Pontia, 2016) as in Section 7.7.1.4 of Epping Industrial Case study was adopted here.
• A modular unit which allows the battery to be replaceable in the field was input as the typical characteristic of the WMD system proposed since this was considered to be the preferred option for maintenance and operational cost management.
• A meter service life of 7 years for advanced meters was obtained from the City of Cape Town (Pontia, 2016).
b) Failure rates
• GIBB, 2015 contains a section on case studies done on WMD implementations in Cape Town performed by Thompson, L., et al., 2013. WMD project experience in
UCT MASTERS THESIS CASE STUDY REVIEW OF ADVANCED WATER METERING APPLICATIONS IN SOUTH AFRICA
MASTERS DISSERTATION | OCTOBER 2017 Page | (51)
four areas i.e. Saxon Sea, Samora Machel, Umlazi and Umbubulu of Cape Town are given. The technical failure rates of the WMDs in each area were thus used to obtain the average WMD meter failure rate of 21% given above.
• The electronics and other components (e.g. valve) failure rate parameter was omitted since this value was deemed to be included in the meter failure rate value from the 4 CoCT case studies in item 4.9 above.
• Per GIBB, 2015 study in eThekwini, there is an increased probability of tampering of conventional systems with water management devices in low cost housing areas. A 2015 value of 43% probability of failure per year due to vandalism and other causes was given for eThekwini (GIBB, 2015). In the absence of information on vandalism of these devices from CoCT; an estimate of 10% failure per year due to vandalism and other causes was adopted as an average for roll-out in all the various areas of Cape Town.
c) Costs
• In the absence of information from CoCT on this, the typical WMD meter price adopted was R1 500 based on the complete cost value for a conventional domestic meter with WMD in eThekwini study area (GIBB, 2015).
• In the absence of information from CoCT on the installation cost of WMDs, R1 000 /meter for labour for installation as in the GIBB, 2015 report value for WMDs was thus adopted.
• For communication infrastructure costs, since these meters in most cases are not automatically read, the value for this has been omitted.
• The payment infrastructure cost was also omitted from the table since the WMDs use a post payment system similar to that of conventional meters thus no vending infrastructure was required.
• The battery replacement costs for this WMD system were based on comparison of two source values as explained in the Epping case study.
• Although the typical value of manual meter reading cost from CoCT is R8 /meter; this was adjusted to a WMD meter reading cost of R 2/meter and used. This fraction of the entire meter reading cost represented the fact that WMDs allow predetermined volumes of consumption to be provided to consumers therefore negating the need for manual meter reading to be carried out in many instances.
• Similar to the conventional case, to estimate the typical advanced meter operation and maintenance costs, a ratio of 15% of the overall capital cost of the advanced meter per annum was used. An estimate of about R225 per annum and thus R19 /meter/month was obtained and adopted in the absence of more conclusive information from CoCT.
UCT MASTERS THESIS CASE STUDY REVIEW OF ADVANCED WATER METERING APPLICATIONS IN SOUTH AFRICA
MASTERS DISSERTATION | OCTOBER 2017 Page | (52)
• The billing cost of R10 /bill as adopted from GIBB, 2015 in the Epping industrial Section 7.7.1.4 has been maintained for this WMD metering system since conventional billing systems were retained for these WMDs.
• No additional communication system operating costs are expected in this WMD system for similar reasons to those in Section 7.7.1.4 of the Epping case study.
d) Expected Consumption
• All 160,000 properties as in Section 4.8.1.1 above were assumed to be under billed metered consumption as part of the new WMD project implementation.
• It has largely been found that consumption decreases where WMDs are installed particularly in areas where communities were previously not paying for their consumption (Marah, et al., 2004). The FBW allotment in CoCT of approximately 10.5 kl/property/month is therefore used here to represent the billed metered unit consumption reduction in the areas where these devices were used to combat the culture of non-payment for water services.
• All illegal connections and consequently their illegal unit consumption are assumed to have been identified and removed as part of the new WMD process and were thus omitted from the table.
• A 90% fraction of billed metered consumption properties paying for water was assumed due to the automatic flow restriction properties of WMDs which consequently force consumers to pay for continuous water supply or minimise their use within the FBW amount.
Results
The four tables below provide the technical, social, environmental and economic results for the WMD case study in Cape Town calculations based on the input parameter values above.
4.8.2.1 Technical Result
The technical results of the evaluation are summarised in Table 7 showing compliance with SABS standards for both conventional and advanced meters. However, the advanced meters had over four times the failure rates of the conventional meters. In fact these high failure rates were one of the reasons for the initial rejection of the WMDs in most areas in Cape Town.
UCT MASTERS THESIS CASE STUDY REVIEW OF ADVANCED WATER METERING APPLICATIONS IN SOUTH AFRICA
MASTERS DISSERTATION | OCTOBER 2017 Page | (53)
1. TECHNICAL
No Property
Conventional metering (baseline)
Advanced metering
1.1 SABS compliance Yes Yes
1.2 Number of meters to replace (/month) 933 4133
4.8.2.2 Social Result
The social results are shown in Table 8 below. In this case study, the affordability of the system is not assured, with the water bill making up 6.8% of the average income in the community. This, as well as the high unemployment rate and past incidents of volatility in the community shows that the proposed system is highly unlikely to be accepted by the community. The case study report indicates several social challenges and consequently a number of protests in implementing these devices in many of the Cape Town areas. However with more efficient water use learnt by the community over time as well as improved community awareness campaigns and city customer query response time, these meters exhibited the potential to meet the key objectives i.e. debt management and water demand management.
2. SOCIAL
No Property Value
2.1 Current rate of meters vandalised (/year) 2.0%
2.2 Unemployment rate 24.0%
2.3 Volatility of community (No of protest or mass action incidences per year) 129
2.4 Average water bill (/month) R216.58
2.4 Average property income (/month) R3,200.00
2.5 Water bill as a fraction of income 6.8%
4.8.2.3 Environmental Result
The environmental results are shown in Table 9 below.
A 32.3% reduction in consumption was realized with 22 857 batteries requiring disposal per year shown as items 3.7 and 3.8 of Tables 9-10 below. This reduction in consumption in Cape Town fulfilled the consumption management objective.
Table 7: Technical result for WMD Case Study in Cape Town
Table 8: Social result of the WMD Case Study in Cape Town
UCT MASTERS THESIS CASE STUDY REVIEW OF ADVANCED WATER METERING APPLICATIONS IN SOUTH AFRICA
Communication infrastructure cost R0.00 R0.00 R0.00
Table 9: Environmental result of the WMD Case Study in Cape Town
Table 10: Economic Viability of WMD Case Study in Cape Town
UCT MASTERS THESIS CASE STUDY REVIEW OF ADVANCED WATER METERING APPLICATIONS IN SOUTH AFRICA
MASTERS DISSERTATION | OCTOBER 2017 Page | (55)
4.10
Payment infrastructure cost R0.00 R0.00 R0.00
4.11 Total capital cost R0.00 R208,000,000.00 R400,000,000.00
4.12 Unit capital cost (/property) R0.00 R1,300.00 R2,500.00 Operational cost 4.13 Water production (/month) R19,840,000.00 R19,840,000.00 R13,440,000.00 4.14 Meter reading (/month) R1,203,200.00 R1,280,000.00 R320,000.00
4.15 Meter operation & maintenance (/month) R1,052,800.00 R1,120,000.00 R3,040,000.00
The WMDs at a capital cost of R400 million achieve a 32.8% reduction in consumption and a 50% increase in payment rates. They therefore achieve the two primary objectives of the City of Cape Town’s installation that is debt reduction and consumption management.
This however means that the City must be willing to invest an additional R192 million rand into WMDs which translates into an additional R2.45 /kl if only capital cost and total consumption over the meter service life is considered for both scenarios. In water scarce areas, this additional cost may be preferable to bulk augmentation projects
UCT MASTERS THESIS CASE STUDY REVIEW OF ADVANCED WATER METERING APPLICATIONS IN SOUTH AFRICA
MASTERS DISSERTATION | OCTOBER 2017 Page | (56)
involving finding alternative water sources or importing water from neighbouring areas. Savings in production costs due to the reduced consumption can also be channelled to meeting the above additional metering costs.
It is important to note that in the evaluation framework above, a cost of R0 /kl was considered for the FBW consumption. As such, inclusion of a government subsidy amount equivalent to the first tier tariff for this 6kl FBW amount will change the economic results obtained since a new tariff amount of R12.62 / kl instead of R8.33 /kl as in the case above will be used. The new economic results indicate that both schemes as in the above case have a negative effective surplus and therefore are infeasible. However, where the conventional scheme resulted in operational savings unlike the WMD scheme, with an increased tariff, the WMD scheme results in higher savings of R2.3 million /month compared to the conventional scheme savings of about R352 000 /month.
The main objectives of the advanced scheme and what achieving them means in terms of cost and social factors management should therefore be reviewed before roll out of similar schemes in the future.
4.9 Lessons Learnt
Water management devices have brought to light a number of issues related to water demand in South Africa. The opening of this dialogue is critical to water management demand and conservation efforts both now and in future. With technological advancements and major social justice interventions and policies in the use of these WMDs, they stand to play a critical role in water security in Cape Town. Some of these lessons learnt are described below.
4.9.1.1 Community Involvement
Consumer education and awareness is required to improve community attitudes towards WMDs. As highlighted in Section 4.6.3 above, several shortfalls in clarifying the billing, indigency policy and debt rebate or cancellation’s application to the WMD implementations still exist since the roll out process of these WMDs seems to differ in different areas (Pereira, 2009). To prevent the consequent worry and rejection of these WMDs in various communities therefore, extensive awareness campaigns divergent from the typical participatory approaches which serve more to avoid conflict should be in place before these devices are rolled out (Wilson, et al., 2008).
4.9.1.2 Sensitivity of Approach
Many of the studies done on WMDs imply that the acceptance to pay for services does exist in many of these areas (Rodina, et al., 2016). However, the manner of implementation if not done carefully only serves to perpetuate distrust and thus community resistance by further burdening already vulnerable households (Pereira, 2009). This implies that a need to extensively engage with local leaders and community members to identify and mitigate social burdens on the especially vulnerable in these
UCT MASTERS THESIS CASE STUDY REVIEW OF ADVANCED WATER METERING APPLICATIONS IN SOUTH AFRICA
MASTERS DISSERTATION | OCTOBER 2017 Page | (57)
areas is necessary and will also build a sense of ownership for these devices in the community.
4.9.1.3 Multipronged Method
One of the areas in which advanced meters gained significant success in terms of demand management is Hermanus (Turton, 1999). This is because a multi-faceted approach from education of adults and children, water saving device usage and approaches to gardening, employment of local labour to assist in some of the conservation measures (clearing alien vegetation) and policy adoption were all concurrently done with the pre-paid meter implementation (Turton, 1999).This approach serves to both permeate information on several levels as well as instil a sense of ownership that makes the project sustainable. It is thus recommended that a similar approach to this be adopted in the WMD implementation areas to avoid the WMD from being seen as a punitive device for the poor but rather as part of a bigger water conservation programme for the whole city.
4.9.1.4 Plumbing and Retrofitting
As mentioned in Section 4.6.1 above, the water loss due to leakage in low income areas is very high. As a result, it not only increases the requirements for supply side solutions but also causes premature cut off of WMDs where installed. Retrofitting and leakage repair projects prior to implementation of these devices have already been embarked on by CoCT (De Sousa-Alves, 2013). Critical to their success however is the use of durable high-quality pipes, meters and fittings in township areas due to the significant wear and tear taps and toilets face from more frequent usage in these areas (DWAF, 2009). These durable solutions should be encouraged in all aspects of low income development i.e. water infrastructure upgrades and housing developments to ensure successful implementation of both WMDs and other water conservation strategies.
4.9.1.5 Disaster Preparedness
The ability to immediately respond to fire and other medical emergencies is critical to saving of life and property (Pereira, 2009). Alternative water sources for these emergency cases where WMDs are installed or configuration of the WMD technology to allow for emergency reserves are thus critical to their safe implementation in different areas.
4.9.1.6 Institutional Capacity
WMDs due to their self-disconnection function place significantly higher demands on the maintenance and operation capacity of the municipality. Pereira, 2009 mentions leakages, frequent cut-offs and slow response time to complaints as some of the cross-cutting issues in different areas where these devices were installed. Improvement of the City’s institutional capacity to operate and maintain these devices prior to their roll out is therefore critical to their success and will also prevent disease outbreaks from the unhealthy coping mechanisms adopted in the absence of water.
UCT MASTERS THESIS CASE STUDY REVIEW OF ADVANCED WATER METERING APPLICATIONS IN SOUTH AFRICA
MASTERS DISSERTATION | OCTOBER 2017 Page | (58)
4.9.1.7 Procurement
The WMD failure rates alluded to above, point to the need for stricter procurement requirements in the purchase and installation of these devices. Even as these are relatively new technologies, CoCT believes the market is capable of coming up with more versatile solutions to the various technical problems encountered in WMD use in CoCT (Saayman, 2016).
4.9.1.8 Stakeholder Engagement
The varied political interests and landscape described in Section 4.6.2 above indicate that stakeholder engagement at all levels must be done to ensure political buy-in of both local and other community leaders. This will avoid the need for outsourcing of personnel as was the case when the South African Municipal Workers Union (SAMWU) issued a press statement in November 2007 that condemned the forthcoming roll-out of these WMDs in Cape Town (Wilson, et al., 2012) and also minimize issues of vandalism and mass protests against the WMDs.
UCT MASTERS THESIS CASE STUDY REVIEW OF ADVANCED WATER METERING APPLICATIONS IN SOUTH AFRICA
MASTERS DISSERTATION | OCTOBER 2017 Page | (59)
5 PREPAID WATER METERS IN ILEMBE DISTRICT MUNICIPALITY
5.1 Introduction
iLembe District Municipality is located in Kwazulu Natal along the north coast(65km north of Durban) where it covers an approximately 1 455km2 area comprised of four local municipalities (the water dialogues, 2008). The 4 local municipalities of Maphumulo, Ndwedwe, Mandeni and Kwadukuza are 80%, 80%, 60% and 20% rural respectively with Kwadukuza situated in the east, Mandeni in the north and Maphumulo and Ndwedwe in the West (Mthembu, 2016) .
The 2011 Census results indicate a population of 606 809 in iLembe with a 0.8% growth per annum (Statistics South Africa, 2012a). Additionally, trends indicate a high migration rate of residents from the rural municipalities of Maphumulo and Ndwedwe to the more urbanized municipalities of Mandeni and Kwadukuza (Statistics South Africa, 2012a). This is no surprise considering that Maphumulo and Ndwedwe have the highest unemployment rates of 49% and 58% respectively relative to a district average unemployment of 31% and 37% amongst the youth (Statistics South Africa, 2012a).
This municipality currently has a total length of mains of approximately 2 205km from 111 water schemes feeding about 34 632 consumer connections (iLembe District Municipality, 2015a). Of these consumer connections, an FBW allocation of 10kl/month goes to indigent domestic consumers with all the other domestic, industrial, commercial and institutional users required to pay for any and all water used (Mthembu, 2016).
However in October 2013, bill accruement and an increasing debt book of about R211 million from unpaid water bills prompted the municipality to roll-out prepaid water meters (iLembe District Municipality, 2013). Currently the coverage of these prepaid meters in each local municipality stands at approximately 80% for Kwadukuza, 25% for Maphumulo, 45% for Ndwedwe and 60% for Mandeni (Mthembu, 2016).
A more detailed breakdown of this case study’s evaluation inputs and results is provided in section 5.8 of this Chapter.
5.2 Reasons for Implementation
The primary reason for introduction of prepaid meters was to increase revenue collection by mitigating the various problems with billing. These included meter data capturing errors, discrepancies in meter records and time lags in updating meter records per field maintenance activities and/or new connections (iLembe District Municipality, 2015b).
It was thus hoped that the data cleansing done in due course of prepaid meter installations would reconcile and update the billing system records. Furthermore, the drive-by approach in data capture was envisioned as a time saving and error proof means of meter reading (iLembe District Municipality, 2015b).
UCT MASTERS THESIS CASE STUDY REVIEW OF ADVANCED WATER METERING APPLICATIONS IN SOUTH AFRICA
MASTERS DISSERTATION | OCTOBER 2017 Page | (60)
As stated above, the municipal debt book was approximately R211 million and growing in 2013 (iLembe District Municipality, 2013). Prepaid meters were therefore seen as a means of arresting this debt. This municipal thinking around prepaid meters can best be illustrated by the statement that Mr Jean-Pierre Mas, the Operations Executive at Johannesburg Water, said in regard to their installation in Orange Farm in 2000 (Thompson, 2003).
"Under the old system, people were billed for far less water than they consumed, and still they were not paying their bills. They had no incentive to lower their consumption. They had no incentives to pay. If we don't do anything about it, it will be an unsustainable setup. We will have a financial disaster." (Thompson, 2003).
The roll out of the Utility Systems (USC) prepaid meters therefore commenced in iLembe in October 2013 with varying device sizes installed amongst different consumer types. The technical specifications of these devices are detailed in Section 5.3 below.
5.3 Technical Specifications of Utility Systems Prepaid Water Metering System
The Utility Systems prepaid metering system can be grouped into 4 main components, namely:
• a Water Management Device,
• a User Interface Unit (UIU),
• Vending infrastructure and
• Data collection hardware and software.
A brief of each of these components per the manufacturer’s brochure is given in the subsequent sections.
Water Management Devices (WMD)
The WMD is an electronically controlled valve typically connected to a pulse output water meter. The pulse output from the water meter is what typically triggers the WMD to monitor and control consumption via electronic pick-ups. Per the manufacturer’s claim, this WMD has the following functions and features and a photograph of it is also provided in Figure 2 below:
• Monitoring consumption and dispensing water accordingly. This could includedispensation of emergency or lifeline reserves in case of credit depletion (GIBB,2015).
• Ability to communicate with field service units for data collection as well as withthe UIU.
• Has a data logging function for monthly billing or longer duration analysis.
UCT MASTERS THESIS CASE STUDY REVIEW OF ADVANCED WATER METERING APPLICATIONS IN SOUTH AFRICA
MASTERS DISSERTATION | OCTOBER 2017 Page | (61)
• Tamper and leak detection properties.
• Bi-directional communication abilities which can allow remote control of this device.
User Interface Unit (UIU)
This unit is typically installed inside the customer’s premises and is the unit into which the consumer keys the credits/tokens bought into the prepaid system. This UIU uses an RF radio link to convey the purchased units information to the WMD above (personal communication with USC cited in GIBB, 2015). Per the manufacturer’s claim, this UIU also has four main display functions mentioned below and a figure of it is shown thereafter:
• Display of meter reading per the WMD installed
• Display of available water allocation (FBW or other prepaid amounts)
• Display of WMD serial number required to purchase a token
• Leak, tamper and other alarm detections.
Vending Infrastructure
Per the manufacturer’s claim, this prepaid metering system is Standard Transfer Specification (STS) approved. This implies that multiple vending options are available to both the municipality as well as to consumers who need to purchase credit for water.
Figure 2: Utility Systems Water Management Device (courtesy of Utility Systems)
Figure 3: Utility Systems User Interface Unit (courtesy of Utility Systems)
UCT MASTERS THESIS CASE STUDY REVIEW OF ADVANCED WATER METERING APPLICATIONS IN SOUTH AFRICA
MASTERS DISSERTATION | OCTOBER 2017 Page | (62)
For the municipality, billing is therefore not required since revenue collection from consumers on this system is recorded and done through said vendors. On the consumer side, the STS system is claimed to enable multiple and therefore more convenient non-proprietary vending options. These, per the manufacturer include use of already existing
• “electricity vendors,”
• “internet- based vending”,
• “cell phone vending”,
• “points of sale” and
• “bank hall vending”
Data Collection Hard and Software Interfaces
Per the manufacturer’s claim, these data collection systems can be scaled from basic walk by, drive by or fully automated remote reading systems. This is dependent on whether the data collector receiving transmissions from the WMD is fixed or periodic. This data collector then relays the information to a central server through a secondary communication network.
The same network and process is used for reverse directional commands or configurations sent to a single or multiple WMDS in the area.
The software interface enables field data download and interpretation into billing information or other meter data analysis records. According to the manufacturer, this system can support varying scales of area meter configurations be they local, municipal or otherwise.
The figure below from the manufacturer’s brochure shows examples of the different vending and communication components of this system explained above.
Figure 4: Vending and communication infrastructure of USC prepaid metering system (courtesy of Utility Systems)
UCT MASTERS THESIS CASE STUDY REVIEW OF ADVANCED WATER METERING APPLICATIONS IN SOUTH AFRICA
MASTERS DISSERTATION | OCTOBER 2017 Page | (63)
A list of other features, specifications and benefits to the service provider are also provided in the manufacturer’s brochure. With regard to conformance, these meters are claimed to be STS approved; and to have an average battery life of 10 years dependent on use.
Due to the varied components and functionalities of the USC system described above, the more specific components chosen by the municipality will be included in the project implementation section 5.4 below.
5.4 Project Implementation Process
A number of steps were involved in the project implementation process as described below.
Consumer awareness campaigns were carried out in which residents were both informed of the upcoming works as well as briefed of the preliminary processes that these roll outs would entail. For example during the 6th – 7th July 2013 weekend, IDM Council members including the Mayor were engaged in meetings in different wards to consult and address prepaid metering queries (iLembe District Municipality, 2013).
Among the preliminary processes were meter audits whose role was to update the customer list as well as identify illegal connections (Mathonsi, 2014). This audit involved field workers, typically hired from the municipality carrying out door to door campaigns to collect the necessary information for the meter database listed below. Note that the database information required as quoted below was obtained from iLembe District Municipality, 2013 text;
• “Stand or the “Erf/F” number”;
• “Personal detail and Id numbers of the Home owner”;
• “Marital Status of the Homeowner (A copy of the marital certificate will be required)”;
• “Number of persons living in the household;”
• “Proof of Income for all this that are employed and or receive Social assistance grant;”
• Contact details i.e. “Telephone number; Physical address and Postal address;
• “Water meter number”;
• “Details of Next of Kin/ one relative that does not live in the Household”; and
• “Preferred mode of communication with the iLembe District Municipality”
In addition to the above process, another data cleansing initiative carried out by the municipality was a 2012/13 contractual agreement between the municipality and a data house tasked with carrying out database cleansing (iLembe District Municipality, 2015b).
UCT MASTERS THESIS CASE STUDY REVIEW OF ADVANCED WATER METERING APPLICATIONS IN SOUTH AFRICA
MASTERS DISSERTATION | OCTOBER 2017 Page | (64)
Following the preliminary processes above, installation of the WMDs and required communication infrastructure to enable a drive-by approach to meter reading was then carried out (Mthembu, 2016). Note that in most cases the conventional Elster Kent meters were left in the ground and an addition of the aforementioned infrastructure made to them (Mthembu, 2016).
UIUs were also provided to consumers and different vending options for purchasing water credits similar to those of the prepaid electricity availed (Mthembu, 2016).
A one year defects liability/ warranty period formed part of the Service Level Agreement (SLA) for this Utility Systems prepaid metering system installed (Mthembu, 2016).
In the iLembe case study,
5.5 Benefits of the Prepaid System
As described above, the overall project results fell far below the municipality expectations and no benefits specific to the prepaid meters were observed in the case study. This is because most of the benefits of the prepaid system came from the meter audit process, which benefits can also be realised with conventional meters. These include the below;
• During the meter audit and replacement phases, bypassed, vandalised and faulty meters within the area were identified and repaired or replaced thus saving the utility further revenue losses.
• Short term job creation for municipal youth as field workers during meter audits were also availed (iLembe District Municipality, 2013).
• An update and reconciliation of the city’s meter database was also one of the benefits realised and this was a step towards improving billing efficiency and revenue collection.
• An overall reduction in water losses was realised due to the improved metering and subsequent area zoning for leak detection.
5.6 Challenges Encountered
Although initially sold as a solution to many of the municipality problems, it was soon realised that the prepaid metering system installed came with a significant number of challenges (Mthembu, 2016). In some instances, because the sanitation system charges are tied to water consumption and thus both conventional and prepaid meter readings, the challenges in obtaining the prepaid meter consumption readings for sanitation charges usage have also been highlighted. These challenges are divided into the Economic, Administrative, Technical and Social subsections expounded below.
UCT MASTERS THESIS CASE STUDY REVIEW OF ADVANCED WATER METERING APPLICATIONS IN SOUTH AFRICA
MASTERS DISSERTATION | OCTOBER 2017 Page | (65)
Economic challenges
The different economic challenges faced during implementation as well as after it included the following;
• Shortly after the roll-out of prepaid meters, the iLembe municipality embarked on a new policy of charging for sanitation. Where previously a constant rate based on property value had been charged for sanitation, the municipality now opted to use a percentage of water consumed as the basis of sanitation charges. This meant that particularly large households whose prior water consumption had no impact on their sanitation charges now faced increments of double or more compared to their previous state. In some instances, these households would therefore struggle to pay these increased charges and thereby accrue municipal debts. It was therefore difficult to realize the reduction in debt accruement as a result of these prepaid meter installations and in fact an increase in the municipal debt book was instead realized (Mthembu, 2016).
• The maintenance cost of the prepaid system for the same area as conventional has been noted to be significantly higher. This can be partly attributed to the significant number of failure rates just shortly after the warranty period that required the municipality to purchase new prepaid metering units (Mthembu, 2016). Even in instances where repairs are done, due to the increased components of these meters compared to conventional ones, this repair process is often more resource intensive in terms of staff, funds and frequency of maintenance requirements than the conventional one.
• In spite of the hope that behavioural changes would occur whereby consumers would be forced to pay for their consumption, it was realized that illegal connections even where these prepaid meters were installed were being made in many instances. As such, no drastic improvement in the payment for water services could be realized (Mthembu, 2016).
• The increased logistical requirements needed to make this system work for example management of credit vendors, manual checks of the system sometimes required for water balancing purposes and others have also placed an additional cost burden on the municipality (GIBB, 2015 & Mthembu, 2016).
Administrative Challenges
Various administrative challenges were faced with implementation of this technology some of which included the following:
• As stated above, the use of the water consumption amounts to calculate sanitation rates therefore highlighted some of the issues/problems with this prepaid metering system for example, time savings in billing were not realised as anticipated with the drive by system. This is because the field data has to be
UCT MASTERS THESIS CASE STUDY REVIEW OF ADVANCED WATER METERING APPLICATIONS IN SOUTH AFRICA
MASTERS DISSERTATION | OCTOBER 2017 Page | (66)
sent to the supplier for interpretation before it can be fed into the municipal billing system and it can take up to 3 days for the supplier to respond (Mthembu, 2016).
• The added step described above in which the supplier is required to interpretfield data collected has also resulted in a lengthier and less conducive process toidentifying discrepancies in billing accounts. This is because this time lag limitsthe time available to the municipality to carry out field verification of anyanomalies noted in the billing records and thus often results in these works notbeing done (Mthembu, 2016). As such, the level of confidence in the sanitationbills currently sent out is much lower for the prepaid meters than theconventional one’s case.
• Due to the change in sanitation charges policy of iLembe from a flat rate to awater-dependent rate, increased water and sanitation costs resulted andtherefore more instances of illegal or bypassed connections were encountered.As such, maintaining accurate statistics of the indigents in iLembe is still difficultsince they retain the illegal connection and don't come forward to themunicipality (Mthembu, 2016).
• Again, the lengthier process in sanitation billing using prepaid meters providesmore opportunities for errors to occur in billing. This is because on pickingdrive–by data, the municipality has to first take it to the service provider forinterpretation which can take up to 3 days as mentioned above. Then when thisreport is returned from the service provider, it then has to be reformatted intothe Municipal billing system template (Moonsoft) from the Supplier’s format.Only after this reformatting and uploading onto the billing system can the databe uploaded onto the billing system and discrepancies detected (Mthembu,2016). By this time, not only has a significant delay of a week or longer passed,but also various changes of hands and thus multiple opportunities for errors tobe introduced in the data have also occurred.
• Poor record keeping and out-dated municipal billing and meter recordsnecessitated economic investments to be made in data cleansing and meteraudits before the roll out of these prepaid meters could be carried out(Mathonsi, 2014).
Technical Challenges
Some of the technical challenges experienced with this system are described as follows:
• Constant break-downs due to different component faults with the prepaidmeters have been experienced. This is particularly frustrating for themunicipality because as mentioned before, new meters therefore have to bepurchased where they fail just shortly after one year because their warranty/defects liability period has run out. This calls into question the value for money
UCT MASTERS THESIS CASE STUDY REVIEW OF ADVANCED WATER METERING APPLICATIONS IN SOUTH AFRICA
MASTERS DISSERTATION | OCTOBER 2017 Page | (67)
spent on these meters and has also highlighted the need for the warranty period to last longer than one year (Mthembu, 2016).
• Due to the significant technical failure rates above, there has been a corresponding significant increase number of consumer complaints and queries over these meters. As such, it is even more difficult to collect revenue or debts from consumers with a multitude of complaints particularly in cases where payment has been made and yet these consumers are unable to access their water due to technical issues or faults. The resource envelop (time and staff) required to deal with these varied issues is therefore also constrained meaning that there is a slow response time in attending to each consumer complaint (Mthembu, 2016).
• As explained above, the varied issues and increased consumer frustration with these prepaid meters has put them at risk of consumer tampering. This is especially true in because even the current meter bypasses are largely being picked up in "guess mode”; whereby only consumers who haven't purchased tokens or whose purchasing patterns are irregular are highlighted for illegal checks. This basing of illegal consumption on sales only means that those who continue to purchase water regularly but have bypasses and are thus consuming a lot more water than is purchased at home will never be captured by this system (Mthembu, 2016).
• Drive by data collection has also been observed to have significant challenges whereby in instances where cars are on top of the meters or other obstructions cause interruptions in transmission from data collectors, drive by readings for some meters may not be taken. This combined with the lengthy data interpretation and formatting process means that the un-captured meter readings will only be realised very close to billing time. This results in some houses not being charged their sanitation fees for long periods of time. Subsequent charging of these consumers with lump sums after long durations of time are not convenient in many instances and instead entrench quarrels and refusal to pay attitudes amongst them (Mthembu, 2016)
• The prepaid meters have multiple components each with significantly higher failure rates in comparison to conventional meters. For example approximately 80% of the UIUs installed as part of this study were found to be faulty from the time of installation and in need of replacement which the supplier did for free. However even a significant number of batteries were found to need replacement within the first year of installation in spite of the 10 year battery life claimed by the supplier. These high failure rates coupled with lack of satisfactory reasons being provided for said failures has resulted in an unwillingness to recommend this technology roll out to other municipalities (Mthembu, 2016).
UCT MASTERS THESIS CASE STUDY REVIEW OF ADVANCED WATER METERING APPLICATIONS IN SOUTH AFRICA
MASTERS DISSERTATION | OCTOBER 2017 Page | (68)
• Another widespread problem encountered in the use of these meters was the WMD automatic close off at the start of each month regardless of the water credits still available. Widespread complaints had been received in this regard necessitating a large number of meter repairs and/or replacements to be done as well as an inquiry from the municipality to the supplier as to why this technical fault was so rampant (Mthembu, 2016).
• Leakages on consumer pipes particularly where poor plumbing / installation works had been done were another problem experienced resulting in substantial background water losses being experienced (Mthembu, 2016).
• The vulnerability of prepaid meters to air in the pipe network is very high. In many instances, this has resulted in depletion of consumer credits by air instead of water in the system and thus premature cut off of consumer water supply in spite of the fact that water paid for was actually not used (Mthembu, 2016).
Social Challenges
As is the case with most infrastructure projects, social impacts and engagements are inevitable. For this case study, some of these social challenges experienced were as below:
• Frustration of customers with the multiple failures of these meters and the consequent interruptions to their supply. In some instances, some of the customers were even demanding for their old conventional meters back (Mthembu, 2016).
• In addition, due to the increased bills particularly from increased sanitation charges, high instances of vandalism and tampering were faced particularly in instances where lump sum bills or high debts were difficult for consumers to pay off (Mthembu, 2016).Increased visits to consumers were therefore necessary to deal with this.
• In some cases due to insufficient consumer education or awareness about the prepaid meters and their mode of work, confusion still persisted about their alignment with /dispensation of Free Basic Water (the water dialogues, 2008). This further negatively biased communities against the prepaid meters and municipality.
• In some instances, wrongful perceptions persisted of water being more expensive due to the installation of prepaid meters and yet increments in consumption could just be attributed to improved meter accuracy (Mthembu, 2016).
UCT MASTERS THESIS CASE STUDY REVIEW OF ADVANCED WATER METERING APPLICATIONS IN SOUTH AFRICA
MASTERS DISSERTATION | OCTOBER 2017 Page | (69)
5.7 Current Status of iLembe Prepaid Metering Project
The municipality currently has both prepaid as well as conventional metering systems running. Regardless of the significant issues faced with the prepaid meters, reversion back to the more reliable conventional meters would require significant investments to be made in terms of retrofitting and reconfiguring the network back to its old state since a number of the system piping (for example required pipe-length for prepaid installation compared to conventional) was modified to accommodate the prepaid WMDs. It is therefore not considered a cost effective solution at this time (Mthembu, 2016).
Another counter to the idea of reverting back to the old system is the argument that the prepaid meters are working well in high income gated communities. The implication of this, however unsubstantiated, is that the usage of these meter facilities in other low or middle income areas is at fault for their failure as opposed to the technology itself (Mthembu, 2016).
Although both in-house as well as contracted out teams are carrying out maintenance of the metering systems, USC has on occasion been given a number of defaulted meters and asked to explain why there were so many faulty meters. In these instances, they have often returned a portion of them which are fixed while others which had completely failed were returned but nothing beyond needing to replace them since the warranty period had ended was recommended to the municipality. The municipality thus feels no closer to understanding why the units on ground are failing and with the regularity at which they are failing (Mthembu, 2016).
The municipality would thus prefer to have a competitor on the advanced metering market who will either offer a more durable product or alternatively force USC to improve their product as opposed to going back to the conventional system since consumers still do not want to pay for water (Mthembu, 2016).
5.8 Evaluation of Prepaid Metering in iLembe Municipality
Model Input Parameters
The input parameters used to calculate the indicators for the evaluation factors were obtained from various sources and are discussed in this section under the headings of ‘global parameters’, ‘existing system’ (which caters for the situation before new meter implementation) and ‘proposed scheme’ (which caters for both the new conventional and new advanced metering systems proposed). The input parameters are given in tables linked to the evaluation framework, which is provided in Appendix A.
5.8.1.1 Global Parameters
The global parameters used in the analysis are summarised in Table 11, with the values chosen, sources of information and a brief comment. A more detailed explanation of how these model values were selected is provided in the subsequent paragraphs. Since
UCT MASTERS THESIS CASE STUDY REVIEW OF ADVANCED WATER METERING APPLICATIONS IN SOUTH AFRICA
MASTERS DISSERTATION | OCTOBER 2017 Page | (70)
no exact number of prepaid meters installed was provided, this case study assumes 10 000 properties to be the pilot study area.
The number of properties is based on the maximum number of properties that can be used for a pilot study in an area in the absence of a conclusive number of meters installed in this area.
The water cost price is based on the proposed 2013/2014 average bulk portable tariff of R4.70/Kl for Umgeni Water Board which supplies this area with water (DWA, 2014).
The applicable water tariff of R5.40 /kl is based on the current iLembe District Municipality Water and Sewerage Tariffs 2016/2017 for the 2nd tier of conventional domestic consumption after Free Basic Water (iLembe District Municipality, 2016).
Table 11: Global Parameters for iLembe District Municipality No Parameter Value Source Comment 2.1 Number of
properties 10,000 Pilot study source
2.2 Water cost price
R5/kl DWA, 2014 Based on average bulk portable tariff
2.3 Applicable water tariff
R5.40 /kl
iLembe District Municipality, 2016
From iLembe District Municipality Water and Sewerage Tariffs 2016/17. 10 kl free = R0 5 kl at R16.20 / kl = R81 Thus the total cost for 15 kl is R81.00 which gives an average tariff of R5.40 / kl
UCT MASTERS THESIS CASE STUDY REVIEW OF ADVANCED WATER METERING APPLICATIONS IN SOUTH AFRICA
MASTERS DISSERTATION | OCTOBER 2017 Page | (71)
5.8.1.2 Existing System (Situation before Metering system upgrade)
This section describes the situation before the metering system upgrade. The values used are summarised in Table 12 below.
No Parameter Value Source Comment
3.1 Billed metered consumption
9,300 properties
GIBB,2015 Based on 7% tampering rate & thus 93% billed rate
3.1 Billed metered unit consumption
15 kl/property /month
Viljoen, 2015 & iLembe District Municipality, 2015a
3.3 Illegal or unbilled connections
700 GIBB, 2015 Based on 7% tampering rate
3.3 Illegal connections unit consumption
15 kl/property /month
N/A Same as 3.1 above
Fraction of properties paying for water 3.5 Billed metered
consumption 31% iLembe District
Municipality, 2015b
Baseline value provided in iLembe District Municipality, 2015b report
Other parameters before Advanced Meter Implementation 3.8 Fraction of demand
that is on-site leakage 6% De Sousa-Alves,
2013 Retained from CoCT due to the absence of iLembe information.
3.9 Ave time between meter readings (months)
1 Mthembu , 2016 Adopted since congruent with monthly billing cycles.
3.10 Meter reading cost R8 /meter Otieno, et al., 2002 & Saayman, 2016
Adopted since congruent with 8.43 value provided for Umgeni Water Board
3.11 Billing cost R10 /bill GIBB, 2015 Inclusive of administrative, printing and postage costs.
3.12 Meter operation & maintenance cost
R7/meter/month Otieno, et al., 2002 & capital cost estimate
Fraction of meters failing due to 3.13 Meter failure (/year) 5% Wendell,2016 Retained from CoCT
due to the absence of iLembe information.
3.14 Vandalism and other (/year)
2% Wendell, 2016 Retained from CoCT due to the absence of iLembe information.
3.16 Average household income (/month)
R5 000 /month Statistics South Africa, 2012b
Based on Census 2011 Municipal Results for KZN
Table 12: Water Consumption before Advanced Meter Implementation
UCT MASTERS THESIS CASE STUDY REVIEW OF ADVANCED WATER METERING APPLICATIONS IN SOUTH AFRICA
MASTERS DISSERTATION | OCTOBER 2017 Page | (72)
No Parameter Value Source Comment
3.17 Unemployment rate 31% Statistics South Africa, 2012a
Based on Census 2011 iLembe District Results
3.18 Volatility of community (No of protest or mass action incidences per year)
15 Centre for Civil Society , 2016
Social Protest Observatory records 2016.
Only 93% of the 10,000 properties were assigned to billed metered consumption as per the GIBB, 2015 report average of 7% tampering rate of conventional meters in rural and low income areas (GIBB, 2015).
Consequently, 7% of the 10,000 properties were assigned to illegal consumption to account for the said 7% tampering rate above (GIBB, 2015).
In the absence of consumption information, billed metered unit consumption was based on comparison of two sources. The iLembe Municipality average monthly consumption values for billed authorized consumption over a 6 year period [July 2009 - May 2015] (iLembe District Municipality, 2015a) and unit consumption value of 0.5 kl/day for low income category of single households surveyed in the Viljoen, 2015 study of Cape Town. For iLembe municipality, the average area value given (approx. 750,000 kl/month) was divided by the total number of connections (34,632) given in the system characteristics and downscaled to also account for consumer and other industrial/institutional amount (iLembe District Municipality, 2015a).This reduced value fitted closer with the CoCT domestic consumption and was thus adopted with a reasonable level of confidence.
A fraction of billed metered properties paying for water of 31% was adopted from the baseline value given for the proportion of consumers paying in full versus the number of consumers billed in iLembe District Municipality, 2015b report.
The fraction of demand that is on-site leakage of 6% based on an estimate of on-site leakage in residential areas made by the City of Cape Town (De Sousa-Alves, 2013) was adopted here due to the absence of information from iLembe Municipality in this regard.
The R8 /meter value for meter reading cost for the City of Cape Town (Saayman, 2016) was maintained here since it is congruent with 8.43 value provided as administration cost/connection/month for Umgeni Water Board which serves the iLembe municipality area (Otieno, et al., 2002).
It was not possible to get a billing cost value from iLembe Municipality. However from a feasibility study for eThekwini, billing costs were estimated as R10 per month per meter (GIBB, 2015) made up of R 6 administrative cost, R 1 printing cost and R 3 postage cost. This estimated R10 /bill was thus adopted as the billing cost for iLembe Municipality which is close to this area.
UCT MASTERS THESIS CASE STUDY REVIEW OF ADVANCED WATER METERING APPLICATIONS IN SOUTH AFRICA
MASTERS DISSERTATION | OCTOBER 2017 Page | (73)
To estimate the typical meter operation and maintenance costs, the overall sum of R22/connection/month operating and maintenance costs for Umgeni water schemes (Otieno, et al., 2002) was compared with the ratio of 15% of the overall capital cost of the conventional meter per annum. Since the exact details of what the above sum from Umgeni water schemes contains were unknown, the estimate of about R7 /meter/month as in the Cape Town conventional case was used.
The meter failure rate of 5% for conventional meters in the Cape Town case study (Wendell, 2016) was adopted here due to the absence of information from iLembe Municipality in this regard.
The failure rate due to vandalism and other reasons of 2% for conventional meters in the Cape Town case study was also adopted here (Wendell, 2016) due to the absence of information from iLembe Municipality in this regard.
The socio-economic characteristics for the Census 2011 Municipal Results for KZN state an average annual household income of R61 000 for iLembe district and this was thus divided by 12 to get R5 083; approximately R5 000/month for average household income (Statistics South Africa, 2012b).
Similar to the above, the unemployment rate of 31% was based on the Statistics South Africa, 2012a iLembe District Results and adopted as such.
About five protests / mass action incidents have been recorded in the Centre for Civil Society Social Protest Observatory as having occurred in iLembe district municipality just between January and April of 2016 (Centre for Civil Society, 2016). This indicates a high community volatility of approximately 15 incidents per year.
5.8.1.3 Proposed Scheme for Conventional Metering (baseline)
In the evaluation framework, the proposed scheme consists of two parallel categories, i.e. conventional and advanced metering. This is useful in evaluating the benefits of replacing the existing meters with advanced meters over conventional meters.
The parameters for the proposed conventional metering scheme are summarised in Table 13 and discussed in the rest of the section under the headings of ‘proposed system parameters’, ‘failure rates’, ‘costs’ and ‘expected consumption’.
No Parameter Value Source Comment Proposed system parameters 4.1 Meter make Variable including Elster
UCT MASTERS THESIS CASE STUDY REVIEW OF ADVANCED WATER METERING APPLICATIONS IN SOUTH AFRICA
MASTERS DISSERTATION | OCTOBER 2017 Page | (74)
No Parameter Value Source Comment 4.7 Meter service life
(years) 18 Van Zyl, 2011 & De
Sousa-Alves, 2013 Retained from CoCT due to the absence of iLembe information.
Fraction of meters expected to fail due to 4.9 Water meter
failure (/year) 5.0% Wendell,2016 Same as 3.13 above
4.11 Vandalism (/year) 2.0 % Wendell, 2016 Same as 3.14 above 4.12 Other(/year) N/A N/A Included in 4.11
above Costs 4.14 Meter price R500 /meter De Beer, 2010 Same as Cape Town
value 4.15 Installation cost R800 /meter Ngobeni,2016 4.17 Payment
infrastructure cost
R0 N/A Absorbed within billing cost
4.19 Meter reading cost
R8 /meter Otieno, et al., 2002 & Saayman, 2016
Same as 3.10 above
4.20 Meter operation & maintenance cost
R7 /meter/month N/A Same as 3.12 above
4.21 Billing cost R10 /bill GIBB, 2015 Same as 3.11 above. Expected New Consumption 4.24 Billed metered
consumption 10 000 properties
Viljoen, 2015 & iLembe District Municipality, 2015a
Same as 3.1 above
4.24 Billed metered Unit Consumption
15 kl/property/month N/A
4.26 Illegal consumption or unbilled connections
700 properties GIBB, 2015
4.26 Illegal connections unit consumption
N/A N/A
Fraction of Properties Paying for Water 4.29 Billed metered
consumption 31% iLembe District
Municipality, 2015b Same as 3.5 above
4.31 Ave time between meter readings
1 per month Mthembu,2016 Same as 3.9 above
a) Proposed System Parameters
• iLembe municipality indicated the Elster Kent meter as one of the various conventional meter makes and models in the district (Mthembu, 2016).
UCT MASTERS THESIS CASE STUDY REVIEW OF ADVANCED WATER METERING APPLICATIONS IN SOUTH AFRICA
MASTERS DISSERTATION | OCTOBER 2017 Page | (75)
However, regardless of make and model, all the newly installed conventional meters can be assumed to all be SANS 1529-1 compliant.
• The value for SANS 1529-9 compliance was omitted from Table 13 since it deals with requirements for electronic indicators that in most cases are not part of a typical conventional meter.
• A conventional meter service life of 18 years was adopted as in the Cape Town case study due to the similarity in conventional meters used as well as the absence of information from iLembe Municipality in this regard.
b) Failure Rates
• In assessing the water meter failure rate a value of 5% meter failure per year as in Section 5.8.1.2 above was used (Wendell, 2016).
• The values of 2% failure per year due to vandalism and other causes were also adopted as in Section 5.8.1.2 above (Wendell, 2016).
c) Costs
• The typical conventional meter price used of R500 /meter was adopted from the Cape case study since the conventional meters used in both municipalities are the same.
• No information on the installation cost of conventional meters in iLembe could be found. As such, an estimate of R800 / meter per municipal staff experience in the Pretoria case study was adopted here to account for all the materials and labour required for meter installation.
• Since the administrative portion of the billing cost is expected to cover all payment system operational costs, no payment infrastructure costs are expected.
• The meter reading, billing and meter operation and maintenance costs were adopted from the existing values discussed in Section 5.8.1.2.
d) Expected New Consumption
• All 10 000 properties were assigned to billed metered consumption based on the assumption that all illegal connections in the existing system above would be discovered and rectified in the new scheme
• As inferred above, none of the 10 000 properties were assigned to illegal consumption to account for corrective measures taken with the new scheme.
• Since it was difficult to determine whether the changes in unit consumption were attributed to leakages or improved meter accuracy, domestic consumption was assumed to remain unchanged (Mthembu, 2016).
• The fraction of billed metered consumption properties paying for water of 31% was adopted here as in the existing section 5.8.1.2 since in both cases, conventional meters are used (iLembe District Municipality, 2015b).
UCT MASTERS THESIS CASE STUDY REVIEW OF ADVANCED WATER METERING APPLICATIONS IN SOUTH AFRICA
MASTERS DISSERTATION | OCTOBER 2017 Page | (76)
5.8.1.4 Proposed Scheme for Advanced Metering
Table 14 summarises the parameters for the Utility Systems prepaid meters installed as additional features to existing meters in the iLembe municipality pilot area.
More detailed information on the parameters for this prepaid advanced metering scheme are discussed in the rest of the section under the headings of ‘proposed system parameters’, ‘failure rates’, ‘costs’ and ‘expected consumption’.
No Parameter Value Source Comment Proposed System Parameters 4.1 Meter make Prepaid Drive by Meter Mthembu,
2016
4.2 Meter model Variable conventional models all fitted with Utility Systems Prepaid metering components
Mthembu, 2016
4.3 SANS 1529-1 compliant?
True Meets legal requirements
4.4 SANS 1529-9 compliant?
True Meets legal requirements
4.5 Mean battery life (years)
10 years Utility Systems,2013
Adopted from manufacturer’s brochure in the absence of more pertinent field information.
4.6 Battery replaceable in field?
True Mthembu, 2016
Preference for modular units
4.7 Meter service life (years)
7 years GIBB, 2015 & Pontia, 2016
Fraction of meters expected to fail due to 4.9 Water meter
failure 5.0% Wendell, 2016 As in Section 5.8.1.3
above 4.10 Electronics and
other components (e.g. valve) failure
7.5% Wendell, 2016 Adopted from Cape Town due to absence of information from iLembe municipality in this regard
4.11 Vandalism 10.0% GIBB, 2015 4.12 Other N/A N/A Included in 4.11 above Costs for Advanced Metering 4.14 Meter price R1 210 /meter GIBB, 2015 Summation of WMD &
UCT MASTERS THESIS CASE STUDY REVIEW OF ADVANCED WATER METERING APPLICATIONS IN SOUTH AFRICA
MASTERS DISSERTATION | OCTOBER 2017 Page | (77)
No Parameter Value Source Comment 2002
4.16 Communication infrastructure cost
R 10 000 GIBB, 2015 & Mthembu, 2016
Based on unit price of R2 500 for each mobile data collector and once-off installation costs of R2 500 for system.
4.18 Battery replacement cost
R220 /meter Made in China.com, 2016 & GIBB, 2015
Estimate from product price list
4.19 Meter reading cost N/A N/A No reading required since it is a prepaid metering system.
4.20 Meter operation & maintenance cost
R25 /meter/month N/A Based on overall capital cost of each meter
4.21 Billing cost N/A N/A No billing required for this prepaid system
Expected new Consumption for Advanced Metering 4.24 Billed metered
consumption 9,000 properties GIBB, 2015 90% of assumed pilot
area properties 4.24 Billed metered
unit consumption 15 kl/property/month N/A Same as existing case
4.26 Illegal consumption
1,000 properties GIBB, 2015 Following from 4.24 above
4.26 Illegal connections unit consumption
15 kl/property/month N/A
Fraction of Properties Paying for Water 4.29 Billed metered
consumption 39% Mathonsi, 2014
4.31 Ave time between meter readings (months)
N/A N/A No billing required since this is a prepaid system
a) Proposed System Parameters
• The meter make and model chosen for this pilot scheme was the Utility Systems Prepaid metering drive by technology (Mthembu, 2016).
• Both SANS 1529-1 and SANS 1529-9 compliance are applicable to advanced metering technology and therefore it is a legal requirement for the advanced meters to comply with these standards. The system and meters installed complied with these standards in all cases.
• A mean battery life of 10 years as claimed by the manufacturer and per the warranty period consequently provided for it was adopted here (Mthembu, 2016).
UCT MASTERS THESIS CASE STUDY REVIEW OF ADVANCED WATER METERING APPLICATIONS IN SOUTH AFRICA
MASTERS DISSERTATION | OCTOBER 2017 Page | (78)
• A modular unit which allows the battery to be replaceable in the field was thepreferred option installed in this case for improved maintenance andoperational cost management.
• A meter service life of 7 years for the prepaid system was adopted from theCape Town information and GIBB, 2015 value for prepaid meters due to lack ofany information from iLembe municipality in this regard and also because the15mm WMDs in use in CoCT are from the same supplier (Pontia, 2016).
b) Failure rates
• In the absence of information from iLembe municipality, the 5% meter failurerate obtained from CoCT was retained here. This is because this rate was closeto the 3.6% per year failure rate mentioned in Singh, N & Xaba, B., 2006Operation Gcin’ Amanzi case study on prepaid meter use in Johannesburg citedin the GIBB, 2015 report.
• Similarly, the electronics and other components (e.g. valve) failure rateparameter of 7.5% from CoCT (Wendell, 2016) was also retained in the absenceof any information from iLembe municipality in this regard.
• Per GIBB, 2015 study in eThekwini, there is an increased probability oftampering of conventional systems with water management devices in low costhousing areas. A 2015 value of 43% probability of failure per year due tovandalism and other causes was given for eThekwini (GIBB, 2015). This valueseems quite high and so, in the absence of information on vandalism of thesedevices from iLembe, an estimate of 10% failure per year due to vandalism andother causes was adopted as in the Cape Town WMD case study.
c) Costs
• The typical advanced meter price adopted was R1 210 /meter based on the sumof the USC meter and UIU unit costs obtained from the GIBB, 2015 study. Thisstudy included an assessment of different suppliers ‘s meter types andassociated costs for use in eThekwini municipality (GIBB, 2015) and the abovevalue was thus adopted in the absence of information from the municipality inthis regard.
• In obtaining the installation cost, a comparison between GIBB, 2015 value of 1500 as well as Cottle, et al., 2002 values of 1 200 for installation was made. The1 200 value was adopted since it more closely coincides with the value thatwould be obtained if a similar approach as that taken in the proposedconventional metering case was used to determine the installation cost of theprepaid meters.
• For communication infrastructure costs, the different unit process provided inthe GIBB , 2015 report for eThekwini suggest an approximate sum of aboutR35 000 which includes the unit prices for a mobile data collector and once-off
UCT MASTERS THESIS CASE STUDY REVIEW OF ADVANCED WATER METERING APPLICATIONS IN SOUTH AFRICA
MASTERS DISSERTATION | OCTOBER 2017 Page | (79)
installation costs provided for third party hosts for example Blue Label, net Vendor and Easy Pay (GIBB, 2015). However, because of the STS compliance of the USC prepaid meters, advantages in terms of making use of the existing prepaid electricity vending systems used in iLembe could be achieved (Mthembu, 2015). To take this into account, the value of R5 000 Based on unit price of R2 500 for each mobile data collector and once-off installation costs of R2 500 for system) was considered for one mobile data collector. Purchase of at least 2 additional mobile data units therefore resulted in a total cost of R10 000 which was therefore adopted here.
• The payment infrastructure cost was omitted from the table since the UIU unit cost was included in the overall meter price in 4.14.
• The battery replacement cost of R220/meter used in the Cape Town case studies was retained here since no information was obtained from iLembe municipality in this regard (Made in China.com, 2016 & GIBB 2015).
• The meter reading cost was considered inapplicable here since it is a prepaid metering system and so no meter readings were required for water, only sanitation which is outside the scope of this evaluation framework.
• The R25 /meter/month of Epping CoCT was retained here as the meter operation and maintenance cost due to the similarity of physical and communication infrastructure installed in both areas and also in the absence of information from iLembe municipality in this regard.
• The billing cost was as in the meter reading cost case considered inapplicable to this prepaid metering system.
• No additional communication system operating costs are expected since all communication costs were included in the 4.16 item and can alternatively form part of the existing iLembe vending system used.
d) Expected Consumption
• Only 90% of the 10,000 properties were assigned to billed metered consumption to account for the 10% value assumed in 4.11 as the vandalism rate (GIBB, 2015).
• Conversely, 10% of the 10,000 properties were assigned to illegal consumption to account for said 10% tampering rate.
• The prepaid system was not expected to have any impact on unit consumption and thus it was assumed to be identical to the conventional metering system in Section 5.8.1.3.
• The 2013/2014 annual report (Mathonsi, 2014) indicated a 7-8% increment in bill collection resulting in an approximate 39% increment in properties paying for water compared to the previous year. This 39% was therefore adopted as
UCT MASTERS THESIS CASE STUDY REVIEW OF ADVANCED WATER METERING APPLICATIONS IN SOUTH AFRICA
MASTERS DISSERTATION | OCTOBER 2017 Page | (80)
the fraction of billed metered consumption properties paying for water (iLembe District Municipality, 2015b).
• The average time between meter readings per month was not applicable since this is a prepaid system and therefore requires no billing to be made.
Results
The four tables below provide the technical, social, environmental and economic results for the iLembe prepaid metering case study calculations based on the input parameter values above.
5.8.2.1 Technical Result
The technical results of the evaluation are summarised in Table 15 showing compliance with SABS standards for both conventional and advanced meters. However, the prepaid meters have over three times the failure rate of the conventional meters. These high failure rates are one of the main reasons for both the municipality and community’s frustration with the prepaid scheme.
No Property Conventional
metering (baseline) Advanced metering
1.1 SABS compliance Yes Yes
1.2 Number of meters to replace (/month) 58 188
5.8.2.2 Social Result
The social results are shown in Table 16 below. The water bill is estimated to be 3.2% of the community’s household income. While this value which is under 5% implies that the community will be willing to pay for water, the case study report still indicates a high level of non-payment and increasing municipal debt. Although some of this debt can be attributed to the increased sewer bills explained in the case study report, the non-payment also points to the fact that technology alone cannot change water use and payment behaviour. Other social interventions like improved community engagement and awareness campaigns, rapid customer query response time and others should be worked on as well.
2. SOCIAL
No Property Value
2.1 Current rate of meters vandalised (/year) 2.0%
2.2 Unemployment rate 31.0%
Table 15: Technical Result for case study in iLembe
Table 16: Social result of the Prepaid Case Study in iLembe
UCT MASTERS THESIS CASE STUDY REVIEW OF ADVANCED WATER METERING APPLICATIONS IN SOUTH AFRICA
MASTERS DISSERTATION | OCTOBER 2017 Page | (81)
2.3 Volatility of community (No of protest or mass action incidences per year) 15
2.4 Average water bill (/month) R162.00
2.4 Average property income (/month) R5,000.00
2.5 Water bill as a fraction of income 3.2%
5.8.2.3 Environmental Result
The environmental results are shown in Table 17 below.
No reduction in consumption was observed for either metering case. 1 000 batteries per year will require disposal in the prepaid metering case, as compared to the conventional one with no battery disposal requirements.
The economic results indicate that both schemes have a negative effective surplus and therefore are infeasible. However, the prepaid metering scheme at a capital cost of about R24 million compared to the conventional scheme of R13 million require almost twice the investment amount making them even more unfavourable.
It is important to note that in the evaluation framework above, a cost of R0 /kl was considered for the FBW consumption. As such, inclusion of a government subsidy amount equivalent to the first tier tariff for this 6kl FBW amount will change the economic results obtained since a new tariff amount of R16.20 / kl instead of R5.40 /kl as in the case above will be used. The new economic results donot differ much since both schemes as in the above case still have a negative effective surplus and therefore are infeasible.
The main benefit of the prepaid system is that it causes a slight improvement in the payment rates but not by a significant enough amount to warrant the increased operational and capital costs it imposes with a total capital cost of R24 million compared with R13 million for conventional metering.
5.9 Lessons Learnt
The overwhelming municipal experience with these prepaid meters is that contrary to the solution that they were sold as, their functionality on ground rather brought on more problems than had been anticipated. As such, although a solution is required to deal with failure to pay for municipal services, they would not recommend this system as it is to another municipality (Mthembu, 2016).
It was difficult for the municipality to ascertain the impact of this system on consumption. This is because in some instances increased consumption could be attributed to leakage or improved meter accuracy meaning the actual household consumption remains consistent (Mthembu, 2016).
Additionally, there was an increase in the debt book contrary to the reduction anticipated with the installation of prepaid meters (Mthembu, 2016).Although this can be largely attributed to increased sanitation rates, it is also believed that in some
UCT MASTERS THESIS CASE STUDY REVIEW OF ADVANCED WATER METERING APPLICATIONS IN SOUTH AFRICA
MASTERS DISSERTATION | OCTOBER 2017 Page | (84)
instances, illegal connections and tampering with the prepaid meters could have resulted in this (Mathonsi, 2014).
Typically, technological service improvements raise user expectations about the service delivery (the water dialogues, 2008).Consequently the various setbacks encountered with the prepaid meters created an increasing shift in municipal resource allocations to dealing with consumer queries and complaints rather than obtaining the increased revenue initially anticipated (Mthembu, 2016). Institutional capacity improvement to handle the increased consumer demands and expectations from advanced metering technology should therefore be critically considered before their implementation.
A previous case study on iLembe prepaid communal stand pipes emphasized the need for awareness and transparency in rolling out new metering technology. In particular, the varying levels of service in an area was mentioned as a cause of confusion and distrust among consumers for utility providers. As such, it is prudent for the municipality to ensure that extensive awareness and education campaigns are carried out prior to advanced meter installation. These campaigns should also clarify operation and maintenance responsibilities and who they fall to particularly with regard to fixing of leaks on the meters (the water dialogues, 2008)
UCT MASTERS THESIS CASE STUDY REVIEW OF ADVANCED WATER METERING APPLICATIONS IN SOUTH AFRICA
MASTERS DISSERTATION | OCTOBER 2017 Page | (85)
6 PREPAID METER INSTALLATION IN OLIEVENHOUTBOSCH, TSHWANE
6.1 Introduction
The City of Tshwane (CoT) is comprised of five administrative regions; the Southern, North West, Eastern, North East and Central regions (City of Tshwane, 2010). Water and sanitation maintenance works are however divided into 7 Regions; Regions 1 to 7 (Ngobeni, 2016). Of these regions, approximately 95% of consumption is monitored by conventional metering leaving 5% under prepaid metering (Ngobeni, 2016).
The prepaid meter roll out started in 2003 with a total of about 6 000 prepaid meters installed to date. The roll out was started as a pilot project in Olievenhoutbosch Extension 36 & 37, located in Maintenance Region 4 and it is here that these meters remain focused to the present day(Ngobeni, 2016).
Olievenhoutbosch is located in the Southern Region of City of Tshwane along with Centurion. It is one of the more formalized townships with an area of about 11.39 km2 housing a population of approximately 70 863 residents, 98% of whom are Black African (Statistics South Africa, 2012). Up to 87% of residents in the Southern region have access to piped water within their households (City of Tshwane, 2010).
The prepaid meters installed are largely domestic meters located above ground and they are programmed to dispense a 12 kl/month free basic water allocation to all users (Ngobeni, 2016). The main reason for installation of these prepaid meters was to assist in debt control by minimizing the non-revenue water losses to only FBW allocation (City of Tshwane, 2012b).Additionally, prepaid metering would be able to circumvent billing inefficiencies caused due to conventional meter readers’ failure to take and/or report actual physical meter readings (Ngobeni, 2016).
The section below will delve into more details about the project implementation process. A more detailed breakdown of this case study’s evaluation inputs and results is provided in Section 6.7 of this Chapter.
6.2 Project Implementation Process
The three main prepaid metering systems to choose from included the Communal standpipe type, the Domestic Wall mount and then the Domestic Above Ground type. This study focuses on the Domestic Above Ground metering used in Olievenhoutbosch which was chosen for easy monitoring by the municipality as well as easy credit loading and consumption tracking by the user (Ngobeni, 2016).
The process involved complete removal of conventional units and their subsequent replacement with the prepaid units. In addition, some of the supplier training options offered included (Ngobeni, 2016):
• “Full training for all aspects of system”
• “In field training for consumers”
UCT MASTERS THESIS CASE STUDY REVIEW OF ADVANCED WATER METERING APPLICATIONS IN SOUTH AFRICA
MASTERS DISSERTATION | OCTOBER 2017 Page | (86)
• “Follow up training ensuring efficient operation of system by all levels of staff”
However, before any particular meter was settled on, product specifications were formulated to guide the municipal procurement process. These requirements were made up of 3 main sections; Legal, Technical and Warranty. Among the Legal requirements was the compliance to the relevant SANS 1529 Trade Metrology Acts for Class C Meters as well as JASWIC (Joint Acceptance Scheme for Water Services Installation Components) acceptance (Ngobeni, 2016).
The technical specifications included requirement for 15mm diameter units with above ground plastic housing, compatibility with prepayment systems, inclusion of all appurtenant components i.e. the battery, shut off & non-return valves, computing unit & transmitting reed switch sensor all connected to the volumetric meter unit as well as different tokens required. Visibility of valve status, available allocation, battery life, leak detection & tamper detection on the remote display unit was also required (Ngobeni, 2016).
The warranty period specified for each unit was 1 year from delivery time (Ngobeni, 2016).
With the above requirements in mind, Elster Kent above ground meters were eventually chosen for the prepaid metering roll-out. The technical specifications of the chosen metering system are given in the section below.
6.3 Technical Specifications of Elster Kent Prepaid Metering System Installed
The Elster Kent Prepaid Metering system was a proprietary token based vending system. This meter consists of several features each of which contributes to its overall use:
• Domestic Water Dispenser
• Above-ground Meter Box
• Tokens
• Hardware System Components
• Cash Flow Management System
• System Requirements
• Management Information
• Prepaid Meter Display
A brief description of the above feature characteristics per the technical specifications used in procurement as well as the manufacturer’s claim are provided below.
Domestic Water Dispenser (DWD)
Class C meters of 15mm diameter and 114mm body length with 0.5 litres/pulse pulse output facilities were required. These dispensers were to have field replaceable lithium
UCT MASTERS THESIS CASE STUDY REVIEW OF ADVANCED WATER METERING APPLICATIONS IN SOUTH AFRICA
MASTERS DISSERTATION | OCTOBER 2017 Page | (87)
SAX1327L batteries as well as be fitted with Aquacity 25mm valves [SAX1136] and actuated valve replacement diaphragm mains [SAX1347- 48]. A replaceable control box & associated battery for this DWD was also required (Ngobeni, 2016).
Above-ground Meter Box
The meter box was to be constructed from UV stabilized plastic of at least 4mm thickness with approximate dimensions of ±800mm height; ±250mm width and ±100mm depth. Protection of soil ingress in form of a base plate on this meter box was required as well as use of washers and O-Rings to prevent leaks at the inlet and outlet box connections. Ability of the box to withstand external sitting, tilting or standing pressures exerted by users was to be ensured as well as internal protection for the consumer valve. To assist installation, the flow direction was to be indicated clearly on the box as well as a line showing the recommended installation depth. For readability, the box was to have a slot at the lid top for taking meter readings and this lid was to be fixed with tamper proof locks that allow only authorized municipal personnel to open them (Ngobeni, 2016).
A picture showing this meter box is provided below.
Tokens
Five different types of tokens exist for the Elster Kent prepaid metering system:
• Consumer Token,
• Maintenance Token,
• Management Token,
Figure 5: Prepaid Meter Above-ground box (Elster Kent, 2014)
UCT MASTERS THESIS CASE STUDY REVIEW OF ADVANCED WATER METERING APPLICATIONS IN SOUTH AFRICA
MASTERS DISSERTATION | OCTOBER 2017 Page | (88)
• Engineering Token and
• Vendor Token.
For this Pretoria case study however, only three of these tokens were specified i.e.
• Blue consumer tokens,
• Green maintenance tokens and
• Yellow engineering tokens,
Pictures of the tokens are shown below.
It was also specified that the token touch port on the meter box be of stainless steel ring design to enable easy data/credits transfer. This system was also required to be upgradable to walk-by or fixed network AMR systems with the ability of performing upgrades without removing the meter box from the installation (Ngobeni, 2016).
The token benefits claimed by the manufacturer include the following;
• “Read/write token with non-volatile memory” (Elster Kent, 2014)
• “Ensures transfer of up to date info of usage” (Elster Kent, 2014)
Figure 6: Consumer Token (Elster Kent, 2014)
Figure 7: Maintenance Token (Elster Kent, 2014)
Figure 8: Engineering Token (Elster Kent, 2014)
UCT MASTERS THESIS CASE STUDY REVIEW OF ADVANCED WATER METERING APPLICATIONS IN SOUTH AFRICA
MASTERS DISSERTATION | OCTOBER 2017 Page | (89)
• “Data retention over 10 years” (Elster Kent, 2014)
• “Resistant to extreme environmental conditions i.e. shock and temperature (-20°to +70° C)” (Elster Kent, 2014)
• “Information stored includes: Account no., Credit Remaining, Consumptionprofile, Leak and tamper icons, Last meter reading, Programmed information.”(Elster Kent, 2014)
Hardware System Components
Per the manufacturer’s claim, the main hardware system components are comprised of a Tamper switch, Isolating latching valve, Pulse output meter and Electronic module. Benefits of these system components according to the manufacturer include (Elster Kent, 2014):
• “Quality proven components”
• “Ease of installation (no fittings needed)”
• “Pulse output water meter approved to Class C”
• “Electronics water resistant to IP 67”
• “Electronic totalizer with 0.5l resolution”
• “Up to 7 years battery life”
Cash flow Management System
This can be quite a complex system depending on the size or extent of the prepaid metering installation project. According to the manufacturer, it is possible for this to be a central system that houses information on multiple villages/areas whose consumers make use of multiple work stations. This can be by aggregating collected village/area databases, consumer databases and vendors’ databases. The information contained therein can be used for generation of reports on Consumer Sales as well as other pertinent Administrative and Access control system information required (Elster Kent, 2014).
System Requirements
Specified hardware and software form the system requirements for vending and monitoring of the installed meters. The hardware requirements per the manufacturer’s claim include; “PC with Pentium or higher processor, 512 MB DDR2 memory, 80 GB hard-disc drive, VGA or higher resolution monitor, Microsoft mouse or compatible pointing device, Printer & keyboard,2 open serial or USB ports and external drive/CD writer”. The system software however includes “Windows 95, 98, 2000 or NT”. To make good use of these requirements however, staff should be trained in the different aspects for use (Elster Kent, 2014).
UCT MASTERS THESIS CASE STUDY REVIEW OF ADVANCED WATER METERING APPLICATIONS IN SOUTH AFRICA
MASTERS DISSERTATION | OCTOBER 2017 Page | (90)
Management Information
The information obtained from these prepaid metering systems that enables easy municipal monitoring and/or management includes; Monthly and daily sales analysis, Consumer profiles of monthly consumption, Reporting of discrepancies and logging of maintenance activities (Elster Kent, 2014).
Prepaid Meter Display
Before information is recorded and stored by the token and management systems, the meter display is able to indicate some of the following according to the manufacturer claims; “Credit remaining, Leak detection, Tamper detection, Meter reading, Free water and amount remaining, Indication of tariff scale and R per m3” (Elster Kent, 2014).
UCT MASTERS THESIS CASE STUDY REVIEW OF ADVANCED WATER METERING APPLICATIONS IN SOUTH AFRICA
MASTERS DISSERTATION | OCTOBER 2017 Page | (91)
6.4 Benefits of the Prepaid Metering Implementation
Some of the benefits realised in the use of the prepaid metering system include the following:
i. Wide scale community acceptance of the system largely because lower fixedrates were charged for consumers on prepaid meters. This acceptance thereforeresulted in minimal vandalism of this infrastructure comparative to theconventional meters (Ngobeni, 2016).
ii. Reduced consumption was observed as a result of the prepaid meterinstallations and this aided water demand management efforts (Ngobeni, 2016).
iii. There was a reduction in the resources required for meter reading since theprepaid meters rendered this process irrelevant (Ngobeni, 2016).
iv. No billing was required and this in tandem with upfront payment for waterresulted in improved credit/debt control (Ngobeni, 2016).
v. New consumers connected to prepaid meters were exempt from a deposit forwater consumption further endearing these meters and the city to thecommunity (City of Tshwane, 2015).
However, in spite of the above, a number of challenges as discussed in the section below were also experienced in the prepaid metering roll-out process.
6.5 Challenges Encountered
The challenges experienced are sub-divided into the Technical, Social and Economic sub-sections below.
Technical Challenges
6.5.1.1 Failure Rates
The prepaid system has multiple components susceptible to failure. As such, it was realized that the failure rates of these prepaid meters was significantly higher than that of the conventional ones (Ngobeni, 2016).
6.5.1.2 Repair & Replacement Works
The prepaid system has a higher level of complexity compared to conventional metering. As such, even as modular units with batteries replaceable in the field were obtained, in some instances the whole unit had to be replaced when one component was damaged. This was to avoid instances where tampering of other components may be caused in due course of replacing damaged ones (Ngobeni, 2016).
6.5.1.3 Water Losses
One of the problems realized was that meters in some instances failed in the open position. This resulted in large volumes of unrecorded water being availed to the
UCT MASTERS THESIS CASE STUDY REVIEW OF ADVANCED WATER METERING APPLICATIONS IN SOUTH AFRICA
MASTERS DISSERTATION | OCTOBER 2017 Page | (92)
consumer particularly since failures of this nature would rarely be reported to the municipality as opposed to instances where meters failed in closed position (Ngobeni, 2016). Increased NRW was therefore realized in these open position failure scenarios.
6.5.1.4 Health & Safety risks
In instances where meters failed in the closed position, increased fire risks were imparted on consumers (Ngobeni, 2016).
6.5.1.5 Leak & Tamper Detection
It was realized that since meter readings were not required for this prepaid system, field detection of leakages, tampering and vandalism on site was not being done and therefore further increasing water losses (Ngobeni, 2016).
Furthermore, the tampering detection facility as was the case in iLembe also works based on sales whereby only consumers whose purchase of water patterns reduce or vary dramatically will be flagged for an illegal or tampering check (Ngobeni, 2016). This leaves the system vulnerable to abuse in other ways.
6.5.1.6 Consumption Monitoring
Since tokens are used to purchase water, it is difficult to monitor individual consumption patterns consumers since this would require tracking of the individual token purchases, their frequency of use and then conversion of these purchases to consumption values (Ngobeni, 2016).Since this type of exercise has not been embarked on, the accuracy in demand monitoring and water balancing has been affected.
Social Challenges
The different social challenges faced in the use of the prepaid metering are explained below.
6.5.2.1 Vending
There is only one vending station and due to the working hours of municipal vendors employed therein, consumers are unable to purchase water credits after hours or during weekends. They would therefore have to interrupt their schedules to purchase water during the business hours or do without water in cases where it run out after these times (Ngobeni, 2016). Health and safety risks were therefore inevitable in these cases as well as unsatisfied consumers with multiple complaints.
6.5.2.2 O&M Capacity
There is a lack of sufficient staff to handle the increased meter failure frequencies and consequent maintenance requirements resulting in delayed responses to customer complaints. Currently, only one team is trained to carry out the prepaid meter repairs and therefore no back up capacity for this team is available. Efforts to have more teams that can deal with these repairs are therefore being made (Ngobeni, 2016).
UCT MASTERS THESIS CASE STUDY REVIEW OF ADVANCED WATER METERING APPLICATIONS IN SOUTH AFRICA
MASTERS DISSERTATION | OCTOBER 2017 Page | (93)
Economic Challenges
Some of the economic challenges encountered in use of the prepaid metering system are highlighted below;
6.5.3.1 Limited Purchases
The presence of only one main vending station with limited working hours restricts the amount of water credit purchases made (Ngobeni, 2016). This therefore reduces the revenue stream that would otherwise be obtained from these prepaid meters if multiple vending options were available.
6.5.3.2 Tariff Application
Application of a rising block tariff to prepaid meters was found to be problematic. This is because consumption measurements are not made for payments made upfront and yet these measurements form the basis of rising block tariff application. As such a fixed rate was therefore applied regardless of volumes purchased resulting in the prepaid meters being cheaper than conventional ones. The revenue that would otherwise have been made from both water as well as sanitation charges levied as 10% of the water consumed is thus curbed (Ngobeni, 2016).
6.5.3.3 Maintenance Intensive
Due to the increased complexity of prepaid metering, more staff and resources are required to adequately maintain the system increasing the operation and maintenance costs required at the municipal level (Ngobeni, 2016).
6.5.3.4 Capital Costs
The capital costs of the prepaid metering system are significantly higher than those of conventional metering therefore imposing an additional cost burden on the municipality (Ngobeni, 2016).
6.5.3.5 Open Position Failure
As mentioned 5.5.1 above, device failure in the open position results in large volumes of water being supplied to the consumer regardless of credit availability. As such, significant revenue is lost from this unregistered water (Ngobeni, 2016).
In light of all the aforementioned challenges and Section 6.4 benefits, a status update on the current prepaid metering situation in Olievenhoutbosch is given in the section below.
6.6 Current Status of Prepaid Metering Installation in Olievenhoutbosch
Continued roll out of prepaid meters is being carried out in Olievenhoutbosch due to popular demand. This is largely due to the fact that the tariffs since the time of the first pilot in 2003 have not been changed to-date making these meters significantly cheaper than conventional meters whose tariffs are typically revised every year. As such, planned
UCT MASTERS THESIS CASE STUDY REVIEW OF ADVANCED WATER METERING APPLICATIONS IN SOUTH AFRICA
MASTERS DISSERTATION | OCTOBER 2017 Page | (94)
changes to these tariffs with R2-3 increments in the current tariffs imply that there may be a social outcry since the current preference for these prepaid meters is largely tagged to their affordability (Ngobeni, 2016).
Regarding operation and maintenance, currently only one team has been trained to manage these meters, and thus no stand by team is available to work when this team is off-duty for example during night shifts or in other emergency cases. Efforts to therefore train at least 2 to 3 teams in dealing with the prepaid meter issues are thus being made to provide the necessary assistance (Ngobeni, 2016).
From Section 6.3 above in which some of the specifications used for the prepaid metering system at the time of tender in 2003 are given, it is evident that current innovations/improvements in the advanced metering industry offer more robust technologies to utilities that were not available in 2003.New specifications that require STS-compliance to diversify the vending options available as well as IP68 water resistance and other more durable meter characteristics are now used when purchasing newer models of these prepaid meters (Ngobeni, 2016).
6.7 Evaluation of Prepaid Meter Installation in Olievenhoutbosch, Tshwane
Model Input Parameters
The input parameters used to calculate the indicators for the evaluation factors were obtained from various sources and are discussed in this section under the headings of ‘Global Parameters’, ‘Existing System’ (which caters for the situation before new meter implementation ) and ‘Proposed Scheme’ (which caters for both the new conventional and new advanced metering systems scenarios proposed). Appendix A contains detailed descriptions of each parameter as well as typical values that can be adopted where specific parameters required for the area under investigation are unknown.
6.7.1.1 Global Parameters
The global parameters used in the analysis are summarised in Table 19, with the values chosen, sources of information and a brief comment. A more detailed explanation of how these model values were selected is provided in the subsequent paragraphs. The rollout of 6 000 prepaid meters in Olievenhoutbosch to date (Ngobeni, 2016) was considered as the project scope for this evaluation.
No Parameter Value Source Comment 2.1 Number of
properties 6 000 Ngobeni, 2016
2.2 Water cost price R8.00 /kl
De Sousa-Alves, 2013 & City of Tshwane, 2015
2.3 Applicable water R6.75 CoT, 2016 CoT Water and Sanitation Tariffs.
Table 19: Global Parameters
UCT MASTERS THESIS CASE STUDY REVIEW OF ADVANCED WATER METERING APPLICATIONS IN SOUTH AFRICA
MASTERS DISSERTATION | OCTOBER 2017 Page | (95)
tariff /kl 12 kl free = R0 6 kl at R16.23 / kl = R97.38 2 kl at R18.78 / kl = R37.56 Thus the total cost for 20 kl is R134.94 which gives an average tariff of R6.75 / kl
2.4 Billed unmetered tariff (R/month)
N/A City of Tshwane, 2015 This denomination does not currently exist under the city tariff structure
• The number of properties is based on the total number of prepaid meters in Tshwane as per October 2016 (Ngobeni, 2016).
• For the water cost price, since the R8.00/kl value used in the other Cape Town case studies is quite close to the City of Tshwane July 2015 - June 2016 bulk water supply cost of R7.49/kl (City of Tshwane, 2015), the previous approximation of R8.00/kl was retained here.
• The applicable water tariff of R6.75 /kl is based on the on a weighted average of the 1st & 2nd FBW tariff considerations as well as the 3rd and 4th tier tariffs of Water and Sanitation Tariffs effective from 1st July 2016 to 30th June 2017 for Scale B: Single dwelling households for both conventional and prepaid metering (City of Tshwane, 2016).
• All unauthorized consumption under the City of Tshwane, 2015 tariff structure refers to illegal connections and thus no billed unmetered tariff or denomination was considered applicable to this case study (City of Tshwane, 2015).
6.7.1.2 Existing System (Situation before Metering system upgrade)
This section describes the situation before the metering system upgrade. The values used are summarised in Table 20.
No Parameter Value Source Comment
3.1 Billed metered consumption
5 040 properties
City of Tshwane, 2010
3.1 Billed metered unit consumption
20 kl/property /month
City of Tshwane, 2009
Domestic consumption estimates
3.2 Billed unmetered consumption
N/A N/A
3.2 Billed unmetered unit consumption
N/A N/A
3.3 Illegal or unbilled connections
960 properties City of Tshwane, 2010
Based on remaining 6% of overall 6,000 properties
Table 20: Water Consumption before Advanced Meter Implementation
UCT MASTERS THESIS CASE STUDY REVIEW OF ADVANCED WATER METERING APPLICATIONS IN SOUTH AFRICA
MASTERS DISSERTATION | OCTOBER 2017 Page | (96)
No Parameter Value Source Comment
3.3 Illegal connections unit consumption
20 kl/property /month
City of Tshwane, 2009
Same consumption estimates as 3.1 above
Fraction of properties paying for water 3.5 Billed metered
consumption 69% Peters,2011 Based on non-payment
stats 3.6 Billed unmetered
consumption N/A N/A
Other parameters before Advanced Meter Implementation 3.7 Fraction of demand that
is on-site leakage 10% Van Zyl et al.,
2007; Lugoma et al., 2012
Average of on-site leakage in l/stand/day extrapolated over a month
3.8 Ave time between meter readings (months)
1 Ngobeni, 2016 Adopted since congruent with monthly billing cycles.
3.9 Meter reading cost R8 /meter Saayman, 2016 3.10 Billing cost R10 /bill GIBB, 2015 Inclusive of
administrative, printing and postage costs.
3.11 Meter operation & maintenance cost
R7 /meter/month
N/A Estimated as a ratio of overall capital cost.
Fraction of meters failing due to 3.12 Meter failure (/year) 5% Wendell,2016 3.13 Vandalism and other
(/year) 2% Wendell, 2016
3.14 Average household income (/month)
R15 200 /month
Parliament, 2012 Based on Census 2011 City of Tshwane Results
3.15 Unemployment rate 24% Parliament, 2012 Based on Census 2011 City of Tshwane Results
3.17 Volatility of community (No of protest or mass action incidences per year)
75 Centre for Civil Society , 2016
Social Protest Observatory records 2016.
• The 5 040 value for billed metered consumption properties was obtained by applying a factor of 84% to the overall 6 000 properties installed with prepaid meters as per the City of Tshwane IDP 2010 target of 84% meter reading/ billing efficiency per month in City of Tshwane (City of Tshwane, 2010).
• In the absence of billed metered unit consumption data for Olievenhoutbosch, an estimate had to be made. City of Tshwane, 2009 assumes an approximate consumption of 20kl/month for a typical subsidized household in the Gauteng area and this estimate was therefore adopted here.
• Since all 6 000 properties were assumed to be metered, the values for billed unmetered properties and their unit consumption were not applicable for this case study.
UCT MASTERS THESIS CASE STUDY REVIEW OF ADVANCED WATER METERING APPLICATIONS IN SOUTH AFRICA
MASTERS DISSERTATION | OCTOBER 2017 Page | (97)
• The 960 value for illegal or unbilled connections was obtained by applying the remaining fraction of 6% to the overall 6 000 properties on the assumption that this un-captured fraction represents these types of connections in Tshwane.
• A similar illegal connections unit consumption of 20 kl/property/month as in the billed metered unit consumption case was adopted in the absence of more conclusive information from City of Tshwane.
• In the absence of information from City of Tshwane in this regard, a fraction of billed metered properties paying for water of 69% was adopted as a representative value. This was based on the Stats SA 2005 percentage total of 31% of consumers with water debts for various reasons as plotted in the text (Peters, 2011).
• The fraction of billed unmetered properties paying for water was considered inapplicable since the consumption was considered to fall either under billed or illegal consumption category.
• The fraction of demand that is on-site leakage of 10% was taken as an average approximation from 2 studies of which investigation of on-site leakage forms a part. In Van Zyl, H.J., et al., 2007, a 2.5% value was extrapolated from the average of 5 – 28l/day per stand results of on-site leakage determined to form a part of the consumption levels study for selected South African cities (Van Zyl, et al., 2007). In a study done on the extent of on-site leaks in Johannesburg which neighbours Pretoria, established suburbs were determined to have approximately 25% on-site leakage translating to about 17kl/month (Lugoma et al., 2012). Since this case study deals with a low income area, an approximation between the two values above was taken to be 10%.
• The R8 /meter value for meter reading cost was obtained from the City of Cape Town (Saayman, 2016) and maintained in this case study in the absence of any information from Tshwane in this regard.
• It was not possible to get the billing cost from City of Tshwane. As such, the eThekwini study estimated value of R10/bill was thus adopted here as it was in the Cape Town case (GIBB, 2015).
• To estimate the typical meter operation and maintenance costs a ratio of 15% of the overall capital cost of the conventional meter per annum was used due to the absence of more conclusive information on this. An estimate of about R79.8 per annum and thus R6.65 /month was obtained, which value was rounded off to approximately R7 /meter/month as in the other case studies.
• The meter failure rate of 5% for conventional meters obtained from the Cape Town case study (Wendell, 2016) was retained here in the absence of information from City of Tshwane in this regard.
UCT MASTERS THESIS CASE STUDY REVIEW OF ADVANCED WATER METERING APPLICATIONS IN SOUTH AFRICA
MASTERS DISSERTATION | OCTOBER 2017 Page | (98)
• As above, the failure rate due to vandalism and other reasons of 2% for conventional meters from the Cape Town case study (Wendell, 2016) was also retained here in the absence of information from City of Tshwane in this regard.
• As stated in the socio-economic characteristics for City of Tshwane Parliament report, the average household income of R182 822 per annum which translates to approximately R15 200 /month as per the Census 2011 was adopted here (Parliament, 2012).
• Similar to the above, the unemployment rate of 24% based on the Census 2011 City of Cape Tshwane Results (Parliament, 2012) was adopted.
• Over 25 protest/ mass action incidents have been recorded in the Centre for Civil Society Social Protest Observatory as having occurred in different parts of Tshwane Pretoria just between January and April of this year 2016 (Centre for Civil Society, 2016). This indicates a high community volatility of approximately 75 incidents per year.
6.7.1.3 Proposed Scheme for Conventional Metering (baseline)
In the evaluation framework, the proposed scheme consists of two parallel categories, i.e. conventional and advanced metering. This is useful in evaluating the benefits of replacing the existing meters with advanced meters over conventional meters.
The parameters for the proposed conventional metering scheme are summarised in Table 21 below and discussed in the rest of the section under the headings of ‘proposed system parameters’, ‘failure rates’, ‘costs’ and ‘expected consumption’.
No Parameter Value Source Comment Proposed system parameters 4.1 Meter make Variable including Elster
Kent, Utility Systems, etc.
4.2 Meter model Variable including Rotary piston, Single jet and Multi-jet meters
4.3 SANS 1529-1 compliant?
True N/A Meets legal requirements.
4.7 Meter service life (years)
18 Van Zyl, 2011
Fraction of meters expected to fail due to 4.9 Water meter
failure (/year) 5% Wendell,
2016 As in Section 6.7.1.2 above
4.11 Vandalism (/year) 2% Wendell, 2016
As in Section 6.7.1.2 above
4.12 Other(/year) N/A N/A Included in 4.11 above 4.13 Total failure rate
(/year) 7% N/A Sum of all the above
failure rates 4.9 to 4.12
Table 21: Conventional Metering Scheme Parameters
UCT MASTERS THESIS CASE STUDY REVIEW OF ADVANCED WATER METERING APPLICATIONS IN SOUTH AFRICA
MASTERS DISSERTATION | OCTOBER 2017 Page | (99)
No Parameter Value Source Comment Costs 4.14 Meter price R532 /meter Ngobeni,
2016
4.15 Installation cost R800 /meter Ngobeni, 2016
4.17 Payment infrastructure cost
R0 N/A Absorbed within billing cost
4.19 Meter reading cost R8 /meter Saayman, 2016
4.20 Meter operation & maintenance cost
R7 /meter/month N/A Based on capital cost of the meter
4.21 Billing cost R10 /bill GIBB, 2015 Inclusive of administrative, printing and postage costs.
Expected New Consumption 4.24 Billed metered
consumption 6 000 properties Ngobeni,
2016
4.24 Billed metered Unit Consumption
20 kl/property/month City of Tshwane, 2009
No change assumed
4.26 Illegal consumption or unbilled connections
N/A N/A Illegal connections are assumed to have been identified and metered.
4.26 Illegal connections unit consumption
N/A N/A Based on above
Fraction of Properties Paying for Water 4.29 Billed metered
consumption 69% Peters,
2011 Same as Section 6.7.1.2
4.31 Ave time between meter readings
1 per month Ngobeni, 2016
Congruent with monthly billing cycle.
a) Proposed System Parameters
• CoT has different types of conventional meters whose meter make and model include Elster Kent and Utility Systems among others.
• The value for SANS 1529-9 compliance was omitted from Table 3 since it deals with requirements for electronic indicators that in most cases are not applicable to typical conventional meters.
• A conventional meter service life of 18 years as used in the CoCT case study was retained here in the absence of information from City of Tshwane in this regard.
b) Failure rates
• For water meter failure rate, a value of 5% meter failure per year as in Section 6.7.1.2 above was used (Wendell, 2016).
UCT MASTERS THESIS CASE STUDY REVIEW OF ADVANCED WATER METERING APPLICATIONS IN SOUTH AFRICA
MASTERS DISSERTATION | OCTOBER 2017 Page | (100)
• The values of 2% failure per year due to vandalism and other causes wereadopted as in Section 6.7.1.2 above.
c) Costs
• The typical conventional meter price used was approximately R532 /meterobtained from City of Tshwane (Ngobeni, 2016).
• The typical installation cost of conventional meters used was R800/ meterobtained from City of Tshwane (Ngobeni, 2016).
• Since the administrative portion of the billing cost is expected to cover allpayment system operational costs, no payment infrastructure costs areexpected.
• The meter reading, billing and meter operation and maintenance costs wereadopted from the existing values discussed in Section 6.7.1.2 above.
d) Expected Consumption
• All 6,000 properties were adopted for billed metered consumption in thisproposed metering case since illegal connections were assumed to have beenidentified and rectified accordingly.
• Since the proposed meter type here is the same as the existing conventionalone, the consumption was assumed to remain unchanged as in Section 6.7.1.2above as well.
• A fraction of billed metered consumption properties paying for water of 69% asin the Section 6.7.1.2 above was maintained since the same meters as in theexisting case are used.
6.7.1.4 Proposed Scheme for Advanced Metering
The parameters for the prepaid metering scheme in Olievenhoutbosch are summarised in below Table 22 and discussed in the rest of the section under the headings of ‘proposed system parameters’, ‘failure rates’, ‘costs’ and ‘expected consumption’.
No Parameter Value Source Comment Proposed System Parameters 4.1 Meter make Prepaid Meters Ngobeni, 2016 4.2 Meter model Elster Kent Ngobeni, 2016 4.3 SANS 1529-1
UCT MASTERS THESIS CASE STUDY REVIEW OF ADVANCED WATER METERING APPLICATIONS IN SOUTH AFRICA
MASTERS DISSERTATION | OCTOBER 2017 Page | (101)
No Parameter Value Source Comment field?
4.7 Meter service life (years)
7 years Pontia, 2016 & Elster Kent, 2014
Fraction of meters expected to fail due to 4.9 Water meter failure 10% Extrapolated from
Ngobeni, 2016
4.10 Electronics and other components (e.g. valve) failure
10% Extrapolated from Ngobeni, 2016
4.11 Vandalism 10% Extrapolated from Ngobeni, 2016
4.12 Other 5% Extrapolated from Ngobeni, 2016
4.13 Total failure rate (/year) 35% N/A Sum of all the above failure rates 4.9 to 4.12
Costs for Advanced Metering 4.14 Meter price R3 200 /meter Ngobeni, 2016 4.15 Installation cost R800 /meter Ngobeni, 2016 4.16 Communication
infrastructure cost N/A N/A
4.17 Payment Infrastructure Cost
R38 000 GIBB, 2015
4.18 Battery replacement cost
R220 /meter Made in China.com, 2016 & GIBB, 2015
4.19 Meter reading cost N/A N/A 4.20 Meter operation &
maintenance cost R41 /meter/month N/A Based on overall
capital cost of meter 4.21 Billing cost N/A Expected new Consumption for Advanced Metering 4.24 Billed metered
consumption 6 000 Ngobeni, 2016
4.24 Billed metered unit consumption
15 kl/property/month
Extrapolated from Ngobeni, 2016
4.26 Illegal consumption N/A N/A All assumed to have been identified and removed
4.26 Illegal connections unit consumption
N/A N/A See above
Fraction of Properties Paying for Water 4.29 Billed metered
consumption 95% Maromo, 2016
4.31 Ave time between meter readings (months)
N/A N/A
UCT MASTERS THESIS CASE STUDY REVIEW OF ADVANCED WATER METERING APPLICATIONS IN SOUTH AFRICA
MASTERS DISSERTATION | OCTOBER 2017 Page | (102)
a) Proposed System Parameters
• Prepaid meters are the advanced meter make considered in this case study (Ngobeni, 2016).
• The meter model used in Olievenhoutbosch was Elster Kent (Ngobeni, 2016).
• Both SANS 1529-1 and SANS 1529-9 compliance are applicable to prepaid meters and the meters installed complied with these legal standards in all cases.
• The mean battery life of 7 years obtained from City of Cape Town (Pontia, 2016) was maintained here since it coincided with the Elster Kent prepaid hardware component’s service life (Elster Kent, 2014).
• A modular unit which allows the battery to be replaceable in the field was input as the typical characteristic of the prepaid system proposed since this was the preferred option at the time of tendering.
• A meter service life of 7 years for advanced meters was adopted from the same hardware components mean battery life above and the corresponding City of Cape Town experience (Pontia, 2016 & Elster Kent, 2014).
b) Failure rates
• A 30 - 40% overall meter failure per year due to various component failures was provided from the City of Tshwane experience with these meters (Ngobeni, 2016). An average total of 35% failure was therefore adopted for this case study and distributed into 10% allotments to account for each of the 3 major failure causes alluded to in this evaluation framework and 5% for failures due to other causes. Consequently a 10% meter failure rate was adopted for parameter 4.9 of the table.
• The electronics and other components (e.g. valve) failure rate parameter as well as the vandalism rate were both adopted as 10% as in the extrapolation explanation above (Ngobeni, 2016).
• The remaining 5% of the 35% total failure rate per year was adopted as the failure per year due to other causes (Ngobeni, 2016).
c) Costs
• The typical prepaid meter price used was approximately R3 200 /meter as provided by City of Tshwane (Ngobeni, 2016).
• A similar installation cost to that of conventional meters was adopted here per City of Tshwane information provided i.e. R800 /meter (Ngobeni, 2016).
• For communication infrastructure costs, since these meters are not remotely read, the value for this has been omitted.
• Due to absence of information from City of Tshwane on this, the payment infrastructure cost of R38 000 was estimated by addition of the Elster Kent
UCT MASTERS THESIS CASE STUDY REVIEW OF ADVANCED WATER METERING APPLICATIONS IN SOUTH AFRICA
MASTERS DISSERTATION | OCTOBER 2017 Page | (103)
vending software cost of R24 960 and hand held vending station cost of R13 465 provided in the GIBB, 2015 feasibility study of different advanced meters that could be used in eThekwini. This sum was thus approximated to account for the overall cost of the vending station used for water credit purchase in Olievenhoutbosch (GIBB, 2015).
• The battery replacement cost for this prepaid system was based on comparison of two source values explained in the Epping case study and adopted here in the absence of information from City of Tshwane in this regard.
• The meter reading cost was not applicable for these meters since payment is made up front.
• Similar to the conventional case, to estimate the typical advanced meter operation and maintenance costs, a ratio of 15% of the capital cost of just the advanced meter unit per annum was obtained. An estimate of about R480 per annum and thus approximately R40 /meter/month was found. To account for communication infrastructure maintenance costs, 15% of the R 38 000 was obtained (R 5 700) and divided by the no. of meters to get a unit cost of R1 per annum. Although this value was per annum, it was added to the monthly value of the unit meter above in order to obtain a conservative overall summation of R 41/meter/month. This value was adopted in the absence of more conclusive information from City of Tshwane.
• The billing cost was not applicable here since the system under consideration here is prepaid.
• No additional communication system operating costs are expected in this system and this value was consequently omitted from the table.
d) Expected Consumption
• All 6,000 properties as in Section 6.7.1.3 above were assumed to be under billed metered consumption as part of the new prepaid project implementation.
• City of Tshwane observed an overall reduction in consumption after installation of the prepaid meters (Ngobeni, 2016). However, since no specifics on the actual amount of reduced consumption per household have been made, the value of 15 kl/property/month was therefore adopted to represent the reduced billed metered unit consumption in this area.
• All illegal connections and consequently their illegal unit consumption are assumed to have been identified and removed as part of the new prepaid meter installation process and were thus omitted from the table.
• A 95% fraction of billed metered consumption properties paying for water was based on the Tshwane Chief Financial Officer’s comment on the percentage of Tshwane residents who pay their bills and adopted in the absence of any information from CoT in this regard (Maromo, 2016).
UCT MASTERS THESIS CASE STUDY REVIEW OF ADVANCED WATER METERING APPLICATIONS IN SOUTH AFRICA
MASTERS DISSERTATION | OCTOBER 2017 Page | (104)
Results
The four tables below provide the technical, social, environmental and economic results for the Olievenhoutbosch prepaid metering case study calculations based on the input parameter values above.
6.7.2.1 Technical Result
The technical results of the evaluation are summarised in Table 23 showing compliance with SABS standards for both conventional and advanced meters. However, the prepaid meters have over five times the failure rate of the conventional meters.
1. TECHNICAL
No Property Conventional
metering (baseline) Advanced metering
1.1 SABS compliance Yes Yes
1.2 Number of meters to replace (/month) 35 175
6.7.2.2 Social Result
The social results are shown in Table 24 below. The water bill is estimated to be 1.6% of the community’s household income. This value which is under 5% implies that the community will be willing to pay for water and this was confirmed by the wide social acceptance and even popular demand for these prepaid meters as mentioned in the case study report.
2. SOCIAL No Property Value
2.1 Current rate of meters vandalised (/year) 2.0% 2.2 Unemployment rate 24.0%
2.3 Volatility of community (No of protest or mass action incidences per year) 25
2.4 Average water bill (/month) R236.25 2.4 Average property income (/month) R15,200.00 2.5 Water bill as a fraction of income 1.6%
6.7.2.3 Environmental Result
The environmental results are shown in Table 25 below.
A 25% reduction in consumption was obtained for the prepaid metering case with 857 batteries requiring disposal per year.
Table 23: Technical result for Prepaid Case Study in Olievenhoutbosch
Table 24: Social result of the Prepaid Case Study in Olievenhoutbosch
UCT MASTERS THESIS CASE STUDY REVIEW OF ADVANCED WATER METERING APPLICATIONS IN SOUTH AFRICA
The above results indicate that prepaid metering at a capital cost of about R24 million achieve a 25% reduction in consumption and a 26% increase in payment rates. They therefore achieve one of the objectives of the municipality to increase payment for water services as well as assist in consumption management; a benefit particularly useful in water scarce areas.
This however means that the City must be willing to invest an additional R16 million rand into prepaid metering which translates into an additional R6.35 /kl if only capital cost and total consumption over the meter service life is considered for both scenarios.
UCT MASTERS THESIS CASE STUDY REVIEW OF ADVANCED WATER METERING APPLICATIONS IN SOUTH AFRICA
MASTERS DISSERTATION | OCTOBER 2017 Page | (107)
In water scarce areas, this additional cost may be preferable to bulk augmentation projects involving finding alternative water sources or importing water from neighbouring areas. Savings in production costs due to the reduced consumption can also be channelled to meeting the above additional metering costs.
The framework also indicates that while the advanced metering scheme is infeasible with a negative effective surplus, the conventional scheme is not. In fact, while the new conventional metering scheme results in a R57 964.80/month reduction in the operational deficit of the existing scheme; this is not the case for the prepaid metering scheme. Even with its slightly increased income, the higher operating expenditure of this prepaid scheme cannot be offset resulting in a R448 904/month increment in the operational deficit of the existing scheme.
It is important to note that in the evaluation framework above, a cost of R0 /kl was considered for the FBW consumption. As such, inclusion of a government subsidy amount equivalent to the first tier tariff for this 6kl FBW amount will change the economic results obtained since a new tariff amount of R16.49 / kl instead of R6.75 /kl as in the case above will be used. The new economic results do not differ much from the first scenario with the prepaid metering scheme still infeasible and the conventional case a better option.
The main benefit of the prepaid system is its potential to enable user consumption be managed better, and in areas where water supply is under severe stress this benefit may override the economic benefits of conventional metering. However, this comes at a significantly higher financial risk associated with a total capital cost of R24 million compared with R8 million for conventional metering.
6.8 Lessons Learnt
Taking the benefits and challenges mentioned in the sections above into account, three main municipal lessons learnt are cited below:
i. Although the prepaid meters can be said to cause a general reduction in consumption, the savings realized by this reduced demand are offset by the increased capital and maintenance costs of these meters (Ngobeni, 2016).
ii. Increased components make prepaid metering failures more prone to occur and in some instances these go unreported. As such, field investigations as well as quick response to failures are critical to mitigate water losses, fire hazards and other health risks that may occur as a result of these failures (Ngobeni, 2016).
iii. Due to the significantly higher operation and maintenance demands of prepaid metering, institutional capacity in terms of both staff and vending infrastructure should be improved prior to further roll-out (Ngobeni, 2016).
iv. Due to lack of experience in using these meters at the time of the pilot study, no policy regarding their use had been formulated (Ngobeni, 2016). However, a
UCT MASTERS THESIS CASE STUDY REVIEW OF ADVANCED WATER METERING APPLICATIONS IN SOUTH AFRICA
MASTERS DISSERTATION | OCTOBER 2017 Page | (108)
new municipal policy on prepaid metering is now being concluded to guide any new installations based on the municipality’s experiences with them (Ngobeni, 2016).
UCT MASTERS THESIS CASE STUDY REVIEW OF ADVANCED WATER METERING APPLICATIONS IN SOUTH AFRICA
MASTERS DISSERTATION | OCTOBER 2017 Page | (109)
7 AUTOMATIC METER READING IN EPPING INDUSTRIAL AREA
7.1 Introduction
Advanced meters are gaining increasing importance in the management of water resources today. As such, the City of Cape Town from February 2008 to May 2010 rolled out a pilot project to test the economic and technical efficacy of using Advanced Meter Reading technology to measure water consumption and manage demand, while improving customer service.
Under AMR Pilot Project: Tender 30S 2007/2008 for City of Cape Town, three pilot project areas were chosen, each with unique characteristics in order to test this technology’s functionality under different conditions. These areas were Sunset Beach, a residential suburban area, Epping, a majorly industrial area and N2 Gateway, another residential area housing several high density blocks of flats (De Beer, 2010).
The focus of this case study will be the Epping Industrial Area situated to the south of Thornton, east of Pinelands and north of Langa. As one of Cape Town’s largest industrial hubs, manufacturing contributes about 43% of the activity in Epping Industrial area. The products manufactured in this industrial area range from fabricated metal work, machines and equipment, wood products as well as chemical and plastic products(City of Cape Town, 2016).
It is therefore expected that the water consumption in this area is higher than that of a typical residential area. The pilot project scope in Epping covered an area of 6.8 square kilometres comprising of approximately 430 water meters of sizes varying between 15mm and 200mm (De Beer, 2010).
A more detailed breakdown of this case study’s evaluation inputs and results is provided in Section 7.7 of this Chapter.
7.2 Reasons for Implementation
Automatic Meter Reading (AMR) involves the capture of consumption data from customer’s premises and relay of this data to a remote central location (De Beer, 2010). This advanced metering system was the type chosen by City of Cape Town for implementation in Epping, a large industrial area as well as two other residential areas mentioned above.
AMR systems have been known to have benefits such as obtaining readings at any time on demand, real-time leak detection, no need for property access, reduced billing cycles and rapid client dispute resolution. In addition, managing water demand and conservation is greatly assisted by effective metering, monitoring and control of the water reticulation system, functions that are supported by AMR technologies (De Beer,2010). For these reasons, the pilot project in Cape Town was implemented in order
UCT MASTERS THESIS CASE STUDY REVIEW OF ADVANCED WATER METERING APPLICATIONS IN SOUTH AFRICA
MASTERS DISSERTATION | OCTOBER 2017 Page | (110)
to determine the feasibility of AMR system use and its ability to achieve these benefits in different areas of Cape Town.
On 18th February 2008, a tender was awarded to Hydrometrix Technologies/Cape Digital Solutions Joint Venture (JV).
Radio frequency technology for AMR systems can vary from low-power pulse-activated (for “walk-by” or “drive-by” systems) to high-power, licensed, fixed radio networks or alternatively to low-power, licence-free, two way communication, integrated radio mesh networks. Of the two remote reading types, i.e. high-power licenced fixed RF networks and the integrated low power licence-free RF mesh networks, the latter was preferred by the contractor due to its cost-effectiveness, flexibility, scalability and low maintenance needs. Additionally, its low power requirements result in longer battery life and due to absence of licensing conditions, it is geographically unlimited (De Beer, 2010).
The contractor’s RealSens AMR system was thus based on a two-way, license-free, 868 MHz radio frequency communication system. This system transmits meter reading data via a GSM (GPRS) network to a system server where data is inserted automatically into a MySQL database (De Beer, 2010).
For the data transmission to occur, the water meter is fitted with a pulse output device (reed or inductive switch), a radio transceiver (meter interface unit - MIU) connected locally to the water meter, a low power radio repeater network and GSM device(s). Data logging is done by the MIU facility until a request is received to upload the meter readings to the database. To upload, the MIU sends the stored readings via the repeaters to a GSM device, which in turn forwards the data to the remote data base (De Beer, 2010).
The scope of the pilot project was to equip each meter in the pilot area chosen with the AMR communication components from which the meter data logged could be sent at predefined intervals to a MySQL data base server. This upgrade was to be followed by a three month evaluation period during which meter readings obtained from the AMR system would be compared with manual readings to determine the success of the system (De Beer, 2010).Figure 9 below shows a GIS image of the Epping pilot study area.
UCT MASTERS THESIS CASE STUDY REVIEW OF ADVANCED WATER METERING APPLICATIONS IN SOUTH AFRICA
MASTERS DISSERTATION | OCTOBER 2017 Page | (111)
7.3 Project Implementation Process
Prior to the AMR installation, the two preliminary processes explained below had to be undertaken:
Consumer Awareness
An AMR project, like any other city infrastructure implementation, has numerous affected parties whose usual operations will be impacted by the works to be done. In this case, checks and consequent upgrades had to be done on individual consumer meters some of which were located inside the consumer’s properties. In addition, intermittent shut down of water supply to some consumers had to be done where meter repairs or replacements were required. All affected parties thus needed to be given notice of the project aim and implications, including approximate time schedules of when field personnel should be expected in or near their properties. Various awareness strategies ranging from local newspaper articles, notices in their utility bills and hand delivered notices were employed prior to installation (De Beer, 2010).
Meter Audits
The aim of meter audits is to verify the utility’s meter database by ensuring that field meter details such as property reference, serial number, size and type match with the utility office records. Consequently the meters which need to be replaced with AMR
Figure 9: Epping Industrial Pilot Area (De Bruyn, 2009)
UCT MASTERS THESIS CASE STUDY REVIEW OF ADVANCED WATER METERING APPLICATIONS IN SOUTH AFRICA
MASTERS DISSERTATION | OCTOBER 2017 Page | (112)
compatible ones can be determined. This comprehensive process involved field data capture, comparison of field and municipal data, data clean up involving both office and field verification and finally compilation in GIS and data tables. A total of 439 properties in Epping were visited of which 315 meters were not compatible, 87 were compatible and for 19 the AMR compatibility was unknown due to the meters not being found (De Beer, 2010).An example of an AMR installation is shown in Figure 10 below.
The above two processes formed the basis of the meter replacement activity in which incompatible meters were replaced with new AMR compatible ones, while the meters that could not be found were reported in a snag list to the CoCT.
Following the replacement activity, reed switch and MIU installations were done on both existing compatible meters and new ones installed (De Beer, 2010). With all the upgraded meter locations marked on maps, the radio network planning regarding the placement of repeaters and GSM devices could be done on a map background. Repeaters were ideally placed as high above the ground as possible for communication and safety reasons while GSM devices which require a permanent power source had differing positions from initial map placements dependent on the availability of these power sources (De Beer, 2010).An example of a GSM mounted switch in this area is shown in Figure 11 below.
Figure 10: Actaris Combination meter with 2-channel MIU (De Beer, 2010)
UCT MASTERS THESIS CASE STUDY REVIEW OF ADVANCED WATER METERING APPLICATIONS IN SOUTH AFRICA
MASTERS DISSERTATION | OCTOBER 2017 Page | (113)
Once the above installation process was complete, a snag list including pilot area meters that were not fitted with AMR due to incompatibility, inaccessibility and several other reasons was compiled and reported to the City of Cape Town. A post audit and data integration process then formed the final stages of the AMR implementation process (De Beer 2010).
During the meter audit and replacement phases, bypassed and vandalized meters within the area were identified and repaired or replaced thus saving the utility further revenue losses. In addition, oversized meters and old meters which had surpassed their service lives were also identified and replaced during the AMR project implementation (De Beer, 2010). However, since these benefits could be achieved from audits done on conventional meter installations, they were not included in the benefits of the AMR system given below.
7.4 Benefits of the AMR System
As initially anticipated a number of benefits were observed as a result of this pilot project and these included the following:
i. Timely detection of tampering, leakages and improperly functioning meters could be done with the AMR technology in place (De Beer, 2010).
ii. On-demand meter readings and consumption monitoring could be done with the central database thus reducing the hazards to meter readers e.g. traffic where meters were in hard-to-read locations (De Beer, 2010).
Figure 11: GSM unit mounted with Isolating switch (De Beer, 2010)
UCT MASTERS THESIS CASE STUDY REVIEW OF ADVANCED WATER METERING APPLICATIONS IN SOUTH AFRICA
MASTERS DISSERTATION | OCTOBER 2017 Page | (114)
iii. An update and mapping of the city’s meter database was also one of the benefits observed as a means to improve billing efficiency and ease customer service query handling (De Beer, 2010).
7.5 Challenges Encountered
A number of challenges however were also encountered by the City of Cape Town both during the implementation phase of this pilot project as well as in the subsequent operation and maintenance phases. These challenges are divided into the Administrative, Technical, Operational and Social subsections expounded below.
Administrative Challenges
The administrative shortfalls which negatively impacted this project included the following:
• Delays in the city procurement process of meters resulted in delays in their delivery and consequently extended the project implementation timeline (De Beer, 2010).
• Poor coordination between the different parties involved in the implementation process also caused delays; for instance where the meter supply contractor upgraded existing meters which had already been recorded in the meter audit by the AMR contractor; and thus the upgrade materials that the AMR contractor had initially planned for based on the audit results needed to be updated and reordered too (De Beer, 2010).
• Some of the AMR components (repeaters and GSM devices) required permanent power sources to run. Their mounting therefore required the notification of and approval from electricity and street lighting authorities in some instances. The administrative processes required to get these approvals lengthened the project time schedule (De Beer, 2010).
• The City had a three year meter procurement tender in place from which only a particular make of meter could be ordered. However, because AMR had not been anticipated at the time the meter tender was instigated, no consideration was given to meters with pulse outputs. Consequently, for the 25mm domestic meters on tender, a significantly more expensive pulse device compared to a standard reed switch was required to ensure compatibility thus inflating the initial contract price (De Beer, 2010).
Technical Challenges
The technical setbacks experienced are summarised below:
• Incompatibility whereby some of the existing meters were not pulse upgradable and thus needed to be replaced before AMR could be installed (De Beer, 2010).
UCT MASTERS THESIS CASE STUDY REVIEW OF ADVANCED WATER METERING APPLICATIONS IN SOUTH AFRICA
MASTERS DISSERTATION | OCTOBER 2017 Page | (115)
• Battery failure of the different AMR components making it impossible to obtain the meter readings (Wendell, 2016).
• Meter box sizes restricted the meter body lengths that could be used and since in many instances, this was only discovered on site, it resulted in cancellation of the orders of longer body length meters and replacement with ones of shorter body length. This replacement process caused unnecessary delays (De Beer, 2010).
• Other time delays were caused by the need to close zonal valves in instances where meters to be worked on couldn’t be isolated due to defective shut off valves (De Beer, 2010).
• In the course of some meter replacements, it was observed that some meter flange types were not compatible with the existing fittings therefore triggering another procurement process before the replacement could be concluded (De Beer, 2010).
• It was also observed that certain electric streetlights in very close proximity to repeaters could cause radio interference and so great care needed to be taken with AMR component installation procedures to avoid this (De Beer, 2010).
• Defective reed switches whereby a specific type of meter installed during the project produced such a weak magnetic field that the reed switch struggled to operate accurately resulting in large reading errors (De Beer, 2010).
• Meter chambers with metal lids and buildings with excessive metal cladding and/or steel reinforcing were found to be a challenge to the AMR communication systems since they affected the transmission of radio frequency waves (De Beer, 2010). Relocation or other contingency measures had to be taken in these cases.
Operational Challenges
The pilot project maintenance and operation challenges included the following:
• Buried and /or broken valves and meters which not only increased replacement needs but also caused delays in meter replacement scheduling (De Beer, 2010 & Wendell, 2016).
• In some cases, when manhole covers were being removed or replaced during maintenance operations, they fell into the manhole thereby breaking the AMR components installed (De Beer, 2010 & Wendell, 2016).
• Poor record keeping and updating of meter and AMR system damage or upgrade activities made coordination of maintenance activities difficult (De Beer, 2010 & Wendell, 2016).
UCT MASTERS THESIS CASE STUDY REVIEW OF ADVANCED WATER METERING APPLICATIONS IN SOUTH AFRICA
MASTERS DISSERTATION | OCTOBER 2017 Page | (116)
• Poor meter chamber construction whereby some meter chambers required complete demolition before the necessary working space to perform replacements and/or upgrades could be obtained. These, once reported by the AMR contractor, were either exempted from the project or incurred undue time and cost burdens for the City of Cape Town (De Beer, 2010).
• Some meter locations were difficult to access and this factor as well as poor record keeping resulted in discrepancies and difficulties in resolving the meter field and office databases together (De Beer, 2010).
• Flooded meter chambers due to leakages and/or groundwater ingress necessitated dewatering of chambers and thus increased time needs for meter auditing and upgrades (De Beer, 2010). An example of this is shown in Figure 12 below.
Social Challenges
A number of social challenges had to be addressed both during and after the AMR pilot project. Some of these issues are highlighted below:
• Vandalism of existing and newly installed meters and AMR components which incurred losses to the City of Cape Town (De Beer, 2010 & Wendell, 2016). About 5.6% of the newly installed meters in Epping had been vandalised during the evaluation period per the audit summary report (De Beer, 2010).
Figure 12: Flooded meter chamber (De Bruyn, 2009)
UCT MASTERS THESIS CASE STUDY REVIEW OF ADVANCED WATER METERING APPLICATIONS IN SOUTH AFRICA
MASTERS DISSERTATION | OCTOBER 2017 Page | (117)
• Poor solid waste disposal practices whereby some meter chambers were filled with rubbish and so time consuming efforts were required to empty them before meter characteristics and replacement needs could be ascertained (De Beer, 2010).Figure 13 below shows an example of this.
• One labour concern that the City of Cape Town had to contend with was the reallocation of the conventional meter readers once the AMR system was operational. This would impart additional logistics (re-assignment) and fund allocations (for training) on the City of Cape Town (De Beer, 2010 & Saayman, 2016).
Other social challenges which mainly stemmed from the attitudes of some consumers whose meters were part of the AMR pilot are elaborated below:
• In some cases, consumers who experienced minor plumbing problems long after their meters had been replaced blamed the contractor for these problems. The contractor in an attempt to maintain good relations therefore fixed these consumer plumbing problems at his own cost, incurring even more unanticipated delays (De Beer, 2010 & Saayman, 2016).
• Some consumers disagreed with the advanced meters due to the notion of privacy invasion through the continual meter monitoring aspect of AMR systems, and these consumers were prone to vandalising these installations (De Beer, 2010).
• In instances where meters had been installed in customer driveways, break up and reinstatement of these pave-ways was required as part of the meter
Figure 13: Meter chamber filled with rubbish (De Bruyn, 2009)
UCT MASTERS THESIS CASE STUDY REVIEW OF ADVANCED WATER METERING APPLICATIONS IN SOUTH AFRICA
MASTERS DISSERTATION | OCTOBER 2017 Page | (118)
upgrade process. However, many customers remained dissatisfied with the reinstatement works done regardless of their quality on completion (De Beer, 2010).This challenge however is not limited to advanced meters and can occur with conventional metering projects as well.
• One of the delays imparted on the contractor were the limited working timesprescribed by factory consumers in order to minimise disruption to theiroperations. The low volumes of work achievable within these time slots, usuallyonly weekends, therefore lengthened the overall project completion time (DeBeer, 2010). Like the above, this challenge is not limited to advanced meters andcan occur with conventional metering projects as well.
7.6 Current Status of Epping Pilot Project
The remote reading functionality of the Epping AMR system is not currently being used. Instead a walk by approach typical of conventional meters is being used. This is because the financial investment required to operate and maintain the communication infrastructure for the remote read is above the municipal operational capacity for the time-being (Saayman, 2016).
The Epping pilot and its lessons which are delved further into in Section 7.8 below were therefore successful in informing the city’s current stand on advanced water meter reading technology use. This stand is summarised below:
• The City currently only chooses to use AMR technology in the following areas:
o Industrial and residential areas where it is difficult for municipal staff toobtain access to the meters and/or where the distance between metersis large making walk by methods ineffective (Saayman, 2016).
o Areas with high income consumers (Saayman, 2016) since recuperationof the costs invested is more feasible with such consumers.
A phased approach to install AMR in the above type of areas in Cape Town is therefore underway (Saayman, 2016).
7.7 Evaluation of Epping AMR Case Study in Cape Town
Model Input Parameters
The input parameters used to calculate the indicators for these factors were obtained from various sources and are discussed in this section under the headings of ‘Global Parameters’, ‘Existing System’ (which caters for the situation before new meter implementation ) and ‘Proposed Scheme’ (which caters for both the new conventional and new advanced metering systems proposed). The input parameters are given in tables linked to the evaluation framework, which is provided in Appendix A.
UCT MASTERS THESIS CASE STUDY REVIEW OF ADVANCED WATER METERING APPLICATIONS IN SOUTH AFRICA
MASTERS DISSERTATION | OCTOBER 2017 Page | (119)
7.7.1.1 Global Parameters
The global parameters used in the analysis are summarised in Table 27, with the values chosen, sources of information and a brief comment. A more detailed explanation of how these model values were selected is provided in the subsequent paragraphs. The study was a pilot with only 465 properties.
No Parameter Value Source Comment 2.1 Number of
properties 465 Wendell, 2016
2.2 Water cost price R8 /kl De Sousa-Alves, 2013
2.3 Applicable water tariff
R17.10/kl City of Cape Town, 2015
From CoCT Water and Sanitation Tariffs.
• The number of properties is based on results of the meter audit in Epping done at the end of AMR project implementation (De Beer, 2010).
• The water cost price is the water production cost and includes only raw water and purification costs. It was adopted as R8.00 / kl as a fraction of the water reticulation cost provided in the De Sousa-Alves, 2013 Cape Town report.
• The applicable water tariff of R17.10 /kl is based on the current Water and Sanitation Tariffs 2015-2016-CoCT for the Industrial Consumer category (City of Cape Town, 2015).
7.7.1.2 Existing System (Situation before Metering system upgrade)
This section describes the situation before the metering system upgrade. The values used are summarised in Table 28 below.
No Parameter Value Source Comment
3.1 Billed metered consumption
465 properties Wendell, 2016 & De Beer, 2010
100% of the properties in the pilot study area
3.1 Billed metered unit consumption
80 kl/property /month
Van Zyl, H.J., et al., 2007 & City of Cape Town, 2016
Industrial consumption estimates
3.3 Illegal or unbilled connections
N/A N/A
3.3 Illegal connections unit consumption
80 kl/property /month
N/A
Fraction of properties paying for water 3.5 Billed metered
consumption 100% Sivatho, et al., 2016
Table 27: Global Parameters
Table 28: Water Consumption before Advanced Meter Implementation
UCT MASTERS THESIS CASE STUDY REVIEW OF ADVANCED WATER METERING APPLICATIONS IN SOUTH AFRICA
MASTERS DISSERTATION | OCTOBER 2017 Page | (120)
No Parameter Value Source Comment
Other parameters before Advanced Meter Implementation 3.8 Fraction of demand
that is on-site leakage
5% De Sousa-Alves, 2013
3.9 Ave time between meter readings (months)
1 Saayman, 2016 Adopted since congruent with monthly billing cycles.
3.10 Meter reading cost R8 /meter Saayman, 2016 3.11 Billing cost R10 /bill GIBB, 2015 Inclusive of
administrative, printing and postage costs.
3.12 Meter operation & maintenance cost
R7 /meter/month
N/A Estimated as a ratio overall capital cost.
Fraction of meters failing due to 3.13 Meter failure (/year) 5% Wendell,2016 3.14 Vandalism and other
(/year) 2% Wendell, 2016
• It was clear from the implementation report (De Beer, 2010) that billed metered consumption was considered for all 465 properties in the pilot study area.
• In the absence of guidelines on the estimation of industrial consumption from the Red Book, as well as no consumption data for this consumer category from CoCT, an estimate had to be made. The average billed metered unit consumption of 80 kl/property/month is based on the AADD of 3 kl/day allotted to industrial area stands of 3 000m3 (Van Zyl, et al., 2007). This 3 kl value was applied over 26 days to obtain the monthly consumption value above. The approximation of 3 000 m2 stand value area for Epping resulted from a review of typical plot sizes in different industrial areas in Cape Town (City of Cape Town, 2016 & SA Commercial Prop News, 2014).
• A fraction of billed metered properties paying for water of 100% was adopted from table showing overview of metering, billing and free basic services (Sivatho, et al., 2016).
• The fraction of demand that is on-site leakage was based on an estimate of on-site leakage in industrial areas made by the City of Cape Town (De Sousa-Alves, 2013).
• The R8 /meter value for meter reading cost was obtained from the City of Cape Town (Saayman, 2016).
• It was not possible to get the billing cost from City of Cape Town. However from the feasibility study for eThekwini, billing costs were estimated as R10 per month per meter (GIBB, 2015) made up of R 6 administrative cost, R 1 printing
UCT MASTERS THESIS CASE STUDY REVIEW OF ADVANCED WATER METERING APPLICATIONS IN SOUTH AFRICA
MASTERS DISSERTATION | OCTOBER 2017 Page | (121)
cost and R 3 postage cost. This estimated R10 /bill was thus adopted as the billing cost for Cape Town.
• To estimate the typical meter operation and maintenance costs, a ratio of 15% of the overall capital cost of the conventional meter per annum was used due to the absence of more conclusive information on this. An estimate of about R75 per annum and thus R6.25 /month was obtained, which value was rounded off to approximately R7 /meter/month.
• The meter failure rate of 5% for conventional meters in Cape Town was obtained from the City of Cape Town (Wendell, 2016).
• The failure rate due to vandalism and other reasons of 2% for conventional meters in Cape Town was also obtained from the City of Cape Town (Wendell, 2016).
7.7.1.3 Proposed Scheme for Conventional Metering (baseline)
In the evaluation framework, the proposed scheme consists of two parallel categories, i.e. conventional and advanced metering. This is useful in schemes where all existing meters are replaced, for instance when old conventional meters are replaced with new meters and the benefits of replacing the existing meters with advanced meters over conventional meters should be evaluated.
However, in the case of Epping, the existing system was not in a bad condition and thus not all the conventional meters were replaced. The advanced metering component was mostly added to the existing conventional meters. In this contract the low compatibility necessitated replacement of 80-90% of the meters (Saayman, 2016). It was assumed that the meters that were replaced would also have required replacement if the advanced metering was not implemented.
To allow the lower replacement costs of only 90% of the meters in the model, the meter price (4.14) was reduced accordingly.
The parameters for the modified conventional metering scheme are summarised in Table 29 and are discussed in the rest of the section under the headings of ‘proposed system parameters’, ‘failure rates’, ‘costs’ and ‘expected consumption’.
No Parameter Value Source Comment Proposed system parameters 4.1 Meter make Variable including
Elster Kent, Actaris, Sensus
De Beer, 2010 Based on existing situation
4.2 Meter model Variable including Woltmann and Multi-jet meters
UCT MASTERS THESIS CASE STUDY REVIEW OF ADVANCED WATER METERING APPLICATIONS IN SOUTH AFRICA
MASTERS DISSERTATION | OCTOBER 2017 Page | (122)
No Parameter Value Source Comment 4.3 SANS 1529-1
compliant? True N/A Meets legal requirements.
4.7 Meter service life (years)
18 Van Zyl, 2011 & De Sousa-Alves, 2013
Fraction of meters expected to fail due to 4.9 Water meter
failure (/year) 5.0% Wendell,2016
4.11 Vandalism (/year)
2.0 % Wendell, 2016
4.12 Other(/year) N/A N/A Included in 4.11 above Costs 4.14 Meter price R 413.98 /meter Saayman, 2016,
De Beer, 2016 & WRP Consulting Engineers, 2009
Meter cost excluding the AMR compatible units was proportionally reduced according to the fraction of meters that were replaced (385 meters replaced out of 465 x R500 per meter)
4.15 Installation cost R663.37 /meter Ngobeni, 2016 Installation cost as in 4.14 above was proportionally reduced according to the fraction of meters that were replaced (385 meters replaced out of 465 x R800 per meter)
4.17 Payment infrastructure cost
R0 N/A Absorbed within billing cost
4.19 Meter reading cost
R8 /meter Saayman, 2016
4.20 Meter operation & maintenance cost
R7 /meter/month N/A Based on initial capital cost of the meter
4.21 Billing cost R10 /bill GIBB, 2015 Inclusive of administrative, printing and postage costs.
Expected New Consumption 4.24 Billed metered
consumption 465 properties Wendell, 2016
4.24 Billed metered Unit Consumption
80 kl/property/month
N/A Increased to account for improved meter accuracy
4.26 Illegal consumption or unbilled connections
N/A N/A
4.26 Illegal connections unit
80 kl/property/month
N/A
UCT MASTERS THESIS CASE STUDY REVIEW OF ADVANCED WATER METERING APPLICATIONS IN SOUTH AFRICA
MASTERS DISSERTATION | OCTOBER 2017 Page | (123)
No Parameter Value Source Comment consumption
Fraction of Properties Paying for Water 4.29 Billed metered
consumption 100% Sivatho, et al.,
2016 Same as Section 7.7.1.2
4.31 Ave time between meter readings
1 per month Saayman, 2016 Congruent with monthly billing cycle.
a) Proposed System Parameters
• The meter make and model varied to maintain compatibility with the differentexisting system fittings and junctions which required replacement (De Beer,2010). However, regardless of make and model, all the newly installedconventional meters were SANS 1529-1 compliant.
• The value for SANS 1529-9 compliance was omitted since it deals withrequirements for electronic indicators that in most cases are not part of a typicalconventional meter.
• A conventional meter service life of 18 years was adopted as herein explained;Cape Town has ±12.5% meters above the age of 20 years (De Sousa-Alves,2013). However, due to variation in meter types and consequently theirperformance periods, smaller meters are able to last between 12 and 20 years,and larger meters (≥75 mm) have typically lower service lives of 5 and 10 years(Van Zyl, 2011). Since smaller meters are typically used, an average meterservice life value of 18 years was adopted.
b) Failure rates
• In assessing the water meter failure rate a value of 5% meter failure per year asin Section 7.7.1.2 above was used (Wendell, 2016).
• The values of 2% failure per year due to vandalism and other causes wereadopted as in Section 7.7.1.2 above (Wendell, 2016).
c) Costs
• The typical conventional meter price used was R500 /meter based oncomparison of two sources herein explained; A range of prices from R180 - R700per meter depending on the make, size and material of meter (De Beer, 2016)and the replacement cost of R500 /meter in the tabular summary of WC/WDMcosts (WRP Consulting Engineers, 2009). The R500 /meter value was adopted asan average of the two. This unit price as explained in the table above wasreduced to R413.98 to account for the 83% fraction of meters replaced.
• No information on the installation cost of conventional meters in Epping couldbe found. As such, an estimate of R800 per municipal staff’s experience in thePretoria case study area was adopted here to account for all the materials and
UCT MASTERS THESIS CASE STUDY REVIEW OF ADVANCED WATER METERING APPLICATIONS IN SOUTH AFRICA
MASTERS DISSERTATION | OCTOBER 2017 Page | (124)
labour required for meter installation. Since meter prices and their associated installation costs vary with the meter size, material and make, it was considered prudent to take an approach of a typical value no less than that of the meter installed. As with the meter price above, this unit cost was also reduced by the fraction of meters replaced to R662.37.
• Since the administrative portion of the billing cost is expected to cover all payment system operational costs, no payment infrastructure costs are expected.
• The meter reading, billing and meter operation and maintenance costs were adopted from the existing values discussed in Section 7.7.1.2.
d) Expected Consumption
• All 465 properties were assigned to billed metered consumption as stated for the existing system in Section 7.7.1.2.
• Since many of the meters replaced were still post-paid and were conventional meter based with add-on components, the consumption was assumed to remain unchanged.
• A fraction of billed metered consumption properties paying for water of 100% as in the Section 7.7.1.2 above was maintained.
7.7.1.4 Proposed Scheme for Advanced Metering
The Table 30 below summarises the parameters for the RealSens AMR system that was installed on the existing and replaced meters in Epping.
The meter price parameter includes both the AMR add-on to the meters and the cost of the meters that were replaced. To allow the lower replacement costs of only a few meters in the model, the meter price (4.14) component of the advanced metering system was reduced as was the case for the conventional meters above.
The parameters for the modified advanced metering scheme are summarised in Table 30 and are discussed in the rest of the section under the headings of ‘Proposed System Parameters’, ‘Failure Rates’, ‘Costs’ and ‘Expected Consumption’.
No Parameter Value Source Comment Proposed System Parameters 4.1 Meter make RealSens Advanced
Meter Reading System De Beer, 2010 Requirement of the
awarded pilot project tender.
4.2 Meter model Variable conventional models stated all fitted with RealSens
De Beer, 2010 Inferred from implementation process.
UCT MASTERS THESIS CASE STUDY REVIEW OF ADVANCED WATER METERING APPLICATIONS IN SOUTH AFRICA
MASTERS DISSERTATION | OCTOBER 2017 Page | (125)
No Parameter Value Source Comment AMR System
4.3 SANS 1529-1 compliant?
True De Beer, 2010 Meets legal requirements
4.4 SANS 1529-9 compliant?
True De Beer, 2010 Meets legal requirements
4.5 Mean battery life (years)
7 years Pontia , 2016 Adopted from field experience
4.6 Battery replaceable in field?
True Not available Preference for modular units assumed
4.7 Meter service life (years)
5 years Wendell,2016
Fraction of meters expected to fail due to 4.9 Water meter
failure 5.0% Wendell, 2016 As in Section 7.7.1.3 above
4.10 Electronics and other components (e.g. valve) failure
7.5% Wendell, 2016 From implementation and subsequent O&M experience.
4.11 Vandalism 2.0% Wendell, 2016 From implementation and subsequent O&M experience.
4.12 Other 4.2% Wendell, 2016 From implementation and subsequent O&M experience.
Costs for Advanced Metering 4.14 Meter price R1 241.94 /meter GIBB 2015 Meter cost excluding the
AMR compatible units was proportionally reduced according to the fraction of meters that were replaced (385 meters replaced out of 465 x R 1500 per meter)
4.15 Installation cost R1 241.94 /meter GIBB 2015 Based on reduced meter price above
4.16 Communication infrastructure cost
R15 000 GIBB 2015 Based on field estimates
4.18 Battery replacement cost
R220 /meter Made in China.com, 2016 & GIBB, 2015
Estimate from product price list
4.19 Meter reading cost
R120 /meter Saayman, 2016
4.20 Meter operation & maintenance cost
R25 /meter/month N/A Based on capital cost of meter
4.21 Billing cost R10 /bill GIBB, 2015 Expected new Consumption for Advanced Metering 4.24 Billed metered 465 N/A All properties in pilot study
UCT MASTERS THESIS CASE STUDY REVIEW OF ADVANCED WATER METERING APPLICATIONS IN SOUTH AFRICA
MASTERS DISSERTATION | OCTOBER 2017 Page | (126)
No Parameter Value Source Comment consumption area
4.24 Billed metered unit consumption
80 kl/property/month N/A
4.26 Illegal consumption
N/A N/A
4.26 Illegal connections unit consumption
80 kl/property/month N/A
Fraction of Properties Paying for Water 4.29 Billed metered
consumption 100% N/A
4.31 Ave time between meter readings (months)
1 N/A Congruent with monthly billing cycle
a) Proposed System Parameters
• A RealSens Advanced Meter Reading technology was the requirement for the pilot scheme in Epping (De Beer, 2010).
• Both SANS 1529-1 and SANS 1529-9 compliance are applicable to advanced metering technology and therefore it is a legal requirement for the advanced meters to comply with these standards. The system and meters installed complied with these standards in all cases.
• A mean battery life claimed by the manufactures for AMR communication systems is 15 years for ultra-low power radio systems, but this varies with the frequency of readings taken (De Beer, 2010). However, 7 years was the value for advanced meters obtained from City of Cape Town (Pontia, 2016) and it is this conservative value that was adopted here.
• A modular unit which allows the battery to be replaceable in the field was input as the typical characteristic of the AMR system proposed since this was considered to be the preferred option for maintenance and operational cost management.
• A meter service life of 5 years for the AMR system was obtained from the City of Cape Town (Wendell, 2016) based on their current installations as well as historical records of faulty meters.
b) Failure rates
• A 5% meter failure rate was obtained from CoCT based on the pilot area O&M experience (Wendell, 2016).
• The electronics and other components (e.g. valve) failure rate parameter was 7.5%. This was based on the CoCT radio failure rates reported for the AMR system in Epping due to various reasons (Wendell, 2016).
UCT MASTERS THESIS CASE STUDY REVIEW OF ADVANCED WATER METERING APPLICATIONS IN SOUTH AFRICA
MASTERS DISSERTATION | OCTOBER 2017 Page | (127)
• Similar to the above, the failure rate due to vandalism was also based on the AMR pilot project experience shared by CoCT. Failure rates due to vandalism were approximately 2% of the total meters installed (Wendell, 2016).
• The other failure rate approximation of 4.2% was also obtained from the City of Cape Town (Wendell, 2016). This value accounted for failures whose exact cause was not identified in the historical records provided.
c) Costs
• The typical advanced meter price adopted was R1 500 based on an average of the Utility systems and Lesira Teq advanced meter unit costs provided in a study for eThekwini (GIBB, 2015). This unit price as explained in the table above was reduced to R1 241.94 to account for the 83% fraction of meters replaced.
• A similar approach as that taken in the proposed conventional metering case was used to determine the installation cost of AMR and compared with the GIBB, 2015 report value for installation of prepaid meters. Since these two values coincided, the R1 500/meter installation cost was adopted here with a reasonable degree of certainty. However, as with the meter price above, this unit cost was also reduced by the fraction of meters replaced to R1 241.94.
• For communication infrastructure costs, a table with estimates of AMR meter configuration was reviewed with similar focus on the more competitive Utility systems and Lesira Teq costs (GIBB 2015). The mobile data collector unit costs were excluded since the AMR system used in Epping was a remote reading system at the time of implementation. An average of R14 130 rounded off to R15 000 was therefore adopted here in the absence of further information.
• The payment infrastructure cost was omitted from the table since the AMR system used for this case study was a post payment system similar to that of conventional meters thus requiring no vending infrastructure.
• The battery replacement costs for this AMR system were obtained by comparison of an advanced meter battery product price list (Made in China.com, 2016) and the GIBB 2015 value of R197 for Elster Kent Battery replacement costs. The average price of R220 /meter was adopted on the assumption that the amount for associated labour/installation costs would be included in the meter operation and maintenance costs.
• The R120 /meter value for advanced meter reading cost was obtained from CoCT (Saayman, 2016).This value is assumed to account for the operation and maintenance of the AMR add-on hardware and software data management systems.
• Similar to the conventional case and in the absence of more conclusive information, to estimate the typical advanced meter operation and maintenance costs, a ratio of 15% of the capital cost of just the advanced meter
UCT MASTERS THESIS CASE STUDY REVIEW OF ADVANCED WATER METERING APPLICATIONS IN SOUTH AFRICA
MASTERS DISSERTATION | OCTOBER 2017 Page | (128)
unit per annum was obtained. An estimate of about R225 per annum and thus approximately R19 /meter/month was found. To account for communication infrastructure maintenance costs, 15% of the R 15,000 was obtained (R 2, 250) and divided by the no. of meters to get a unit cost of R4.83 per annum. Although this value was per annum, it was added to the monthly value of the unit meter above in order to obtain a conservative overall summation of R 25/meter/month.
• The billing cost of R10 /bill as adopted from GIBB, 2015 in the Section 7.7.1.2 has been maintained for this metering system since conventional billing was retained.
• No additional communication system operating costs are expected in this AMR system either because no sms or mobile applications typically used in prepaid systems are applicable in the conventional billing system that was used here. All communication costs have thus already been included in the 4.16 value given before.
d) Expected Consumption
• The AMR system was not expected to have any impact on consumption and billing, and thus these were assumed to be identical to the conventional meter system above.
• The same 100% fraction of billed metered consumption properties paying for water as in Section 7.7.1.3 above was maintained as the conventional billing system was still applied in this system.
• The same average time between meter readings per month of 1 as in Section 7.7.1.3 was maintained. This is because even as the AMR technology has the capability of taking daily or even hourly meter readings (De Beer,2010), the Epping case largely was meant to pilot and test the benefit of these functionalities. The conventional meter reading and billing cycle therefore remained as in the past in spite of this potential.
Results
The four tables below provide the technical, social, environmental and economic results for the Epping case study calculations based on the input parameter values above.
7.7.2.1 Technical Result
The technical results of the evaluation are summarised in Table 31 showing compliance with SABS standards for both conventional and advanced meters. However, the advanced meters had about twice the failure rates of the conventional meters and the multiple components required to make them work imparted heavy logistical requirements on the project.
UCT MASTERS THESIS CASE STUDY REVIEW OF ADVANCED WATER METERING APPLICATIONS IN SOUTH AFRICA
MASTERS DISSERTATION | OCTOBER 2017 Page | (129)
1. TECHNICAL
No Property Conventional
metering (baseline) Advanced metering
1.1 SABS compliance Yes Yes
1.2 Number of meters to replace (/month) 3 7
7.7.2.2 Social Result
The social results are shown in Table 32 below. The social feasibility aspect was not critical for this case study since the focus was on industrial and not domestic consumption. However, social recommendations to do with time scheduling to minimise project interruption of industrial activities and liaison with all relevant electricity or street lighting authorities among others are included in the case study report.
2. SOCIAL No Property Value
2.1 Current rate of meters vandalised (/year) 2.0% 2.2 Unemployment rate -
2.3 Volatility of community (No of protest or mass action incidences per year) -
2.4 Average water bill (/month) R2,736.00 2.4 Average property income (/month) - 2.5 Water bill as a fraction of income N/A
7.7.2.3 Environmental Result
The environmental results are shown in Table 33 below.
No reduction in consumption was observed for either metering case. 66 batteries per year require disposal in the AMR case and this as well as the fact that some of the AMR components need a permanent power source to run makes this AMR scheme even less environmentally friendly.
When viewed from the scope of the evaluation framework, all cases of the metering scheme scenarios run on a surplus. However, while the above model input parameters once applied to the framework calculations reveal that investment in a new conventional metering scheme doesn’t cause any change in the operational surplus of the existing scheme, investment in the AMR scheme causes a R76 747.07 /month reduction in the operational surplus of the existing scheme. This is because the utility has an increased expenditure cost with the new AMR scheme and yet there is no increase in the total income obtained from it compared to the existing or conventional case. As such, more income is required to offset the increased operational costs leaving the utility with a lower operational surplus than before.
No capital payback period can thus be calculated for the new conventional metering case. This is not the case for the AMR scheme which has a negative capital payment period and eventual effective surplus that renders this scheme economically unfeasible.
UCT MASTERS THESIS CASE STUDY REVIEW OF ADVANCED WATER METERING APPLICATIONS IN SOUTH AFRICA
MASTERS DISSERTATION | OCTOBER 2017 Page | (132)
Thus for this case study, it is clear that a conventional metering system is a better choice than the AMR in all respects and comes at a significantly lower financial risk with a total capital cost of R500 500 compared with R1 170 000 for AMR .
7.8 Lessons Learnt
Several lessons were learnt, both during project implementation and the subsequent system operation. These are divided into the economic, social, environmental and technical subsections below for easy comparison with the evaluation framework criteria.
Economic
Advanced metering systems require both high capital investment and operating costs. Their appurtenant communication infrastructure and its maintenance are additional costs to those already being placed on the city for meter operation and maintenance requirements. As such, it is hard to justify the installation of AMR/AMR systems from a direct financial benefit/cost perspective, particularly where it is being purely viewed purely as a replacement for manual meter reading (Saayman, 2016 & De Beer, 2010). An example of this is where existing water meters can be upgraded to advanced systems and yet the unit costs of some of the additional components for example Meter Interface Units (MIU’s) can vary from R 65 to R650, which eclipses the cost of some conventional meters (Saayman, 2016).
Careful consideration should be given to the operational capability of the municipality in terms of infrastructural and human capacity needed to handle and integrate the AMR operational demands into the existing water metering system ones. Investment into building this type of capacity (billing, operation and maintenance) is another indirect expense the city will have to incur for successful AMR implementation (Saayman, 2016).
The legality of using AMR records for billing purposes was another issue that came to the forefront. Where there is a dispute, the physical meter reading is usually sacrosanct as opposed to the AMR reading (Pontia, 2016). In addition, according to the City of Cape Town, a municipality cannot legally use AMR records for billing for more than six months without physical readings and a meter audit being conducted after this duration (Pontia, 2016). The cost implications of this as well as its policy restrictions on the municipality particularly in cases of customer complaints/ bill disputes should consequently be considered.
The water tariff restrictions that municipalities face mean that their main revenue source to recuperate AMR system costs is limited (Saayman, 2016 & De Beer, 2016). As such, a more holistic financial and cost analysis over the entire project lifecycle of these systems which incorporates more than just their direct and short term outcomes should be done before large scale implementation is carried out.
UCT MASTERS THESIS CASE STUDY REVIEW OF ADVANCED WATER METERING APPLICATIONS IN SOUTH AFRICA
MASTERS DISSERTATION | OCTOBER 2017 Page | (133)
Social
As highlighted in Section 7.5 on challenges faced, significant social impacts and ways of minimising them had to be developed from this AMR pilot project.
The AMR project had numerous affected parties whose usual operations would be impacted by the works to be done. As such, notifications of the upcoming works as well as their planned timeline are critical to minimise the interruptions to scheduled activities as well as customer complaints during contract implementation (De Beer, 2010). Municipalities should therefore take this into account in planning their community awareness approach as well as in setting realistic project timelines. Although this lesson is included here, it is important to note that it is not exclusive to advanced metering and would therefore apply to conventional metering projects as well.
AMR systems because of their different components for example the GSM unit which requires a permanent power source to work, impart additional logistic demands on the implementing agency. Therefore liaison and coordination with all the different stakeholders and/or parties needed to successfully complete the project is vital to avoid unnecessary delays, a few of which were mentioned in Section 7.5.1 above (De Beer, 2010).
The City of Cape Town has a highly unionised staffing component. This implies that in order to avoid job losses to meter readers when remote meter reading systems are in place, a re-assignment or training programme for them needs to already be in place. In this project this issue was addressed by re-deployment of meter readers to meter inspectors who used the AMR data as a tool to plan and execute inspections of identified problems in the pilot study areas (De Beer, 2010). Future implementations of this kind therefore require that the city has a clear policy in this regard.
Even as notification of the upcoming works is important as stated above, the attitudes of different consumers to this technology will not be addressed without community education programmes and awareness campaigns (Saayman, 2016). These should be done in the early feasibility phases of the project to aptly assess whether these technologies will be accepted by communities and if not, whether attitudes can be changed prior to implementation. This type of community involvement creates ownership of the AMR infrastructure and consequently minimises incidents of mass protest and vandalism that would otherwise arise.
Environmental
Significantly higher battery replacement needs have been observed for AMR technologies. This is because unlike conventional systems, for modular AMR communication units which run on batteries, excluding defective batteries that required replacement shortly after installation, replacement after the 7-8 year battery life typically claimed by manufacturers will be required (Pontia, 2016). The environmental
UCT MASTERS THESIS CASE STUDY REVIEW OF ADVANCED WATER METERING APPLICATIONS IN SOUTH AFRICA
MASTERS DISSERTATION | OCTOBER 2017 Page | (134)
impact of this battery disposal if advanced meter roll outs are done on a wide scale would therefore need to be considered and planned for accordingly.
Additionally, some AMR communication components require a permanent power source to work. The electricity requirements for operation of AMR systems are therefore higher than those of the conventional metering and the environmental impact of this will also need to be weighed in during the AMR planning phases.
Due to AMR technology’s ability to monitor consumption patterns and thus detect illegal connections and leakages, one of the Epping project recommendations was that it be installed on large consumer meters as well as bulk and zonal meters in future projects. This way, it could initiate leak detections and save large volumes of water otherwise lost within the network as well as reduce power requirements during the production stage of these lower volumes (De Beer, 2010).This advanced metering potential for water demand reduction through leak detection also has the environmental benefit of reducing the depletion of scarce water resources. These benefits can be factored in as motivations for AMR implementation on bulk water infrastructure.
Technical
Due to the multiple components for the functioning of advanced metering projects, there were a large number of technical lessons learnt both during and after project implementation. For easy categorisation of these lessons, three subsections namely Logistics, Operations and Maintenance and Procurement are used.
7.8.4.1 Logistics
Compatibility Issues were the major cause of the increased logistical requirements during AMR project implementation and the methods adopted to cope with these issues explained below:
• For accuracy of consumer billing, matching of the contractor’s AMR records and meter database with the existing municipal revenue and billing systems to ensure coherence was required. For Epping, this necessitated the use of specialised meter audit software used in conjunction with a hand-held electronic data capture device. With this system, the contractor could reconcile the billing database with actual field installations, update the meter record, synchronise the meter readings with the RealSens AMR database and obtain a GPS position fix of each meter installation (De Beer, 2010).
• In ensuring that the new meters supplied were compatible and thus easily upgradable to AMR; one problem faced in the Epping project was the high percentage of failures of reed switches and meter pulse outputs supplied by the meter manufacturers. This necessitated the AMR contractor to develop a very sensitive electronic Hall Effect reed switch with no moving parts which was able to reduce the number of failures to near zero (De Beer, 2010). Strict
UCT MASTERS THESIS CASE STUDY REVIEW OF ADVANCED WATER METERING APPLICATIONS IN SOUTH AFRICA
MASTERS DISSERTATION | OCTOBER 2017 Page | (135)
procurement guidelines should therefore be used to ensure that durable advanced meters are obtained.
• Compatibility of the municipal operational software/billing systems with the contractor’s system was another logistically demanding issue faced during this project. A municipal policy on whether future AMR installations will require synchronisation or adoption of new meter record infrastructure by the municipality needs to be formulated before any future AMR roll outs are carried out (Saayman 2016).
The second major cause of logistical complications was the installation requirements and/or procedures for each separate AMR component to ensure that they all work effectively as a whole. The following lessons were learnt in this regard:
• Traffic movement and/or parking over transmitting units attached to meters were noted to interfere with data transmissions in some cases. As such, changes to network software had to be made to improve signal reception and consequently avoid invalid zero consumption reads (De Beer, 2010).
• Particular requirements like line of sight and continuous power sources needed by the different AMR components meant that multiple locations were required in which to mount these components (De Beer, 2010). Obtaining ideal locations and approval for their use therefore required more time than would be the case for conventional meters. It is hoped that in future, alliances and liaison between different municipal authorities can be made to ease this work.
7.8.4.2 Maintenance and Operations
A number of innovations and improvements that should be made to the city’s operation and maintenance processes were observed in due course of this project that could assist future AMR implementations. These included the following:
• Due to the more advanced skill sets needed to ensure smooth operation and maintenance of the additional hardware and software components of an AMR system, the need to have maintenance contracts in place as municipal staff are trained and equipped to handle these systems was realised (Saayman,2016).
• The municipal staff expressed discontent with the process through which meter data from the AMR systems had to be obtained. Of particular concern was the fact that this data had to first go through the manufacturer’s network for interpretation before it could be forwarded to the city (Saayman, 2016). The quality controls, security and privacy issues around this therefore needed to be more critically considered prior to new implementations.
• Coordination of the different meter maintenance teams and exercises was observed to be required. This would avoid work duplication, redundancy of previously requested repair materials and erroneous meter maintenance scheduling (Saayman, 2016).
UCT MASTERS THESIS CASE STUDY REVIEW OF ADVANCED WATER METERING APPLICATIONS IN SOUTH AFRICA
MASTERS DISSERTATION | OCTOBER 2017 Page | (136)
• Due to the important role that well covered and constructed meter chambersplay in protection and durability of meters and their additional components,continuous monitoring and reporting programmes on them should be in place(De Beer, 2010). This activity could be assigned to the meter readers as part ofthe labour reallocation aspect of implementation.
• Incomplete meter serial numbers and characteristics were noted to have beeninput into the initial municipal metering database. Continual meter audits andupdates of these databases as well as emphasis on the need for meter readersto take proper field records should be carried out (De Beer, 2010).
• A phased approach starting with the city replacement of all incompatible meterswith pulse output meters was suggested as a means of easing future AMRimplementations (De Beer, 2010).This will eliminate the need for meterreplacement and its associated logistics in future AMR implementation projects.
• Investigation of the meters which the audit results found to be missing shouldbe done since it will potentially save the city the losses accruing from theseunrecorded consumptions (De Beer, 2010).
• The municipality would also benefit from a feasibility study on the installation ofmeters above ground since it is anticipated that these installations would becheaper, reduce vandalism as well as eliminate the risk of meter chamberflooding.
• Meter, chamber and valve inspection and maintenance should be done regularlyto ensure all necessary cleaning and repairs are carried out. Identification ofvandalism and/or illegal connections will also be assisted by these inspectionprocesses (De Beer, 2010).
7.8.4.3 Procurement
Due to the unique characteristics of each of the AMR components, a number of guidelines to assist the municipality in future advanced metering procurement processes were made and include the following:
• IP68 compliance of meters supplied to ensure their functionality in instanceswhere areas have high water tables should form another procurement technicalrequirement (Pontia, 2016)
• Future meter supply contracts should allow for meters with multi-drilled flangessince these can easily be connected to adjacent fittings when meterreplacements are required (De Beer, 2010).
UCT MASTERS THESIS CASE STUDY REVIEW OF ADVANCED WATER METERING APPLICATIONS IN SOUTH AFRICA
MASTERS DISSERTATION | OCTOBER 2017 Page | (137)
8 DISCUSSION
8.1 Introduction
This chapter provides an overview of the main findings in the above case studies with highlights of the trends observed throughout the case studies. Details of the overall benefits, challenges and lessons learnt from implementing the metering projects in Chapters 4 to 7 above are also given and can be used as recommendations and points of caution when proposing new advanced metering projects.
8.2 Main Findings
Most of the case municipalities cited debt management and cost recovery among their main objectives for installation of the advanced metering schemes. However, significant drawbacks in achieving these objectives through advanced metering seem to have been the overall experience. Other common trends observed from the case study evaluation framework results are given below.
Costs
The above case studies generally show advanced metering systems to have higher operation and maintenance costs. In fact, the Figure 14 below clearly depicts that for all case studies, even as increased O&M costs and significantly higher capital costs are required for the advanced metering schemes compared to the conventional ones, only minimal or in some cases no increment in income is earned from them, regardless of the increment in payment rates due to these advanced meter installations.
UCT MASTERS THESIS CASE STUDY REVIEW OF ADVANCED WATER METERING APPLICATIONS IN SOUTH AFRICA
MASTERS DISSERTATION | OCTOBER 2017 Page | (138)
These advanced metering schemes are therefore a riskier economic investment than the conventional ones with negative payback periods obtained in some advanced metering cases implying that the investment costs would never be paid back. The table 35 below also depicts much higher negative effective surpluses for the advanced compared to the conventional metering schemes showing that they are economically less feasible schemes.
Income(R/meter) Capital Costs(R/meter) Operation and MaintenanceCosts(R/meter)
WMDs in Cape Town Prepaid Meters in Olievenhoutbosch
Prepaid Meters in iLembe AMR in Epping Cape Town
Figure 14: Economic Results of the different case study areas)
Table 35: Effective surplus of conventional and advanced metering schemes
UCT MASTERS THESIS CASE STUDY REVIEW OF ADVANCED WATER METERING APPLICATIONS IN SOUTH AFRICA
MASTERS DISSERTATION | OCTOBER 2017 Page | (139)
Meter Failure Rates
All the advanced metering schemes were also observed to have higher failure rates than the conventional ones as shown in Figure 15 below. This was in fact one of the contributing factors to their increased O&M costs compared to the conventional metering systems as indicated above.
The above increased technical failure rates could be attributed to several factors some of which include the following;
• On-site leakage and thus premature cut-offs • Incompatibility of some AMR add-on components with the existing meters. • Data transmission problems due to signal interference from various objects. • Field installation complications particularly for AMR with multiple
components
Therefore the increased functionalities for which these metering systems were installed required more intensive operation and maintenance activities to be achieved.
Consumption Changes
The figure 16 below shows the level of domestic consumption for both advanced and conventional metering schemes with conventional schemes taken as the baseline/existing system consumption. It is observed that 2 out of the 3 domestic consumption case studies show decreased consumption as a result of advanced meters. In water scarce regions, this could be an overwhelming reason for their installation.
0.00%
5.00%
10.00%
15.00%
20.00%
25.00%
30.00%
35.00%
WMDs in Cape Town Prepaid Meters inOlievenhoutbosch
Prepaid Meters in iLembe AMR in Epping CapeTown
Conventional meters/year Advanced meters/year
Figure 15: Meter Failure Rates for the Case Study Areas
UCT MASTERS THESIS CASE STUDY REVIEW OF ADVANCED WATER METERING APPLICATIONS IN SOUTH AFRICA
MASTERS DISSERTATION | OCTOBER 2017 Page | (140)
Social Responses
Social responses to advanced metering products are hard to predict. The affordability and community volatility factors highlighted in the evaluation framework should therefore be used just as guidelines and not as replacements for knowledge of the community of interest. For example, although the monthly water bill was found to be less than 5% of the household monthly income and therefore indicated that there was willingness to pay for water in iLembe, the social responses in iLembe described in the case study report above indicated a rejection of the prepaid scheme. In fact even in cases even where the technology was initially accepted, several challenges both during and after implementation were experienced for example;
• Consumer frustration, vandalism and social protests due to high failure rates or when water is shut off at inconvenient times
• Health and safety risks in cases of no emergency reserves for prepaid metering systems
• Consumer inconvenience for example due to proprietary vending options • Billing inconsistencies leading to mistrust • Labour concerns due to job insecurity of meter readers
The need for community involvement is therefore critical throughout the scheme lifecycle in order to change attitudes towards advanced metering as well as enable communities adapt to them.
0%
20%
40%
60%
80%
100%
120%
WMDs in Cape Town Prepaid Meters inOlievenhoutbosch
Figure 16: Domestic Consumption of existing conventional case and advanced metering systems
UCT MASTERS THESIS CASE STUDY REVIEW OF ADVANCED WATER METERING APPLICATIONS IN SOUTH AFRICA
MASTERS DISSERTATION | OCTOBER 2017 Page | (141)
Based on the above main findings as well as the overall case study experiences, a number of benefits, challenges and overall lessons in dealing with the different aspects of advanced metering schemes were obtained. These different overall experiences are provided in the sections that follow.
8.3 Overall Benefits Gained
A number of benefits were gained by municipalities implementing advanced metering systems. The main benefits reported are as follows:
• Reduction in nonrevenue water due to the timely detection of tampering, leaks on consumer properties and improperly functioning water meters.
• Reduced consumption due to the monitoring and restriction of flow by prepaid water meters and WMDs. Reduced consumption supports water demand management efforts and helped defer water infrastructure augmentation projects for example in Cape Town.
• With AMR technology, on-demand meter readings and consumption monitoring could be done, thus reducing the risks to meter readers in reaching inaccessible sites and also enabling water balance calculations to more easily be made.
• Where lower fixed rates were charged for consumers on advanced meters like in Olievenhoutbosch, community acceptance of the system largely resulted in minimal vandalism of infrastructure compared to the conventional meters.
It may be concluded from this list and the case studies that the benefits gained were generally not substantial, could have been gained in other ways and were only experienced in certain cases.
8.4 Overall Challenges Experienced
The case studies showed that, while advanced metering can have benefits, a large number of challenges were also experienced. In this section the challenges that were experienced are discussed under the headings of technical, social and economic challenges.
Technical challenges
This section summarises the main technical challenges experienced in advanced metering projects in South Africa.
High meter failure rates. Advanced water meters have multiple components susceptible to failure. As such, it was found that the failure rates of advanced meters were significantly higher than those of the conventional meters, which required higher replacement rates and repair interventions.
UCT MASTERS THESIS CASE STUDY REVIEW OF ADVANCED WATER METERING APPLICATIONS IN SOUTH AFRICA
MASTERS DISSERTATION | OCTOBER 2017 Page | (142)
Slow response times. A significant lag in the response to some of the advanced meter complaints made by residents is highlighted in a number of studies. This was due to the increased technical failure rates of advanced meters without additional municipal resources to deal with them.
Valves failing in the open position. Automatic shut-off valves malfunctioning and failing in the open position leads to increased non-revenue water.
On-site leakage. In areas with old or poor quality plumbing fittings, a major cause of problems was that on-site losses resulted in premature cut-offs without the full allotment being used by consumers.
Leak and tamper detection. When water meter readers are not visiting meters to take readings, for example with prepaid meters in Olievenhoutbosch, their help in identifying leaks, tampering, vandalism and meter bypassing is also lost.
Incompatibility issues. Where the AMR technology was installed, high levels of incompatibility with existing meters were found, resulting in these meters having to be replaced.
Data transmission problems. Drive-by and remote data collection were found to present significant challenges with failed readings, for instance due to cars or other objects obstructing the signal, interference with the radio frequency signals by electrical devices. Meter chambers with metal lids and buildings with excessive metal cladding and/or steel reinforcing were also found to negatively affect the transmission of radio frequency waves (De Beer, 2010).
Field Installation Complications. In the course of some meter replacements, problems like incompatible meter flange types, incompatible meter box lengths with procured meter sizes and defective shut off valves caused delays in the project implementation (De Beer, 2010).
Accessibility of meter sites. In instances where meters had been installed in customer driveways, break up and reinstatement of these pave-ways was required as part of the meter upgrade process. In spite of prior notification of the project, consumers in some cases resisted or refused to grant the contractor access to their properties where meters were located inside them. Other issues like limited working times prescribed by industrial consumers in order to minimise disruption to their operations lengthened the overall project completion time of some metering projects (De Beer, 2010).This challenge however is not unique to advanced metering but applicable to conventional metering projects as well.
Social challenges
This section summarises the main social challenges experienced in advanced metering projects in South Africa.
Community Perceptions. Significant community biases and disparities in implementation of the different metering strategies in different communities may negatively affect
UCT MASTERS THESIS CASE STUDY REVIEW OF ADVANCED WATER METERING APPLICATIONS IN SOUTH AFRICA
MASTERS DISSERTATION | OCTOBER 2017 Page | (143)
community attitudes towards advanced metering technologies. Implementing advanced metering in volatile areas present several risks of failure when a community rejects the project.
Poor Stakeholder Engagement. In some cases, insufficient consumer education and stakeholder engagement on planned advanced metering implementations results in resistance, for instance due to confusion on the alignment of the metering technology with Free Basic Water supply (the water dialogues, 2008). In some instances, perceptions were created of water being more expensive due to the installation of advanced meters when higher rates actually resulted from improved meter accuracy.
Community protests due to high failure rates. Frustration of customers with multiple failures of advanced water meters and the consequent interruptions to their supply have in many instances led to vandalism of the meters and sometimes even demands of getting the earlier conventional meters back (Mthembu, 2016). These incidents are further exacerbated by minimal consultation prior to implementation and insufficient discussion between municipalities and consumers on the way forward after the advanced meter installations (Wilson, et al., 2012).
Increased Social Tensions. The water restrictions and self-disconnections imposed by advanced meters, both in their proper functioning and malfunctions, have implications for the social environment of consumers. For example, an increased burden is placed on women and children to find alternative water sources and ensure the safety of children when using outside toilets and other instances of this nature (McDonald, 2002). In other cases, begging for water from neighbours causes embarrassment and strains relations between community members (Phaliso, et al., 2010 & Nkomo, 2012).
Consumer inconvenience. Proprietary vending advanced metering options often resulted in the need for consumers to interrupt their schedules to purchase water during the business hours or do without water in cases where it runs out after these times (Ngobeni, 2016).
Health Risks. Water supply interruptions caused by malfunctioning advanced meters and slow response times in addressing them have been found to result in consumers adopting water saving strategies that may carry health risks. These include sharing bath water, recycling dish washing water, going to the toilet in outside bushes to avoid flushing (Pereira 2009 & Kumwenda, 2006). The water-borne diseases and other health complications that may arise from such practices place additional burdens on the municipal health sector.
Labour Concerns. A major labour concern some utilities have to consider is perceptions around job security of meter readers when remote reading or prepaid systems are implemented (De Beer, 2010 & Saayman, 2016).
Litigation. In some instances, the legality of the self-disconnection nature of some advanced meters has been contested in court, requiring municipalities to deal with delays and costs resulting from litigation (Bond, 2008).
UCT MASTERS THESIS CASE STUDY REVIEW OF ADVANCED WATER METERING APPLICATIONS IN SOUTH AFRICA
MASTERS DISSERTATION | OCTOBER 2017 Page | (144)
Dealing with indigent consumers. In instances where indigency grants apply to advanced metering installations, the complex nature of the indigent policy implementation as well as the low level of awareness of residents about these policies sometimes serve to further entrench negative attitudes in the public towards advanced meters.
Consumption Monitoring. In instances where consumers are unable to easily monitor their consumption with advanced meters, increased suspicion and levels of distrust of these devices and the utilities which installed them has resulted (Nkomo, 2012).
Privacy Concerns. Some consumers disagreed with advanced metering due to the notion of privacy invasion through the continual consumption monitoring aspect of AMR systems (De Beer, 2010).
Economic Challenges
Increased Capital Costs. The capital costs of advanced metering systems are substantially higher than those of conventional metering, imposing an additional cost burden on the municipality (Ngobeni, 2016).
Reduced income from water sales. When advanced water meters are installed they often assist or force consumers to reduce their consumption. Poor consumers may aim to stay within their FBW allowance or even seek alternative water sources (Pereira, 2009). Reduced water sales impact on a municipality’s ability to recuperate the increased investment costs of the advanced metering system through water and sanitation charges, and affects the financial viability of these projects.
Increased maintenance costs. Due to the increased complexity of advanced metering, more and better trained staff and greater fund and time resources are required to maintain the meters, increasing the operation and maintenance costs required at the municipal level (Ngobeni, 2016).
Increased non-revenue water. As mentioned in the technical challenges above, prepaid meter device failure in the open position results in large volumes of water being supplied to the consumer regardless of credit availability (Ngobeni, 2016). As such, significant revenue is lost from this unregistered water (Ngobeni, 2016).
Water Tariff implementation: - Implementation of a rising block tariff to prepaid meters was found to be problematic. This is due to the fact that raising block tariffs operate on the basis of particular tariffs for particular amounts of monthly consumption, while credit for prepaid meters allow users to purchase an amount of water for an indeterminate period of time.
Affordability: - In areas where water costs make up a significant fraction of household income, payment for water outside of the FBW becomes problematic for many people regardless of the type of meters used. This may lead to increases in advanced meter tampering and illegal connections and consequently high non-payment levels.
UCT MASTERS THESIS CASE STUDY REVIEW OF ADVANCED WATER METERING APPLICATIONS IN SOUTH AFRICA
MASTERS DISSERTATION | OCTOBER 2017 Page | (145)
Negative effects on home industries. Informal home industries may be affected by water restrictions or costs imposed by advanced metering, limiting the economic resilience of communities.
The above benefits and challenges also helped the municipalities learn about what approaches should best be adopted in implementing these schemes. The considerations in social, environmental, technical and economic terms are provided in the sections below.
8.5 Social Considerations
Community Involvement
Consumer education and awareness is required to improve community attitudes towards advanced metering. Several shortfalls in clarifying the billing, indigency policy and debt rebate or cancellation’s application to the advanced metering implementations still exist and to prevent the consequent worry and rejection of these meters in various communities, extensive awareness campaigns should be in place before these devices are rolled out (Wilson, et al., 2008).Where differing levels of service and metering technologies are in use, this awareness and transparency will avoid confusion and distrust among consumers for utility providers (the water dialogues, 2008).
Multipronged Method
A multi-faceted approach from education of adults and children, water saving device usage and employment of local labour to assist in some of the conservation measures (clearing alien vegetation) should be done concurrently with the advanced metering implementation (Turton, 1999).This approach serves to both permeate information on several levels as well as instil a sense of ownership that makes the advanced metering project sustainable consequently minimising incidents of mass protest and vandalism that would otherwise arise.
Stakeholder Engagement
Many of the studies done on WMDs imply that the acceptance to pay for services does exist in many of these areas (Rodina, et al., 2016). This implies that a need to extensively engage with local leaders and community members to identify and mitigate social burdens on the especially vulnerable in these areas is necessary to build a sense of ownership for these devices in the community.
Other utility stakeholders engagement is also required for example in the AMR case where particular requirements like line of sight, no traffic obstructions and continuous power sources needed by the different AMR components meant that multiple locations were required in which to mount these components (De Beer, 2010). Obtaining ideal locations and approval for their use therefore required alliances and liaison between different municipal authorities to ease this work.
UCT MASTERS THESIS CASE STUDY REVIEW OF ADVANCED WATER METERING APPLICATIONS IN SOUTH AFRICA
MASTERS DISSERTATION | OCTOBER 2017 Page | (146)
Labour Reallocation
Municipalities, particularly those with highly unionised staffing components should ensure that re-assignment or training programmes are in place to avoid job losses to meter readers when remote meter reading systems are in place.
8.6 Environmental Considerations
Water Savings
AMRs and other advanced metering technologies are able to monitor consumption patterns and thus detect illegal connections and leakages. Their installation on large consumer meters as well as bulk and zonal meters should therefore be encouraged to ensure saving of large volumes of water otherwise lost within the network and consequently reduce power requirements during the production of these lower volumes (De Beer, 2010).
Energy Use and Battery Disposal
Advanced metering technologies unlike the conventional ones require battery replacement and disposal. Similar to domestic battery disposal, current smart meter batteries were assumed to be disposed of in the municipal landfill sites since no specific legislation in South Africa currently requires them to dispose of these dry batteries separately (Creamer Media Engineering News, 2014). This however presents high risks of soil and groundwater contamination due to leaching of some toxic chemicals contained in these batteries for example nickel and cadmium (Knights, et al., 2015). However, future environmental legislations to address this, particularly if advanced metering roll outs are done on a large scale, will require that the hidden cost of these battery disposals be included in future AM project costs (Creamer Media Engineering News, 2014).
Additionally, some AMR communication components require a permanent power source to work and so the higher electricity requirements for operation of these systems and the environmental impact of this will also need to be weighed in during the advanced metering planning phases.
8.7 Technical Considerations
Policy Formulation
Due to lack of experience in using these meters at the time of the pilot studies, no policy regarding their use had been previously formulated in most municipalities. As such, the experiences obtained should be used to formulate policies that guide future installations (Ngobeni, 2016).
Procurement
Stricter procurement specifications which combat some of the technical issues experienced in using some of the advanced metering systems should be insisted on. These include SANS 1529 compliance, STS compliance and bi-directional communication,
UCT MASTERS THESIS CASE STUDY REVIEW OF ADVANCED WATER METERING APPLICATIONS IN SOUTH AFRICA
MASTERS DISSERTATION | OCTOBER 2017 Page | (147)
accommodation of step /multi-tier tariffs, compatibility with municipal billing systems, IP68 resistance of meters and multi-drilled flanges. More durable products with minimal failure rates can consequently be obtained.
Disaster Preparedness
The ability to immediately respond to fire and other medical emergencies is critical to saving of life and property (Pereira, 2009). Alternative water sources for emergency cases where self-disconnecting meters are installed or configuration of these meters to allow for emergency reserves are thus critical to their safe implementation in different areas.
Institutional Capacity
Some advanced meters due to their self-disconnection function place significantly higher demands on the maintenance and operation capacity of the municipality. As such, investment into improvement of the utility’s institutional capacity to operate and maintain these devices prior to their roll out is critical to their success and will also prevent disease outbreaks from the unhealthy coping mechanisms adopted in the absence of water (Ngobeni, 2016). This is particularly important in prepaid metering cases where prepayment raises user expectations of the service delivery.
Plumbing and Retrofitting
As mentioned in some of the case studies above, the water losses due to leakage in low income areas is very high. As a result, retrofitting and leakage repair projects prior to implementation of the advanced metering should be done with use of durable high-quality pipes, meters and fittings encouraged in all aspects of low income water infrastructure upgrades. This will also enable municipalities to more accurately ascertain the impact of advanced metering on consumption without errors due to leakage.
Maintenance and Operations
Meter audits, maintenance of updated meter records, meter chamber and valve inspection and preservation as well as continual field inspections to identify leakages and vandalism should be done to both ease future advanced metering implementation works as well as save the city the losses accrued from damaged meters and unrecorded consumptions (De Beer, 2010).
Where more advanced skill sets are required to operate and maintain the added software and hardware components of the advanced metering system, there is a need to train municipal staff or have maintenance contracts in place to run these systems (Saayman,2016 & Ngobeni, 2016).
Compatibility Issues
Incompatibility was one of the major causes of the increased logistical requirements during AMR project implementation in Epping Industrial area. Innovative systems of meter auditing as well as municipal policies clarifying how future advanced metering installations will be synchronised with existing municipal infrastructure should be
UCT MASTERS THESIS CASE STUDY REVIEW OF ADVANCED WATER METERING APPLICATIONS IN SOUTH AFRICA
MASTERS DISSERTATION | OCTOBER 2017 Page | (148)
formulated before any future roll outs are carried out (Saayman, 2016). The quality controls, security and privacy issues around the advanced metering information obtained also need to be clarified prior to new implementations.
8.8 Economic Considerations
Financial Analysis
Advanced metering systems require both high capital investment and operating costs. However, the water tariff restrictions that municipalities face mean that their main revenue source to recuperate advanced metering system costs is limited (Saayman, 2016 & De Beer, 2016). A more holistic financial and cost analysis over the entire project lifecycle of these systems which incorporates more than just their direct and short term outcomes should therefore be done before large scale implementation is carried out.
An example of this is where existing water meters can be upgraded to AMR systems, and yet the unit costs of some of these additional components for example Meter Interface Units (MIU’s) can vary from R 65 to R650, which eclipses the cost of some conventional meters (Saayman, 2016). Another example of this is that continual monitoring of these systems is often restricted to particular clusters for example in parts of Europe to minimise the increased infrastructure running costs (Saayman, 2016).
Vending Infrastructure
Large scale roll out of proprietary based systems is not feasible for some areas since the risk of being locked or tied to a system that may not work is high and the reinvestment into all new advanced system infrastructure not viable. These proprietary systems should therefore only been piloted on a small and therefore manageable scale in a few areas and any new advanced metering procurements should require STS Compliance for bid consideration (Saayman, 2016).
Legal Considerations
The legality of using some advanced meter records needs to be considered for example where there is a dispute, the physical meter reading is usually sacrosanct as opposed to the AMR reading (Pontia, 2016). The cost implications of this as well as its policy restrictions on the municipality particularly in cases of customer complaints/ bill disputes when using AMR technology should consequently be planned for .
The Chapter below provides the overall conclusions of this dissertation and recommendations for further research.
UCT MASTERS THESIS CASE STUDY REVIEW OF ADVANCED WATER METERING APPLICATIONS IN SOUTH AFRICA
MASTERS DISSERTATION | OCTOBER 2017 Page | (149)
9 CONCLUSIONS
Advanced metering (AM) technology is being introduced to augment or replace the use of conventional metering in many parts of the world. This is because of the improved functionalities it offers over those of conventional metering; with intelligent networks that assist municipalities to deal with challenges of water scarcity, non-revenue water losses and poor payment for services among others.
While smart networks consisting of these advanced meters are becoming the norm in many developed countries, the situation in South Africa and other developing countries is more complex. Careful consideration should therefore be given to the various technical, social, environmental and economic factors required to successfully implement these advanced metering technologies in developing countries.
This report reviewed 4 case studies in South Africa in the areas of Cape Town, iLembe Municipality and Olievenhoutbosch, Tshwane to better understand how advanced metering technologies have been implemented so far and make a comparative study of advanced metering performance against conventional metering through the use of an evaluation framework.
9.1 Key Conclusions
Advanced metering systems were observed to be substantially more expensive to install, operate and maintain compared to conventional ones. Municipalities should therefore be aware of all the hidden costs in staffing, support infrastructure, repair and replacement of the advanced metering systems prior to their installation.
Advanced metering systems also have significantly higher failure rates than conventional meters due to their increased components whose vulnerability to failure impacts that of the meter. More intensive maintenance operations will be required to ensure that these advanced metering systems function as planned and utilities should equip themselves for this.
In line with the above, municipal personnel responsible for managing the metering schemes should be well trained beforehand to ensure that these metering technologies, most of which are still in early stages of development, can function efficiently.
None of the case studies found that advanced metering could be justified on economic grounds only, and thus other considerations (for example water efficiency and leak detection) should be of higher priority before selecting advanced metering as an option.
Due to the higher investment and overall lifecycle costs of advanced metering compared to conventional metering, utilities should avoid looking at advanced metering as a “quick-fix” solution for deep-seated social problems like unwillingness to pay for water services. Setting specific objectives and reviewing all the different options available to meet these objectives should rather be done before advanced metering is conclusively chosen.
UCT MASTERS THESIS CASE STUDY REVIEW OF ADVANCED WATER METERING APPLICATIONS IN SOUTH AFRICA
MASTERS DISSERTATION | OCTOBER 2017 Page | (150)
9.2 Recommendations for further Research
Although the Epping case study was based on industrial-consumption, this report primarily looks at advanced metering performance under single-household domestic consumption. Municipalities however monitor and bill various other domestic, commercial, industrial and institutional consumers and therefore further research into the use of advanced metering technology for these other user categories would provide a more holistic economic and overall view of their performance at municipal level.
New advanced metering products and technologies are continually being developed to meet current municipal demands. The case studies reviewed in this report however refer to advanced metering products that were installed in most cases over 10 to 15 years ago. A market survey of the current products and their performance under different field conditions would be useful in technical assessment of particular meters before any large-scale installations are done.
Since most of the case studies reviewed in this report were pilot projects for the advanced metering technologies used, municipal policies on issues like compatibility of AM communication systems with existing billing systems, legality of use of the AM readings for billing, rising block tariff application to prepaid technologies, performance requirements and guarantees and several others were not yet in place. More detailed research on overall policy recommendations including procurement, by-laws and legislation for implementation of these metering systems would better guide and protect municipalities who are just starting to implement these schemes in South Africa.
In most of the above case studies, municipal billing records were used to estimate the evaluation framework consumption and payment rates before and after advanced meter installation. However changing tariffs, on-site leakage and other non-revenue water losses could be partially responsible for the changes in billing records. As such, more detailed studies on the impact of AM technology on actual consumption and payment rates which take into account the above factors should be done. This would give municipalities a better idea of what to expect in implementing these schemes.
The prohibitive costs of advanced metering as shown in the case studies above make them a 2nd choice to conventional metering in measuring domestic consumption. However, a study on the impact of advanced metering use on bulk and zonal meters which are fewer in number yet measure large volumes of water would assist municipalities to more specifically direct these kind of investments where higher chances of pay-off are guaranteed.
Under environmental considerations, limited information outside the current disposal of the advanced meter batteries in landfills is known. The potential for advanced meter battery recycling and safe disposal should be investigated so that innovative ways of dealing with the increased waste stream from large-scale roll-outs of these metering schemes can be found.
UCT MASTERS THESIS CASE STUDY REVIEW OF ADVANCED WATER METERING APPLICATIONS IN SOUTH AFRICA
MASTERS DISSERTATION | OCTOBER 2017 Page | (151)
In obtaining figures for economic evaluation of the above case studies, it was observed that since the revenue and technical departments of the municipalities are often separately managed, it was often difficult for either one to conclusively assign a particular cost to the different technical operations being done to maintain the metering systems. Financial tracking of the various unit costs involved from water production to its end-use in the municipality would therefore assist municipalities to more effectively target any cost recovery interventions made along the water resource management supply chain. Models can be revisited as more of these costs become available.
9.3 Contribution to Knowledge
A South African case study review which provides an in-depth understanding of the economic life-cycle costs of advanced metering systems in an attempt to test their feasibility relative to conventional metering has not been done. This report can therefore be used to assist further research attempts in the field of advanced metering use.
In addition, for municipal cases where site-specific knowledge is unavailable, the values in this report and its appendices can offer useful guidelines that enable a preliminary feasibility study of the proposed metering scheme to be done.
UCT MASTERS THESIS CASE STUDY REVIEW OF ADVANCED WATER METERING APPLICATIONS IN SOUTH AFRICA
MASTERS DISSERTATION | OCTOBER 2017 Page | (152)
10 REFERENCES
AlAbdulkarim, L., Lukszo, Z., & Fens, T. (2012). Acceptance of Privacy-Sensitive Technologies: Smart Metering Case in The Netherlands. CESUN.
Anglian Water.(2014). Anglian Water explores efficiency with Elster Smart Meters
Aqua-Loc. Aqua-Loc Water Demand Management System. Retrieved July 2016 from http://aqualoc1.co.za/?q=node/7
Blom, A., Cox, P., & Raczka, K. (2010). Developing a Policy Position on Smart Water Metering.
Bond, P., & Dugard .J. (2008). Law, Social Justice & Global Development Water, Human Rights and Social Conflict: South African Experiences in (An Electronic Law Journal)
Bond, P. (2008). “The Case of Johannesburg water. What really happened at the prepaid Parish pump”: Centre for Civil Society (CCS), University of Kwazulu Natal & Jackie Dugard Centre for Applied Legal Studies(CALS) , University of Witwatersrand)
Bond, P. (2011). Political-ecological and political-economic conflicts over water management in Durban, South Africa
Booysen Chevon @Chevonbooysen. (2016). Water meter woes. Retrieved June 8, 2016, from http://www.news24.com/southafrica/local/peoples-post/water-meter-woes-20160509
Brown, J., Nevada, T. S., Francisco, S., Diego, S., Campos, A., Diegans, S., & Green, N. (2015). California Met Governor ’ s Water Consumption Goals Last Month , Thanks To Rainy December, (December 2013), 2014–2015.
Carden, K., & Armitage, N. (2012). Assessing urban water sustainability in South Africa; not just performance measurement. Water SA, 39 (3).
Carty, B. (2003). Whose hand on the tap? Water privatization in South Africa. CBC Radio's Bob Carty in Durban, South Africa | February 2003. Retrieved July 11, 2016 from http://www.cbc.ca/news/features/water/southafrica.html
Castle, S. (2015). IN DROUGHT-STRICKEN CALIFORNIA , SMART METERS CATCH WATER HOGS , HELP FIND LEAKS. Digital Trends, pp. 2015–2017. Retrieved March 1, 2011 from http://www.digitaltrends.com/home/smart-water-meter-use-in-drought/
Centre for Civil Society. (2016). Social Protest Observatory. Retrieved October 19, 2016, from http://ccs.ukzn.ac.za/default.asp?2,27,3,1858
City of Cape Town. (2009). Draft Water By-law, 2009.
City of Cape Town. (2011). City of Cape Town Tariff Policies 2010/2011.
City of Cape Town. (2012a). Water and Sanitation Department Annual Report 2011/12.
UCT MASTERS THESIS CASE STUDY REVIEW OF ADVANCED WATER METERING APPLICATIONS IN SOUTH AFRICA
MASTERS DISSERTATION | OCTOBER 2017 Page | (153)
City of Cape Town. (2012b). Water Services Development Plan (WSDP) For City of Cape Town 2012/13 – 2016/15
City of Cape Town. (2013a). Water and Sanitation Department Annual Report 2011/13.
City of Cape Town. (2013b). Water Services Departmental Sector Plan for City of Cape Town 2012/13 – 2016/17 IDP Term
City of Cape Town. (2015). Water and Sanitation Tariffs 2015 2016 – City of Cape Town. Retrieved June 9, 2016, from https://www.capetown.gov.za/en/Pages/Results.aspx?k=water%20tariffs
City of Cape Town. (2015b). Service Guidelines & Standards for the Water & Sanitation Department CoCT (Version 3.2)
City of Cape Town. (2015c).Integrated Annual Report, 2015/16.
City of Cape Town; Economic Development Department. (2016). Industrial survey
City of Tshwane. (2006). City of Tshwane Collection Policy - Arrears Accounts (Notice Published For Public Comment and/or Input on a Draft Policy for Implementation in the City of Tshwane Metropolitan Municipality)
City of Tshwane. (2009). Policy on a Standard Procedure for Provision of Water Meters and Billing of Beneficiaries for Subsidized Low Cost Housing Developments.
City of Tshwane. (2010). City of Tshwane Integrated Development Plan; 3rd Revision for 2009/2010.
City of Tshwane. (2012b). Motion 24: Investigation into the Possibility of Installation of Main Supply Domestic Pre-Paid Water Meters on Voluntary Basis.
City of Tshwane. (2015). Withdrawal and Determination of Various Fees, Charges, Tariffs and Property Rates and Taxes Payable to the City of Tshwane.
City of Tshwane. (2016). City of Tshwane Water and Sanitation Tariffs (effective from 1st July 2016 to 30th June 2017).
City of Tshwane; Water and Sanitation Division. (2012). Water Loss Management in the City of Tshwane.
Cottle, E ., & Deedat, H. (2002). The Cholera Outbreak: A 2000-2002 case study of the source of the outbreak in the Madlebe Tribal Authority areas, uThungulu Region, KwaZulu-Natal.
Creamer Media Engineering News. (2014). Smart Water Meter Technology. Retrieved July 2017 from http://www.engineeringnews.co.za/article/smart-water-meter-technology-2014-02-05
Cutler, S. (2014). Smart Water Metering Networks An Intelligent Investment? Water World. Available: http://www.waterworld.com/articles/wwi/print/volume-26/issue-5/regulars/creative-finance/smart-water-metering-networks-an-intelligent-investment.html [2016, April 14]
UCT MASTERS THESIS CASE STUDY REVIEW OF ADVANCED WATER METERING APPLICATIONS IN SOUTH AFRICA
MASTERS DISSERTATION | OCTOBER 2017 Page | (154)
De Beer, I. (2010). AMR Pilot Project: Tender 30S 2007/2008 (Hydrometrix Technologies / Cape Digital Solutions JV) For the City of Cape Town
De Beer, I. (2016). Manufacturer Co-operation with the University of Cape Town Research Project on Advanced Meters. [Personal Communication, 4th May 2016].Cape Town. (Unpublished)
De Bruyn, J. (2009). Automated Meter Reading – Pilot Project in Cape Town. Presentation at African Utility Week.
De Sousa-Alves, M. (2013). Update and Additions to Existing Long-Term Water Conservation and Water Demand Management Strategy - Water & Sanitation and Water Demand Management: City of Cape Town
Department of Water Affairs (DWA). (2014). Water Boards as Regional Water Utilities (Institutional Arrangements to Facilitate Turnaround) - Legal, Financial and Other Implications.
Department of Water Affairs and Forestry (DWAF). (2009). Water Reconciliation Strategy Study for the Kwazulu Natal Coastal Metropolitan Areas. First Stage Strategy: Water Conservation and Demand Management.
Donne, D.R. (2009). Inter Press Service (IPS). SOUTH AFRICA: Water Meters for the Poor: New Name, Old Problems. Retrieved June 8, 2016, from http://www.ipsnews.net/2009/03/south-africa-water-meters-for-the-poor-new-name-old-problems/
Electa, K.U.L.E. et al., (2008) An evaluation of two-way communication means for advanced metering in Flanders ( Belgium).
Environmental Monitoring Group (EMG). (2016). Water management devices: update and new perspectives. Presentation from EMG water and climate change seminar in September 2015. Retrieved June 8, 2016, from http://www.slideshare.net/EnvMonGroup/water-management-devices-update-and-new-perspectives
Farrar, L., (with A. Prof. Ulrike Rivett). (2014). Is South Africa’s Free Basic Water Policy Working? A Quantitative Analysis Of The Effectiveness Of The Policy Implementation: Department of Civil Engineering, University of Cape Town (October)
Fletcher, J. Case study: Burbank Water and Power (2013).
French, K. (2015). California’s Worst Drought in History: The Breakdown. Visual News. https://www.visualnews.com/2015/04/13/californias-worst-drought-in-history-the-breakdown/
GIBB. (2015). KST9: Preliminary Feasibility Study for the Use of Prepaid/Alternative Domestic Metering Solutions For EThekwini Water and Sanitation: Non-Revenue Water Branch
UCT MASTERS THESIS CASE STUDY REVIEW OF ADVANCED WATER METERING APPLICATIONS IN SOUTH AFRICA
MASTERS DISSERTATION | OCTOBER 2017 Page | (155)
Green Cape. (2014 a). Market Intelligence Report Water 2014.
Green Cape. (2014b). Smart meters survey :Status of and barriers to the local manufacturing and roll out of smart and smart enabled prepaid meters 2013-2014 (March)
Green Cape. (2014 c). Smart Meters:-Technology Review and Role in the Western Cape 2013 -2014 (March)
Hellberg, S. (2005). Talking About Water: Discourses and Hydropolitics in South Africa; Perspectives on Equity, Sustainability and Economic Efficiency. Department of Human Ecology, University of Lund.
hellopeter.com. (2015). no water in my home. Retrieved September 30, 2016, from https://hellopeter.com/ilembe-district-municipality/reviews/no-water-in-my-home-1889639
Herbst, J. (2015). Ilembe switches to prepaid water. Prepaid system to solve administrative issues. Retrieved September 30, 2016, from http://northcoastcourier.co.za/35341/ilembe-switches-to-prepaid-water/
Heymans, C., Eales, K. & Franceys, R. (2014) The Limits and Possibilities of Prepaid Water in Urban Africa: Lessons from the Field, Washington DC: World Bank Group.
House, L. (2010). Smart Meters and California Water Agencies: Overview and status.
ILembe District Municipality. (2013). IDM Introduces the New Prepaid Metering System in Mandeni
iLembe District Municipality. (2015a). iLembe District Municipality; Integrated Development Plan 2015/2016 Review
ILembe District Municipality. (2015b). Update on WC/WDM Program– Performance in 2014/15 Financial Year and 2015/16 Financial Year Outlook: iLembe District Municipality
iLembe District Municipality.(2016). iLembe District Municipality Water and Sewerage Tariffs 2016/2017
Jabareen, Y. (2009). Building a Conceptual Framework: Philosophy, Definitions, and Procedure. International Journal of Qualitative Methods, 8.
Knights, B.D.H., & Salojee, F. (2015). LITHIUM BATTERY RECYCLING: Keeping the future fully charged. A Green Economy Research Report. Department of Environmental Affairs South Africa.
Kumwenda, K.M. (2006). Pre-paid Water Metering: Social Experiences and Lessons Learned from Klipheuwel Pilot Project, South Africa. Masters Dissertation, University of the Western Cape.
UCT MASTERS THESIS CASE STUDY REVIEW OF ADVANCED WATER METERING APPLICATIONS IN SOUTH AFRICA
MASTERS DISSERTATION | OCTOBER 2017 Page | (156)
Littlefair, K. (1998). Willingness to Pay for Water at the Household Level: individual financial responsibility for water consumption, London: Water Issues study Group School of Oriental and African Studies (SOAS) University of London.
Lugoma, M.F.T., Van Zyl, J.E., & Ilemobade, A.A. (2012).The extent of on-site leakage in selected suburbs of Johannesburg.
Made in China.com.Water Meter Battery Price List. Retrieved June 13, 2016, from http://www.made-in-china.com/products-search/hot-china products/Water_Meter_Battery.html
Mainguet, C., & Baye, A. (2006). Defining a framework of indicators to measure the social outcomes of learning. Measuring the effects of education on health and civic engagement: proceedings of the Copenhagen symposium
Malete, L. (2010) Interact Media Defined. Water meters...what you need to know.
Marah, L., O’ Donovan, M., Finlayson, K., & Boderg, D. (2004). Institutional and Socio-Economic Review of the Use/Application of Electronic Prepayment Meter Technology in the Provision of Water Supply Services to Urban and Peri-urban areas. Water Research Commission Report.
Maromo, J. (2016). Tshwane pursuing R6bn in debts. Retrieved November 25, 2016, from http://www.iol.co.za/news/politics/tshwane-persuing-r6bn-in-debts-2003010
Masoabi, M. (2017) Advanced Water Metering and its Application in Low Income Communities, Masters dissertation, University of Cape Town.
Mathonsi, N.Y. (2014). Annual Report for iLembe District Municipality July 2013 – June 2014; Corporate Governance Unit, iLembe District Municipality.
Mwangi, M. (2017) Advanced Water Metering and its Application in High Income Communities, Masters dissertation, University of Cape Town.
McDonald, A.D. (2002). Cost Recovery and the Crisis of Service Delivery in South Africa.
McDonald, D. A., & Pape, J. (2002). Crisis of Service Delivery in South Africa. London and New York: HSRC Publishers.
Mthembu, N. (2016). Co-operation with the iLembe District Municipality. [Personal Communication, 26th September]. Stanger, iLembe District. (Unpublished)
Nardo, M., Saisana, M., Saltelli, A., & Tarantola, S. (2008). Handbook on Constructing Composite Indicators (1 Ed.). Europe: OECD.
News24. (2015).Water meter concerns put to rest in Cape Town. Retrieved June 8, 2016, from http://www.news24.com/SouthAfrica/Local/Peoples-Post/Water-meter-concerns-put-to-rest-20150428-2
News24. (2016).Water rationing now in place. Retrieved September 30, 2016, from http://www.news24.com/southafrica/local/stanger-weekly/water-rationing-now-in-place-20160719
UCT MASTERS THESIS CASE STUDY REVIEW OF ADVANCED WATER METERING APPLICATIONS IN SOUTH AFRICA
MASTERS DISSERTATION | OCTOBER 2017 Page | (157)
Ngobeni, P. (2016). Co-operation with Pretoria Municipality. [Personal Communication, 25th October]. Pretoria. (Unpublished)
Nicholson, R., Chuang, D., Muallem, D., & Torchia, M. Business Strategy : Smart Water Market Overview (2012).
Nkomo, S. WESTERN CAPE. (2012). New water meters a curse, blessing. Retrieved June 8, 2016, from http://www.iol.co.za/news/south-africa/western-cape/new-water-meters-a-curse-blessing-1401045
northcoastcourier. (2014). iLembe water credits gone with the wind. Retrieved September 30, 2016, from http://mybroadband.co.za/vb/showthread.php/784433-Ilembe-water-credits-gone-with-the-wind
Otieno, F., & Mwangi, P.N. (2002). Costing Calculations of Operation and Maintenance in Commmunity Water Supplies to Ensure Sustainability- Case Studies (2002). Presented at the Biennial Conference of the Water Institute of Southern Africa (WISA)
Papier, M. (2009). Mitchell’s Plain in a water-borne fury. Retrieved July 11, 2016, fromhttp://m24arg02.naspers.com/argief/berigte/dieburger/2009/02/24/PQ/7/mpwatermeters.html
Parliament of the Republic of South Africa (based on Statistics South Africa). (2012). City of Tshwane General and Regional Overview.
Pereira, T. (2009). Household Impacts of Water Management Devices -Summary of Initial Research. 26 November 2009 EMG Water and climate change seminar Presentation.
Peters, S. (2011). Municipal Consumer Debt in South Africa, Chapter 9 in Financial and Fiscal Commission. 2012/13 Submission for the Division of Revenue Technical Report, Midrand, South Africa.
Phaliso, S., & Naidoo, Y. (2010). West Cape News. Cape Town water meters leave poor high and dry. Retrieved June 8, 2016, from http://westcapenews.com/?p=1729
Ntwana, B. (2015). PLAAS SEMINAR: Impact of water management devices (WMDs) on poor households’ access to water services: Case of Samora Machel, Cape Town. Retrieved June 8, 2016, from http://www.plaas.org.za/event/seminar-impact-water-management-devices-wmds-poor-households%E2%80%99-access-water-services-case
Plato, D. (2009). Cape Town tells ANC to stop spreading misinformation. Retrieved July 11, 2016, from http://www.politicsweb.co.za/news-and-analysis/cape-town-tells-anc-to-stop-spreading-misinformati
Pontia, M. (2016). Co-operation with the City of Cape Town. [Personal Communication, 7th June].Cape Town. (Unpublished)
Rodina, L., & Harris, L.M. (2016). Water Services, Lived Citizenship, and Notions of the State in Marginalised Urban Spaces: The Case of Khayelitsha, South Africa. Water Alternatives 9(2): 336-355
UCT MASTERS THESIS CASE STUDY REVIEW OF ADVANCED WATER METERING APPLICATIONS IN SOUTH AFRICA
MASTERS DISSERTATION | OCTOBER 2017 Page | (158)
Ruiters, G. (2007). Contradictions in municipal services in contemporary South Africa: Disciplinary commodification and self-disconnections. Critical Social Policy.
SA Commercial Prop News. (2014). Cape Town Industrial Property Vacancies continue to reduce. Retrieved June 9, 2016, from http://www.sacommercialpropnews.co.za/property-types/commercial-industrial-property/6654-cape-town-industrial-property-vacancies-continue-to-reduce.html
Saayman, B. (2016). Co-operation with the City of Cape Town. [Personal Communication, 7th June]. Cape Town. (Unpublished)
Sandspruit Works Association (SWA). (2014). Sandspruit Works Association (SWA) Annual Report 2013/14.
Sensus. (2012) Taking Measure of Advanced Water Metering Technologies. White Paper.
Sensus. (2013).Shelburne , Ontario Reaps Benefits of Smart Water Network Case Study.
Sensus. (2013). Snow Covered Water Meters : How a Smart Water Network Uncovered Money and Time for Pinetop Water Case Study (2013). Retrieved March 1, 2017 from http://sensus.com/resources/case-studies/snow-covered-water-meters-how-a-smart-water-network-uncovered-money-and-time-for-pinetop-water/
Singh, N., & Xaba, B. (2006). Johannesburg Water's Prepayment Water Meter Appropriate Technology in the Implementation of Project Operation Gcin'amanzi in Soweto. Johannesburg: Johannesburg Water.
Sivatho, N., & De Sousa-Alves, M. (2016). City of Cape Town, Annual Water Services Development Plan Performance – and Water Services Audit Report; FY 2015: City of Cape Town
Statistics South Africa. (2012) Cape Town Profile. Compiled by Strategic Development Information and GIS Department, City of Cape Town 2011 using 2011 Census data supplied by Statistics South Africa.
Statistics South Africa. Census 2011 Municipal Report Kwazulu-Natal. (2012b). 2011 Census data supplied by Statistics South Africa.
Statistics South Africa. Census 2011 Results as of 6th November 2012: iLembe. (November, 2012a). 2011 Census data supplied by Statistics South Africa.
The Local Government Handbook. (2012). City of Cape Town Metropolitan Municipality (CPT) Overview: Geography, History and Economy. Retrieved July 12, 2016, from http://www.localgovernment.co.za/metropolitans/view/6/City-of-Cape-Town-Metropolitan-Municipality
The water dialogues. (2008). iLembe Case Study Full Report.
Thompson, G. (2003). Water Tap Often Shut to South African Poor. New York Times.
UCT MASTERS THESIS CASE STUDY REVIEW OF ADVANCED WATER METERING APPLICATIONS IN SOUTH AFRICA
MASTERS DISSERTATION | OCTOBER 2017 Page | (159)
Thompson, L., Masiya, T., & De, W. P. (2013). Comparative Analysis of the Social Impact of Water Management Devices in Cape Town and EThekwini Municipality. Water Research Commission.
Turton, A.R. (1999). Water Demand Management (WDM): A Case Study from South Africa. MEWREW Occasional Paper No. 4. Presented to the Water Issues Study Group, School of Oriental and African Studies (SOAS) On January 18, 1999
Tweed, K. (2015). Smart Water Meters Gain Traction in Drought-Ridden California. Retrieved March 1, 2017 from https://www.greentechmedia.com/articles/read/smart-water-meters-gain-traction-in-drought-ridden-california
Utility Systems. Prepaid Water Metering System.
Utility Systems. Water Management Device. Retrieved July 22, 2016, from http://www.utility-systems.co.za/water-management-device.html
Utility Systems. (2013). Prepaid Water Metering System.
Van Zyl, H.J., Van Zyl, J.E., Geustyn, L., Ilemobade, A., & Buckle, J.S. (2007). Water Consumption Levels in Selected South African Cities: Water Research Commission Report.
Van Zyl, J.E. (2011) Introduction to Integrated Water Meter Management, ISBN 978-1-4312-0117-4, Report TT 490/11, Water Research Commission, Pretoria.
Viljoen, N. (2015). City of Cape Town Residential Water Consumption Trend Analysis 2014/2015.
Water and Sanitation Tariffs 2015 2016 – City of Cape Town. Retrieved June 9, 2016, from https://www.capetown.gov.za/en/Pages/Results.aspx?k=water%20tariffs
WRC. Water Consumption Levels in Selected South African Cities: Water Research Commission Report.
Wendell, L (2016). Co-operation with the City of Cape Town. [Personal Communication, 7th June].Cape Town. (Unpublished)
Wilson, J., & Pereira, T. (2012). Water Demand Management’s Shadow Side; Tackling Inequality and Scarcity of Water Provision in Cape Town.
Wilson, Z., Malakoana, M., & Gounden, T. (2008). Trusting consumers: Involving communities in municipal water service decision making in Durban, South Africa.
WRP Consulting Engineers. (2009). Water Reconciliation Strategy Study for the KwaZulu-Natal Coastal Metropolitan Areas. First Stage Strategy: Water Conservation & Demand Management For Department of Water Affairs and Forestry
2 INPUT PARAMETERS ........................................................................................ 3 2.1 System parameters ............................................................................................................. 3 2.2 Global parameters .............................................................................................................. 3
Number of Properties .......................................................................................... 3 Water Cost Price .................................................................................................. 4 Applicable Water Tariff ....................................................................................... 5 Billed Unmetered Tariff ....................................................................................... 9
2.3 Current Situation Parameters ............................................................................................. 9 Current Water Consumption ............................................................................... 9 Current Payment Level ...................................................................................... 11 Other Current Parameters ................................................................................. 12
2.4 Proposed Parameters: System Parameters ..................................................................... 17 SANS 1529-1 Compliance .................................................................................. 18 SANS 1529-9 Compliance .................................................................................. 18 Mean Battery Life .............................................................................................. 18 Meter Service Life .............................................................................................. 19 Effective Service Life .......................................................................................... 19 Fraction Failed due to Meter Failure ................................................................ 19 Fraction Failed due to Electronic or Component Failure.................................. 19 Failure due to Vandalism ................................................................................... 20
2.5 Proposed System Parameters: Costs ................................................................................ 20 Meter Price ........................................................................................................ 21 Installation Cost ................................................................................................. 21 Communication Infrastructure Cost ................................................................. 22 Payment Infrastructure Cost ............................................................................. 22 Battery Replacement Cost ................................................................................. 23 Meter Reading Cost ........................................................................................... 23 Meter Operation and Maintenance Cost .......................................................... 23 The Billing Cost .................................................................................................. 24
2.6 Proposed System Parameters: Expected New Consumption .......................................... 25 Expected Billed Metered Consumption ............................................................ 25 Number of Meters Installed .............................................................................. 26 Fraction of Billed Metered Consumers Who Pay ............................................. 26 The Average Time Between Meter Readings ................................................... 26
Capital Payback Period ...................................................................................... 28 Effective Surplus ................................................................................................ 29
CASE STUDY REVIEW OF ADVANCED WATER METERING APLICATIONS IN SOUTH AFRICA APPENDIX A: EVALUATION FRAMEWORK USER GUIDE
MASTERS THESIS | OCTOBER 2017 Page | (iii)
TABLE INDEX PAGE(S)
Table 2-1: System parameters ........................................................................................................... 3 Table 2-2: Global parameters ............................................................................................................. 3 Table 2-3: Water tariff structures FY2015/16 for domestic and non-domestic consumption in
different South African metropolitan municipalities ................................................................ 5 Table 2-4: Ekurhuleni Unmetered Consumption (Ekurhuleni Metropolitan Municipality, 2014) ... 9 Table 2-6: Current situation: consumption parameters .................................................................10 Table 2-7: Current situation parameters: payment level ................................................................11 Table 2-8: Other Current Parameters ..............................................................................................12 Table 2-9: Proposed System Parameters .........................................................................................17 Table 2-10: Proposed Scheme Parameters: Cost.............................................................................20 Table 2-11: Proposed system consumption levels ..........................................................................25 Table 3-1: Key to project evaluation results ....................................................................................27
FIGURE INDEX PAGE(S)
Figure 2-1: Bulk Water Prices in 2003 (Eberhard, 2003) ................................................................... 4 Figure 2-2: The average demand and stand area of 739 suburbs throughout South Africa and
current South African design guidelines (Griffioen & van Zyl, 2014) ........................................ 7 Figure 2-3: Proposed new design envelope curves for estimating the AADD of properties
(Griffioen & van Zyl, 2014) .......................................................................................................... 8
CASE STUDY REVIEW OF ADVANCED WATER METERING APLICATIONS IN SOUTH AFRICA APPENDIX A: EVALUATION FRAMEWORK USER GUIDE
MASTERS THESIS | OCTOBER 2017 Page | (iv)
ABBREVIATIONS AMI Advanced Metering Infrastructure AMR Automatic Meter Reading CDMA Code-Division Multiple-Access GSM Global System for Mobile for communication HAN Home Area Network LAN Local Area Network NIST United States National Institute for Standards and Technology PLC Power Line Communication RF Radio Frequency SEP Smart Energy Profile UMTS Universal Mobile Telecommunications System (UMTS) WAN Wide Area Network WCDMA Wideband code-division multiple-access WMN Wireless Mesh Network WRC Water Research Commission of South Africa WBKMS Web-based Knowledge Management system
CASE STUDY REVIEW OF ADVANCED WATER METERING APLICATIONS IN SOUTH AFRICA APPENDIX A: EVALUATION FRAMEWORK USER GUIDE
MASTERS THESIS | OCTOBER 2017 Page | (1)
1 INTRODUCTION
This appendix describes the application of an evaluation framework for advanced water metering projects. The framework itself is provided as a separate spreadsheet.
It is important to stress that the evaluation framework is meant as a guide to help designers make appropriate decisions on the implementation of advanced metering projects. Advanced metering projects are highly complex and no evaluation tool can replace the engineering analysis and judgement required to make sensible decisions on their implementation.
The framework evaluates projects in four areas:
• technical
• social
• economic and
• environmental
The technical and economic evaluations lend themselves well to calculated parameters and thus make up most of the evaluation framework. Social and environmental evaluations are less amenable to analytical measures and subsequently only a few input and calculated parameters are included in the framework. These are meant to flag issues that might negatively affect the implementation of the project and should not be used as decision variables.
The input parameters are described in table format for each section. Information on the range of values that each parameter can adopt is then presented based on a literature search, survey and case studies. These values can assist users to select appropriate model values where local information is not readily available.
The model is implemented for several case studies in Chapters 5 to 8 of the report.
The survey referred to in this section was developed to obtained relevant information from water metering practitioners with experience in advanced metering projects. The survey was conducted at a workshop on advanced metering held in Midrand in November 2015 and further through approaching practitioners individually. The response rate to the survey was low, but the results were still considered useful in determining a typical range of values. More details on the survey can be found in Masoabi (2017) and Mwangi (2017).
It was seen as important to keep the evaluation framework as simple as possible to make it easy to use and understand. It should be stressed again that the framework is not intended to be used as a black box, but as a tool to help decision-makers identify potential problems and benefits, and thus make rational decisions.
This document is structured as follows;
Chapter 2:- This chapter describes the different input parameters used in the evaluation framework. For each group i.e. System, Global, Current and Proposed; a brief definition of
CASE STUDY REVIEW OF ADVANCED WATER METERING APLICATIONS IN SOUTH AFRICA APPENDIX A: EVALUATION FRAMEWORK USER GUIDE
MASTERS THESIS | OCTOBER 2017 Page | (2)
each parameter is given. Literature which includes typical values for each parameter is also given as a guideline to assist the designer pick an appropriate value for areas where limited information is available.
Chapter 3:- This chapter describes the four different categories of framework results. It gives a brief description of the major key parameters under each indicator category.
CASE STUDY REVIEW OF ADVANCED WATER METERING APLICATIONS IN SOUTH AFRICA APPENDIX A: EVALUATION FRAMEWORK USER GUIDE
MASTERS THESIS | OCTOBER 2017 Page | (3)
2 INPUT PARAMETERS
2.1 System parameters
The system parameters describe the advanced metering project to be analysed. The system parameters are summarised in Table 2-1
Table 2-1: System parameters No Parameter Description 1.1 Analysis ID Unique ID for the analysis 1.2 System name Name of the system analysed 1.3 Suburb(s) Suburb the system is located in 1.4 City City or town the system is located in 1.5 Date Date of analysis
2.2 Global parameters
The global input parameters describe the basic system parameters used throughout the analysis. The summary description of each input parameter is given in Table 2-2 and discussed in the rest of the section.
Table 2-2: Global parameters No Parameter Description 2.1 No of properties The number of consumer connections included in the project 2.2 Water cost price
(R/kl) The production cost of water. Ideally this should include all raw water and water purification costs. Where a bulk supplier is used, this will be the price paid to the supplier for the water.
2.3 Applicable water tariff (R/kl)
The tariff used for consumption-based billing, i.e. billed metered consumption. Most municipalities use rising block tariffs and a representative water tariff should be selected from this structure. It is important to consider the inclusion of a cross-subsidy or Government subsidy as payment for Free Basic Water in the model
2.4 Billed unmetered tariff (R/month)
The tariff used for fixed monthly water billing (i.e. unbilled metered consumption) where this is applicable.
Number of Properties
The number of properties (Item 2.1) gives the number of user connections that exists in a supply area. These include formal and informal connections directly to the system, irrespective of whether they are currently legal connections, metered or paying for the water consumed. However, backyard dwellers that should obtain water from the main dwelling and not from the distribution system should be excluded.
CASE STUDY REVIEW OF ADVANCED WATER METERING APLICATIONS IN SOUTH AFRICA APPENDIX A: EVALUATION FRAMEWORK USER GUIDE
MASTERS THESIS | OCTOBER 2017 Page | (4)
Water Cost Price
The water cost price (Item 2.2) is the cost the municipality incurs in the abstraction and treatment of water before it is supplied to the system. For municipalities that use their own treatment and abstraction facilities, this will be the cost of production. For municipalities that use a bulk water supplier, this is the purchase price of the bulk water. This value excludes distribution system costs such as operation, maintenance, meter reading and billing costs.
According to Eberhard (2003) individual water charges vary widely across South Africa due to the large number of links in the water supply chain that are regulated in different ways and by different entities. Figure 2-1 shows water cost prices for different municipalities in 2003.
The cost prices were adjusted for inflation to 2016 values using inflation calculator for South Africa showing them to vary between R2.65 to R7.96 (Crause 2016). However, Eberhard (2003) found the annual nominal increases in bulk water tariffs to be significantly higher than inflation between 1997 and 2001. Thus these inflation corrected values are likely to underestimate the true production price.
In the practitioner survey four correspondents reported prices between R 6 /kl and R 10 /kl, which corresponds reasonably well with the inflation-adjusted values from Eberhard (2003). Through data acquired from De Sousa (2013) and GIBB (2015), the cost of water in 2016 in Cape Town and Durban were found to be R10 per kl and R5 per kl respectively. Water Boards in South Africa vary in their average bulk portable water
Figure 2-1: Bulk Water Prices in 2003 (Eberhard, 2003)
CASE STUDY REVIEW OF ADVANCED WATER METERING APLICATIONS IN SOUTH AFRICA APPENDIX A: EVALUATION FRAMEWORK USER GUIDE
MASTERS THESIS | OCTOBER 2017 Page | (5)
tariff with the DWAS Report on Water Boards (DWA , 2014) giving a range of R3.20 /kl to R7.55 / kl.
In Australia, the production cost of water in New South Wales was AUD 0.75/kl in 2014 (Beal & Flynn 2014), which is approximately R8.40/kl in South African currency.
Applicable Water Tariff
The applicable water tariff (Item 2.3) is the average price that consumers pay to the municipality for water consumed. Since municipalities use different tariff structures and rising block rates, this value should be the weighted average price paid by consumers in the study.
According to a study on average water demand by suburb (Griffioen & van Zyl, 2014) the daily demand for properties is a function of stand size, but also of a large number of other factors such as income and climate. For smaller property size range that is typical in low income urban areas, unit consumption varied between 6 and 30 kl/month.
In low-income areas the average consumption is often found to be substantially higher due to a lack of maintenance and high on-site leakage rates. However, since these high consumption rates are invariably associated with non-payment for the service, they were not considered when estimating the tariff range paid.
As indicated by Muller (2008), the municipalities have to set the tariffs in a way that high volume users cross subsidise the free basic water allocation. However, with municipalities that are too poor to achieve that, the constitution provides for an inter-governmental transfer, the “equitable share of revenue” from the national level. On the one hand, findings of the feasibility study in eThekwini indicate that value of the free basic water allowance as provided by the National Treasury as R 11.43 /kl (GIBB, 2015).
In South Africa, increasing block tariffs are favoured for domestic metered consumption and non-domestic consumption (i.e. institutional, commercial and industrial). A block tariff comprises of different prices for water based on the amount of water consumed. However, in South Africa each municipality utilizes different water tariff structures.
Table 2-3 compares the water tariff structures for FY2015/16 for domestic consumption in the different South African metropolitan municipalities. Although all municipalities use the increasing block tariff structure, each municipality charges different water prices for different quantities consumed.
Table 2-3: Water tariff structures FY2015/16 for domestic and non-domestic consumption in different South African metropolitan municipalities
Quantity Consumed (kl/month)
Water Tariff by municipality (R/kl)
eThekwini Johannesburg Cape Town Tshwane Ekurhuleni
Domestic Consumption 0 6 9 10
CASE STUDY REVIEW OF ADVANCED WATER METERING APLICATIONS IN SOUTH AFRICA APPENDIX A: EVALUATION FRAMEWORK USER GUIDE
MASTERS THESIS | OCTOBER 2017 Page | (6)
Quantity Consumed (kl/month)
Water Tariff by municipality (R/kl)
eThekwini Johannesburg Cape Town Tshwane Ekurhuleni
Table 2-3 indicates the different water tariffs for domestic and non-domestic consumption in the City of Johannesburg, which have different rates for industrial and commercial users. The rates for industrial users are given in brackets.
In order to select an appropriate tariff bracket it is imperative to determine the consumption range for high-income areas in South Africa. Griffioen and van Zyl (2014) addressed this matter in a study looking to propose a guideline for modelling water demand. This study indicated that the factors having the greatest impact on domestic consumption were household size, prolonged high temperatures, stand area and income. Of these, stand area was the predominant factor. Griffioen and van Zyl (2014) demonstrated the correlation between the Average Annual Daily Demand (AADD) and the stand areas. This is illustrated in Figure 1-2 and Figure 1-3.
CASE STUDY REVIEW OF ADVANCED WATER METERING APLICATIONS IN SOUTH AFRICA APPENDIX A: EVALUATION FRAMEWORK USER GUIDE
MASTERS THESIS | OCTOBER 2017 Page | (7)
Figure 2-2: The average demand and stand area of 739 suburbs throughout South Africa and current South African design guidelines (Griffioen & van Zyl, 2014)
Figure 2-2 shows the consumption range of 739 suburbs against the upper and lower limit of the South African design guidelines. However, 4% were above and 38% were below the upper and lower limits respectively. As such Griffioen and van Zyl (2014) proposed new design envelope curves as is illustrated in Figure 2-3.
CASE STUDY REVIEW OF ADVANCED WATER METERING APLICATIONS IN SOUTH AFRICA APPENDIX A: EVALUATION FRAMEWORK USER GUIDE
MASTERS THESIS | OCTOBER 2017 Page | (8)
Figure 2-3: Proposed new design envelope curves for estimating the AADD of properties (Griffioen & van Zyl, 2014)
Figure 2-3 illustrates that most of the data samples were within the design curve. The data above the upper limit represents very high income consumers and data below the lower limit represents either coastal holiday homes or small, low density rural settlements.
Once the average consumption has been determined, the applicable average water tariff can be determined through a weighted average calculation. This method uses a cumulative procedure where tariff brackets are multiplied by the respective quantities consumed on the bracket. The resulting products are summed up until the accumulative quantity consumed equates to the total quantity consumed. The summations of the products are then divided by the total quantity consumed to get an average rate.
Finally, it should be noted that many municipalities also bill sewer services based on water consumption, normally assuming the sewer flow to be 75% of the water used. Sewer charges can be included in the analysis when appropriate to give a more complete picture of the project. However, if sewer charges are included in the analysis, it is expensive to operate and maintain and the sewer system cost must also be included in the analysis.
CASE STUDY REVIEW OF ADVANCED WATER METERING APLICATIONS IN SOUTH AFRICA APPENDIX A: EVALUATION FRAMEWORK USER GUIDE
MASTERS THESIS | OCTOBER 2017 Page | (9)
Billed Unmetered Tariff
The Billed unmetered tariff (Item 2.4) is the flat rate tariff charged to consumers who are not billed based on metered consumption. This is normally a monthly figure that the municipality charges its consumers based of parameters such as stand size or land use type and consumer category.
The City of Johannesburg charges a flat water rate of R 192.19 /property for indigent consumers (City of Johannesburg, 2014). Marah et al., (2004) found that prior to installation prepaid meters a flat rate of R 50 per month was charged in 2004, which is R97.43 in 2016 terms.
The Table 2-4 below shows the flat-rate tariff rates for Ekurhuleni Municipality
This section deals with the system before any intervention is implemented. It is discussed in three sections;
• Current consumption;
• Current payment rate and
• Other parameters.
Current Water Consumption
Three types of current consumption are used:
• billed metered,
• billed unmetered and
• illegal or unbilled consumption.
CASE STUDY REVIEW OF ADVANCED WATER METERING APLICATIONS IN SOUTH AFRICA APPENDIX A: EVALUATION FRAMEWORK USER GUIDE
MASTERS THESIS | OCTOBER 2017 Page | (10)
A summary description of the required input parameters are given in Table 2-5. The input parameters (with suggested typical, low and a high values) are discussed in more detail in the rest of this section.
Note that a significant fraction of consumption may consist of on-site leakage, which should be included in the consumption values entered in the model. See the discussion of Parameter 3.9 for more information on on-site leakage.
Table 2-5: Current situation: consumption parameters No Parameter Description
Billed metered consumption: No of properties
Billed metered consumption includes all properties that are metered and billed based on their actual consumption.
Billed metered consumption: Unit consumption (kl/property/month)
The average monthly consumption of properties billed on metered consumption
Billed unmetered consumption: No of properties
Billed unmetered consumption includes all properties that are not metered but are billed for water consumption, or are metered but not billed based on their actual consumption. This category is also know as flat rate billing.
Billed unmetered consumption: Unit consumption (kl/property/month)
The average monthly consumption (in kL/month) for billed unmetered consumption.
3.3 Illegal or unbilled consumption (kl/property/month)
Illegal or unbilled connections include all properties that have illegal or unregistered connections to the distribution system. The number of illegal connections is calculated in the model as the total number of properties minus the numbers of billed metered and billed unmetered properties.
3.4 Total/ average The total number of properties included in the analysis is calculated as the sum of the billed metered, billed unmetered and illegal connections. The number of properties has to equal the number of properties (entered under global input parameters).
2.3.1.1 Billed metered consumption
Billed metered consumption range for systems in a reasonably good condition and where consumers pay for their consumption is discussed in Section 2.3.1. In a study on prepaid meters by Marah et al. (2004), in Nkomazi the average unit consumption was found to be 40 kl per household per month before implementation of prepaid meters and 7 kl per household per month after installation (Marah et al., 2004). The survey indicated the value to range from 3 kl/property/month to 15 kl per month.
2.3.1.2 Billed unmetered consumption
According to the feasibility study on prepaid meters in eThekwini, it was established that consumption is reduced from 1 kl/day (30 kl per month) to 0.5 kl per day (15 kl per month) after installing water meters (GIBB, 2015), implying unmetered consumption of 30 kl/property/month. In Phiri (Soweto), the water consumption was reported to be
CASE STUDY REVIEW OF ADVANCED WATER METERING APLICATIONS IN SOUTH AFRICA APPENDIX A: EVALUATION FRAMEWORK USER GUIDE
MASTERS THESIS | OCTOBER 2017 Page | (11)
66.7 kl/property/month prior to installation of prepaid meters when consumers were charged a flat rate for services (Singh & Xaba, 2006).
2.3.1.3 Illegal or unbilled consumption
In low income areas, a study on feasibility of prepaid metering system in eThekwini, the extent of illegal connections was found to range between 0% and 52% (of the connections) (GIBB, 2015). The results of the practitioners’ survey indicate that the fraction ranges from 0 to 70% from 6 respondents.
Illegal connections are seen to be less prevalent in high income areas, although the survey results showed that it does occur. An assumed range for this parameter ranges from 0% to 10% with a typical value of 3%.
Current Payment Level
Payment levels are of critical importance for economic evaluation of advanced metering systems. A summary description of the payment level input parameters (with suggested typical, low and a high values) is given in Table 2-6. The input parameters (with suggested typical, low and a high values) are discussed in more detail in the rest of this section.
Table 2-6: Current situation parameters: payment level No Parameter Description 3.5 Fraction paying for
water: billed metered consumption (%)
Fraction of billed metered properties currently paying their full water bill.
3.6 Fraction paying for water: billed unmetered consumption (%)
Fraction of billed unmetered properties currently paying their full water bill
The current situation regarding payment levels of billed metered consumption (Item 3.5) reflects on payment levels where conventional meters are used (the experience with advanced meters is discussed in Section 2.6.3). From literature, it is clear that numerous factors play a role in consumers’ ability to pay for water. However, the most predominate one is poverty. DWAF (2004) states that poverty is the root challenge to the inability to pay for water services.
A study in eThekwini (GIBB, 2015) showed that only about 10% of low income residents with conventional metering had their account in arrears. The eThekwini municipality is strict with non-payment for water; and annual 12% interest is charged on arrears and flow restrictors are installed on consumers’ points where the account has been unpaid for 60 days (GIBB, 2015). According to this study, approximately 20% of the connections have been disconnected due to non-payment in low income areas of eThekwini.
A study by Marah et al (2004) indicates that before prepaid meters were installed in Umzimvubu Municipality, the collection levels were approximately 30 % and the results of the practitioners’ survey indicate that the fraction ranges from 0% to 50% from 2 respondents.
CASE STUDY REVIEW OF ADVANCED WATER METERING APLICATIONS IN SOUTH AFRICA APPENDIX A: EVALUATION FRAMEWORK USER GUIDE
MASTERS THESIS | OCTOBER 2017 Page | (12)
The payment levels of billed unmetered consumption (Item 3.6) reflects payment levels in low income areas where fixed water charges are used.
The study on cost recovery by Marah et al (2004) found that the Letsemeng Municipality experienced a very low rate of payment for fixed-rate and unmetered water services of 1%.
Other Current Parameters
A summary description of the other current parameters is given in Table 2-7 below. The input parameters (with suggested typical, low and a high values) are discussed in more detail in the rest of this section.
Table 2-7: Other Current Parameters No Parameter Description 3.7 Fraction of demand that is on-
site leakage (%) The fraction of the estimated demand that is made up of on-site leakage. This parameter is not used in the calculations, but is meant as a flag of this issue and therefore its impact on current and future water demand and the cost of the project implementation should be considered.
3.8 Ave time between meter readings (months)
The average time between water meter readings.
3.9 Meter reading cost (R/meter reading)
The cost of taking a water meter reading, including transport, labour and equipment.
3.10 Billing cost (R/bill) The cost of entering the meter reading data into the billing system, generating, printing and mailing a water bill.
3.11 Meter operation & maintenance cost (R/meter/month)
The cost of operating and maintaining the water meter.
3.12 Meter failure (/year) The fraction of existing meters that needs replacement due to failure of the meter itself.
3.13 Vandalism and other (/year) The fraction of existing meters that needs replacement due to tampering or vandalism damage to the meter.
3.14 Total (%/year) The total fraction of meters that needs to be replaced per year due to failure or vandalism.
3.15 Average household income (/month)
The average household income of properties in the study area. This parameter is used as a flag for the designer to consider the affordability of the water supply in low income areas.
3.16 Unemployment rate The average unemployment rate in the study area. This parameter is used as a flag for the designer to
CASE STUDY REVIEW OF ADVANCED WATER METERING APLICATIONS IN SOUTH AFRICA APPENDIX A: EVALUATION FRAMEWORK USER GUIDE
MASTERS THESIS | OCTOBER 2017 Page | (13)
No Parameter Description consider the affordability of the water supply in low income areas.
3.17 Volatility of community (No of protest or mass action incidences per year)
The average number of incidences of protest or mass action occurring in the study area per year. This parameter is used as a flag for the designer to consider the volatility of the community and the likelihood of the water metering project being politicised and rejected by the community, particularly in low income areas.
2.3.3.1 Fraction of Demand on Site-Leakage
The fraction of demand that is on-site leakage (Item 3.7) is the fraction of estimated demand that is made up of on-site leakage. On-site leakage includes leaks from elements such as pipe fittings, taps, toilet cisterns and other household appliances (Lugoma et al, 2012).
In a study on extent of on-site leakage on selected middle and high income suburbs of Johannesburg, it was found that 64% of residential properties had measurable on-site leakage with a median flow rate of 12 kl/month (Lugoma et al., 2012). In the same study it was found that the average on-site leakage can be reduced by almost two thirds by fixing leaks in the 10% of the properties with the most leakage.
In a similar study in selected middle and high income suburbs of Cape Town it was found that 16.4% of domestic properties had an on-site leakage and with a median flow rate of 10 litres/hour or 7.2 kl/month/property (Couvelis & van Zyl, 2012).
According to the same study, the prevalence of on-site leakage in low income areas of Cape Town ranged from 17% in Mandela Park in Khayelitsha to 42% in Langa. In Bloemfontein (Mangaung) the percentage of properties with on-site leakage ranged from 3% in Motlatla to 62% in Freedom Square.
In another study Frame et al (2009) indicated that 62% of 8 000 low income properties of Cape Town had on-site leakage prior to the implementation of a leakage repair program. This program reduced consumption from 19 kl/month/property to 11.5 kl/month/property (a 40% reduction). The practitioners’ survey indicate that in low income communities the fraction of demand that is on-site leakage ranges from 5% to 70% from 4 respondents.
A study in Spain on 64 households (Arregui et al. 2006) found that most measurable on-site leakage rates ranged between 2 and 40 ℓ/h, with some leaks being as high as 100 ℓ/h. Similarly, Gascón et al. (2004) found an average residential leakage rate of 17.0 ℓ/h per property while studying water consumption patterns in 4 different Spanish cities. The on-site leaks represented 8.9% of the average daily consumption.
In Australia, Beal & Flynn (2014) and Blom et al. (2010) found through case studies that the fraction of on-site leakage on consumption ranges from 6% to 20%. The results from practitioners also revealed that on-site leakage ranges from 5% to 70%.
CASE STUDY REVIEW OF ADVANCED WATER METERING APLICATIONS IN SOUTH AFRICA APPENDIX A: EVALUATION FRAMEWORK USER GUIDE
MASTERS THESIS | OCTOBER 2017 Page | (14)
2.3.3.2 Average Time between Meter Readings
The average time between meter readings (Item 3.8) is the frequency at which water meters are currently being read. Ideally these should be once a month but not less that once every three months.
Heymans, et al., (2014) advise that it is important that the monthly manual meter reading is carried out as a way to inspect the possibilities of illegal connections (Heymans et al., 2014). The practitioners’ survey indicated that the average time between meter readings ranges from monthly to quarterly from four respondents.
2.3.3.3 Meter Reading Cost
The meter reading cost (Item 3.9) is the cost of taking a manual water meter reading, including transport, labour and equipment.
The results of the practitioners’ survey indicate that the cost of manual meter reading ranges from R 4.00 to an unreasonable sounding R 100.00. In the Economic feasibility of advanced metering technology in Melbourne, it was established that the cost of meter reading is 60 Australian cents per meter per reading (Blom et al., 2010), which is equivalent to R 4.40 in South African currency in 2010 and R6.18 in 2016. A study in eThekwini established this cost to range from R 1.74 to R 4.00 . The results indicate that the R 1.74 is the cost of reading a meter in informal settlements while the R 4.00 is the cost of reading a meter in rural areas as the properties are clustered together in informal settlements and remotely located leading to increased traveling expenses in rural areas.
International studies done by Arregui et al. (2003) and Sternberg and Bahrs (2015) also found that the meter reading cost ranges approximately from R5.50 per meter to R12.69 per meter in 2016.
2.3.3.4 Billing Cost
The billing cost (Item 3.10) is the cost of entering the meter reading data into the billing system, generating, printing and mailing a water bill to the consumer.
From a feasibility study on prepaid meters in eThekwini the cost was assumed to be R10 per month per meter (GIBB, 2015) made up of R 6 administrative cost, R 1 printing cost and R 3 postage cost.
2.3.3.5 Meter Operation & Maintenance Cost
The meter operation & maintenance cost (Item 3.11) is the cost of operating and maintaining the water meter. This cost is dictated by maintenance requirement of a water meter; that is through specified maintenance intervals of a meter and a strainer.
According to SGS Economics and Planning (2011) the annual maintenance cost of a meter is expected to be 15% of the purchase cost.
CASE STUDY REVIEW OF ADVANCED WATER METERING APLICATIONS IN SOUTH AFRICA APPENDIX A: EVALUATION FRAMEWORK USER GUIDE
MASTERS THESIS | OCTOBER 2017 Page | (15)
2.3.3.6 Meter Failure
The meter failure (Item 3.12) is the fraction of existing meters that needs replacement due to failure of the meter itself. This number should reflect the ideal situation where meters that fail are replaced immediately. Thus even if all failed meters are not currently replaced, the value should reflect the ideal fraction of replacements rather than the actual one.
Couvelis & van Zyl (2015) on the study on apparent losses investigated the meters installed in eThekwini in the period; 6th June 2005 to 28 March 2010 (5 years). As part of the observations of the study it was observed that in that period approximately 19 % of the meters were replaced that period, which translates into a fraction of approximately 4 % per year. Based on a study done Mutikanga et al. (2011) the failure rate is be 6.6 %/year. This, Mutikanga et al. deemed to be a high failure rate.
On the one hand, the study in eThekwini it was cited that from 1 July 2013 to 30 June 2014 (1 year) 8.8 % of conventional meters in the database were replaced (GIBB, 2015). The practitioners’ survey indicated that the fraction of meters failing due to the meter failure ranges from 5 % to 50%. The high value of 50 % was in Johannesburg and Mangaung where prepaid meters were installed.
2.3.3.7 Meter Vandalism
The fraction of meters failing due to vandalism (3.13) and other is the fraction of existing meters that needs replacement due to vandalism of the meter. This number should reflect the ideal situation where meters that fail due to vandalism are replaced immediately. Thus even if all vandalized meters are not currently replaced, the value should reflect the ideal fraction of replacements rather than the actual one.
2.3.3.8 Average Household Income
The average household income (Item 3.15) is the average monthly income of properties in the study area. This value may be obtained from census data or other income studies. This parameter is used as a flag for the designer to consider the affordability of the water supply to the community.
Willingness to pay for water consumption is a major factor that has to be taken into consideration when it comes to provision of service; and this is directly influenced by social factors such as income level, household size, and education (Moffat et al., 2002). At municipal level, this willingness to pay can be predicted through establishing the correlation between level of payment for services with social factors such as unemployment rate, average family income, and level of education. Studies also indicate that stand ownership plays an important role in willingness to pay for water services.
To get further indication on the expected level of payment for services, average family income should be considered. As cited by Littlefair (1998), payment for services can be estimated using the 5% rule.
CASE STUDY REVIEW OF ADVANCED WATER METERING APLICATIONS IN SOUTH AFRICA APPENDIX A: EVALUATION FRAMEWORK USER GUIDE
MASTERS THESIS | OCTOBER 2017 Page | (16)
The 5% rule commonly assumes that there is an elastic demand for the purchase of water with a cost of less than 5% of a household’s income and an inelastic demand where the cost exceeds 5% of the household’s income.
2.3.3.9 Unemployment Rate
The unemployment rate (item 3.16) is the average number of people without formal employment and the figure can be obtained from census data or other employment studies of the area of study. This parameter is used as a flag for the designer to consider the affordability of the water supply to the community.
2.3.3.10 Community Volatility
The volatility of community (Item 3.17) (Number of protest or mass action incidences per year) is the average number of incidences of protest or mass action occurring in the study area per year. This parameter is used as a flag for the designer to consider the volatility of the community and the likelihood of the water metering project being politicised and rejected by the community.
CASE STUDY REVIEW OF ADVANCED WATER METERING APLICATIONS IN SOUTH AFRICA APPENDIX A: EVALUATION FRAMEWORK USER GUIDE
MASTERS THESIS | OCTOBER 2017 Page | (17)
2.4 Proposed Parameters: System Parameters
This section deals with the proposed new conventional and advanced metering system to be installed. An option of using conventional instead of advanced water meters in the scheme is included as this option should always be considered as an alternative. This is important since advanced metering schemes are considerably more complex and costly than conventional metering. The complexity, electronics and additional components such as communication and billing systems of advanced metering results in a higher failure rate and makes increases in operation and maintenance costs inevitable. This means that advanced metering schemes will not be suitable in all situations.
The key parameters for the evaluation of advanced and new conventional metering technology are summarised in Table 2-8 and are discussed in more detail in the subsequent text.
Table 2-8: Proposed System Parameters No Parameter Description 4.1 Meter make The make of the meters proposed for conventional and
advanced meters respectively. 4.2 Meter model The models of meters proposed for conventional and
advanced meters respectively. 4.3 SANS 1529-1
compliant? Does each of the meter models comply with SANS 1529 Part 1?
4.4 SANS 1529-9 compliant?
Does the advanced meter model proposed comply with SANS 1529 Part 9? This document does not apply for most conventional water meters.
4.5 Mean battery life (years)
The mean battery life of the advanced water meters
4.6 Battery replaceable in field?
Can the battery be replaced in the field or should the meter be replaced when the battery runs flat?
4.7 Meter service life (years)
Expected service life of the water meter, including all components except for the battery.
4.8 Effective service life (years)
If a meter uses a battery that cannot be replaced in the field, the effective service life is determined as the shortest of the meter and battery service lives. If the meter doesn’t use a battery, or has a battery that can be replaced in the field, the effective service life is set to the meter service life.
4.9 Water meter failure (%)
The expected fraction of meters that will need replacement annually due to failure of the meter itself.
CASE STUDY REVIEW OF ADVANCED WATER METERING APLICATIONS IN SOUTH AFRICA APPENDIX A: EVALUATION FRAMEWORK USER GUIDE
MASTERS THESIS | OCTOBER 2017 Page | (18)
No Parameter Description 4.10 Electronics and
other components (e.g. valve) failure
The expected fraction of meters that will need replacement annually due to failure of the electronic components of the meter (advanced meters only).
4.11 Vandalism The expected fraction of meters that will need replacement annually due to damage caused by vandalism.
4.12 Fraction of meters needing replacement annually due to other reasons (/year)
The expected fraction of meters (if conventional and advanced meters are installed respectively) that will need replacement annually due to other reasons.
4.13 Total (/year) The total fraction of meters (if conventional and advanced meters are installed respectively) that needs to be replaced per year due to all possible causes.
SANS 1529-1 Compliance
The SANS 1529-1 compliance (Item 4.3) refers to whether the mechanical meter part conforms to the national standards for mechanical water meters for potable water. This is a legal requirement for all meters installed in South Africa and thus a meter should be disqualified if the answer is ‘No’.
SANS 1529-9 Compliance
The SANS 1529-9 compliance (Item 4.4) refers to whether the electronic components of the metering system conforms to the national standards for electronic components of water meters. This is a requirement for all advanced meters installed in South Africa and thus a meter should be disqualified if the answer is ‘No’.
Mean Battery Life
The mean battery life (Item 4.5) is the average time the meter battery is expected to last. This is not applicable to conventional meters since they do not have batteries.
The expected battery service life is normally specified by manufacturers. Manufacturers sometimes claim battery life exceeding 10 years. These numbers should be taken with scepticism since the test conditions tend to differ from operating conditions.
CASE STUDY REVIEW OF ADVANCED WATER METERING APLICATIONS IN SOUTH AFRICA APPENDIX A: EVALUATION FRAMEWORK USER GUIDE
MASTERS THESIS | OCTOBER 2017 Page | (19)
Studies in low income areas indicate that battery life can be as short as 1 year and as high as 10 years (Heymans et al., 2014). The practitioners’ survey indicated that the mean battery life ranged from 2 to 10 years from three respondents.
Dittrich (n.d.) found that most batteries will have a lifespan ranging from 10-20 years. However, he also noted some batteries have a lifespan of 5 years. Blom et al. (2010) support these findings as they found, from an Australian case study, that batteries have a lifespan ranging from 5 to 15 years.
Meter Service Life
The meter service life (Item 4.7) is the expected service life of the water meter, including all components except for the battery. The results of the practitioners’ survey indicate that the meter service life of conventional and prepaid meters range from 5 to 25 years and 5 years to 15 years respectively (6 respondents). Heymans et al (2014) indicate that conventional meters can be in operation for up to 30 years while prepaid meters can be in operation up to 20 years but are only effective for 10 and 7 years respectively.
Effective Service Life
For the Effective service life (Item 4.8) if a meter uses a battery that cannot be replaced in the field, the effective service life is determined as the shortest of the meter and battery service lives. If the meter doesn’t use a battery, or has a battery that can be replaced in the field, the effective service life is set to the meter service life.
Fraction Failed due to Meter Failure
The fraction of meters expected to fail due to water meter failure (Item 4.9) is the fraction of meters that will need replacement annually due to failure of the meter itself.
The fraction of prepaid meters failing due to the meter failing itself can be expected to be similar to that of conventional meters especially when a conventional water meter is used as part of the advanced meter. The results of the practitioner survey indicate that the fraction of prepaid meters failing due to the meter failure itself ranges from 1 % to 60 % from 7 respondents.
Fraction Failed due to Electronic or Component Failure
The fraction of meters expected to fail due to electronics and other components failure (Item 4.10) is the expected fraction of meters that will need replacement annually due to failure of the electronic and other components of the meter.
Though all components have a chance of failing, literature indicates that batteries are the most critical and have the highest chance of failure. Shirley et al. (2014) indicates that an advanced meter and components with a failure rate of 10%/year or more, within the first 10 years, could be considered as catastrophic. Seifried & Converse (2009) found, from a study on a meter replacement project, that the failure rate of an advanced water meter can range from 4.8%/year – 11.3%/year due to battery failure.
A study on cost recovery by Marah et al (2004) indicate that prepaid meters failure rate can be as high as 40 % per annum (meter, vandalism and electronics). The practitioners
CASE STUDY REVIEW OF ADVANCED WATER METERING APLICATIONS IN SOUTH AFRICA APPENDIX A: EVALUATION FRAMEWORK USER GUIDE
MASTERS THESIS | OCTOBER 2017 Page | (20)
survey indicated that the fraction of prepaid meters failing due to electronics and other components range from 1 % to 70 % from 6 respondents. Heymans, et al (2014) reports that a performance audit of prepaid meters in Mogale 8 years after installation showed that 90 % of the meters were faulty due water meter failure, vandalism, electronics and other components.
Failure due to Vandalism
The expected fraction of meters to fail due to vandalism (Item 4.11) is the expected fraction of meters that will need replacement annually due to damage caused by vandalism.
The fraction of prepaid meters failing due to vandalism has been reported as 30% in Johannesburg and 7.5% in eThekwini (GIBB, 2015).
2.5 Proposed System Parameters: Costs
The proposed scheme input parameters comprise of information on costs related to the proposed advanced metering installation as well as conventional metering installation. This information is useful in determining the financial viability of the proposed metering solution compared to the financial viability of conventional metering.
The key cost parameters for the evaluation of advanced metering technology are presented in Table 2-9 and the parameters are discussed in more detail in the rest of the section.
Table 2-9: Proposed Scheme Parameters: Cost
No Parameter Description
4.14 Meter price (R/meter) The price of the meter.
4.15 Installation cost (R/meter)
The cost of installing the meter including transport, labour, meter box and auxiliaries.
4.16 Communication infrastructure cost (R)
The total cost of communication infrastructure if included in the advanced metering installation
4.17 Payment infrastructure cost (R)
The total cost of payment infrastructure, including vending terminals, billing software, computer hardware and additional staff that will be required.
4.18 Battery replacement cost (R/meter)
The cost of replacing a battery in the advanced meters, including the cost of the new battery, disposal cost of the old battery and labour.
CASE STUDY REVIEW OF ADVANCED WATER METERING APLICATIONS IN SOUTH AFRICA APPENDIX A: EVALUATION FRAMEWORK USER GUIDE
MASTERS THESIS | OCTOBER 2017 Page | (21)
No Parameter Description
4.19 Meter reading cost (R/meter)
The cost of reading the meter. The costs should include all related costs, such as transport, labour and equipment.
4.20 Meter operation & maintenance cost (/meter/month)
The cost of operating and maintaining water meters.
4.21 Billing cost (R/bill) The cost of entering the meter reading data into the billing system, generating, printing and mailing a water bill.
4.22 Additional billing system operating cost (R/month)
Additional billing system operating costs not already included in the model if conventional and advanced meters are installed respectively.
4.23 Additional communication system operating costs (R/month)
Additional communication system operating costs not already included in the model if conventional and advanced meters are installed respectively.
Meter Price
The Meter price (Item 4.14) is the cost of purchasing a water meter. This is the actual price that the municipality pays for the water meter.
GIBB (2015) state that the cost of purchasing a conventional water meter is R 150/meter. This price appears to close to the low limit as 6 practitioners surveyed state that the price ranges between R300/meter – R 750/meter. In Australia, a study in 2010 showed that the cost of a conventional water meter was AUD 36 (Blom et al., 2010). In 2016, this price equates to approximately AUD 40.61/meter (Reserve Bank of Australia, 2016) and R 426.33/meter in South African currency.
With regards to advanced meters, 6 practitioners state that the price ranges from R500/meter – R2 500/meter, with the most stated value as R2 000/meter. In Australia, the cost of an advanced water meter in 2010 was AUD 750 (Blom et al., 2010). In 2016, this price equates to approximately AUD 846/meter and R 8 881.35/meter in South African currency.
Installation Cost
The installation cost (Item 4.15) is the cost of installing the water meter. For conventional meters, this cost encompasses the labour costs incurred in installing the meter. GIBB (2015) states that the cost of installing a conventional water meter is R 1000/meter. From the surveys collected, 5 practitioners state that the cost of installing a conventional meter ranges from R 150/meter – R 1000/meter with majority of the values ranging from R 400 per meter – R 1 000 per meter. Whereas in Australia, in 2010,
CASE STUDY REVIEW OF ADVANCED WATER METERING APLICATIONS IN SOUTH AFRICA APPENDIX A: EVALUATION FRAMEWORK USER GUIDE
MASTERS THESIS | OCTOBER 2017 Page | (22)
the cost was AUD 25 per meter (Blom et al., 2010). This equates, in 2016 values, to AUD 28.20 per meter and R 296.05 per meter in South African currency.
However, with regards to advanced meters, the cost of installing a meter will consists of the cost of installing and setting up the necessary software and communication system per meter, the highly qualified technician labour costs as well as payment infrastructure.
In Australia, water meters were installed with transmitters at each home. The cost, in 2010, was stated as AUD 200. These values translate to AUD 225.60 per meter in 2016 and R2 368.39 per meter (Blom et al., 2010).
Communication Infrastructure Cost
The communication infrastructure cost (Item 4.16) is the total cost of communication infrastructure required for the metering system. This varies greatly from application to application do to the large range of possible technologies and systems.
This consists of installing the home user interface, purchasing communication equipment, purchasing the necessary communication software and establishing a communication infrastructure (e.g. via mobile/cellular, radio frequency etc.)
There are different water metering communication protocols available. It is important that when selecting a water meter, the suitability of the communication protocol used for the meter in the wider municipality be taken into consideration. Different manufacturers generally use their own communication protocols that are incompatible with that of other manufacturers. The utility will be forced to stick to the same supplier when upgrading meters in the future (KEMA, 2012).
Some manufacturers use open protocols, which enables a water utility to switch from one manufacturer to another without replacing the meters and its support infrastructure together with the vending system while others use proprietary software that require replacement of the whole system in a case where the water utility wants to switch from one manufacturer to another (Sneps-Sneppe et al., 2012).
Communication protocols that use standardised infrastructure like STS enable interoperability of utility meters; water and electricity (Sneps-Sneppe et al., 2012). Metering technologies that use this technology have an advantage over technologies that use proprietary communication protocols and software.
Sackett & Lake (2014) conducted a feasibility study on the implementation of an AMR water metering system on approximately 500 households. From this study, they established that the cost of installing either a mobile communication system or fixed (e.g. radio frequency) communication system would range from $ 21 500 to $76 586. In 2016 values, this equates to approximately $21 890.70 and $77 977.73. In South African currency, these costs range from R290 468.59 and R1 034 686.
Payment Infrastructure Cost
The Payment infrastructure cost (Item 4.17) is the total cost of payment infrastructure, including vending terminals, billing software, computer hardware and additional staff
CASE STUDY REVIEW OF ADVANCED WATER METERING APLICATIONS IN SOUTH AFRICA APPENDIX A: EVALUATION FRAMEWORK USER GUIDE
MASTERS THESIS | OCTOBER 2017 Page | (23)
that will be required. This varies greatly from application to application due to the large range of possible technologies and systems.
Battery Replacement Cost
The Battery replacement cost (Item 4.18) is the cost of replacing a battery in advanced water meters, including the cost of the new battery, disposal cost of the old battery and labour. Based on a study done on eThekwini, GIBB (2015) states that the cost of replacing a battery is R197 per meter. Two surveyed practitioners stated that the cost of replacing a battery were R200 per meter and R300 per meter. Using America as a high income area proxy, it was found that the cost a battery, in 2013, was $15 per meter. This equates, in 2016 values, to $15.52 per meter and R205.59 per meter in South African currency. However, as this is only the cost of the battery and doesn’t include the other costs associated with replacing the battery, this value is expected to rise and exceed R 300 per meter.
Meter Reading Cost
The Meter reading cost (Item 4.19) is the cost of reading a meter. The cost include all related costs, such as transport and labour and equipment. The cost of reading conventional meters has already been discussed under item 3.10.
With regards to advanced water meters, meter reading costs vary based on the type of advanced metering used (i.e. AMR or AMI).
For AMR technologies, meter readings cost would consist of fuel and labour costs as readings are taken through drive by or walk by. Sackett and Lake (2014) conducted a feasibility study in Oak Creek, Colorado, of the costs associated with implementing different types of advance water metering systems. In this study, they found that the cost of reading an AMR ranged from $0.50 per meter per month –$0.80 per meter per month. In 2016 values, these equate to $0.51 per meter per month - $0.88 per meter per month and R6.76 per meter per month – R11.66 per meter per month in South African values. Mott-MacDonald, 2007) proposed that the cost of reading an advanced meter after implementation would be £0.25 per meter per month. In 2016 values, this equates to £0.3 per meter per month and R5.19 per meter per month
With regards to AMI, literature such as Blom et al., (2010), indicate that meter reading cost could be eliminated due to technologies such as wireless communication networks. However, Blom et al., (2010) also states that the cost would be replaced by the cost of maintaining this networks. However, it is recommended that meters in AMI systems are read manually at least once a year to verify the readings.
Meter Operation and Maintenance Cost
The Meter operation & maintenance cost (Item 4.20) is the cost of operating and maintaining water meters after installation. This cost is dictated by maintenance requirements of a water meter.
As mentioned earlier in item 3.12, according to SGS Economics and Planning, (2011) the annual maintenance cost of a water meter is expected to be 15% of the purchase cost.
CASE STUDY REVIEW OF ADVANCED WATER METERING APLICATIONS IN SOUTH AFRICA APPENDIX A: EVALUATION FRAMEWORK USER GUIDE
MASTERS THESIS | OCTOBER 2017 Page | (24)
For instance, taking the cost price of R 1 500.00 for prepaid meters, the typical monthly operation and maintenance cost of R 18.75 is estimated.
The Billing Cost
The Billing cost (Item 4.21) is the cost of entering the meter reading data into the billing system, generating, printing and mailing a water bill if conventional and advanced meters are installed respectively.
This cost was assumed to be R10 per meter per month in the eThekwini system (GIBB, 2015). This is component of the operations cost is said to be applicable to all metering technology that involves delivery of a bill to the consumer, therefore prepaid systems carry a zero cost for this component.
CASE STUDY REVIEW OF ADVANCED WATER METERING APLICATIONS IN SOUTH AFRICA APPENDIX A: EVALUATION FRAMEWORK USER GUIDE
MASTERS THESIS | OCTOBER 2017 Page | (25)
2.6 Proposed System Parameters: Expected New Consumption
This section deals with the expected consumption situation after replacing all meters with either conventional or advanced meters. A summary description of the input parameters is given in Table 2-10. The input parameters are discussed in more detail in the rest of the section.
Table 2-10: Proposed system consumption levels No Parameter Description
The estimated average monthly consumption for properties in the billed unmetered consumption category (for both the conventional and advanced metering options).
4.26 Illegal consumption (kL/property/month)
The estimated average monthly consumption for properties with illegal connections (for both the conventional and advanced metering options).
4.27 Total/average The total number of properties included in the analysis is calculated as the sum of the billed metered, billed unmetered and illegal connections. The number of properties has to equal the number of properties (entered under global input parameters).
4.28 No of meters installed The number of meters to be installed in the proposed scheme. It is assumed that existing billed metered consumers will have their meters replaced and that all other consumers will move to the billed metered consumption category.
4.29 Fraction of Billed metered properties paying for water
Fraction of billed metered properties currently paying their full water bill for the conventional and advanced meter options respectively.
4.30 Fraction of billed unmetered properties paying for water.
Fraction of billed unmetered properties currently paying their full water bill for the conventional and advanced meter options respectively.
4.31 Ave time between meter readings (months)
Average time between meter readings.
Expected Billed Metered Consumption
The expected billed metered consumption (Item 4.24) includes all properties that are metered and billed based on their actual consumption. It is assumed that all consumers will have new meters installed and thus that all will move to this category.
CASE STUDY REVIEW OF ADVANCED WATER METERING APLICATIONS IN SOUTH AFRICA APPENDIX A: EVALUATION FRAMEWORK USER GUIDE
MASTERS THESIS | OCTOBER 2017 Page | (26)
If on-site leakage is reduced as part of the implementation of new meters, an equivalent reduction of registered water consumed should be considered.
As for advanced water meters, reduction in unit consumption may incorporate the reduction of leakage and consumption due to consumption feedback. Sønderlund et al. (2016) conducted a study to review the existing literature showing the correlation between reduction in consumption and advanced metering feedback. The study concluded that reduction in consumption due to advanced metering feedback ranges from 2.5% to 29% with an average of 12 %.
Number of Meters Installed
The number of meters installed (item 4.28) is the number of meters to be installed in the proposed scheme. It is assumed that existing billed metered consumers will have their meters replaced and that all other consumers will move to the billed metered consumption category.
Fraction of Billed Metered Consumers Who Pay
The fraction of billed metered consumers paying for water (Item 4.29) is the fraction of consumers that is expected to pay for their water after the new meters are installed. For conventional meters installed the values are expected to be similar to the situation in item 3.5.
Prepaid metering can increase payment level making payment unavoidable (unless consumers tamper with or bypass the prepaid meter) and maximising collection by removing human error from conventional billing (Heymans et al., 2014). This has been demonstrated to be the case by case studies on cost recovery in places like Beaufort West (Marah et al., 2004). According to case studies, the impact that prepaid water metering did was make consumers reduce their consumption to free basic water with very few exceeding free basic water with a very little amount which can easily be paid making it a reasonable assumption that prepaid metering can achieve up to 100 % payment level. However, since prepaid metering shuts consumers off water supply, it makes it susceptible to tampering in which case payment level can be assumed to be 100% minus extent of illegal connection.
The Average Time Between Meter Readings
The average time between meter readings (Item 4.31) is the frequency at which the meters will be read in the new scheme. Ideally meters should be read every month, and the frequency should not be less than every three months.
CASE STUDY REVIEW OF ADVANCED WATER METERING APLICATIONS IN SOUTH AFRICA APPENDIX A: EVALUATION FRAMEWORK USER GUIDE
MASTERS THESIS | OCTOBER 2017 Page | (27)
3 EVALUATION FRAMEWORK: RESULTS
3.1 Introduction
This section describes the results of the advanced meter evaluation system provided in the accompanying excel spread sheet model. These results of evaluation are shown on the ‘Results’ tab and several calculations are presented in the results in four categories: technical, social, environmental and economic.
The approached followed in this evaluation framework was to estimate critical performance parameters aimed at assisting the designer to make rational decisions. To assist the designer, certain cells are formatted to highlight particularly good or bad values.
As a general rule, a result highlighted as ‘very bad’ indicates a critical failure that should result in the system being rejected. Results formatted as ‘Unrealistic’ indicate that the result should not be trusted and that the input parameters should be checked to correct this problem.
Table 3-1: Key to project evaluation results
Very Bad Bad
Neutral Good
Very Good Unrealistic
Take Note of Value
The results of the analysis are discussed in the rest of this chapter under the four analysis categories.
3.2 Technical
The technical results of the metering technology evaluation is an indication on how the robustness of the technology makes the technology suit the application. Compliance to national standards is used as a flag for technical feasibility of the project. Full technical compliance is much more complex and should be carefully investigated based on manufacturer’s information, requirements of the project, success of field implementations of the technology and sound engineering judgement.
It is a legislative requirement that all water meters installed in South Africa comply with national standards. Conventional meters are expected to comply with SANS 1529-1 while electronic and prepaid meters are also expected to comply with SANS 1529-9. Meters that don’t comply with these standards should be rejected.
CASE STUDY REVIEW OF ADVANCED WATER METERING APLICATIONS IN SOUTH AFRICA APPENDIX A: EVALUATION FRAMEWORK USER GUIDE
MASTERS THESIS | OCTOBER 2017 Page | (28)
3.3 Social
The social results of the technology evaluation do not reflect detailed analysis, but only highlights certain issues as flags for the designer to consider social issues in the project. If a community does not accept a metering scheme it is bound to fail. Social acceptance is highly complex and it is important that the designer gets expert input and the support of all interested and affected parties in the community for the project before implementation.
3.4 Environmental
Only two key parameters are considered in the environmental impact of the proposed scheme, i.e. the number of batteries to be replaced and safely disposed of and the reduction in water consumption. Efficient water consumption is an essential component of sustainable management.
Batteries are made of various chemicals including lithium-ion, nickel and cadmium that are toxic and can cause damage to humans and the environment. For example, cadmium can cause damage to soil micro-organisms and affect the breakdown of organic matter. It also bio-accumulates in fish, which reduces their numbers and makes them unfit for human consumption (AlAbdulkarim et al., 2012). The extent of the damage is greatly influenced by battery type and its capacity (AlAbdulkarim et al., 2012), and this should be considered in the design phase of the project.
3.5 Economic
The economic result of the evaluation framework gives an indication on financial viability of the metering system to be implemented. This is achieved through determining the payback period for the technology and the effective surplus to be expected from the implementation.
The economic results are given relative to the current situation and thus the project. This means that to succeed economically, a new project doesn’t necessarily have to run at a surplus, but can achieve this by saving more money compared to the current situation than it costs to implement.
Capital Payback Period
The capital payback period is how long it would take to recover the money spent on implementing the new system through the money saved by installing it. It is calculated by dividing the total capital cost by the increased operational surplus (or decreased loss) of the new system.
A system with a shorter capital payback period is better than a system with a longer one. Generally a capital payback period of four years would be considered acceptable, but this is a decision that should be made in consultation with the municipality.
A negative capital payback period means that the system investment costs cannot be paid back and thus the scheme is infeasible.
CASE STUDY REVIEW OF ADVANCED WATER METERING APLICATIONS IN SOUTH AFRICA APPENDIX A: EVALUATION FRAMEWORK USER GUIDE
MASTERS THESIS | OCTOBER 2017 Page | (29)
Effective Surplus
The effective surplus is the average annual increased surplus (or reduced loss) over the service life of the metering system after the capital has been recovered. It allows meters with different service lives to be compared on the same basis. For instance, a more expensive type meter may result in higher monthly income from water sales. Thus even though these meters may be more expensive to install, have shorter service lives and a longer capital payback period, the increased income may be sufficient to make this the preferred system.
The effective surplus is an additional measure to the capital repayment period and both should be considered when evaluating the feasibility of a system. It is also important to consider the risks associated with different systems. For instance, an advanced metering system might have a higher effective surplus than a conventional system, but at the same time it represents a greater financial risk due to the higher capital outlay required and risks of the more sophisticated meters not performing as expected.
CASE STUDY REVIEW OF ADVANCED WATER METERING APLICATIONS IN SOUTH AFRICA APPENDIX A: EVALUATION FRAMEWORK USER GUIDE
MASTERS THESIS | OCTOBER 2017 Page | (30)
4 REFERENCES
AlAbdulkarim, L., Lukszo, Z. & Fens, T. (2012). Acceptance of Privacy-Sensitive Technologies: Smart Metering Case in The Netherlands. CESUN.
Arregui F, Palau C, Gascon L., & Peris O. (2003) Evaluating domestic water meter accuracy. A case study. In: Cabrera E and Cabrera E Jr. (eds). Pumps, Electromagnetic Devices, and Systems applied to Urban Water Management. Swets & Zeitlinger, Lisse. ISBN 90 5809 560 6. 343–352.
Arregui, F., Cobrera, E., Cobacho, R. & Garcia-Serra, J. (2006). Reducing Apparent Losses Caused By Meters Inaccuracies. Water Practice and Technology, 1(4).
Beal, C. & Flynn, J. (2014). The 2014 Review of Smart Metering and Intelligent Water Networks in Australia & New Zealand. , pp.1–52.
Blom, A., Cox, P. & Raczka, K. (2010). Developing a Policy Position on Smart Water Metering, s.l.: s.n.
Britton, T., Stewart, R. & O'Halloran, R. (2013). Smart metering: enabler for rapid and effective post meter leakage identification and water loss management.. Journal of Cleaner Production..
Chris Hani District Municipality, 2014. 2014/15 Tariff Structure Water and Sanitation An Annual Budget and Supporting Documentation for Chris Hani District Municipality, s.l.: Chris Hani District Municipality.
City of Johannesburg. (2014). Determination of property rates and rebates for 2014/15 as amended in accordance with the regulations, Johannesburg: City of Johannesburg.
Couvelis, F.A. & van Zyl, J.E. (2015). Apparent losses due to domestic water meter under-registration in South Africa. Water SA, 41(5), pp.698–704.
Crause, R. (2013). South African Inflation Calculator. Available at: http://www.inflationcalc.co.za/ [Accessed July 4, 2016].
De Sousa-Alves, M. (2013). Update and Additions to Existing Long-Term Water Conservation and Water Demand Management Strategy - Water & Sanitation and Water Demand Management: City of Cape Town.
DWAF. (2004) Draft White Paper on Water Services, Pretoria
Department of Water Affairs (DWA). (2014). Water Boards as Regional Water Utilities (Institutional Arrangements to Facilitate Turnaround) - Legal, Financial and Other Implications.
Dittrich, T., Battery concepts for smart utility meters – The requirements and proving their suitability. , pp.1–8.
Eberhard, R.E. (2003). Administered prices water: a report for National Treasury,
CASE STUDY REVIEW OF ADVANCED WATER METERING APLICATIONS IN SOUTH AFRICA APPENDIX A: EVALUATION FRAMEWORK USER GUIDE
MASTERS THESIS | OCTOBER 2017 Page | (31)
Littlefair, K. (1998). Willingness to Pay for Water at the Household Level: individual financial responsibility for water consumption, London: Water Issues study Group School of Oriental and African Studies (SOAS) University of London.
Gascon, L., Arregui, F., Cobacho, R. & Jr, E. C. (2004). Urban Water Demand in Spanish Cities by Measuring End Uses Consumption Patterns.
GIBB. (2015). KST9: Preliminary Feasibility Study for the Use of Prepaid/Alternative Domestic Metering Solutions For EThekwini Water and Sanitation: Non-Revenue Water Branch
hellopeter.com. (2015). no water in my home. Retrieved September 30, 2016, from https://hellopeter.com/ilembe-district-municipality/reviews/no-water-in-my-home-1889639
Griffioen, M.L. & van Zyl, J.E. (2014). Proposed guideline for modelling water demand by suburb. Journal of the South African Institution of Civil Engineering, pp.63–68.
Heymans, C., Eales, K. & Franceys, R. (2014). The Limits and Possibilities of Prepaid Water in Urban Africa: Lessons from the Field, Washington DC: World Bank Group.
KEMA. (2012). The Critical Need for Smart Meter Standards:, s.l.: Globa Perspective.
Lugoma, M.F.T., van Zyl, J.E. & Ilemobade, A.A. (2012). The extent of on-site leakage in selected suburbs of Johannesburg. Water SA, 38(1), pp.127–132.
Masoabi, M. (2017). Advanced Water Metering and Its Application in Low Income communities, s.l.: Not yet published.
Marah, L., O’ Donovan, M., Finlayson, K., & Boderg, D. (2004). Institutional and Socio-Economic Review of the Use/Application of Electronic Prepayment Meter Technology in the Provision of Water Supply Services to Urban and Peri-urban areas. Water Research Commission Report.
Moffat.B, Motlaleng.G.R & Thukuza. A. (2002). Households Willingness to Pay for Improved Water Quality and Reliability of Supply in Chobe Ward, Maun.
Mott-MacDonald. (2007). Appraisal of Costs & Benefits of Smart Meter Roll Out Options Appraisal of Costs & Benefits of Smart Meter Roll Out Options, London.
Muller M (2008) Free basic water: a sustainable instrument for a sustainable future in South Africa. Environ. Urbanization 20 67-87. URL: http://eau.sagepub.com/cgi/content/abstract/20/1/67 (Accessed 24 April, 2008).
Mutikanga, H.E., Sharma, S.K. & Vairavamoorthy, K. (2011). Investigating water meter performance in developing countries: A case study of Kampala, Uganda. Water SA, 37(4), pp.567–574.
Mwangi, M. (2017). Advanced Water Metering and Its Application in High Income Communities, s.l.: Not yet published.
CASE STUDY REVIEW OF ADVANCED WATER METERING APLICATIONS IN SOUTH AFRICA APPENDIX A: EVALUATION FRAMEWORK USER GUIDE
MASTERS THESIS | OCTOBER 2017 Page | (32)
Reserve Bank of Australia. (2016). Inflation calculator. Reserve Bank of Australia. Available at: http://www.rba.gov.au/calculator/ [Accessed July 4, 2016].
Sacket & Lake. (2014). AMI Technology and Feasibility study consolidated Report, s.l.: s.n.
Seifried, C.M. & Converse, T.S. (2009). Canton’s Meter Replacement Project Registers Savings, Canton.
SGS Economics and Planning. (2011). Water meter cost benefit, Hobart.
Shirley, J.F. et al. (2014). (Agreement/Contract for Information and Review) Water Meter Reading Automation Project Agreement Amendments and Agreements, Sacramento.
Singh, N. & Xaba, B. (2006). Johannesburg Water's Prepayment Water Meter Appropriate Technology in the Implementation of Project Operation Gcin'amanzi in Soweto., Johannesburg: Johannesburg Water.
Sneps-Sneppe, M., Maximenko, A. & Namiot, D. (2012). On M2M communications standards for smart. M2M.
Sønderlund, A.L. et al. (2016). Effectiveness of Smart Meter-Based Consumption Feedback in Curbing Household Water Use : Knowns and Unknowns. , 142(12).
Sternberg, J. & Bahrs, P. (2015). Water Metering – The Tauranga Journey.
Van Zyl, J. (2011). Introduction to Integrated Water Management. South Africa: Water Research Commision.
Van Zyl, H.J., Van Zyl, J.E., Geustyn, L., Ilemobade, A., & Buckle, J.S. (2007). Water Consumption Levels in Selected South African Cities: Water Research Commission Report.
WorldBank, 2012. Designing a results framework for achieving results: a how-to guide, Washington DC: Independent Evaluation Group.
CASE STUDY REVIEW OF ADVANCED WATER METERING APLICATIONS IN SOUTH AFRICA APPENDIX B: CASE STUDY UPDATE QUESTIONNAIRE
MASTERS THESIS | OCTOBER 2017 Page | (1)
APPENDIX B
UCT ADVANCED METERING CASE STUDY UPDATE QUESTIONNAIRE
Masters Dissertation Case Study Review of Advanced Water Metering Applications in South Africa
CASE STUDY REVIEW OF ADVANCED WATER METERING APLICATIONS IN SOUTH AFRICA APPENDIX B: CASE STUDY UPDATE QUESTIONNAIRE
MASTERS THESIS | OCTOBER 2017 Page | (2)
1. Project Information 1.1 Name: ___________________________________________________________ 1.2 Employer: ___________________________________________________________ 1.3 Address: ___________________________________________________________ _________________________________________________________________________ ____________________________________________________________________________ 1.4 Name of Advanced Metering Project: ______________________________________________ ________________________________________________________________________________ 1.5 Project Area Location (Province, City and Municipality) ________________________________ ________________________________________________________________________________ 1.6 Year of Meter Installation: _______________________________________________________ 1.7 No of Meters Installed: __________________________________________________________ 1.8 Meter Make: __________________________________________________________________ 1.9 Meter Model: _________________________________________________________________ 1.10 Projected meter lifespan: _______________________________________________________ 1.11 Projected battery life: _________________________________________________________ 1.12 Motivation for Installing advanced meters: _________________________________________ ________________________________________________________________________________ ________________________________________________________________________________ ________________________________________________________________________________ ________________________________________________________________________________ 1.13 Billing System Used: ___________________________________________________________ ______________________________________________________________________________ ________________________________________________________________________________ ________________________________________________________________________________
CASE STUDY REVIEW OF ADVANCED WATER METERING APLICATIONS IN SOUTH AFRICA APPENDIX B: CASE STUDY UPDATE QUESTIONNAIRE
MASTERS THESIS | OCTOBER 2017 Page | (3)
2. Problems ExperiencedId Problem Fraction of meters
affected Solution/Action Taken
3. Benefits ExperiencedWhat benefits did the utility obtain from the installation of these meters: ___________________