- 1 - Case Study: Smart Community Demonstration Project at Industrial Park in Java Island, the Republic of Indonesia 1. Introduction In Java Island of the Republic of Indonesia, a joint project with Japan was conducted from 2012 to 2017 to demonstrate smart communities, focusing on the establishment of advanced energy use methods in an industrial park where energy demand was growing rapidly. It is one of the “Smart Community International Demonstration Projects,” of NEDO. There was a cooperation request from the Ministry of Energy and Mineral Resources of the Republic of Indonesia (MEMR) to the state electricity company (PLN) for the implementation of the project which was carried out at Suryacipta City of Industry as a project site. Under the MOU (Memorandum of Understanding) concluded between NEDO and MEMR, the five Japanese companies (Sumitomo Corporation, Fuji Electric, Mitsubishi Electric, Sumisho Machinery Trade Corporation and NTT Communications) and PLN signed ID (Implementation Document) to jointly implement the demonstration (Figure 1). In this demonstration, in addition to the introduction of a system for stabilizing power quality and a system for energy management in the industrial park, the ICT platform was established and its effectiveness was verified. The purpose of this project is not only a technology demonstration but also a business demonstration that examines the feasibility of the technologies which were introduced in this project. This case study summarizes social significance of the demonstrations and suggestions of smart grid related technologies obtained in this demonstration project. 2. Background Power shortage situation in Java Island, the Republic of Indonesia when the demonstration started in 2011 was tight. There were 165 days of planned blackouts per year. This was due to the fact that the chronic electricity shortage had not been solved because of the long delay of financing and construction works of the 1st short-term electricity development plan formulated in the Republic of Indonesia in 2006, while the demand for electricity was growing rapidly. The country’s industrial parks are featured in "industrial cluster" that consumes about 1/3 of the country's total energy consumption and have seen remarkable growth in the energy consumption. Among others, the Suryacipta City of Industry, whose land sales is carried out by Sumitomo Corporation, has been occupied by many Japanese companies (more than half i.e. approximately 130 tenants are Japanese companies), and high- quality power sources were in demand. Based on the above, this demonstration aims to create a new business model that provides high-quality services / distribution system stabilization services to electric power companies (PLNs) using Japanese technology. In order to demonstrate this service, it is necessary to create a new power distribution system in the industrial park. However, it violates the country's regulations of one power supplier per area, so in cooperation with MEMR and PLN, NEDO conducted the project as a demonstration project. Figure 1 Demonstration system
Transcript
- 1 -
Case Study: Smart Community Demonstration Project at Industrial Park
in Java Island, the Republic of Indonesia
1. Introduction
In Java Island of the Republic of Indonesia, a joint project with Japan was
conducted from 2012 to 2017 to demonstrate smart communities, focusing
on the establishment of advanced energy use methods in an industrial park
where energy demand was growing rapidly.
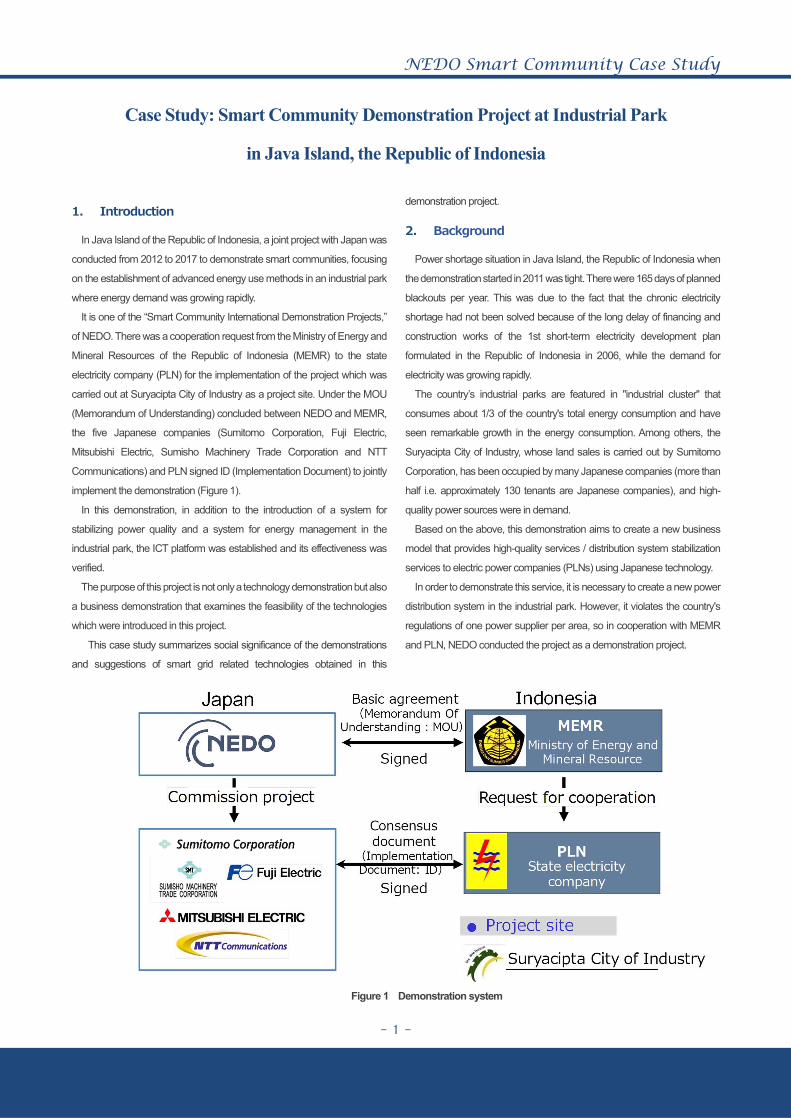
It is one of the “Smart Community International Demonstration Projects,”
of NEDO. There was a cooperation request from the Ministry of Energy and
Mineral Resources of the Republic of Indonesia (MEMR) to the state
electricity company (PLN) for the implementation of the project which was
carried out at Suryacipta City of Industry as a project site. Under the MOU
(Memorandum of Understanding) concluded between NEDO and MEMR,
the five Japanese companies (Sumitomo Corporation, Fuji Electric,
Mitsubishi Electric, Sumisho Machinery Trade Corporation and NTT
Communications) and PLN signed ID (Implementation Document) to jointly
implement the demonstration (Figure 1).
In this demonstration, in addition to the introduction of a system for
stabilizing power quality and a system for energy management in the
industrial park, the ICT platform was established and its effectiveness was
verified.
The purpose of this project is not only a technology demonstration but also
a business demonstration that examines the feasibility of the technologies
which were introduced in this project.
This case study summarizes social significance of the demonstrations
and suggestions of smart grid related technologies obtained in this
demonstration project.
2. Background
Power shortage situation in Java Island, the Republic of Indonesia when
the demonstration started in 2011 was tight. There were 165 days of planned
blackouts per year. This was due to the fact that the chronic electricity
shortage had not been solved because of the long delay of financing and
construction works of the 1st short-term electricity development plan
formulated in the Republic of Indonesia in 2006, while the demand for
electricity was growing rapidly.
The country’s industrial parks are featured in "industrial cluster" that
consumes about 1/3 of the country's total energy consumption and have
seen remarkable growth in the energy consumption. Among others, the
Suryacipta City of Industry, whose land sales is carried out by Sumitomo
Corporation, has been occupied by many Japanese companies (more than
half i.e. approximately 130 tenants are Japanese companies), and high-
quality power sources were in demand.
Based on the above, this demonstration aims to create a new business
model that provides high-quality services / distribution system stabilization
services to electric power companies (PLNs) using Japanese technology.
In order to demonstrate this service, it is necessary to create a new power
distribution system in the industrial park. However, it violates the country's
regulations of one power supplier per area, so in cooperation with MEMR
and PLN, NEDO conducted the project as a demonstration project.
Figure 1 Demonstration system
- 2 -
3. Demonstration overview
This demonstration was based on four themes. The themes of the
demonstration and the roles of the implementers are shown in Table 1.
Themes 1 and 2 are technological and business demonstrations based
on the actual situation in Indonesia described above. Theme 3 is a technical
demonstration of the infrastructure for implementing the system in Theme 2.
In addition, Theme 4 examines the business structure for developing these
technologies and businesses in the region.
Table 1 Demonstration theme and Roles of Japanese operators Role Description Implemented by
1.Power quality stabilization technology
Technology and Business Demonstration of High-Quality Power Supply Systems
Fuji Electric
Technical demonstration of power distribution automation system
2.Energy management of industrial park
Technology and business demonstration of DSM system
Mitsubishi Electric
Demonstration of factory-mounted FEMS and Simplified FEMS Demonstration of cloud-based FEMS technology
Fuji Electric
3. Construction of ICT platform that serves as the foundation for Theme 2
Demonstration of ICT platform technologies
NTT Communications
4.Survey on establishment of local JVC
Business model analysis and JVC establishment survey
Sumisho Machinery Trade
Corporation
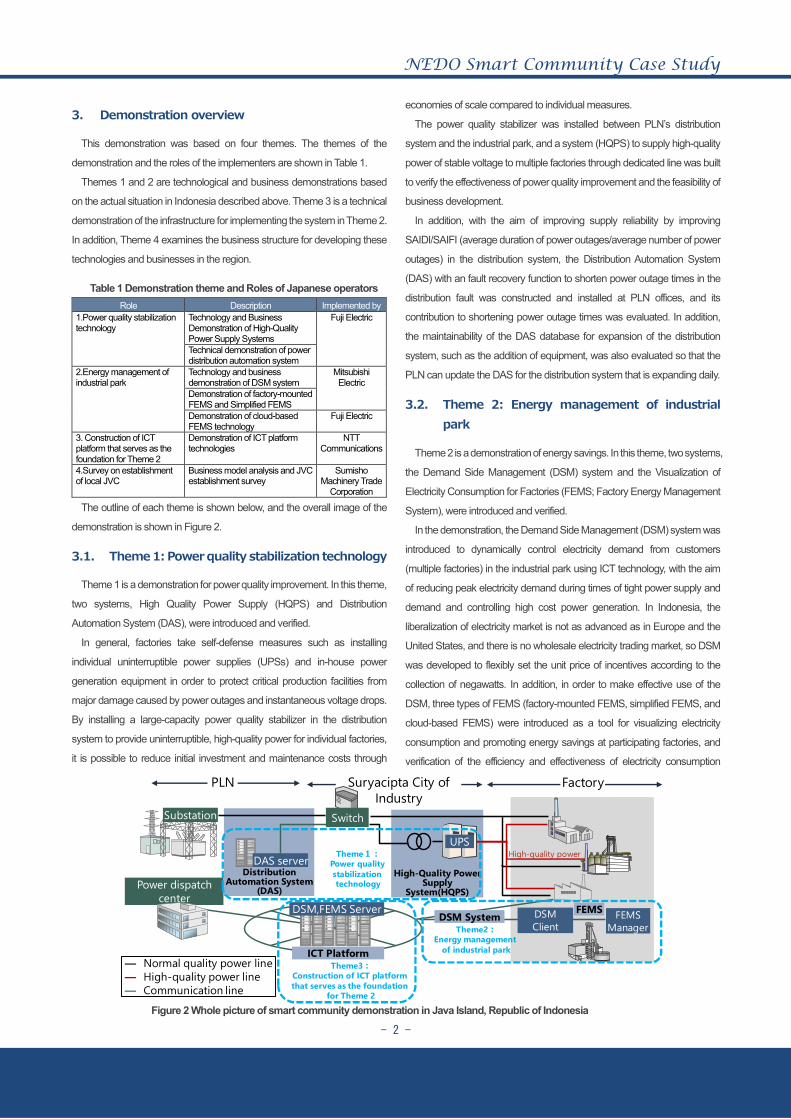
The outline of each theme is shown below, and the overall image of the
demonstration is shown in Figure 2.
3.1. Theme 1: Power quality stabilization technology
Theme 1 is a demonstration for power quality improvement. In this theme,
two systems, High Quality Power Supply (HQPS) and Distribution
Automation System (DAS), were introduced and verified.
In general, factories take self-defense measures such as installing
individual uninterruptible power supplies (UPSs) and in-house power
generation equipment in order to protect critical production facilities from
major damage caused by power outages and instantaneous voltage drops.
By installing a large-capacity power quality stabilizer in the distribution
system to provide uninterruptible, high-quality power for individual factories,
it is possible to reduce initial investment and maintenance costs through
economies of scale compared to individual measures.
The power quality stabilizer was installed between PLN’s distribution
system and the industrial park, and a system (HQPS) to supply high-quality
power of stable voltage to multiple factories through dedicated line was built
to verify the effectiveness of power quality improvement and the feasibility of
business development.
In addition, with the aim of improving supply reliability by improving
SAIDI/SAIFI (average duration of power outages/average number of power
outages) in the distribution system, the Distribution Automation System
(DAS) with an fault recovery function to shorten power outage times in the
distribution fault was constructed and installed at PLN offices, and its
contribution to shortening power outage times was evaluated. In addition,
the maintainability of the DAS database for expansion of the distribution
system, such as the addition of equipment, was also evaluated so that the
PLN can update the DAS for the distribution system that is expanding daily.
3.2. Theme 2: Energy management of industrial park
Theme 2 is a demonstration of energy savings. In this theme, two systems,
the Demand Side Management (DSM) system and the Visualization of
Electricity Consumption for Factories (FEMS; Factory Energy Management
System), were introduced and verified.
In the demonstration, the Demand Side Management (DSM) system was
introduced to dynamically control electricity demand from customers
(multiple factories) in the industrial park using ICT technology, with the aim
of reducing peak electricity demand during times of tight power supply and
demand and controlling high cost power generation. In Indonesia, the
liberalization of electricity market is not as advanced as in Europe and the
United States, and there is no wholesale electricity trading market, so DSM
was developed to flexibly set the unit price of incentives according to the
collection of negawatts. In addition, in order to make effective use of the
DSM, three types of FEMS (factory-mounted FEMS, simplified FEMS, and
cloud-based FEMS) were introduced as a tool for visualizing electricity
consumption and promoting energy savings at participating factories, and
verification of the efficiency and effectiveness of electricity consumption
Figure 2 Whole picture of smart community demonstration in Java Island, Republic of Indonesia
Distribution Automation System
(DAS)High-Quality Power
Supply System(HQPS)
― Normal quality power line― High-quality power line― Communication line
PLN Suryacipta City of Industry
Factory
UPS
Switch
DAS server
Substation
Power dispatchcenter
ICT Platform
FEMSManager
DSM System DSMClient
DSM,FEMS Server
High-quality power
FEMS
Theme1:Power quality stabilization technology
Theme3:Construction of ICT platform that serves as the foundation
for Theme 2
Theme2:Energy management
of industrial park
- 3 -
analysis was carried out.
3.3. Theme 3: Construction of ICT platform that serves as the foundation for Theme 2
Theme 3 is to construct the infrastructure (common infrastructure)
necessary for the actual operation of DSM and cloud-based FEMS among
the applications developed in Theme 2, and to verify the effectiveness of this
infrastructure.
Specifically, High-quality communication infrastructure that spans a wide
area between the data center in Jakarta and the industrial park, as well as
cloud infrastructure equipped with various server functions were provided to
verify the validity of a common basis for Theme 2. In addition, effective use
of these ICT platforms and possible provision of business applications were
examined.
3.4. Theme 4: Survey on the establishment of local JVC
Theme 4 is to verify the business structure and other aspects of the
technology and business that were demonstrated in Themes 1 to 3.
In order to continue the business and develop export of packaged
infrastructure, it was essential to have a local management body.
In order to realize the business model considered at the beginning of the
demonstration project, interviews were conducted with related companies in
order to clarify the possibility of establishing a Joint Venture Company (JVC)
and the conditions for its establishment, and the results were compiled.
Surveys were conducted on local laws and regulations, procedures for
establishing local companies, and business licenses in implementing HQPS,
DSM, FEMS, and ICT platform businesses.
Figure 3 Scope of survey
4. Construction of demonstration system
In this chapter, the systems constructed for the demonstration are
described respectively.
4.1. Theme 1: Power quality stabilization technology
4.1.1. High Quality Power Supply System (HQPS)
The conventional method of installing UPSs at individual factories as a
measure to cope with power outages and instantaneous voltage drops
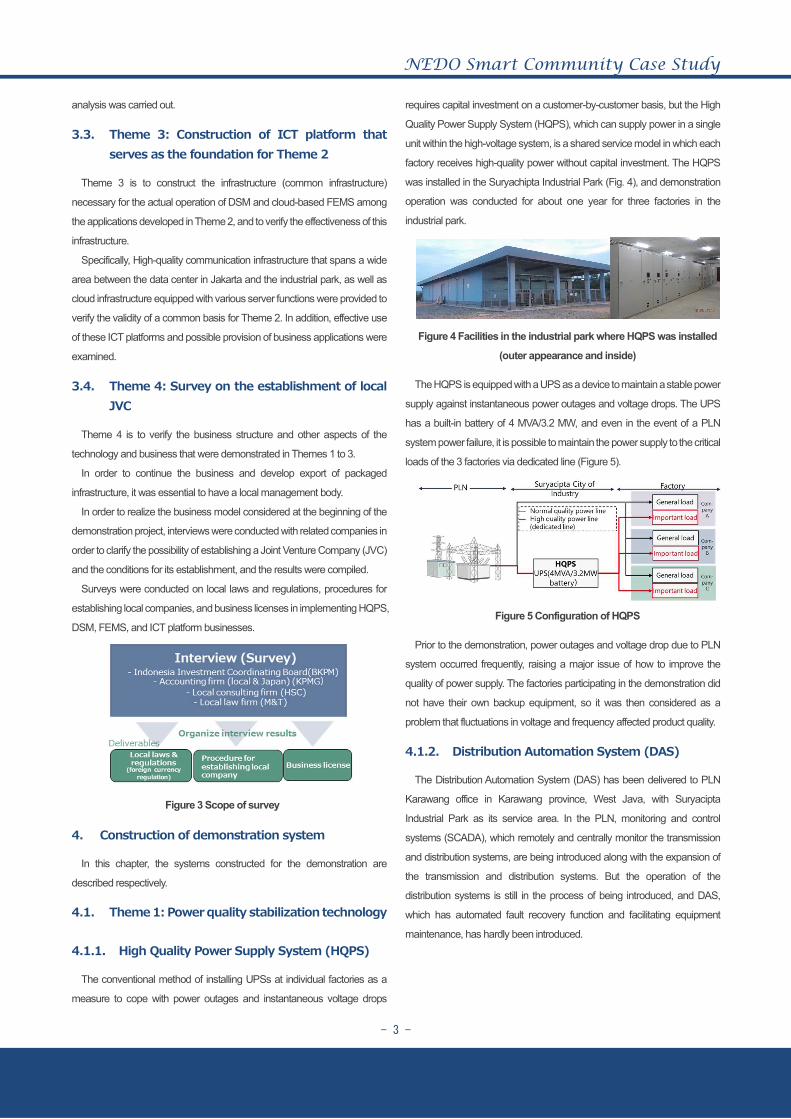
requires capital investment on a customer-by-customer basis, but the High
Quality Power Supply System (HQPS), which can supply power in a single
unit within the high-voltage system, is a shared service model in which each
factory receives high-quality power without capital investment. The HQPS
was installed in the Suryachipta Industrial Park (Fig. 4), and demonstration
operation was conducted for about one year for three factories in the
industrial park.
Figure 4 Facilities in the industrial park where HQPS was installed
(outer appearance and inside)
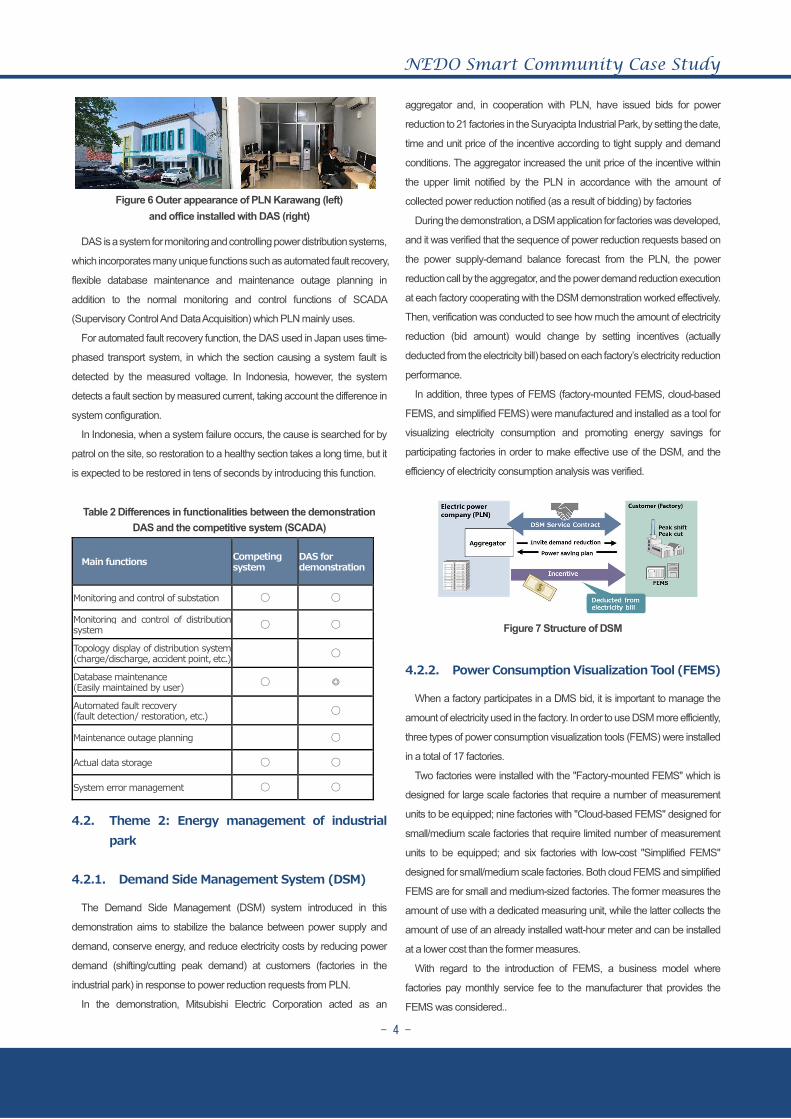
The HQPS is equipped with a UPS as a device to maintain a stable power
supply against instantaneous power outages and voltage drops. The UPS
has a built-in battery of 4 MVA/3.2 MW, and even in the event of a PLN
system power failure, it is possible to maintain the power supply to the critical
loads of the 3 factories via dedicated line (Figure 5).
Figure 5 Configuration of HQPS
Prior to the demonstration, power outages and voltage drop due to PLN
system occurred frequently, raising a major issue of how to improve the
quality of power supply. The factories participating in the demonstration did
not have their own backup equipment, so it was then considered as a
problem that fluctuations in voltage and frequency affected product quality.
4.1.2. Distribution Automation System (DAS)
The Distribution Automation System (DAS) has been delivered to PLN
Karawang office in Karawang province, West Java, with Suryacipta
Industrial Park as its service area. In the PLN, monitoring and control
systems (SCADA), which remotely and centrally monitor the transmission
and distribution systems, are being introduced along with the expansion of
the transmission and distribution systems. But the operation of the
distribution systems is still in the process of being introduced, and DAS,
which has automated fault recovery function and facilitating equipment
maintenance, has hardly been introduced.
- 4 -
Figure 6 Outer appearance of PLN Karawang (left) and office installed with DAS (right)
DAS is a system for monitoring and controlling power distribution systems,
which incorporates many unique functions such as automated fault recovery,
flexible database maintenance and maintenance outage planning in
addition to the normal monitoring and control functions of SCADA
(Supervisory Control And Data Acquisition) which PLN mainly uses.
For automated fault recovery function, the DAS used in Japan uses time-
phased transport system, in which the section causing a system fault is
detected by the measured voltage. In Indonesia, however, the system
detects a fault section by measured current, taking account the difference in
system configuration.
In Indonesia, when a system failure occurs, the cause is searched for by
patrol on the site, so restoration to a healthy section takes a long time, but it
is expected to be restored in tens of seconds by introducing this function.
Table 2 Differences in functionalities between the demonstration DAS and the competitive system (SCADA)
Main functions Competing system
DAS for demonstration
Monitoring and control of substation
Monitoring and control of distribution system
Topology display of distribution system (charge/discharge, accident point, etc.)
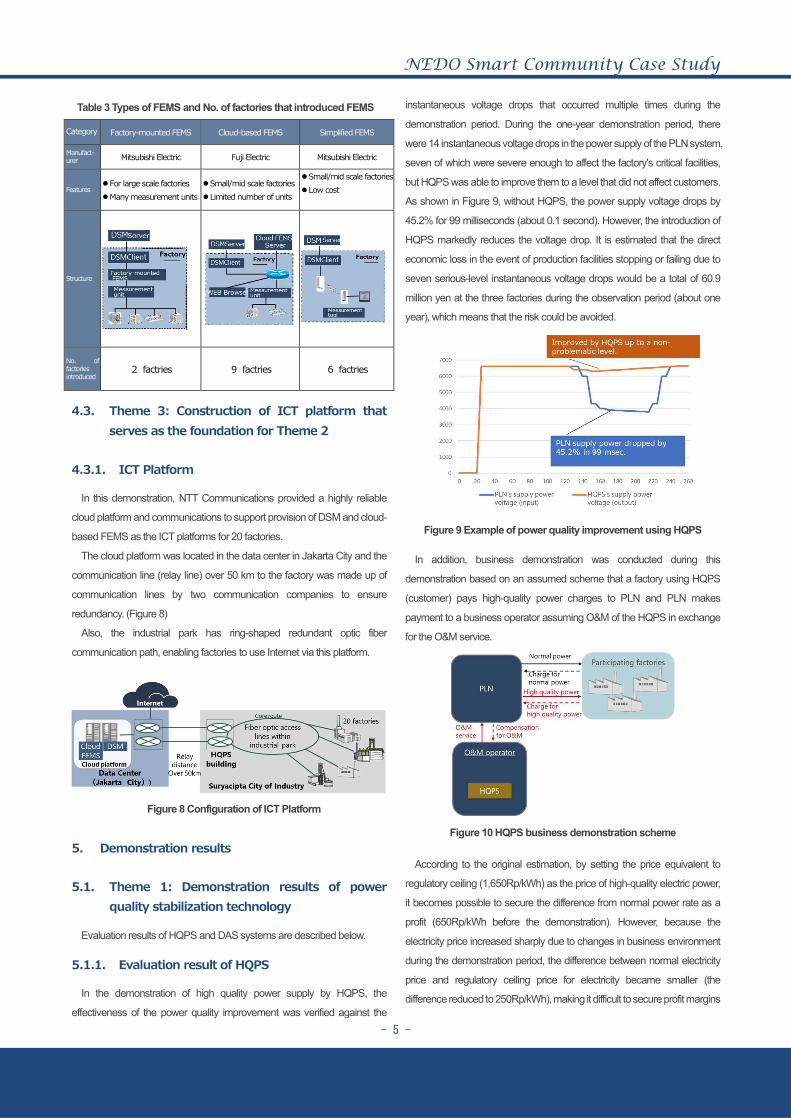
Manufact-urer Mitsubishi Electric Fuji Electric Mitsubishi Electric
Features For large scale factories Many measurement units
Small/mid scale factories Limited number of units
Small/mid scale factories Low cost
Structure
No. of factories introduced
2 factries 9 factries 6 factries
4.3. Theme 3: Construction of ICT platform that serves as the foundation for Theme 2
4.3.1. ICT Platform
In this demonstration, NTT Communications provided a highly reliable
cloud platform and communications to support provision of DSM and cloud-
based FEMS as the ICT platforms for 20 factories.
The cloud platform was located in the data center in Jakarta City and the
communication line (relay line) over 50 km to the factory was made up of
communication lines by two communication companies to ensure
redundancy. (Figure 8)
Also, the industrial park has ring-shaped redundant optic fiber
communication path, enabling factories to use Internet via this platform.
Figure 8 Configuration of ICT Platform
5. Demonstration results
5.1. Theme 1: Demonstration results of power quality stabilization technology
Evaluation results of HQPS and DAS systems are described below.
5.1.1. Evaluation result of HQPS
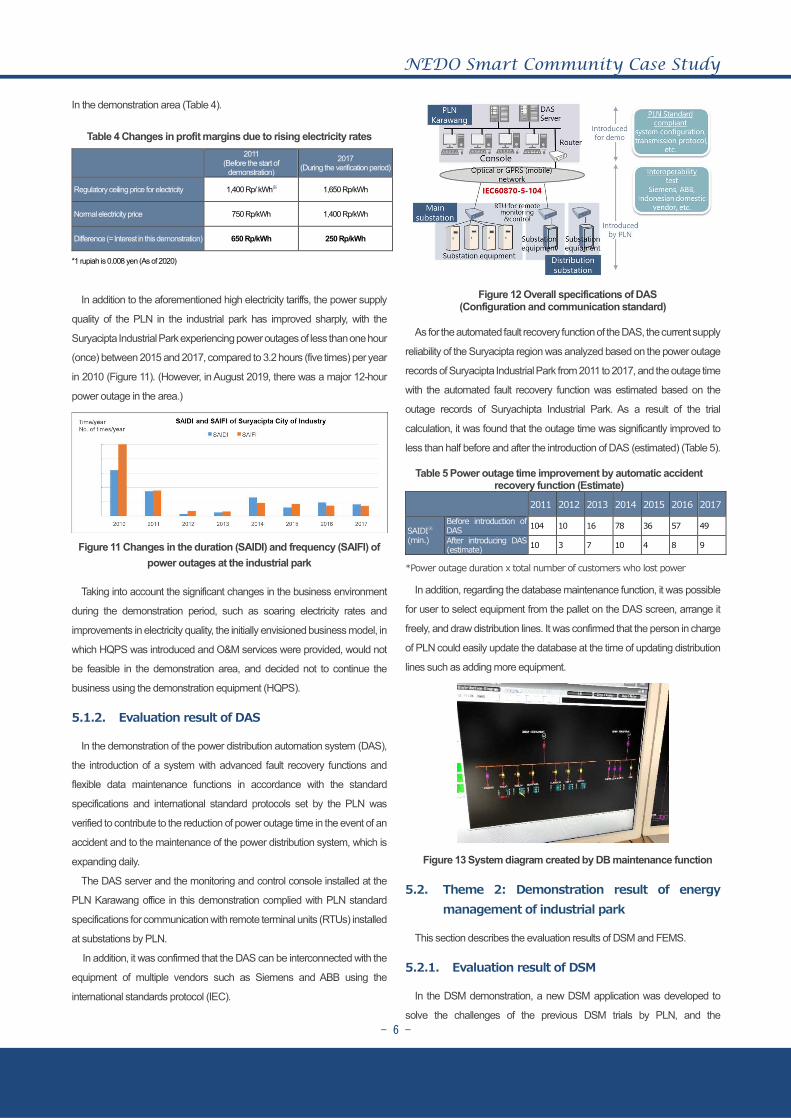
In the demonstration of high quality power supply by HQPS, the
effectiveness of the power quality improvement was verified against the
instantaneous voltage drops that occurred multiple times during the
demonstration period. During the one-year demonstration period, there
were 14 instantaneous voltage drops in the power supply of the PLN system,
seven of which were severe enough to affect the factory's critical facilities,
but HQPS was able to improve them to a level that did not affect customers.
As shown in Figure 9, without HQPS, the power supply voltage drops by
45.2% for 99 milliseconds (about 0.1 second). However, the introduction of
HQPS markedly reduces the voltage drop. It is estimated that the direct
economic loss in the event of production facilities stopping or failing due to
seven serious-level instantaneous voltage drops would be a total of 60.9
million yen at the three factories during the observation period (about one
year), which means that the risk could be avoided.
Figure 9 Example of power quality improvement using HQPS
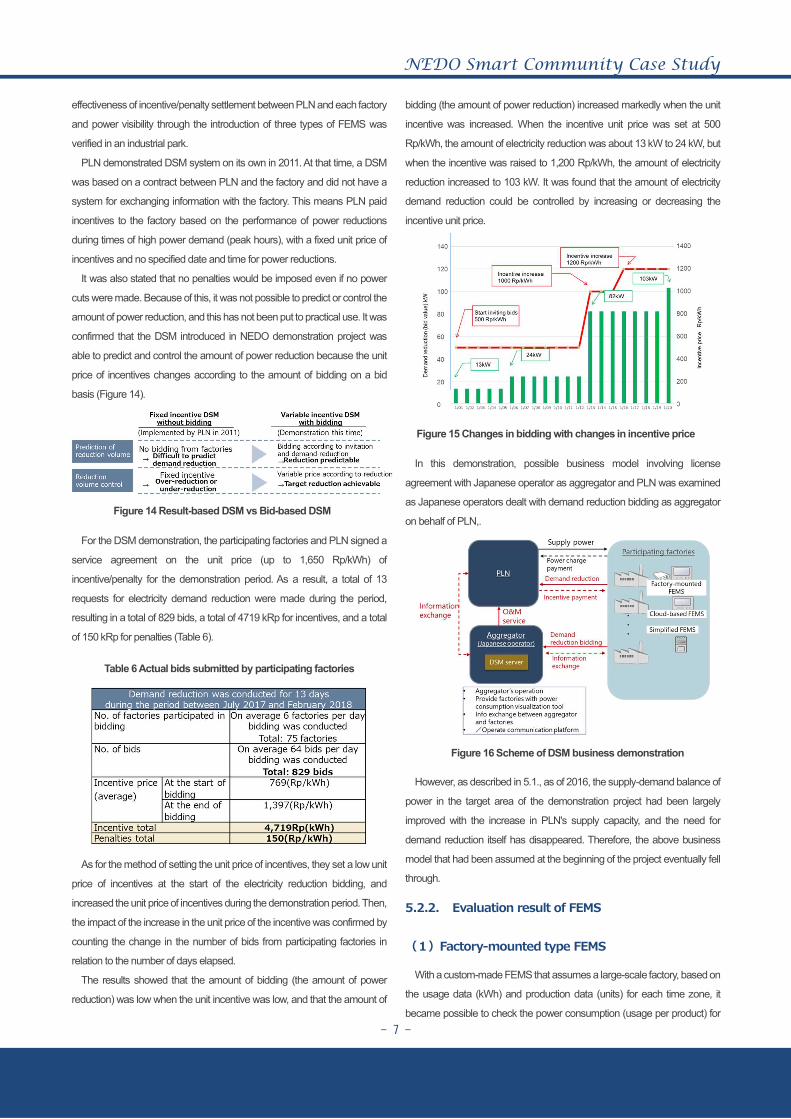
In addition, business demonstration was conducted during this
demonstration based on an assumed scheme that a factory using HQPS
(customer) pays high-quality power charges to PLN and PLN makes
payment to a business operator assuming O&M of the HQPS in exchange
for the O&M service.
Figure 10 HQPS business demonstration scheme
According to the original estimation, by setting the price equivalent to
regulatory ceiling (1,650Rp/kWh) as the price of high-quality electric power,
it becomes possible to secure the difference from normal power rate as a
profit (650Rp/kWh before the demonstration). However, because the
electricity price increased sharply due to changes in business environment
during the demonstration period, the difference between normal electricity
price and regulatory ceiling price for electricity became smaller (the
difference reduced to 250Rp/kWh), making it difficult to secure profit margins
- 6 -
In the demonstration area (Table 4).
Table 4 Changes in profit margins due to rising electricity rates
2011
(Before the start of demonstration)
2017 (During the verification period)
Regulatory ceiling price for electricity 1,400 Rp/ kWh※ 1,650 Rp/kWh
Normal electricity price 750 Rp/kWh 1,400 Rp/kWh
Difference (= Interest in this demonstration) 650 Rp/kWh 250 Rp/kWh
*1 rupiah is 0.008 yen (As of 2020)
In addition to the aforementioned high electricity tariffs, the power supply
quality of the PLN in the industrial park has improved sharply, with the
Suryacipta Industrial Park experiencing power outages of less than one hour
(once) between 2015 and 2017, compared to 3.2 hours (five times) per year
in 2010 (Figure 11). (However, in August 2019, there was a major 12-hour
power outage in the area.)
Figure 11 Changes in the duration (SAIDI) and frequency (SAIFI) of power outages at the industrial park
Taking into account the significant changes in the business environment
during the demonstration period, such as soaring electricity rates and
improvements in electricity quality, the initially envisioned business model, in
which HQPS was introduced and O&M services were provided, would not
be feasible in the demonstration area, and decided not to continue the
business using the demonstration equipment (HQPS).
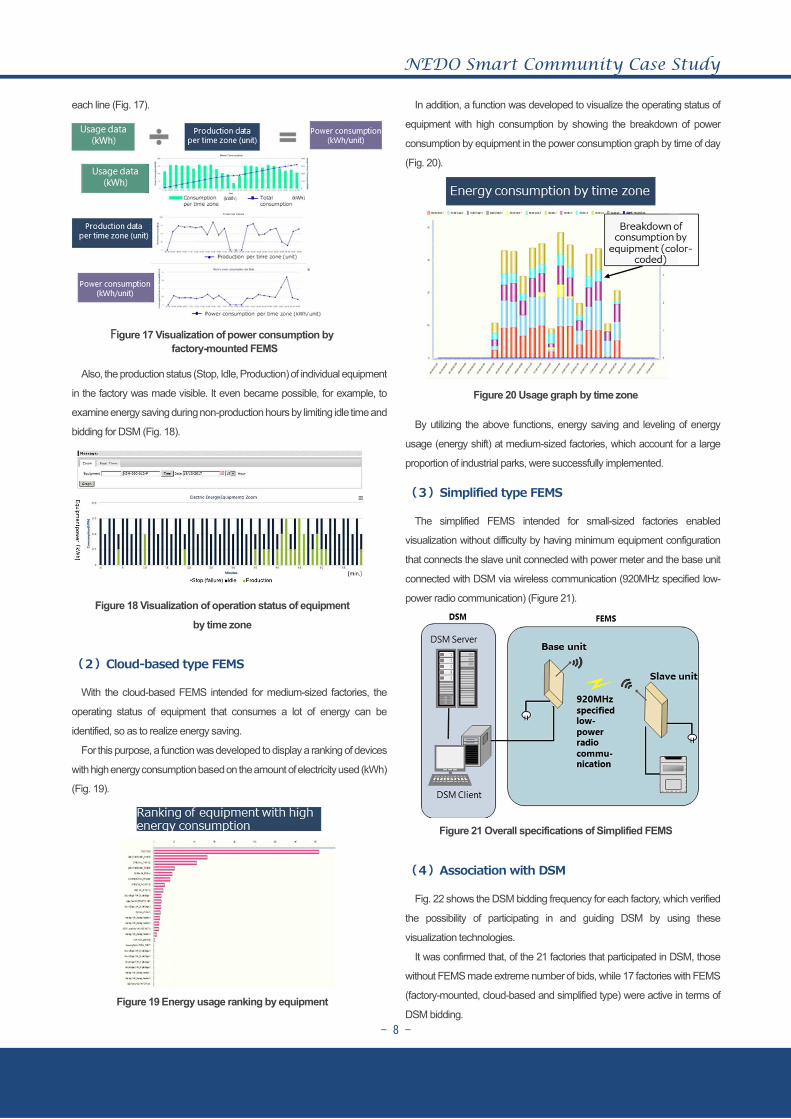
5.1.2. Evaluation result of DAS
In the demonstration of the power distribution automation system (DAS),
the introduction of a system with advanced fault recovery functions and
flexible data maintenance functions in accordance with the standard
specifications and international standard protocols set by the PLN was
verified to contribute to the reduction of power outage time in the event of an
accident and to the maintenance of the power distribution system, which is
expanding daily.
The DAS server and the monitoring and control console installed at the
PLN Karawang office in this demonstration complied with PLN standard
specifications for communication with remote terminal units (RTUs) installed
at substations by PLN.
In addition, it was confirmed that the DAS can be interconnected with the
equipment of multiple vendors such as Siemens and ABB using the
international standards protocol (IEC).
Figure 12 Overall specifications of DAS (Configuration and communication standard)
As for the automated fault recovery function of the DAS, the current supply
reliability of the Suryacipta region was analyzed based on the power outage
records of Suryacipta Industrial Park from 2011 to 2017, and the outage time
with the automated fault recovery function was estimated based on the
outage records of Suryachipta Industrial Park. As a result of the trial
calculation, it was found that the outage time was significantly improved to
less than half before and after the introduction of DAS (estimated) (Table 5).
Table 5 Power outage time improvement by automatic accident recovery function (Estimate)
2011 2012 2013 2014 2015 2016 2017
SAIDI※ (min.)
Before introduction of DAS 104 10 16 78 36 57 49 After introducing DAS (estimate) 10 3 7 10 4 8 9
*Power outage duration x total number of customers who lost power
In addition, regarding the database maintenance function, it was possible
for user to select equipment from the pallet on the DAS screen, arrange it
freely, and draw distribution lines. It was confirmed that the person in charge
of PLN could easily update the database at the time of updating distribution
lines such as adding more equipment.
Figure 13 System diagram created by DB maintenance function
5.2. Theme 2: Demonstration result of energy management of industrial park
This section describes the evaluation results of DSM and FEMS.
5.2.1. Evaluation result of DSM
In the DSM demonstration, a new DSM application was developed to
solve the challenges of the previous DSM trials by PLN, and the
- 7 -
effectiveness of incentive/penalty settlement between PLN and each factory
and power visibility through the introduction of three types of FEMS was
verified in an industrial park.
PLN demonstrated DSM system on its own in 2011. At that time, a DSM
was based on a contract between PLN and the factory and did not have a
system for exchanging information with the factory. This means PLN paid
incentives to the factory based on the performance of power reductions
during times of high power demand (peak hours), with a fixed unit price of
incentives and no specified date and time for power reductions.
It was also stated that no penalties would be imposed even if no power
cuts were made. Because of this, it was not possible to predict or control the
amount of power reduction, and this has not been put to practical use. It was
confirmed that the DSM introduced in NEDO demonstration project was
able to predict and control the amount of power reduction because the unit
price of incentives changes according to the amount of bidding on a bid
basis (Figure 14).
Figure 14 Result-based DSM vs Bid-based DSM
For the DSM demonstration, the participating factories and PLN signed a
service agreement on the unit price (up to 1,650 Rp/kWh) of
incentive/penalty for the demonstration period. As a result, a total of 13
requests for electricity demand reduction were made during the period,
resulting in a total of 829 bids, a total of 4719 kRp for incentives, and a total
of 150 kRp for penalties (Table 6).
Table 6 Actual bids submitted by participating factories
As for the method of setting the unit price of incentives, they set a low unit
price of incentives at the start of the electricity reduction bidding, and
increased the unit price of incentives during the demonstration period. Then,
the impact of the increase in the unit price of the incentive was confirmed by
counting the change in the number of bids from participating factories in
relation to the number of days elapsed.
The results showed that the amount of bidding (the amount of power
reduction) was low when the unit incentive was low, and that the amount of
bidding (the amount of power reduction) increased markedly when the unit
incentive was increased. When the incentive unit price was set at 500
Rp/kWh, the amount of electricity reduction was about 13 kW to 24 kW, but
when the incentive was raised to 1,200 Rp/kWh, the amount of electricity
reduction increased to 103 kW. It was found that the amount of electricity
demand reduction could be controlled by increasing or decreasing the
incentive unit price.
Figure 15 Changes in bidding with changes in incentive price
In this demonstration, possible business model involving license
agreement with Japanese operator as aggregator and PLN was examined
as Japanese operators dealt with demand reduction bidding as aggregator
on behalf of PLN,.
Figure 16 Scheme of DSM business demonstration
However, as described in 5.1., as of 2016, the supply-demand balance of
power in the target area of the demonstration project had been largely
improved with the increase in PLN's supply capacity, and the need for
demand reduction itself has disappeared. Therefore, the above business
model that had been assumed at the beginning of the project eventually fell
through.
5.2.2. Evaluation result of FEMS
(1)Factory-mounted type FEMS
With a custom-made FEMS that assumes a large-scale factory, based on
the usage data (kWh) and production data (units) for each time zone, it
became possible to check the power consumption (usage per product) for
- 8 -
each line (Fig. 17).
Figure 17 Visualization of power consumption by factory-mounted FEMS
Also, the production status (Stop, Idle, Production) of individual equipment
in the factory was made visible. It even became possible, for example, to
examine energy saving during non-production hours by limiting idle time and
bidding for DSM (Fig. 18).
Figure 18 Visualization of operation status of equipment
by time zone
(2)Cloud-based type FEMS
With the cloud-based FEMS intended for medium-sized factories, the
operating status of equipment that consumes a lot of energy can be
identified, so as to realize energy saving.
For this purpose, a function was developed to display a ranking of devices
with high energy consumption based on the amount of electricity used (kWh)
(Fig. 19).
Figure 19 Energy usage ranking by equipment
In addition, a function was developed to visualize the operating status of
equipment with high consumption by showing the breakdown of power
consumption by equipment in the power consumption graph by time of day
(Fig. 20).
Figure 20 Usage graph by time zone
By utilizing the above functions, energy saving and leveling of energy
usage (energy shift) at medium-sized factories, which account for a large
proportion of industrial parks, were successfully implemented.
(3)Simplified type FEMS
The simplified FEMS intended for small-sized factories enabled
visualization without difficulty by having minimum equipment configuration
that connects the slave unit connected with power meter and the base unit
connected with DSM via wireless communication (920MHz specified low-
power radio communication) (Figure 21).
Figure 21 Overall specifications of Simplified FEMS
(4)Association with DSM
Fig. 22 shows the DSM bidding frequency for each factory, which verified
the possibility of participating in and guiding DSM by using these
visualization technologies.
It was confirmed that, of the 21 factories that participated in DSM, those
without FEMS made extreme number of bids, while 17 factories with FEMS
(factory-mounted, cloud-based and simplified type) were active in terms of
DSM bidding.
- 9 -
Figure 22 Frequency of DSM bidding by factory (with and without FEMS)
5.3. Theme 3: Demonstration result of construction of ICT Platform
As shown in Table 7, the service was successfully provided to DSM and
Cloud-type FEMS by the redundant configuration. No problem was found
with the performance and quality during the demonstration period, and the
effectiveness was verified.
Based on the observations between May 2017 and February 2018, Table
7 compares the utilization rates with and without redundant configurations.
The utilization rate for the redundant configuration is shown in the bottom
row, and the utilization rate for the period in which the redundant
configuration is not used is shown in the upper row as an estimate.
In the section from data center to service line of the industrial park, if the
configuration is not redundant, the annual downtime was more than 7 hours.
However, with redundant configuration, the downtime became 0 hour with
the utilization rate of 100%, succeeded in ensuring high availability.
Table 7 Comparison of utilization rate of equipment with or without redundant configuration
5.4. Theme 4: Survey results on establishment of local JVC
In the study of the establishment of the local JVC, the possibility of
dissemination of the business results was verified based on the business
model of each system.
Through the survey, the business licenses required for projects as well as
the procedures for establishing a local company in accordance with
Indonesia regulations were confirmed in a comprehensive manner. It was
clarified that although required license would be different depending on the
solution, the common procedures would be used for establishing a local
company, for example when making applications for and registering a
company with the government agencies. (Table 8)
Table 8 Requirements by project (summary)
5.5. Demonstration results - Summary
The results of the demonstrations on the four themes are summarized in
Table 9.
Table 9: Results of demonstration (Summary) Theme Results/Achievement
Power quality stabilization technology
It was confirmed that communication between DAS system and RTU was PLN Standard compliant and that the system can be interconnected with equipment of multiple vendors.
Power outage duration was improved by the automated recovery function and operator of PLN became able to easily update/ maintain the system diagram.
It was confirmed that the instantaneous voltage drop occurred in the PLN system during the demonstration period could be improved to a non-problematic level by the HQPS.
Energy management of industrial park
It was confirmed that bidding was activated with the increase in the incentive price, revealing that power demand could be controlled by increasing or decreasing the incentive unit price.
Visualization of power consumption using FEMS was realized and successfully linked with DSM. It was found that the DSM bidding was activated with the introduction of visualization of power consumption.
Construction of ICT Platform
ICT platform that uses DSM and cloud-based FEMS via communication network was built.
There was no problem with the performance and quality during the demonstration period, and the effectiveness was verified. In particular, the adoption of redundant configuration has reduced the downtime to 0 hour, succeeded in ensuring high availability with 100% utilization rate.
Survey on establishment of local JVC
The business licenses required for each business and the procedures for establishing local company in accordance with Indonesian regulations were confirmed exhaustively.
Energy saving and CO2 reduction effects through introduction of DSM
were also estimated as the results of this demonstration.
Based on the energy saving effect estimated from the contracted power
and the average power reduction rate of the industrial park, the estimate was
also made for PLN's Java Bali system.
<Energy saving effect by introducing DSM>
Energy saving of industrial park: 800MWh / year
Energy saving of Java Bali system: 67.1 GWh / year, 844 GWh (10 years)
<CO2 reduction effect by introducing DSM>
CO2 reduction of Java Bali system: 752kt-CO2 (10 years)
- 10 -
6. Key Findings
Important achievements and implications obtained through this
demonstration project have been organized from the following three
perspectives:
① Importance of flexibility with changes in business environment
② Balancing of international standardization and usability
③ Change of perspective from technology to business
Point(1): Importance of flexibility with changes in business environment
At the start of the demonstration (2011), Indonesia was in short supply of
power, and there was a strong need for power companies to reduce
demand and consumers to stabilize power quality (to avoid power outages).
Considering this, the demonstration was positioned as a business
demonstration. However, the electric power company PLN sharply
expanded the generation facilities, which significantly improved the supply-
demand balance during the demonstration period. As a result, initially
assumed business models for HQPS and DSM fell through in the short term.
Regarding the DAS introduced in PLN's office, Mr. Adi of PLN commented
that the Suryacipta City of Industry had already been relatively reliable areas
in terms of power supply so that it could be further utilized in areas with lower
reliability.
On the other hand, Mr. Walla of Suryacipta City Of Industry (SCI) pointed
out that if factories of robots and semiconductors are located in an industrial
park to be developed in the future, the need for high-quality electricity would
increase and that if industrial park has its own power source, the need for
demand reduction would increase, suggesting possible future utilization of
Japanese technology.
As described above, the fluctuations in supply-demand balance and
differences in power quality required in the target area have a great impact
on energy business. It is therefore necessary to assume trends of the
business environment as much as possible in advance and establish a
system that allows the provider to flexibly change the plan.
This is the first smart community demonstration by NEDO in Southeast
Asia. Based on the demonstration results, risk management guidelines
including actually formulated to appropriately review the business system
through the PDCA cycle, and have been utilized in planning and
management of subsequent demonstrations. This is considered one of the
achievements of the project.
Hardware-based solutions pose an issue of increase in fixed costs
associated with handling and maintaining things, but cloud-based solutions
involve only the usage fee which therefore have an operational advantage
because the users can take flexible contract arrangements and plan
expansion and abolition of servers according to customer needs.
Point(2): Balancing of international standardization and usability
Through construction of DAS (Distribuion Automation System) in this
demonstration project, Fuji Electric complied with the IEC communication
standards, carried out testing for interoperability with equipment of multiple
vendors and successfully built a highly versatile package system.
The SCADA and DAS made by Japanese vendors that have been
introduced by general transmission and distribution operators in Japan have
limited compliance with IEC in terms of communication standards and
databases. They have not reached the level to be used in general.
On the other hand, systems from major European and American vendors,
including remote control units (RTUs), have been developed based on the
IEC communication standards. Even in Southeast Asia where many of them
have already been introduced, the application of IEC has become a
standard in terms of coordination between systems, etc.
In fact, the PLN standard that stipulates the standard specifications for the
products which PLN adopts has been developed based on the IEC
communication standard, i.e. PLN does not introduce own standard unlike
Japan.
It is therefore important to establish a system that can easily coordinate
with other existing systems and equipment based on the compliance with
international standards, even when deploying Japanese solutions overseas.
In addition, in terms of the strengths compared with the competitors, DAS-
specific functions support PLN's operation, and its unique usability-
conscious function would continue to add value to the system.
According to Mr. Hendra of PLN Karawang, where DAS was installed,
DAS is used about once a week, and the main functions being used are
remote control for switching the system, changing system diagram and
monitoring of equipment status. It was a great achievement to have the
ability to monitor the status of equipment on the distribution system online
using DAS, which allows to take measures in advance if something goes
wrong.
Although being multifunctional and excellent in usability, DAS has a
certain level of restrictions on user customization compared with the
competitive system in Europe and the United States (SCADA), and it is an
issue that it is designed with less flexibility.
Based on the above, it is believed that improving the versatility and
interoperability by complying with the standard and achieving usability
according to customer needs will be advantage of Japanese solutions.
Point: ③ Change of perspective from technology to business
In this project, DAS, HQPS, DSM, FEMS and ICT platform each achieved
the goal in terms of technical demonstration, being able to show Japan’s
high technical capabilities in this field.
In fact, stakeholders like Mr. Purnomo of PLN and Mr. Edi of MEMR
praised the high quality of Japanese solutions.
On the other hand, such comments were obtained that they were not yet
feasible as business when comparing the benefits from introduction of
system with the system maintenance costs.
In particular, as described above, one of the reasons this time was that
- 11 -
because the supply-demand balance of power improved during the
demonstration period, it became difficult for company to secure profits.
Given that the supply-demand balance would improve sooner or later, it is
important to aim for creating universal value that does not depend on
changes in the business environment to make good business sense.
For specific needs, Mr. Walla of SCI and Mr. Edi of MEMR mentioned that
they wanted technology transfer from Japan. This reflects the idea that not
just having Japanese vendors bring in Japanese solution but the
cooperation with local vendors would contribute to improving technical
capabilities of the relevant country.
In addition, as a result of the survey on the establishment of local JVC, it
was pointed out by Mr. Tachi of Sumitomo Corporation that in order to
develop the business it is necessary to register license which however is
difficult to carry out by Japanese operator alone.
In order to be successful as a business, it is believed important for a
company to increase the presence abroad through expansion of local
technical resources including associating with foreign partners (operators)
and export of technical knowhow as well as solutions.
7. Summary
The implementation content, results achieved and key findings for each
of the themes conducted in this demonstration have been summarized.
It was a great achievement that the power quality improvement
technology, which is one of Japan's strengths, was proven to be effective in
the Indonesian power grid, and that each solution achieved its quality goal.
Further, the establishment of relationships with local stakeholders
including the power company PLN is considered to help Japanese
companies deploy technology in Indonesia in the future.
On the other hand, Indonesia, where demand was growing remarkably,
securing supply capacity was a top priority issue, therefore it was premature
to seek the solutions for reducing social and labor costs at that time.
However, it is expected that the solutions such as DSM and HQPS will
increase the value not only in electric power companies but also among
customers if self-consumption of energy makes progress in the future,
driven by lower-cost batteries and other distributed energy resources.
In such efforts, it is hoped that the solutions will be developed into
successful business with reference to the knowledge and learning obtained
from this demonstration.
Finally, comments by stakeholders of Japan and overseas who deeply
engaged in this demonstration are introduced.
Comment by Mr. Purnomo, PLN
PLN’s basic monitoring and control system is SCADA, but Suryacipta’s
DAS is still being used. If more advanced functions are added, it will be
needed in various places. I suspect that DAS will become more popular in
5 or 10 years.
Japanese engineers are open, friendly and easy to work with. If you have
a problem, they will deal with it immediately. I was able to work with them
without any worries. If the project with Japan is feasible for the customer, I
would like to be involved again.
Comment by Mr. Nakamura, Fuji Electric
I think it is one of the achievements that PLN engineers got interested in
DAS. I feel that they were particularly interested in the functions of detecting
and recovering from accident points and the system diagram
maintenance. In the case of SCADA of European and American vendors,
they have to code by themselves for the maintenance of system diagram,
and it does not support charging and power failure indications. In this
regard, the system diagram function is useful. However, a problem is that
users cannot freely increase the types of equipment.
Comment by Mr. Walla, SURYACIPTA CITY OF INDUSTRY
The ability to react to small voltage and frequency deviations was
better than what is stated in the operating standard of PLN. It did not result
in continued use with additional charge on normal electricity rate after the
demonstration, but because there occurred blackouts three times in the
area in 2019, some factories may have regrets over removing HQPS. If
factories of robots and semiconductors enter the industrial park in the
future, the required quality will be higher and the need for HQPS will
emerge.
Also, because Suryacipta City of Industry has set up a power contract with
PLN at a flat price regardless of the time zone, the benefits of DSM could
not be found. However, for example, from the standpoint of procuring
supply capacity by ourselves (i.e. having own power generation facility), it
would be useful if DSM could reduce the originally prepared power of 100
to 60. This is what we are thinking at the moment for the new industrial park
we are planning. We believe that there are areas where Japanese
technology can be used.
- 12 -
Comment by Mr. Jaya, MEMR
Many factories participated in the demonstration and their reaction was
that the systems were easy to use but not so necessary at present.
MEMR is responsible for the promotion of energy saving which should be
addressed anyway even if power is oversupplied.
It is said that the customers of C & I (Commercial and Industrial) such as
factories have the energy saving potential of 10%, so we are intending to
work on technical aspects (e.g. establishment of standards to be applied
by energy-saving functions, etc.).
Comment by Mr. Makino, Mitsubishi Electric Company
Prior to the start of the demonstration, PLN had tried DSM with fixed
incentives to reduce demand during peak hours, lamenting that it was
uncontrollable. The purpose of this demonstration was to make the system
controllable. As a result, we could get an idea that with how much incentive
price would be required to get a certain amount of bids. It was also found
that factories with FEMS are clearly more energy conscious and submit
more bids than those without FEMS. It was not only a simple simulation,
but it resulted in a major achievement that we incorporated it into the power
contract between PLN and the factory, and could go as far as to actually
issue a power reduction directive.
There was an issue that factory operators stopped looking at the screen
when they were busy, so there was a need for automation. This time it was
for demonstration purposes, so we did not do that much, but we found that
usability-conscious design is important in actual business.
Comment by Mr. Tachi, Sumitomo Corporation
This demonstration was originally aimed at the establishment of JVC, but
due to changes in the business environment, etc., the results were limited
to the investigation of requirements. A major factor in the business change
was that Indonesia's supply capacity improved during the demonstration
period.
In order to develop business locally, license registration is necessary, and
it was proven that it was difficult to do it alone in Japan. Therefore, we
recognized the importance of collaborating with local stakeholders.
Acknowledment
We would like to thank Mr. Masao Nakamura (Fuji Electric), Mr. Yasuhisa
Electric Power), Edi Sartono (MEMR), Adrian Marta Kusuma (MEMR),
Wijaya Rajasa (MEMR), Purnomo (PLN), Adi Sulistyawan (PLN),
Hendra Aji (PLN), Karel Walla (Suryacipta) and Agus Sukarno
Suryatmojo (Suryacipta) for their support extended to this Case Study
report.
8. References
[1] NEDO,” International Demonstration Project of Japanese Technology Contributing to Energy Consumption Efficiency / Smart Community Demonstration Project in an Industrial Park in Java, Indonesia”, 2019
[2] NEDO, "Smart Community Demonstration Project at Industrial Park in Java Island, the Republic of Indonesia" (FY2012-FY 2017 Project Report), 2018
[3] Ministry of Internal Affairs and Communications, "Technical Standards Certification System for Radio Equipment in Japan", 2017
[4] PLN, "Case study: Implementation of IEC 61850 in Java-Bali Transmission System", 2010
[5] JICA, “Survey on Power Technology and Skill Standards Development in Indonesia,” 2010
[6] Nomura Research Institute, “Study on Power Business Environment in India,” 2017
This case study was commissioned by the New Energy and Industrial Technology Development Organization (NEDO). Written by Mitsubishi Research Institute, Inc.