17
VIII Britcham International Seminar Mauro Andrade – [email protected] Petroleum Services, November 2008 Potential Impacts for the Brazilian Economy: Case study .
VIII Britcham International Seminar
Mauro Andrade – [email protected]
Petroleum Services, November 2008
Potential Impacts for the Brazilian Economy:
Case study .
2 ©2008 Deloitte. All rights reserved1-Dec-08
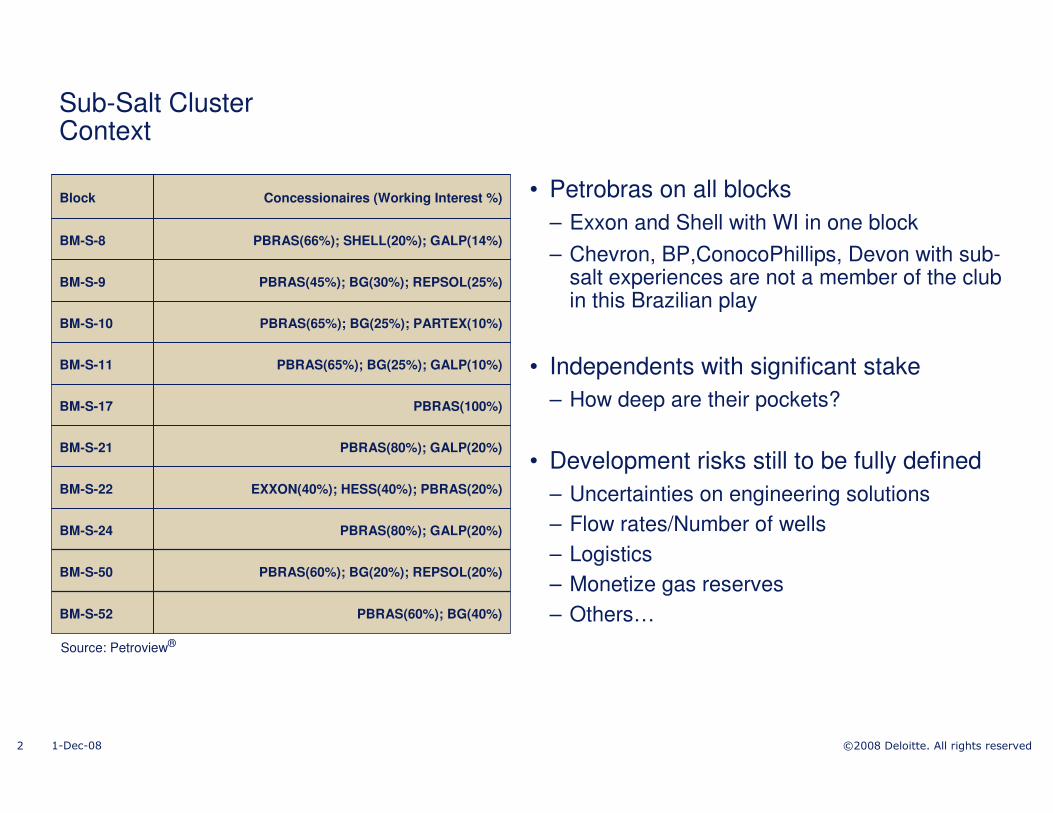
Sub-Salt ClusterContext
PBRAS(60%); BG(20%); REPSOL(20%)BM-S-50
PBRAS(80%); GALP(20%)BM-S-21
PBRAS(100%)BM-S-17
PBRAS(65%); BG(25%); GALP(10%)BM-S-11
PBRAS(45%); BG(30%); REPSOL(25%)BM-S-9
PBRAS(66%); SHELL(20%); GALP(14%)BM-S-8
PBRAS(65%); BG(25%); PARTEX(10%)BM-S-10
PBRAS(60%); BG(40%)BM-S-52
PBRAS(80%); GALP(20%)BM-S-24
EXXON(40%); HESS(40%); PBRAS(20%)BM-S-22
Concessionaires (Working Interest %)Block • Petrobras on all blocks
– Exxon and Shell with WI in one block
– Chevron, BP,ConocoPhillips, Devon with sub-salt experiences are not a member of the club in this Brazilian play
• Independents with significant stake
– How deep are their pockets?
• Development risks still to be fully defined
– Uncertainties on engineering solutions
– Flow rates/Number of wells
– Logistics
– Monetize gas reserves
– Others…
Source: Petroview®
3 ©2008 Deloitte. All rights reserved1-Dec-08
Source: Deloitte Petroleum Services
2000 2002 2003 2004/2005
7,000
11,000
9,000
DJIA
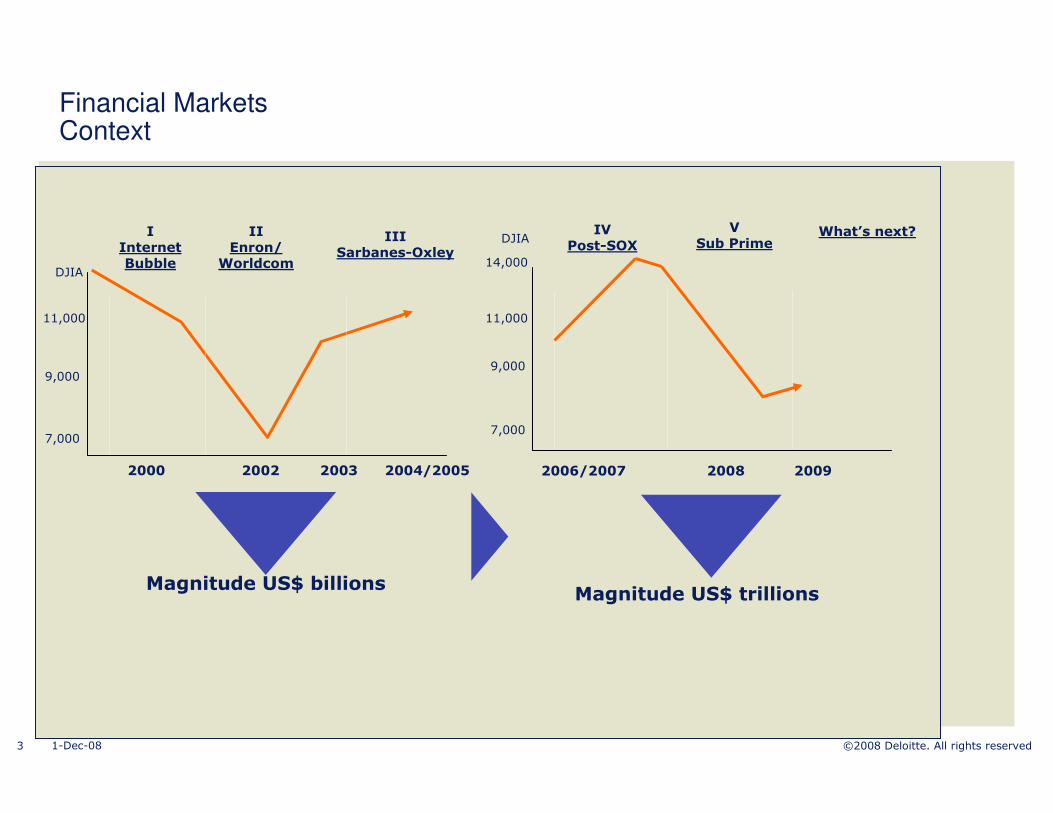
IIEnron/
Worldcom
IIISarbanes-Oxley
Magnitude US$ billions
IInternetBubble
2006/2007 2008 2009
7,000
11,000
9,000
DJIA
Magnitude US$ trillions
14,000
What’s next?VSub Prime
IVPost-SOX
Financial MarketsContext

4 ©2008 Deloitte. All rights reserved1-Dec-08
# of companies with interest in Sub-Salt Blocks in Selected Regions
Sub Salt Blocks Participants in Selected Areas
33
20
8
0
5
10
15
20
25
30
35
40
GOM West Africa Brazil
Source: Deloitte Petroleum Services
5 ©2008 Deloitte. All rights reserved1-Dec-08
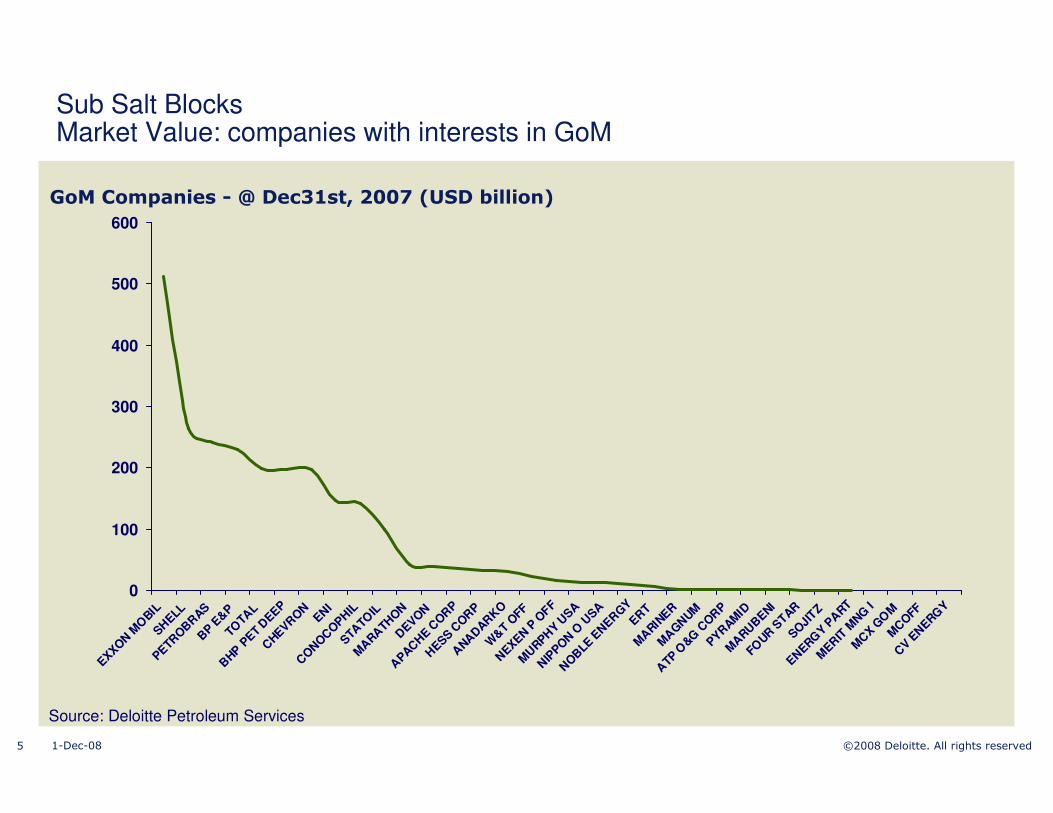
GoM Companies - @ Dec31st, 2007 (USD billion)
Sub Salt BlocksMarket Value: companies with interests in GoM
0
100
200
300
400
500
600
EXXON
MO
BIL
SHELL
PETRO
BR
AS B
P E&
P TO
TAL
BHP P
ET D
EEP
CHEVR
ON
ENI
CO
NO
CO
PHIL
STA
TOIL
MA
RATH
ON
D
EVON
APAC
HE C
OR
P
HESS C
OR
P
ANA
DAR
KO
W&
T O
FF
NEXEN P
OFF
MU
RPHY U
SA
NIP
PON
O U
SA
NO
BLE
EN
ERG
Y ER
TM
ARIN
ER
MA
GN
UM
ATP
O&G
CO
RP
PYRAM
IDM
ARU
BENI
FOUR
STAR
SO
JITZ
ENERG
Y PA
RT
MER
IT M
NG I
MC
X GO
M
MC
OFF
CV E
NERG
Y
Source: Deloitte Petroleum Services

6 ©2008 Deloitte. All rights reserved1-Dec-08
West Africa Companies - @ Dec31st, 2007 (USD billion)
Sub Salt BlocksMarket Value: companies with interests in West Africa
0
100
200
300
400
500
600
700
800
CH
INA
NA
T P
ET C
OR
P
EXX
ON
MO
BIL
CO
RP
SIN
OP
EC
CO
RP
PETR
ON
AS
BP
TO
TA
LC
HEV
RO
N
EN
I
AL T
HA
NI E
MIR
ATE
S
STA
TO
ILH
YD
RO
ASA
GA
Z D
E F
RA
NC
E
MA
RA
TH
ON
OIL
CO
RP
DO
MIN
ION
PETR
OLE
UM
GA
LP E
NE
RG
IATU
LLO
W O
IL P
LC
SU
DA
PET
SO
NA
NG
OL
PETR
OD
AR
RO
C O
IL
DA
NA
PE
TRO
LE
UM
Source: Deloitte Petroleum Services

7 ©2008 Deloitte. All rights reserved1-Dec-08
Companies in Brazil - @ Dec31st, 2007 (USD billion)
Sub Salt BlocksMarket Value: companies with interests in Brazil
0
100
200
300
400
500
600
700
800
EXXO
N MO
BIL
SH
ELL
PETRO
BR
AS
BG
GR
OUP
REP
SO
L-YP
F
HES
S C
OR
P
GA
LP
PAR
TEX
Source: Deloitte Petroleum Services

8 ©2008 Deloitte. All rights reserved1-Dec-08
So Far, So Good...So What?Funding the Oil Bonanza
• Finance investment needs can be an issue…
– Pace of developments (phased, modular, ??)
• Petrobras has USD 13 billion per year until 2012 to put the existing projects on stream
• Per our estimates a hyphotetical field in ultra-deep water with 5 bi boe of reserves wouldrequire US$ 50 billion capex
• Joint financial effort from all players
– Oil companies
– Suppliers
– Service Providers
9 ©2008 Deloitte. All rights reserved1-Dec-08
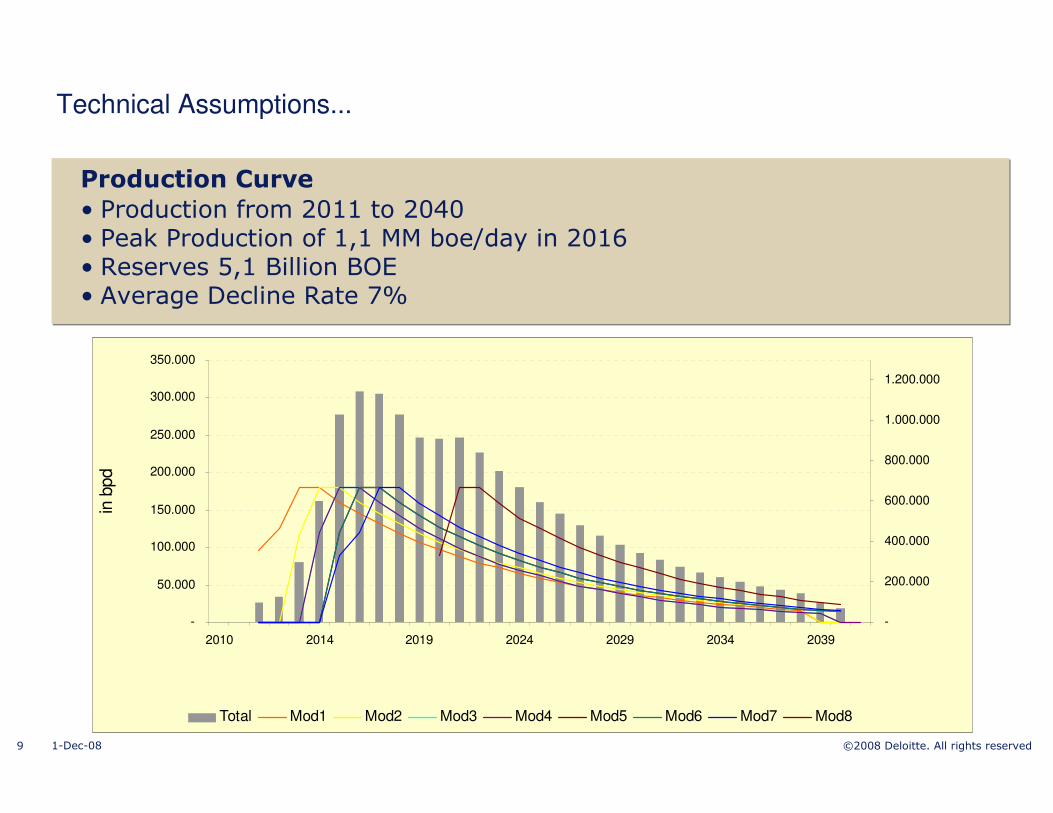
Production Curve
• Production from 2011 to 2040• Peak Production of 1,1 MM boe/day in 2016• Reserves 5,1 Billion BOE• Average Decline Rate 7%
Technical Assumptions...
-
50.000
100.000
150.000
200.000
250.000
300.000
350.000
2010 2014 2019 2024 2029 2034 2039
in b
pd
-
200.000
400.000
600.000
800.000
1.000.000
1.200.000
Total Mod1 Mod2 Mod3 Mod4 Mod5 Mod6 Mod7 Mod8
10 ©2008 Deloitte. All rights reserved1-Dec-08
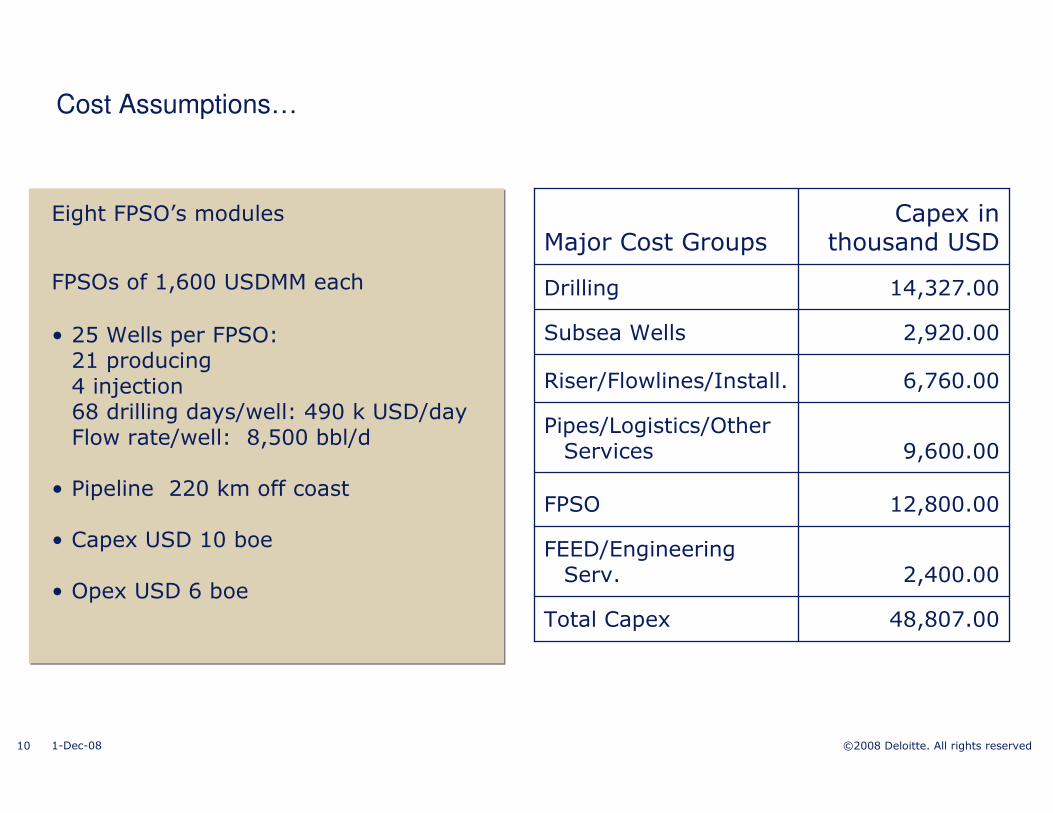
Cost Assumptions…
Eight FPSO’s modules
FPSOs of 1,600 USDMM each
• 25 Wells per FPSO:21 producing 4 injection68 drilling days/well: 490 k USD/dayFlow rate/well: 8,500 bbl/d
• Pipeline 220 km off coast
• Capex USD 10 boe
• Opex USD 6 boe2,400.00
FEED/Engineering Serv.
Capex in thousand USDMajor Cost Groups
48,807.00Total Capex
12,800.00FPSO
9,600.00Pipes/Logistics/Other Services
6,760.00Riser/Flowlines/Install.
2,920.00Subsea Wells
14,327.00Drilling
11 ©2008 Deloitte. All rights reserved1-Dec-08
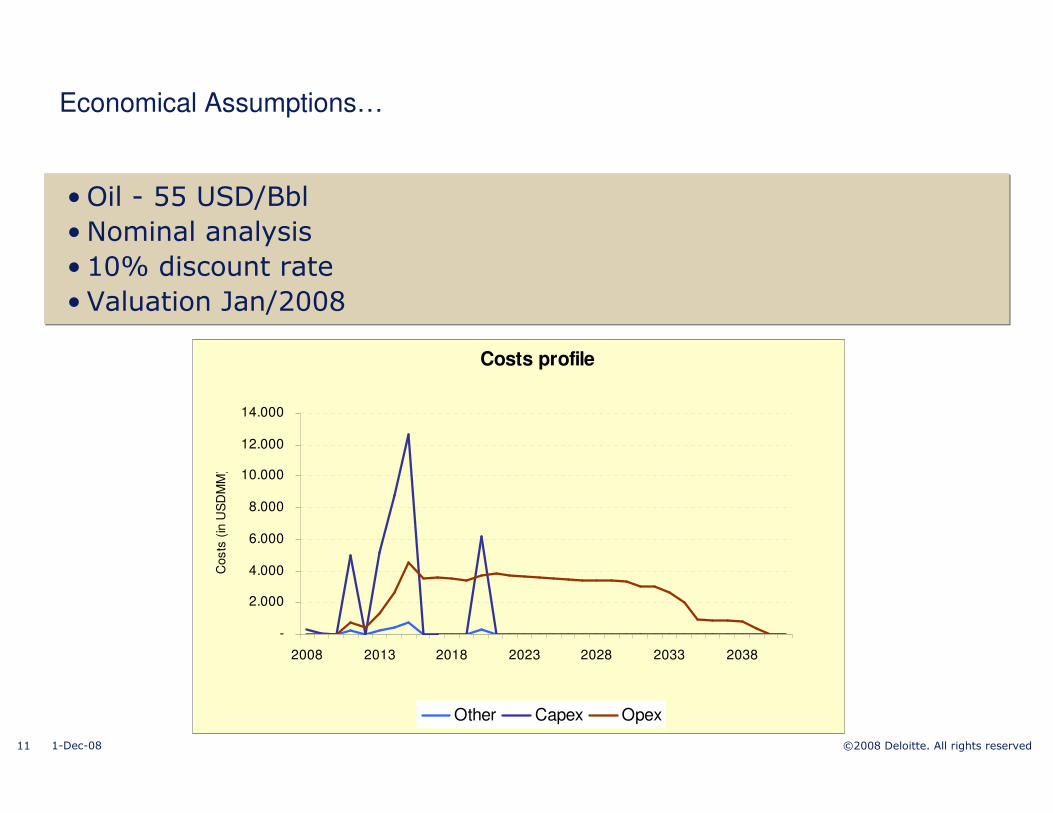
Economical Assumptions…
• Oil - 55 USD/Bbl
• Nominal analysis
• 10% discount rate
• Valuation Jan/2008
Costs profile
-
2.000
4.000
6.000
8.000
10.000
12.000
14.000
2008 2013 2018 2023 2028 2033 2038
Costs
(in
US
DM
M)
Other Capex Opex

12 ©2008 Deloitte. All rights reserved1-Dec-08
Case Study 1: Company leasing the FPSOs
Petroscope®
Economic Indicators & Cashflow Chart
Pre-Tax Post-Tax
NPV at 10% on 1 January 2008 (USDmm) 29.766,05 7.933,88
Internal Rate of Return 48,0% 18,2%PVI at 10% on 1 January 2008 2,5 1,4
Maximum Cash Exposure (USDmm) 24.142,04
Project Payback 2018,0 (7 years)
Discounted Project Payback at 10% 2019,0 (8 years)
-10000,0
-5000,0
0,0
5000,0
10000,0
15000,0
2008 2015 2022 2029 2036
US
Dm
m
-30000
-20000
-10000
0
10000
20000
30000
40000
50000
60000
US
Dm
m
Net Cashflow Cumulative Net Cashflow
13 ©2008 Deloitte. All rights reserved1-Dec-08
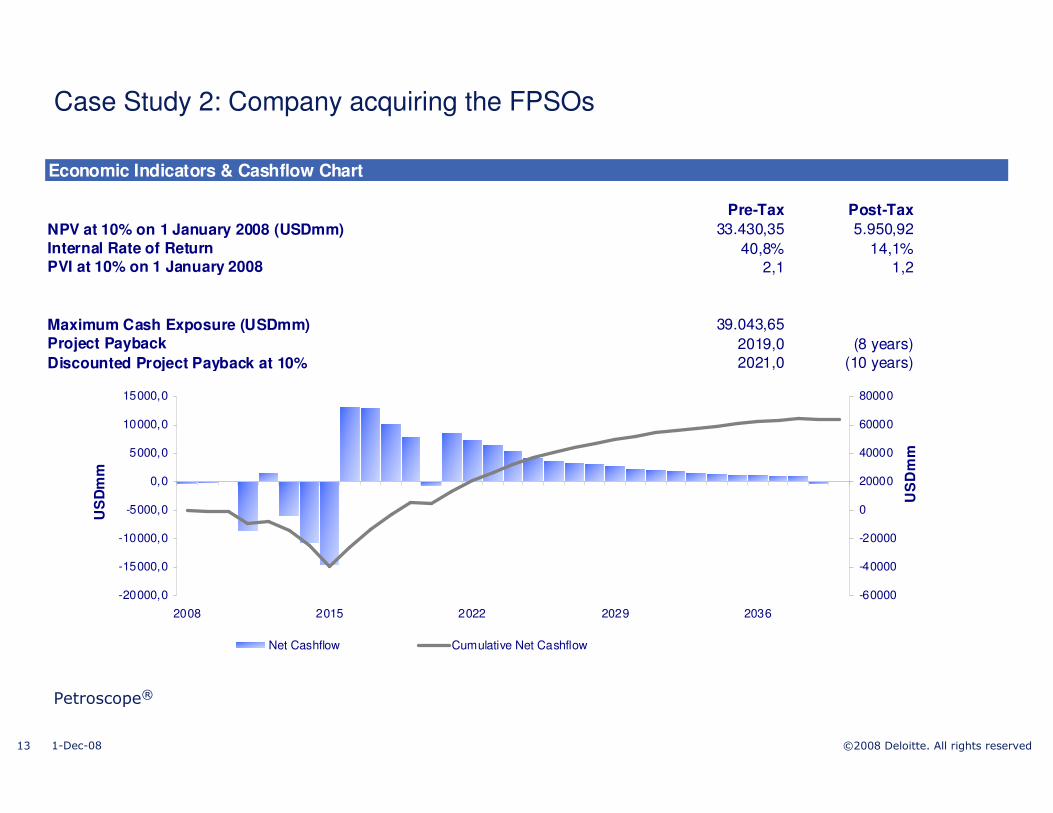
Case Study 2: Company acquiring the FPSOs
Petroscope®
Economic Indicators & Cashflow Chart
Pre-Tax Post-Tax
NPV at 10% on 1 January 2008 (USDmm) 33.430,35 5.950,92
Internal Rate of Return 40,8% 14,1%PVI at 10% on 1 January 2008 2,1 1,2
Maximum Cash Exposure (USDmm) 39.043,65
Project Payback 2019,0 (8 years)
Discounted Project Payback at 10% 2021,0 (10 years)
-20000,0
-15000,0
-10000,0
-5000,0
0,0
5000,0
10000,0
15000,0
2008 2015 2022 2029 2036
US
Dm
m
-60000
-40000
-20000
0
20000
40000
60000
80000
US
Dm
m
Net Cashflow Cumulative Net Cashflow

14 ©2008 Deloitte. All rights reserved1-Dec-08
Discounted Per barrel analysis (@ 10%)
Petroscope®
Case 1 (lease & tax optimization) Case2 (acquisition)
11%
32%
19%
31%
7%
PV Opex PV Capex
PV Government Take PV Taxation
PV Net Cashflow
USD/boe
PV Gross Revenue 16,23
PV Opex 1,73
PV Capex 5,32
PV Government Take 3,07
PV Taxation 5,01
PV Net Cashflow 1,09
23%
23%20%
25%
9%
PV Opex PV Capex
PV Government Take PV Taxation
PV Net Cashflow
USD/boe
PV Gross Revenue 16,23
PV Opex 3,79
PV Capex 3,73
PV Government Take 3,28
PV Taxation 3,98
PV Net Cashflow 1,45
15 ©2008 Deloitte. All rights reserved1-Dec-08
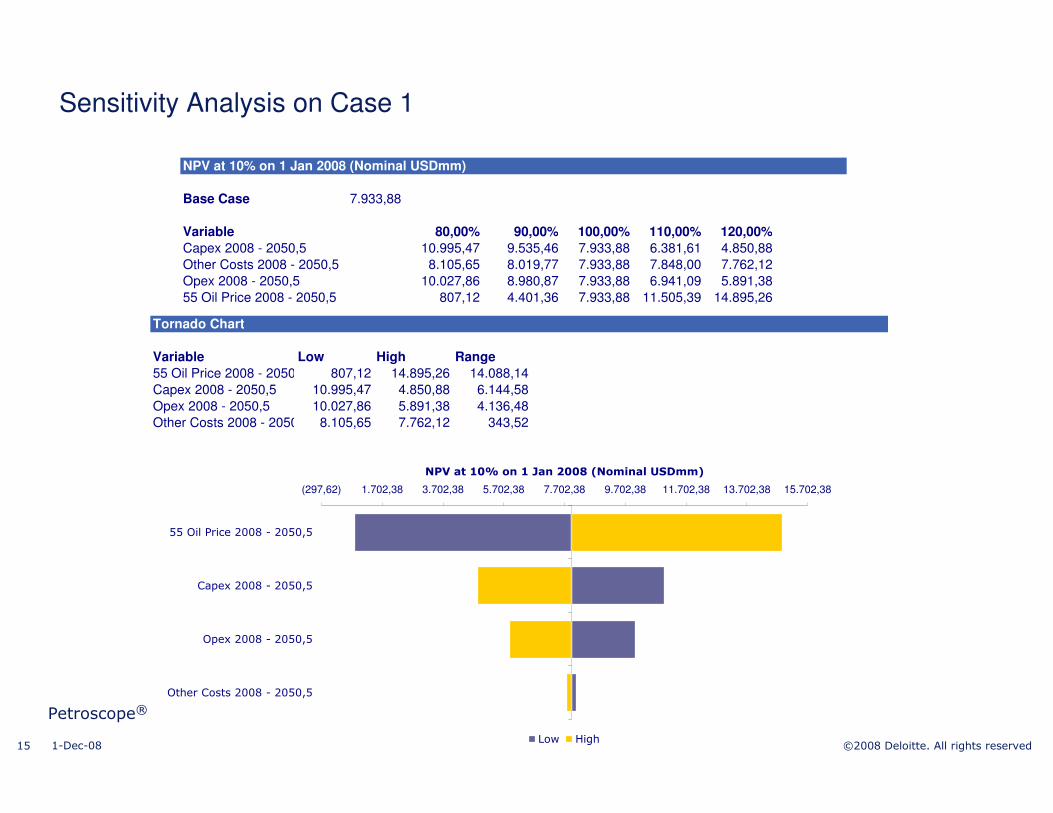
Sensitivity Analysis on Case 1
Petroscope®
NPV at 10% on 1 Jan 2008 (Nominal USDmm)
Base Case 7.933,88
Variable 80,00% 90,00% 100,00% 110,00% 120,00%
Capex 2008 - 2050,5 10.995,47 9.535,46 7.933,88 6.381,61 4.850,88
Other Costs 2008 - 2050,5 8.105,65 8.019,77 7.933,88 7.848,00 7.762,12
Opex 2008 - 2050,5 10.027,86 8.980,87 7.933,88 6.941,09 5.891,38
55 Oil Price 2008 - 2050,5 807,12 4.401,36 7.933,88 11.505,39 14.895,26
Tornado Chart
Variable Low High Range
55 Oil Price 2008 - 2050,5 807,12 14.895,26 14.088,14
Capex 2008 - 2050,5 10.995,47 4.850,88 6.144,58
Opex 2008 - 2050,5 10.027,86 5.891,38 4.136,48
Other Costs 2008 - 2050,5 8.105,65 7.762,12 343,52
(297,62) 1.702,38 3.702,38 5.702,38 7.702,38 9.702,38 11.702,38 13.702,38 15.702,38
55 Oil Price 2008 - 2050,5
Capex 2008 - 2050,5
Opex 2008 - 2050,5
Other Costs 2008 - 2050,5
NPV at 10% on 1 Jan 2008 (Nominal USDmm)
Low High

16 ©2008 Deloitte. All rights reserved1-Dec-08
Conclusions
• Under the current macroeconomic scenario finance the investments will be challenging
• Accessing cost competitive reserves is an important piece of the equation
– Would allow proper finance and the management of the risks associated with projects of such massive magnitude
• Debates over an eventual “Oil Bonanza” must ensure a fair regulatory framework
– Government wants to maximize returns from its resources, but has to ensure a fair balance
• Ensure an internationally competitive taxation system is key to attract foreign investment that will help to develop the resources
– In any given regulatory framework
17 ©2008 Deloitte. All rights reserved1-Dec-08
Deloitte provides services in audit, tax, risk management, corporate finance, consulting, outsourcing, human capital management and actuarial consulting to clients spanning multiple industries. With a global network of member firms in more than140 countries, Deloitte brings world class capabilities and deep local expertise to help clients succeed the best performance, wherever they operate.
Deloitte's 165,000 professionals are committed to becoming the standard of excellence and they are unified by a collaborative culture that fosters integrity, outstanding value to markets and clients, commitment to each other, and strength from diversity. They enjoy an environment of continuous learning, challenging experiences, and enriching career opportunities. Deloitte's professionals are dedicated to strengthening corporate responsibility, building public trust, and making a positive impact in their communities.
Deloitte refers to one or more of Deloitte Touche Tohmatsu, a Swiss Verein, and its network of member firms, each of which is a legally separate and independent entity. Please see www.deloitte.com/about for a detailed description of the legal structure of Deloitte Touche Tohmatsu and its member firms.
This presentation does not constitute tax, legal or other advice from Deloitte, which assumes no responsibility with respect to assessing or advising the
reader as to tax, legal, or other consequences arising from the reader’s particular situation.


![Advising Manual 2016-2017 - Monfort College of Businessmcb.unco.edu › pdf › advising › MCB-Advising-Manual-2016-2017.pdf · Advising Manual 2016-2017. 2 [AdvisingManual] 3 ...](https://static.documents.pub/doc/80x56/5f1169150273b0207c355cff/advising-manual-2016-2017-monfort-college-of-a-pdf-a-advising-a-mcb-advising-manual-2016-2017pdf.jpg)