27
Cash Flow Analysis Venture Business Perspective
| Date post: | 07-Apr-2018 |
| Category: |
Documents |
| Upload: | vuongnguyet |
| View: | 221 times |
| Download: | 5 times |

Cash Flow Analysis Venture Business Perspective
Cash Flow (CF) Analysis What is CF and how is determined?
CF Free CF
Managing CF Cash Conversion Cyclical CF Break-even
Valuing venture businesses based on CF Multiple Method Growing Perpetuity Discounted Projected FCF

Cash Flow: The Big Picture What kind of company/venture?
Industry Characteristics Cyclical or Defensive High growth or mature
Venture’s growth stage Startup Survival Growth Mature
Statement of Cash Flows
Changes the picture from accrual to cash o Key step in financial analysis
Shows Cash Flows divided into 3 categories: o Cash flow from operations o Cash flow from investments o Cash flow from financing activities

Statement of Cash Flows Cash flows from operations
Net Income adjusted for all non-cash or non-reoccuring items +/- changes in working capital (e.g. money spent on inventories)
Cash flows from investing activities Purchase plant & equipment, cash goes out to pay for it Sell fixed assets, cash comes in from the sale
Cash flows from financing activities Cash inflow if we borrow money (bonds and loans) or issue stock Cash outflow if we pay off debt, buyback stocks or pay dividends
Cash position Shows the change in the company’s beginning and ending cash
position based on the cash flows from the 3 categories above

Cash Flow A venture’s basic CF can be measured two ways:
Cash Sales – Cash Expenses
Net Income adjusted for non-cash items such as Depreciation and Impairment losses
CF from Operations CF +/- changes in working capital

Free Cash Flow (Levered)
FCF = ATCFO - Increase in NOWC - Increase in gross fixed assets + Decrease in NOWC + Decrease in gross fixed assets
(Net Income minus non-cash items)
(NOWC = CA – CL) Did the company
need to invest more In working capital?
Did the company make new capital investments (Capex)?
FCF is a Venture’s actual CF after all investments are completed Short cut for calculating a company’s Levered FCF is found on the CF
Statement. Levered FCF = Net cash flow from Operations – Capital Expenditures.
Future FCF streams discounted for time and risk are a good indicator of equity values.

Cash Flow is the Key Is the venture burning or building cash and at what
level (CF, CF from operations, FCF)? Dissecting CF
What are the key drivers to cash flow? Adjustments to normalize.
Financial Policies and Strategies for managing CF Working Capital Capex Dividends Capital Raising (Debt or Equity) Cash Position

Cash Flow Issues What does venture do with positive FCF:
Pay interest and dividends Repay debt or Repurchase Stock M&A Build cash balances and invest in marketable securities
How does venture finance negative FCF Issue new debt or equity Sell Assets Drain Cash
Look forward anticipating cash flow situation and funding requirements over next 5 years

Importance of Cash Flows
Key business decisions are based on FCF What projects to invest in (capital allocation)? What is the optimal method of financing a company? When and how much financing will be necessary? Working capital management
Bottom Line: Does business’ long-term after-tax free cash flow provide a good risk-adjusted return to investors?
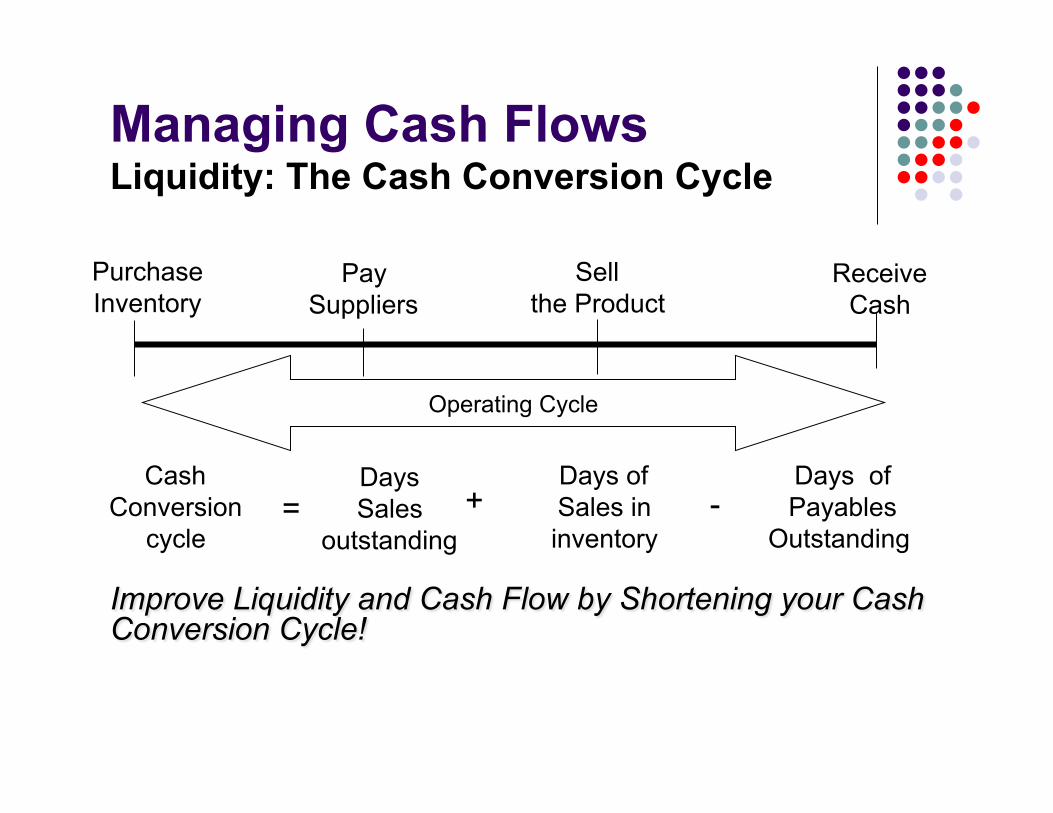
Managing Cash Flows Liquidity: The Cash Conversion Cycle
Purchase Inventory
Pay Suppliers
Sell the Product
Receive Cash
Operating Cycle
Cash Conversion
cycle
Days Sales
outstanding + =
Days of Sales in inventory
Days of Payables
Outstanding -

13
Survival Sales CF Breakeven Some Basics
Basic Equation: EBDAT = Revenues (R) - Variable Costs (VC) – Cash Fixed Costs (CFC)
Where: CFC includes both fixed operating (e.g., general & administrative, & possibly marketing expenses) & fixed financing (interest) costs
When EBDAT is Zero: R = VC + CFC

14
Solving for the Breakeven CF Level of Survival Revenues
Starting Point: Ratio of variable costs (VC) to revenues (R) is a constant (VC/R) & is called the Variable Cost Revenue Ratio (VCRR)
Survival Revenues (SR) = VC + CFC Rewriting, CFC = SR – VC By substitution, CFC = SR[1 – (VCRR)] Solving for SR, SR = [CFC/(1 – VCRR)]

15
Survival Revenues CF Breakeven: An Example
If the PSA venture were expecting: Revenues = $1,000,000 Cost of Goods Sold = $650,000 Administrative Expenses = $200,000 Marketing Expenses = $180,000 Depreciation Expenses = $100,000 Interest Expenses = $20,000 Tax Rate = 33%
16
Survival Revenues CF Breakeven: An Example
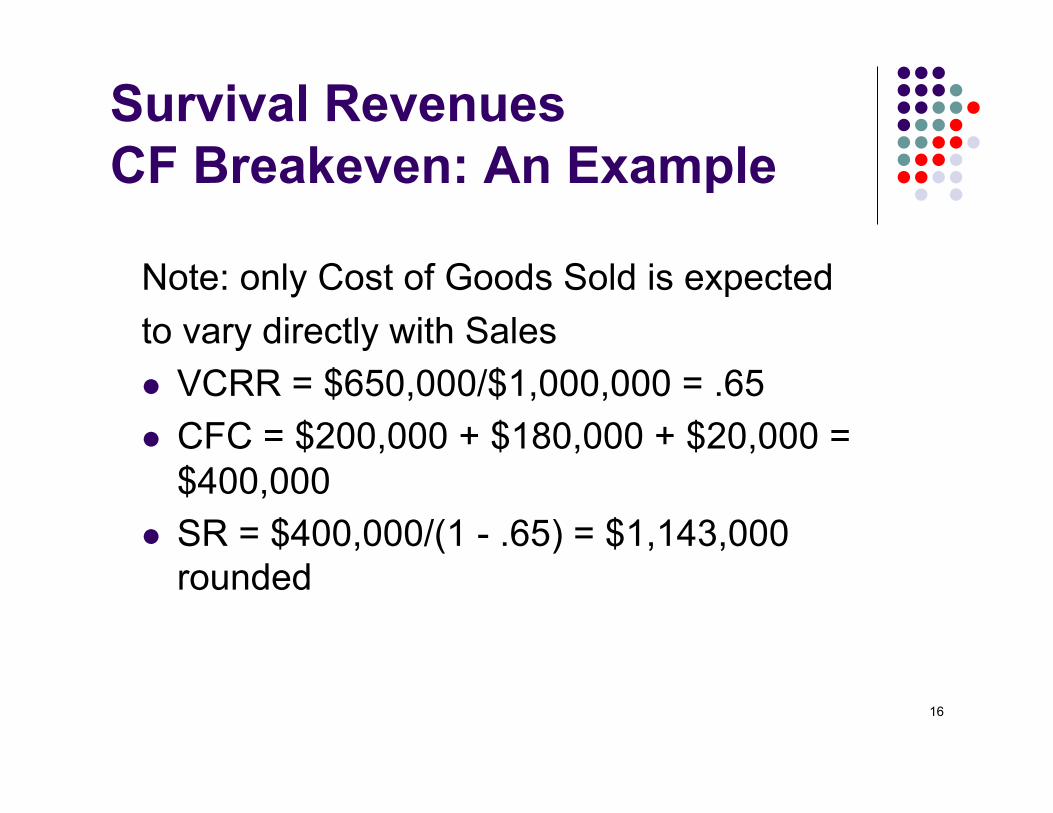
Note: only Cost of Goods Sold is expected to vary directly with Sales VCRR = $650,000/$1,000,000 = .65 CFC = $200,000 + $180,000 + $20,000 =
$400,000 SR = $400,000/(1 - .65) = $1,143,000
rounded
17
Survival Revenues CF Breakeven: An Example
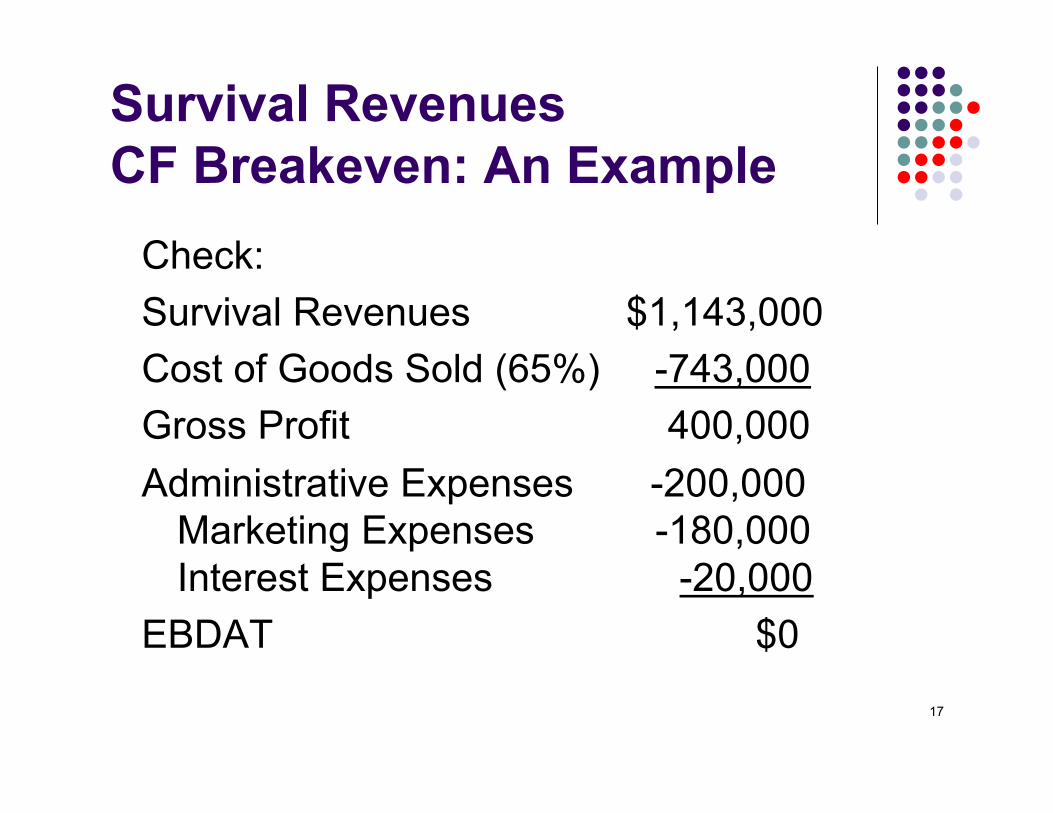
Check: Survival Revenues $1,143,000 Cost of Goods Sold (65%) -743,000 Gross Profit 400,000 Administrative Expenses -200,000
Marketing Expenses -180,000 Interest Expenses -20,000
EBDAT $0

Scenarios
19
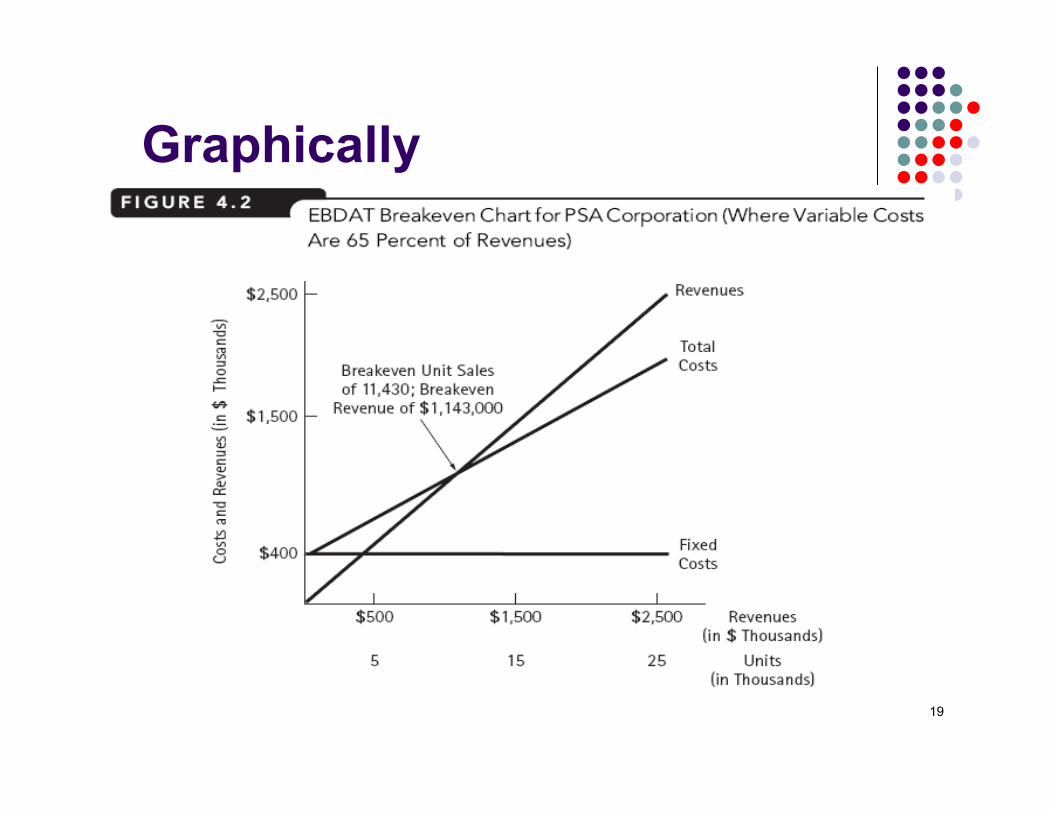
Graphically
20
• Determine what multiple of FCF comparable listed companies are trading at (Equity Market Cap / FCF)
• Multiply this comp multiple by your venture’s FCF to determine total equity value of your venture.
• Problem is often new ventures do not generate much (if any) positive FCF. Therefore many use pro-forma analysis to value venture 5-7 years in the future and discount this value to its PV.
Valuing Equity with FCF FCF Multiple Method
21
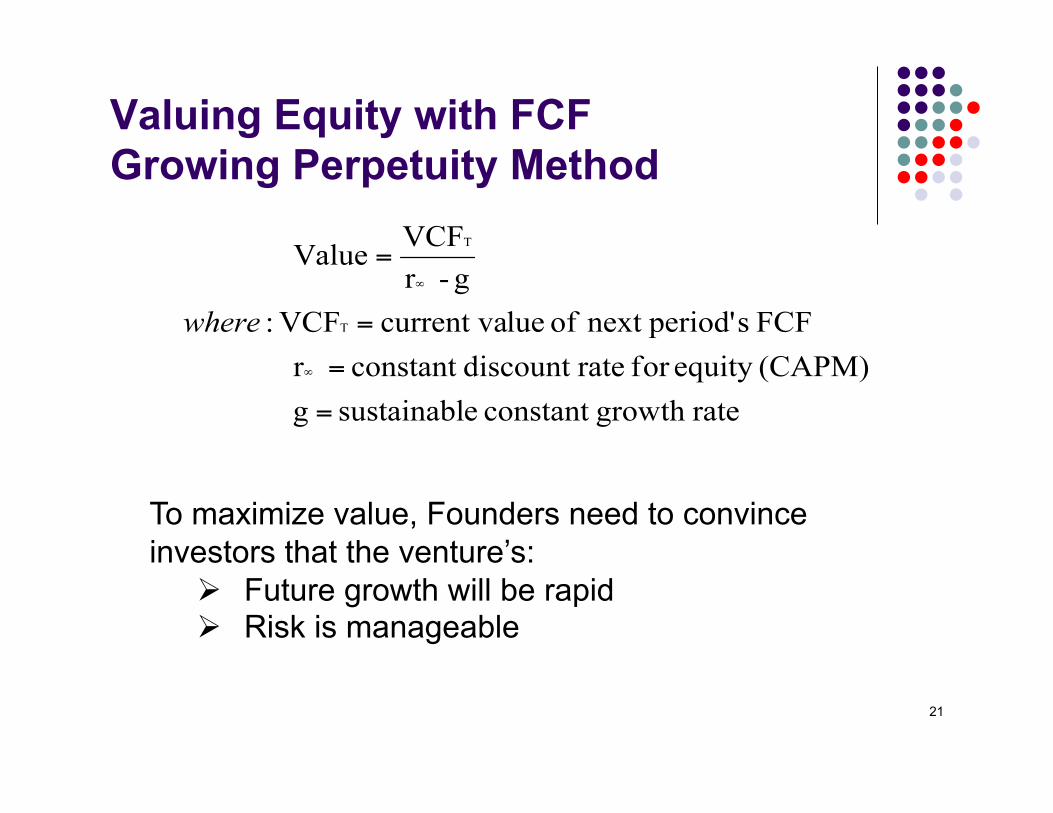
Valuing Equity with FCF Growing Perpetuity Method
To maximize value, Founders need to convince investors that the venture’s:
Future growth will be rapid Risk is manageable
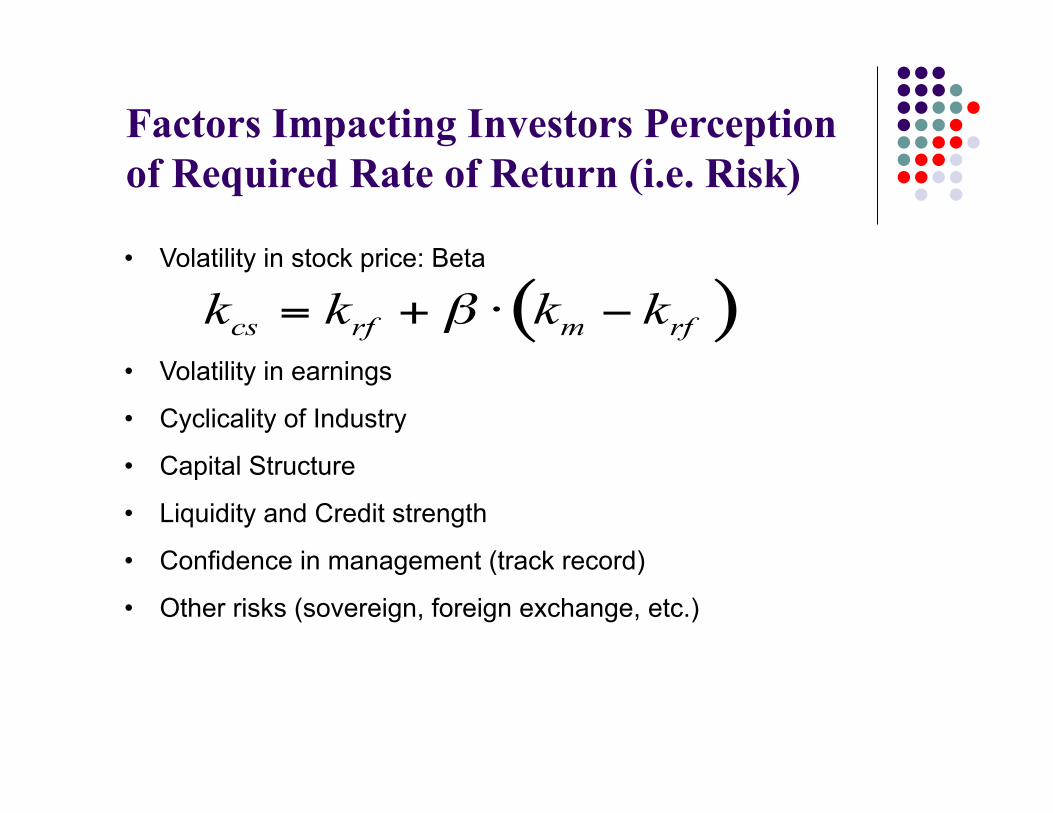
• Volatility in stock price: Beta
• Volatility in earnings
• Cyclicality of Industry
• Capital Structure
• Liquidity and Credit strength
• Confidence in management (track record)
• Other risks (sovereign, foreign exchange, etc.)
Factors Impacting Investors Perception of Required Rate of Return (i.e. Risk)

• Industry growth rate
• Company’s ability to gain market share
• Management’s focus on growth and earnings
• Capex and R&D
• Divestitures of slow growth businesses
• Potential for value added acquisitions
• Trends in Profit Margins
• New products and services
• Capacity to raise capital
• Dividend policy (g = ROE x r)
Factors Impacting Growth in Earnings

24
Equity Valuation Discounted Levered FCF Method
ABC Corp 1 2 3 4 5
Levered Free Cash Flow $Mil 2012E 2013E 2014E 2015E 2016E
Net Cash from Operations $ 16 $ 18 $ 20 $ 23 $ 25 Capital expenditures $ (7) $ (7) $ (7) $ (6) $ (5) Free Cash Flow $ 9 $ 11 $ 13 $ 17 $ 20 Terminal Value $ 218.95 Total (FCF + Terminal Value) $ 9 $ 11 $ 13 $ 17 $ 238.95 PV $7.93 $8.54 $8.89 $10.24 $126.86
Comp Beta 1.5 30 year UST Yield 3.0% Notes
Avg Market Return 10.0% 1) Terminal Value = (FCF 2016 * (1+g)) / (RRR Equity -g)
Est. Constant Growth 4.0% 2) FCF and Terminal Value discounted at RRR Equity
RRR Equity 13.5% 3) RRR determined by CAPM with Comp Beta
Value Common Equity $162.46

25
Adjusting for Equity Investments Pre-Money Valuation:
present value of a venture prior to new money investment
Post-Money Valuation: pre-money valuation of venture + money injected by new investors
Example: Selling $25 million of Equity
Pre-Money Valuation 100
Equity Investment 25
Post-Money Valuation 125
Percentage of Company Sold 20% (Equity Investment / Post-Money Valuation)

26
Issues in Valuing new Venture Companies
Will venture be successful/profitable business and when??
Lack historical track record and financial information
Growth rate difficult to estimate and highly volatile
Identifying risks and appropriate discount rate Handling low profitability and cash flow resulting
from high Capex and lumpy investment requirements, yet to be realized scale advantages and sales growth

27
Issues in Valuing new Venture Companies
Ultimately, “Beauty is the eye of the beholder”, when it comes to valuing a venture. Investors will pay what they perceive is the venture’s value based on growth potential, risk and a whole host of other factors
Market conditions have a major impact – in periods of low liquidity there is often no bid for startup ventures
Valuation in M&A scenario
Valuation perspective: Founder and Diversified Fund


