i Cash Transfers in Lesotho: An evaluation of World Vision’s Cash and Food Transfers Pilot Project Stephen Devereux 1 Michael Mhlanga 2 July 2008 1 Centre for Social Protection, Institute of Development Studies, University of Sussex, Brighton, UK. 2 Mhlanga Consulting Services, Maseru, Lesotho.
Transcript
i
Cash Transfers in Lesotho:
An evaluation of World Vision’s Cash and Food Transfers Pilot Project
Stephen Devereux 1
Michael Mhlanga 2
July 2008
1 Centre for Social Protection, Institute of Development Studies, University of Sussex, Brighton, UK.
2 Mhlanga Consulting Services, Maseru, Lesotho.
ii
CONTENTS
EXECUTIVE SUMMARY ............................................................................................................... vii
3.1 Use of cash and food transfers ............................................................................................ 29 3.1.1 Spending of cash transfers ....................................................................................... 29 3.1.2 Use of food transfers ................................................................................................ 31 3.1.3 Sharing of cash and food transfers........................................................................... 32 3.1.4 Anti-social uses of cash transfers ............................................................................. 33
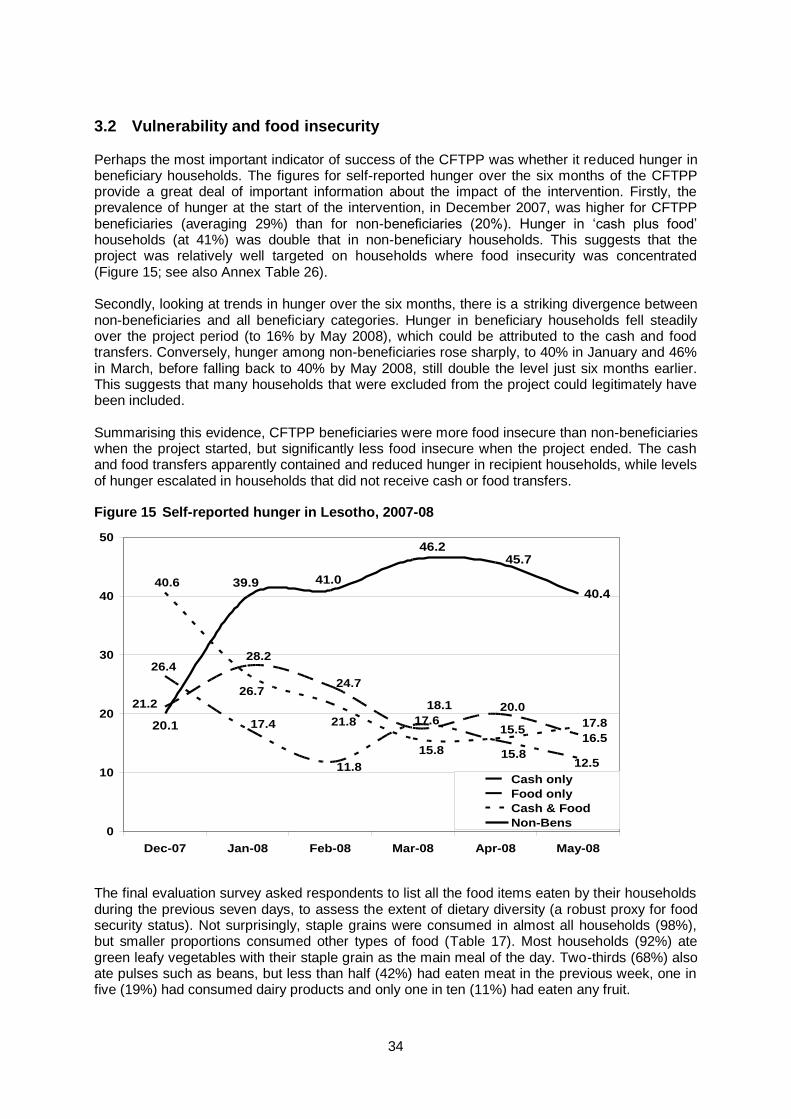
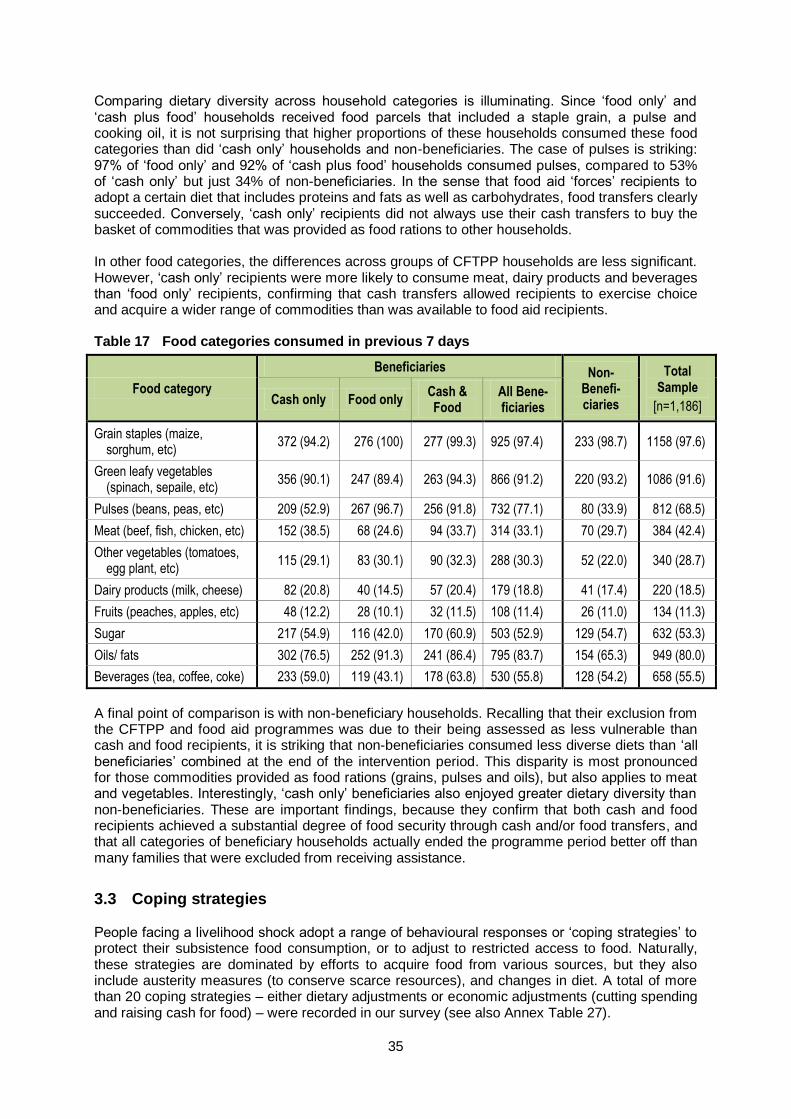
3.2 Vulnerability and food insecurity ........................................................................................... 34
3.7 Impacts on children............................................................................................................... 44
3.8 Impacts on the community.................................................................................................... 45 3.8.1 Positive social impacts .............................................................................................. 45 3.8.2 Negative social impacts ............................................................................................ 45
Chapter 4 Contributions of the CFTPP to World Vision’s Learning and Capacity for Cash Transfer Programming ................................................... 47
Chapter 5 Conclusions and Recommendations ................................................................... 51
Annex 1. Sampling for the Evaluation Survey ............................................................................... 54
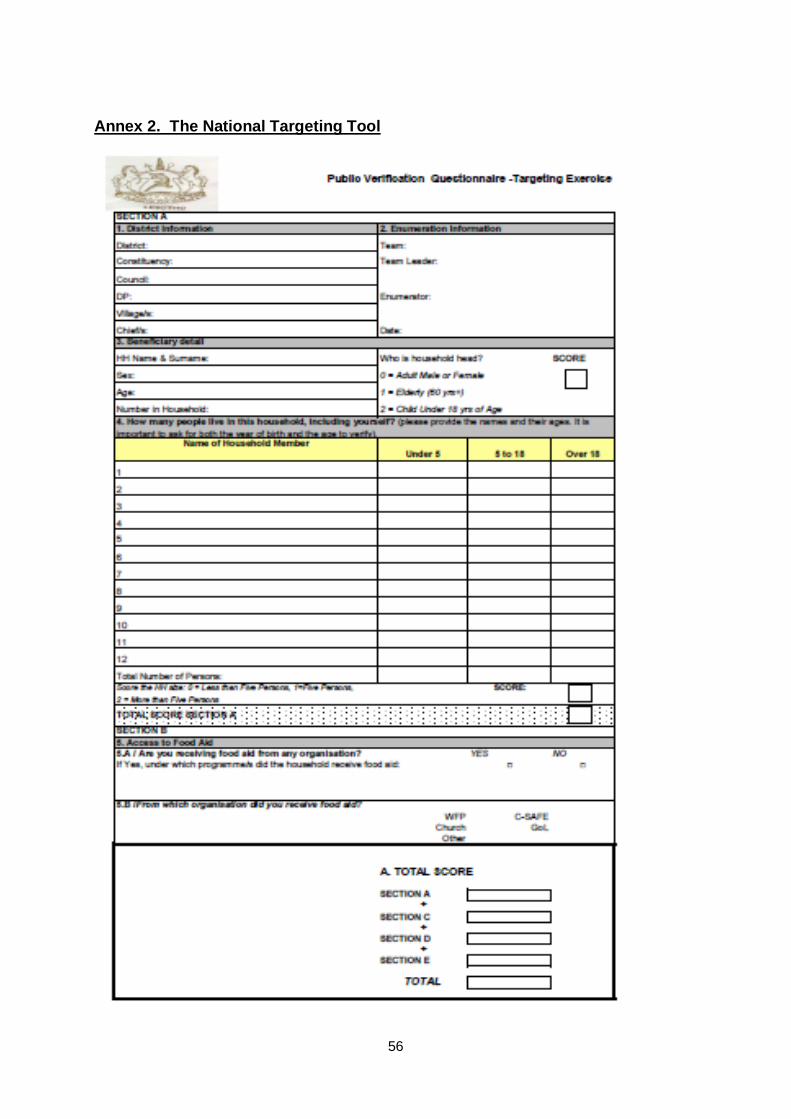
Annex 2. The National Targeting Tool .......................................................................................... 56
Annex 3. Recommended Calculation of Cash and Food Transfers ............................................. 58
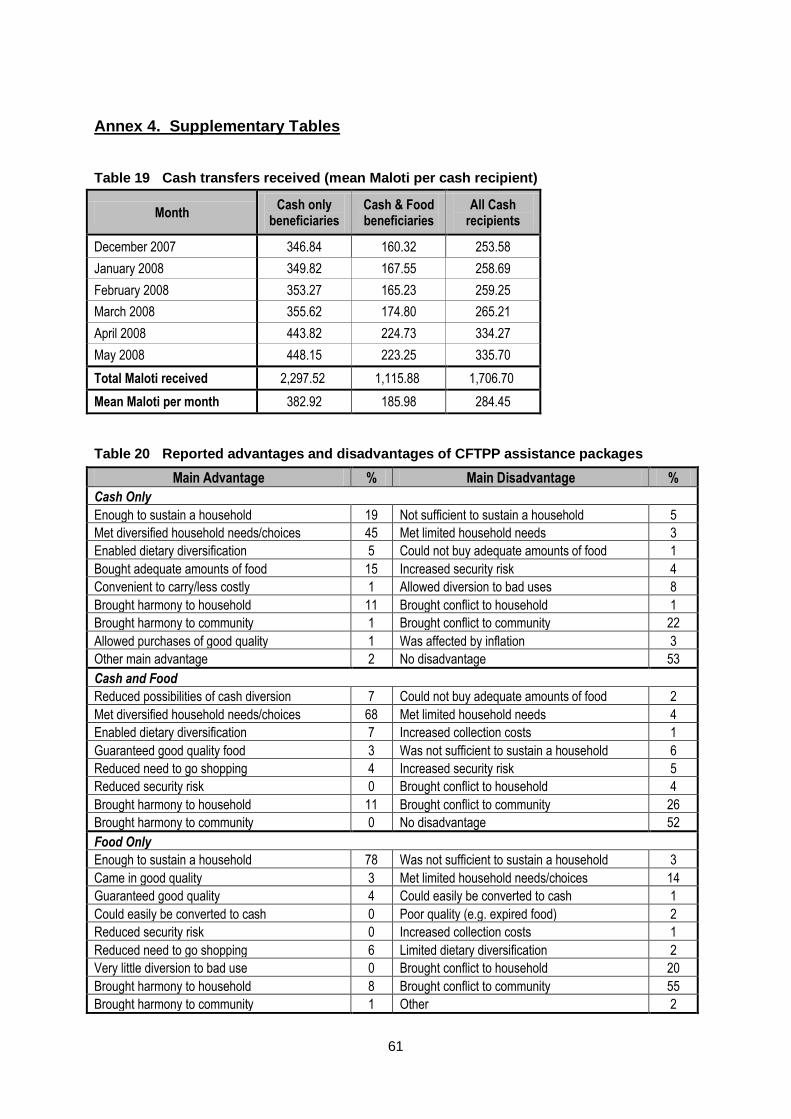
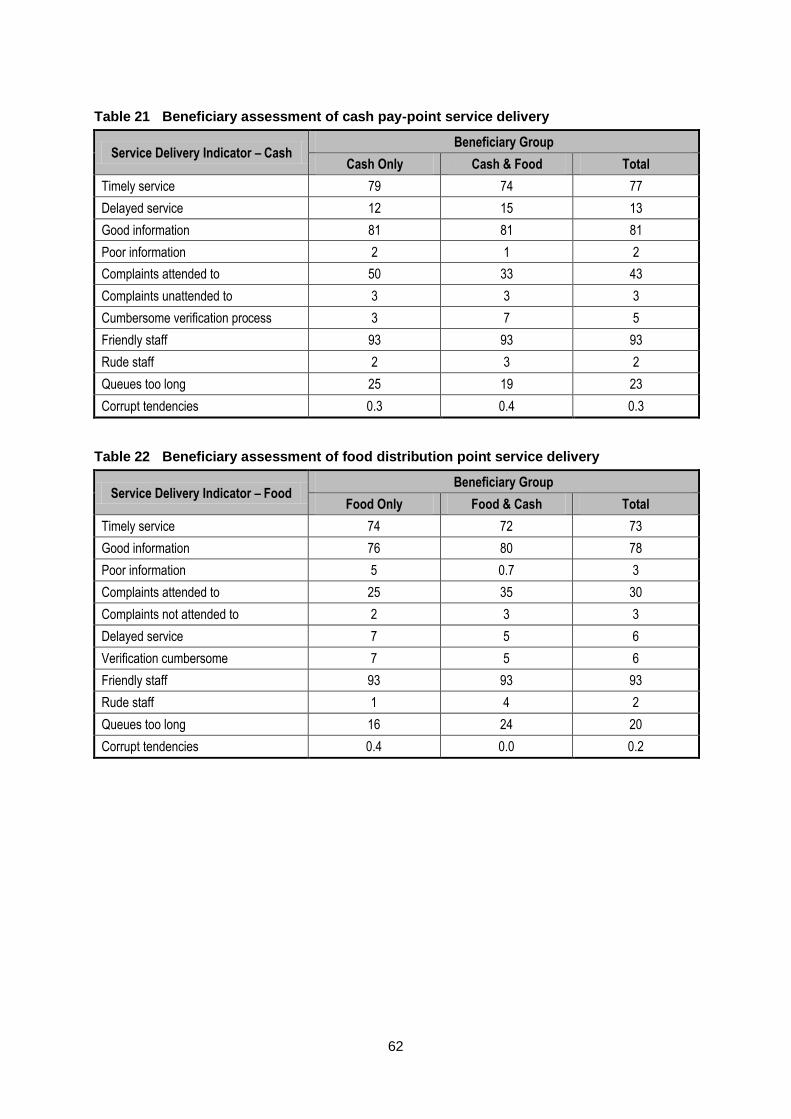
Annex 4. Supplementary Tables ................................................................................................... 61 List of Tables
Table 1 Distribution of focus group participants by location and gender ................................... 4 Table 2 Sample allocation by Constituency................................................................................ 4 Table 3 Sample yield by gender and assistance package ......................................................... 6 Table 4 Type of information received on the CFTPP, by beneficiary category ........................10 Table 5 Perceived CFTPP inclusion and exclusion errors, by beneficiary category ................11 Table 6 Comparison of sample characteristics by sample category ........................................11 Table 7 Sample composition by gender of household head ....................................................12 Table 8 CFTPP areas of operation, targeted households and assistance packages ..............14 Table 9 Food transfers received by commodity........................................................................15 Table 10 Average prices of selected commodities in CFTPP areas ..........................................16 Table 11 Preference for relief packages, by package received .................................................18 Table 12 Mode of transport and average time to cash pay-point (one-way trip) .......................20 Table 13 Pay-point queuing time by beneficiary category..........................................................21 Table 14 Mode of transport and average time to food distribution point (one-way trip).............23 Table 15 CFTPP budget and actual expenditures, December 2007 to May 2008 ....................27 Table 16 Average costs of collecting cash and food transfers ...................................................27 Table 17 Food categories consumed in previous 7 days ...........................................................35 Table 18 Borrowing behaviour during the project period............................................................41 Table 19 Cash transfers received (mean Maloti per cash recipient) ..........................................61 Table 20 Reported advantages and disadvantages of CFTPP assistance packages ...............61 Table 21 Beneficiary assessment of cash pay-point service delivery ........................................62 Table 22 Beneficiary assessment of food distribution point service delivery .............................62 Table 23 Utilisation of cash transfers (% of cash recipient households) ....................................63 Table 24 Spending of cash transfers (Maloti per household) .....................................................63 Table 25 Utilisation of food transfers ..........................................................................................64 Table 26 Self-reported food insecurity, December 2007 – May 2008 ........................................64 Table 27 Coping strategy adoption, March–May 2008...............................................................65 Table 28 Livestock ownership, December 2007 – May 2008 (mean/household) ......................66 Table 29 Livestock values, December 2007 – May 2008 (mean/household) ............................67 Table 30 Farm asset ownership, December 2007 – May 2008 (mean/household) ...................68 Table 31 Reasons for borrowing during the project period (% of households) ..........................69 Table 32 Saving, lending, and donating behaviour (% of households) ......................................69 Table 33 Household income and income sources .....................................................................70
iv
List of Figures
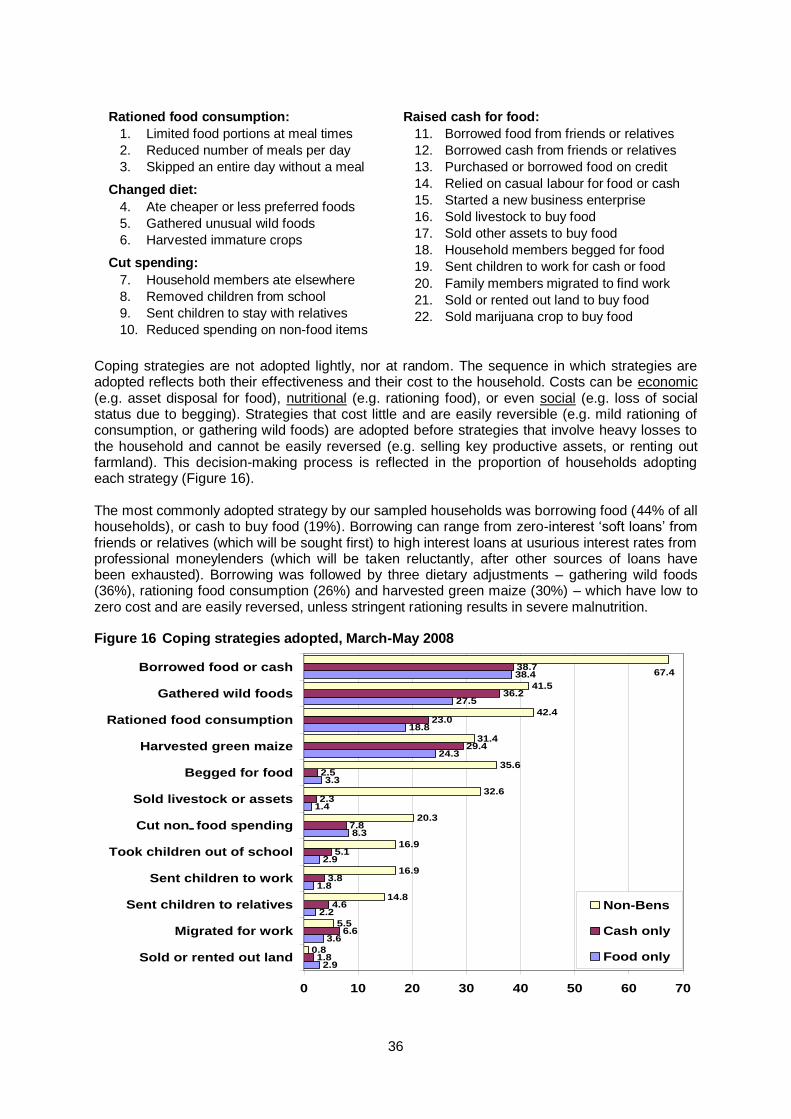
Figure 1 Distribution of sample households by type of beneficiary ........................................... 4 Figure 2 The targeting flowchart ................................................................................................ 9 Figure 3 Average cash received by beneficiary type .............................................................. 15 Figure 4 Trends in food ration cost and cash transfer ............................................................. 16 Figure 5 Beneficiary preferences for relief packages, baseline and final evaluation .............. 18 Figure 6 The cash delivery flowchart ....................................................................................... 19 Figure 7 Beneficiary households by location of cash pay-point .............................................. 20 Figure 8 Beneficiaries‟ evaluation of cash pay-points ............................................................. 21 Figure 9 Beneficiaries‟ satisfaction with service delivery ........................................................ 22 Figure 10 Beneficiary households by location of food distribution point ................................... 22 Figure 11 Beneficiaries‟ satisfaction with food delivery ............................................................. 23 Figure 12 Beneficiary complaints about service delivery .......................................................... 24 Figure 13 Utilisation of cash transfers (% of cash recipient households) ................................. 29 Figure 14 Spending of cash transfers (Maloti) .......................................................................... 30 Figure 15 Self-reported hunger in Lesotho, 2007-08 ................................................................ 34 Figure 16 Coping strategies adopted, March-May 2008 ........................................................... 36 Figure 17 Changes in livestock ownership, 2007-08 (% per household) .................................. 38 Figure 18 Changes in livestock values, 2007-08 (Maloti per household) ................................. 39 Figure 19 Changes in asset ownership, 2007-08 (% per household) ....................................... 39 Figure 20 Changes in asset values, 2007-08 (Maloti per household)....................................... 40 Figure 21 Changes in total asset values, 2007-08 (Maloti per household) ............................... 40 Figure 22 Reasons for borrowing during the project period (% of households)........................ 41 Figure 23 Saving, lending and donating behaviour (% of households)..................................... 42 Figure 24 Retail maize prices in Lesotho, 2007-08 (Maloti per kilogram) ................................. 42 Figure 25 Main source of income (Maloti per household) ......................................................... 70
v
Acronyms
AIDS Acquired Immune Deficiency Syndrome
BOS Bureau of Statistics
CFTPP Cash and Food Transfers Pilot Project
C-SAFE Consortium for Southern Africa Food Security Emergency
DAC Development Assistance Committee
DMA Disaster Management Authority
EA Enumeration Area
FAO Food and Agricultural Organisation
FPMG Food Program Management Group
FGD Focus Group Discussion
G4S Group 4 Securicor
HH Household
HIV Human Immuno-deficiency Virus
HPG Humanitarian Policy Group
LPS Lesotho Postal Services
LVAC Lesotho Vulnerability Assessment Committee
M&E Monitoring and Evaluation
NGO Non-Governmental Organisation
ODI Overseas Development Institute
OECD Organisation for Economic Cooperation and Development
PRRO Protracted Relief and Recovery Operation
SRV Senqu River Valley region
RSA Republic of South Africa
SYAP Single-Year Assistance Project
WFP World Food Programme
WVI World Vision International
UN United Nations
USAID United States Agency for International Development
vi
Acknowledgements
The consultants would like to acknowledge the contributions made by many individuals to this evaluation. World Vision staff: Thabani Maphosa (Director, FPMG), Junus David (Project Manager, CFTPP), Mbuso Jama (Research, M&E Specialist), Jonathan Moyo (Field Coordinator), Marumbo Ngwira (DME & LEAP Specialist). Enumerators (quantitative survey teams): Setori Lejaha (Team Leader), Vusi Senkoto, Ralineo Mokemane, Neo Poopa, Leqaphela Liphoto, Lipolelo Khoeli, Tlalane Mahooana, Matseliso Makhomo, Montseng Lerapapa, Motheba (Team Leader), Limpho, Tisetso, Moalosi Kometsi, Katiso Salewe, Mamosa Peete, Makha Molapo, Maseteli Ntene, Litseo Mosenene. Enumerators (qualitative fieldwork teams): Rannyaliseng Maanela, Kobasia, Masupha Mojela, Mahlapane, Rethabile Letsoalo, Moliehi Selepe, Lipolelo Khoeli, Ithabeleng. Data entry team: Malefu, Likhapha Tetsane, Mantsasa, Lineo, Mabafokeng. We also valued the comments and feedback received from participants in workshops in Maseru (8 July 2008) and Johannesburg (9-10 July 2008), where preliminary findings of this evaluation were presented and discussed. Most importantly, our thanks go to the hundreds of community members, both participants and non-participants in the Cash and Food Transfers Pilot Project, who generously gave their time to participate in the quantitative survey, focus group discussions and key informant interviews. The following constituencies were visited for the household survey. In Maseru District: Matsieng, Rothe and Koro-Koro. In Mohale‟s Hoek District: Mekaling, Mpharane and Taung. The following communities were involved in the qualitative fieldwork. In Maseru District: Masite, Rothe, Linotsing, Ha Toloane, Ha Maphathe, Ha Mokuoane, Ha Mapeshooane. In Mohale‟s Hoek District: Qalasi, Liphiring, Pontśeng, Draaihoek, Morifi-Ha Moiloa, Morifi-Ha Khosi. Without their inputs, this report would not have been possible. This evaluation was funded by World Vision Support offices and the World Food Programme.
vii
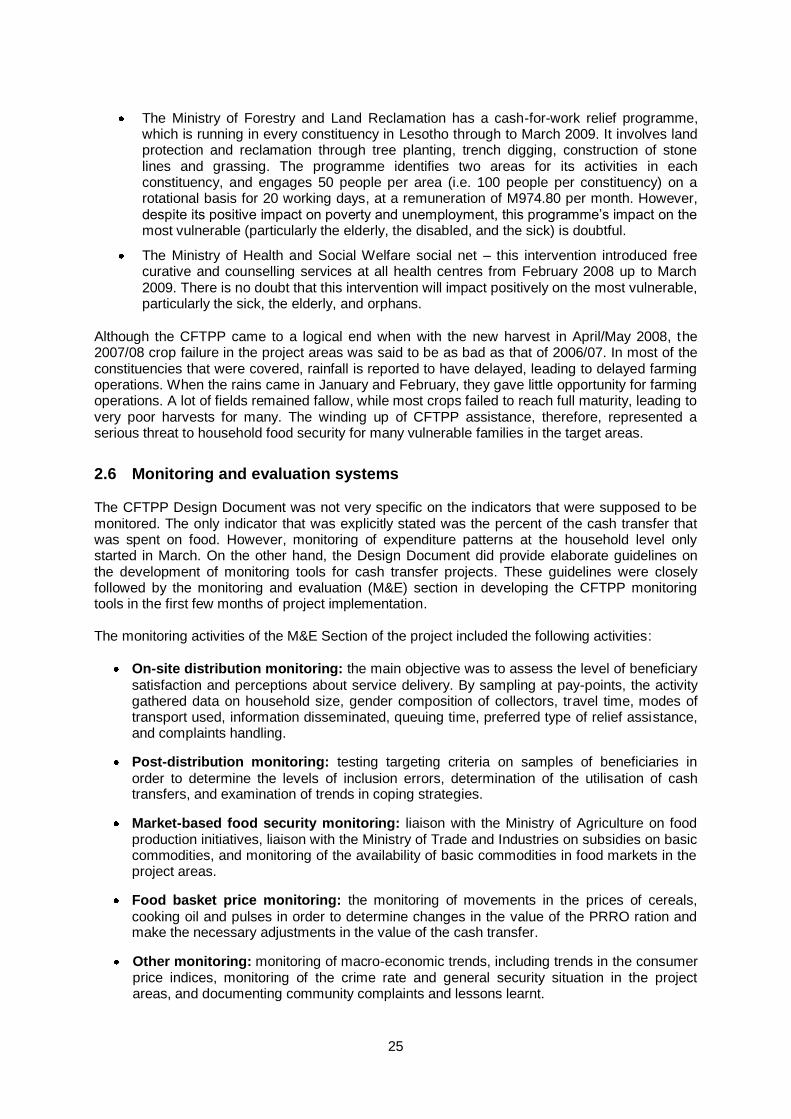
EXECUTIVE SUMMARY The Cash and Food Transfers Pilot Project (CFTPP) was designed and implemented as World Vision‟s contribution to the humanitarian response to the 2007/08 food crisis in Lesotho. This crisis was triggered by Lesotho‟s worst drought in 30 years, which reduced maize yields by 42% and left an estimated 553,000 people (approximately 25% of the national population) in need of emergency assistance. a feasibility study was commissioned by World Vision which concluded that, since 70% of Lesotho‟s food requirements are imported even in good years, food markets are well-functioning and resilient, so cash transfers would be an appropriate intervention. The CFTPP delivered cash and/or food transfers to 9,172 households, or 41,200 beneficiaries, every month for six months from December 2007 to May 2008. Of these, 3,824 households received „cash only‟ while 2,676 households received a „cash plus food‟ combination – equivalent to a full food ration, half in food (cereals, pulses and cooking oil) and half in cash (enough to buy the same commodities in local markets at November 2007 prices). A further 2,672 households received full food rations and acted as a control group against which to compare impacts. Cash transfers were provided by World Vision and food rations were provided by the World Food Programme (WFP). The objectives of the CFTPP were to provide access to basic food for vulnerable households through the 2007/08 „hunger period‟ until the next harvest, and to build World Vision‟s capacity in cash transfer programming and learn lessons for World Vision in Lesotho and elsewhere. This evaluation assesses whether the CFTPP achieved its objectives. It draws on internal project monitoring documents and other secondary sources, as well as a survey of 940 beneficiaries and 235 non-beneficiaries, 18 focus group discussions and interviews with key informants that were conducted specifically for this report. The evaluation is divided between design and process aspects (targeting, assistance packages, cash transfer values, delivery mechanisms) and project impacts (uses of cash and food transfers, food security and hunger, coping strategies, assets
and livelihoods, borrowing and saving behaviour, markets and communities).
Design and process evaluation
Targeting was implemented at two levels. The first was geographic: three constituencies in each
of two districts were selected – Maseru and Mohale‟s Hoek – because many drought-affected residents had not yet received assistance and because World Vision was already active in these districts. The second level was beneficiary identification, for which official Disaster Management Authority (DMA) Targeting Guidelines were followed. The DMA guidelines involved communities in identifying the poorest 20% of households, based on a wealth ranking score following selected criteria. World Vision also undertook a verification exercise before registering beneficiaries for the CFTPP. Combining the wealth ranking with a quota created two problems. First, applying the 20% cut-off universally did not allow for variations in average wealth levels across communities. Second, since a Baseline Survey had concluded that 61% of households in the project area were vulnerable, the 20% quota meant there was serious under-coverage or exclusion error. Inclusion errors were lower – estimates ranged from 0% to 28%. Overall, however, several indicators (such as below average incomes and asset ownership, and high proportions of elderly- or child-headed households) confirmed that the CFTPP reached people who were mostly poorer and more vulnerable than average, so targeting accuracy was assessed as satisfactory. Cash transfer payments were set at a level sufficient to purchase a full food ration at the local
prices prevailing in November 2007. But food prices in Lesotho increased steadily throughout the project period, until the next harvest in April/May 2008 boosted supplies and brought maize prices down. Average retail prices of maize increased by 12-17% in five months, eroding the purchasing power of CFTPP cash transfers and forcing a belated upward adjustment of 25%, to compensate cash recipients for their declining market access to food.
viii
Beneficiary preferences for different assistance packages shifted during the project period.
„Cash plus food‟ was preferred by 41% of respondents to the pre-project baseline survey, but rose to 52% in the post-project evaluation survey. Second choice was „cash only‟, which increased only slightly, from 30% to 35%. Least preferred was „food only‟, chosen by only 19% pre-project but falling to 13% post-project. The main reported advantage of the „cash only‟ package was that it met a diverse range of household needs, while the main advantage of the „food only‟ package was that it was sufficient to sustain a household. This implies that the full food ration did not meet non-food needs, while the cash transfer on its own was not sufficient to sustain the household, perhaps because it was not index-linked to food prices. The „cash plus food‟ combination was preferred by the majority because it reportedly combined the advantages of the „cash only‟ and „food only‟ packages. Delivery mechanisms were different for cash and food. Cash transfers were delivered by a private company to pay-points that were within walking distance for the majority of cash recipients (77%) but required the use of public transport by some (20%). Beneficiaries generally found their pay-points to be accessible, with good security. Most cash recipients (more than 75%) were satisfied with queuing times, information provided and friendliness of staff at pay-points. There were more food distribution points than cash pay-points, so walking distances were shorter. Similarly positive feedback was received about accessibility, security, and helpfulness of staff at food distribution points. Overall, the delivery of both cash and food was excellent, with virtually all eligible beneficiaries apparently receiving their entitlement in full and on time every month. The only negative aspect was the complaints procedure, which was absent until a mobile Community Help Desk was established in January 2008, but then dealt promptly and effectively with most complaints that were lodged. Apart from the late introduction of the complaints procedure, the CFTPP scores highly on all indicators of „customer care‟.
Impact evaluation
Uses of cash transfers followed a pattern familiar from cash transfer projects in other countries.
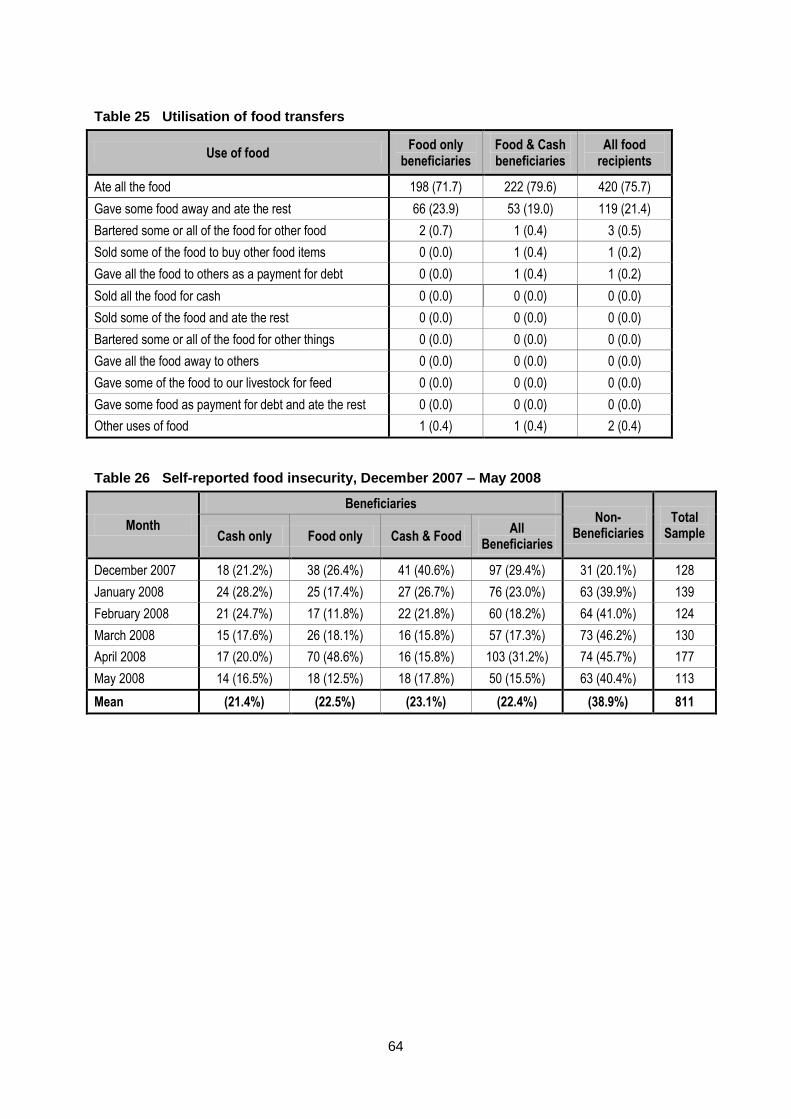
All cash recipients spent much or all of their transfer income on purchasing staple food (maize) and other food commodities (e.g. vegetables). Cash transfers were also used by most recipients to finance non-food basic needs (groceries, clothing, education, health care, housing, burial society contributions). Next on the priority list was investment in livelihoods (farming, small businesses), asset accumulation (durable goods, livestock), with „extravagant‟ spending (alcohol and cigarettes) admitted by only a few respondents. Because cash transfers raised total household income substantially, spending on all categories was significantly higher by „cash only‟ recipients than by „cash plus food‟ or „food only‟ households, confirming that cash transfers empowered poor households to meet a diverse range of consumption and investment priorities. Uses of food transfers were much more limited, being restricted to consumption at home and sharing of food with relatives and neighbours who were excluded from assistance. (Interestingly, food transfers were more likely to be shared than were cash transfers, although several cash recipients did donate some of their purchased food to excluded relatives.) So food transfers contributed to the primary humanitarian objective of restoring food security to drought-affected households, though not to meeting non-food needs – no food recipients admitted to selling any of this food to raise cash for other priorities. The „cash plus food‟ combination came closest to meeting both food and non-food needs directly. Hunger and food insecurity indicators were worse among project beneficiaries before the CFTPP started, but worse among non-beneficiaries at the end of the project. The prevalence of self-reported hunger almost halved (from 29% to 16%) among beneficiaries, but doubled (from 20% to 40%) among non-beneficiaries surveyed, between December 2007 and May 2008. This implies both that CFTPP targeting was relatively accurate, and that cash and food transfers did reduce hunger, as intended. Similarly, non-beneficiaries were more likely to adopt an array of damaging „coping strategies‟ to survive the food crisis, from borrowing to selling assets to withdrawing their children from school. CFTPP beneficiaries were better protected against asset disposal, austerity measures (rationing), adverse impacts on children, and dependence on others.
ix
Asset protection is an important secondary impact of social transfer programmes, because asset disposal allows food insecure families to avoid hunger today, but at the risk of compromising the viability of future livelihoods. Market impacts of the CFTPP were ambiguous. Wholesale and retail prices of most food items increased substantially during the project period. Monitoring data found that retail maize prices were 80% higher in January 2008 than in January 2007. The main drivers of this price inflation were the poor harvest of April-May 2007, and rising food and fuel prices globally, which raised the transport costs and wholesale prices of all imported commodities, including food. On the other hand, while the CFTPP was not responsible for wholesale price inflation, beneficiaries accused local traders in the project areas of raising their prices opportunistically around cash pay-days, causing temporary, localised retail price inflation. Local businesses were stimulated by the disbursement of cash transfers, and many beneficiaries profited from increased turnover in their own micro-enterprises (e.g. selling snacks or second-hand clothes at pay-points on pay-days). Impacts on communities were both positive and negative. Positive impacts included lower reported levels of begging, crime and distrust in project communities, and increased sharing of food between beneficiaries and non-beneficiaries. These impacts imply enhanced social cohesion, but were offset by other, more negative social impacts, especially resentment and envy towards beneficiaries by their excluded neighbours. Finally, an unanticipated source of tension occurred within households, not between genders but between generations, when children who knew that cash transfers were calculated on a per capita basis demanded their „share‟ of the cash from their parents or carers. Overall, the Cash and Food Transfers Pilot Project was a well designed and diligently delivered programme that fully achieved its primary humanitarian purpose – assisting some 41,000 people in rural Lesotho to survive a food crisis in 2007/08. Innovative design features, notably the delivery of different packages of assistance to different beneficiaries and the introduction of a „Community Help Desk‟, allowed for instructive comparisons between „cash only‟, „food only‟ and „cash plus food‟ packages. A comprehensive monitoring and evaluation system, and engagement throughout the project period with a variety of stakeholders, ensured that second objective of the CFTPP was satisfactorily achieved. Useful and important lessons were derived about the design, delivery and evaluation of cash transfers in humanitarian emergencies that have relevance to future programming, by World Vision and others, within Lesotho as well as elsewhere in Africa.
1
Chapter 1 Introduction
1.1 Background Recent years have seen growing threats to the livelihoods of rural populations in Southern Africa, as a result of adverse weather conditions and associated crop failures, as well as extremely high prevalence of HIV and AIDS. In Lesotho, drought conditions in 2006/07 were the most severe in 30 years, with far below average rainfall and higher than long-term average temperatures.
3 As a
result, average yields of maize and sorghum, the main staple food crops, were estimated to have decreased by 42% and 25% (respectively) from the previous year,
4 leaving Lesotho facing
widespread and extreme food insecurity. There were also critical shortages of water for both human and animal consumption. Under normal weather conditions, Lesotho produces 30% of staple food requirements, which are estimated at 328,000 tonnes. The deficit is met from commercial imports and food donations. However, food assessments for the 2006/07 cropping season that were conducted by the Disaster Management Authority (DMA) and the Bureau of Statistics (BOS), with the assistance of the Food and Agriculture Organisation (FAO), the World Food Programme (WFP) and other donor agencies and organisations, indicated that the country would produce only 72,000 tonnes. This increased the food deficit to 356,000 tonnes, of which 219,000 tonnes would be available through commercial imports, 7,000 tonnes through food aid, and the rest, 30,000 tonnes valued at M58.7 million, through emergency assistance.
5
According to the DMA, many households in rural Lesotho had exhausted their coping strategies by mid-2007. Figures released by the Lesotho Vulnerability Assessment Committee (LVAC) predicted that 553,000 people or about 25% of the country‟s population would need food assistance in the critical months between October 2007 and April 2008.
6 On the other hand,
reduced production levels for cereals throughout Southern Africa and the escalation of food prices in the RSA, the main food supplier in the region, were increasingly limiting access to market supplies by vulnerable households in Lesotho.
7 The resulting stress conditions and
deepening food insecurity amongst poor households were further exacerbated by the scourge of the HIV/AIDS pandemic, with an infection rate estimated at 23% of the 15-49 age group. Of particular concern were poor households that could neither plant food crops nor afford to buy food supplies from the markets. These included female-headed households, those infected with HIV and affected by AIDS, child-headed households, orphans and people with disabilities. In June 2007, the Lesotho Government declared a Food Crisis in the country and called for urgent assistance from development partners to fight hunger and poverty.
8 By the end of 2007, 120,000
people were said to be beneficiaries of ongoing humanitarian food assistance for chronically food insecure and vulnerable households. Following the widespread international application of cash-based programming in humanitarian crises, World Vision International commissioned a study to determine the feasibility of using cash transfers in Lesotho. Concluded in September 2007, this study found that the use of cash
3 Consolidated Appeals Process (July 2007) Lesotho Drought 2007: Flash Appeal, United Nations,
p.3. 4 FAO/WFP Mission (12 June 2007) Special Report of an FAO/WFP Crop and Food Supply
Assessment Mission to Lesotho, tables 3 and 4. 5 Statement by the Right Honourable the Prime Minister on the Food Crisis in Lesotho.
6 UNICEF (21 June 2007) UNICEF Situation Report: Lesotho, UNICEF.
7 High levels of food inflation in the RSA were directly imported into Lesotho where food constituted
the largest weight, 40%, in the CPI basket. 8 Statement by the Right Honourable the Prime Minister on the Food Crisis in Lesotho.
2
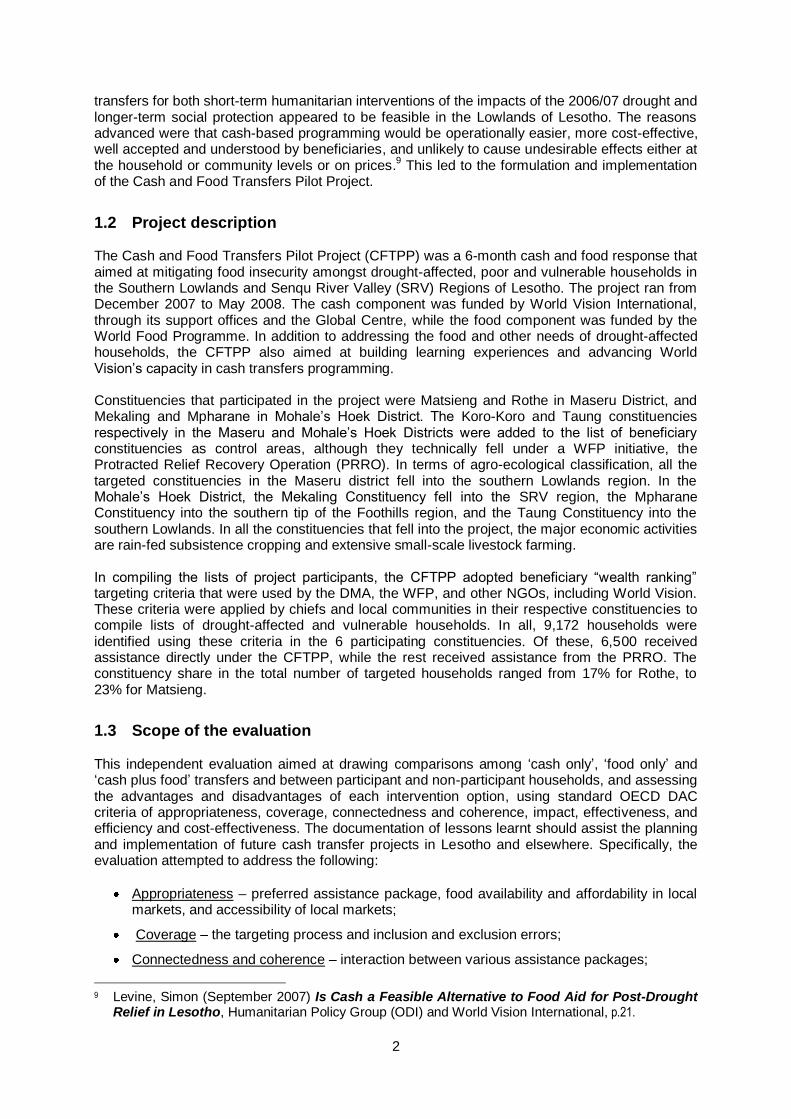
transfers for both short-term humanitarian interventions of the impacts of the 2006/07 drought and longer-term social protection appeared to be feasible in the Lowlands of Lesotho. The reasons advanced were that cash-based programming would be operationally easier, more cost-effective, well accepted and understood by beneficiaries, and unlikely to cause undesirable effects either at the household or community levels or on prices.
9 This led to the formulation and implementation
of the Cash and Food Transfers Pilot Project.
1.2 Project description The Cash and Food Transfers Pilot Project (CFTPP) was a 6-month cash and food response that aimed at mitigating food insecurity amongst drought-affected, poor and vulnerable households in the Southern Lowlands and Senqu River Valley (SRV) Regions of Lesotho. The project ran from December 2007 to May 2008. The cash component was funded by World Vision International, through its support offices and the Global Centre, while the food component was funded by the World Food Programme. In addition to addressing the food and other needs of drought-affected households, the CFTPP also aimed at building learning experiences and advancing World Vision‟s capacity in cash transfers programming. Constituencies that participated in the project were Matsieng and Rothe in Maseru District, and Mekaling and Mpharane in Mohale‟s Hoek District. The Koro-Koro and Taung constituencies respectively in the Maseru and Mohale‟s Hoek Districts were added to the list of beneficiary constituencies as control areas, although they technically fell under a WFP initiative, the Protracted Relief Recovery Operation (PRRO). In terms of agro-ecological classification, all the targeted constituencies in the Maseru district fell into the southern Lowlands region. In the Mohale‟s Hoek District, the Mekaling Constituency fell into the SRV region, the Mpharane Constituency into the southern tip of the Foothills region, and the Taung Constituency into the southern Lowlands. In all the constituencies that fell into the project, the major economic activities are rain-fed subsistence cropping and extensive small-scale livestock farming. In compiling the lists of project participants, the CFTPP adopted beneficiary “wealth ranking” targeting criteria that were used by the DMA, the WFP, and other NGOs, including World Vision. These criteria were applied by chiefs and local communities in their respective constituencies to compile lists of drought-affected and vulnerable households. In all, 9,172 households were identified using these criteria in the 6 participating constituencies. Of these, 6,500 received assistance directly under the CFTPP, while the rest received assistance from the PRRO. The constituency share in the total number of targeted households ranged from 17% for Rothe, to 23% for Matsieng.
1.3 Scope of the evaluation This independent evaluation aimed at drawing comparisons among „cash only‟, „food only‟ and „cash plus food‟ transfers and between participant and non-participant households, and assessing the advantages and disadvantages of each intervention option, using standard OECD DAC criteria of appropriateness, coverage, connectedness and coherence, impact, effectiveness, and efficiency and cost-effectiveness. The documentation of lessons learnt should assist the planning and implementation of future cash transfer projects in Lesotho and elsewhere. Specifically, the evaluation attempted to address the following:
Appropriateness – preferred assistance package, food availability and affordability in local markets, and accessibility of local markets;
Coverage – the targeting process and inclusion and exclusion errors;
Connectedness and coherence – interaction between various assistance packages;
9 Levine, Simon (September 2007) Is Cash a Feasible Alternative to Food Aid for Post-Drought
Relief in Lesotho, Humanitarian Policy Group (ODI) and World Vision International, p.21.
3
Impact – the impacts of cash transfers on people‟s vulnerability, impacts on local markets, multiplier effects, evidence of anti-social uses of cash, gender differences in impacts, specific impacts on social groups such as older persons, orphans, the chronically ill, the physically challenged, etc.; and
Effectiveness – cash form and amounts, distribution timing, appropriateness of distribution points, cash adequacy, quantities of food purchased, additional costs to beneficiaries, effectiveness of M&E systems, reports of corruption in targeting and distribution processes, learning experiences for future operations of WVI staff, and possibilities for future larger scale project operations.
1.4 Evaluation methodology To enable the evaluation team to effectively capture the scope of the evaluation, a multi-pronged approach was adopted. This involved documentary analyses, beneficiary interviews (including a small sample of non-beneficiaries for comparison), key informant interviews, stakeholder interviews, focus group discussions, and case studies. The urgency of the assignment necessitated that most of these activities be carried out concurrently. The results and findings from these different sources were then consolidated into this final report. Documentary analysis - the consultants retrieved for review all relevant secondary materials,
including the feasibility and baseline reports, policy documents, project data and documents, and monitoring reports and data. This material assisted the design of data gathering instruments, provided background information, and enriched the analytical framework.
Beneficiary interviews – these interviews were the main source of information for the evaluation. Two household questionnaires were designed, one for beneficiaries and the other for non-beneficiaries. The latter served as a control questionnaire. The questionnaires captured data on household characteristics, main sources of livelihoods, household incomes, expenditures and assets, household food security, participation in the CFTPP, opinions on service delivery under the project, evaluations of various assistance packages, the utilisation of cash and food transfers, and an assessment of dietary and other impacts.
Key informant interviews – these interviews were conducted in all the 6 constituencies that were targeted by the CFTPP for relief intervention. In all, 73 key informants were identified and interviewed. These comprised café owners, café employees, chiefs or their assistants, general dealers, supermarket owners, health personnel, school principals or teachers, and village committee members. Although most of the informants were not aware the specifics of the CFTPP, the interviews proved to be invaluable in shedding light on the project framework and the local context.
Stakeholder interviews – these interviews were conducted with major stakeholders in humanitarian assistance in Lesotho. The information was useful in understanding policy directions, project organisation, complementarities of approaches, and opinions on cash transfer programming.
Focus group discussions – focus group discussions (FGDs) were held in all the constituencies that participated in the CFTPP. A total of 18 FGDs were conducted, 9 in Maseru and 9 in Mohale‟s Hoek constituency, involving more than 370 participants. These FGDs included both gender specific and mixed gender sessions (Table 1). The facilitators followed a format that included issues on targeting, service delivery, project impacts, and local markets.
Case studies – a few case studies were followed up, with the aim of illustrating at the individual and household levels some of the impacts of the project and other findings of the evaluation.
4
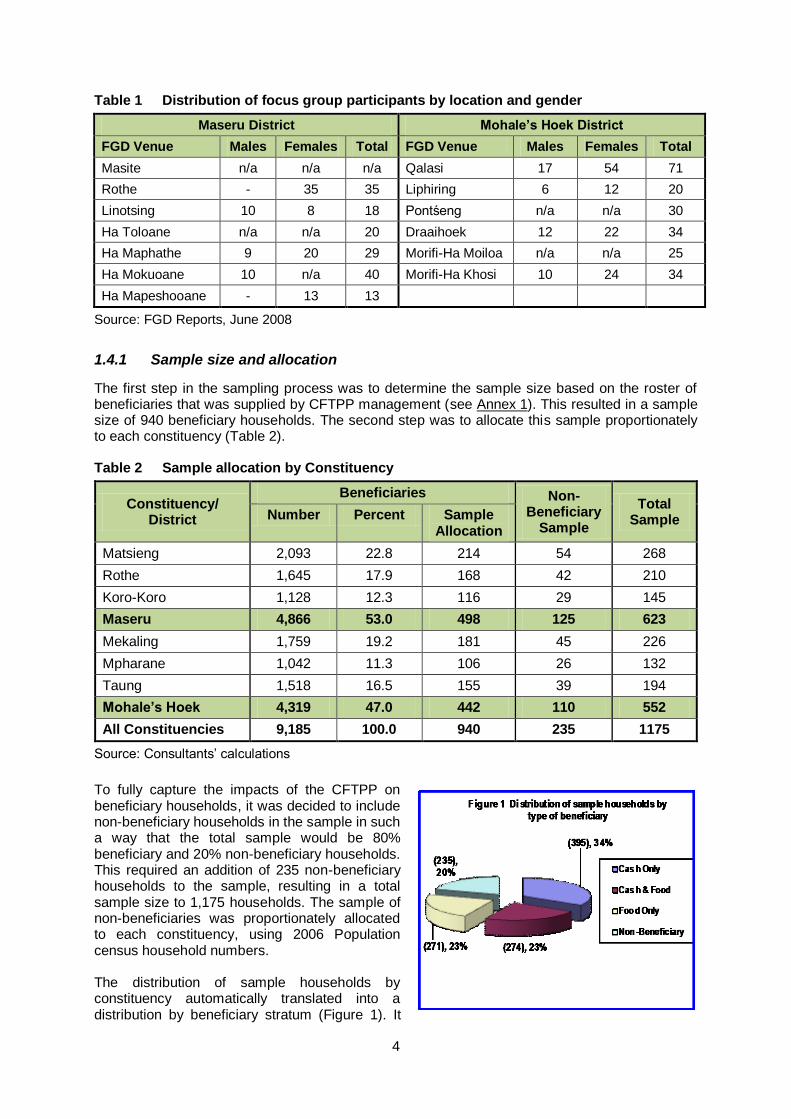
Table 1 Distribution of focus group participants by location and gender
Maseru District Mohale’s Hoek District
FGD Venue Males Females Total FGD Venue Males Females Total
Masite n/a n/a n/a Qalasi 17 54 71
Rothe - 35 35 Liphiring 6 12 20
Linotsing 10 8 18 Pontśeng n/a n/a 30
Ha Toloane n/a n/a 20 Draaihoek 12 22 34
Ha Maphathe 9 20 29 Morifi-Ha Moiloa n/a n/a 25
Ha Mokuoane 10 n/a 40 Morifi-Ha Khosi 10 24 34
Ha Mapeshooane - 13 13
Source: FGD Reports, June 2008
1.4.1 Sample size and allocation
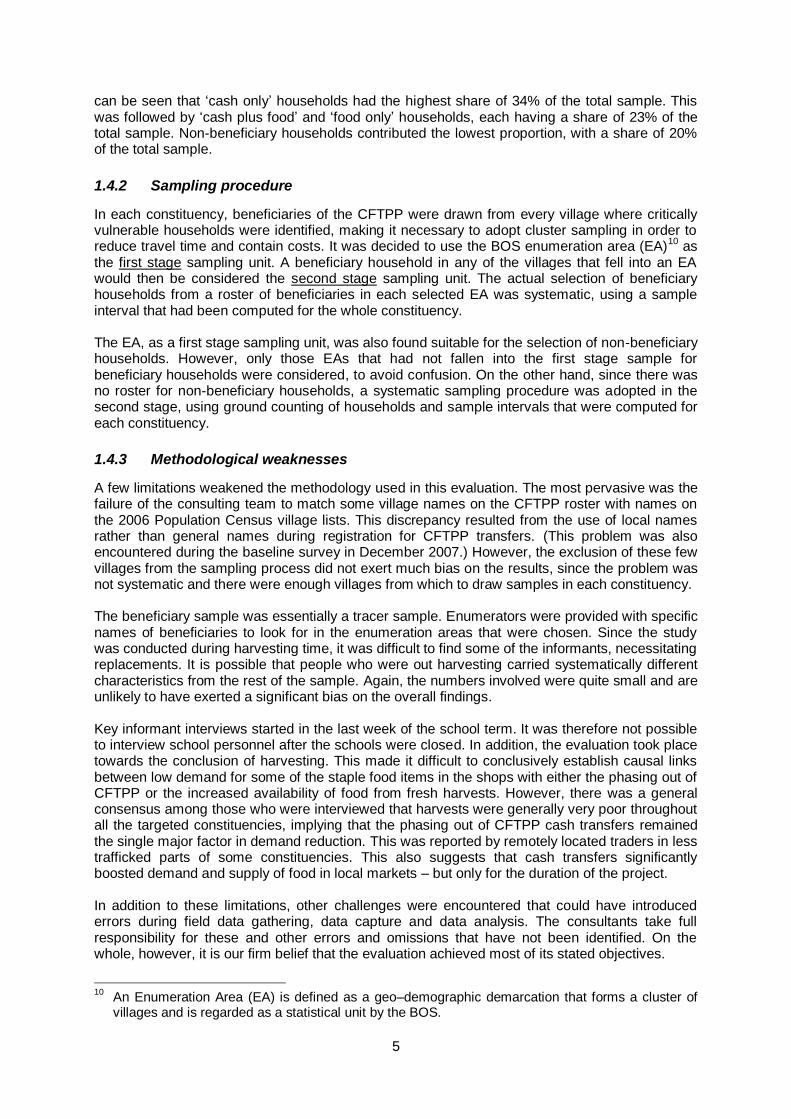
The first step in the sampling process was to determine the sample size based on the roster of beneficiaries that was supplied by CFTPP management (see Annex 1). This resulted in a sample size of 940 beneficiary households. The second step was to allocate this sample proportionately to each constituency (Table 2). Table 2 Sample allocation by Constituency
Constituency/ District
Beneficiaries Non-Beneficiary
Sample
Total Sample Number Percent Sample
Allocation
Matsieng 2,093 22.8 214 54 268
Rothe 1,645 17.9 168 42 210
Koro-Koro 1,128 12.3 116 29 145
Maseru 4,866 53.0 498 125 623
Mekaling 1,759 19.2 181 45 226
Mpharane 1,042 11.3 106 26 132
Taung 1,518 16.5 155 39 194
Mohale’s Hoek 4,319 47.0 442 110 552
All Constituencies 9,185 100.0 940 235 1175
Source: Consultants‟ calculations
To fully capture the impacts of the CFTPP on beneficiary households, it was decided to include non-beneficiary households in the sample in such a way that the total sample would be 80% beneficiary and 20% non-beneficiary households. This required an addition of 235 non-beneficiary households to the sample, resulting in a total sample size to 1,175 households. The sample of non-beneficiaries was proportionately allocated to each constituency, using 2006 Population census household numbers. The distribution of sample households by constituency automatically translated into a distribution by beneficiary stratum (Figure 1). It
5
can be seen that „cash only‟ households had the highest share of 34% of the total sample. This was followed by „cash plus food‟ and „food only‟ households, each having a share of 23% of the total sample. Non-beneficiary households contributed the lowest proportion, with a share of 20% of the total sample.
1.4.2 Sampling procedure
In each constituency, beneficiaries of the CFTPP were drawn from every village where critically vulnerable households were identified, making it necessary to adopt cluster sampling in order to reduce travel time and contain costs. It was decided to use the BOS enumeration area (EA)
10 as
the first stage sampling unit. A beneficiary household in any of the villages that fell into an EA would then be considered the second stage sampling unit. The actual selection of beneficiary households from a roster of beneficiaries in each selected EA was systematic, using a sample interval that had been computed for the whole constituency. The EA, as a first stage sampling unit, was also found suitable for the selection of non-beneficiary households. However, only those EAs that had not fallen into the first stage sample for beneficiary households were considered, to avoid confusion. On the other hand, since there was no roster for non-beneficiary households, a systematic sampling procedure was adopted in the second stage, using ground counting of households and sample intervals that were computed for each constituency.
1.4.3 Methodological weaknesses
A few limitations weakened the methodology used in this evaluation. The most pervasive was the failure of the consulting team to match some village names on the CFTPP roster with names on the 2006 Population Census village lists. This discrepancy resulted from the use of local names rather than general names during registration for CFTPP transfers. (This problem was also encountered during the baseline survey in December 2007.) However, the exclusion of these few villages from the sampling process did not exert much bias on the results, since the problem was not systematic and there were enough villages from which to draw samples in each constituency. The beneficiary sample was essentially a tracer sample. Enumerators were provided with specific names of beneficiaries to look for in the enumeration areas that were chosen. Since the study was conducted during harvesting time, it was difficult to find some of the informants, necessitating replacements. It is possible that people who were out harvesting carried systematically different characteristics from the rest of the sample. Again, the numbers involved were quite small and are unlikely to have exerted a significant bias on the overall findings. Key informant interviews started in the last week of the school term. It was therefore not possible to interview school personnel after the schools were closed. In addition, the evaluation took place towards the conclusion of harvesting. This made it difficult to conclusively establish causal links between low demand for some of the staple food items in the shops with either the phasing out of CFTPP or the increased availability of food from fresh harvests. However, there was a general consensus among those who were interviewed that harvests were generally very poor throughout all the targeted constituencies, implying that the phasing out of CFTPP cash transfers remained the single major factor in demand reduction. This was reported by remotely located traders in less trafficked parts of some constituencies. This also suggests that cash transfers significantly boosted demand and supply of food in local markets – but only for the duration of the project. In addition to these limitations, other challenges were encountered that could have introduced errors during field data gathering, data capture and data analysis. The consultants take full responsibility for these and other errors and omissions that have not been identified. On the whole, however, it is our firm belief that the evaluation achieved most of its stated objectives.
10
An Enumeration Area (EA) is defined as a geo–demographic demarcation that forms a cluster of villages and is regarded as a statistical unit by the BOS.
6
1.5 Characteristics of the sample population The sample yield in household surveys stood at 1,186, or 101% of the targeted sample size. The slight over–sampling resulted from rounding up of sample intervals. The sample maintained the original allocation of 80% beneficiary and 20% non–beneficiary households. The overall gender breakdown was 51% female–headed and 49% male–headed households. However, among beneficiaries the gender breakdown was 55% female– and 45% male–headed households, while among non–beneficiaries it stood at 65% male– and 35% female–headed households (Table 3). This reversal of gender balances is explained by the vulnerability profile of CFTPP participants. Table 3 Sample yield by gender and assistance package
Source: Final evaluation household survey, June 2008
Beneficiary household heads sampled were slightly older than non–beneficiaries, with 36% of the former over 60 years of age as compared to 30% of the latter. Similarly, beneficiary household heads were less educated on average than non-beneficiary ones, with 16% of the former having not attended formal school as compared to 13% of the latter, and 61% respectively having not completed primary school as compared to only 3% of the non-beneficiaries. On the other hand, 83% of the non-beneficiary household heads had completed Form A upwards as compared to only 24% of beneficiary household heads. The non-beneficiary sample was dominated by household heads who were monogamously married (60%), although widowed household heads also constituted a sizeable category (30%). The remaining 10% was made up of household heads of other marital status. On the other hand, the beneficiary sample was dominated by widowed household heads (45%), while those who were married monogamously came a fairly close second (36%). Child–headed households constituted 1% of the beneficiary sample, while those with miscellaneous marital status made up 8%. The household size of the sample ranged between 1 to 15 members, with an average household size of 4.8 for both the beneficiary and non–beneficiary sample households.
7
Chapter 2 Design and Process Evaluation Following the recommendations of a feasibility study conducted by the Humanitarian Policy Group (HPG) of the Overseas Development Institute (ODI), a project Design Workshop was held in Lesotho in October 2007. This workshop concluded that conditions in Lesotho presented a suitable environment for cash transfers, and that the latter were an appropriate response to the needs of vulnerable and drought-affected households in the country. Three conditions were considered critical during the programme design phase:
The application of targeting criteria that were already used in the country by various humanitarian agencies;
Pegging the transfer value to the value of current food rations that were already applied by other humanitarian agencies; and
Choosing the most appropriate delivery mechanism for cash. Under the facilitation of the HPG, the Design Workshop came to a consensus that the project‟s goal would be to “Mitigate the food insecurity effects of drought”. This goal was further unpacked into two specific objectives:
To maintain/increase access to basic food for 6,500 drought affected households; and
To increase World Vision‟s capacity and learning for cash transfer programming. The Design Workshop took a pragmatic stance in designing the project‟s goal and objectives. Noting that the project had a very short timeframe, it was prudent to address current needs rather than take the more ambitious step of building capacity among households to better withstand future shocks.
2.1 Targeting
2.1.1 Geographical targeting
The CFTPP was part of a countrywide relief programme that involved several donor agencies and was spearheaded by the DMA. For relief purposes, Lesotho is divided into 6 livelihood zones: the foothills, the mountains, peri-urban areas, northern lowlands, southern lowlands, and the Senqu River Valley (SRV).
11 The vulnerability assessment exercise that was carried out from May to
June 2007 concluded that although all the 553,000 drought-affected households in an estimated 110,660 households would need humanitarian assistance until June 2008, the needs varied across these livelihood zones, the biggest need being in the southern lowlands and the SRV where drought-induced food deficits were estimated to run from 6 to 9 months. The vulnerability assessment also established that drought conditions had severely reduced a major source of livelihoods in the form of casual labour in the farming sector (ploughing, weeding, harvesting, etc.). In addition, most of the affected households had no livestock or had limited stock. In a normal rainfall year, own crop production contributed a mere 15-25% of their annual food requirements, forcing these households to rely on gifts, remittances, and casual labour. While the northern lowlands were eliminated from consideration for launching the CFTPP due to the relatively short-term nature of their food deficits, the southern lowlands district of Mafeteng was also eliminated as it was already covered by other humanitarian interventions such as the USAID-funded Single-Year Assistance Project (SYAP). On the other hand, both the Maseru and Mohale‟s Hoek districts were found to have large numbers of households that met DMA targeting
criteria and had not yet received assistance. In addition, World Vision was already involved in these districts through PRRO and SYAP activities, making them the most appropriate for the CFTPP. The choice of specific constituencies to participate in the project in these two districts was influenced by considerations of complementary interventions by other humanitarian efforts. This evaluation found the choice of CFTPP intervention areas to have been appropriate, for two reasons:
the project was at its pilot stage, needing very close and intensive monitoring, and all the project‟s operational areas were found to be easily accessible for this purpose;
there were interventions in neighbouring constituencies by other humanitarian actors, clearly indicating that CFTPP efforts complemented efforts by other agencies.
Despite these observations, a few development practitioners felt that the project should have chosen one or two areas that were remotely located, for comparative purposes. On the other hand, project records show that, in contrast to areas where food interventions were underway, government officials demanded an explanation of how participating districts and their respective constituencies were chosen.
12 This confirmed the view that in humanitarian interventions
involving cash, whichever geographical area is chosen there will inevitably be queries from politicians representing areas that were not included. This is understandable from the point of view that each political leader is elected to deliver material changes to the livelihoods of the people that he or she represents.
2.1.2 Beneficiary selection
The Design Workshop came to a conclusion that CFTPP was to use the government‟s targeting criteria that were already in use in World Vision‟s drought response food programming. Three major reasons were advanced:
World Vision participated in the development of the government‟s targeting criteria and processes;
the objectives of CFTPP cash programming were in line with those of other humanitarian agencies, including the DMA; and
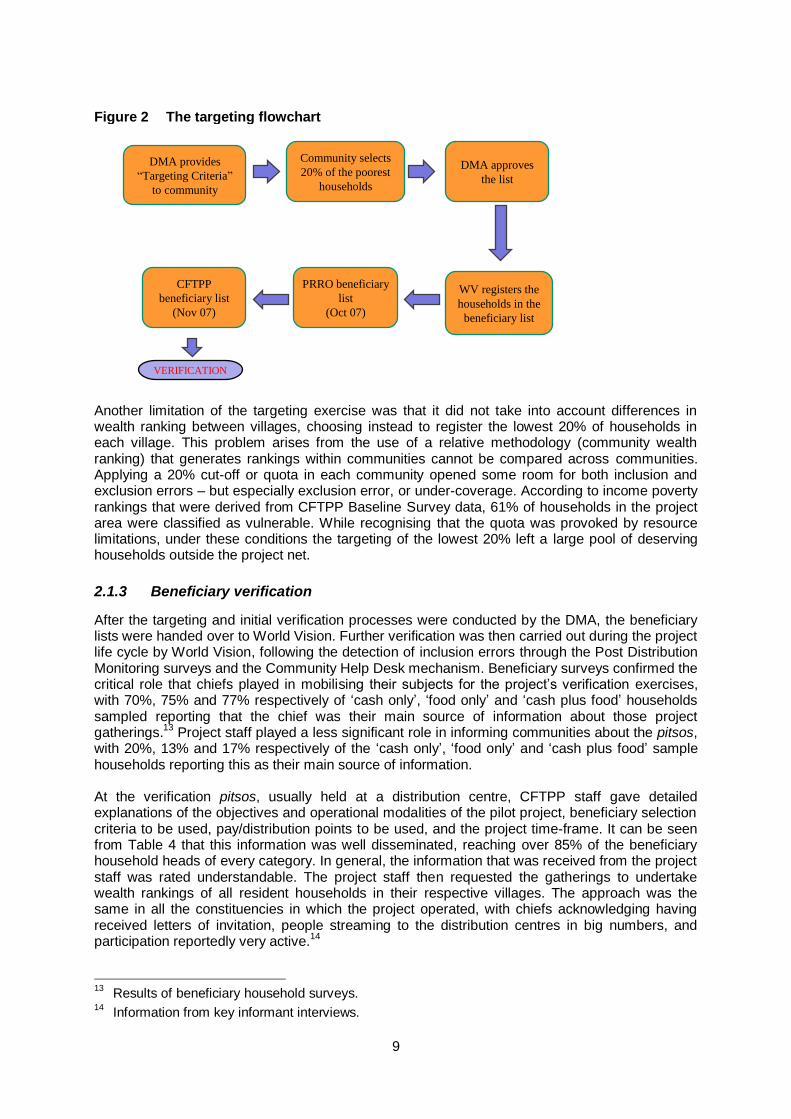
targeting criteria could only be changed with the approval of the government. The DMA is the government institution that coordinates the targeting process for relief. The targeting exercise itself is based on a ranking score on selected wealth criteria (see Annex 2). Although this process aims at eventually generating standing lists of beneficiaries, it is doubtful if this will ever be reached due to population dynamics and changes in people‟s wealth ranking from year to year. Besides, in some places, communities have objected to lists that were drawn up by targeting teams, accusing Disaster Management Committees of lacking transparency in compiling lists. Despite these criticisms, national targeting criteria provided the CFTPP with objective standards on which to base household selection within a limited timeframe. Figure 2 shows the targeting flowchart that was pursued in the selection of beneficiary households. It can be seen that local communities played a pivotal role in the selection process. On the other hand, the lists that were inherited by the CFTPP from the PRRO were subject to further refinement through a verification process. The bias towards the elderly, child-headed households, and households with low and irregular incomes was vindicated by the fact that these were found to be positively associated with vulnerability.
12
Cash and Food Transfers Pilot Project, Monthly Report, October 2007, paragraph 2c.
9
Figure 2 The targeting flowchart
DMA provides
“Targeting Criteria”
to community
Community selects
20% of the poorest
households
WV registers the
households in the
beneficiary list
DMA approves
the list
Diagram 2-1
The Targeting Flowchart
VERIFICATION
PRRO beneficiary
list
(Oct 07)
CFTPP
beneficiary list
(Nov 07)
Another limitation of the targeting exercise was that it did not take into account differences in wealth ranking between villages, choosing instead to register the lowest 20% of households in each village. This problem arises from the use of a relative methodology (community wealth ranking) that generates rankings within communities cannot be compared across communities. Applying a 20% cut-off or quota in each community opened some room for both inclusion and exclusion errors – but especially exclusion error, or under-coverage. According to income poverty rankings that were derived from CFTPP Baseline Survey data, 61% of households in the project area were classified as vulnerable. While recognising that the quota was provoked by resource limitations, under these conditions the targeting of the lowest 20% left a large pool of deserving households outside the project net.
2.1.3 Beneficiary verification
After the targeting and initial verification processes were conducted by the DMA, the beneficiary lists were handed over to World Vision. Further verification was then carried out during the project life cycle by World Vision, following the detection of inclusion errors through the Post Distribution Monitoring surveys and the Community Help Desk mechanism. Beneficiary surveys confirmed the critical role that chiefs played in mobilising their subjects for the project‟s verification exercises, with 70%, 75% and 77% respectively of „cash only‟, „food only‟ and „cash plus food‟ households sampled reporting that the chief was their main source of information about those project gatherings.
13 Project staff played a less significant role in informing communities about the pitsos,
with 20%, 13% and 17% respectively of the „cash only‟, „food only‟ and „cash plus food‟ sample households reporting this as their main source of information. At the verification pitsos, usually held at a distribution centre, CFTPP staff gave detailed explanations of the objectives and operational modalities of the pilot project, beneficiary selection criteria to be used, pay/distribution points to be used, and the project time-frame. It can be seen from Table 4 that this information was well disseminated, reaching over 85% of the beneficiary household heads of every category. In general, the information that was received from the project staff was rated understandable. The project staff then requested the gatherings to undertake wealth rankings of all resident households in their respective villages. The approach was the same in all the constituencies in which the project operated, with chiefs acknowledging having received letters of invitation, people streaming to the distribution centres in big numbers, and participation reportedly very active.
14
13
Results of beneficiary household surveys. 14
Information from key informant interviews.
10
Table 4 Type of information received on the CFTPP, by beneficiary category
Information received Cash Only Food Only Cash & Food All Beneficiary
Number % Number % Number % Number %
Objectives of the project 362 92 250 91 254 91 866 91
Targeting mechanisms 353 89 255 92 267 96 875 92
Pay/distribution point 344 87 235 85 249 89 828 87
Project time frame 346 88 242 88 261 94 849 89
Other information 7 2 0 0 3 1 10 1
Source: Beneficiary Household Survey, June 2008
More serious beneficiary targeting problems emerged during the month of December, when the CFTPP made its initial disbursements. Although most of the problems reflected teething problems relating to the database more than anything else, there were other more pervasive challenges:
The process was not implemented in the same way in all project areas. While in most of the localities in Maseru District a wealth ranking of all households in each village was made, in Mohale‟s Hoek District the instruction was to compile lists of vulnerable households (bahloki) in every village, in some cases limiting registration to those vulnerable household heads that attended the pitsos.
In both operational districts, the lists were submitted to CFTPP staff. However, when the latter came back to deliver ration cards, the lists had varied considerably, creating discontent and sometimes animosity among communities. Failure on the part of CFTPP staff to organise report-back meetings or further verification sessions exacerbated the problem and increased perceptions of possible favouritism.
Although CFTPP adopted the PRRO beneficiary list, with a specific household size for each beneficiary household, several beneficiaries began to query their household sizes in the cash transfers register although they never did so under food transfers. This strengthened the conclusion that cash transfers were valued more than food transfers, even if the two modes of assistance were officially equal. Database problems once again surfaced when the need to verify household sizes intensified in January and the database for Mohale‟s Hoek constituencies, being scanty, could not support the verification process.
15
There were suspicions on the part of project management that the demand for the amendment of household sizes could have been motivated by fraudulent intentions on the part of beneficiaries who had learnt that transfers were based on household size.
There were cases of “sympathetic registration”, where community councillors included elderly or chronically ill people from households that were not eligible under DMA targeting criteria. Such beneficiaries would then call for a review of their under-registration, upon realising that cash transfers were based on family size.
While the beneficiary verification process that was adopted by the CFTPP exhibited all the characteristics of a transparent process, it appears that the most influential people within communities, especially community councillors, were able to exert more influence than other less powerful community members.
Summoning communities to centrally located venues, while expedient, posed serious problems for the aged, the chronically sick, the disabled, and the remotely located. The chances of those who had no household member or friend to represent them at the pitso appearing in beneficiary lists, particularly in the Mohale‟s Hoek District, were therefore slim.
15
Cash and Food Transfers Pilot Project, Monthly Report, January 2008.
11
The problems cited above opened room for the inclusion of less deserving cases and omission of more deserving ones. Both inclusion and exclusion errors were reported during this evaluation. Village-based beneficiary surveys conducted by the Research, Monitoring and Evaluation (M&E) Division of World Vision revealed inclusion errors ranging from 0% to 28%.
16 Several attempts
were made to investigate and correct these errors. They were partly blamed on the targeting of 20% of the households in villages whose wealth rankings varied, rather than uniformly applying standardised national wealth ranking criteria. Unfortunately, because of limited resources and time, the M&E Department did not investigate the possible existence of exclusion errors. The final evaluation survey found widespread perceptions of inclusion and exclusion errors among beneficiary household heads (Table 5). Those who perceived the existence of exclusion errors averaged 65% of the sample, while those who perceived the existence of inclusion errors averaged 24%. Perceptions of both inclusion and exclusion errors were higher among cash transfer beneficiaries than with other categories of beneficiaries, implying that cash was valued more than food among beneficiary household heads. On the other hand, 22% of the sample reported some possible existence of favouritism during the verification process. This perception was exacerbated by the failure of project staff to organise a report-back meeting after the verification process, or to organise a second verification process. Table 5 Perceived CFTPP inclusion and exclusion errors, by beneficiary category
Perceived Error Cash Only Food Only Cash & Food All Beneficiary
No. % No. % No. % No. %
Inclusion error: Undeserving HHs that were included
115 29 64 23 51 18 230 24
Exclusion error: Deserving HHs that were excluded
270 68 165 60 180 65 615 65
Perceived favouritism 88 22 63 23 62 22 213 22
Source: Beneficiary Household Survey, June 2008
Despite the verification problems discussed above, it appears that the characteristics of the beneficiary sample closely matched those of vulnerable households that were derived from the CFTPP Baseline Study (Table 6). Table 6 Comparison of sample characteristics by sample category
Characteristics Beneficiary
HHs: Evaluation Non-Beneficiary HHs: Evaluation
Vulnerable HHs: Baseline
Average household size 4.8 4.8 4.9
HH heads aged 60+ years 36% 30% 41%
HH heads widowed 45% 30% 48%
HH heads without formal education 16% 13% 21%
HHs with primary schooling 61% 3% 63%
HHs with Form A or more schooling 23% 84% 16%
Average monthly cash income M3.75* M377.01 M98.50
Percentage expenditure on food 66% ** 63% 57%
Sources: Beneficiary Household Survey, June 2008; CFTPP Baseline Survey, May 2008
* After subtracting an average M355.62 from cash transfers for May 2008
** Cash only households 16
Cash and Food Transfers Pilot Project: Research, Monitoring and Evaluation Reports for the months of January to March.
12
The two samples were dominated by elderly and widowed household heads with very low educational attainment. The average household cash income (after subtracting the average cash transfer of M355.62 for May 2008) for beneficiary households in May, the last month of the project, was M3.75, much lower than the average household monthly cash income recorded for vulnerable households during the Baseline Study (M98.50), implying that the project had indeed targeted the poorest of the poor. Similarly, in the month of May 2008, beneficiary households spent 45% of their cash incomes (including that from cash transfers) on food. This compared with 36% for vulnerable households under the Baseline Study, once again suggesting that CFTPP had targeted many of the most vulnerable households.
2.1.4 Gender sensitivity
The CFTPP baseline study established that 39% of the households in the CFTPP areas were female-headed. The percentage of female-headed households ranged from 34% in the Matsieng constituency to 44% in the Mekaling constituency. There were relatively more female-headed households in the Mohale‟s Hoek District than in the Maseru District, 41% as compared to 37%. A breakdown of the households by income poverty also revealed strong gender sensitivity, in that 43% of the female-headed households were found to be very poor and 30% were poor. The respective percentages for male-headed households were 37% and 15%, implying that 52% of male-headed households were vulnerable, compared to 73% of the female-headed. Although there was no reference to gender targeting in the CFTPP design document, the final evaluation survey established that, on average, 55% of the beneficiary households were female-headed (Table 7), the percentage being 54% each of „cash only‟ and „food only‟ beneficiaries, and 59% for „cash plus food‟ beneficiaries. This finding implies that by the pursuing national targeting criteria, the project reached a high proportion of vulnerable women. Active participation by women was also demonstrated by the fact that right from December, 2007, 74% of the cash collectors at cash-points were women, the same being observed at food distribution points.
17
Table 7 Sample composition by gender of household head
Beneficiary Type Males Females Total
Number % Number % Number %
Cash only 183 46 212 54 395 100
Cash and food 115 41 164 59 279 100
Food only 128 46 148 54 276 100
All beneficiary 426 45 524 55 950 100
Source: CFTPP Households Survey, June 2008
2.1.5 Conclusion
The application of national targeting criteria was appropriate for a short-term project such as the CFTPP. Not only did these criteria net the poorest of the poor households, they also produced gender-sensitive results. However, by not recognising variations in the wealth ranking of different villages, the national targeting criteria could not fully eradicate either inclusion or exclusion errors. Nonetheless, in the face of resource and time limitations, the extremely fine differentiation among vulnerable households, and the limited database, the application of national targeting criteria by the CFTPP produced an acceptable level of accuracy. The public or community verification system is ruthlessly transparent. However, it may encourage both inclusion and exclusion errors if it does not limit the influence of powerful individuals within communities. Interestingly, the CFTPP has established that under-registration controversies
17
Cash and Food Transfers Pilot Project: Post-Distribution Monitoring, December 2007.
13
come to the fore faster when cash transfers are involved than when food is involved, probably because cash is perceived by beneficiaries as having a higher value. The fact that cash transfers were usually collected by females in 58% of the cash beneficiary households underlines the important role that women played in the project. Since baseline survey data revealed that vulnerability was more widespread among female-headed households, this was also a pointer to the gender sensitivity of the national targeting guidelines, as applied by the CFTPP. If differences in village wealth rankings had been taken into account and beneficiary verification was conducted objectively, gender sensitivity could have been more pronounced. The targeting and verification problems raised here demonstrate the challenges that development practitioners will always face between limited relief resources on the one hand and the large number of deserving cases on the other, and expeditious delivery of emergency relief assistance on the one hand and refining targeting criteria and processes on the other. One possible solution to the second challenge would be to appoint local assessment officers whose duties would be to trace critically deserving exclusion cases, to identify less deserving cases and to propose amendments to the beneficiary roster.
2.2 Assistance packages A number of cash transfer options were considered during the design stage. These included vouchers, conditional transfers, cash-for-work and cash grants. Unconditional cash grants were found to be the most appropriate intervention, in that:
they were suitable for drought-affected households that lacked labour capacity;
they were consistent with drought response strategies adopted by other interventions, such as the PRRO; and
they did not divert household members from their normal livelihood activities. Although the cash transfers were unconditional, they were expected to be complemented with development activities, particularly keyhole gardens. Even in this case there were two possible options: „cash only‟ and a „cash plus food‟ combination. However, to facilitate a comprehensive assessment of impacts, it was decided to include a „food only‟ ration as a third option.
2.2.1 ‘Cash only’ package
The value of the „cash only‟ package was calculated from local retail prices of commodities used in the food ration. It was hoped that the „cash only‟ option would offer households flexibility in terms of purchase items and quantities, and broadening choices. It also offered an opportunity for World Vision to build its capacity for cash transfer programming and accumulate useful learning experiences in areas such as the impacts of inflation, antisocial uses of cash, and so on.
2.2.2 ‘Cash plus food’ package
This option provided an opportunity for a comparison of impacts with the „cash only‟ option. In the feasibility study, this was the most popular option because households wanted protection against food price inflation. In order to facilitate comparisons, the real value of the „cash plus food‟ option would be kept constant. On the other hand, „cash only‟ and „cash plus food‟ beneficiaries had to be geographically separated to avoid interference and conflict between the two groups.
2.2.3 ‘Food only’ package
Since the main objective of the CFTPP was to improve access to basic food by drought-affected households, this option took into account minimum food requirements, which already existed in the form of the food ration that was distributed through the PRRO programme. The food ration was calibrated according to household size, as is done in the PRRO. This also applied to the
14
„cash only‟ and „cash plus food‟ packages. In other words, the transfer value was designed to reflect both retail prices and household size. This required close monitoring of retail prices.
2.2.4 The package mix
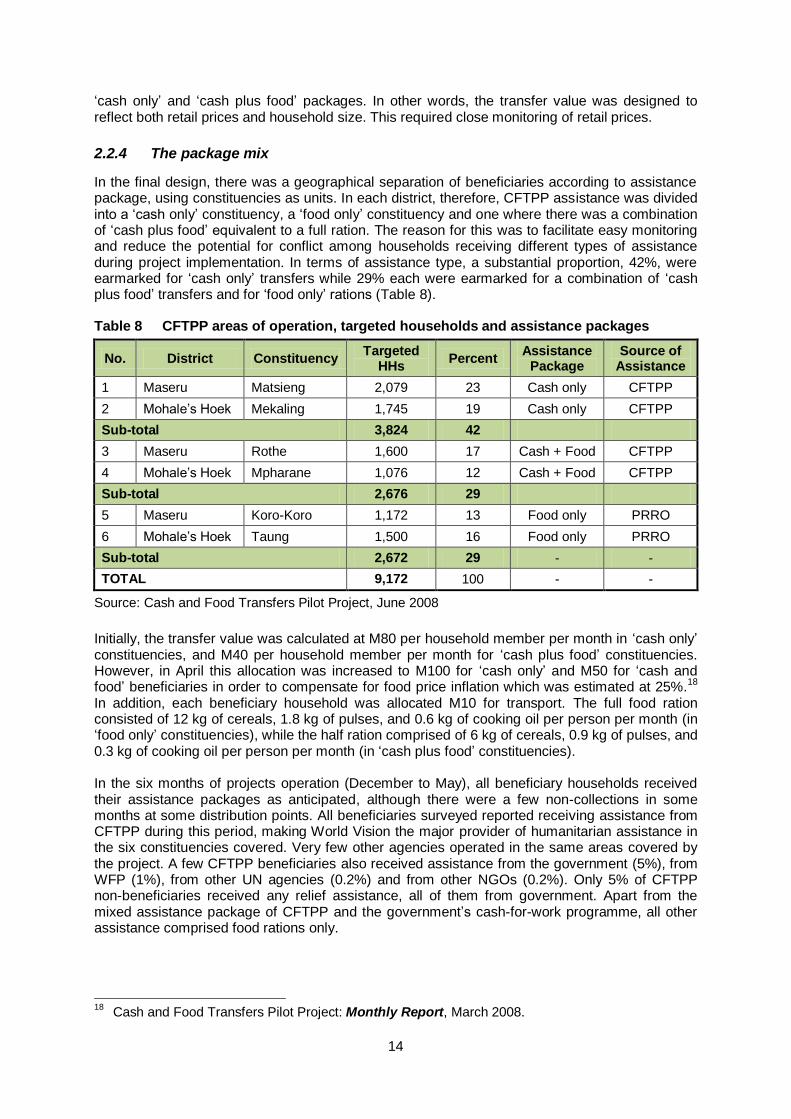
In the final design, there was a geographical separation of beneficiaries according to assistance package, using constituencies as units. In each district, therefore, CFTPP assistance was divided into a „cash only‟ constituency, a „food only‟ constituency and one where there was a combination of „cash plus food‟ equivalent to a full ration. The reason for this was to facilitate easy monitoring and reduce the potential for conflict among households receiving different types of assistance during project implementation. In terms of assistance type, a substantial proportion, 42%, were earmarked for „cash only‟ transfers while 29% each were earmarked for a combination of „cash plus food‟ transfers and for „food only‟ rations (Table 8). Table 8 CFTPP areas of operation, targeted households and assistance packages
Source: Cash and Food Transfers Pilot Project, June 2008
Initially, the transfer value was calculated at M80 per household member per month in „cash only‟ constituencies, and M40 per household member per month for „cash plus food‟ constituencies. However, in April this allocation was increased to M100 for „cash only‟ and M50 for „cash and food‟ beneficiaries in order to compensate for food price inflation which was estimated at 25%.
18
In addition, each beneficiary household was allocated M10 for transport. The full food ration consisted of 12 kg of cereals, 1.8 kg of pulses, and 0.6 kg of cooking oil per person per month (in „food only‟ constituencies), while the half ration comprised of 6 kg of cereals, 0.9 kg of pulses, and 0.3 kg of cooking oil per person per month (in „cash plus food‟ constituencies). In the six months of projects operation (December to May), all beneficiary households received their assistance packages as anticipated, although there were a few non-collections in some months at some distribution points. All beneficiaries surveyed reported receiving assistance from CFTPP during this period, making World Vision the major provider of humanitarian assistance in the six constituencies covered. Very few other agencies operated in the same areas covered by the project. A few CFTPP beneficiaries also received assistance from the government (5%), from WFP (1%), from other UN agencies (0.2%) and from other NGOs (0.2%). Only 5% of CFTPP non-beneficiaries received any relief assistance, all of them from government. Apart from the mixed assistance package of CFTPP and the government‟s cash-for-work programme, all other assistance comprised food rations only.
18
Cash and Food Transfers Pilot Project: Monthly Report, March 2008.
15
2.2.5 Trends in transfer values
Figure 3 shows trends in the average cash transfer over the 6 months period of the CFTPP. It can be seen that the average cash transfer for all the project‟s operational areas increased slightly up to March for both „cash only‟ and „cash plus food‟ beneficiaries. There was a significant increase in the average cash transfer in April, when there was an adjustment for inflation and transport, and a slight increase in May for „cash only‟ beneficiaries. These slight increases reflect revisions in the average household sizes that followed complaints of under-registration by some beneficiaries. The average cash transfer for all the cash beneficiaries increased from M346.84 in December to M355.62 in March, registering a 2.5% increase in four months. Similarly, the average cash transfer for „cash plus food‟ beneficiaries increased from M160.32 in December to M174.73 in March 2008, registering a 9% increase in that period (see also Annex Table 19). Increases in the average transfer were also experienced with food rations (Table 9). For „food only‟ beneficiaries, the average ration increased by 42% for cereals between December and May, by 43% for pulses, and by 19% for cooking oil. The increase in the average ration for „cash plus food‟ beneficiaries was somewhat indeterminate due to supply problems in December and April. However, there was a 6% increase in the average ration for cereals between January and May, 7% for pulses, and 12% for cooking oil. It appears that the pressures for an increase in transfers, therefore, were not only confined to cash but to the food ration as well, although it tended to be lower in the latter case. Table 9 Food transfers received by commodity
Month
Food Only Beneficiaries Cash and Food Beneficiaries
Cereals
(kg)
Pulses
(kg)
Cooking oil
(litres)
Cereals
(kg)
Pulses
(kg)
Cooking oil
(litres)
December 2007 33.39 5.01 3.55 15.69 2.39 0.94
January 2008 38.61 5.85 3.79 25.42 3.76 1.24
February 2008 47.63 7.18 4.24 25.93 3.84 1.23
March 2008 47.88 7.22 4.20 25.55 3.79 1.04
April 2008 32.09 4.85 3.39 28.11 4.03 0.87
May 2008 47.49 7.18 4.24 26.95 4.01 1.39
Source: CFTPP Household Survey, June 2008
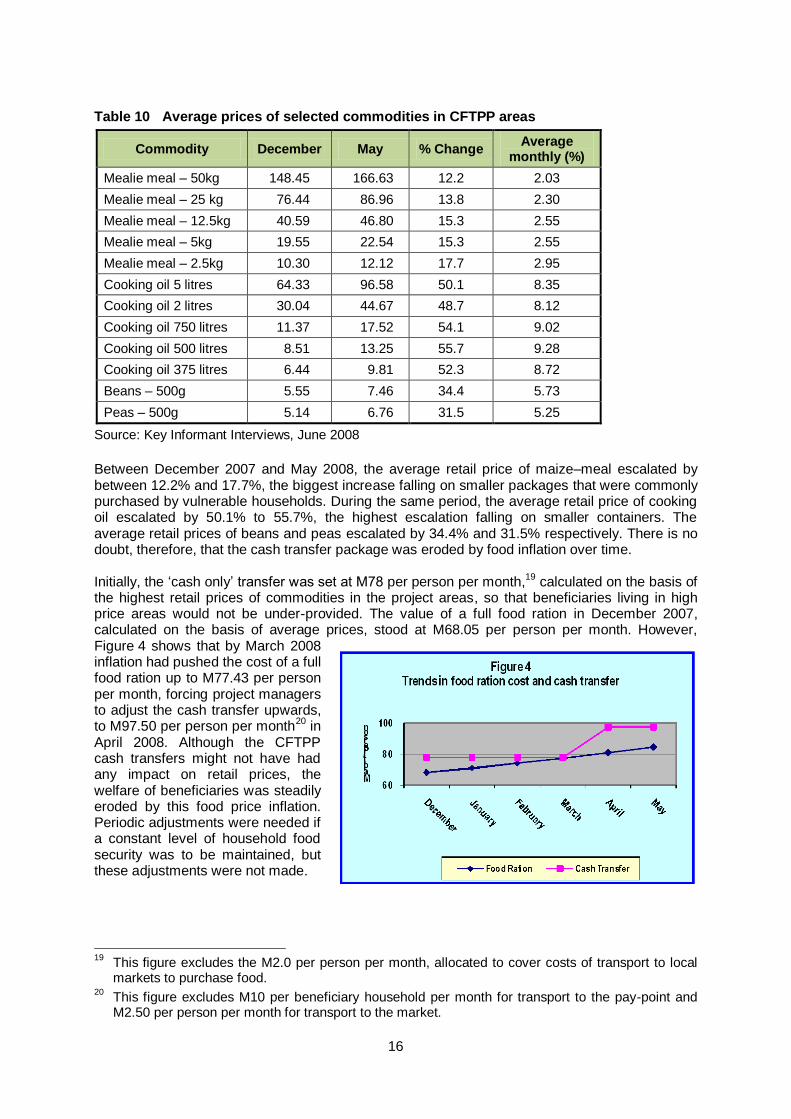
The real value of the cash transfer was intended to be constant over time. This required close monitoring of retail prices in local markets (which was done) in order to effect adjustments in the nominal transfer value whenever retail prices increased (which was not done). Indeed, there was an escalation in the cost of food, driven mainly by wholesale price rises. In the six months ending May, there were reports of 2 or 3 increases in the wholesale price of maize and 4 or 5 increases in the wholesale price of cooking oil. These wholesale price increases had direct impacts on retail prices (Table 10) throughout all the project areas, leading to an erosion of the real value of the cash transfers. These price changes were not localised since they prevailed even in areas that were outside the project, clearly indicating that they were not project-driven – the CFTPP did not contribute to general food price inflation.
16
Table 10 Average prices of selected commodities in CFTPP areas
Commodity December May % Change Average
monthly (%)
Mealie meal – 50kg 148.45 166.63 12.2 2.03
Mealie meal – 25 kg 76.44 86.96 13.8 2.30
Mealie meal – 12.5kg 40.59 46.80 15.3 2.55
Mealie meal – 5kg 19.55 22.54 15.3 2.55
Mealie meal – 2.5kg 10.30 12.12 17.7 2.95
Cooking oil 5 litres 64.33 96.58 50.1 8.35
Cooking oil 2 litres 30.04 44.67 48.7 8.12
Cooking oil 750 litres 11.37 17.52 54.1 9.02
Cooking oil 500 litres 8.51 13.25 55.7 9.28
Cooking oil 375 litres 6.44 9.81 52.3 8.72
Beans – 500g 5.55 7.46 34.4 5.73
Peas – 500g 5.14 6.76 31.5 5.25
Source: Key Informant Interviews, June 2008
Between December 2007 and May 2008, the average retail price of maize–meal escalated by between 12.2% and 17.7%, the biggest increase falling on smaller packages that were commonly purchased by vulnerable households. During the same period, the average retail price of cooking oil escalated by 50.1% to 55.7%, the highest escalation falling on smaller containers. The average retail prices of beans and peas escalated by 34.4% and 31.5% respectively. There is no doubt, therefore, that the cash transfer package was eroded by food inflation over time. Initially, the „cash only‟ transfer was set at M78 per person per month,
19 calculated on the basis of
the highest retail prices of commodities in the project areas, so that beneficiaries living in high price areas would not be under-provided. The value of a full food ration in December 2007, calculated on the basis of average prices, stood at M68.05 per person per month. However, Figure 4 shows that by March 2008 inflation had pushed the cost of a full food ration up to M77.43 per person per month, forcing project managers to adjust the cash transfer upwards, to M97.50 per person per month
20 in
April 2008. Although the CFTPP cash transfers might not have had any impact on retail prices, the welfare of beneficiaries was steadily eroded by this food price inflation. Periodic adjustments were needed if a constant level of household food security was to be maintained, but these adjustments were not made.
19
This figure excludes the M2.0 per person per month, allocated to cover costs of transport to local markets to purchase food.
20 This figure excludes M10 per beneficiary household per month for transport to the pay-point and
M2.50 per person per month for transport to the market.
17
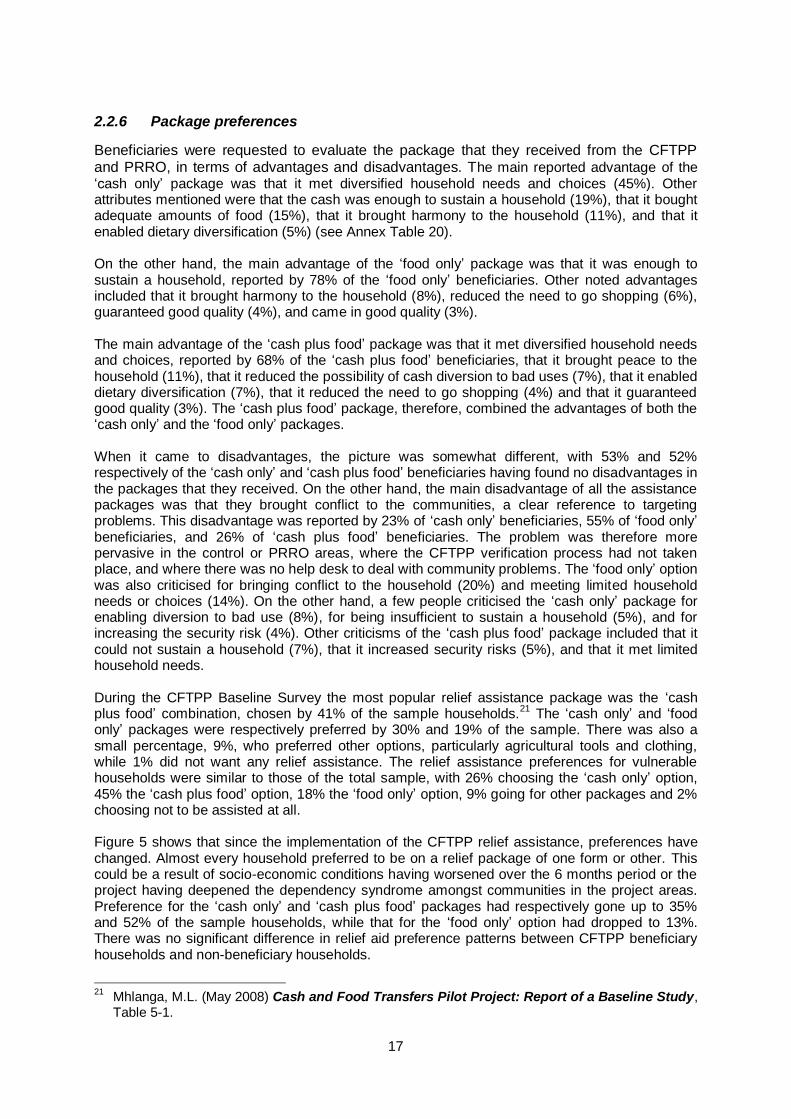
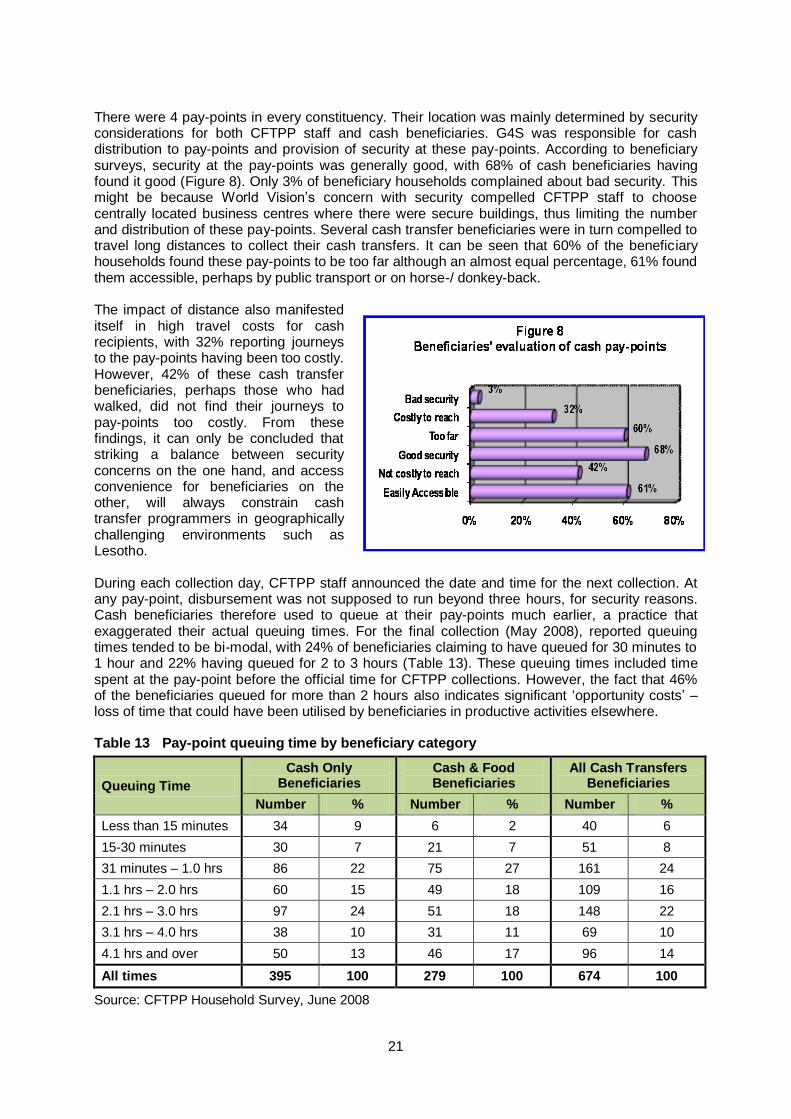
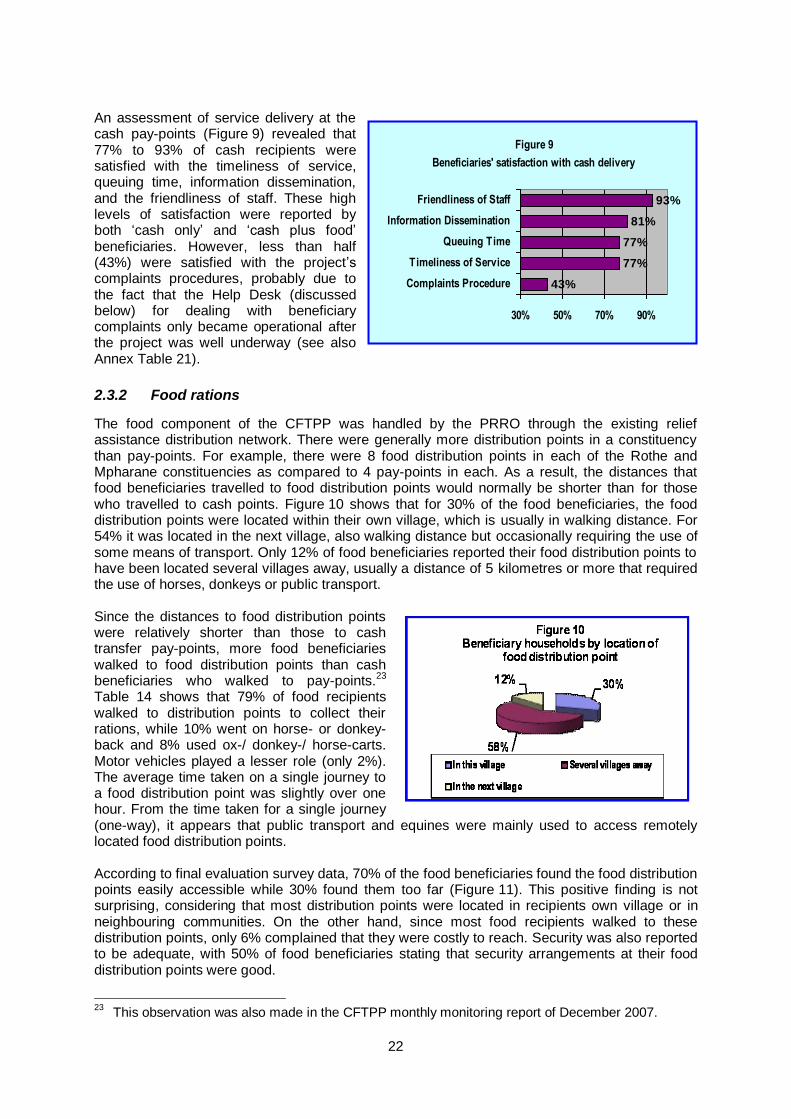
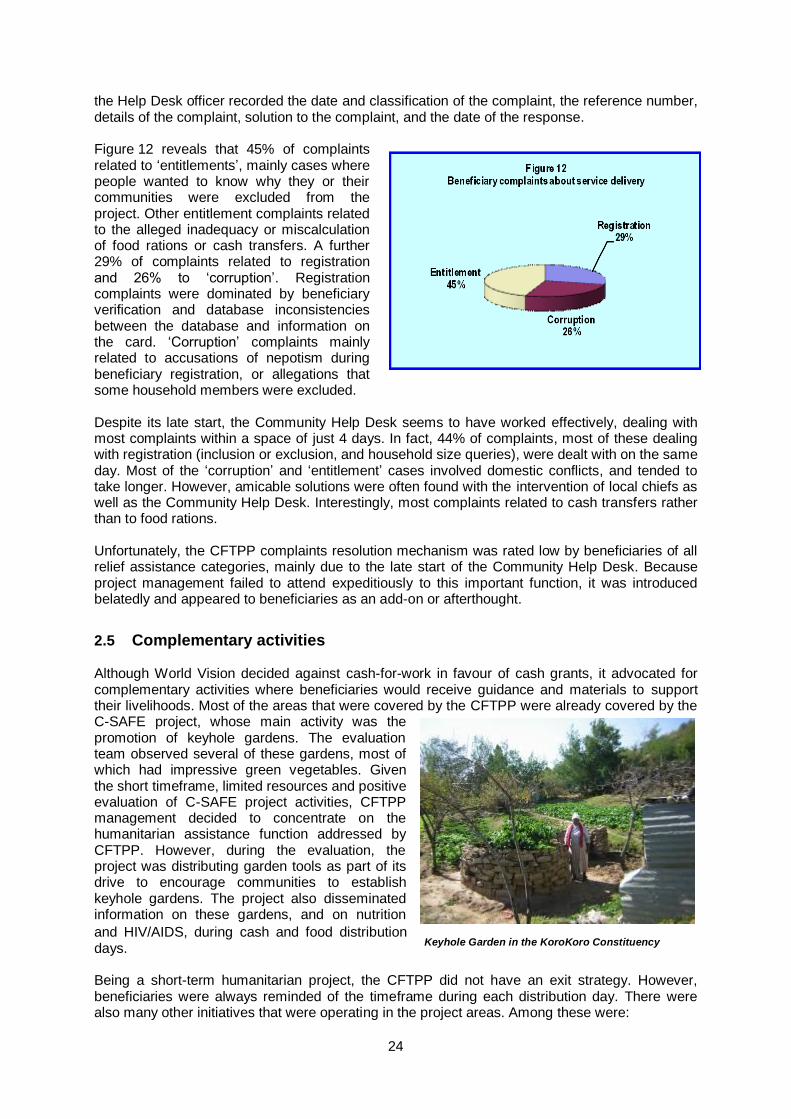
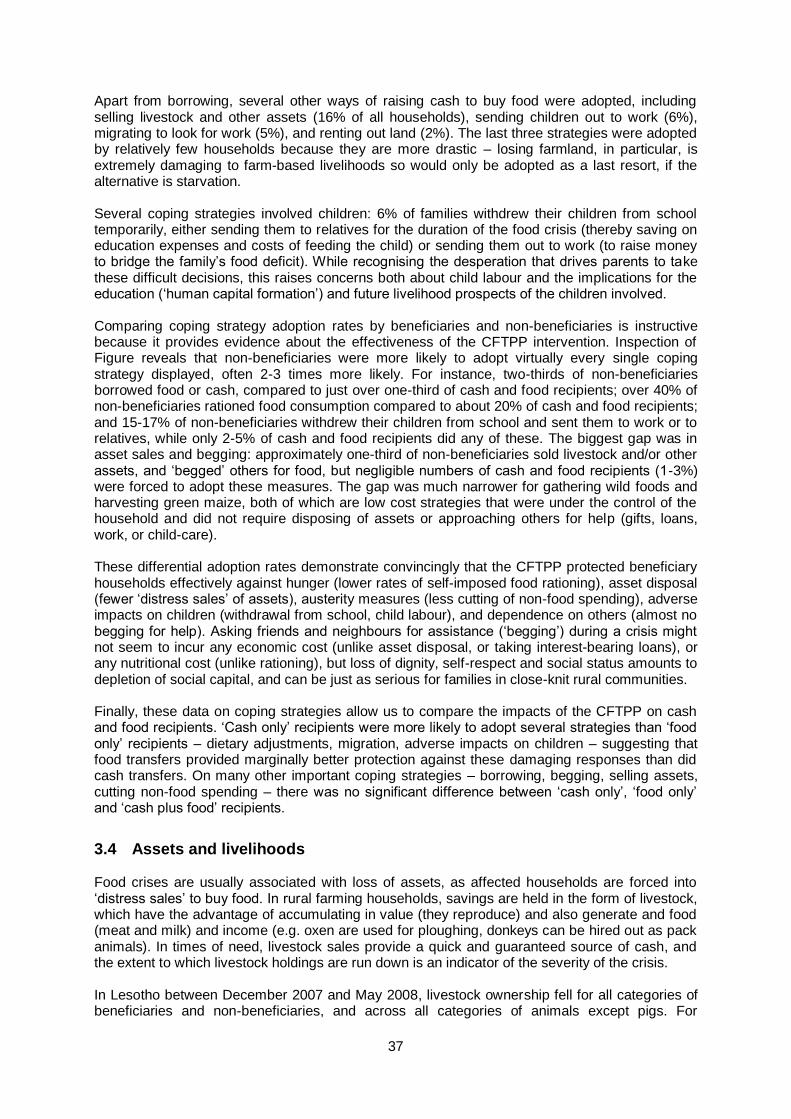
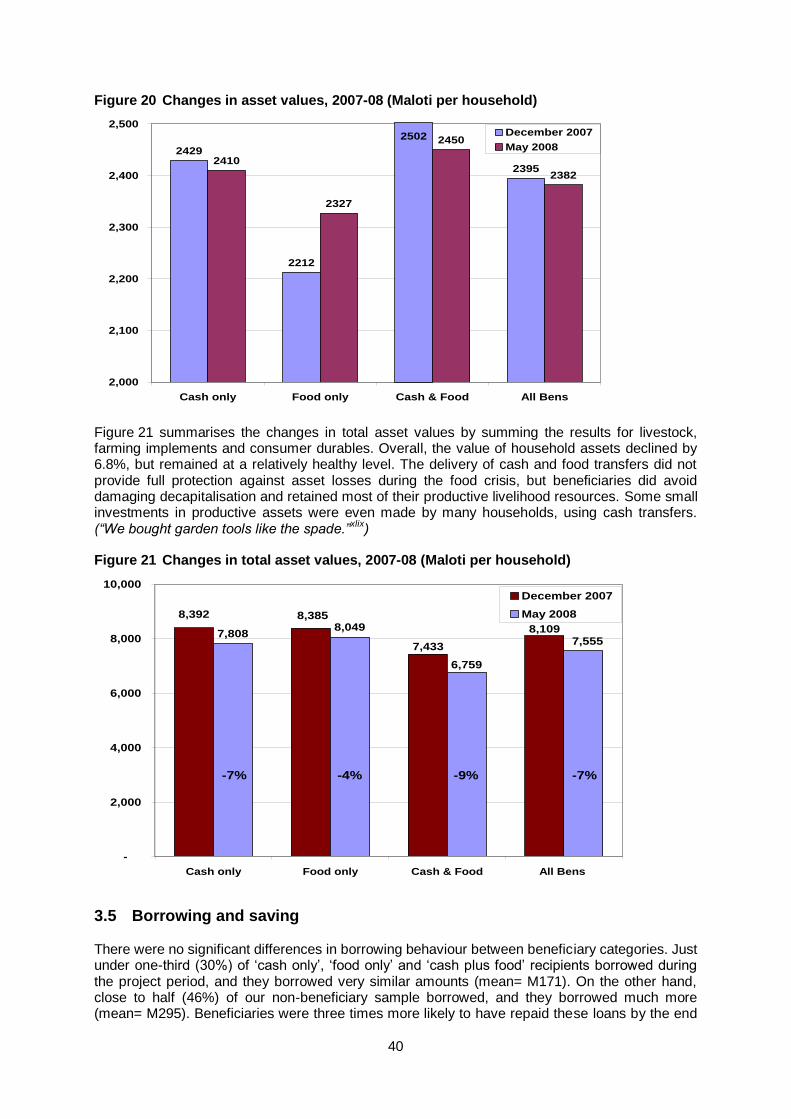
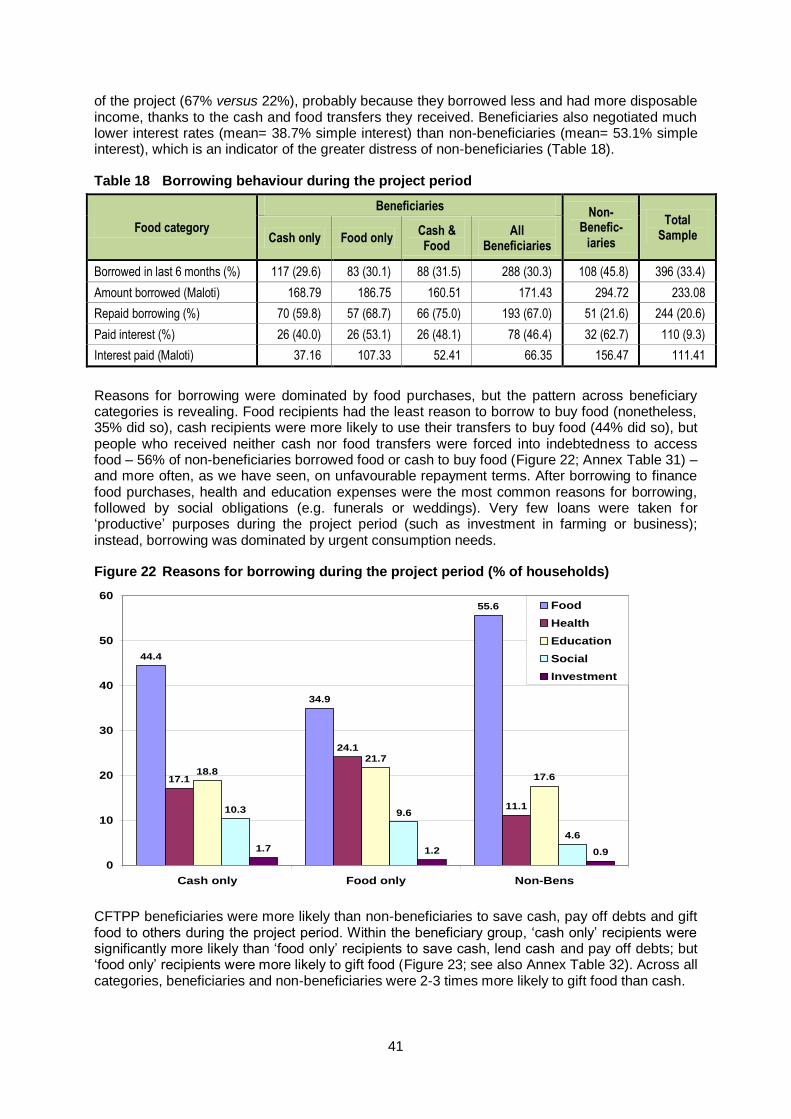
2.2.6 Package preferences
Beneficiaries were requested to evaluate the package that they received from the CFTPP and PRRO, in terms of advantages and disadvantages. The main reported advantage of the „cash only‟ package was that it met diversified household needs and choices (45%). Other attributes mentioned were that the cash was enough to sustain a household (19%), that it bought adequate amounts of food (15%), that it brought harmony to the household (11%), and that it enabled dietary diversification (5%) (see Annex Table 20). On the other hand, the main advantage of the „food only‟ package was that it was enough to sustain a household, reported by 78% of the „food only‟ beneficiaries. Other noted advantages included that it brought harmony to the household (8%), reduced the need to go shopping (6%), guaranteed good quality (4%), and came in good quality (3%). The main advantage of the „cash plus food‟ package was that it met diversified household needs and choices, reported by 68% of the „cash plus food‟ beneficiaries, that it brought peace to the household (11%), that it reduced the possibility of cash diversion to bad uses (7%), that it enabled dietary diversification (7%), that it reduced the need to go shopping (4%) and that it guaranteed good quality (3%). The „cash plus food‟ package, therefore, combined the advantages of both the „cash only‟ and the „food only‟ packages. When it came to disadvantages, the picture was somewhat different, with 53% and 52% respectively of the „cash only‟ and „cash plus food‟ beneficiaries having found no disadvantages in the packages that they received. On the other hand, the main disadvantage of all the assistance packages was that they brought conflict to the communities, a clear reference to targeting problems. This disadvantage was reported by 23% of „cash only‟ beneficiaries, 55% of „food only‟ beneficiaries, and 26% of „cash plus food‟ beneficiaries. The problem was therefore more pervasive in the control or PRRO areas, where the CFTPP verification process had not taken place, and where there was no help desk to deal with community problems. The „food only‟ option was also criticised for bringing conflict to the household (20%) and meeting limited household needs or choices (14%). On the other hand, a few people criticised the „cash only‟ package for enabling diversion to bad use (8%), for being insufficient to sustain a household (5%), and for increasing the security risk (4%). Other criticisms of the „cash plus food‟ package included that it could not sustain a household (7%), that it increased security risks (5%), and that it met limited household needs. During the CFTPP Baseline Survey the most popular relief assistance package was the „cash plus food‟ combination, chosen by 41% of the sample households.
21 The „cash only‟ and „food
only‟ packages were respectively preferred by 30% and 19% of the sample. There was also a small percentage, 9%, who preferred other options, particularly agricultural tools and clothing, while 1% did not want any relief assistance. The relief assistance preferences for vulnerable households were similar to those of the total sample, with 26% choosing the „cash only‟ option, 45% the „cash plus food‟ option, 18% the „food only‟ option, 9% going for other packages and 2% choosing not to be assisted at all. Figure 5 shows that since the implementation of the CFTPP relief assistance, preferences have changed. Almost every household preferred to be on a relief package of one form or other. This could be a result of socio-economic conditions having worsened over the 6 months period or the project having deepened the dependency syndrome amongst communities in the project areas. Preference for the „cash only‟ and „cash plus food‟ packages had respectively gone up to 35% and 52% of the sample households, while that for the „food only‟ option had dropped to 13%. There was no significant difference in relief aid preference patterns between CFTPP beneficiary households and non-beneficiary households.
21
Mhlanga, M.L. (May 2008) Cash and Food Transfers Pilot Project: Report of a Baseline Study, Table 5-1.
18
Figure 5 Beneficiary preferences for relief packages, baseline and final evaluation
Table 11 disaggregates preferences for different packages by package received. „Cash plus food‟ recipients exhibited the strongest preference for the package they had actually been given: four in five (82%) chose this option and only one in five (18%) preferred a different package. „Cash only‟ was preferred by two-thirds (66%) of people who had received „cash only‟, but almost one-third (29%) would have preferred „cash plus food‟. „Food only‟ recipients, on the other hand, were generally not satisfied with receiving full food rations: less than one in three (30%) would have chosen this package, but more than half (52%) favoured „cash plus food‟. Table 11 Preference for relief packages, by package received
Preferred Relief Package
Beneficiary Households Non-Benefi-ciaries
All Sample Households
CFTPP Baseline
Study Cash Only
Cash & Food
Food Only
All Beneficiaries
Cash Only 66 11 18 36 35 35 30
Cash & Food 29 82 52 52 51 52 41
Food Only 5 6 30 12 14 13 19
Other Package 0 1 0 0 0 0 10
All Packages 100 100 100 100 100 100 100
Source: CFTPP Household Survey, June 2008 and CFTPP Baseline Survey, December/January 2008
2.2.7 Conclusion
The minimum biological calorie intake that is allocated to beneficiary households as food aid in relief interventions is limited, because it does not address the various non-food needs of vulnerable households, such as groceries, health care and school fees. An allocation of cash transfers to the value of this biological minimum (i.e. equivalent to the food ration) forces cash recipients to choose between meeting their family‟s food needs in full, or sacrificing some food consumption in order to purchase non-food necessities. This finding calls for a re-examination of both traditional food rations and the level of cash transfers, with the aim of protecting household food security while also providing additional resources to meet basic non-food needs (Annex 3 proposes an „enhanced cash and food transfer‟ calculation, to address this consideration). The index-linking of cash transfers to food prices is essential for maintaining household food security during livelihoods crises. The value of cash transfers is rapidly eroded by general price inflation, and especially by food price inflation, since food forms a large proportion of the expenditure of poor households. (One definition of poverty is spending more than 60% of total income on food.)
19
There was a widely-held preference among beneficiaries for cash transfers over food rations, deriving from the fact that cash gives beneficiaries a broad choice of consumption items and basic necessities. Focus group discussions and key informant interviews confirmed that the possibility of investing some cash transfers in livelihood diversification made a significant difference to people‟s lives in all CFTPP target constituencies. However, the role of the food package in hedging against inflation remained a central concern, hence the popularity of the „cash plus food‟ combination. By meeting diversified household needs and providing some protection against inflation, the „cash plus food‟ package combines the main advantages of both the „cash only‟ and „food only‟ options.
2.3 Delivery mechanisms
2.3.1 Cash transfers
During the design stage, a number of delivery options for cash transfers were considered. These included direct payments to beneficiaries by World Vision staff, bank transfers to beneficiaries‟ accounts, issuing smart-cards to beneficiaries, and using the post office network of the Lesotho Postal Services. Direct payments were ruled out because of their demands on accountability, logistics and security. Bank transfers were also ruled out since banks are generally distantly located, and very few beneficiaries had bank accounts.
22 The smart-card system was not suitable
because it required too much time and money to establish. One mechanism that was considered close to ideal was „over the counter‟ disbursement through the Lesotho Postal Services (LPS). During the design stage, LPS was found to have the capacity to deliver cash to large numbers of beneficiaries. It was already delivering pensions to 78,000 people through 192 pay-points spread throughout the country. Most of its branches were easily accessible on foot or by public transport. Unfortunately, negotiations with LPS stalled at the end of November after a promising start, when the Ministry of Communications expressed doubts about the capacity of LPS to manage the CFTPP. So World Vision entered into an agreement with a private company, Group 4 Securicor (G4S), an international company that was already positioned as a contingency institution and had a proven track record in Lesotho in the management and handling of cash-in-transit. Figure 6 shows the flow of activities that preceded cash payments at a pay-point. Figure 6 The cash delivery flowchart
District Office
prepares
Distribution Plan
Commodity
Officer & Project
Manager approve
Distribution Plan
Accountant
requests Bank to
release money to
G4S
G4S collects
money from the
Bank
G4S packs the
money in
individual envelops
G4S transports
the money to Pay
Point
Accountant pays
insurance
START
CASH PAYMENTS
9
Diagram 2-5
The Cash Delivery Flowchart
22
The Baseline Study found that only 22% of rural households surveyed held bank accounts. Most of these were well-off households that would not have qualified for assistance under the CFTPP.
20
In the six months of project operation, G4S delivered cash transfers to 16 pay-points, 8 each in the Maseru and Mohale‟s Hoek districts, serving an average of 6,539 beneficiary households and delivering an average of M2.3 million per month. According to data from beneficiary households surveyed (Figure 7), 16% of cash recipients collected their cash transfers within walking distance as the pay-points were located in their own villages. However, 54% collected their cash transfers in the next village, a distance that could be 2-4 kilometres and could require either walking or the use of some means of transport. The last 30% collected their cash several villages away, a distance that could be 5 kilometres or more and required the use of a horse, donkey or public transport. Despite these distances, 77% of the cash beneficiary households usually walked to the pay-points. Only 20% regularly used public transport while 2% used either donkey or horseback. Less than 1% used either private vehicles or ox-/ donkey-/ horse-carts. In 55% of the cash beneficiary households, the cash transfers were usually collected by a female household head, while in 27% it was collected by a male household head. In 15% of the cash beneficiary households, the usual collector was a male member of the household who was not the household head, while in 3% of cases it was a female member who was also not the head. The fact that cash transfers were usually collected by females in 58% of the cash beneficiary households underlines the important role that women played in the project. Since vulnerability is more widespread among female-headed households, this could also be a pointer to the efficiency of CFTPP targeting mechanisms. This conclusion is reinforced by the fact that 76% of the cash collectors were household heads. Most of the cash beneficiaries (77%) usually walked to their pay-points to collect their transfers (Table 12). However, 20% used public transport while 2% used either donkeys or horses, 0.3% used private vehicles and 0.4% used ox-/ donkey-/ horse-carts. For those who walked or used donkeys, horses or ox-/ donkey-/ horse-carts, the average time taken on a single trip was over
one hour. Public transport cut travel time by almost 50% in most cases. Unfortunately, many villages, particularly in Mohale‟s Hoek District, were located outside public transport routes, leaving beneficiary households with very few options. Table 12 Mode of transport and average time to cash pay-point (one-way trip)
Mode of transport Number Using Percent Using Average time
(Minutes)
Walking 520 77.3 70
Public transport 134 19.9 37
Private motor car 2 0.3 50
Ox/donkey/horse cart 3 0.4 63
Horse/donkey 14 2.1 73
Total 673 100 63
Source: CFTPP Household Survey, June 2008
16%
30% 54%
Figure 7 Beneficiary households by location of cash
pay-point
In this village Several villages away In the next village
21
There were 4 pay-points in every constituency. Their location was mainly determined by security considerations for both CFTPP staff and cash beneficiaries. G4S was responsible for cash distribution to pay-points and provision of security at these pay-points. According to beneficiary surveys, security at the pay-points was generally good, with 68% of cash beneficiaries having found it good (Figure 8). Only 3% of beneficiary households complained about bad security. This might be because World Vision‟s concern with security compelled CFTPP staff to choose centrally located business centres where there were secure buildings, thus limiting the number and distribution of these pay-points. Several cash transfer beneficiaries were in turn compelled to travel long distances to collect their cash transfers. It can be seen that 60% of the beneficiary households found these pay-points to be too far although an almost equal percentage, 61% found them accessible, perhaps by public transport or on horse-/ donkey-back. The impact of distance also manifested itself in high travel costs for cash recipients, with 32% reporting journeys to the pay-points having been too costly. However, 42% of these cash transfer beneficiaries, perhaps those who had walked, did not find their journeys to pay-points too costly. From these findings, it can only be concluded that striking a balance between security concerns on the one hand, and access convenience for beneficiaries on the other, will always constrain cash transfer programmers in geographically challenging environments such as Lesotho. During each collection day, CFTPP staff announced the date and time for the next collection. At any pay-point, disbursement was not supposed to run beyond three hours, for security reasons. Cash beneficiaries therefore used to queue at their pay-points much earlier, a practice that exaggerated their actual queuing times. For the final collection (May 2008), reported queuing times tended to be bi-modal, with 24% of beneficiaries claiming to have queued for 30 minutes to 1 hour and 22% having queued for 2 to 3 hours (Table 13). These queuing times included time spent at the pay-point before the official time for CFTPP collections. However, the fact that 46% of the beneficiaries queued for more than 2 hours also indicates significant „opportunity costs‟ – loss of time that could have been utilised by beneficiaries in productive activities elsewhere. Table 13 Pay-point queuing time by beneficiary category
Queuing Time
Cash Only Beneficiaries
Cash & Food Beneficiaries
All Cash Transfers Beneficiaries
Number % Number % Number %
Less than 15 minutes 34 9 6 2 40 6
15-30 minutes 30 7 21 7 51 8
31 minutes – 1.0 hrs 86 22 75 27 161 24
1.1 hrs – 2.0 hrs 60 15 49 18 109 16
2.1 hrs – 3.0 hrs 97 24 51 18 148 22
3.1 hrs – 4.0 hrs 38 10 31 11 69 10
4.1 hrs and over 50 13 46 17 96 14
All times 395 100 279 100 674 100
Source: CFTPP Household Survey, June 2008
22
An assessment of service delivery at the cash pay-points (Figure 9) revealed that 77% to 93% of cash recipients were satisfied with the timeliness of service, queuing time, information dissemination, and the friendliness of staff. These high levels of satisfaction were reported by both „cash only‟ and „cash plus food‟ beneficiaries. However, less than half (43%) were satisfied with the project‟s complaints procedures, probably due to the fact that the Help Desk (discussed below) for dealing with beneficiary complaints only became operational after the project was well underway (see also Annex Table 21).
2.3.2 Food rations
The food component of the CFTPP was handled by the PRRO through the existing relief assistance distribution network. There were generally more distribution points in a constituency than pay-points. For example, there were 8 food distribution points in each of the Rothe and Mpharane constituencies as compared to 4 pay-points in each. As a result, the distances that food beneficiaries travelled to food distribution points would normally be shorter than for those who travelled to cash points. Figure 10 shows that for 30% of the food beneficiaries, the food distribution points were located within their own village, which is usually in walking distance. For 54% it was located in the next village, also walking distance but occasionally requiring the use of some means of transport. Only 12% of food beneficiaries reported their food distribution points to have been located several villages away, usually a distance of 5 kilometres or more that required the use of horses, donkeys or public transport. Since the distances to food distribution points were relatively shorter than those to cash transfer pay-points, more food beneficiaries walked to food distribution points than cash beneficiaries who walked to pay-points.
23
Table 14 shows that 79% of food recipients walked to distribution points to collect their rations, while 10% went on horse- or donkey-back and 8% used ox-/ donkey-/ horse-carts. Motor vehicles played a lesser role (only 2%). The average time taken on a single journey to a food distribution point was slightly over one hour. From the time taken for a single journey (one-way), it appears that public transport and equines were mainly used to access remotely located food distribution points. According to final evaluation survey data, 70% of the food beneficiaries found the food distribution points easily accessible while 30% found them too far (Figure 11). This positive finding is not surprising, considering that most distribution points were located in recipients own village or in neighbouring communities. On the other hand, since most food recipients walked to these distribution points, only 6% complained that they were costly to reach. Security was also reported to be adequate, with 50% of food beneficiaries stating that security arrangements at their food distribution points were good.
23
This observation was also made in the CFTPP monthly monitoring report of December 2007.
Figure 9
Beneficiaries' satisfaction with cash delivery
43%
77%
77%
81%
93%
30% 50% 70% 90%
Complaints Procedure
Timeliness of Service
Queuing Time
Information Dissemination
Friendliness of Staff
23
Table 14 Mode of transport and average time to food distribution point (one-way trip)
Mode of transport Number Using Percent Using Average time
(Minutes)
Walking 439 79.1 63
Public transport 8 1.4 42
Private motor car 4 0.7 25
Ox/donkey/horse cart 46 8.3 76
Horse/donkey 53 9.5 70
Other 5 0.9 32
Total 555 100 64
Source: CFTPP Household Survey, June 2008
Queuing problems that were experienced at cash pay-points were also experienced at food distribution points, but seem to have been largely confined to „cash plus food‟ constituencies rather than „food only‟ constituencies. On average, 36% of food beneficiaries queued for less than 1 hour, but this constituted 42% of „food only‟ beneficiaries and 29% of „cash plus food‟ beneficiaries. Conversely, food collectors who queued for more than 2 hours comprised 53% of „cash plus food‟ households and 41% of „food only‟ households. An evaluation of food distribution points by beneficiary household heads seems to have been a mirror image of that of cash distribution points. However, food beneficiary household heads who reported that their complaints were attended to (30%) were fewer than cash beneficiary households who complained (43%). Slightly more food beneficiary household heads reported long queues at CFTPP (i.e. „food plus cash‟) food distribution points than at PRRO (i.e. „food only‟) food distribution points (20% versus 16%). Food beneficiary household heads were overwhelmingly satisfied with the timeliness of service and information dissemination at the distribution centres. Like cash beneficiaries, 93% were very satisfied with the friendliness of project staff. Moreover, the verification process at distribution points seems to have gone smoothly, and reports of corruption were almost non-existent (see Annex Table 22).
2.4 The ‘Community Help Desk’ The mobile Community Help Desk was conceived in the early days of project design as a channel through which beneficiaries could raise complaints and concerns about the project. However, only in January 2008 were concrete steps taken to set up this structure, whose main function was to deal with complaints at every cash pay-point and food distribution centre. Until full-time staff were recruited to run the Community Help Desk in March, the project did not have a clear structure and procedures to process complaints and provide feedback to communities. It was not until April that the three officers who constituted the complaints mechanism became fully operational, with clear terms of reference and operational procedures. In the few months that the complaints mechanism was operational, 38 households registered complaints with the Help Desk. This represented a mere 0.4% of beneficiary households, though some complainants were non-beneficiaries asking why they had been excluded. In its logbook,
24
the Help Desk officer recorded the date and classification of the complaint, the reference number, details of the complaint, solution to the complaint, and the date of the response. Figure 12 reveals that 45% of complaints related to „entitlements‟, mainly cases where people wanted to know why they or their communities were excluded from the project. Other entitlement complaints related to the alleged inadequacy or miscalculation of food rations or cash transfers. A further 29% of complaints related to registration and 26% to „corruption‟. Registration complaints were dominated by beneficiary verification and database inconsistencies between the database and information on the card. „Corruption‟ complaints mainly related to accusations of nepotism during beneficiary registration, or allegations that some household members were excluded. Despite its late start, the Community Help Desk seems to have worked effectively, dealing with most complaints within a space of just 4 days. In fact, 44% of complaints, most of these dealing with registration (inclusion or exclusion, and household size queries), were dealt with on the same day. Most of the „corruption‟ and „entitlement‟ cases involved domestic conflicts, and tended to take longer. However, amicable solutions were often found with the intervention of local chiefs as well as the Community Help Desk. Interestingly, most complaints related to cash transfers rather than to food rations. Unfortunately, the CFTPP complaints resolution mechanism was rated low by beneficiaries of all relief assistance categories, mainly due to the late start of the Community Help Desk. Because project management failed to attend expeditiously to this important function, it was introduced belatedly and appeared to beneficiaries as an add-on or afterthought.
2.5 Complementary activities Although World Vision decided against cash-for-work in favour of cash grants, it advocated for complementary activities where beneficiaries would receive guidance and materials to support their livelihoods. Most of the areas that were covered by the CFTPP were already covered by the C-SAFE project, whose main activity was the promotion of keyhole gardens. The evaluation team observed several of these gardens, most of which had impressive green vegetables. Given the short timeframe, limited resources and positive evaluation of C-SAFE project activities, CFTPP management decided to concentrate on the humanitarian assistance function addressed by CFTPP. However, during the evaluation, the project was distributing garden tools as part of its drive to encourage communities to establish keyhole gardens. The project also disseminated information on these gardens, and on nutrition
and HIV/AIDS, during cash and food distribution days. Being a short-term humanitarian project, the CFTPP did not have an exit strategy. However, beneficiaries were always reminded of the timeframe during each distribution day. There were also many other initiatives that were operating in the project areas. Among these were:
Keyhole Garden in the KoroKoro Constituency
25
The Ministry of Forestry and Land Reclamation has a cash-for-work relief programme, which is running in every constituency in Lesotho through to March 2009. It involves land protection and reclamation through tree planting, trench digging, construction of stone lines and grassing. The programme identifies two areas for its activities in each constituency, and engages 50 people per area (i.e. 100 people per constituency) on a rotational basis for 20 working days, at a remuneration of M974.80 per month. However, despite its positive impact on poverty and unemployment, this programme‟s impact on the most vulnerable (particularly the elderly, the disabled, and the sick) is doubtful.
The Ministry of Health and Social Welfare social net – this intervention introduced free curative and counselling services at all health centres from February 2008 up to March 2009. There is no doubt that this intervention will impact positively on the most vulnerable, particularly the sick, the elderly, and orphans.
Although the CFTPP came to a logical end when with the new harvest in April/May 2008, the 2007/08 crop failure in the project areas was said to be as bad as that of 2006/07. In most of the constituencies that were covered, rainfall is reported to have delayed, leading to delayed farming operations. When the rains came in January and February, they gave little opportunity for farming operations. A lot of fields remained fallow, while most crops failed to reach full maturity, leading to very poor harvests for many. The winding up of CFTPP assistance, therefore, represented a serious threat to household food security for many vulnerable families in the target areas.
2.6 Monitoring and evaluation systems The CFTPP Design Document was not very specific on the indicators that were supposed to be monitored. The only indicator that was explicitly stated was the percent of the cash transfer that was spent on food. However, monitoring of expenditure patterns at the household level only started in March. On the other hand, the Design Document did provide elaborate guidelines on the development of monitoring tools for cash transfer projects. These guidelines were closely followed by the monitoring and evaluation (M&E) section in developing the CFTPP monitoring tools in the first few months of project implementation. The monitoring activities of the M&E Section of the project included the following activities:
On-site distribution monitoring: the main objective was to assess the level of beneficiary
satisfaction and perceptions about service delivery. By sampling at pay-points, the activity gathered data on household size, gender composition of collectors, travel time, modes of transport used, information disseminated, queuing time, preferred type of relief assistance, and complaints handling.
Post-distribution monitoring: testing targeting criteria on samples of beneficiaries in
order to determine the levels of inclusion errors, determination of the utilisation of cash transfers, and examination of trends in coping strategies.
Market-based food security monitoring: liaison with the Ministry of Agriculture on food production initiatives, liaison with the Ministry of Trade and Industries on subsidies on basic commodities, and monitoring of the availability of basic commodities in food markets in the project areas.
Food basket price monitoring: the monitoring of movements in the prices of cereals,
cooking oil and pulses in order to determine changes in the value of the PRRO ration and make the necessary adjustments in the value of the cash transfer.
Other monitoring: monitoring of macro-economic trends, including trends in the consumer price indices, monitoring of the crime rate and general security situation in the project areas, and documenting community complaints and lessons learnt.
26
In addition to these monitoring activities, World Vision‟s M&E section carried out limited research involving various relief assistance options and related anti-social practices, and appropriate delivery mechanisms. It also coordinated research on the gender impacts and human resource requirements of cash transfers. Beginning in January 2008, most of the actionable recommendations of the M&E section found their way into the „action‟ columns of the monthly management reports. Among these, some of the more notable actions included the following:
a continuous investigation of inclusion errors, after the testing of targeting criteria found the existence of such errors;
rectification of under-registered households, following a revelation that average household sizes were much lower than baseline averages;
increased security awareness at collection sites, after revelations that 74% of the collectors were females;
improvement of information about entitlements at collection sites, after it emerged that 83% of the beneficiaries did not know their entitlements;
improvement of distribution timetables to enable field coordinators to improve service delivery, after it emerged that 35% of beneficiaries had queued for over 3 hours;
the setting up of a Help Desk, after it emerged that 70% of the beneficiaries were not aware of channels to be followed to raise concerns about the project; and
a revision of the transfer value in April (from M80 to M100 for a full cash transfer and from M40 to M50 for a half cash transfer) in order to mitigate the impacts of inflation, after it emerged that the cost of the PRRO ration had increased by 25%, plus a M10 increment to cover costs of transport to pay-points.
Despite a slow start and limited human resources, it is the consultants‟ opinion that the M&E function made a commendable input into both project organisation and service delivery. On the other hand, there were constraints, mostly related to resource constraints that led to the failure of the M&E function to track or interpret changes in specific variables accurately, on a month to month basis. For instance, M&E staff changed sampling frames for data collection, by shifting to different geographical locations in order to achieve a wider coverage. This resulted in fluctuations in the values of several observed variables that were not necessarily related to project impacts. This was all the more so given that there was an over-reliance on quantitative data gathering at the expense of simpler but more effective qualitative approaches. Similarly, the M&E function should have discovered early on that price changes in the project areas were directly influenced by wholesale price changes and not by the cash transfers, and this information should have been used to adjust cash transfer levels more regularly. (The reason why this was not done is that a rise in cash payments was supposed to be triggered when prices increased by more than 10%, which never occurred within a single month – but it did occur cumulatively over several months.) This example of a gap between information and action raises questions about why these price data were collected if they were not used to modify project design. On the whole, however, the M&E function proved to be an invaluable management tool, even for this short-term humanitarian cash transfer programme.
2.7 Project cost-effectiveness The concept of cost-effectiveness implies comparison between two alternative approaches. In the context of the current evaluation this would involve comparing cash transfers with food transfers. The cash transfer component of the CFTPP was a well implemented, intensively managed and closely monitored small-scale pilot project. On the other hand, the food component was part of a large-scale food aid programme that was supported by the World Food Programme, and WFP
27
purchases food in bulk or receives it free of charge or at heavily subsidised prices. Under these conditions, comparative cost analysis did not only prove to be difficult but could not establish with certainty the merits of one intervention over the other. In the six months ending May 2008, the CFTPP spent US$2.3 million, or 75% of the project‟s budgeted funds, reaching 29,366 beneficiaries in 6,539 households (Table 15). This translated to an average cost of US$78.46 per beneficiary or US$352.35 per household over the six-months. Although the budget anticipated management (administration) costs to be contained at 4.2% of the total project costs, this was slightly exceeded, eventually totalling 5.5%. However, there was under-expenditure on every budget line, enabling the project to increase the relative share of programme implementation from the anticipated 65% to 75%. The savings across all budget lines reflected unanticipated exchange rate fluctuations during project implementation. For example, the initial project budget was based on 6.75 Maloti per US$ 1 in October 2007, but by June 2008 the Lesotho currency had appreciated to 7.86 Maloti to the dollar. Table 15 CFTPP budget and actual expenditures, December 2007 to May 2008
Activity Budget Actual Expenditure
Maloti (000’s) Percent Maloti (000’s) Percent
Feasibility studies 82.2 2.7 31.9 1.4
Program design 27.0 0.9 20.5 0.9
Program implementation 1,991.2 64.5 1,733.5 75.3
Administration 130.6 4.2 126.6 5.5
Monitoring and Evaluation 218.0 7.1 49.5 2.1
Equipment and vehicles 139.8 4.5 129.8 5.6
Staff costs 309.9 10.0 201.2 8.7
Other Costs 187.3 6.1 10.8 0.5
Total 3,085.8 100.0 2,303.8 100.0
Source: Cash and Food Transfers Pilot Project, Financial Report, May 2008
From the point of view of CFTPP beneficiaries, collecting food cost slightly more (M9.35), on average, than collecting cash (M6.78) (Table 16). These expenses included child care, transport, food and drinks, accommodation, and messenger costs. But cash recipients were more likely to spend money on collecting their cash (35%) than were food recipients (22%), partly because some cash recipients had to pay for child care and overnight accommodation (for those who had long distances to travel), and partly because the receipt of cash allowed more cash recipients to buy food and drinks at pay-points. „Messenger costs‟ were higher for food collection because messengers were often hired to collect food packages and carry them home. Table 16 Average costs of collecting cash and food transfers
Collection Cost Item
Cash Collection Food Collection
Households Incurring
Average Cost (M)
Households Incurring
Average Cost (M)
Child care 15 (2.2%) 2.07 2 (0.4%) 4.00
Transport 74 (11.0%) 7.30 85 (15.3%) 9.75
Food and drinks 164 (24.3%) 5.84 37 (6.7%) 7.28
Accommodation 9 (1.3%) 1.78 0 (0.0%) 0.00
Messenger costs 11 (1.6%) 1.09 6 (1.1%) 6.33
Other 5 (0.7%) 4.60 1 (0.2%) 6.00
All costs 233 (34.6%) 6.78 123 (22.2%) 9.35
Source: CFTPP Household Survey, June 2008
28
2.8 Conclusion Cash transfers are generally more demanding than food transfers in terms of security concerns, especially when „pull‟ mechanisms are involved that concentrate large numbers of beneficiaries at pay-points served by mobile cash-in-transit vehicles. Alternatively, „push‟ mechanisms, such as transferring cash entitlements electronically to post offices or bank accounts for beneficiaries to withdraw at their convenience, would circumvent some of these security problems and reduce queuing times. These options should be considered for future cash transfer disbursement in Lesotho and elsewhere, though they do require the cooperation of banks or post offices, and beneficiaries need to have bank accounts or familiarity with using post office facilities. CFTPP service delivery was rated highly favourably at both cash and food distribution points. Cash recipients had further to travel and usually queued for longer than did food recipients, but security was good and project staff were generally assessed as helpful and friendly by both cash and food recipients. However, this study has shown that future programmes need to pay more attention to establishing independent, accessible and efficient complaints resolution mechanisms from the outset. Involving community leaders at in the resolution of complaints also seems to have a positive effect. The CFTPP cost structure seems to suggest that the project could easily be replicated at larger scale, although issues of security would need to be looked into very carefully. A similar initiative, the government‟s social pension scheme, is operating nationwide though with a simpler targeting procedure. The CFTPP experience has shown that cash transfers can be delivered at reasonable cost, with administrative efficiency that is higher than food aid interventions and convenience for beneficiaries that could also be comparable if local markets are functioning well.
29
Chapter 3 Impact Evaluation This chapter examines various impacts of the Cash and Food Transfers Pilot Project on recipient households and communities, starting with a breakdown of how cash transfers were spent and how food transfers were utilised, including sharing of food and „anti-social‟ uses of cash. Next we consider project impacts on household-level vulnerability and food insecurity, adoption of coping strategies, assets and livelihoods, borrowing and saving behaviour. This is followed by a focus on markets (prices and trade), children, and communities (positive and negative social impacts).
3.1 Use of cash and food transfers
3.1.1 Spending of cash transfers
Because the CFTPP was a response to a humanitarian crisis in Lesotho, the expectation was that the cash transfers would be spent mainly on meeting the recipients‟ basic needs, especially food, and that all the food transfers would be consumed by the recipients‟ families. If this was not the case (e.g. if the cash was spent on luxury consumption), it would imply that the transfers were not really needed, or that recipients were mis-targeted. Data from the evaluation survey confirmed that the cash and food transfers were largely used as intended, so the humanitarian objective was satisfactorily achieved. Almost all „cash only‟ recipients (94%) spent some of their cash transfers on buying staple food (mainly maize or maize-meal), and two-thirds of „cash only‟ and „cash plus food‟ recipients (69%) also bought other food (beans, vegetables, meat, etc) (Figure 13). Some „cash only‟ recipients spent all their transfers on food. (“There is nothing else that we can buy except food.”
i)
Only two-thirds of „cash plus food‟ recipients (66%) bought staple food, probably because their half food rations were sufficient to bridge the food gap in the remaining one-third of households, releasing the cash to meet other priorities (including other food items). Three-quarters of both categories of recipients (73%) bought groceries (paraffin, soap, etc). (“We added maize-meal and bought candles, paraffin with the remaining cash.”
ii)
Figure 13 Utilisation of cash transfers (% of cash recipient households)
94.4
45.6
38.0
28.0
19.5
13.6
5.7
67.8
6.8
15.9
39.0
70.6
76.3
15.8
17.921.9
30.8
39.4
69.9
66.3
0
20
40
60
80
100
Staple
food
Groceries Other food Clothing Education Health Farm
inputs
Burial
society
Durable
goods
Alcohol &
cigarettes
Cash only
Cash & Food
30
After food and groceries, the most popular uses for cash transfers were clothing (43% of all cash recipients), education costs (36%) and health care (31%). Significant numbers of households also invested some of this cash on agricultural inputs such as fertiliser or farm tools (23%), payments to burial societies (18%), and buying durable consumer goods such as a radio (15%). Less than one in ten recipients wasted some of the money on „anti-social‟ spending such as alcohol and cigarettes (6%). Smaller numbers of households (<5%) spent some of their cash transfers on house construction or repairs (4%), investment in business (3%), purchasing livestock (2%), lending money to others (2%), and savings (0.7%) (see Annex Table 23). This ranking of spending priorities is familiar from cash transfer programmes in many other countries: food comes first, followed by other basic needs (groceries, clothing, education, health, burial society, housing), then investment in livelihoods (farming, business), asset accumulation (durable goods, livestock), and extravagant spending (alcohol, cigarettes). The evaluation survey also asked cash recipients to estimate how much of their cash transfers they spent on these different expenditure categories in the last month. As expected, the largest single item was staple food, with „cash only‟ recipients spending 177 Maloti out of a total of 450 Maloti received (39% of monthly cash transfer income), almost three times more than spending on staple food by „cash plus food‟ recipients, at 66 Maloti from 238 Maloti received (28% of total). Two factors explain this difference: first, „cash plus food‟ recipients needed to spend less on food because they also received a half ration of maize; second, „cash plus food‟ households were only given half the amount of cash that „cash only‟ households received (a total of 1,116 Maloti over six months, compared to 2,298 Maloti given to „cash only‟ recipients (Annex Table 24). In some other spending areas where in-kind assistance was not provided, the gap between the two groups of beneficiaries was much narrower. On household groceries, for instance, the needs of an average household are very similar, and „cash only‟ recipients spent only 9 Maloti more than „cash plus food‟ recipients (60 Maloti versus 51 Maloti). However, the pure cash transfer clearly enabled these recipients to allocate more money to a wide range of urgent needs, with spending on education, clothing, health, consumer durables and burial society payments all close to double the spending of „cash plus food‟ recipients (Figure 14). Apart from food and groceries, however, only education was allocated more than 10% of total cash transfer spending, followed by clothing on 9%. Spending on all other categories averaged less than 5% of total cash transfers received. Figure 14 Spending of cash transfers (Maloti)
47.99
17.61
10.70 8.71
60.07
41.74
66.17
177.20
66.01
39.73
26.3321.36
7.955.87 4.67
51.46
0
20
40
60
80
100
120
140
160
180
Staple
food
Groceries Other
food
Education Clothing Health Durables Burial
society
Cash only
Cash & Food
+ 16
8%
+ 17
%
+ 67
%
+ 82
%
+ 95
%
+122
%
+82
%+87
%
31
Other minor spending categories (averaging <5 Maloti across all cash recipients) include housing construction or repair, investment in business (3%), livestock purchase (2%), lending to others (2%) and saving (0.7%).(not shown in Figure 14; see Annex Table 24). None of these non-food needs can be met with food transfers, although it is true that food transfers release household resources that would otherwise need to be spent on buying food. Decisions about utilisation of cash transfers varied between male-dominated, female-dominated, and joint decision-making. (See Slater and Mphale (2008) for further analysis of gender issues in the CFTPP.) Even in male-headed households, women often controlled the cash transfers, especially when they collected the cash. But sometimes women faced pressure from their husbands to share.
“It is known that the wife keeps the cash”iii
“The wives mostly keep the cash and spend it for the benefit of the family.”iv
“I used to give my husband his share simply to avoid disagreement.”v
Sometimes the male household head controlled the cash (“I keep the cash, and then my wife has to ask for it if she wants to buy something and I give her the amount she wants.”
vi)
In many cases the allocation of cash transfers was seen as a matter for joint decision-making involving the husband and wife, or occasionally the whole family.
“The person who keeps the money is the husband but in terms of spending, we decide together with our wives.”
vii
“We plan together as to which needs should be prioritised.”viii
“Everyone in the household has their own separate needs, so that is why we sit as a family to decide and compromise on the very essential needs for the whole family.”
ix
In households that received both cash and food, control over these resources was often split, with women controlling the food and men controlling the cash. (“The wife as the cook was deciding the usage of food, but both husband and wife sat down and planned the cash.”
x)
3.1.2 Use of food transfers
Utilisation of food transfers was more straightforward than utilisation of cash transfers, probably because the range of options was much more limited. There were no significant differences in the utilisation of food transfers between „food only‟ and „cash plus food‟ recipients. Three in four recipients of food transfers (76%) ate all the food they received from the CFTPP. (“We did not do anything except eat it. How can we do anything else? Believe me we are hungry!”
xi) One in five
food recipients (21%) gave away some of their food to others and ate the rest (a discussion of food sharing behaviour follows below). Just three food recipients in our survey (0.5%) bartered some food for other food, and only one recipient (0.2%) sold any food, but only to buy other food items (see Annex Table 25). No food transfers were sold to meet non-food needs. (“How can we sell when we are so hungry? Money has its own teeth and can be easily used up.”
xii) Finally, small quantities of beans and peas were
used as seeds for planting. (“We sometimes use the peas and beans as seeds so that we can have something to harvest at a later stage”;
xiii “We only planted some and ate the rest.”
xiv)
Decisions about utilisation of food transfers were most often taken by women, because of their responsibilities for providing the family meals:
“Our wives are the ones who look after the food since they are responsible for cooking.”xv
“It is the wife because she is the cook of the family. Men only eat!”xvi
32
“Men want to look after food though they do not want to collect it. When they arrive at home, they want food not knowing who prepared it let alone collect it from the distribution point. He might assault you if you do not give him food.”
xvii)
3.1.3 Sharing of cash and food transfers
Food sharing was common in many households that received food transfers. (“We shared food with others when we were still getting food aid.”
xviii) Food recipients reported sharing food
transfers with people who did not receive any aid. Several reasons for sharing food transfers were mentioned, which can be summarised as altruism, affinity (sharing was mainly restricted to relatives), tradition, social capital (maintaining social relations through reciprocity), and exclusion error (supporting non-beneficiaries). Altruism
“I help my neighbours with food because of compassion. „Love your neighbour as you love yourself‟.”
xix
“We can not ignore our sisters and brothers since we are all hungry.”xx
“Some people are very, very hungry so we give but we do not sell the food.”xxi
“How can we let them starve!”
Affinity
“We would only give to our family members who are hungry too.”xxii
“We sometimes gave 5kg of maize-meal, especially to our neighbours and relatives, because they always come back for more.”
xxiii
Tradition
“We share food with our neighbours. It is culture.”xxiv
“We do help those in need, not only because we feel sorry for them but it is the way we live. It is our norm to help others.”
xxv
Social capital
“We know that sometimes the food runs out and we have to ask from others. So when we receive aid we give something to the neighbours and relatives.”
xxvi
“There is harmony in this village and we always give out, especially the food.”xxvii
Exclusion error
A final reason for sharing food was a widely-shared perception that the CFTPP did not reach everyone in need, and that an arbitrary cut-off rule had excluded many people who badly needed social assistance. Sharing of food transfers within communities was a way of correcting for this under-coverage.
“We do share with other people, because they are poor and have been left out.”xxviii
“We gave food to non-beneficiaries. We sometimes gave them a basin of maize-meal.”xxix
“We share food because we are all hungry. Every time after we get food we give them.”xxx
“We give them food because they are poor like us.”xxxi
“We are being helped so we have to help others who are needy.”xxxii
Sharing of cash transfers was unusual – much more uncommon than sharing food. (“We never share cash; rather we share food because we only cater for our needs. Immediately after receiving cash we buy food and other household needs so when we get home we no longer have cash to share with others.”
xxxiii) This finding is common from other cash and food transfer
33
programmes – food sharing is normal but „cash sharing‟ is not. (“We do not share cash with others because it is quite a small amount.”
xxxiv)
When cash was donated it was often for specific purposes. (“With cash, it is rare. For example; if my neighbour tells me that they need to go to hospital.”
xxxv “With money it is very difficult but we
give a little to some to buy paraffin.”xxxvi
) Instead of sharing their cash transfers, several cash recipients bought food and shared this food with others.
“We rather buy food first and then share with others. Not the cash!”xxxvii
“We do not share cash but the food we buy with the cash we received.”xxxviii
“I only share food but not cash. Rather I would give somebody something I have bought with the cash.”
xxxix
Alternatively, instead of giving cash for free, some people „assisted‟ each other with soft loans.
“People do not share. They only assist.”
“We only lend to people and do not really expect anything since our neighbours are poor and have nowhere to take from.”
“People lend their money to others but without interest.”
“We lend it to our neighbours but the intention is not to get something but we do so with the knowledge that we might need their help in future”.
xl
“When we help people we do not expect them to return the money with interest.”xli
3.1.4 Anti-social uses of cash transfers
Any discussion of „anti-social‟ uses of cash transfers is complicated, both because an element of judgementalism is involved and because it is impossible to quantify the extent of such „misuse‟. Clearly there were cases where cash was wasted instead of being used to meet the basic needs of the family, but the available evidence suggests that this was sporadic rather than systematic. (“Generally, it does not happen a lot, only in rare and discreet cases.”) Cash recipients admitted to spending approximately 6% of their cash transfers on cigarettes and alcohol (as noted above), which is not very high but probably understates the actual figure to a certain extent. One form of anti-social behaviour was men spending the cash transfers on other women, but even anecdotal evidence for this is very limited. (“In some cases money is spent on women but it happens in a very secretive manner.”
xlii) However, the most common form of „irresponsible‟
spending of cash transfers was on alcohol. (“We heard of such stories where money did not even reach the family members. All the money was wasted on drinking.”
xliii “There were stories about
people wasting money on beer.”xliv
) Interestingly, in several cases where cash transfers were wasted on alcohol, action was taken to rectify this, either by relatives or by local leaders – or even by the cash recipients themselves.
“Children complained to the help desk about their mother who wasted money on alcohol and did not take care of the family.”
xlv
“In other places children demanded their shares because parents took all the money and used it all up on alcohol.”
xlvi
“With cash it happened that there was a person who did not take the money home, but used it for other purposes. The chief and the council intervened in such cases.”
xlvii
“I now send my wife to collect the cash because she does not drink. I used to spend on alcohol.”
xlviii
34
3.2 Vulnerability and food insecurity Perhaps the most important indicator of success of the CFTPP was whether it reduced hunger in beneficiary households. The figures for self-reported hunger over the six months of the CFTPP provide a great deal of important information about the impact of the intervention. Firstly, the prevalence of hunger at the start of the intervention, in December 2007, was higher for CFTPP beneficiaries (averaging 29%) than for non-beneficiaries (20%). Hunger in „cash plus food‟ households (at 41%) was double that in non-beneficiary households. This suggests that the project was relatively well targeted on households where food insecurity was concentrated (Figure 15; see also Annex Table 26). Secondly, looking at trends in hunger over the six months, there is a striking divergence between non-beneficiaries and all beneficiary categories. Hunger in beneficiary households fell steadily over the project period (to 16% by May 2008), which could be attributed to the cash and food transfers. Conversely, hunger among non-beneficiaries rose sharply, to 40% in January and 46% in March, before falling back to 40% by May 2008, still double the level just six months earlier. This suggests that many households that were excluded from the project could legitimately have been included. Summarising this evidence, CFTPP beneficiaries were more food insecure than non-beneficiaries when the project started, but significantly less food insecure when the project ended. The cash and food transfers apparently contained and reduced hunger in recipient households, while levels of hunger escalated in households that did not receive cash or food transfers. Figure 15 Self-reported hunger in Lesotho, 2007-08
40.4
17.6
21.2
16.5
20.0
24.7
28.2
11.8
18.1
15.5
12.5
26.4
17.4
26.7
21.8
15.8 15.8
17.8
40.6
45.746.2
41.039.9
20.1
0
10
20
30
40
50
Dec-07 Jan-08 Feb-08 Mar-08 Apr-08 May-08
Cash only
Food only
Cash & Food
Non-Bens
The final evaluation survey asked respondents to list all the food items eaten by their households during the previous seven days, to assess the extent of dietary diversity (a robust proxy for food security status). Not surprisingly, staple grains were consumed in almost all households (98%), but smaller proportions consumed other types of food (Table 17). Most households (92%) ate green leafy vegetables with their staple grain as the main meal of the day. Two-thirds (68%) also ate pulses such as beans, but less than half (42%) had eaten meat in the previous week, one in five (19%) had consumed dairy products and only one in ten (11%) had eaten any fruit.
35
Comparing dietary diversity across household categories is illuminating. Since „food only‟ and „cash plus food‟ households received food parcels that included a staple grain, a pulse and cooking oil, it is not surprising that higher proportions of these households consumed these food categories than did „cash only‟ households and non-beneficiaries. The case of pulses is striking: 97% of „food only‟ and 92% of „cash plus food‟ households consumed pulses, compared to 53% of „cash only‟ but just 34% of non-beneficiaries. In the sense that food aid „forces‟ recipients to adopt a certain diet that includes proteins and fats as well as carbohydrates, food transfers clearly succeeded. Conversely, „cash only‟ recipients did not always use their cash transfers to buy the basket of commodities that was provided as food rations to other households. In other food categories, the differences across groups of CFTPP households are less significant. However, „cash only‟ recipients were more likely to consume meat, dairy products and beverages than „food only‟ recipients, confirming that cash transfers allowed recipients to exercise choice and acquire a wider range of commodities than was available to food aid recipients. Table 17 Food categories consumed in previous 7 days
A final point of comparison is with non-beneficiary households. Recalling that their exclusion from the CFTPP and food aid programmes was due to their being assessed as less vulnerable than cash and food recipients, it is striking that non-beneficiaries consumed less diverse diets than „all beneficiaries‟ combined at the end of the intervention period. This disparity is most pronounced for those commodities provided as food rations (grains, pulses and oils), but also applies to meat and vegetables. Interestingly, „cash only‟ beneficiaries also enjoyed greater dietary diversity than non-beneficiaries. These are important findings, because they confirm that both cash and food recipients achieved a substantial degree of food security through cash and/or food transfers, and that all categories of beneficiary households actually ended the programme period better off than many families that were excluded from receiving assistance.
3.3 Coping strategies People facing a livelihood shock adopt a range of behavioural responses or „coping strategies‟ to protect their subsistence food consumption, or to adjust to restricted access to food. Naturally, these strategies are dominated by efforts to acquire food from various sources, but they also include austerity measures (to conserve scarce resources), and changes in diet. A total of more than 20 coping strategies – either dietary adjustments or economic adjustments (cutting spending and raising cash for food) – were recorded in our survey (see also Annex Table 27).
36
Rationed food consumption:
1. Limited food portions at meal times
2. Reduced number of meals per day
3. Skipped an entire day without a meal
Changed diet:
4. Ate cheaper or less preferred foods
5. Gathered unusual wild foods
6. Harvested immature crops
Cut spending:
7. Household members ate elsewhere
8. Removed children from school
9. Sent children to stay with relatives
10. Reduced spending on non-food items
Raised cash for food:
11. Borrowed food from friends or relatives
12. Borrowed cash from friends or relatives
13. Purchased or borrowed food on credit
14. Relied on casual labour for food or cash
15. Started a new business enterprise
16. Sold livestock to buy food
17. Sold other assets to buy food
18. Household members begged for food
19. Sent children to work for cash or food
20. Family members migrated to find work
21. Sold or rented out land to buy food
22. Sold marijuana crop to buy food
Coping strategies are not adopted lightly, nor at random. The sequence in which strategies are adopted reflects both their effectiveness and their cost to the household. Costs can be economic (e.g. asset disposal for food), nutritional (e.g. rationing food), or even social (e.g. loss of social status due to begging). Strategies that cost little and are easily reversible (e.g. mild rationing of consumption, or gathering wild foods) are adopted before strategies that involve heavy losses to the household and cannot be easily reversed (e.g. selling key productive assets, or renting out farmland). This decision-making process is reflected in the proportion of households adopting each strategy (Figure 16). The most commonly adopted strategy by our sampled households was borrowing food (44% of all households), or cash to buy food (19%). Borrowing can range from zero-interest „soft loans‟ from friends or relatives (which will be sought first) to high interest loans at usurious interest rates from professional moneylenders (which will be taken reluctantly, after other sources of loans have been exhausted). Borrowing was followed by three dietary adjustments – gathering wild foods (36%), rationing food consumption (26%) and harvested green maize (30%) – which have low to zero cost and are easily reversed, unless stringent rationing results in severe malnutrition. Figure 16 Coping strategies adopted, March-May 2008
2.9
3.6
2.2
1.8
2.9
8.3
1.4
3.3
24.3
18.8
27.5
38.4
1.8
6.6
4.6
3.8
5.1
7.8
2.3
2.5
29.4
23.0
36.2
38.7
0.8
5.5
14.8
16.9
16.9
20.3
32.6
35.6
31.4
42.4
41.5
67.4
0 10 20 30 40 50 60 70
Sold or rented out land
Migrated for work
Sent children to relatives
Sent children to work
Took children out of school
Cut non‑ food spending
Sold livestock or assets
Begged for food
Harvested green maize
Rationed food consumption
Gathered wild foods
Borrowed food or cash
Non-Bens
Cash only
Food only
37
Apart from borrowing, several other ways of raising cash to buy food were adopted, including selling livestock and other assets (16% of all households), sending children out to work (6%), migrating to look for work (5%), and renting out land (2%). The last three strategies were adopted by relatively few households because they are more drastic – losing farmland, in particular, is extremely damaging to farm-based livelihoods so would only be adopted as a last resort, if the alternative is starvation. Several coping strategies involved children: 6% of families withdrew their children from school temporarily, either sending them to relatives for the duration of the food crisis (thereby saving on education expenses and costs of feeding the child) or sending them out to work (to raise money to bridge the family‟s food deficit). While recognising the desperation that drives parents to take these difficult decisions, this raises concerns both about child labour and the implications for the education („human capital formation‟) and future livelihood prospects of the children involved. Comparing coping strategy adoption rates by beneficiaries and non-beneficiaries is instructive because it provides evidence about the effectiveness of the CFTPP intervention. Inspection of Figure reveals that non-beneficiaries were more likely to adopt virtually every single coping strategy displayed, often 2-3 times more likely. For instance, two-thirds of non-beneficiaries borrowed food or cash, compared to just over one-third of cash and food recipients; over 40% of non-beneficiaries rationed food consumption compared to about 20% of cash and food recipients; and 15-17% of non-beneficiaries withdrew their children from school and sent them to work or to relatives, while only 2-5% of cash and food recipients did any of these. The biggest gap was in asset sales and begging: approximately one-third of non-beneficiaries sold livestock and/or other assets, and „begged‟ others for food, but negligible numbers of cash and food recipients (1-3%) were forced to adopt these measures. The gap was much narrower for gathering wild foods and harvesting green maize, both of which are low cost strategies that were under the control of the household and did not require disposing of assets or approaching others for help (gifts, loans, work, or child-care). These differential adoption rates demonstrate convincingly that the CFTPP protected beneficiary households effectively against hunger (lower rates of self-imposed food rationing), asset disposal (fewer „distress sales‟ of assets), austerity measures (less cutting of non-food spending), adverse impacts on children (withdrawal from school, child labour), and dependence on others (almost no begging for help). Asking friends and neighbours for assistance („begging‟) during a crisis might not seem to incur any economic cost (unlike asset disposal, or taking interest-bearing loans), or any nutritional cost (unlike rationing), but loss of dignity, self-respect and social status amounts to depletion of social capital, and can be just as serious for families in close-knit rural communities. Finally, these data on coping strategies allow us to compare the impacts of the CFTPP on cash and food recipients. „Cash only‟ recipients were more likely to adopt several strategies than „food only‟ recipients – dietary adjustments, migration, adverse impacts on children – suggesting that food transfers provided marginally better protection against these damaging responses than did cash transfers. On many other important coping strategies – borrowing, begging, selling assets, cutting non-food spending – there was no significant difference between „cash only‟, „food only‟ and „cash plus food‟ recipients.
3.4 Assets and livelihoods Food crises are usually associated with loss of assets, as affected households are forced into „distress sales‟ to buy food. In rural farming households, savings are held in the form of livestock, which have the advantage of accumulating in value (they reproduce) and also generate and food (meat and milk) and income (e.g. oxen are used for ploughing, donkeys can be hired out as pack animals). In times of need, livestock sales provide a quick and guaranteed source of cash, and the extent to which livestock holdings are run down is an indicator of the severity of the crisis. In Lesotho between December 2007 and May 2008, livestock ownership fell for all categories of beneficiaries and non-beneficiaries, and across all categories of animals except pigs. For
38
instance, cattle owned fell from 0.61 to 0.52 per beneficiary household and from 1.03 to 0.92 per non-beneficiary household, and „shoats‟ (sheep and goats) fell from 1.31 to 1.19 per beneficiary and from 3.32 to 3.07 per non-beneficiary household (see Annex Table 28). The only reversal of this trend was a slight increase in pigs owned by beneficiaries, which increased marginally from 0.35 to 0.36. Figure 17 summarises the changes in livestock ownership in percentage terms. For oxen, cattle, donkeys and shoats the decline is in the range of 8-14%, but for (low-value) poultry the decline is close to 20%, and 24% for „cash only‟ recipients. Chickens are often sold to raise small amounts of cash, say to buy food for a day. The increase in pig ownership by beneficiaries is 3% for „cash only‟ and 6% for „food only‟ recipients. Comparing changes in ownership across household categories, no clear pattern emerges. For oxen and donkeys, the decline was larger for non-beneficiaries, but for cattle, shoats and poultry the decline was larger for beneficiaries. Within beneficiary categories, „cash only‟ recipients ran down their oxen and poultry holdings more than „food only‟ recipients did, but „food only‟ recipients lost more of their cattle, donkeys and shoats. Figure 17 Changes in livestock ownership, 2007-08 (% per household)
-25%
-20%
-15%
-10%
-5%
0%
5%
10%
Cash only
Food only
Non-Bens
Oxen Cattle Donkeys Shoats
Pigs
Poultry
During a food crisis, markets are flooded with livestock being sold to finance food purchases, so prices collapse and animals are sold for less than their true value. To estimate the economic cost of livestock losses, prices of different animals were collected in May 2008 from 3 markets in Maseru (Koro-Koro, Matsieng, and Rothe) and 3 markets in Mohale‟s Hoek (Mekaling, Mpharane, and Taung). These average prices were multiplied by animal ownership to estimate the full value in Maloti of livestock holdings per household. Figure 18 (see also Annex Table 29) compares livestock values by household category in December 2007 and May 2008. A striking finding is the much higher level of livestock values in non-beneficiary households – approximately 70% higher in both December and May – reinforcing other evidence that suggests the CFTPP was well targeted on poorer households. The second clear finding from Figure 18 is that all household categories experienced a significant decline in the total market value of their livestock holdings during the food crisis period. There is no difference between household categories in the extent of livestock losses, which averaged 10% across the board. (Bearing in mind that livestock reproduce and thereby increase their value, the real economic loss to these households was somewhat greater than 10%.) From this data we might conclude that the cash and food transfers were ineffective in terms of protecting household assets against „distress sales‟ for food and non-food needs. But this is contradicted by evidence on „coping strategies‟ (Figure 16 above), which found that CFTPP beneficiaries were less likely than non-beneficiaries to sell their animals for food. The explanation is that declining livestock values across the board reflect price effects as well as „distress sales‟ – asset prices fall during food crises due to excess market supplies, leaving the same animals worth less than before.
39
Figure 18 Changes in livestock values, 2007-08 (Maloti per household)
5,9636,173
4,9315,399
4,309
8,8289,812
5,722
-
2,000
4,000
6,000
8,000
10,000
Cash only Food only Cash & Food Non-Bens
December 2007
May 2008
Turning now to non-livestock assets, beneficiaries lost some of their farmland, ploughs, planters and radios during the food crisis, but increased their garden plots slightly, and one „food only‟ recipient acquired a Scotch-cart (Figure 19; see also Annex Table 30). There were no changes in bicycle ownership. „Cash only‟ households appear to have lost most. Because the numbers of these assets are very small, slight changes in ownership equate to sizeable percentage changes (especially for Scotch-carts). Figure 19 Changes in asset ownership, 2007-08 (% per household)
-10%
-5%
0%
5%
10%
15%
20%
Cash only
Food only
Cash & Food
Fields
Garden Scotch
cart
Plough Planter Bicycle Radio
Market prices of farm assets (scotch-cart, plough, planter/cultivator) and consumer durables (bicycle, radio) were collected and averaged to calculate total non-livestock asset values per household, for December 2007 and May 2008. Figure 20 reveals that the value of these assets fell only marginally (by 0.5%) across all beneficiary households, and actually increased in „food only‟ recipients (by 5.2%), mainly because of the acquisition of a scotch-cart by one household.
40
Figure 20 Changes in asset values, 2007-08 (Maloti per household)
2429
2212
23952410
2327
2450
2382
2,000
2,100
2,200
2,300
2,400
2,500
Cash only Food only Cash & Food All Bens
December 2007
May 20082502
Figure 21 summarises the changes in total asset values by summing the results for livestock, farming implements and consumer durables. Overall, the value of household assets declined by 6.8%, but remained at a relatively healthy level. The delivery of cash and food transfers did not provide full protection against asset losses during the food crisis, but beneficiaries did avoid damaging decapitalisation and retained most of their productive livelihood resources. Some small investments in productive assets were even made by many households, using cash transfers. (“We bought garden tools like the spade.”
xlix)
Figure 21 Changes in total asset values, 2007-08 (Maloti per household)
7,8088,049 8,109
7,433
8,3858,392
6,759
7,555
-
2,000
4,000
6,000
8,000
10,000
Cash only Food only Cash & Food All Bens
December 2007
May 2008
-9% -7%-4%-7%
3.5 Borrowing and saving There were no significant differences in borrowing behaviour between beneficiary categories. Just under one-third (30%) of „cash only‟, „food only‟ and „cash plus food‟ recipients borrowed during the project period, and they borrowed very similar amounts (mean= M171). On the other hand, close to half (46%) of our non-beneficiary sample borrowed, and they borrowed much more (mean= M295). Beneficiaries were three times more likely to have repaid these loans by the end
41
of the project (67% versus 22%), probably because they borrowed less and had more disposable income, thanks to the cash and food transfers they received. Beneficiaries also negotiated much lower interest rates (mean= 38.7% simple interest) than non-beneficiaries (mean= 53.1% simple interest), which is an indicator of the greater distress of non-beneficiaries (Table 18). Table 18 Borrowing behaviour during the project period
Food category
Beneficiaries Non-
Benefic-iaries
Total Sample Cash only Food only
Cash & Food
All Beneficiaries
Borrowed in last 6 months (%) 117 (29.6) 83 (30.1) 88 (31.5) 288 (30.3) 108 (45.8) 396 (33.4)
Reasons for borrowing were dominated by food purchases, but the pattern across beneficiary categories is revealing. Food recipients had the least reason to borrow to buy food (nonetheless, 35% did so), cash recipients were more likely to use their transfers to buy food (44% did so), but people who received neither cash nor food transfers were forced into indebtedness to access food – 56% of non-beneficiaries borrowed food or cash to buy food (Figure 22; Annex Table 31) – and more often, as we have seen, on unfavourable repayment terms. After borrowing to finance food purchases, health and education expenses were the most common reasons for borrowing, followed by social obligations (e.g. funerals or weddings). Very few loans were taken for „productive‟ purposes during the project period (such as investment in farming or business); instead, borrowing was dominated by urgent consumption needs. Figure 22 Reasons for borrowing during the project period (% of households)
44.4
34.9
55.6
17.1
24.1
11.1
18.8
21.7
17.6
10.3 9.6
4.6
1.7 1.2 0.9
0
10
20
30
40
50
60
Cash only Food only Non-Bens
Food
Health
Education
Social
Investment
CFTPP beneficiaries were more likely than non-beneficiaries to save cash, pay off debts and gift food to others during the project period. Within the beneficiary group, „cash only‟ recipients were significantly more likely than „food only‟ recipients to save cash, lend cash and pay off debts; but „food only‟ recipients were more likely to gift food (Figure 23; see also Annex Table 32). Across all categories, beneficiaries and non-beneficiaries were 2-3 times more likely to gift food than cash.
42
Figure 23 Saving, lending and donating behaviour (% of households)
12.9
7.28.1
15.4
10.1
16.5
13.5 13.2 12.7
27.6
35.5
26.7
22.3
18.8
15.3
0
10
20
30
40
Cash only Food only Non-Bens
Saved cash
Lent cash
Gifted cash
Gifted food
Paid debts
3.6 Impacts on markets Cash transfer programmes can have an inflationary impact on food prices if market supplies are constrained, but the boost to purchasing power that cash represents can also stimulate trade and general economic activity. Evidence for these negative and positive impacts is considered here.
3.6.1 Food prices
Market monitoring data reveal a sharp increase in the retail price of maize in Lesotho between the 2007 and 2008 harvests. After the April 2007 harvest, the retail price of maize (averaged over 26 separate market observations) was 2.31 Maloti per kilogram, but in April 2008 it was 42% higher, at 3.28 Maloti. But the maize price actually peaked earlier in the „hungry season‟, at 3.92 Maloti in January, 80% higher than the previous January. The biggest price rises were recorded on smaller packages (e.g. 2.5 or 5 kilogram packets of maize-meal), which are commonly purchased by the poorest households who have no reserves for bulk purchases. These price trends raise three questions: (1) What impact did these price rises have on the food security of households in rural Lesotho? (2) Did the CFTPP contribute to this maize price inflation? (3) How effectively did the CFTPP protect beneficiaries against these price rises? Figure 24 Retail maize prices in Lesotho, 2007-08 (Maloti per kilogram)
3.06
3.78
3.923.91
3.28
3.38
3.15
3.09
2.18
2.21
2.43
2.312.22
3.04
2.79
2.68
2.0
2.4
2.8
3.2
3.6
4.0
Jan Feb Mar Apr May Jun Jul Sep Nov Dec Jan Feb Mar Apr May Jun
43
Most project participants did not blame the cash transfers project for causing the price rises (“We do not think that the project has had any impact on food prices”
l), for several reasons. Firstly,
prices were known to be rising throughout Lesotho, not just in project communities. (“Prices are not affected by the cash assistance we are getting. We are told that prices are increasing everywhere, not just here.”
li) Secondly, food prices always rise in drought years. (“When there is a
crisis like drought, prices normally increase.”lii)
Thirdly, other prices were also rising, not only staple foods. There were many complaints by cash recipients about price increases across a range of commodities and services, including transport, fuel and paraffin. (“Prices are forever going up. In December [2007] one litre of paraffin was 6 Maloti and now [May 2008] it is 10 Maloti.”
liii) In fact, the main driver of food price inflation was
identified as rising fuel prices, which was independent of the food crisis. (“We think it is because of the high prices of petrol.”
liv “Each time there is a petrol increase, the prices of food increase.”
lv
“We think that traders base their prices on the ever increasing prices of fuel, because they have to use transport to buy stock.”
lvi)
More supporting evidence that CFTPP cash transfers were not responsible for maize price inflation comes from quantitative data on prices of other items in the food ration basket. Between December and May, the average retail price of cooking oil escalated by 50-56%, while beans increased by 34% and peas by 31%.
lvii It is highly unlikely that these price increases were driven
by demand pressure from cash beneficiaries, since beans, peas and oil are not necessities, unlike staple foods like maize or maize-meal. Traders interviewed pointed out that cash transfers could not possibly contribute to inflation, since the amounts involved were quite low and local business outlets only increased their prices following increases in wholesale prices. Only one person in a focus group of „cash only‟ recipients suggested that the CFTPP played a causal role in driving up maize prices. (“We suspect that the project might have contributed to price increases.”
lviii) On the other hand, while the CFTPP was hardly ever blamed for general
price inflation, there were widespread accusations that local traders put up their prices opportunistically around cash pay-days.
“Prices go up especially on the day we receive aid.”lix
“It is like they know the distribution date because prices go up immediately on the day we get our cash.”
lx
“Sometimes when there are a lot of buyers, like on the day we receive cash, prices are increased.”
lxi)
“Food prices would normally go up for three days after we the collection date and after that they would go down again.”
lxii
“Prices of food items in all the shops around Braakfontein increase on the date of distribution. A few days after the distribution date, prices normally go down.”
lxiii
There is no doubt that the purchasing power of the CFTPP cash transfers was severely eroded by food inflation, despite attempts at adjustments for inflation by CFTPP management. Rising food prices prompted some cash recipients to suggest that increasing cash payments would have been appropriate.
“The cash was not enough because the food prices have gone up.”lxiv
“Food prices are forever going up so an increment would be better.”lxv
“The money we are given is based on prices of food items in Maseru, but prices are very high here in the rural areas.”
lxvi
“We suggest that each person be given M150 due to high prices of food items.”lxvii
44
3.6.2 Trade
Traders interviewed in areas where cash was distributed generally reported an increase in their volume of business during the period of the CFTPP, especially small retailers in remote rural areas, where even a moderate increase in demand made a significant difference to turnover and profits. Big impacts were registered in sales of maize-meal, cooking oil, soap, candles, paraffin, matches, sugar, milk, tea, soups, tomatoes, peas and beans. Many customers who used to purchase these items on credit from local retail outlets were able to pay cash during the period of cash transfers. In those constituencies that received the „cash plus food‟ package, the purchases of groceries were driven by the fact that the food component was too small and somewhat undiversified, hence the need for purchasing supplementary items. On the other hand, some businesses in small communities complained that cash pay-points were located at high traffic centres, where bigger businesses (like supermarkets) captured most of the benefits. The Holy Cross area in the Mekaling constituency presented a good example, where small local cafés and grocery stores hardly derived any benefits from the increased spending power. In general, these remotely located businesses are not competitive and usually carry small volumes of stock due to low demand, low capitalisation, and thefts through break-ins. Since the winding up of the cash transfers, sales figures in many business outlets, particularly those in remote and less trafficked locations, had begun to drop, although this could also be attributed to price escalations and poor recent harvests. In areas where food was distributed, traders were less positive about the CFTPP. Many grocery outlets that were located in „food only‟ and „cash plus food‟ constituencies reported a drop in sales of up to 50%, particularly of maize-meal and cooking oil, as a result (according to local traders) of CFTPP food distribution. As an example, one café that normally sold 10 25kg bags of maize-meal in 3-4 days at Ha Tlebere village (in northern Koro-Koro constituency) was now selling the same quantity over a period of 2 weeks. Similarly, a box of 12 500ml bottles of cooking oil at a café at Mokema village (in eastern Koro-Koro) that used to be exhausted in one week lasted one month during the period of CFTPP food distribution. However, maize-meal sales began to pick up towards their original levels after the winding up of the project. Large traders located at high traffic areas did not feel the impacts of the food distribution. This is because, in relative terms, their losses in sales volumes were minute. Those that experienced low volumes in the early months of 2008 attributed these to normal seasonal business cycles – prices are always highest and disposable income is lowest in the post-Christmas „hungry season‟ – rather than to the impacts of the food distribution. Another reason for the reported low impacts of food distribution on large businesses was said to be the fact that vulnerable households do not normally have money to buy large quantities of food from shops, so the loss of their business would hardly be noticed.
3.7 Impacts on children Children benefited directly from the cash and food transfers in terms of receiving food and having cash spent on their food and non-food needs (clothing, education, health). As noted above, a significant proportion of cash transfer income was spent on education expenses. This impact was (by definition) greatest in „cash only‟ households, less pronounced in „cash plus food‟ households, and negligible in „food only‟ households. Indirectly, transfers of cash and food protected children against being withdrawn from school – a common coping strategy to save on education expenses, as discussed above. (“Children are in school, thanks to the aid. We are also able to buy them school uniform.”
lxviii) Before the CFTPP
intervention, many children were said to have been surviving on the one meal a day they received at school. Many parents moved their children from schools that had no school feeding scheme to those that did. After the cash and food transfers were introduced, St. Joseph‟s High School in Koro-Koro reported a drop in the number of pupils who came to school without lunch-boxes,
45
meaning that their parents were able to provide them with food for school. Because of improved nutrition, some parents believe that their children‟s performance at school also improved. (“Our children look smart, they eat well and hence perform well at school.”
lxix)
Another indirect impact of the CFTPP was on child labour. Children in rural Lesotho often work, young children doing unpaid family labour – boys as animal herders, girls doing household chores – but older children working for cash as farm labourers or domestic workers, even migrating to Maseru to look for formal or informal employment. Some focus group participants denied that child labour was prevalent in Lesotho. (“We have no children who are labourers because the Prime Minister provides free education for our children. A parent appears in court if he/she does not send his children to school.”
lxx) Other focus group participants argued that the CFTPP project
had no effect on child labour, neither increasing nor reducing it. (“Child labour has always existed in Lesotho, so it is still practised despite this assistance.”
lxxi “Poverty is broad across the country
and we still see hunger and no difference.”lxxii
) Other respondents believe that the cash and food transfers had a significant positive impact on paid and unpaid child labour. (“Children do work for cash. The project has brought a difference, the number of children who work for returns has reduced. Nowadays when we need herd boys it is difficult to find them.”
lxxiii “The number has reduced dramatically since the children are able to
eat and go to school.”lxxiv
)
3.8 Impacts on the community The CFTPP had a number of social impacts, some positive and some negative, in communities where the project was implemented.
3.8.1 Positive social impacts
Many positive social impacts were claimed for the CFTPP, including reduced begging and crime. Although the cash and food transfers were targeted at a minority of households, they took the pressure off other community members, who would otherwise be expected to provide informal social protection to their most food insecure neighbours. (“No one is a beggar anymore.”
lxxv “We
no longer bother pensioners any more.”lxxvi
) In fact, some of the people who would otherwise have been asking for help were empowered by receiving cash and food transfers to offer help to others. (“People who receive aid are able to give a hand to those who are not covered by aid, so less people are hungry.”
lxxvii) Sharing of transfers diluted their direct impact on beneficiary
households but spread the benefits among a wider group. (“Since we share with our neighbours it benefited the whole community.”
lxxviii)
Incidents of stealing due to hunger – from homes, farms and animal kraals – allegedly declined in many communities. (“House breakings have dropped.”
lxxix “No more cases of stealing in the fields
and livestock.”lxxx
“The crime rates has been reduced in our community.”lxxxi
) More generally, several focus group participants reported that the injection of cash and food transfers improved social relations, because they reduced hunger and the stress that hunger imposes between community members. (“Hunger can lead to poor relationships within families and with neighbours.”
lxxxii “No one has to hide her groceries! Before we had to buy our groceries
at night because there was a high tendency of begging.” lxxxiii
)
3.8.2 Negative social impacts
Negative social impacts included resentment from excluded community members, and conflicts between older and younger generations over the control of cash transfers. Contradicting the positive reports of improved social harmony in several communities, in others the CFTPP contributed to tensions and conflict between beneficiaries and non-beneficiaries. One
46
reason for this was a general aversion to targeting of benefits (this was not specific to the CFTPP intervention), which is widely regarded as discriminatory and unfair. “This is quite normal in the villages, and there were many complaints.”
lxxxiv Non-beneficiaries were “extremely jealous”, and
many “talked badly” about the beneficiaries:
“They say: why do we eat while their children do not, but we are all poor?”lxxxv
“We are told that we feed on camel milk.”lxxxvi
“Some of our neighbours do not talk to us anymore.”lxxxvii
“They say we are blocking their chances of receiving aid and that we are dependent on World Vision so much that we do not want to work.”
lxxxviii
“They think it is unfair that they are not registered.”lxxxix
“We might get killed for this cash. They demand to be included in the beneficiary list”.xc
“There is jealousy among the people. They claim that they do not understand why and how we receive aid because they are also hungry.”
xci
“Due to jealousy that reigns over our community, our chief deliberately left some people out and left his favourites.”
xcii
“They say we are making money out of our children.”xciii
“They think we deliberately deleted their names from the list.”xciv
“They also say that the money came from the Prime Minister, but we told them it comes from our beautiful donors!”
xcv
Cash transfers are often believed to cause tensions between husbands and wives, especially if husbands control cash that is intended to buy food for children, or if women collect cash transfers in cultures where cash income is traditionally earned and controlled by men. In the CFTPP, gendered conflicts over the control of cash transfers were not reported very often. However, there were reports of inter-generational conflicts between children and their parents, grandparents or carers. In most cases, children understood that the cash was intended to be used for the benefit of all family members, and if the person controlling the cash did not use the money „responsibly‟, some children complained:
“There were clashes between elders and children: the person who normally collects the cash misused it and the children were not benefiting at all from the cash.”
xcvi
“In one instance, the children were fighting with their father, claiming he does not cater for the household needs. The counsellor intervened and the money was shared equally”.
xcvii
“One old lady did not agree to share the cash with her daughters-in-law and there was a disagreement and we had to intervene.”
xcviii
47
Chapter 4 Contributions of the CFTPP to World Vision’s Learning and Capacity for Cash Transfer Programming
While the primary objective of the CFTPP was humanitarian, a key secondary objective was to increase World Vision‟s learning and capacity for cash transfer programming. This objective reflected the reality that a wealth of materials on cash transfer programming has been produced in recent years, by academic institutions such as the Centre for Social Protection at IDS, the Humanitarian Policy Group at ODI and the International Poverty Centre; by donor agencies such as DFID and the World Bank; and by other NGOs including Oxfam, Save the Children UK, and Concern Worldwide. In this context, the CFTPP offered an opportunity for World Vision to make a contribution to the rapidly growing literature on this innovative response to humanitarian crises, and to learn lessons for its own future work in this area. Throughout the duration of the CFTPP, from the feasibility study through to project design and implementation, there was an institutional emphasis on building on the extensive experience that World Vision had already acquired in food programming, and on utilising established systems that were already in use in food programming. This included the adoption or modification of existing targeting procedures and data management systems, utilising expertise in food disbursement for disbursing cash transfers, and identifying complementarities between food and cash delivery mechanisms. By closely integrating food programming staff at every stage of project development, the CFTPP therefore offered ample learning opportunities for World Vision staff on the ground. Increasing opportunities for utilising cash transfers in humanitarian situations and for social protection more broadly dictate that World Vision should expand its capacity in cash programming. Lessons from this pilot project in Lesotho should assist World vision‟s various national offices and the Global Centre in programming for cash-based responses to chronic poverty and future emergencies.
The Cash Transfers Feasibility Study
This feasibility study was conducted from 11 to 21 September 2007. The study was led by the Humanitarian Policy Group (HPG) of the Overseas Development Institute (ODI), and the team included four members from World Vision Lesotho and one member each from World Vision Zimbabwe, World Vision Swaziland, FPMG and WVI. The objective was to use HPG‟s expertise in cash transfers programming to build capacity within World Vision to conduct feasibility studies on the appropriateness of cash-based interventions. The study made in-depth analyses of the legal and political context, targeting and household-gender dynamics, possible uses of cash, delivery mechanisms, the relative cost effectiveness of cash transfers, organisational capacity and programme coordination. The feasibility study found cash transfers to be feasible for short-term humanitarian interventions in the Lowlands of Lesotho and listed a number of programme design guidelines. The study was highly participatory and instilled analytical skills among team members.
The Project Design Workshop
A project design workshop was facilitated by the Humanitarian Policy Group of ODI, from 1 to 14 November 2007, after a preliminary visit to Lesotho from 1 to 12 October. The workshop aimed at drawing upon HPG expertise in cash transfers programming in order to design a viable pilot program, while at the same time building capacity within World Vision for cash transfers programming. The main aspects of this workshop were design issues (objectives, targeting, type of transfer, delivery mechanisms), monitoring and evaluation, the implementation plan and the log-frame. The Design Document that emerged from this workshop was written in the form of a project manual, which became an important source of design materials for management systems and monitoring tools during the implementation of the CFTPP.
48
Orientation Workshops
The implementation of the CFTPP was preceded by preparatory work that included orientation workshops and training. An Orientation Workshop for all field staff who had been identified to work with the project was conducted by Dorothy Knoechel (WVI-SALER) on 1-3 November 2007. This was followed by a Security Workshop that was conducted by Tim Mercer (WVI-Global Centre) for all field staff, and by an M&E Training workshop on 26-29 November 2007. Cash Transfer Manual
During the course of implementing the CFTPP, project management captured all the relevant management systems into flow-charts that would guide future cash transfer programming. These were revised regularly to reflect actual experiences on the ground. These flow-charts, which will be incorporated into a manual for future reference, include the following:
Beneficiary Selection
Beneficiary Verification for Under-registered Households
Beneficiary Verification for Individual Inclusion Error
Beneficiary verification for Mass Inclusion Error
Beneficiary Entitlement Verification
Monitoring System
Market Price Monitoring
Accountability (for project funds)
Cash Distribution Flowchart
Setting up a Community Help Desk
Managing Community Help Desk
Monitoring Community Help Desk Performance
Project Reports
In the short time span that the CFTPP was operational, it produced a wealth of data and reports. These included monthly reports by the project manager, monthly reports by the M&E specialist, and occasional studies produced by the M&E section. These reports contained a wide range of information that included management issues and logistics, operational issues at distribution points, community issues, financial matters, on-site monitoring and post-distribution survey results, lessons learnt, etc. The reports had a broad circulation that included World Vision support offices, the Food Program Management Group (FPMG), and the WVI Global Centre, thereby keeping the World Vision fraternity and other stakeholders well informed about project progress, constraints and lessons learnt during project implementation. Advocacy for Cash Transfers
One of the learning elements that emerged as a by-product of the planning and implementation of the CFTPP is the demonstration that cash transfers can respond appropriately to the needs of humanitarian crises, as long as the local market infrastructure is functioning well. Evidence on the ground pointed at many ways in which cash transfers performed better than food distribution. Although the debate continues, this evidence has served as advocacy for cash transfers among local communities, among community-based World Vision structures, among development partners and other stakeholders, including government, within World Vision country offices and within FPMG and the Global Centre. The most notable finding for World Vision International is that cash transfers are a viable option in emergency responses. The advocacy for cash transfers that followed the implementation of the CFTPP came through the following forums:
49
a continuous comparison of cash transfers and food-based interventions that culminated in the hosting of the Mid-term Evaluation Workshop in Maseru on 3-4 March 2008, with participation from 7 World Vision country offices, ODI, FPMG, WFP, UNICEF, Save the Children Swaziland, DMA, LVAC, and Group 4 Securicor;
an End of Project Dissemination Workshop that was held in Maseru on 8 July 2008 with attendance by representatives from World Vision Lesotho, FPMG, US Embassy, the EU, FAO, WFP, DFID, Irish AID, UNICEF, Red Cross, CRS, CARE, DMA, LVAC, and the Lesotho Ministries of Forestry and Land Reclamation, Trade and Industry, Agriculture and Food Security, and Health and Social Welfare;
End of Project Dissemination Workshops that were held in Johannesburg on 9-10 July 2008 with attendance by 42 people on 9 July and 110 on 10 July. Participants came from the DMA, LVAC, UNICEF, WFP, EU, HHVP, FANRPAN, CRS, CARE, ODI, RHVP, FPMG, World Vision country offices in Lesotho, Swaziland, Malawi and Zimbabwe, World Vision Canada, World Vision Switzerland, World Vision US, World Vision International, and World Vision Global Centre.
In addition to the above advocacy initiatives, there are plans to publish the findings of the end of project evaluation, including learning experiences. A video that presents the story of the CFTPP will also be launched with plans for international circulation. Many participants in the advocacy workshops listed above reported that they learnt a lot in these meetings about the planning, monitoring and evaluation of cash transfer projects. World Vision Malawi is already tapping experiences from the CFTPP. On the other hand, most World Vision International and country offices staff who responded to the follow-up evaluation questionnaire were satisfied that the CFTPP unquestionably realised its major objective of meeting food insecurity among poor and vulnerable households, with very little cash diversion to finance anti-social activities. They also conceded that the project demonstrated another dimension of humanitarian assistance, namely that such assistance must also address non-food basic needs, which cash transfers can do more effectively than food aid. Some of the country offices staff who responded to the follow-up evaluation questionnaire felt that, with proper planning, the CFTPP concept could be operated at larger scale. However, there was caution from staff from a few support offices that funding for „cash only‟ projects could be difficult to solicit. On the other hand, there was general agreement among those who completed the follow-up evaluation questionnaire that the popularity of the „cash plus food‟ relief package was an eye-opener that called for a re-examination of traditional humanitarian approaches.
Research
The CFTPP collaborated with the ODI to support research on the impact of cash transfers on gender and children, and with an independent consultant to conduct comparative research on the staffing dimensions of the delivery of cash transfers and food aid under emergency conditions. A study involving a comparison of the costs of delivery between cash transfers and food aid is being undertaken by the WVI Global Centre as part of the CFTPP Process Evaluation. Draft findings of all of these studies were presented to the End of Project Dissemination Workshops on 9-10 July 2008, arousing a lot of interest and debate. Hopefully, these studies will be published in some form, both for internal use and for wider dissemination and reference. Supervision, Exchange Visits and Collaborative Efforts
During project CFTPP implementation, a number of support offices kept a close eye on project performance, with the keen interest that is often provoked by pilot initiatives. Both WVI Global Centre and FPMG engaged actively with the project. FPMG staff visited project areas from time to time and assisted with improvements in the setting up and operations of the Community Help Desk. A number of stakeholders also showed interest. These included a number of government institutions, particularly the DMA, WFP which provided the food component, UNICEF, and Save the Children Swaziland, which was implementing a similar project at the same time.
50
There were also several collaborative efforts that assisted capacity building within the CFTPP team. For example, the M&E Specialist attended a „Market Analysis for Food Security‟ Workshop that was organised by the WFP in December 2007. The same official paid an exchange visit to Save the Children Swaziland on 6-9 February 2008. On the other hand, the CFTPP had close collaboration with other WV Lesotho initiatives, particularly the PRRO and the C-SAFE project. PRRO field teams were fully involved in CFTPP planning and implementation activities. Collaborative efforts were reinforced by extensive project documentation, effective project management and extensive utilisation of the team approach in the planning, implementation and monitoring of project activities. A number of World Vision staff from different country offices felt that, given another opportunity, they would confidently apply the skills they had acquired from participation in the CFTPP to new cash transfer initiatives. This was especially so in the areas of project design, monitoring and evaluation. Other Possible Cash Transfer Applications
Some World Vision staff expressed the opinion that, building on the experience acquired from planning and implementation of CFTPP, the concept of cash transfers could be extended to other operations such as cash-for-work, cash-for-school-attendance, cash-for-treatment-compliance, and so on. However, the same staff cautioned that conditions for cash transfers would have to be appropriate before such applications were implemented. One of the preconditions mentioned was the existence of stable and well functioning markets in each programme context. Constraints to Capacity-Building
The biggest constraint to capacity-building in the CFTPP was the fact that there were no existing guidelines to draw upon, since the project was an innovative pilot. As such, most of the systems were established through trial and error (designing, applying and modifying) within a very limited time-frame, under the severe pressure of running a humanitarian intervention. On the other hand, lack of continuity within the project framework also led to loss of acquired skills and experience. However, these drawbacks were compensated by the project‟s inclination towards team-work, the sustained external interest in the project, and the voluminous documentation that was generated.
51
Chapter 5 Conclusions and Recommendations The Cash and Food Transfers Pilot Project (CFTPP) was an effective humanitarian response to a drought-induced harvest failure in Lesotho in April/May 2007. Some 41,000 vulnerable people received cash, cash plus food or food rations for six months, in full and on time, thus protecting their food security until the next harvest in April/May 2008. The project also generated useful lessons about designing, delivering and evaluating cash-based social assistance programmes, in emergency contexts but with application to non-emergency (social protection) contexts as well. Some of the lessons learnt relate to possibilities for improved practice by World Vision if similar projects are implemented in the future, while other lessons are in the form of general principles for all agencies to follow when designing and implementing social assistance programmes. The key specific recommendations arising from the CFTPP relate to five areas: setting the level of cash transfers; simplifying the targeting procedure; respecting beneficiary preferences; setting up a complaints mechanism; and linking M&E data to response. Cash transfers: The decision to transfer cash rather than food, especially in an emergency
context, must always be informed by a feasibility study that assesses the capacity of local markets to respond to the increased demand that cash transfers induce. This was done for CFTPP, and the decision to include cash in the humanitarian relief package was vindicated by the many positive impacts recorded, as well as by a significant shift in beneficiary preferences towards cash or „cash plus food‟ by the end of the intervention. However, the failure to adjust cash transfer levels in line with food price rises, apart from a single 25% increment towards the end of the project, eroded purchasing power and market access to food. Cash transfers intended to ensure market access to a defined food basket must be adjusted regularly to compensate cash recipients for declining purchasing power if food prices rise, and local prices must be continuously monitored for this purpose.
Targeting: When multiple approaches to targeting are used – in this case, geographic targeting,
community wealth ranking, objective wealth indicators, and a 20% quota – the potential for confusion and internal contradictions increases. During beneficiary selection for the CFTPP, inadequate controls on the influence of powerful community members over beneficiary lists resulted in both inclusion and exclusion errors, while the 20% quota failed to account for wealth differences across communities, and resulted in substantial under-coverage in relation to needs. A simplified and more consistent approach to targeting is recommended, such as triangulated community wealth ranking or a proxy means test, together with more rigorous verification procedures.
Beneficiary preferences: Among the three assistance packages provided, the „cash plus food‟
combination was preferred by most respondents to both the pre-project baseline survey and the post-project evaluation survey. This was followed by „cash only‟, with „food only‟ being the least preferred option. In the final evaluation survey, the majority of „food only‟ recipients stated that they would have preferred „cash plus food‟ if they had a choice. „Cash plus food‟ was favoured because it combined the flexibility of cash with guaranteed access to food. Respecting beneficiary preferences implies that future humanitarian programming in Lesotho should deliver combined packages of relief assistance: half food, half cash.
‘Customer care’ indicators such as accessibility, security, queuing times and helpfulness of
project staff at cash pay-points and food distribution points were all favourably evaluated by cash and food recipients. The delivery of cash and food was efficient and fair. However, beneficiaries and excluded households had no access to a complaints procedure until the project was almost over. All cash and food transfer programmes should establish an independent, accessible and efficient complaints resolution mechanism as standard procedure.
52
Project monitoring and evaluation systems were comprehensively designed and professionally managed. They generated useful information both during project implementation and for the post-project evaluation. On the other hand, some data that were generated through an array of monitoring mechanisms were not acted on, notably the price monitoring data that revealed rising food costs, which did not trigger an increase in cash transfer payment levels until the project was nearly over. Monitoring data must be directly linked to response in terms of modifying project design or delivery, otherwise the effectiveness of the monitoring and evaluation system is substantially compromised.
Notwithstanding these suggestions for potential improvement, it is appropriate to conclude by returning to the „bigger picture‟. The CFTPP was a well designed and well delivered intervention that impacted positively on beneficiaries‟ wellbeing, it was evaluated favourably by beneficiaries themselves, and it demonstrated that cash transfers are feasible and appropriate in Lesotho, even as an emergency response. World Vision staff and partners are to be commended for their dedication and professionalism in implementing the CFTPP, which has hopefully opened up the policy space for further cash-based responses to food crises and chronic poverty in Lesotho.
53
References Bailey, Sarah (November 2007) World Vision Lesotho Cash Transfers Pilot Project Design
Document, World Vision International
Concern Worldwide (April 2006) Project Evolution, Planning and Implementation, Food and Cash Transfer (FACT) Project
Consolidated Appeals Process (July 2007) Lesotho Drought 2007: Flash Appeal, United Nations
Disaster Management Authority and World Food Program (March 2006) Uncovering Chronic, Persistent Vulnerability to Hunger in the Southern Lowlands and Senqu River Valley: Report of the DMA-WFP Targeting Exercise
Economic and Social Department (June 2007) FAO/WFP Crop and Food Supply Assessment Mission to Lesotho: Special Report, World Food Programme
Gentilini, Ugo (2007) Cash and Food Transfers: A Primer, World Food Programme
Harvey, Paul (January 2007) Cash-based Responses in Emergencies, Humanitarian Policy Group, ODI
Levine, Simon (September 2007) Is Cash a Feasible Alternative to Food Aid for Post Drought Relief in Lesotho, World Vision International
LVAC (July 2006) Lesotho Livelihoods Profile Report, Government of Lesotho
Mhlanga, Michael L. (May 2008) Cash and Food Transfers Pilot Project: Report of a Baseline Survey, World Vision International
Ribas, Rafael P. (January 2008) Debating Targeting Methods for Cash Transfers: A Multidimensional Index vs. an Income Proxy for Paraguay’s Tekoporá Programme, IPC Evaluation Note Number 2, 2008
Slater, Rachel and Matšeliso Mphale (March 2008) Cash Transfers and Gender Relations: Evidence from a Pilot Project in Lesotho: A report for World Vision International, World Vision International
54
ANNEXES
Annex 1. Sampling for the Evaluation Survey
Sample Size Determination The sample size for beneficiary households was determined using the formula:
n = t^2 pq deff, d^2 where: n = Sample size;
t = Standard normal deviate for a specified level of confidence;
p = Proportion of the population (households) that are beneficiaries;
q = The complement of p (i.e. 1-p);
d = Tolerated margin of error;
deff = Design effect
Assumptions: t = 2
p = 0.4 (9,185 total beneficiary households as percent of a total 24,955
households in all the targeted constituencies)
q = 0.6
d = 0.035
deff = 1.2.
Then n = t^2 pq deff, d^2 = (2)(2)(0.4(0.6)(1.2) (0.035)(0.035) = 940.40816
= 940 households
Sample Allocation According to figures supplied by the CFTPP project management, the number of beneficiaries in the Matsieng Constituency stood at 2,093 while that in the Rothe and Koro-Koro constituencies respectively stood at 1,645 and 1,128, giving the Maseru District a total 4,866 beneficiaries under the project. On the other hand, the number of beneficiaries in the Mekaling, Mpharane and Taung constituencies respectively stood at 1,759, 1,042 and 1,518, implying that 4,319 beneficiaries in the Mohale‟s Hoek District benefited under the CFTPP project. The sample of 940 beneficiary households was then allocated proportionately to each constituency (Table A1).
55
Table A1 Sample allocation by Constituency
Constituency/ District
Beneficiaries Non-Beneficiary
Sample
Total Sample Number Percent Sample
Allocation
Matsieng 2,093 22.8 214 54 268
Rothe 1,645 17.9 168 42 210
Koro-Koro 1,128 12.3 116 29 145
Maseru 4,866 53.0 498 125 623
Mekaling 1,759 19.2 181 45 226
Mpharane 1,042 11.3 106 26 132
Taung 1,518 16.5 155 39 194
Mohale’s Hoek 4,319 47.0 442 110 552
All Constituencies 9,185 100.0 940 235 1175
Sampling Procedure The beneficiaries of the CFTPP came from 6 constituencies, 3 each in the Maseru and Mohale‟s Hoek Districts. In each constituency, beneficiaries were drawn from every village where the lowest 20% or critically vulnerable households were identified, making it necessary to cluster in order to reduce travel time and contain enumeration costs. The latest roster of beneficiaries that was available was that of May, the last month of the project. Although the names on this roster were sorted by constituency and by village, the latter were dotted over a very large area all over the constituency. It would therefore have been prohibitively costly to adopt villages as first stage sampling units. They also varied considerably in size in each constituency, from as small as one household to as large as over 100 households, making them unsuitable as a sampling frame. Since beneficiary households were distributed throughout each participating constituency, it was decided to use the Bureau of Statistics (BOS) enumeration area (EA) as the first stage sampling unit. An EA is defined as a geo-demographic demarcation that forms a cluster of villages and is regarded as a statistical unit by the BOS. A beneficiary household in any of the villages that fell into a selected EA was then considered the second stage sampling unit. The sampling frames, therefore, consisted of EAs in the first stage, and lists of beneficiary households in villages that fell into these EAs in the second stage. The actual selection of beneficiary households in a roster was systematic, using a sample interval that had been computed for the whole constituency. The EA, as a first stage sampling unit, was also found suitable for the selection of non-beneficiary households. However, only those EAs that had not fallen into the first stage sample during the sampling of beneficiary households were considered. On the other hand, since there was no roster for non-beneficiary households, a systematic sampling procedure was adopted, using sample intervals that had been computed for each constituency.
56
Annex 2. The National Targeting Tool
57
58
Annex 3. Recommended Calculation of Cash and Food Transfers Humanitarian relief assistance packages generally vary from crisis to crisis, depending on what assessment teams establish to be the basic or minimum requirements to ensure the survival of affected populations. Where massive disasters involve the destruction of shelter and water systems, humanitarian assistance has often included the provision of alternative shelter, clean water, blankets and clothing, in addition to the provision of minimum consumption items or food. In Southern Africa, crisis conditions of this kind have been experienced in the lower Zambezi and Limpopo River valleys, affecting Mozambique‟s coastal areas, in the lower Shire River valley in southern Malawi, and in the southern Cape of South Africa, where flash floods have often caused human suffering especially within informal settlements. But the most frequent humanitarian crises in Southern Africa today involve drought-induced hunger in poor rural communities, most of which are no longer able to produce adequate food to sustain their households throughout the year. These communities with shattered livelihoods generally suffer severe forms of both absolute and relative deprivation whose impacts have been exacerbated by high levels of HIV/AIDS prevalence rates (often estimated to be in excess of 25% of the sexually active population). The chronically ill, orphans, and child headed households form large segments of these vulnerable communities. Not only are national resources inadequate to restore the livelihoods of these households, but droughts and other adverse weather conditions compound the problems.
Experience from Lesotho
Although humanitarian organisations such as the Red Cross sometimes distribute blankets and clothing, the major part of humanitarian relief assistance in Southern Africa consists of a food ration with biologically determined calorie content. In Lesotho, this food ration usually consists of 12kg of cereals, 1.8kg of pulses, and 0.6kg of cooking oil per person per month. However, an analysis of the utilisation of cash transfers under the Cash and Food Transfers Pilot Project (CFTPP) in Lesotho revealed that even during food crises, poor households will always strike a balance between food and other basic necessities, when given opportunities to do so. In terms of beneficiary preferences, there was therefore a shift away from „food only‟ assistance because it did not offer opportunities for acquiring alternative basic necessities. When households are paid cash that is equivalent to the food ration, their expenditure patterns are such that they spend less on staple food in order to effect savings that enable them to buy other food items or basic necessities like kerosene, matches, salt, tea, sugar, health care, etc. In other words, even in situations of food crises, hungry households will sacrifice their minimum calorie intake in order to access other basic necessities. For humanitarian assistance to restore household food security, therefore, these poor households have to be given an adequate amount to cover both their minimum calorie intake and access non-food basic necessities. There should also be a built-in adjustment of the package so that the real value of the cash transfer is not eroded by inflation.
Calculation of ‘enhanced’ cash and food transfers
By setting the cash transfer value equivalent to the biological minimum calorie intake, cash-based humanitarian interventions have failed to restore household food security fully, since poor cash recipients are compelled to sacrifice some potential food intake for non-food necessities. On the other hand, the food ration on its own is also inadequate since for it to restore household food security and guarantee subsistence (more broadly defined), there should also be an allocation for households to access non-food necessities. The „correct‟ cash or food transfer package should therefore be made up of three elements:
(1) a biologically determined calorie intake, either in food or in cash equivalent to the relief food ration that is currently distributed by humanitarian organisations;
59
(2) a cash allocation that is a fraction of the market value of the food ration and whose function is to enable vulnerable households to meet essential non-food basic needs; and
(3) an adjustment for inflation which is also a fraction of the market value of the food ration.
This means the calculation of a cash transfer package per person should be considered as: Y = X + tX + rX + rtX = X (1+ t + r + rt)
= X 1 + t + r(1+t) Where: Y = the transfer value for a member of a beneficiary vulnerable household
X = the cash value of the minimum calorie intake of a member of a beneficiary vulnerable household
t = a determined fraction of the household cash income that is spent on non-food basic requirements
r = the rate of inflation, preferably the food inflation since food averages 67% of cash transfer expenditures
In the CFTPP evaluation, XDecember was found to be M68.0524
, the value of the parameter t was
found to be 0.33,25
and the value of rDecember was found to be 0.018 (i.e. 1.8%).26
Using this formula,
therefore, the December 2007 cash transfer per person should have stood at:
YDecember = 68.05(1+ 0.33 + 0.018(1 + 0.33)
= M92.14 The diagram below shows the Y values for CFTPP cash transfers for the implementation period of December 2007 to May 2008. These recommended values are compared with actual cash transfers disbursed to beneficiaries by the project. In the first four months of project operations, it is clear that actual cash transfers were far below the recommended level. However, the upward adjustment in actual cash transfers in the months of April and May brought the actual and the recommended closer. Right from December 2007, therefore, the shortfall on the cash transfer amounted to M14.14 per person per month.
CFTPP Actual and Recommended Cash Transfer Levels
70
80
90
100
December
January
February
March
AprilM
ay
Mal
oti
/Per
son
Actual Transfer Recommended Transfer
24
The market value of the food ration that was distributed to „food only‟ beneficiaries. 25
Cash beneficiary households spent 67% of their income on food and groceries. 26
The calculations were based on the official monthly food inflation for the period December to May.
60
In cases where a food ration was distributed, there would need to be a financial top-up to cover non-food basic needs. That top-up would be calculated using the following formula:
Y = X t(1 + r) + r
In this case, YDecember would stand at
YDecember = 68.05 0.33(1 + 0.018) + 0.018
= M24.09 This means that in December 2007, a member of a beneficiary household that received a full food ration should have received an additional M24.09 so that he or she could access essential non-food basic requirements.
61
Annex 4. Supplementary Tables
Table 19 Cash transfers received (mean Maloti per cash recipient)
Month Cash only
beneficiaries Cash & Food beneficiaries
All Cash recipients
December 2007 346.84 160.32 253.58
January 2008 349.82 167.55 258.69
February 2008 353.27 165.23 259.25
March 2008 355.62 174.80 265.21
April 2008 443.82 224.73 334.27
May 2008 448.15 223.25 335.70
Total Maloti received 2,297.52 1,115.88 1,706.70
Mean Maloti per month 382.92 185.98 284.45
Table 20 Reported advantages and disadvantages of CFTPP assistance packages
Main Advantage % Main Disadvantage %
Cash Only
Enough to sustain a household 19 Not sufficient to sustain a household 5
Met diversified household needs/choices 45 Met limited household needs 3
Enabled dietary diversification 5 Could not buy adequate amounts of food 1
Bought adequate amounts of food 15 Increased security risk 4
Convenient to carry/less costly 1 Allowed diversion to bad uses 8
Brought harmony to household 11 Brought conflict to household 1
Brought harmony to community 1 Brought conflict to community 22
Allowed purchases of good quality 1 Was affected by inflation 3
Other main advantage 2 No disadvantage 53
Cash and Food
Reduced possibilities of cash diversion 7 Could not buy adequate amounts of food 2
Met diversified household needs/choices 68 Met limited household needs 4
Gave money as a gift 52 (13.5) 31 (13.2) 26 (10.8) 109 (12.7) 30 (12.7) 139 (11.7)
Gave food (cereal) as a gift 109 (27.6) 98 (35.5) 85 (30.5) 292 (30.7) 63 (26.7) 355 (30.0)
Paid off any debts 88 (22.3) 52 (18.8) 44 (15.8) 184 (19.4) 36 (15.3) 220 (18.5)
70
Table 33 Household income and income sources
Average Household Income Cash only Food only Cash & Food
All Bens Non-Bens Total
Agriculture 11.39 4.57 4.82 7.29 21.40 14.36
Wages and salaries 13.24 1.30 2.22 6.54 163.77 85.16
Business 2.45 4.48 2.21 2.96 19.62 11.29
Remittances from Lesotho 12.91 19.58 12.58 14.74 11.19 12.97
Remittances from abroad 10.00 9.28 3.41 7.85 41.49 24.67
Pension 35.75 40.36 30.11 35.43 51.27 43.35
Casual jobs 20.33 45.85 26.44 29.52 63.93 46.73
Social services 6.33 0.54 1.80 3.32 0.00 1.66
World Vision cash transfer 448.18 0.00 227.20 253.07 0.00 126.54
Other cash transfer 0.25 0.08 0.97 0.41 4.58 2.50
Brewing beer sales 5.32 3.81 5.80 5.02 5.27 5.15
Other cash income source 1.41 4.78 1.71 2.48 18.14 10.31
Total income (Maloti) 567.56 134.63 319.27 368.63 400.66 384.69
Sources of Income (%) Cash only Food only Cash & Food
All Bens Non-Bens Total
Agriculture 2.0% 3.4% 1.5% 2.0% 5.3% 3.7%
Wages and salaries 2.3% 1.0% 0.7% 1.8% 40.9% 22.1%
Business 0.4% 3.3% 0.7% 0.8% 4.9% 2.9%
Remittances from Lesotho 2.3% 14.5% 3.9% 4.0% 2.8% 3.4%
Remittances from abroad 1.8% 6.9% 1.1% 2.1% 10.4% 6.4%
Pension 6.3% 30.0% 9.4% 9.6% 12.8% 11.3%
Casual jobs 3.6% 34.1% 8.3% 8.0% 16.0% 12.1%
Social services 1.1% 0.4% 0.6% 0.9% 0.0% 0.4%
World Vision cash transfer 79.0% 0.0% 71.2% 68.7% 0.0% 32.9%
Other cash transfer 0.0% 0.1% 0.3% 0.1% 1.1% 0.6%
Brewing beer sales 0.9% 2.8% 1.8% 1.4% 1.3% 1.3%
Other cash income source 0.2% 3.6% 0.5% 0.7% 4.5% 2.7%
Total income (Maloti) 100.0% 100.0% 100.0% 100.0% 100.0% 100.0%
Figure 25 Main sources of income (Maloti per household)
0
100
200
300
400
500
World Vision
cash
Wages &
salaries
Casual jobs Pension Remittances Agriculture Business
Cash only
Food only
Cash & Food
Non-Bens
71
Endnotes i Female focus group participant, „cash only‟ beneficiaries, Ha Maphathe, Matsieng, Maseru. ii Male focus group participant, „cash plus food‟ beneficiaries, Rothe, Masite, Maseru.
iii Male focus group participant, „cash plus food‟ beneficiaries, Linotsing, Rothe, Maseru.
iv Male focus group participant, „cash plus food‟ beneficiaries, Rothe, Masite, Maseru.
v Female focus group participant, „cash only‟ beneficiaries, Ha Khosi, Mekaling, Mohale‟s Hoek.
vi Male focus group participant, „cash plus food‟ beneficiaries, Linotsing, Rothe, Maseru.
vii Male focus group participant, „cash only‟ beneficiaries, Ha Khosi, Mekaling, Mohale‟s Hoek.
viii Male focus group participant, „cash plus food‟ beneficiaries, Linotsing, Rothe, Maseru.
ix Male focus group participant, „cash only‟ beneficiaries, Ha Khosi, Mekaling, Mohale‟s Hoek.
x Male focus group participant, „cash plus food‟ beneficiaries, Rothe, Masite, Maseru
xi Female focus group participant, „cash only‟ beneficiaries, Ha Morifi, Moiloa, Mekaling.
xii Female focus group participant, „cash only‟ beneficiaries, Ha Khosi, Mekaling, Mohale‟s Hoek.
xiii Male focus group participant, „food only‟ beneficiaries, Ha Mokuoane, Koro-Koro, Maseru.
xiv Male focus group participant, „food only‟ beneficiaries, Ha Mokuoane, Koro-Koro, Maseru.
xv Male focus group participant, „food only‟ beneficiaries, Ha Mokuoane, Koro-Koro, Maseru.
xvi Male focus group participant, „food only‟ beneficiaries, Ha Mokuoane, Koro-Koro, Maseru.
xvii Female focus group participant, „food only‟ beneficiaries, Qhalasi, Taung, Mohale‟s Hoek.
xviii Male focus group participant, „cash only‟ beneficiaries, Ha Maphathe, Matsieng, Maseru.
xix Male focus group participant, „cash only‟ beneficiaries, Ha Khosi, Mekaling, Mohale‟s Hoek.
xx Female focus group participant, „food only‟ beneficiaries, Ha Mokuoane, Koro-Koro, Maseru.
xxi Male focus group participant, „food only‟ beneficiaries, Ha Mokuoane, Koro-Koro, Maseru.
xxii Male focus group participant, „food only‟ beneficiaries, Ha Mokuoane, Koro-Koro, Maseru.
xxiii Male focus group participant, „food only‟ beneficiaries, Ha Mokuoane, Koro-Koro, Maseru.
xxiv Female focus group participant, „cash plus food‟ beneficiaries, Draaihoek, Mpharane, Mohale‟s
Hoek. xxv
Female focus group participant, „cash only‟ beneficiaries, Ha Morifi, Moiloa, Mekaling. xxvi
Male focus group participant, „food only‟ beneficiaries, Qhalasi, Taung, Mohale‟s Hoek. xxvii
Male focus group participant, „cash plus food‟ beneficiaries, Rothe, Masite, Maseru. xxviii
Male focus group participant, „cash only‟ beneficiaries, Ha Khosi, Mekaling, Mohale‟s Hoek. xxix
Female focus group participant, „food only‟ beneficiaries, Ha Mokuoane, Koro-Koro, Maseru. xxx
Female focus group participant, „food only‟ beneficiaries, Ha Mokuoane, Koro-Koro, Maseru. xxxi
Female focus group participant, „cash plus food‟ beneficiaries, Rothe, Masite, Maseru. xxxiii
Female focus group participant, „cash only‟ beneficiaries, Ha Maphathe, Matsieng, Maseru. xxxiv
Male focus group participant, „cash plus food‟ beneficiaries, Linotsing, Rothe, Maseru. xxxv
Male focus group participant, „cash plus food‟ beneficiaries, Rothe, Masite, Maseru. xxxvi
Male focus group participant, „cash only‟ beneficiaries, Ha Maphathe, Matsieng, Maseru. xxxvii
Female focus group participant, „cash only‟ beneficiaries, Ha Maphathe, Matsieng, Maseru. xxxviii
Male focus group participant, „cash only‟ beneficiaries, Ha Khosi, Mekaling, Mohale‟s Hoek. xxxix
Male focus group participant, „cash only‟ beneficiaries, Ha Morifi, Moiloa, Mekaling. xl Male focus group participant, „cash plus food‟ beneficiaries, Rothe, Masite, Maseru.
xli Male focus group participant, „cash only‟ beneficiaries, Ha Khosi, Mekaling, Mohale‟s Hoek.
xlii Male focus group participant, „cash only‟ beneficiaries, Ha Maphathe, Matsieng, Maseru.
xliii Male focus group participant, „cash plus food‟ beneficiaries, Draaihoek, Mpharane, Mohale‟s
Hoek. xliv
Female focus group participant, „cash only‟ beneficiaries, Ha Morifi, Moiloa, Mekaling. xlv
Female focus group participant, „cash only‟ beneficiaries, Ha Khosi, Mekaling, Mohale‟s Hoek. xlvi
Female focus group participant, „cash only‟ beneficiaries, Ha Khosi, Mekaling, Mohale‟s Hoek. xlvii
Male focus group participant, „cash plus food‟ beneficiaries, Rothe, Masite, Maseru. xlviii
Male focus group participant, „cash only‟ beneficiaries, Ha Khosi, Mekaling, Mohale‟s Hoek. xlix
Male focus group participant, „cash plus food‟ beneficiaries, Ponts‟eng, Mpharane, Mohale‟s Hoek.
l Female focus group participant, „cash plus food‟ beneficiaries, Rothe, Masite, Maseru. li Female focus group participant, „cash only‟ beneficiaries, Ha Maphathe, Matsieng, Maseru.
lii Male focus group participant, „cash only‟ beneficiaries, Ha Maphathe, Matsieng, Maseru.
liii Female focus group participant, „cash only‟ beneficiaries, Ha Maphathe, Matsieng, Maseru.
72
liv
Male focus group participant, „cash plus food‟ beneficiaries, Draaihoek, Mpharane, Mohale‟s Hoek.
lv Female focus group participant, „cash plus food‟ beneficiaries, Rothe, Masite, Maseru.
lvi Male focus group participant, „cash plus food‟ beneficiaries, Draaihoek, Mpharane, Mohale‟s
Hoek. lvii
Key informant interviews. lviii
Male focus group participant, „cash only‟ beneficiaries, Ha Maphathe, Matsieng, Maseru. lix
Female focus group participant, „cash only‟ beneficiaries, Ha Toloane, Matsieng, Maseru. lx Female focus group participant, „cash only‟ beneficiaries, Ha Maphathe, Matsieng, Maseru.
lxi Male focus group participant, „cash only‟ beneficiaries, Ha Maphathe, Matsieng, Maseru.
lxii Male focus group participant, „cash only‟ beneficiaries, Ha Morifi, Moiloa, Mekaling.
lxiii Female focus group participant, „cash only‟ beneficiaries, Ha Khosi, Mekaling, Mohale‟s Hoek.
lxiv Female focus group participant, „cash only‟ beneficiaries, Ha Khosi, Mekaling, Mohale‟s Hoek.
lxv Female focus group participant, „cash only‟ beneficiaries, Ha Toloane, Matsieng, Maseru.
lxvi Male focus group participant, „cash only‟ beneficiaries, Ha Morifi, Moiloa, Mekaling.
lxvii Female focus group participant, „cash only‟ beneficiaries, Ha Khosi, Mekaling, Mohale‟s Hoek.
lxviii Female focus group participant, „cash only‟ beneficiaries, Ha Morifi, Moiloa, Mekaling.
lxix Female focus group participant, „cash only‟ beneficiaries, Ha Khosi, Mekaling, Mohale‟s Hoek.
lxx Female focus group participant, „cash plus food‟ beneficiaries, Rothe, Masite, Maseru.
lxxi Female focus group participant, „food only‟ beneficiaries, Ha Mokuoane, Koro-Koro, Maseru.
lxxii Male focus group participant, „food only‟ beneficiaries, Qhalasi, Taung, Mohale‟s Hoek.
lxxiii Male focus group participant, „cash plus food‟ beneficiaries, Rothe, Masite, Maseru.
lxxiv Male focus group participant, „food only‟ beneficiaries, Qhalasi, Taung, Mohale‟s Hoek.
lxxv Female focus group participant, „cash only‟ beneficiaries, Ha Khosi, Mekaling, Mohale‟s Hoek.
lxxvi Male focus group participant, „cash only‟ beneficiaries, Ha Maphathe, Matsieng, Maseru.
lxxvii Focus group discussion with „food only‟ beneficiaries, Ha Mokuoane, Koro-Koro, Maseru.
lxxviii Male focus group participant, „food only‟ beneficiaries, Qhalasi, Taung, Mohale‟s Hoek.