200
* * ISSN 1018-5593 European Commission physical sciences High-temperature crack growth in steam turbine materials Report EUR 14678 EN
8/21/2019 Caso Rotura
http://slidepdf.com/reader/full/caso-rotura 1/200
* *ISSN 1018-5593
European Commission
phys ica l sc ien ces
High -temp era ture c rack growthin s team turbin e mate ria ls
Report
EUR 14678 EN

8/21/2019 Caso Rotura
http://slidepdf.com/reader/full/caso-rotura 2/200

8/21/2019 Caso Rotura
http://slidepdf.com/reader/full/caso-rotura 3/200

8/21/2019 Caso Rotura
http://slidepdf.com/reader/full/caso-rotura 4/200
' „ ^ s j ; ' * - .•»i?»'*
j »

8/21/2019 Caso Rotura
http://slidepdf.com/reader/full/caso-rotura 5/200
European Commission
phys ica l sc iences
High -temp era ture c rack growthin s team turbin e materia ls
J . EwaldSiemens Power Genera t ion Group KWU
Mülheim-Ruhr — Germany
T. HollsteinFraunhofer Inst i tut für Werkstoffmechanik
Freiburg — Germany
G. A. Webster and F. DjavanroodiImper ia l Co l lege of Sc ience and Techno logy
London — United Kingdom
S. R. HoldsworthGEC-Alsthom Turbine Generators Ltd
Rugby — United Kingdom
Edited by:
J . B. Marriott, Secretariat for COST 501 and COST 505,JRC, Petten, The Netherlands
Supported by the
European Commissionthrough Contract Nos
COST 0032-D.. .1COST 0014-D.. .2.3
COST 0015-UK...4 / July 1992
5
AÍ çhot AltZbr
Science, Research and u]e>ftMtøe£UR0P. Biblìotfl.D ¡ rectorate-G e n IfãrTTT""
1994 ( S j ç EUR 14678 Erv
cl ~

8/21/2019 Caso Rotura
http://slidepdf.com/reader/full/caso-rotura 6/200
Publish ed by theEUROPEAN COMMISSION
Directorate-Genera l XI I ITe lecommunica t ions , In format ion Market and Exp lo i ta t ion of Research
L-2920 Luxembourg
LEGAL NOTICENeither the European Commission nor any person acting on behalf
of the Commission is responsible for the use which might be made of thefollowing information
Cataloguing data can be found at the end of this publication
Luxembourg: Office for Official Publications of the European Communities, 1994
ISBN 92-826-7536-X
© ECSC-EC-EAEC, Brussels • Luxembourg, 1994
Printed in Italy
8/21/2019 Caso Rotura
http://slidepdf.com/reader/full/caso-rotura 7/200
Abstract
Modern steam turbines must retain a very high reliability throughout their service lifeof typically 200 000 hours, which in p ractice extends over m ore than 25 years. One of thefeatures which must be considered at the design and manufacturing stages and during theassessment of fitness carried ou t periodically during the service life is the growth of themanufacturing type defects at temperatures up to about 550°C.
Within the concerted action research programme CO ST 505, Materials for SteamTurbines one coordination group studied this problem with a view to enabling a moreaccurate evaluation of defect acceptability on the basis of data gathered using laboratorytest-pieces. The work of the group was structured under three headings which form thethree Parts of this Monograph:
* Part I - Cree p Crack Initiation and Growth in terms of K* Part n - Creep Crack Growth in 1 % C T M O V steel and Alloy 800H -
an evaluation of the results of the COST 505 and an EGFRound Robin
* Part HI - High Tem perature Fatigue Crack Growth in Steam TurbineMaterials.
In each part solutions are given according to the current state-of-art. None can beregarded, however, as giving a well established methodology for practical application.Further data will have to be determined together with results from complex, simulativebenchmark tests which remain to be conducted, before th ere will be sufficient critical
evidence upon which to base general rules for practical applications.

8/21/2019 Caso Rotura
http://slidepdf.com/reader/full/caso-rotura 8/200

8/21/2019 Caso Rotura
http://slidepdf.com/reader/full/caso-rotura 9/200
HIGH TEMPERATURE CRACK GROWTH IN STEAM TURBINE MATERIALS
~ Preface
Materials for power engineering applications have been important for various concertedaction research programmes throughout the 20 year history of COST. Within this field,one of the areas to which specific attention has been devoted in recent years has beenMaterials for Steam Turb ines; COST 505 . The countries represented in this programm e
were Austria, Belgium, Denmark, Finland, Germany, Italy, Sweden, Switzerland andUnited Kingdom together with the Joint Research Centre of the Commission of theEuropean Communities. Jointly, organisations from these countries tackled a range ofproblems concerned with the improvement and reliability of steam turbines.
One of the coordination groups containing the 7 organisations Usted in Table A on page7 was involved with high temperature crack growth. They had the overall objective to
enable a more accurate evaluation of defect acceptability in full scale power plantcomponents on the basis of data gathered using laboratory test-pieces. The defects wereunderstood to be those associated with the manufacturing process rather than defectsinitiated by creep exhaustion.
The work of this group was structured under three headings:* creep crack initiation and (early) growth* creep crack growth* high tem pera ture fatigue crack growth
These subjects formed the basis of reports in which the work was reviewed and evaluated
in the light of presen t day literatu re and experience in studies which were conducted withsome financial assistance from the Commission of the European Communities. Theround robin work in the second heading was also integrated into a task being undertakenby the European Group for Fracture (now ESIS) and reported by them in 1990.
The three constituent pa rts which make u p this Monograph a re independ ent in terms ofchapters, literature references, table and figure numbering. They are , however, precededby a common Executive Summary and an integrated list of the symbols and abbreviationsused throughout
Acknowledgement must be given to the input which all of the participants made
throughout the investigations and also when the reports were being prepared. Theassistance of Dr. S.R. Holdsworth with the preparation of the list of symbols is alsogratefully acknowledged.
J.B. Marriott
Secretariat for COST Projects 501/505EUCO/MST/01/92JBM/tp/1/1397Petten, July 1992
V -

8/21/2019 Caso Rotura
http://slidepdf.com/reader/full/caso-rotura 10/200

8/21/2019 Caso Rotura
http://slidepdf.com/reader/full/caso-rotura 11/200
Contents
Executive summary 1
List of symbols used throughout 11
Part I Creep Crack Initiation and Growth in Terms of K 21
1. Basic considerations upon the use of K 23
2. Crack tip/farfield models 27
3. Test results on creep crack growth 33
A . Discussion of results 38
5. Conclusions 43
References 44
Table 46
Figures 47
Pa rt II Creep Crack Growth in 1% CrMoV Steel and Alloy 800H -an evaluation of the results of the COST 505and an EGF Round Robin 69
1. Introduction 71
2. Material 73
3. Specimens and test procedure 76
4. Param eter determination 78
5. Num erical investigations 79
6. Results 83
VII

8/21/2019 Caso Rotura
http://slidepdf.com/reader/full/caso-rotura 12/200
7. Discussion 84
8. Con clusions 91
References 92
Tables 96
Figures 104
Pa r t H I High Tem peratu re Crac k Growth in S team Turb in e M ater ia l s 129
1. Introdu ction 131
2. Fatigu e crack growth regimes 131
3. High tem pe ratu re fat igue crack growth correlat ion pa ram ete rs 132
4. Low strain fatigue 134
5. H igh stra in fatigue 138
6. High tem pe ratu re crack growth in we ldmen t micro structures 139
7. G en era l observat ions 140
8. Con clusions 141
References 143
Tables 145
Figures 147
VIII

8/21/2019 Caso Rotura
http://slidepdf.com/reader/full/caso-rotura 13/200
COST 505
HIGH TEMPERATURE CRACK GROWTH IN STEAM TURBINE MATERIALS
Executive SummaryJ. Ewald. Coordinator
Introduction
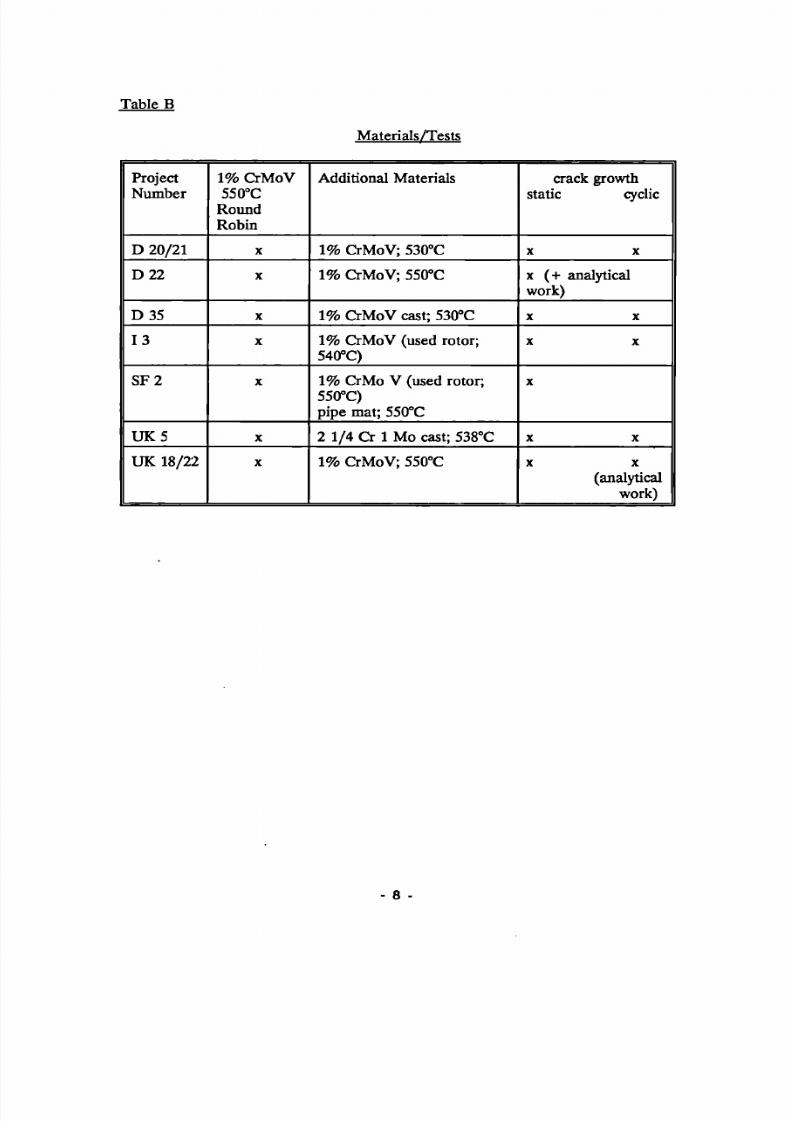
Within COST 505 Materials for Steam Turbines , the High Temp eratu re Crack GrowthWorking Group contained 7 research groups, Tab le A. They investigated 1% CrMoV,2 1/4 Cr 1 Mo and 1 Cr 0,5 M o steel forgings, castings, and p ipes with respect to staticcreep crack initiation and growth and to cyclic crack growth, between 530 and 550°C,Table B. In addition to the mechanical testing, 2 groups (D22 and UK18) performedfinite element analyses to control the validity range of C application and to investigatewhether cracked specimens creep under plain strain or plain stress conditions.
Principal Findings
The m ain conclusions which can be drawn from the results and evaluations of the workof the group can be summarised as follows:
In spite of the undoubted plane strain situation which exists near to the crack tip,the overall structure is exposed to creep under a plane stress condition, whichmeans that the load line displacement rate of the specimens - which is decisivefor the amount of C* - is dominated by plain stress behaviour.
The behaviour of the specimen within the range of the tails and during the earlycreep crack stage may be described in terms of K with additional geometry factorssuch as a crack tip/farfield ratio.
The real creep crack behaviour with higher creep crack rates can best bedescribed by means of C*2 which is a version of C* including the load linedisplacement due to creep. However, it is probable that these displacement ratescan rarely be measured in service for low stress, long time loadedspecimens/components.
Cyclic crack growth is accelerated by hold time. The hold tim e cyclic crack growthrates lie between the cyclic crack growth and the static crack growth curves.Numerical accumulation rates
da/dN total = d a / d N ^ + da/dN ,creep
based on an equivalent AK, considering the cyclic crack closure effects and C forhold time effects were investigated and used to describe the cyclic crack growthbehaviour.
- 1 -

8/21/2019 Caso Rotura
http://slidepdf.com/reader/full/caso-rotura 14/200
The solutions given in of this Monograph have been obtained according to the currentstate of the art, but none can be regarded as giving a well established methodology forpractical application. In the area of static high tempera ture crack growth further data willhave to be determined for specimens with different shapes and sizes under loading
conditions which lead to long crack initiation times and low crack growth ra tes for m oreor less creep ductile materials. A broad data base will have to exist before the finaldecision can be made about the most economic and appropriate evaluation method.
With respect to high temperatu re fatigue crack growth the situation is similar. Th ere aremany data, a considerable level of mechanistic understanding and various proposals forevaluation methods, but even here there remains a lack of critical evidence upon whichto base general rules for practical applications. Furthermore, it is necessary to have agood data base for creep crack growth because according to the proposed accumulationrules for load controlled cyclic crack growth with hold times both static and dynamictypes of data are required.
However, there still remains the complex loading condition of strain controlled cyclesarising from therm al stresses with superimposed stress relaxation. This type of behaviouris frequently met in service and so far it has not been possible to model the behaviourusing relatively simple laboratory tests. At p resent the only way to obtain information isby performing expensive tests which closely follow the actual load cycles.
These conclusions have been established on the basis of three studies, which wereconducted with partial financial assistance from CEC, DG XH-Gl, to review the workof the Group and to examine separate aspects of the field. The summaries of thesereports follow in the order:
Part I - Creep crack initiation and growth in term of K by J. Ewald;
Part n - Creep crack growth in 1 % CrMoV steel and Alloy 800 H - an evaluationof the results of the OCST 505 and E G F round robin by T. Hollstein,G.A Webster & F. Djavanroodi;
Part HI - High tem pera ture fatigue crack growth in steam turbine materials by S.Holdsworth
8/21/2019 Caso Rotura
http://slidepdf.com/reader/full/caso-rotura 15/200
P a r t i
Creep Crack Initiation and Growth in Terms of KJ. Ewald
Siemens, Power Generation Group KWU, Mülheim-Ruhr, Germany
It is clear that two schools of thought exist about the selection of the appropriateparameter for creep crack initiation and growth. There are the protagonists of C*, whofeel supported by the fact that C* is the loading param eter which is reasona ble from thephysical point of view. On the other hand there are the people who try to apply creepcrack initiation and growth data in terms of K for the description of components whichhave thick walls, long loading times, and low loading stresses. With respect to crackinitiation it can be concluded:
Ky,, (the fictitious or ideal elastic stress intensity factor) seems to be basicallyusable to describe the crack tip situation for crack initiation.
The time for crack initiation increases with decreasing crack tip driving force(K lid), Fig. A.
Specimen size and shape determine the damage m ode and the related specimenbehaviour. Therefore, it is necessary to use Kj¡d together with the parameter Gn
(nominal stress or net section stress) to describe the farfield loading situation,because within the creep range time dependent changes in stress distribution,exhaustion and damage occur both at the crack tip and in the farfield (ligament).
Consequently, crack initiation can be described basically by means of a twocriteria diagram for creep crack initiation which covers the rang e of the tailsfrom å = f (K Iid) plots and which is able to demonstrate the influence of differentcrack tip/farfield ratios K E d/G n.
Creep ductility dramatically influences the creep crack initiation and growthbehaviour. Notch weakening m aterials should be avoided, since they tolerate onlyextremely short defects. The related data base for these materials is not yetavailable.
The creep crack growth behaviour when there is only a limited crack increment may bedescribed by plots of K,¡d over t with param eter lines for a, similar to Fig. A. However,with such diagrams, which are only valid for CTl-specimens, it is hardly possible toestimate the influence of specimen shape and thickness. Thus, crack growth with smallincrements should be rated with diagrams like Fig. B which shows the influence ofspecimen shape and specimen thickness, e.g. lateral constraint If it is necessary todescribe the behaviour of cracks of greater depth, the crack tip/farfield method with V0
= Kjjd/G,, or some kind of description by means of C* may be used. This aspect isconsidered in greater detail in Part II of this Monograph.
- 3 -

8/21/2019 Caso Rotura
http://slidepdf.com/reader/full/caso-rotura 16/200
The most important point for the future is to generate further data on specimens withdifferent shapes and sizes with long crack initiation times and low crack growth rates.This would allow a final decision to be made about the most economic and appropriateevaluation method.
P a r t i i
Creep Crack Growth in 1 CrMoV Steel and Alloy 800H - an eva luation of the resultsof the COST 505 and an EGF Round Robin
T. Hollstein*, GA . Webster**, F. Djavanroodi**
* Fraunhofer Institut für Werkstoffmechanik, Freiburg, Germ any
** Imperial College of Science and Technology, London , UK
Experiments and analyses have been performed on a 1% CrMoV steel and on Alloy800H which have shown that creep crack growth in these materials is described mostsatisfactorily by the creep fracture mechanics parameter C*. Recommendations havebeen made about how to obtain the most reliable estimates of C* from experimentalmeasurements. These have been supported by numerical computations, Fig. C. It hasbeen found that the use of 20% side grooves (10% of the total thickness each side) incompact tension specimens, and a seven-point polynomial fît to obtain crack growth anddisplacement rates, produces the most consistent correlations.
It has been dem onstrated for the 1% CrMoV steel that all the cracking took place underplane stress conditions, Figs. C and D . Increased scatter, due to 'tails' in the early stagesof cracking, Fig. D , has bee n shown to be caused mainly by the progressive build up ofdamage at the crack tip until a steady state distribution is reached. This can take up to30% of the life of a specimen and can be important in practical applications. However,little evidence of a 'tail' was noticed for Alloy 800H.
Comparisons have been made with data obtained in other test programmes on the 1%CrMoV steel. These have reinforced the findings of this investigation.
Part III
High Temperature Fatigue Crack Growth in Steam Turbine MaterialsS.R. Holdsworth
GEC Alsthom Turbine Generators Ltd., Rugby, UK
Th e high temperature fatigue crack growth (HTFC G) p roperties of a number of steamturbine m aterials have be en reviewed. Many of the results were gathered by membersof the COST 505 High Temperature Crack Growth Working Group who were active
- 4
8/21/2019 Caso Rotura
http://slidepdf.com/reader/full/caso-rotura 17/200
during the period 1985 to 1988, but additional information has also been collated fromthe published literature to complete the overview.
High temperature low and high strain fatigue crack growth rates may be considered interms of two components, one due to cyclic loading and the second due to creep, ie
da/dN total = d a / d N ^ + d a / d N ^
The da/dNjydj,. term is a power law function of A K ^ (the equivalen t cyclic stressintensity) and may be influenced by crack tip damage due to oxidation and prior creeploading. ăa dNmep is expressed in terms of the C* parameter.
At 530/550°C and for a range of steam turbine forging, casting and pipe steels, there is no apparent effect of creep on low strain fatigue crack growth rates for frequencies in excess of 1Hz.
HTFCG threshold AK levels increase with decreasing frequency due to oxide blocking and crack closure whereas at somewhat higher AKs, low strain fatigue crack growth rates increase with decreasing frequency due to enhanced oxide growth.
For frequencies less than 1Hz, da/dn,otai is still mainly influenced by oxide assisted growth effects on d a / d N , ^ at relatively low AKs. However, with increasing AK, the role of oxidation diminishes and creep becomes more important through its effect on da/dN^y,. and its contribution in terms of d a / dN^ ^ .
In a simple engineering model d a / d N ^ ^ for a given AKeq, increases to a maximum as the crack tip damage zone develops to the critical condition necessary for th e onset of creep crack growth. The prior hold time necessary to achieve this peak acceleration increases with increasing creep ductility.
At frequencies below 13Hz when the cycle is in load control, fatigue crack growth rates
are determined by the rate of creep crack growth (ie the magnitude of da/dN^y,. is small relative to that of åa/äSmcp). This is not always the case when HTFCG is due to a strain controlled cycle. In these circumstances, stress relaxation occurs and da /dN^^ , is no t the dominant crack growth component until still lower frequencies.
The resistence of a material to creep-fatigue crack growth is strongly influenced by creep ductility. The magnitudes of both cyclic and creep crack growth rate components are lower for steels with high creep ductility.
Prior long term thermal exposure (without load) has no influence on high temperature fatigue crack growth rates, at least while th e ageing treatment is no t responsible for a significant reduction in creep ductility.
In load controlled tests, high temperature fatigue crack growth rates through the weld heat affected zone (HAZ) of a cast lCrMoV steel are faster than those through the parent material at frequencies of around 0.1Hz. The difference in cracking rates increases dramatically with the introduction of a hold time at peak load, coinciding with
5 -

8/21/2019 Caso Rotura
http://slidepdf.com/reader/full/caso-rotura 18/200
a change in fracture path from the partially transformed intercritical HAZ to the fullytransformed coarse grain HAZ immediately adjacent to the fusion boundary.
High temperature fatigue crack growth rates through the weld HAZ and parentstructures of a cast 12CrMoV steel are similar in both low frequency continuous cycleand peak load hold time tests. For the test conditions investigated, all fracture paths inweldment tests are contained within the soft sub-critical HAZ.

8/21/2019 Caso Rotura
http://slidepdf.com/reader/full/caso-rotura 19/200
Table A
Research Projects
No.D 20/21
D 22
D 35
1 3
SF 2
UK 5
UK 18/22
OrganisationSiemens
IWM Frbg.
AEG
ENEL
V i l Espoo
GEC-A
Imp. Coll.
Project ResponsibleBerger/Ewald
Hollstein
Kanbach
Ragazzoni
Rintamaa
Holdsworth
Webster/ Djavanroodi
- 7
8/21/2019 Caso Rotura
http://slidepdf.com/reader/full/caso-rotura 20/200
Table B
Materials/Tests
ProjectNumber
D 20/21
D 22
D 35
1 3
SF 2
U K 5
UK 18/22
1% CrMoV550°C
RoundRobin
X
X
X
X
X
X
X
Additional Materials
1% CrM oV; 530°C
1% CrMoV ; 550°C
1% CrMoV cast; 530°C
1% CrMoV (used rotor;540°C)
1% CrMo V (used rotor;550°C)pipe mat; 550°C
2 1/4 G 1 Mo cast; 538°C
1% CrM oV; 550°C
crack growthstatic cyclic
X X
x (+ analyticalwork)
X X
X X
X
X X
X X
(analyticalwork)
8 -

8/21/2019 Caso Rotura
http://slidepdf.com/reader/full/caso-rotura 21/200
scatterband, makroscop. Creep Crack Initiation Siemens 1989
100 1000 10000 loading t ime ( h )
100000
Fig. A Creep Crack Initiation, 1 CrMoNiV 530°C, CT25S
Specim.Thickn. (mm) D X
+ V Y D A O o O
CT 25/50S , a/W = 0.55 CT 50/1 OOS , a/W = 0.55
CT100/200 , a/W = 0.55 0 9 , a/W = 0.40 D60 , a/W = 0.40 D60 , a/W = 0.20 D60 , a/W = 0.10
CT12.5 , a/W = 0.50 CCP , a/W = 0.50 SENT , a/W = 0.20
1%CrMO(Ni)V,T = 550'C
D.60
A A 6
$ 1 0 0
0 X ¡ Q \ Hollstein
' 2 5 / C T 1 2 . S -D^-^Jfom a ,
50 [ 3 ]
10 10 0 1000 loading t ime t¡ ( h )
10000
Maile/Tscheuschner |Siemens|Ragazzoni| Hollstein |Holdsworth|Rintamaa c * + A Y O A
0.004W(CT),0.01W(OENT) spark eroded
B •0,5mm
a O • 0,5mm
CT25 - , CT5 0 X
■ 0,3mm
D - O '0,2mm
Fig. B fatigue precracked
a o - 0,5mm
Creep Crack Initiation for different specimen thickness and size

8/21/2019 Caso Rotura
http://slidepdf.com/reader/full/caso-rotura 22/200
2ICrMoNiV57. T = 550°C CT12.5M0 specimen AB2B
tH R
8 -
§ °
pi strain (à 10) pi . stress (á=0) / pi. strain(àsO)
y ¿. s
8 - | — , — | — i — i — i — , — i — i — i — i — i — i — i — i — I I I I I I T~
°0.00 1.00 2.00 3.00 4.00 5.00 6.00 7.00 B.00 9.00 10.00 11.00
t . se c CE+06)
F i g . C Exp e r i m e n t a l a n d n u m e r i c a l e va l u a t i o n o f C * f o r C T 12 .5 / 40 spec imen A B 2 B , w i t h a n d w i t h o u t c r a c k g r o w t h
Q B D 3 , B D » , B D S . B W 1 , B W 2 , B W 3 , A H J . A H * , A O S , A Q 5 , B C l , B C 2 , A N Í , A E l , A E 2
Q A F Î . A B 3 . A B R A M I , A H I , A l l , A I 2 , A B S , A B Í , A E S , A C 1 - 6 ( C T I 5 / S 0 )
S A N 1 . A N 3 . A N « , A 0 3 ( C T 2 0 / 4 0 ) • RR 5 (SENB 9 .5 /191
O AQ1 .AQ2 ( C N I 2 . S / S 0 )
+ ABZA .AB1B ( C P ï . S / « a )
M A P I . A P 2 . A P 3 ( C T 5 0 / 1 0 0 )
D AM1 .AM2 ( S E N T 1 2 / 2 0 )
X BE31.BE32 ( C T 1 0 / 2 0 ) ' *
♦ BB 1 ( C T 6 Ï . S/137)
o C C P 5 .C C P Í (CN2S /S0 )
. A A1G.A17 ( C Z 1 5 / Ï 0 )
■ RR 7 ( C T 13 /16 )
*t / S
-• <■
CT j / f c n 2« ]
F i g . D C r a c k g r o w t h r a t e â i n 1 C r M o V s t ee l a t 550°C as a f u n c t i o n o f C * .
10 -

8/21/2019 Caso Rotura
http://slidepdf.com/reader/full/caso-rotura 23/200
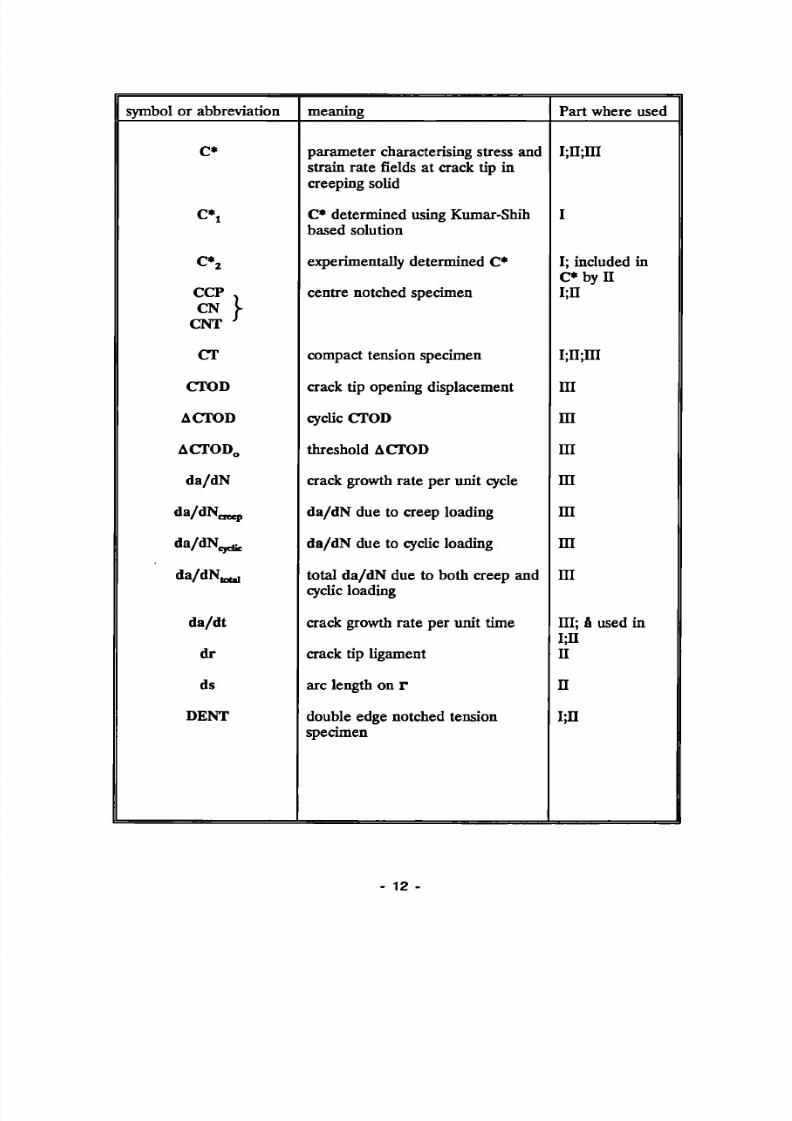
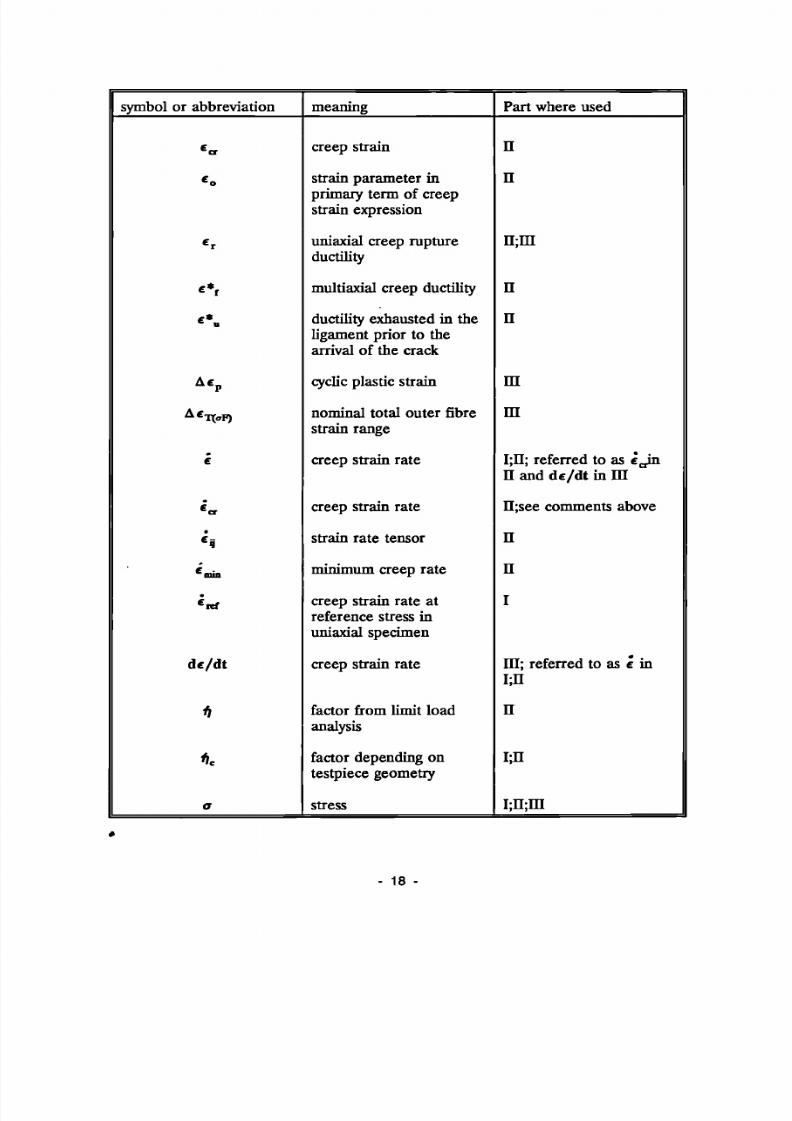
List of symbols and abbreviations used throughout the Monograph
symbol or abbreviation
a
a0
Aa
Aa¡
á
â.
A
A,
(bk
b(t„, er)
B
B .
B .
C
C(f, t„, er)
C '
meaning
crack length
initial crack depth
crack extension
crack initiation criterion
crack growth rate per unit time
initial creep crack growth rate
steady state creep crack growthrate .
uniaxial elongation at fracture
impact energy
remaining ligament (w-a)constant in creep crack growthEquation.
function of hold time and ductilityin creep crack growth expression
specimen thickness
effective B = B - (B-BJ2/B
net section thickness
constant in Paris FCG law
function of frequency, hold timeand creep ductility in d a / d N , ^law
constant in Norton minimum creeprate law
Part where used
i;n;mI;H
n
i
I;II; da/dt usedin IIIn
n
II ; El also usedb y n
n
n \m l
m
I;II;m
n
i;n
m
ra
n;m
- 11
8/21/2019 Caso Rotura
http://slidepdf.com/reader/full/caso-rotura 24/200
symbol or abbreviation
C*
C*
c*2
CCP .CN \-
CNT J
CT
CTOD
ACTOD
ACTOD0
da/dN
d a / d N ^
d a / d N ^
da/dN,,^
da/dt
dr
ds
DENT
meaning
parameter characterising stress and
strain rate fields at crack tip increeping solid
C* determined using Kumar-Shinbased solution
experimentally determined C*
centre notched specimen
compact tension specimen
crack tip opening displacement
cyclic CTOD
threshold ACTOD
crack growth rate per unit cycle
da/dN due to creep loading
da/dN due to cyclic loading
total da/dN due to both creep andcyclic loading
crack growth rate per unit time
crack tip ligament
arc length on r
double edge notched tensionspecimen
Part where used
I;II;m
I
I; included inC byü
i;n
i;n;m
m
m
m
m
mm
m
lu; å used ini;nn
nr,n
12 -

8/21/2019 Caso Rotura
http://slidepdf.com/reader/full/caso-rotura 25/200
symbol or abbreviation
E
E '
El
f
F
FCG
G
gi(7w,ß)
gi(7W,n)
H
HAZ
HSF
HTFCG
In
ICHAZ
meaning
elastic modulus
elastic modulus includinglateral contraction (i.e.including pi. e)
uniaxial elongation atfracture
frequency; dN/dt
load
fatigue crack growth
elastic strain energyrelease rate
geometry function inKumar-Shih J solution
geometry function inKumar-Shih based C* (orC*i) solution
constant in cyclichardening law
heat affected zone
high strain fatigue
high temperature fatiguecrack growth
non dimensional functionof n
intercritical HAZ
Parts where used
m
i
II; A also used by
m
I;H; P used in m
mn
m
I;ffl
m
m
m
m
n
m
i;n
13 -

8/21/2019 Caso Rotura
http://slidepdf.com/reader/full/caso-rotura 26/200
symbol or abbreviation
J
AJ
k,
K
AK
Kc
K *
A K ^
Kt
K M
K W o
Kno
Knm
Kniin
A K C
A K «
meaning
path independent lineintegral characterising
stress and strain fields atcrack tip in plasticallydeforming solid
cyclic J
theoretical elastic stressconcentration factor
elastic stress intensityfactor
cyclic K
apparent elastic K
critical value of K leadingto instability
effective K
cyclic K ^
initial K
fictitious (ideal) K
K M at a0
creep crack initiation K
maximum K
m i n i m u m K
equivalent A K
total AK
Parts where used
i ;m
m
I
I;II;m
mIH; referred to as KM
i n i
m
I
m
H; referred to as K ^ in I
I; referred to as KA in UI
I
I; referred to as K¡ in II
i n
m
m
m
14

8/21/2019 Caso Rotura
http://slidepdf.com/reader/full/caso-rotura 27/200
symbol or abbreviation
AK„
LSF
M
WJt» O
n
N
P
* D E
* D S
^ m a x
min
Po
q
q»
r c
R
R '
meaning
fatigue crack growththreshold A K
low strain fatigue
exponent in Paris law
exponent in da/dN cycliclaw
stress exponent inNortons (minimum creeprate) law
number of cycles
load
load at end of dwellperiod
load at start of dwellperiod
maximum load
minimum load
crack opening load
exponent in creep crackgrowth rate law
effective load range
creep damage zone size
load ratio (R=KmJKaJ
geometrical variablerelated to crack tip -farfield condition ie.R' =( K 2 / 0
Parts where used
m
m
m
m
I;II;m
n i
HI; F used in I;II
m
m
m
m
m
m
m
n
HI; also used for radialdistance from centre ofbar in H
I
- 15 -

8/21/2019 Caso Rotura
http://slidepdf.com/reader/full/caso-rotura 28/200
sym b ol or ab b r e v i a t i on
R "
RA
Rpo.2
Rpi
R »
Rff
RK
R«,«
S E N B
S E N T
S C H A Z
t
»d
tf
»h
ti
t .
' i
m e a n i n g
ac t i vat i on e ne r gy t e r m
uni ax i a l r e duc t i on o f ar e aat fracture
0 . 2% pr oof s t r e ngth
1 % pr oof s t r e ngth
te ns i l e s t r e ngth
stress rat io (o^JR^
stress intensi ty rat io(Kftjo/Km))
c r e e p r uptur e s t r e ngth
s i n g l e e d g e n o t c h e d b e n ds p e c i m e n
s i ng l e e dge notc he dt e n s i o n s p e c i m e n
subcr i t icai HAZ
t i m e
t ime at which crack t ipc r e e p dam age f i r s t for m s
t ime to fai lure
hold t ime
time at w hic h crack tipc ondi t i ons ar e r e spons i b l efor creep crack ini t iat ion
t ime to rupture
tr ans i t i on t i m e
P a r t w h e r e u s e d
n
H; Z also used by II fors a m e p u r p o s e
i;n
n
n
i
i
I; re ferred to as a 0 in II
I;II;m
n
m
I;ü;in
m
II; referred to as tr in I
m
I;ÜI
I; referred to as t f in II
i;n
- 16

8/21/2019 Caso Rotura
http://slidepdf.com/reader/full/caso-rotura 29/200
symbol or abbreviation
T
T¡
ú ¡
U*
5U*/ ía
V
v£
vL
AVL
v.
v.
w
w*
X
Y
Z
ß
e
meaning
temperature
traction vector (T¡ = a^np
displacement rate vector
energy term
energy dissipation rate
load line displacement
crack openingdisplacement
load line displacement
cyclic VL
crack tip farfield ratio^ o = ^ D d o / f f i i o a e b e l
load line displacement
rate due to creep
specimen width
stress work ra te
distance
compliance/geometryfunction in K solution
uniaxial reduction of areaat fracture
exponent in cyclichardening law
strain
part where used
n
nn
n
n
I; H; referred to as VL
m
m
Iu ; referred to as V in
m
I
i;n
i;n;ra
n
n
m
H; RA also used by H
m
i;n;m
in
I
17
8/21/2019 Caso Rotura
http://slidepdf.com/reader/full/caso-rotura 30/200
symbol or abbreviation
e c r
« o
e r
« * f
«*.
A e p
A e T ( 0 P )
é
¿ c r
¿ S
'min
« « f
de/dt
D
Oc
a
meaning
creep strain
strain parameter inprimary term of creepstrain expression
uniaxial creep ruptureductility
multiaxial creep ductility
ductility exhausted in theligament prior to the
arrival of the crack
cyclic plastic strain
nominal total outer fibrestrain range
creep strain rate
creep strain rate
strain rate tensor
minimum creep rate
creep strain rate atreference stress inuniaxial specimen
creep strain rate
factor from limit loadanalysis
factor depending ontestpiece geometry
stress
Part where used
n
n
n;m
n
n
m
m
I;II; referred to as ¿„inn and de/dt in m
II;see comments above
n
n
I
III; referred to as £ ini;n
n
i;n
i;n;m
18

8/21/2019 Caso Rotura
http://slidepdf.com/reader/full/caso-rotura 31/200
symbol or abbreviation
La
ff STM
» .
»«*
a n ã c b c l
» u n d i c i
°0
°ra
aY
r
meaning
cyclic stress
nominal stress as definedby ASTM
nominal stress forcomponents, net sectionstress for specimens
net section stress
nominal stress accordingto Siebel
a„ úax¡ for initial crackdepth a„
plain specimen rupturestrength
reference stress
yield strength
integration path aroundcrack tip connecting lower& upper crack face in acounter clockwisedirection
Part where used
m
I
I; for tensile specimens,alternatively referred toas ona in IÜ
HI; see comment above
I
I
U; referred to as R,,,, in I
I
m
n
- 19

8/21/2019 Caso Rotura
http://slidepdf.com/reader/full/caso-rotura 32/200

8/21/2019 Caso Rotura
http://slidepdf.com/reader/full/caso-rotura 33/200
HIGH TEMPERATURE CRACK GROWTHIN STEAM TURBINE MATERIALS
Parti
Creep Crack Initiation and Growth in Terms of K
J. Ewald
Siemens, Power Generation Group KWU,
Mülheim-Ruhr, Germany
21

8/21/2019 Caso Rotura
http://slidepdf.com/reader/full/caso-rotura 34/200
8/21/2019 Caso Rotura
http://slidepdf.com/reader/full/caso-rotura 35/200
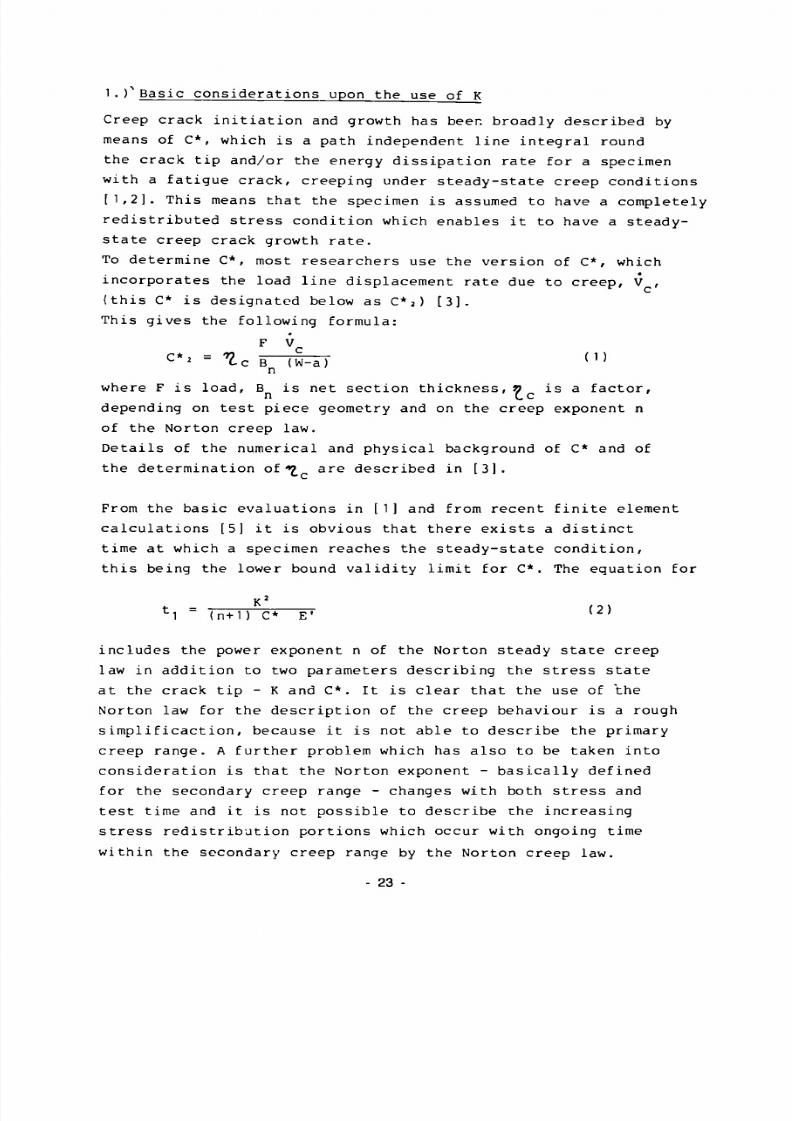
1.r Basic considerations upon the use of K
Creep crack initiation and growth has been broadly described by
means of C*, which is a path independent line integral round
the crack tip and/or the energy dissipation rate for a specimen
with a fatigue crack, creeping under steady-state creep conditions
[1,2]. This means that the specimen is assumed to have a completely
redistributed stress condition which enables it to have a steady-
state creep crack growth rate.
To determine C*, most researchers use the version of C*, which
incorporates the load line displacement rate due to creep, V ,
(this C* is designated below as C* 2) [3].
This gives the following formula:
C* ' = t e B (W-a) <')n
where F is load, B is net section thickness, n is a factor,
depending on test piece geometry and on the creep exponent n
of the Norton creep law.
Details of the numerical and physical background of C* and of
the determination o f ^ are described in [ 3] .
From the basic evaluations in [1] and from recent finite element
calculations [5] it is obvious that there exists a distinct
time at which a specimen reaches the steady-state condition,
this being the lower bound validity limit for C*. The equation for
fc1 = (n+1) C* Ë1" ( 2 )
includes the power exponent n of the Norton steady state creep
law in addition to two parameters describing the stress state
at the crack tip - K and C*. It is clear that the use of theNorton law for the description of the creep behaviour is a rough
simplificaction, because it is not able to describe the primary
creep range. A further problem which has also to be taken into
consideration is that the Norton exponent - basically defined
for the secondary creep range - changes with both stress and
test time and it is not possible to describe the increasing
stress redistribution portions which occur with ongoing time
within the secondary creep range by the Norton creep law.
- 23 -

8/21/2019 Caso Rotura
http://slidepdf.com/reader/full/caso-rotura 36/200
Nevertheless, t ] is an estimate of the time from which C* can
be used. For t i m e s * t., the basic mathematical formulation
shows that C* is path dependent and then the use of C [4] or
simply K is allowed.
The practical application of the C* 2 integral is limited bythe current availability of'7 solutions for different geometries
[7,8]. This means that additional expensive analysis is required
for non standard configurations and complex components. In addition,
the measurement of V for real existing cracks in a component
or specimen loaded to a low stress and for a long duration is
rather difficult or even impossible because of the small displace
ment rates involved. It therefore makes sense to try to use
the fictitious stress intensity factor K T. . to describe thelid
conditions at the crack tip. This is done in spite of the knowledge
that its use is incorrect in physical terms. Nevertheless, K... ,
serves as a vehicle to describe the geometrical situation near
the crack tip for a specimen/component. However, because we
are considering creeping bodies, it is not sufficient to use
K-., as the only parameter to describe the crack tip behaviour
of the component.
A single parametric approach to describe the crack tip such
as K or J can only be used in the sub-creep regime where the
yield strength, which depends on temperature but not on time,
is the decisive material characteristic. Within the creep range
the situation is different because - as mentioned before - time
dependent changes in stress distribution occur both at the crack
tip and in the farfield (ligament). Consequently, exhaustion
and damage of the material have to be considered not only at
the crack tip but also in the farfield as time goes on.
This means that a crack tip/farfield concept must be employedto assess crack initiation and growth in the creep range. Models
covering the crack tip/farfield situation have been developed
and proposed step by step since 1979 [9-13]. A "two criteria
diagram of creep crack initiation" was developed in 1984 [10,11],
which can be used to assess the crack initiation behaviour of
ductile CrMoV grades of steel and which can also be adapted
to other steel grades.
24

8/21/2019 Caso Rotura
http://slidepdf.com/reader/full/caso-rotura 37/200
Later in 1987 [12,13] attempts were made to describe the creep
crack growth behaviour in a consistent manner by a crack tip/far-
field ratio, K Ţ. J / G too. In [14] similar concepts to describe
the specimen behaviour in terms of K were developed.
It was clear from the very beginning that the use of K for speci-mens and components with large ligaments such as castings with
thick walls and rotors wich are subjected to long loading times
at relatively low stresses does not seriously affect the validity
conditions of the K-parameter. This was because, according to
[1], K may be used if the material is creep ductile, but the
creep zone, in spite of the long loading times, is small in
relation to the crack length and/or the specimen width (as a
result of low net section stress).
The other validity conditions for K which exclude the use of
C* are:
- the material is creep brittle (low creep deformation capacity),
- the material is creep ductile, but the creep zone is still
small due to short loading times ( t < t . ) .
For ductile materials the latter condition may also support
the trend to apply K, at least in the range of ongoing stress
redistribution and crack initiation.
The need to use a 2nd parameter for the farfield, which is the
nominal stress, is supported in total by 3 facts [11]:
1. The time dependence of the material characteristics, as mentioned
before.
2. The possible existence of different farfield stresses in
specimens of different sizes and shapes in spite of a constant
crack tip parameter K (Fig. 1) .
3. The finding from finite element calculations that the experi-
mental results were best fitted by assuming plane stress
conditions [3,5] (Fig. 2 ) . This means that in spite of the
undoubted existance of a plane strain condition within the
near crack tip region, the farfield with its plane stress
condition dominates the behaviour of the specimen.
The last finding gives an additional hint, why the C*2-version
with V (load line displacement due to creep) describes the
specimen behaviour best and why the other C*-version based on
the Norton's power exponent n:
- 25 -

8/21/2019 Caso Rotura
http://slidepdf.com/reader/full/caso-rotura 38/200
C*, = a- n
n\ ,3)
does not fit the experimental results in a satisfactory manner.
The reason is that V describes the overall specimen behaviour
by combining the influences of stress and time at the crack
tip and in the farfield. Unfortunately, the C*2 = f (V )-version
is less practicable in long time/low stress situations, for
the reasons-outlined above.
In the following chapters the different crack tip/farfield models
for crack initiation and growth will be described and specific
data which were evaluated in the course of the work of the COST
505 High Temperature Crack Growth Group [15-20] or are available
in the literature will be summarised and their usefulness ex-
plained.
Basically it is the aim of these models to use K in a manner
similar to the employment of the elastically determined stress
concentration factors, K , in the plastic and creep range in the German design rules [9,26,27].
In order to distinguish this K used in the creep range from
LEFM K, it is called K T. , [19]. lid
With the use of K Ţ . , as the crack tip geometry describing factor
and the farfield nominal stress it is believed that the basic
stress features of a specimen/component are fixed so that it
should be possible to describe the creep behaviour of a specimen
or a component using the data of other specimens or components
which have the same stress features. In this case, it is un-
important that the use of K Ţ. , may not be correct in physical
terms over the whole loading range.
26

8/21/2019 Caso Rotura
http://slidepdf.com/reader/full/caso-rotura 39/200
2.) Crack tip/farfield models
2.1 Basic considerations
As explained above, in addition to the application of K . , as
the parameter describing the crack tip situation, the nominal
stress within the farfield has to be taken into consideration.
According to ASTM E 616-82, the nominal stress within the ligament,
i.e. the farfield, of the usual fracture mechanics specimen
is determined as follows: ■
For symmetrically loaded specimens (DENT, C N T ) ,
^ASTM = F / B ( W- a )- ( 4 )
For specimens with bending fractions, (e.g. C T ) , ^ASTM = F / ( B ( W _ a ) ) ( 1 3 (W + a)/(W-a)). (5)
In specimens with tensile loading and bending, the linear elastic
bending stress fraction is added to the tensile stress in accor-
dance with ASTM, Fig. 3. In tensile specimens, however, the
completely balanced (redistributed) tensile stress in the ligament
is used, Fig. 4; this is not consistent. As introduced by Siebel
[16], the bending stress should also be used as a fully redistri-
buted stress, which means that the linear bending stress fraction
must be divided by 1.5 (maximum general yield coefficient for
bending, Fig. 3 ) . The nominal stresses determined in this way
for specimens with bending fractions are referred to as O „. , ,, ^3 n Siebel
contrary to stresses according to ASTM.
At this point, reference must also be made to two peculiarities
associated with the use of K T. , and G~ „. , . as crack tip and lid n Siebel r
farfield parameters:
(1) With increasing specimen size, the K T. ,/G~ „. , , ratio ^ ^ lid n Siebel
increases for the same K I. , (similar relationships arise lid r
for the C*/S . ratio) Fig. 1. This means that large n Siebel — ^ 3
CT-specimens have lower farfield stresses for the same K T. ,, lid'
i.e., these specimens are more likely to exhibit crack tip
damage.
27
8/21/2019 Caso Rotura
http://slidepdf.com/reader/full/caso-rotura 40/200
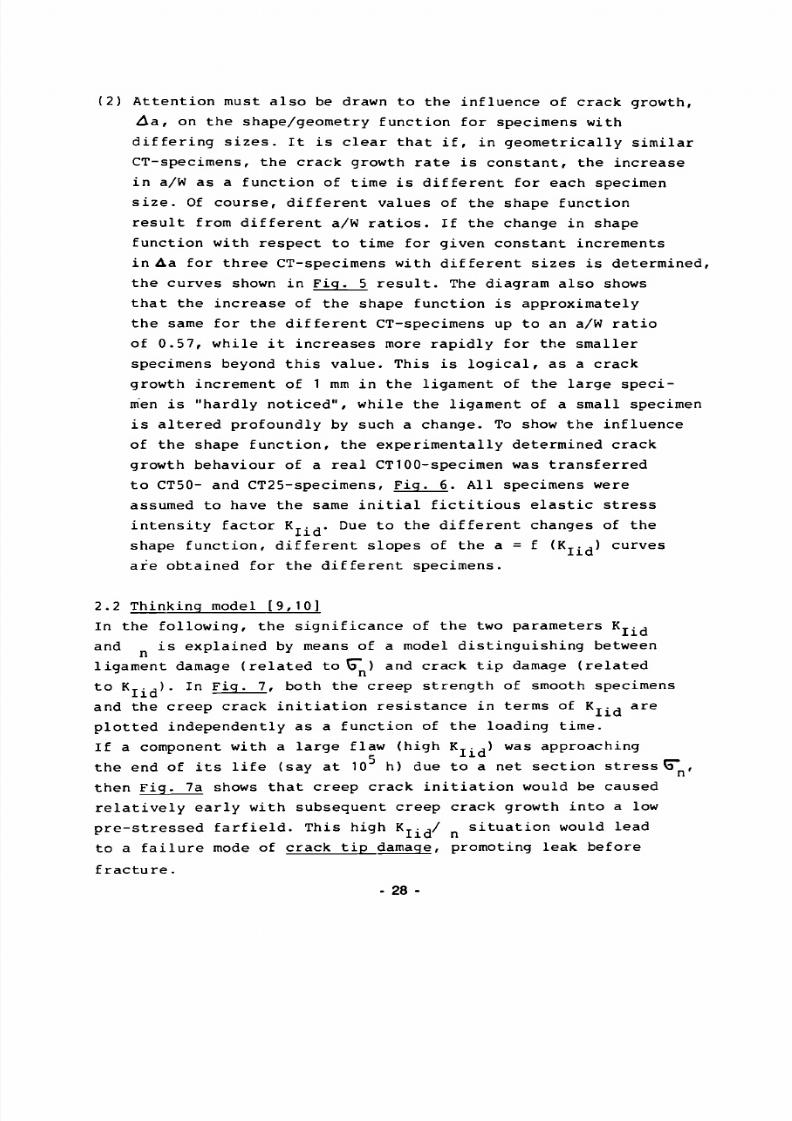
(2) Attention must also be drawn to the influence of crack growth,
A a, on the shape/geometry function for specimens with
differing sizes. It is clear that if, in geometrically similar
CT-specimens, the crack growth rate is constant, the increase
in a/W as a function of time is different for each specimen
size. Of course, different values of the shape function
result from different a/W ratios. If the change in shape
function with respect to time for given constant increments
in A a for three CT-specimens with different sizes is determined,
the curves shown in Fig. 5 result. The diagram also shows
that the increase of the shape function is approximately
the same for the different CT-specimens up to an a/W ratio
of 0.57, while it increases more rapidly for the smallerspecimens beyond this value. This is logical, as a crack
growth increment of 1 mm in the ligament of the large speci
men is "hardly noticed", while the ligament of a small specimen
is altered profoundly by such a change. To show the influence
of the shape function, the experimentally determined crack
growth behaviour of a real CT100-specimen was transferred
to CT50- and CT25-specimens, Fig. 6. All specimens were
assumed to have the same initial fictitious elastic stress
intensity factor K-. ,. Due to the different changes of theshape function, different slopes of the a = f (K_..) curves
are obtained for the different specimens.
2.2 Thinking model [9,10]
In the following, the significance of the two parameters K-. ,
and is explained by means of a model distinguishing between
ligament damage (related to Ç" ) and crack tip damage (related
to K...). In Fig. 7, both the creep strength of smooth specimens
and the creep crack initiation resistance in terms of K_., are
plotted independently as a function of the loading time.
If a component with a large flaw (high K... ,) was approaching
the end of its life (say at 10 h) due to a net section stress C" ,
then Fig. 7a shows that creep crack initiation would be caused
relatively early with subsequent creep crack growth into a low
pre-stressed farfield. This high K T. ,/ situation would lead3 lid n
to a failure mode of crack tip damage, promoting leak before
fracture.- 28 -

8/21/2019 Caso Rotura
http://slidepdf.com/reader/full/caso-rotura 41/200
If the same component had a relatively small flaw (low K T. ,)
(Fig. 7 b ) , creep crack initiation with subsequent crack growth
into a highly pre-stressed farfield would only occur at a very
late stage in life. This would lead to a ligament damage mode
with low K . ,/Πratios. When this mode of ligament damage is dominant, the first indication of failure of the component would
be given by the overall component deformation. This final failure
could, however, occur in a sudden manner.
2.3 Two criteria diagram [10,11]
The correlations which are based on the model explained above,
may be summarized analogously in a two criteria diagram for
creep crack initiation . Such a diagram is shown in Fig. 8.
It describes the decisive damage modes for a material with
sufficiently high creep deformation capacity. (The creep defor-
mation capacity should be adequately high if the material suffers
no notch weakening). The diagram has normalized axes with the
respective time dependent materials characteristics (R(j- = b n c /Rm t
and R_, = K T . , / K T T r J . C indicates the nominal stress in the K lido IID no farfield of a precracked component, Fig. 9, or the net section
stress in a specimen. R is the creep rupture strength of smooth
tensile specimens. K T. , is the fictitious elastic K-value at lido the crack tip within the component, Fig. 9, or a specimen.
K Ţ Ţ denotes the creep crack initiation value of the material,
which is a kind of material characteristic. It depends, however,
on temperature, shape and size of the specimens. Because K--
describes the crack tip damage behaviour, it has to be evaluated
from specimens with deep cracks, which means specimens with high ratios KT. , / C , such as is found in CT 1-specimens.
^ lido no r
The value 1 on the abscissa, Fig. 8, indicates that the fictitious
elastic stress intensity K.. ,, which is obtained in a component,
corresponds to a materials macroscopic creep crack initiation 4
value, K T T , for a certain time, e.g. for 10 h. The respective IID 4
net section stress normalized with the creep strength for 10 h
is plotted on the ordinate.
The diagram distinguishes between three fields of damage, which
are separated by ratio-lines K . ,/G . The meaning of the ratios
has been explained by the thinking model (Section 2.2) .
- 29 -

8/21/2019 Caso Rotura
http://slidepdf.com/reader/full/caso-rotura 42/200
The damage modes are:
- ligament damage;
- crack tip damage;
- and a mixed damage.
The ratio lines of K T. ,/5" in Fig. 8 were estimated on the basis oflid n — 3
available results. Taking account of the different fields of the
diagram it is possible to estimate the failure mechanism to be
expected each time. Crack initiation can only be expected outside
of the hatched boundary for the respective damage mechanism.
Inside different stages of exhaustion and increasing microscopic
damage are expected, Fig. 10. For such estimation, the time
dependent materials data R . and K_Tr> are required.mt IID
Special attention has to be paid to the creep deformation capacity,
because it influences strongly the K T. ,/5" -ratio-lines and thelid n
whole structure of the diagram. Fig. 11 shows as an example
a schematic "two-criteria diagram" for a notched weakening 1 %
CrMoV material. The necessary data are not yet available to
support and quantify it. We can learn from this diagram, however,
that ligament damage is not to be expected in notch weakeningmaterials except for crack free ( K T J -> 0) components. The most
important damage mode is crack tip damage but with earlier crack
initiation than for creep ductile materials (the latter cannot
be seen from the diagram, but it results from the fact thatKTTr. , .... < K T , _ , ... for a certain time).IID creep brittle IID creep ductileAnother important fact is the influence on creep crack initiation
of the lateral constraint for specimens, resp. components of
large thickness/size. This can greatly influence the crack initi
ation time of specimens with equal K x. , and K T. ./G" -values.
^ ^ lid lid nThus, the effect of the constraint should be taken into account
by differing materials K T---values (see chapter 4, below).
2.4 Description of crack growth by a crack tip/farfield concept [12,131
Although the description of crack growth by means of the C*-
integral results in narrower scatterbands than the comparable
description with K . , [ 4] , the description in terms of C* 2 will
not be further discussed in this paper because of its inferior
practicability, as outlined above.
30

8/21/2019 Caso Rotura
http://slidepdf.com/reader/full/caso-rotura 43/200
According to Fig. 12 [14], small scale specimens show a tendency
to faster crack growth than larger ones, with the crack tip
farfield ratio, KT . ,/<S c u i < increasing with specimen size. lid n Siebel = c
In accordance with the finding [9,10] that different specimen
shapes must also have different crack tip/farfield stresses,
Fig. 1, the crack growth results were normalized by the crack
tip/farfield ratio, V = Kx. , /(T „. . ,, of the initial crack o lido' no Siebel'
[12]. For this purpose, the stress intensity factor was plotted
versus the crack tip/farfield ratio of different specimens for
a constant crack growth rate of, say á = 1 x 10 mm/h.
Fig. 13 [12,13] shows such a plot for a creep ductile 1 % CrMoV
steel at 600 C. The diagram shows the stress intensity factor
over the crack tip/farfield ratio V for crack growth rates, • -3 • -3 ° a = 1 x 10 mm/h and a = 5 x 10 mm/h. Joining the data points of this diagram results in a horizontal line for low crack tip/far-field ratios V ; thus there is a constant K T. , for specimens
o' lid ^
with different (but low) crack tip/farfield ratios. The value
of K Ţ . , then rises with growing V ratio and is expected to
reach another plateau for high V ratios.
It might be expected that the mechanisms of damage defined in
the two-criteria diagram, i.e. crack tip damage, ligament damage, mixed mode damage, could be identified again in this diagram.
This is indeed the case.
Creep crack growth at a crack-like defect is the next step in
the sequence of events after the creep crack is initiated. Thus, a specimen with a distinct K T . , /G ratio wich gives rise to ^ lido no = the appropriate damage mode will continue to have crack growth
with the same specific mode. Therefore, the crack tip/farfield
ratio should be the dominating quantity in the crack growth
diagrams depicted in Figs. 13-15. According to Figs. 14 and 15, for the ligament damage and crack tip damage plateau regions,
creep crack growth is found to be independent of geometry and
specimen width ( K Ţ - J = const.). An influence of specimen width
is only found in the regime of mixed mode damage, which can
be described in the example of Fig. 13 by the relation of K_. ,
= 100 V + const. The transition point between ligament damage
and mixed mode damage appears to be at V 2.5, that of mixed
mode damage to farfield damage at V *- 6.5.
- 31 -

8/21/2019 Caso Rotura
http://slidepdf.com/reader/full/caso-rotura 44/200
As further evaluations of this type show [12,13], the slope
of the relation, K.. , = m V + const., is a function of
- the material conditions, i.e., whether it is creep ductile
or not,
- the temperature, and
- the class of materials (1 % CrMoV; 12 % CrMoV).
It can be derived from the evaluations shown above that the
two parameters K-. , and G may be applied to describe the crackgrowth behaviour of laboratory specimens of various sizes and,
ultimately, also of components on the basis of the ratio V =
KIido/'''ño Siebel' I n ' 1 3 ' such a method which needs further
confirmation is described.
However, some boundary conditions have to be observed:
Specimens and/or components
(a) have to be in the same range of applicability of K T., Æ " „. , ,
? ft- i lido no Siebel
with regard to the main modes of damage. While the modes
of failure are probably clear in the areas of ligament damage
and crack tip damage, ductile large specimens (DENT with
65 x 100 mm cross section, Fig. 15) lying within the mixed
mode regime can show normal cracking behaviour side by side
with crack branching, which indicates superposition of the
two failure modes in this case [22,23]. Crack branching,
which means "good natured" cracking behaviour, does not
necessarily have to occur. As can be seen from Fig. 15,
for the two specimens with crack branching, the test results
lie in the general scatterband when the stress intensity
factor for branched cracks, K , f = K/ ] 2 , is substituted.
Another DENT-specimen, "D" in Fig. 15, had no crack branching.
32
8/21/2019 Caso Rotura
http://slidepdf.com/reader/full/caso-rotura 45/200
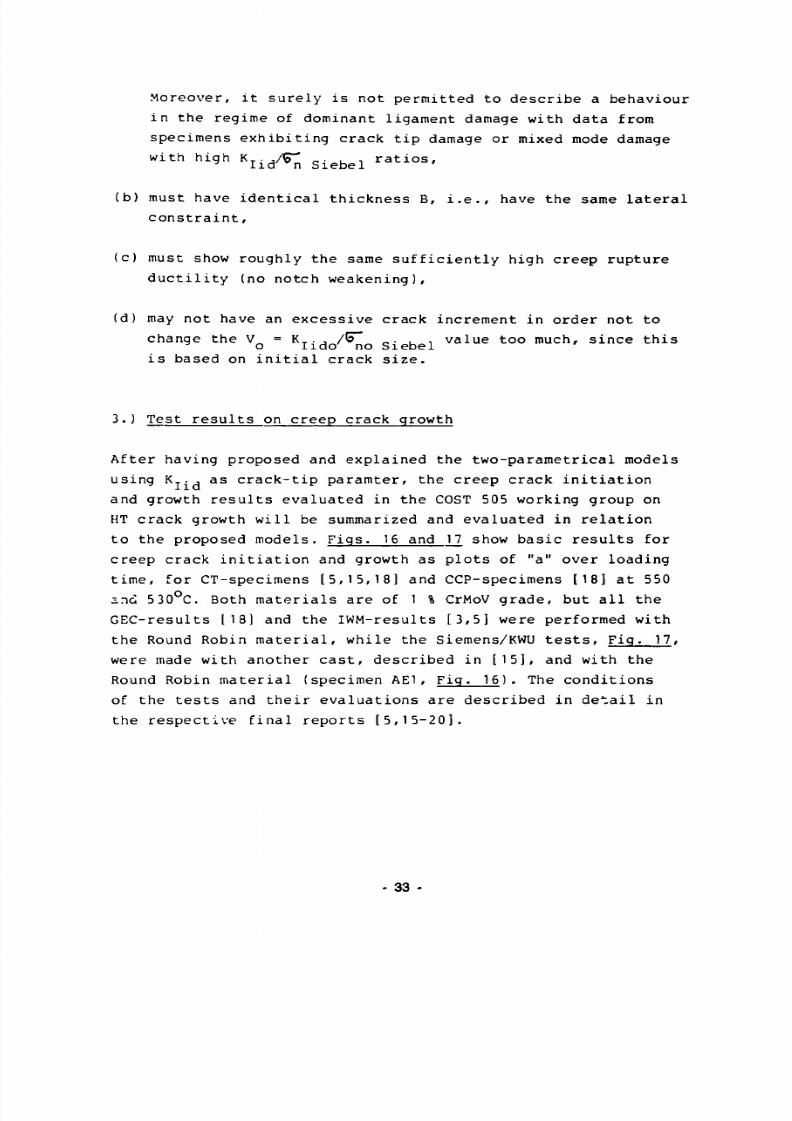
Moreover, it surely is not permitted to describe a behaviour
in the regime of dominant ligament damage with data from
specimens exhibiting crack tip damage or mixed mode damage
with high K I i d / Ç ; s i e b e l ratios,
(b) must have identical thickness B, i.e., have the same lateral
constraint,
(c) must show roughly the same sufficiently high creep rupture
ductility (no notch weakening).
(d) may not have an excessive crack increment in order not to
change the V = K T. , / 5 ~ „. ,^ o lido no Siebis based on initial crack size
change the V = KT. , / 5 ~ . , value too much, since this
o lido no Siebel
3. ) Test results on creep crack growth
After having proposed and explained the two-parametrical models
using K... as crack-tip paramter, the creep crack initiation
and growth results evaluated in the COST 505 working group on
HT crack growth will be summarized and evaluated in relationto the proposed models. Figs. 16 and 17 show basic results for
creep crack initiation and growth as plots of "a" over loading
time, for CT-specimens [5,15,18] and CCP-specimens [18] at 550
2 TIÒ 530°C. Both materials are of 1 % CrMoV grade, but all the
GEC-results [18] and the IWM-results [3,5] were performed with
the Round Robin material, while the Siemens/KWU tests, Fig. 17,
were made with another cast, described in [ 15 ] , and with the
Round Robin material (specimen AE1, Fig. 16 ). The conditions
of the tests and their evaluations are described in detail in
the respective final reports [5,15-20].
33 -

8/21/2019 Caso Rotura
http://slidepdf.com/reader/full/caso-rotura 46/200
3.1 Creep crack initiation results
From the plots, Figs. 18 and 19, it can be seen that the time
for crack initiation depends on the criteria which is used to
define the crack initiation time. A broad scatterband for crack
initiation originates from the different initiation criteria,
Fig. 18. A rough evaluation of these results and of other
available results from the literature [20-24] shows the following
tendencies:
1. The tighter theAa. limit for crack initiation, the lower
the t./t ratio,i r
2. The time of crack initiation depends on the creep ductility.
For very creep ductile materials, the majority of life is
occupied by the initiation process: high t./t ratio. For
creep brittle materials it is proven that crack propagation
is very fast and crack initiation occurs rather early but
- because of the limited number of test results - it is unclear
whether this results in a higher or a lower t./t ratio.
An evaluation of some tests on 1 % CrMoV material ends up with
the following relations t./t , shown in Table 1.
34

8/21/2019 Caso Rotura
http://slidepdf.com/reader/full/caso-rotura 47/200
Fig. 19 shows all Siemens/KWU data at 530°C together with 2 data
points of COST 1 % CrMoV cast material [ 16 ] , as a plot of K .,
over loading time with crack depth parameter points of da. =
0,5; 1 and 2 mm. If a crack depth of ¿la. = 0,5 mm gives the
engineering crack initiation criteria, then the lower bound
line represents the crack initiation times of CTI-specimens
at 530 C. This lower bound curve is supported by the great number
of data with<d a. = 1 and 2 mm, and here especially by one point
of a 1 % CrMoV forged material [9,10] which reached A a. = 1 mm
after about 30,000 h. It would, therefore, seem to be allowable
to extrapolate the scatterband boundary lines up to 10 h.
Fig. 20 depicts a summary of all crack initiation data fromCOST 505 partners and also the results of a further German research
group [21-23] for 1 % CrMoV at 550°C.
All partly solid points are from COST 505 Round Robin small
scale specimens. The specimens were fatigue precracked with
an intended crack initiation criteria of 0.2 to 0.5 mm crack
extension.
In addition, the picture includes specimens with differing size
and shape [21-23], detailed in Fig. 2 1, which had spark erodedcrack tips. Some preliminary tests, Fig. 19, [15] showed that
spark eroded crack tips delay the crack initiation noticeable,
but not too much compared with the usual scatter, if a creep
ductile material is applied.
For technical applications, a creep crack initiation criteria
of A a. = 0,5 mm is adequate, because it represents a smaller
crack growth increment than is detectable by nondestructive
evaluation methods, for example by UT for thick walled casings
or rotors. From the diagram in Fig. 21 it is obvious that specimens
with different shapes and sizes result in specific crack initiation
times.
35

8/21/2019 Caso Rotura
http://slidepdf.com/reader/full/caso-rotura 48/200
From Figs. 20 and 22 which are plots for K . . versus time for
crack initiation it can be derived that the large scale specimens
with deeper cracks, a , and larger thickness, in other words
with predominant crack tip damage (ratios V = K .,/G >4,5)
and higher lateral constraint (thick specimens, 50-100 nun, Fig. 22),
create the upper boundary. The small scale specimens (V = 1 7-3
with short cracks and a smaller specimen thickness (- 25 mm)
form the lower bound of the data band. This is consistent with
the expected behaviour of the different damage modes, mentioned
above, according to which specimens with ligament damage fail
with faster crack growth than specimens with crack tip damage
(deeper cracks) in the case of equal Kj..,-values (Fig. 12 ■
Medium size specimens lie in the middle of the crack initiation
range. In addition an attempt was made to include in this diagram
those medium size specimens [3,5] for which initial cracking
rates,á a. were defined and which were correlated in terms
of K_.. (because stress redistribution may not yet have been
completed). Here, the crack initiation times were calculated
with the assumption thati a.~0.3 mm was accumulated with the
initial cracking rates, a.. The initiation curve evaluated by
this method falls into the lower middle zone of the band.
According to Fig. 20 it seems to be possible to rank the specimens
by the KT. ,/(T ratios. Of course, there is some scatter, but this I i d n is not unexpected in considering the different kinds of crack tips,
the different heats of 1 % CrMoV material, the specimen thick-
ness B, the different crack initiation criteria, and methods* used.
From the test results described above it can be concluded that:
- KT•j seems to be basically usable to describe the crack tip lid J r
situation for crack initiation, Fig. 19,
- the time for crack initiation increases with decreasing crack
tip driving force K J - J J ) » Figs. 18-22,
- specimen size and shape determine the damage mode and the
related specimen behaviour, which appears to be described
basically by means of the two criteria diagram for creep
crack initiation, Fig. 7 and 10, with its crack tip/farfield
ratios and with some additional notice of the specimen thickness,
Figs. 20 and 22,
♦Evaluation of crack initiation by: - interrupted tests and metallographic evaluation [14]
- evaluation of potential drop and/or COD curves [5,16-19] - compliance measurement at RT with test interruption [15] - 36 -

8/21/2019 Caso Rotura
http://slidepdf.com/reader/full/caso-rotura 49/200
- the crack initiation times and the ratio of crack initiation
to rupture times depend on the creep ductility,
- due to the differing methods and criteria used to determine
crack initiation, the scatter of data is considerable, Fig. 18
[18], Table 1, but the data are rather reproducible when usingthe same evaluation methods and material heats, Fig. 19.
3.2 Creep crack growth results
Fig. 23 includes most COST 505 Group 6 data on crack growth
at 550°C [5,15-20]. In spite of the number of specimens and
the different specimen sizes, the crack growth scatterband in
terms of KT. , is not too wide. It shows that for most of thelid
specimen types the curve has a crack initiation tail.
Fig. 24 shows all Siemens/KWU data on CTI-specimens at 530 Ctogether with some D35 data [16] from cast 1 % CrMoV and from
the heat affected zone of a weldment made with the same steelgrade*. At first view the base material of the cast 1 % CrMoV
version fits well into the crack growth bands of the forged
version. However, it should be remembered (Fig. 19) that these
data points represent crack depths,¿a, of 3.5 and 6 mm. This
is relatively deep compared with the bulk of the data points
from the forged material which for similar K-. .-values have
crack depths in the range of A a = 2 mm (Fig. 19). The heat affectedzone data of the casting weldment is weaker and shows still
higher crack growth rates.
The Siemens/KWU data within Fig. 25 include specimens in the
as-received condition as well as specimens with long term annealing
(560°C/10 h which is equivalent on the basis of Larson-Miller
to 530°C and 10 h) and with fatigue precracks which were initiated
at 530°C. Both pretreatments did not influence the crack growthrate. This means that creep crack growth or fatigue crack initi
ation after long term annealing (or low accumulated creep strains)at service temperature do not increase the subsequent crack
growth rate compared to the as-delivered condition [15].
Fig. 26 depicts the crack growth scatterbands based on the data
points of Fig. 25 together with parameter lines of certain crack
growth de pt hs¿a = 0.5; 1 and 2 mm (for individual data points see
Fig. 27). This figure clarifies once again tnat the tails are
part of the k - t (K T. J-curves which represent the stress re
distribution and creep crack initiation phase within the life
of a precracked creeping specimen.
* Crack tip within the HAZ [16]

8/21/2019 Caso Rotura
http://slidepdf.com/reader/full/caso-rotura 50/200
Conclusions from the'crack growth data are:
- Tails represent stress redistribution and crack initiation
portions of the specimen life, which lasts 30-50 % of the
rupture life for a creep ductile material.
- In a similar manner to crack initiation, the crack growth
behaviour with low crack growth rates and smaller resulting
cracks (¿a = 2-3 mm) may be described in terms of K-. ,.
- The different crack growth rates due to specimen shape and
size seem to be normalized by the crack tip/farfield ratios V .
- Long term annealing and fatigue crack growth at 5 30 C does
not accelerate crack initiation and growth rate compared to
the as-delivered condition.
- Cast 1 % CrMoV tends to have slightly earlier crack initiationand higher growth rates than similar forged materials.
- The heat affected zone of weldments in castings shows faster
crack growth than the respective base material.
- Crack growth at 550°C is faster than at 530°C, Fig. 23 and 25.
4 -) Discussion of results
For the application of crack initiation and growth data some
basic questions arise:
1 . Is it sufficient to use a one parameter model?
2. Which mathematical formalism is adequate to describe crack
initiation and growth?
3. How can the specimen shape and size dependent constraint
be taken into consideration?
4. How can the influence of creep ductility be introduced?
These factors will now be considered.
4 .. 1 The parametric model
From the explanations given above it has to be concluded that
it is necessary to use a two parameter model and to pay attention
to the different damage modes.
- 38
8/21/2019 Caso Rotura
http://slidepdf.com/reader/full/caso-rotura 51/200
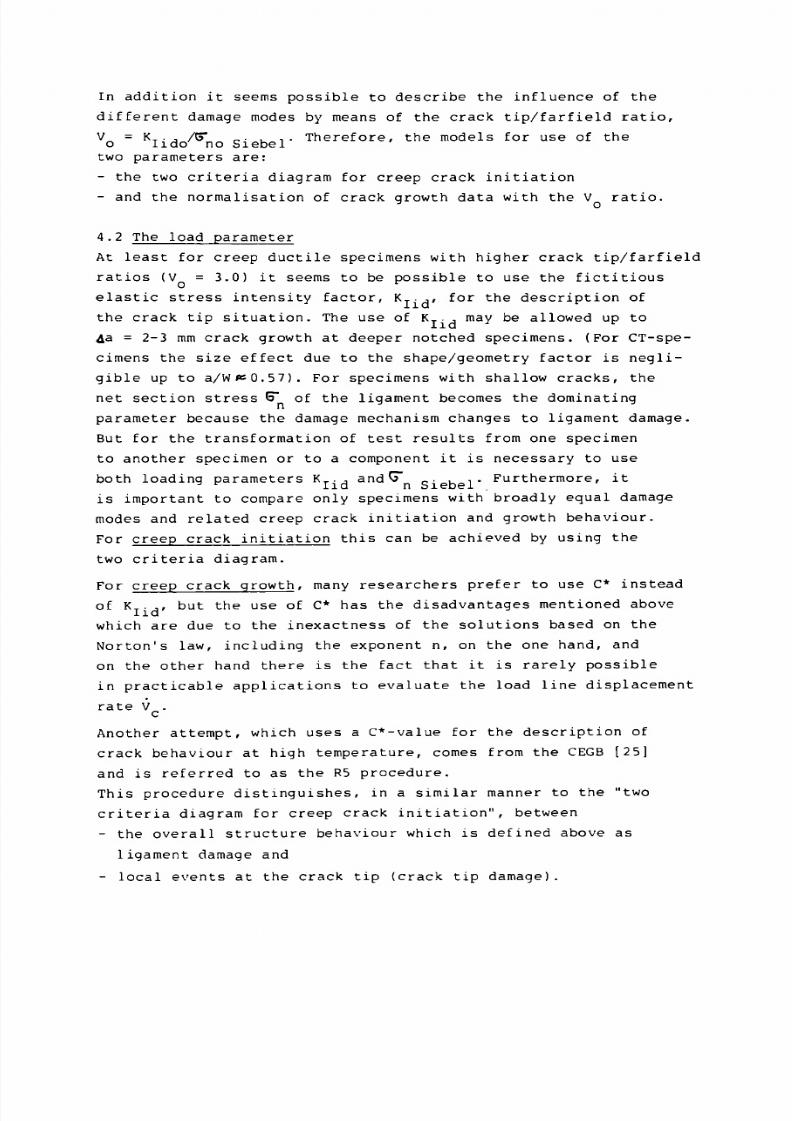
In addition it seems possible to describe the influence of the
different damage modes by means of the crack tip/farfield ratio,
V = KT. , /CT _. , ,. Therefore, the models for use of theo lido no Siebel
two parameters are:
- the two criteria diagram for creep crack initiation
- and the normalisation of crack growth data with the V ratio.^ o
4.2 The load parameter
At least for creep ductile specimens with higher crack tip/farfield
ratios (V = 3.0) it seems to be possible to use the fictitiouso
elastic stress intensity factor, K . ,, for the description of
the crack tip situation. The use of K.., may be allowed up to
4a = 2-3 mm crack growth at deeper notched specimens. (For CT-spe-cimens the size effect due to the shape/geometry factor is negli
gible up to a/WPs0.57). For specimens with shallow cracks, the
net section stress G~ of the ligament becomes the dominating
parameter because the damage mechanism changes to ligament damage.
But for the transformation of test results from one specimen
to another specimen or to a component it is necessary to useboth loading parameters KT. , and G" _. . ,. Furthermore, it
^ ^ lid n Siebel
is important to compare only specimens with broadly equal damage
modes and related creep crack initiation and growth behaviour.For creep crack initiation this can be achieved by using the
two criteria diagram.
For creep crack growth, many researchers prefer to use C* instead
of K .,, but the use of C* has the disadvantages mentioned abovelid
which are due to the inexactness of the solutions based on the
Norton's law, including the exponent n, on the one hand, and
on the other hand there is the fact that it is rarely possible
in practicable applications to evaluate the load line displacementrate V .c
Another attempt, which uses a C*-value for the description of
crack behaviour at high temperature, comes from the CEGB [25]
and is referred to as the R5 procedure.
This procedure distinguishes, in a similar manner to the "two
criteria diagram for creep crack initiation", between
- the overall structure behaviour which is defined above as
ligament damage and
- local events at the crack tip (crack tip damage).

8/21/2019 Caso Rotura
http://slidepdf.com/reader/full/caso-rotura 52/200
The overall structure behaviour is controlled by means of the
reference stress,GT., the local events (crack tip damage)
are proposed to be assessed by C*, which is expressed in the
following form:
<c* = 5~ , 2 . R' (6)
ref ref
Where £ , is the strain rate that occurs in a uniaxial creep
test at the reference stress 5" ,.
ref
The quantity R' is "a geometrical variable which relates the
stress/strain conditions near to the crack tip, to the nominal
conditions in the structure". This C* is proposed in particularfor use for materials showing creep brittle behaviour. For creep
ductile materials the use of 5" c is recommended.
ret
This R5-version of C* consequently includes with the quantity R'
a parameter which relates to the crack tip/farfield situation
of the specimen/component. From another CEGB-paper [7] it transpires
that a good approximation of R Ì S obtained by using the stress
intensity factor K, so R is defined as
R ' = K 2 /5"ref 2 ( 7 )
which tends in the direction of the square value of V ( R ~ V 2 )o o
of the crack tip/farfield ratio. Thus, R tends in the same
direction as V but gives higher differences (square values)
between the different specimen shapes than V .
It should be noticed that reference [7] gives the same reasons
for not using the C*.«-*ţjn - g . (3) and C*,~V (1) versions
of C* when it is stated that unfortunately, displacement rates
can rarely be measured in service and estimates of C* cannot
be readily derived from equation (1) . The equation for C*.
(3) is also said to be inconvenient as detailed finite element
solutions are requested to generate g-i - Thus, the opinion of
the CEGB authors with respect to the use of the usual C*-version
is completely in line with this author's opinion.
40 -
8/21/2019 Caso Rotura
http://slidepdf.com/reader/full/caso-rotura 53/200
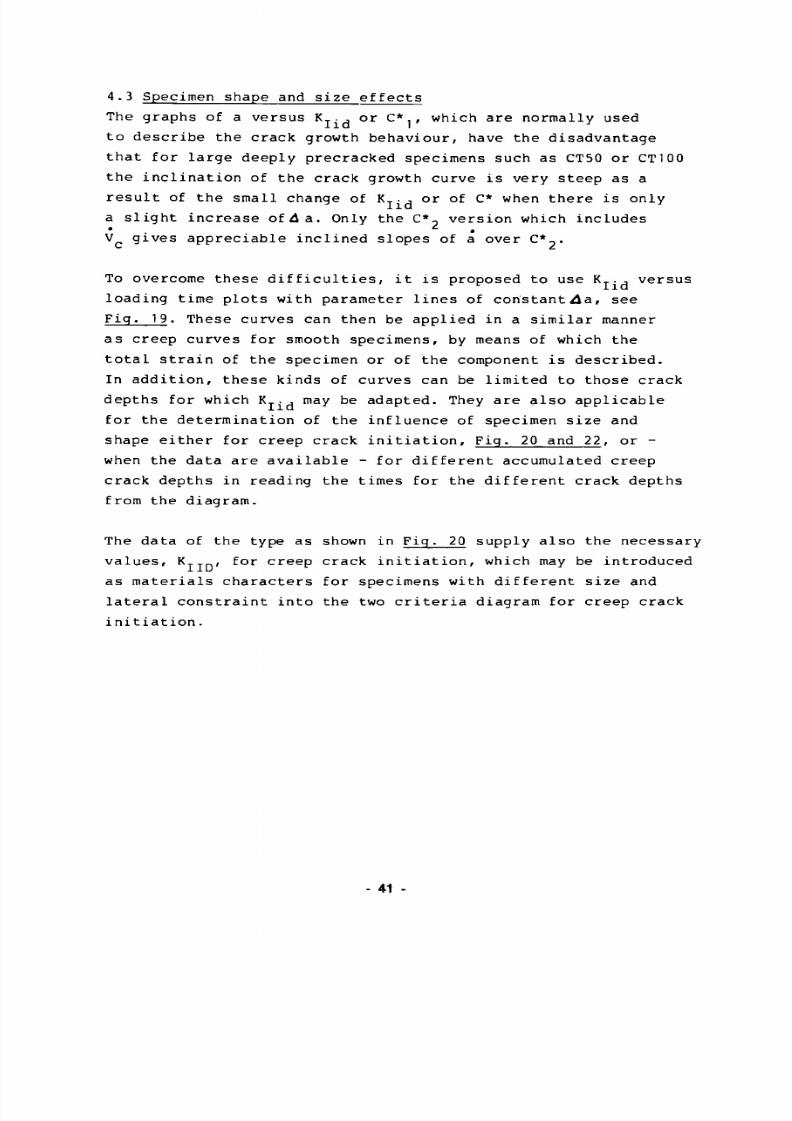
4.3 Specimen shape and size effects
The graphs of a versus K i d or C* 1, which are normally used
to describe the crack growth behaviour, have the disadvantage
that for large deeply precracked specimens such as CT50 or CT100
the inclination of the crack growth curve is very steep as a
result of the small change of K Ţ. , or of C* when there is only
a slight increase of 4 a. Only the C* version which includes
V gives appreciable inclined slopes of a over C*~.
To overcome these difficulties, it is proposed to use K_. , versus
loading time plots with parameter lines of Constantsa, see
Fig. 19. These curves can then be applied in a similar manner
as creep curves for smooth specimens, by means of which the
total strain of the specimen or of the component is described.
In addition, these kinds of curves can be limited to those crack
depths for which K Ţ. , may be adapted. They are also applicable
for the determination of the influence of specimen size and
shape either for creep crack initiation. Fig. 20 and 22, or -
when the data are available - for different accumulated creep
crack depths in reading the times for the different crack depths
from the diagram.
The data of the type as shown in Fig. 20 supply also the necessary
values, K Ţ Ţ_, for creep crack initiation, which may be introduced
as materials characters for specimens with different size and
lateral constraint into the two criteria diagram for creep crack
initiation.
41 -

8/21/2019 Caso Rotura
http://slidepdf.com/reader/full/caso-rotura 54/200
4.4 Creep ductility
From the statements in Section 4.2 and from Part 2 of this brochure
[5] it becomes clear that creep ductility dramatically influences
the creep crack initiation and growth behaviour.
Creep brittle materials are able to tolerate only extremely
short defects, whereas creep ductile materials withstand a
reasonable defect size without a decrease in rupture time. This
service experience teaches us to avoid the use of notch weakening
materials.
The best method to evaluate a potential notch weakening behaviour
is to test smooth and notched specimens (K. «"4.5).
If a material shows no notch weakening (rupture times for notched
specimens equal to or longer than those for smooth samples)
the above mentioned models and design curves in terms of K may
be used. The application of notch weakening materials should
be avoided. If, in extreme situations, such materials have to
be used, a detailed investigation of the creep crack initiation
and growth behaviour is necessary.
42

8/21/2019 Caso Rotura
http://slidepdf.com/reader/full/caso-rotura 55/200
5. ) Conclusion
It becomes obvious that two schools of thought exist about the
selection of the appropriate parameter for creep crack initiation
and growth. There are the protagonists of C*, who feel supported
by the fact that C* is the loading parameter which from the
physical point of view is reasonable . On the other hand there
are the people who try to apply creep crack initiation and growth
data in term of K Ţ . , for the description of components which
have thick w a l l s , long loading t i m e s , and low loading stresses .
For such applications, the use of K . , together with the parameter
C to describe the farfield is recommended. Crack initiation n
should be handled with the two criteria diagram for creep crack initiation which covers the range of the tails from the a = f
(K Ţ . ,) plots . The creep crack growth behaviour with limited
crack increment may be described by plots of K Ţ - J over t with
parameter lines for A a, similar to Fig. 19 . With such d i a g r a m s ,
which are only valid for CTI-specimens, however, it is hardly
possible to estimate the influence of specimen shape and thick-
n e s s B . Thus, crack growth with small increments should be rated
with diagrams like Fig. 20 (specimen shape) and / or Fig. 22 (speci-
men thickness, e.g. lateral constraint ) . If it is necessary
to describe the behaviour of cracks of greater depth, the crack
tip/farfield method with V = K T. , / G , Figs . 13-15, or some o lid n '
kind of description by means of C* [5] may be used. The most
important point for the future is to generate further data on
specimens with different shapes and sizes with long crack initi-
ation times and low crack growth rates, upon which a final decision
for the most economic and appropriate evaluation method can
be made.
- 43 -

8/21/2019 Caso Rotura
http://slidepdf.com/reader/full/caso-rotura 56/200
References
[1] H. Riedel and J.R. Rice, ASTM STP 700, pp. 112-130, 1980.
[2] K.M. Nikbin, D.J. Smith and G.A. Webster, Proc. ASME Int. Conf. on Advances in Life Prediction Methods, Albany, pp. 249-258, 1983.
[3] R. Hollstein and R. Kienzler, Numerical simulation of creep crack growth experiments, COST 505-D22, Institut für Werk-stoffmechanik, Freiburg, FRG, January 1987.
[4] A. Saxena, EPRI Meeting, Sess. 6, Raleigh, North Carolina, Sept. 12-14, 1984.
[5] T. Hollstein, G.A. Webster and F. Djavanroodi, Creep Crack Growth in 1 % CrMoV Steel, an Evaluation of COST 505 Creep Crack Growth Round Robin, Prepared for the EEC, August 1989.
[6] J. Ewald, K.-H. Keienburg and K. Maile, Estimation of manu-facturing defects in the creep range, Nucl. Engrg. Des. 87, pp. 389-398, 1985.
[7] J.W. Goodall and R.A. Ainsworth, Structural Assessment of Metal Components, Paper No. 6, Conference of the Institute of Metals on Materials and Engineering Design , London, 1988.
[8] K.H. Kloos, K. Kußmaul, J. Granacher, K. Maile, R. Tscheuschner und W. Eckert, Kriechrißeinleitungs- und Kriechrißwachstums-verhalten unter Berücksichtigung des Größeneinflusses, Ab-
schlußbericht AIF-Vorhaben
Nr.
6038, 1988.
[9] J. Ewald, K.-H. Keienburg und K. Kußmaul, Hinweise auf Mechanismen und Einflußgrößen zur Beurteilung des Bauteil-verhaltens im Kriechbereich anhand von Kleinproben, VDI-Bericht Nr. 354, pp. 39-57, 1979.
[10] J. Ewald and K.-H. Keienburg, A two criteria diagram for creep crack initiation, Int. Conf. on Creep, Tokyo, pp. 173-178, 14-18 April 1986.
[11] J. Tscheuschner, Anriß- und Rißfortschrittsverhalten zeit-standbeanspruchter warmfester Schmiedewerkstoffe, Dr.-Ing.
Dissertation DI 7, Darmstadt, 1988. [12] J. Ewald, Evaluation of the creep crack growth behaviour
by means of a K Ţ-concept, presented at the European Croup on Fracture, Task Group, Freiburg, May 21/22, 1987.
[13] J. Ewald, K. Maile and R. Tscheuschner, Creep crack growth assessment by means of a crack tip/farfield concept, Nucl. Eng. and Design 117, pp. 185-195, 1989.
[14] K.H. Kloos, J. Granacher und R. Tscheuschner, Kriechrißfort-schrittsverhalten des Stahles 28 CrMoNiV 49, Z. Werkstoff-techn. 18, pp. 390-398, 1987.
- 44 -

8/21/2019 Caso Rotura
http://slidepdf.com/reader/full/caso-rotura 57/200
[15] J. Ewald, C. Berger and H. Brachvogel, Investigation oncrack initiation and propagation under static, cyclic andcombined loading conditions of 1 CrMoNiV steels at 530 C,COST 505 D20/D21 Final Report, Siemens Report No. TW 1187/89,June, 1989.
[16] H. Kanbach, Crack growth in welded turbine materials atelevated temperatures, COST 505 D35 Final Report, AEG,April, 1989.
[17] I. Ragazzoni, COST 505 13 Final Report, ENEL, to be issued.
[18] S.R. Holdsworth, High temperature crack growth in turbinesteels, COST 505 UK5 Final Report, CEG Alsthom Report No.RM 8 72/8 9, November, 1989.
[19] G.A. Webster and F. Djavanroodi, Elevated temperature crackgrowth in steam turbine materials, COST 505 UK18 Final
Report, Imperial College (Mech. Eng. Dept.), January, 1989.[20] G.A. Webster and F. Djavanroodi, Determination of the crack
growth behaviour and failure mode of pre-exposed material,COST 505 UK26 Final Report, Imperial College (Mech. Eng.Dept.), January, 1989.
[21] R. Tscheuschner, W. Eckert und J. Ewald, Bewertung vonBruchmechanik-Parametern zur Beschreibung des Kriechrißwachstums, Arbeitsgemeinschaft für Warmfeste Stähle, 11.Vortragsveranstaltung "Langzeitverhalten warmfester Stähle",25.11.88, Herausgeber: VDEh.
[22 ] J. Granacher, R. Tscheuschner, K. Maile, W. Eckert undJ. Ewald, Ermittlung und Beschreibung des Rißausbreitungsund Rißwachstumsverhaltens bei hohen Temperaturen, DVM,Vorträge 21. Arbeitskreis Bruchvorgänge, Bad Nauheim, 1989.
[23] R. Tscheuschner und W. Eckert, Kriechrißverhalten von Klein-und Großproben bei betriebsnaher Langzeitbeanspruchung,DVM, Vorträge 21. Arbeitskreis Bruchvorgänge, Bad Nauheim,1989.
[24] S.M. Beech, J.W. Selway and A.D. Batte, Factors influencingcrack development in 1 % CrMoV steam turbine rotor forgingsteels, Proc. Internat. Conf. on Creep and Fracture of
Engineering Materials and Structures, Swansea, 1984.
[25] J. Milne and J.W. Goodall, Defects: can we live with them?,CEGB Research, pp. 48-59, May, 1988.
[26] K. Wellinger and H. Dietmann, Determination of "Formdehngrenzen", Materialprüfung 4, pp. 41-43, 1962.
[2 7] Hütte I, Ingenieur-Taschenbuch, 2 8. Auflage 6, Abschnitt:Festigkeitslehre, pp. 847-851.
45

8/21/2019 Caso Rotura
http://slidepdf.com/reader/full/caso-rotura 58/200
Table 1
Author
Holdsworth
Slemens/KWU
^ Malle°> Tscheuschneri
Tscheuschner
Beech
Literature
18
15
22
11
24
Material Condition
partly creep ductile
creep ductile
partly creep ductile
ductilepartly creep ductilecreep brittlecreep brittle
partly creep ductile
Temp. °C
550
550550
550
550
Type of Specimen
CCPl fatigueCT ) precrack
CT) fatigueCT) precrack
CT eroded crack tip
CT eroded crack tip
CCP short cracks
aQ = 1-3 mm
tl/tr
0.50.3
0.4-0.750.3-0.4
0.3
0.11-0.180.2-0.50.15-0.50.22-0.48
0.1
a j * mm
~ 0.2^ 0.2
'v 0.5'v 0.5
¿ 0.5
¿ 0.1á 0.1
•v 0
*¿iaA: criteria for crack Initiation

8/21/2019 Caso Rotura
http://slidepdf.com/reader/full/caso-rotura 59/200
F i g .
2 0 0 4 0 0 6 0 0 8 0 0 1 0 0 0
n o m i n a l ( n e t - s e c t i o n ) s t r e s s [ N / m m 2 ]
Stress Intensity and Nominal Stress as Function ofSpecimens Size
47

8/21/2019 Caso Rotura
http://slidepdf.com/reader/full/caso-rotura 60/200
21CrMoNiV57. T=550°CCT12.5/40 spec men AB2Bé m i n = l 3 - I O - 2 0 < J 6 5 [ h - , l , O inMPa
Fig . 2a .
-1 1 1 1 1 1 1 1 1 r~
'o.CO 1.00 2.00 3.00 4 .00 5.00 6.00 7.00 8.00 9.00 10.00 11.00
i . see (E+06ÌExperimental and numerical evaluation of C forCT 12.5/40 specimen AB2B, with and without crackgrowth, creep law [3] .
o -c'
3*"
o -r
o -o í
21CrMoNiV57, 550°CCT 12.5/40, AB2 B
x : Experiment" /
— : E q ( 1 5 )
f-*tt-¿V '
3000
Fig. 2b. Experimental and numerical values of crack growth [3]- 48 -

8/21/2019 Caso Rotura
http://slidepdf.com/reader/full/caso-rotura 61/200
F
ò ° ASTI
Q JfnK;
h
0\ f n Siebel T T T I
Q
ab at
I l u
F F
F' , . . ., w + a , F (7ASTM ~ r— ; - ( 1 + 3 ) (7nSiebel= r —
B ■ (w - a w — a B ( w — a ) w —a
, a - _ _fc. c ASTM for— —0.5 ^
W f » Siebel
'1 .43
Fig. 3. Nominal Stresses in the Farfield of Specimens with Bending Portions.
F On = ^ = ^ASTIVI
Ã
comple te ly redistr ibuted
general yield condi t ion
Fig. 4. Nominal Stress in symmetrically loaded Specimens.
49

8/21/2019 Caso Rotura
http://slidepdf.com/reader/full/caso-rotura 62/200
4 0 0
a
aia.aci/ì
10'
K ' ^ " a / W l
1
I /W.157 J° _,
1
CT 25 / f CT 50
(C T 100
>icfTr t ie t / h
i>\d
Fig . 5. Shape Function f(a/w) as a function of time for differentspecimen sizes in case of equal crack growth rate.
F m"'-r "-1 -£\
4)
8.r.
o¿3
8 irf1-P KJ -o8- I
ò3 . TO"-
i
1ji
1r(i
f
¿V
7
— 30
c/w
. V
=
... -V -
357
... - v -
—
A CT KW. e«p .
F i g . 6 .
.10' KJ1
Stres s Intens ity Foctor K^ / MPoV ñT
Theoretical creep growth characteristic of differentspecimens with identical crack increase.
- 50
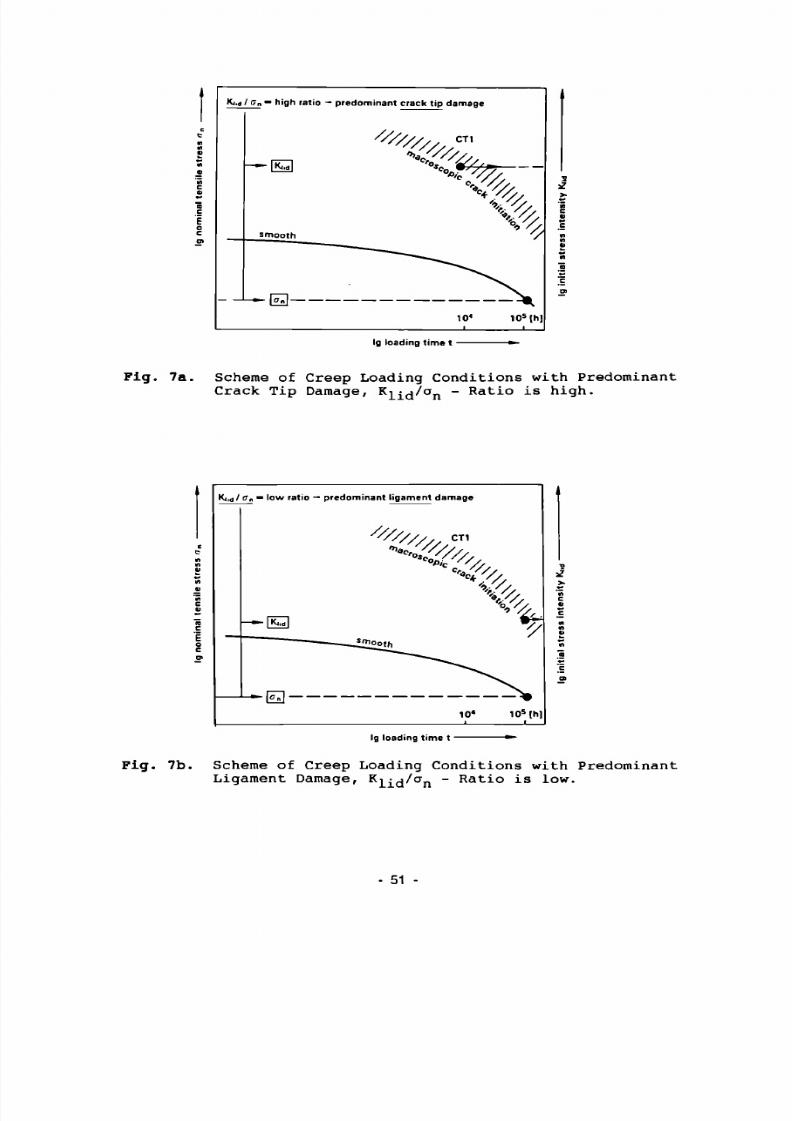
8/21/2019 Caso Rotura
http://slidepdf.com/reader/full/caso-rotura 63/200
K.gf On ™ h igh rat io — p redominan t crack t i p damage
^ S
Ig loading t ime t -
Fig. 7a. Scheme of Creep Loading Conditions with PredominantCrack Tip Damage, ^n¿/ n̂ - Ratio is high.
Ig loading t ime t -
Fig. 7b. Scheme of Creep Loading Conditions with PredominantLigament Damage, Kii(j/on - Ratio is low.
51
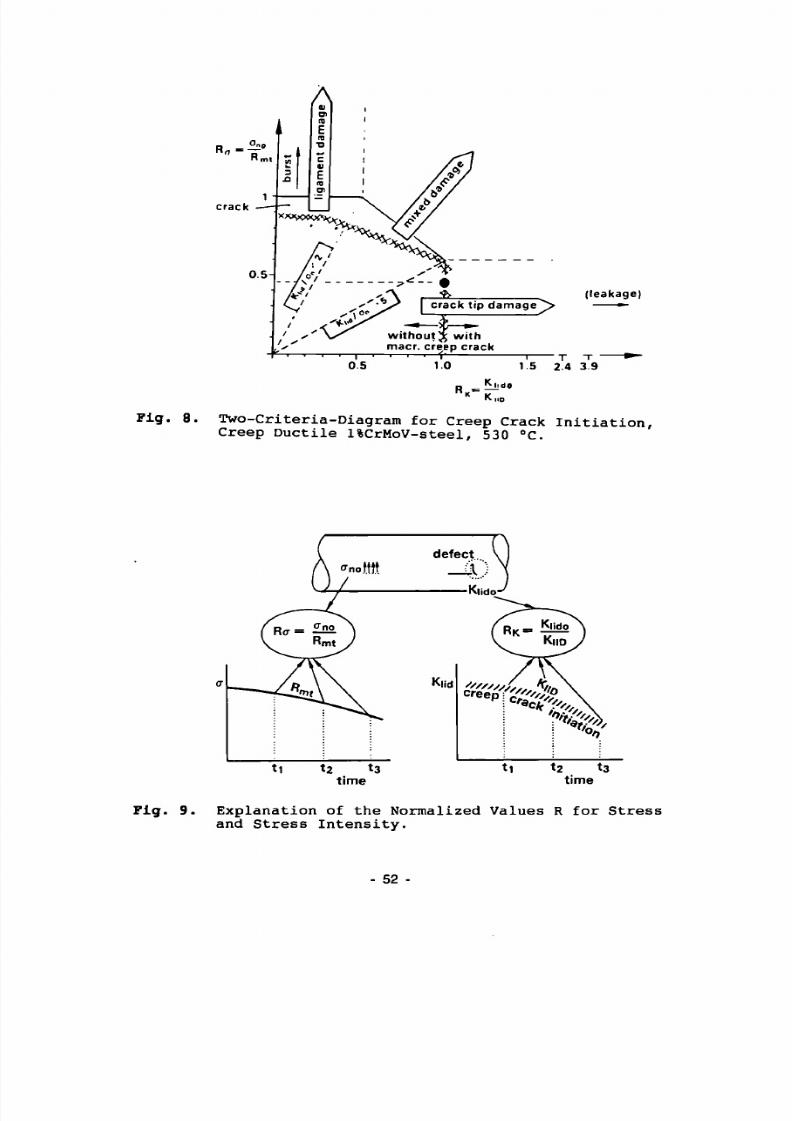
8/21/2019 Caso Rotura
http://slidepdf.com/reader/full/caso-rotura 64/200
c r a c k t ip d a m a g e ^ >
— ^ —t h o u t j ; w i t h
( l e a k a g e )
— T -
0.5
w i t h o
a c r . c r e e p c r a c k1.0 1.5 2.4 3.9
_ K j ,de« K
" UD
Fig. 8. Two-Criteria-Diagram for Creep Crack Initiation,Creep Ductile %CrMoV-steel, 530 °C.
Fig. 9. Explanation of the Normalized Values R for Stressand Stress Intensity.
- 52

8/21/2019 Caso Rotura
http://slidepdf.com/reader/full/caso-rotura 65/200
wi t h wi t hou t
micro crack init.
□
O
■
macro crack init.
o I • eng. crack ¡nit. A 1
V
SENT, duct i le britt le (Beech . Se lway . Bane )
smal l manufactur ing defects in smooth spec
(Taylor, Bat te l
castings w i t h manufactur ing defects (duct i le)
D E N T ' . 30x 112. a/w - 0.45
OENT *. 40 x 65 . a/w - 0.1 and 0.4
*) wi t h spark-eroded crack- t ip
I crack tip damage ~> i io ~i\jfZT without J5 with
acr. creep crack
>12 Ki*/o„M0 O
Ç | leakage)
0.5 1.0 1.5 2.4 3.9
KiidoU)
Fig. 10. Two-Criteria-Diagram for Creep Crack Initiation
Creep Ductile l CrMoV-steel 530 °C.
R -5=.
0,5
burst
1 CrMoV-Steel; 530 CC
mixed damage
ñv crack tip damage J>
—1 rw i t h creep crack
0,5 K no
Fig. 11. Draft for a Two-Criteria-Diagram for Creep Crack
Initiation for Notch Weakening Materials.
- 53

8/21/2019 Caso Rotura
http://slidepdf.com/reader/full/caso-rotura 66/200
Fig. 12.
250 500 K,« (N/mm3/2| 1000 1500
Creep crack growth rate, J, as a function of the
stress intensity factor, K I ¡ J , for different specimenshapes and specimen sizes (IfCrMoV steel, CT compact
tension specimen, K notched round bar specimen) [14].
1000
soo
200
Fig. 13.
AGA
AGB 28CrMoNIV49, 600 °C
Ligament
Damage Crack-Tip Damg.
a — 5 • 10s mm/h
i - 1 • 10'mm/h
60 0 "C
10 101 10
s 10 ' (h)
K8 1 Notched Round Bar
K1 7 j (T.-rVAit
CT with Side Grooves2 3 4 6 6 7 8 9
Creck.Tip/Farf.eld Ratio V0 - Kuo/o«, »« (mm1) ((Tnosj#|>#| _ ,,„ „̂.43,
K,,J for constant crack growth rate, å versus the,-d for constant crack growth rate, a vi
initial crack tip far field ratio, Vg = Kj;j/a
for creep ductile l CrMoNV material, 600 *CnO'
- 54

8/21/2019 Caso Rotura
http://slidepdf.com/reader/full/caso-rotura 67/200
1 5 0 0
bE
2
1 0 0 0
5 0 0
1
m r
2 0 0 -
1 \ C r M o N i V . 5 5 0 °C . c r e e p d u c t i l e
Lig. D.
I -™
1
111111
11 .
« y^
1
1 0
1n / hi KB
— M —
M i x e d M o d e D a m a g e C ra c
K, -Al i d
• / ^* ^ Í »
* /X
CTO. 5
-4—
s 120- V
x ,X*
jr
>•
<*s¿^^^ ^ *
C T 0. 5 ( W - 4 0 )
HC T I C T 2
- ^ + n r - L - T -
k-T ip D¡
^
m a g e
«
C T 4
-4-
0 5 - I O 3 m m / h A G A
9 1 1 0 ' m m / h (T s c h e u s c h n e r ) / 8 /
• 1 • I O " * m m / h
550 " C
1
I O ' | h | 1 0 «
<^ à - 1 • 1 0 J m m / h / 9 /
A M A ( M a i l e )
A » — 6 • I O ' 5 m m / h
A - C T I
£ - C T 0 . 5 ( W - 4 0 m m )D 2 2 ( H o l l s t e i n / K i a r u i e r ) / 10 /
2 3 4 5 6 7 8 9
C r a c k - T i p / F a r f i e l d R a t i o V 0 — K u o i O n O b M i ( m m , / 2 )
Fig. 14. K ^ d for constant crack growth rate, å, versus theinitial crack tip/farfield ratio, V Q
for l%CrMoNiV, 550 °C.Klid /crnO'
- 55 -

8/21/2019 Caso Rotura
http://slidepdf.com/reader/full/caso-rotura 68/200
2000
»EE^̂zs
s?
1500
1000
500
T1 2 3 4 5 6 7 8 9
C'ock-T ip/Farl ie ld Ratio Vo ~ K<„jo <7>io s» i» i (m m" 2 )
Fig. 15. K^id f ° r c o n s t a n t growth rate à versus the initialcrack tip far field ratio, V Q = K l i d / a n 0 , for 12% Crsteel, 550 °C, creep ductile.
56
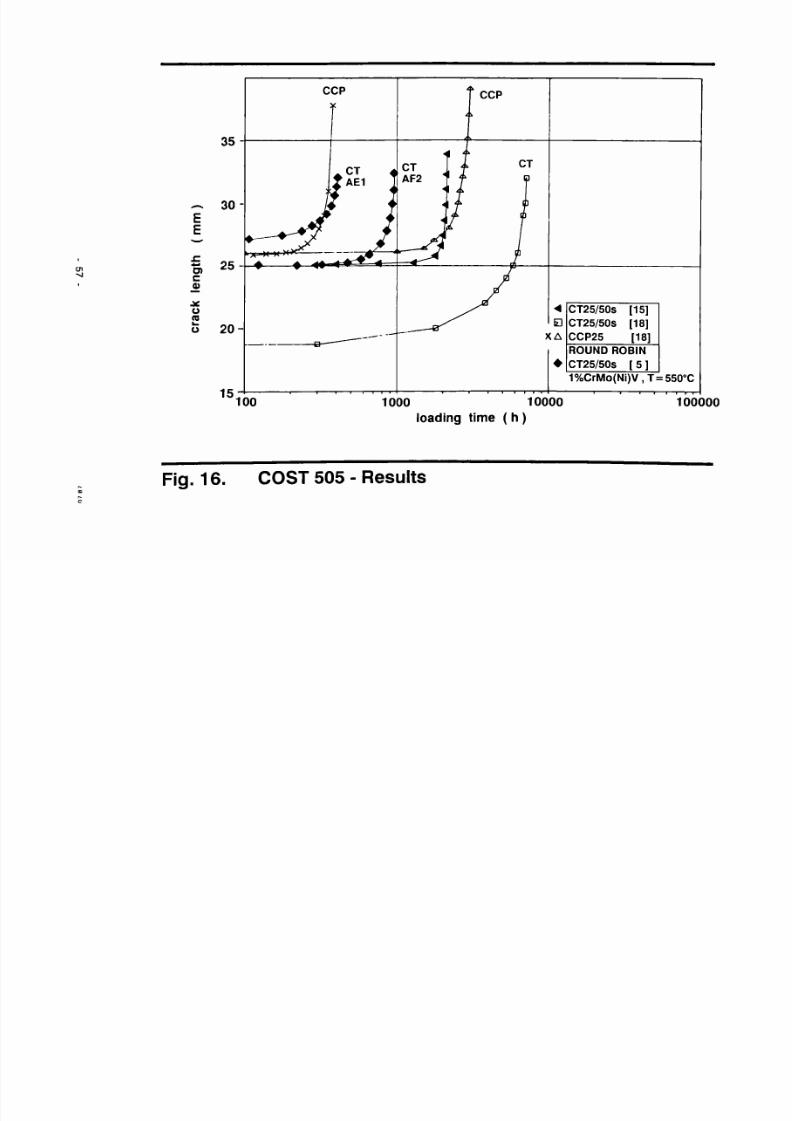
8/21/2019 Caso Rotura
http://slidepdf.com/reader/full/caso-rotura 69/200
35
— 30
EE
O) ¿
°c0)
ü(D
o 20
15 '
CCP
» «« r » " * = «
100
•4
X A
CT25/50S [15]
CT25/50S [18]
CCP25 [18]
ROUND ROBINCT25/50S [ 5 ]
1%CrMo(Ni)V , T = 550°C
1000 10000
loading time ( h )
—i 1 t 1——
100000
Fig. 16. COST 505 - Res u lts
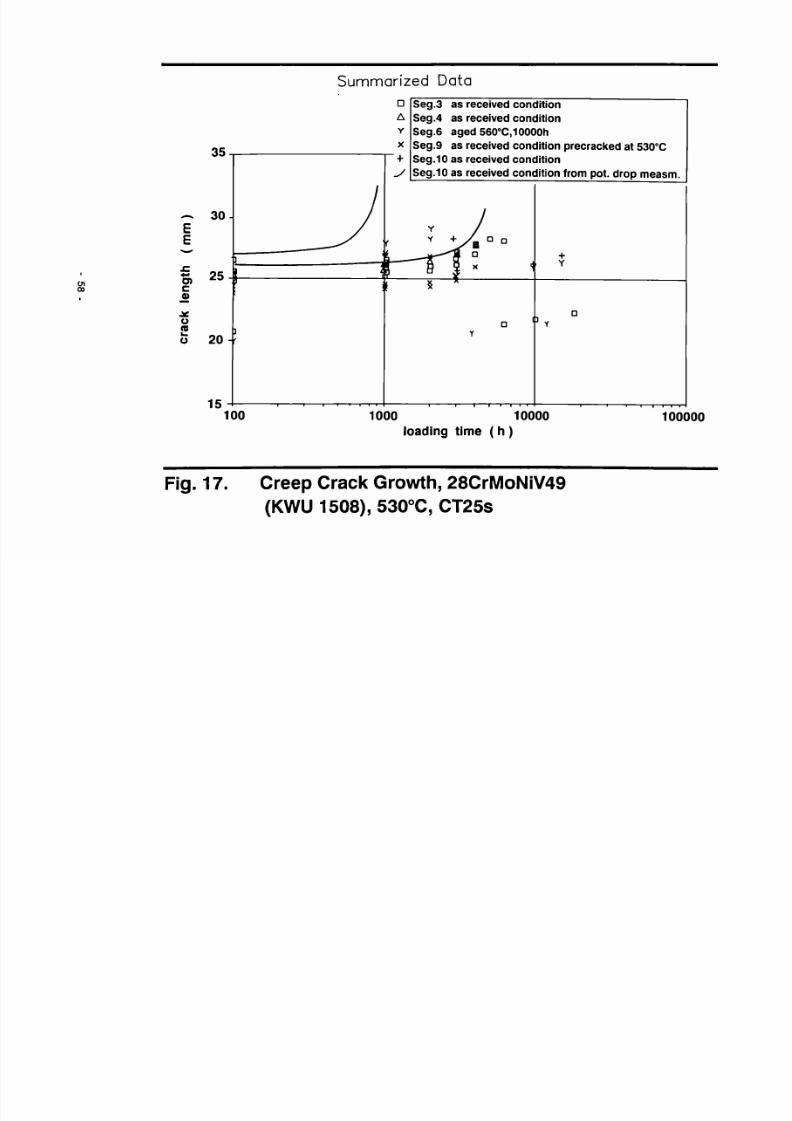
8/21/2019 Caso Rotura
http://slidepdf.com/reader/full/caso-rotura 70/200
Su mma r i z e d Da t a
Ol00
35
DAY
X
+
Seg.3 as rece ived condit ionSeg.4 as rece ived condit ionSeg.6 aged 560°C, 10000hSeg.9 as rece ived condit ion precrac ked a t 530°CSeg.10 as rec e ived con ditionSeg.10 as rec e ived con dition f rom p ot, drop me as m.
1000 10000loading t ime ( h )
Fig. 17 . Cre e p Cra c k Growth , 28CrMoNiV49(KWU 1508), 530°C, CT25S
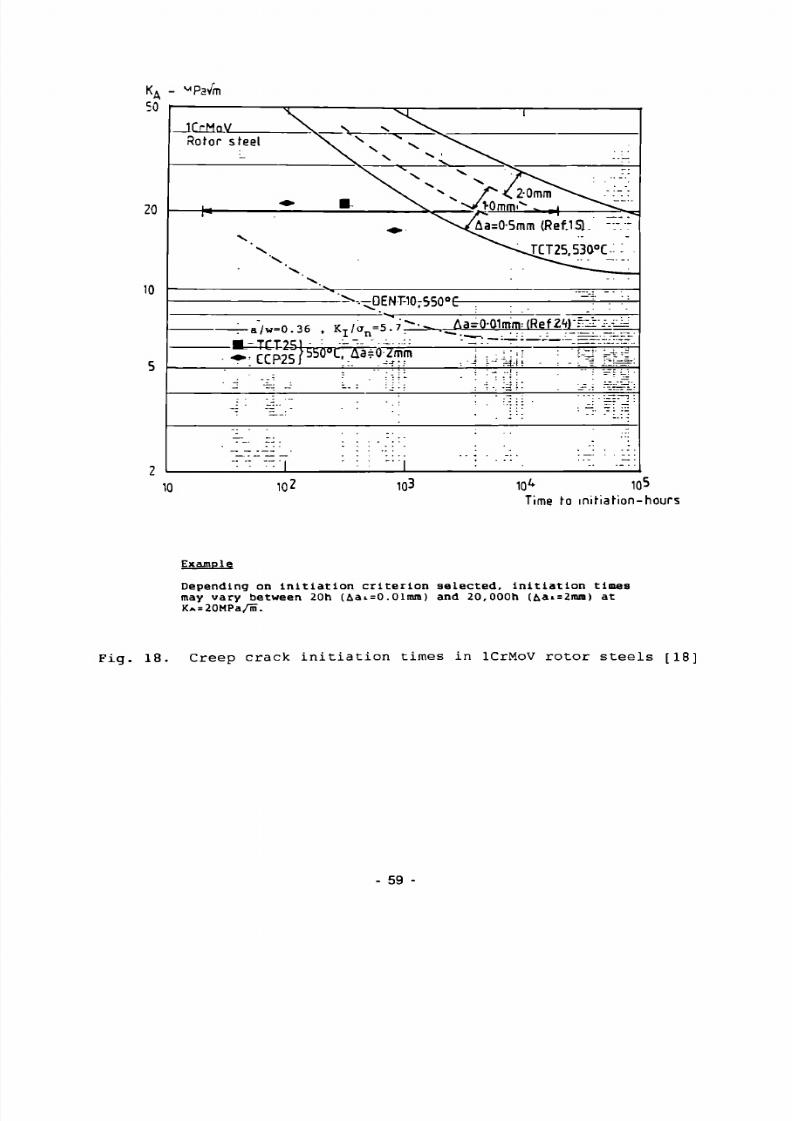
8/21/2019 Caso Rotura
http://slidepdf.com/reader/full/caso-rotura 71/200
KA - ^Pa/m
50
20
10
10
10M( iV \ Rotor steel
v
■ ♦
d
-i •
- rv
a / w = 0 . 3 6
-TCT251 -
N S. s
■-
^
• V _
a«
i fSfâo-craã -= -1
±_.-
=•7
•>. s
♦
^ D E N T 1 : i 5
7 * •
=02mm
ì : 1
i
1
S. i N .
v ^ / ^ O O m m ^ - ^ - -. :
\^Aa=0-5mm (Ref.lSl. -:::
^^^rcT25,530oC-: :
JM L
^ AasO-Olmni i lRefZy lb ] : - - - . -^ ~- . — _ : _ ; ; _ : ^ _ . L =±..~~
. j u-y.íí . : - ~Ş fes--
• ::==.:;• . . i ¡=1-5-.
: ■ ::
)\i -:. = i r = '
1 : • • ~~ -~ :
10* 103 10^ 105 Time fo i n i t i a t i on -hou rs
Example
Depend i ng on I n i t i a t i o n c r i t e r i o n s e l e c t e d . I n i t i a t i o n t ime may v a r y be tween 20h (Aai=0.01mm) and 2 0 , 0 0 0 h ( ai=2ram) a t K«. = 20MPa/m .
F i g . 1 8 . C r e e p c r a c k i n i t i a t i o n t i m e s i n l C rMoV r o t o r s t e e l s [ 18 ]
59
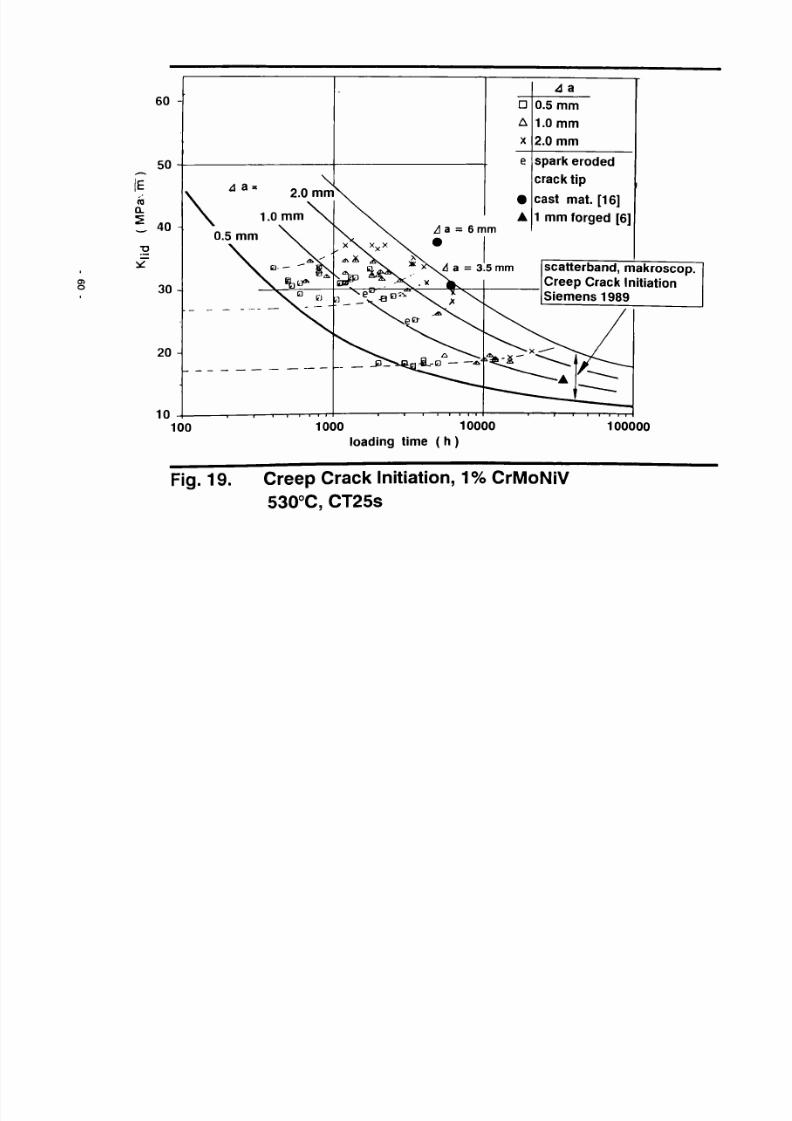
8/21/2019 Caso Rotura
http://slidepdf.com/reader/full/caso-rotura 72/200
Oí
o
60
50
c o
Q .
1 40
30 -l
20
10
0.5 mm
D
A
X
A a
0.5 mm
1.0 mm
2.0 mm
s p a r k e r o d e d
c ra c k ti p
cas t mat . [16]1 mm forged [6]
s c a t t e r b a n d , m a k r o s c o p .Cre e p Cra c k I n i t i a t i o nS i e m e n s 1 9 8 9
1001 1 1 1 1—i—i—i
-
1000 10000load in g t ime ( h )
T — T — I — I -
100000
Fig. 19 . Cre e p Cra ck In i ti a t ion, 1 % CrMoNiV530°C, CT25S

8/21/2019 Caso Rotura
http://slidepdf.com/reader/full/caso-rotura 73/200
6 0 -
50
ra Q .
_ 4 0 -
30
20
10
1 CrMo Ni)V,T = 550°C
a/W = 0.55 a/W = 0.55
, aAV = 0.55 a/W = 0.40 aAV = 0.40 aAV = 0.20 aAV = 0.10
, aAV = 0.50 , aAV = 0.50 , aAV = 0.20
Hollstein C T 1 2 . 5 - 5 0
J r o m à , [ t ]
10000 loading time
Creep Crack Initiation a Criteria
Fig. 20
■}
M a i I e/Ts c h euschner D. x + A Y □ A
0.004W CT),0.01W DENT)
spark eroded
Siemens H
-0,5mm
Ragazzoni a <►
- 0,5mm
Hollstein CT25 - , C T 5 0 X
0,3mm
Holdsworth D o 0,2mm
Creep Crack Initiation with Parameter K Ur i I fatigue precracked
Rintamaa
u e u 0,5mm

8/21/2019 Caso Rotura
http://slidepdf.com/reader/full/caso-rotura 74/200
K.
iH/mrrO
tf -
3*10*
30 CrMoNiV 4 11, AMA, 550 °C A - Cs25. q/tø=0.55
7- 0 9 . q/W=0,4
a = CT100.q/W=0.55
O - Cs50. q/ty=0.55
O - D60. (v^W=0.*
B -0 6 0 . q^W=02 • = D60.(VVi=O.1
10
F i g . 2 1 . S t r e s s I n t e n s i t y v e r s u s c r a c k i n i t i a t o r t i m e fo r a R = 0,01 W , l C r M o N i V , 5 5 5 ° C [ 2 1 ]
6 2 -
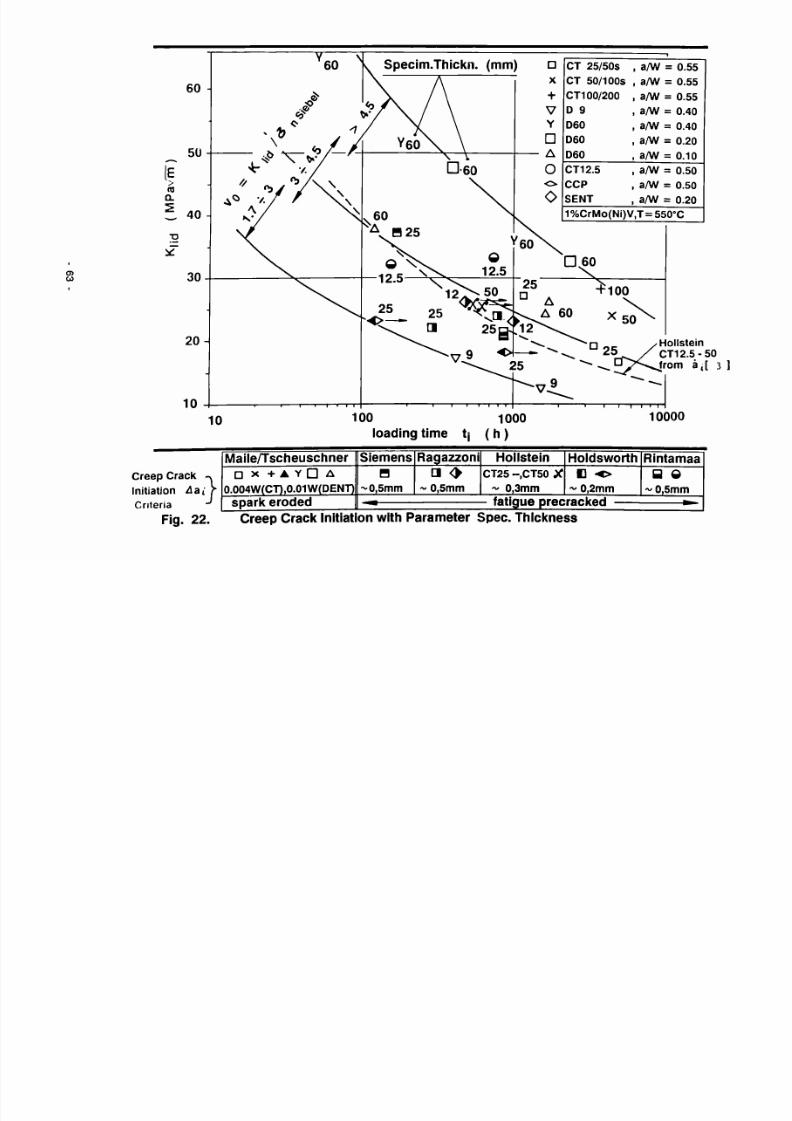
8/21/2019 Caso Rotura
http://slidepdf.com/reader/full/caso-rotura 75/200
u>
60
5U
ra o. Z . 40
30
2 0 -
10
CT 25/50S CT 50/1 OOs CT100/200 D g D60 D60 D60
CrMo(Ni) V,T = SSO C
10
a/W = 0.55 a/W = 0.55 a/W = 0.55 a/W = 0.40 a/W = 0.40 a/W = 0.20 a/W = 0.10
a/W = 0.50 a/W = 0.50 a/W = 0.20
/Ho l ls te in CT12 . 5 - 50 J r om à , [ 3 ]
10000
loading t ime
Creep Crack Initiation Criteria
Fig. 2 2
• >
Mai le/Tscheuschner □ x + ▲ Y D A
0.004W CT ,0.01W DENT
spark eroded
Siemens B
~ 5mm
Ragazzoni
a ~ 5mm
Hollstein CT25 - ,CT50 X
3mm
Holdsworth
2mm fat igue precracked
Rintamaa
y e ~ 5mm
Creep Crack Initiation with Parameter Spec. Thickness
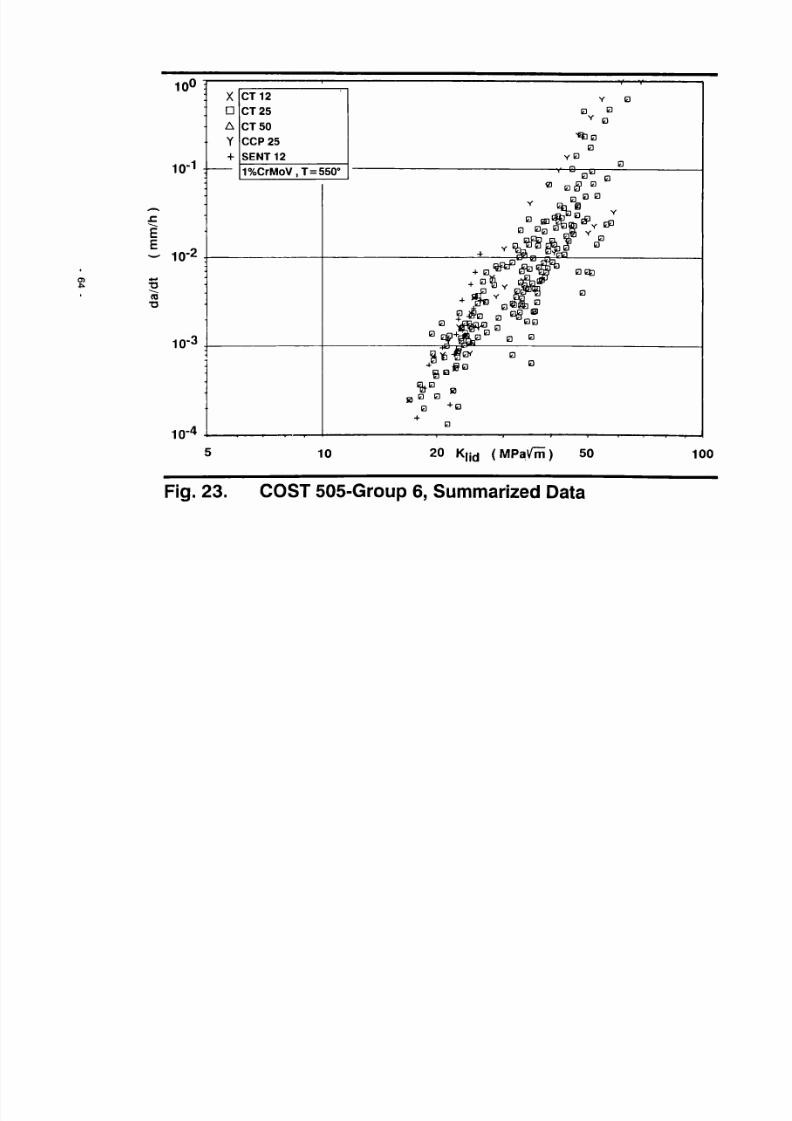
8/21/2019 Caso Rotura
http://slidepdf.com/reader/full/caso-rotura 76/200
10°
Oí
10"
E
reT3
10"
10"
.XDA
Y+
•
•
CT 12CT 25
CT 50C C P 2 5SENT 12
1%CrMoV,T = 550<'
:
Y BB B
T B
S u aB
Y B
' CT U
m B B
BB A V
B j y k « ^ B BB
^ s P3 a a B
QìÉ i - iW B
ET aB B B
0 + B+
B
10 20 K|id ( MP a Y m) 50 100
Fig. 23. COST 505-Group 6, Summa rized Data

8/21/2019 Caso Rotura
http://slidepdf.com/reader/full/caso-rotura 77/200
O ) UI
10
10 -2
E E
ra ■D
10
10 -4
1 0
DA+XY D 20, T = 53 0 °C (forged new material) D 35 , T = 530 °C (casting)
1 CrMoV
10
welded,HAZ
^ 4. y + +
*
¿ti
Y Y
20 K, id (MPa\/m) 50 100
Fig. 24. COST 505-Group 6, Summarized Data, CT25

8/21/2019 Caso Rotura
http://slidepdf.com/reader/full/caso-rotura 78/200
O) O)
•o
1
1
E 10-
1
1
Summa r i z e d a ta
D A
Y X +
Seg.3 as received condition Seg.4 as received condition Seg.6 aged 560°C, 10000h Seg.9 as received condition fatigue precracked at 530°C Seg.10 as received condition
/ /
4
*
* /
9 X 2/
I
■ ^
v
I
I
1 20 K||d MP a t f m ) 50 100
Fig. 25. Creep Crack Growth, 28CrMoNiV49 KWU 1508), 530 °C, CT25S

8/21/2019 Caso Rotura
http://slidepdf.com/reader/full/caso-rotura 79/200
10
cr>
RI ■o
1 CrMoNiV-Steel 530 °C , CT 25s
¿a * o t
2 .0 m m
1.0 m m 0 .5 m m
r a m e t e r l i nes fo r a c c u m u l a t e d c r a c k d e p t h ¿fa to t
crack g ro w t h curves
2 0 Kild ( MPa i/rfT) 5 0 ■ i i
1 0 0
Fig. 26. Creep Crack Initiation and Growth

8/21/2019 Caso Rotura
http://slidepdf.com/reader/full/caso-rotura 80/200
10
O) 00
10 -2
j e
E
7o T3
10
10-
10
c*/\
1
SP
♦
I
Aaqe s
. 2,0 mm
1,0 mm
0,5 mm
i i i
♦ D
■
i i
10 20 K||d ( M P a ^ m ) 50 100
Fig. 27. Creep Crack Initiation, 28CrMoNiV49 KWU (1508), 530°C, CT25S

8/21/2019 Caso Rotura
http://slidepdf.com/reader/full/caso-rotura 81/200
HIGH TEMPERATURE CRACK GROWTHIN STEAM TURBINE MATERIALS
Parti i
Creep Crack Growth in 1% CrMoV Steel and Alloy 800H
an evaluation of the results of the COST 505 and an EGF Round Robin
T. Hollstein*, G.A. Webster**, F. Djavanroodi**
* Fraunhofer Institut für Werkstoffmechanik, Freiburg, D
* * Imperial College of Science and Technology, London, UK
69 -

8/21/2019 Caso Rotura
http://slidepdf.com/reader/full/caso-rotura 82/200

8/21/2019 Caso Rotura
http://slidepdf.com/reader/full/caso-rotura 83/200
ABSTRACT
The report presents the results of a Creep Crack Growth Round
Robin conducted by the COST 505 Group 6 "High-Temperature
Crack Growth" and an EGF Working Party within Task Group 1
"Elastic Plastic Mechanics". Data from twenty-five
laboratories are compared, 'as-determined' by the participants
and following a unified evaluation. For the two materials
tested, Alloy 800 H at 800°C and 1% CrMoV steel at 550°C, it
is shown that the most satisfactory correlations of creep
crack growth rate are achieved with the creep fracture
mechanics parameter C* when a unified evaluation procedure is
adopted. Precautions for obtaining reliable experimental data
and interpretations are discussed and supported by numerical
analysis and models of the cracking process. Little influence
of specimen shape and size is observed and it is demonstrated
that all the cracking occurs under plane-stress conditions. In
the 1% CrMoV steel, transient effects in the early stages of
cracking are shown to be caused by a build-up of creep damage
at the crack tip.
INTRODUCTION
In recent years, an increasing interest has developed in being
able to predict the behaviour of high-temperature components
containing flaws. Such analyses are required to assess defect
acceptability at the design stage, to predict remaining life
and in failure diagnosis.
Depending on the circumstances under consideration, various
approaches are available which may be based on net section
rupture or fracture mechanics methodology. When crack
propagation occupies a significant portion of the lifetime,
creep crack growth rates have been characterised in terms of
the stress intensity factor K, the J integral, the C* integral
71

8/21/2019 Caso Rotura
http://slidepdf.com/reader/full/caso-rotura 84/200
and the C. and C(t) functions, see for example Ref. [ 1] . There
are advantages and disadvantages with the use of each of these
parameters. For example, K is easy to calculate but is notably
geometry dependent in situations where the crack tip stress
field is redistributing at a faster rate than the defect is
propagating. In contrast, C* appears to be able to correlate
creep crack growth rates under steady-state conditions
relatively independently of geometry, but it is more difficult
to apply to the analysis of real components.
With this background, twenty-five laboratories [2-26],
proceeded to conduct a Creep Crack Growth Round Robin to make
an inter-comparison of data generated in differentlaboratories according to agreed procedures. The aims of the
programme were:
- to compare different methods of measuring crack initiation
and growth,
- to evaluate appropriate fracture mechanics field para
meters such as K and C*, and
- to determine the limits of acceptability of fracture
mechanics concepts for high-temperature crack growth
characterization.
The overall objective of the Round Robin was to evaluate the
consistency of the results gathered from different
laboratories and to establish the ability of the field
parameters to correlate creep crack growth rates in a range of
testpiece geometries and ultimately in service components. To
assist in this exercise, two laboratories [3,7] performed
analytical and numerical investigations to produce an
appropriate unified evaluation procedure.
Also included in the report are data which were collected on
the same material under similar testing conditions in other
Round Robin investigations that were organized by the American
Society for Testing and Materials (ASTM) [27] and the Japanese
- 72

8/21/2019 Caso Rotura
http://slidepdf.com/reader/full/caso-rotura 85/200
Society for the Promotion of Science (JSPS) [ 2 8 ] .
Collaboration was achieved through the Versailles Agreement on
Advanced Materials and Standards (VAMAS) [ 2 9] . The data were
analysed together with the EGF results to provide a rigorous
check of the evaluation procedures being developed and a
comprehensive database.
MATERIAL
1% CrMoV steel
The test material was a round bar of a 1% Cr steel(21 CrMoV 5 7) with a diameter of 28 6 mm. The bar was supplied
by Buderus Edelstahlwerke, Wetzlar, identification number
3/22282-Z. Details of the test material given by the
steelmaker are compiled in Table 1.
To check the homogeneity of the material with respect to 0.2%
proof stress R . _ and ultimate tensile stress R ,po .2 m
conventional tensile tests were conducted at room temperature
and 550°C at two different positions along the bar and at four
radial locations (see Fig. 1) . The results are compiled in
Table 2 and Fig. 2. They show no signifcant difference between
the values for the two axial positions but a fairly strong
decrease of the R . _ and R values towards the centre of thepO. 2 m
bar. This is especially conspicuous for the values in the
region AA. It is expected that the strong decrease of the
0.2%-proof stress and ultimate tensile stress near the centre
of the bar (below 0.23 R) will not influence the creep crackgrowth test results, because all the fracture mechanics
specimens were taken from the bar with the crack tips at
approximately 0.5 R.
The impact energy of Charpy specimens tested in COST 505 -
Project D 20 [2] on the same material showed the same
tendency. The results are compiled in Figs. 3 - 6 . The FATT is
- 73 -

8/21/2019 Caso Rotura
http://slidepdf.com/reader/full/caso-rotura 86/200
25°C for the half radius position of both regions AA and DA,
55° C for the centre region of AA and 35° C for the centre
region of DA (Figs. 4, 5 ) . The impact energy over the cross
section for R/2 shows no significant variation (Fig. 6 ) .
A check of the chemical composition over cross sections at the
top and position AA indicated no significant variation (Table
3, from [2] .
The bainitic microstructure of the material is shown in Fig. 7
for region AN. The ferritic portion increases towards the
centre of the bar which explains the deterioration of the
mechanical properties.
The results of creep rupture tests conducted in two
laboratories [6,30] are summarized in Tables 4 and 5 and are
plotted in Figs. 8 - 1 0 . The creep rupture tests at three
different axial positions show a marginal reduction of creep
strength towards the top of the bar [6] which is comparable to
the reduction in tensile strength and Charpy energy [2].
The minimum creep strain rate e . determined from the plots min
in Fig. 9 are shown in Fig. 11 as a function of stress. For stresses between 150 and 250 MPa c . can be described at
min 550°C to a good approximation by a Norton law
è . = 1.3 • I O - 2 0 ■ <r6'5 [ h - 1], <r in MPa. (1) m i n L j r
Over the whole stress range measured, the exponent in Eq. (1)
varies between 4 and 8. Also because of the variation in n the
stress dependence of c . is better described by an min
exponential law (see Fig. 1 2 ) :
I . = 7.06 - 1 0 - 9 - e ° -0 3 6 9 «■ [ h - 1 ] f v in MPa. (2)
min
When the creep strain and strain rate are represented by a law
according to Garofalo, to include primary creep then,
- 74
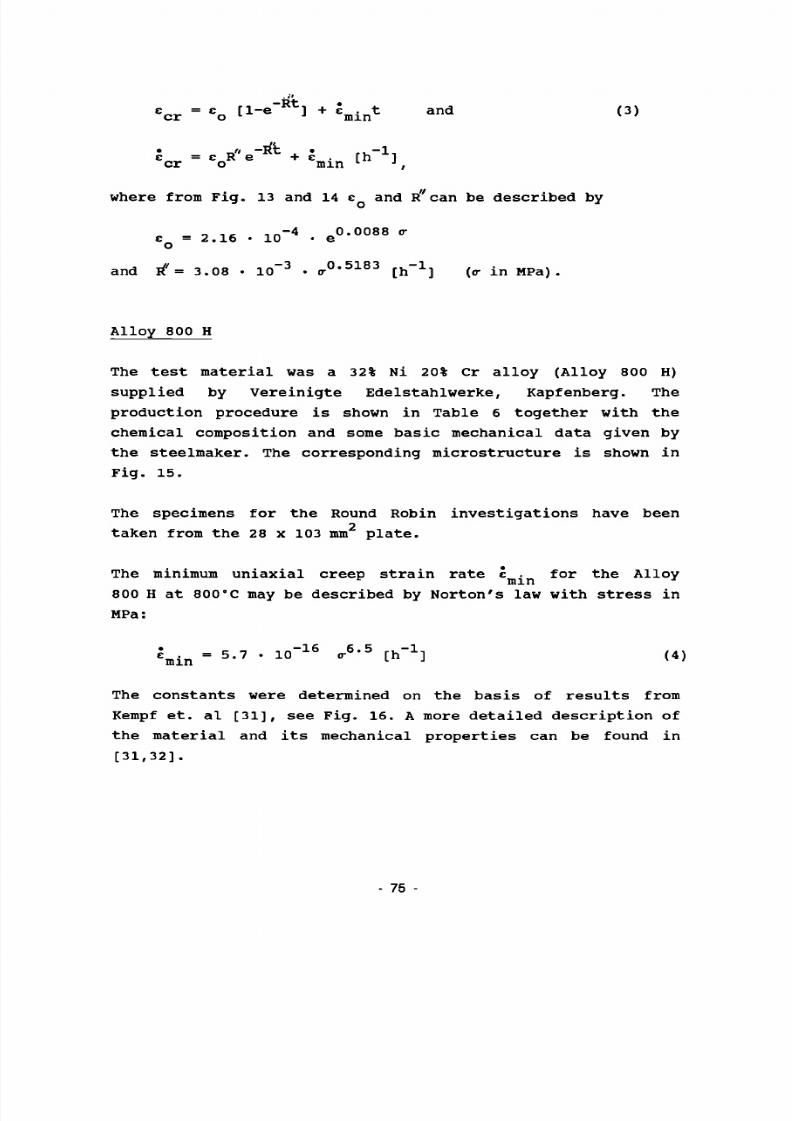
8/21/2019 Caso Rotura
http://slidepdf.com/reader/full/caso-rotura 87/200
—■RI • G c r = eo t 1 6 I + «min* a n d ( 3 )
i r r = e V e A + l . [h _ 1] cr o min ,
where from Fig. 13 and 14 e and R' can be described by
o - o ic m - 4 Q0.0088 <r e_ = 2.16 • 10 • e o
and R = 3.08 • I O - 3 • o- 0' 5183 [h - 1] (¡r in MPa) .
Alloy 800 H
The test material was a 32% Ni 20% Cr alloy (Alloy 800 H)
supplied by Vereinigte Edelstahlwerke, Kapfenberg. The
production procedure is shown in Table 6 together with the
chemical composition and some basic mechanical data given by
the steelmaker. The corresponding microstructure is shown in
Fig. 15.
The specimens for the Round Robin investigations have been 2 taken from the 28 x 103 mm plate.
The minimum uniaxial creep strain rate è . for the Alloy min
800 H at 800°C may be described by Norton's law with stress in
MPa:
? .„ = 5.7 - I O - 1 6 o-6'5 [h _ 1] (4) min L J
The constants were determined on the basis of results from Kempf et. al [31], see Fig. 16. A more detailed description of
the material and its mechanical properties can be found in
[31,32].
75

8/21/2019 Caso Rotura
http://slidepdf.com/reader/full/caso-rotura 88/200
SPECIMENS
1% CrMoV steel
Most of the results were gathered using 25 mm thick and 50 mm
wide compact tension testpieces (CT25/50), but other specimen
types (i.e. single-edge notched three-point bend - SENB3,
single-edge notched tension - SENT and centre-notched
tension-CN) and sizes (i.e. thicknesses from 5 to 63 mm) were
also tested. Parts of the material cut-up plans for the test
specimens are given in Fig. 17. The other specimens were cut
similarly.
All the cracks in the specimens were oriented in a radial
direction to give crack extension towards the centre of the
bar where possible. The crack tips of the CT specimens were
positioned to be at about R/2. Some basic data of the tested
specimens are compiled in Table 7. Specific details of all the
specimen dimensions and test conditions are given in the
individual participants' reports.
Alloy 800 H
Most of the results were gathered using 25 mm thick
compact-tension specimens, but some smaller compact-tension
specimens and centre-notched tension specimens were also
tested. The material cut-up plan and some basic data of the
tested specimens are compiled in Fig. 18 and Table 8,
respectively.
TEST P ROCEDURE
It was required that all the specimens should be fatigue
precracked at room temperature according to the procedures
recommended by ASTM [33,34] to a crack length to width ratio
76

8/21/2019 Caso Rotura
http://slidepdf.com/reader/full/caso-rotura 89/200
a/W = 0.5, approximately, although shorter initial crack sizes
were allowed. It was stated that the final maximum load during
precracking was not to exceed that to be used for creep crack
growth testing.
After precracking most specimens were provided with 20% deep
side grooves (10% each side). A few were retained for testing
without side grooves. No guidelines were given for other
specimen geometries.
All the tests in the COST and EGF creep crack growth
investigations were conducted at 550°C. Loads were chosen
mainly to give approximately 4 mm of crack extension inapproximately 4 to 10 weeks although some testing was
performed at higher and lower loads. It was specified that all
specimens should be held at the test temperature for 16 hours
before the load was applied.
Throughout all tests, it was required that load line
displacement and crack length, using electrical potential
methods, should be recorded continuously. Other methods of
measuring the crack length were allowed in addition.
Each participant was allowed to determine the crack growth
rate, K and C* using their own preferred route. It was
instructed that all the raw data were to be transferred to a
central point to enable the results to be processed by a
single analysis route.
The ASTM and JSPS tests were carried out at 538°C and 594°C
mainly on CT specimens with 25% side grooves.
- 77

8/21/2019 Caso Rotura
http://slidepdf.com/reader/full/caso-rotura 90/200
PARAMETER DETERMINATION
Crack Growth Rate à
The creep crack growth rate à was determined from the cracklength versus time records. In general, these were con
structed using the output from direct- or alternating- current
potential drop instrumentation. However, two participants
[3,26] also used the single specimen partial unloading
compliance method and the multiple specimen unloading
technique.
There was some disagreement between participants concerningthe existence of an incubation period prior to the onset of
crack growth, which led to further testing to resolve the
situation. However, the difference in the growth rates
calculated assuming either the presence or absence of an
incubation period did not vary by more than a factor of two.
In the unified approach à was determined from a seven point
polynomial fit to the crack length versus time recordings
[35]. In some cases, only one value could be evaluated by
linear interpolation due to insufficient experimental pointsor relatively short testing times.
Stress Intensity Factor K
The stress intensity factor K was determined according to the
formulae in the ASTM Standard [33].
C* Integral
To determine C*, participants were encouraged to use a formula
based on the relationship:
F vC* = *c F I T ' <5>
nwhere F is load, v_ is the load line displacement rate due to
- 78
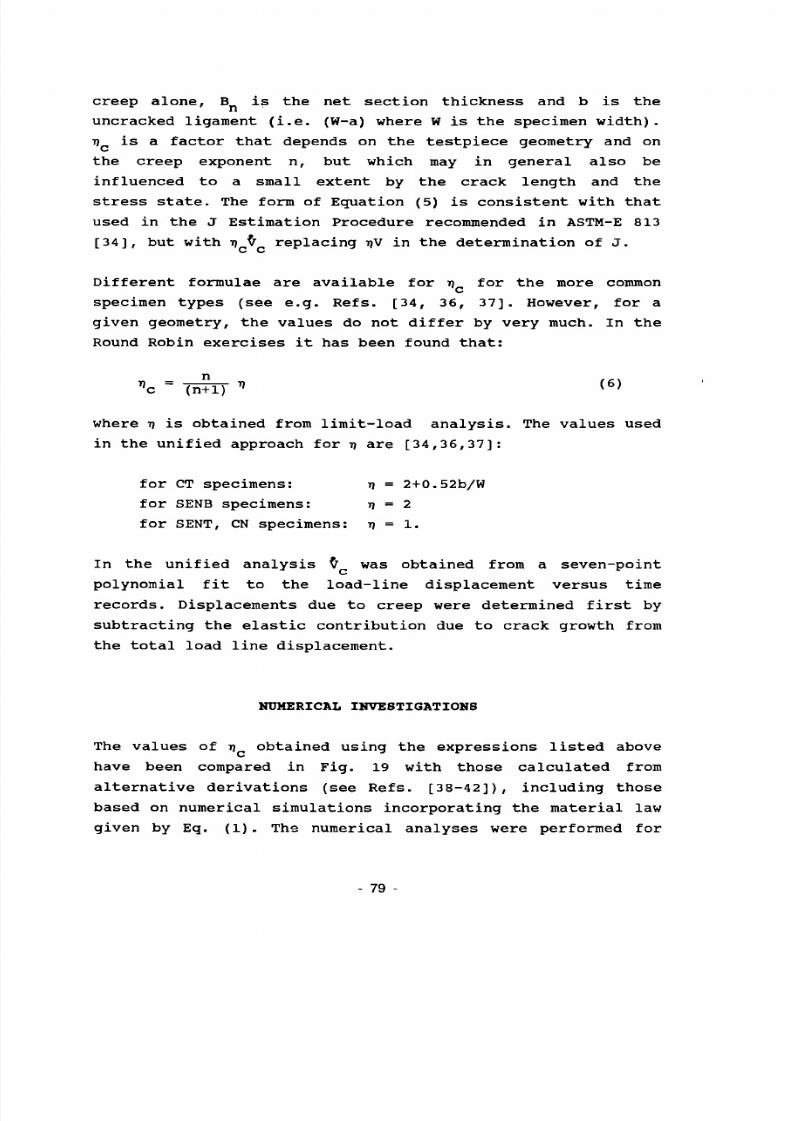
8/21/2019 Caso Rotura
http://slidepdf.com/reader/full/caso-rotura 91/200
creep alone, B is the net section thickness and b is then
uncracked ligament (i.e. (W-a) where W is the specimen width).
T) is a factor that depends on the testpiece geometry and on
the creep exponent n, but which may in general also be
influenced to a small extent by the crack length and the
stress state. The form of Equation (5) is consistent with that
used in the J Estimation Procedure recommended in ASTM-E 813
[34], but with T) V replacing 7)V in the determination of J.
Different formulae are available for i) for the more commonc
specimen types (see e.g. Refs. [34, 36, 37 ] . However, for a
given geometry, the values do not differ by very much. In the
Round Robin exercises it has been found that:
''c = Tn W V (6)
where TJ is obtained from limit-load analysis. The values used
in the unified approach for TJ are [34,36,37]:
for CT specimens: TI = 2+0.52 b/W
for SENB specimens: TJ = 2
for SENT , CN specimens: ij = 1.
In the unified analysis $ was obtained from a seven-point
polynomial fit to the load-line displacement versus time
records. Displacements due to creep were determined first by
subtracting the elastic contribution due to crack growth from
the total load line displacement.
NUMERICAL INVESTIGATIONS
The values of TJ obtained using the expressions listed above
have been compared in Fig. 19 with those calculated from
alternative derivations (see Refs. [38-42]), including those
based on numerical simulations incorporating the material law
given by Eq. (1) . The numerical analyses were performed for
79

8/21/2019 Caso Rotura
http://slidepdf.com/reader/full/caso-rotura 92/200
different specimen types and stress states using line integral
and/or energy dissipation rate equations for C* [43]:
f 9ui 1
C * = ƒ [ W* dy - T ± gir ds J (?)
The equivalence between (7) and (8) is only valid for a
viscous material under steady-state creep conditions, when
elastic strains are negligible.
•emn
W* is the stress work rate W* = T <r. .dê. .
oJ 13 ^
V n
and U* is defined as U* = ƒ F dv ,o
where the following notations are used:
r integration path around the crack tipconnecting the lower and the upper crackface in a counter-clockwise direction,
ds arc length on r,o-ij components of the stre ss ten sor ,Ti = o-ij nj components of the t raction vect or,eij components of the s trai n rat e ten sor ,ui components of the displac ement rate
vector.
The summation convention is implied for repea ted indi ces .
Subroutines to calculate J and C* integr als ha ve bee n
implemented into the finite-elemen t program me ADINA [44].
Since all quant ities entering Eq. (7) are known in the cour se
of an FEM calculation, the line integra l can readily be
evaluated. More effective and easily extendab le to
three-dimensional problems is the calculation of rele ase rate s
by the virtual crack ext ension method [ 45 ] . Both method s have
been employed and lead to the same results withi n the
machine-dependent accuracy, see [ 3 ] .
- 80
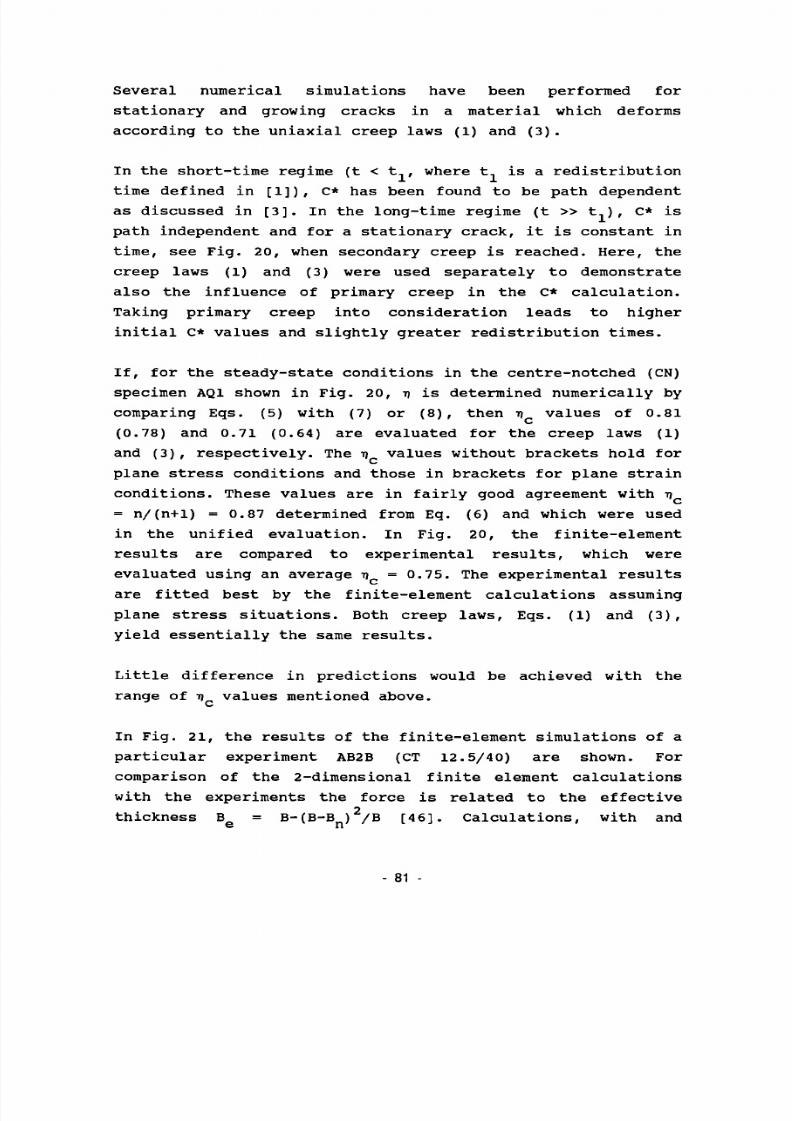
8/21/2019 Caso Rotura
http://slidepdf.com/reader/full/caso-rotura 93/200
Several numerical simulations have been performed for
stationary and growing cracks in a material which deforms
according to the uniaxial creep laws (1) and (3).
In the short-time regime (t < t- , where t is a redistributiontime defined in [1]), C* has been found to be path dependent
as discussed in [3]. In the long-time regime (t » t ) , C* is
path independent and for a stationary crack, it is constant in
time, see Fig. 2 0, when secondary creep is reached. Here, the
creep laws (1) and (3) were used separately to demonstrate
also the influence of primary creep in the C* calculation.
Taking primary creep into consideration leads to higher
initial C* values and slightly greater redistribution times.
If, for the steady-state conditions in the centre-notched (CN)
specimen AQ1 shown in Fig. 20, ij is determined numerically by
comparing Eqs. (5) with (7) or (8 ), then TJ values of 0.81
(0.78) and 0.71 (0.64) are evaluated for the creep laws (1)
and (3), respectively. The TJ values without brackets hold for
plane stress conditions and those in brackets for plane strain
conditions. These values are in fairly good agreement with TI
= n/(n+l) = 0.87 determined from Eq. (6) and which were usedin the unified evaluation. In Fig. 20, the finite-element
results are compared to experimental results, which were
evaluated using an average TI = 0.75. The experimental results
are fitted best by the finite-element calculations assuming
plane stress situations. Both creep laws, Eqs. (1) and (3) ,
yield essentially the same results.
Little difference in predictions would be achieved with the
range of TI values mentioned above.
In Fig. 2 1, the results of the finite-element simulations of a
particular experiment AB2B (CT 12.5/40) are shown. For
comparison of the 2-dimensional finite element calculations
with the experiments the force is related to the effective2thickness B = B-(B-B ) /B [46]. Calculations, with and
81

8/21/2019 Caso Rotura
http://slidepdf.com/reader/full/caso-rotura 94/200
(1). It was assumed, as determined in [3] , that after an
incubation period of 1 hour
à = 7.41 • 10~ 3 • c*0'72 (9)
with à in mm/s and C* in N/(mm>s).
These finite-element calculations gave ij values of 1.86 andc
1.82 for plane stress and plane strain, respectively, which
are in good agreement with TJ = 1.94 according to Eq. (6).
Whereas the calculations for C* without crack growth are
similar to those of CN 12.5/50 specimens AQ2 (see Fig. 20) and
decay to a constant value, those which include crack growth
rise and give good agreement between the plane-stresscalculations and the experimental results. Also, the
experimental crack growth versus time curve corresponds best
with the plane-stress predictions, see Fig. 22.
The ability to perform numerical calculations of this type is
particularly important when there is a requirement to
determine C* for non-standard testpiece geometries or real
components. Some examples of special cases which have been
examined using these methods, for n = 6.5, are:
T) = 0.17 - elliptical surface crack loaded in tension at
infinity [40],
T) = 1.35 - circumferential crack in a tube subjected to
combined tension and internal pressure loading
[40],
ij = 1.75 - square section SENB3 testpiece, assuming only
horizontal displacement of specimen at roller
supports [47],V = 1.54 - square section SENB3 testpiece, assuming free
rotation of specimen at roller supports [47].
In all these circumstances, the values obtained for plane
stress and plane strain deformation were effectively the same.
82

8/21/2019 Caso Rotura
http://slidepdf.com/reader/full/caso-rotura 95/200
Consequently, the finite-element analyses confirm the values
of ii adoptei
approximations.
of ii adopted in the unified approach as reasonable
RESULTS
1% CrMoV steel
Initially, creep crack growth rates were determined in terms
of K and C* by the individual participants, see Figs. 23 and
24. The degree of scatter associated with both loading
parameters is considerable. It can be attributed, partly, to
different interpretations of the raw data and evaluation
procedures and partly to effects of geometry, size and
pronounced crack growth rate "tails" in the early stages of
cracking. In order to determine the significance of each of
these factors, all participants were asked to submit their raw
data to one laboratory [7] in a form suitable for a unified
evaluation.
The results of applying a single standard analysis are givenfor K and C* in Figs. 25 and 2 6, respectively. It is apparent
that the unified approach has only little influence on the
extent of the à versus K correlation. However, the overall
scatter of the C* data is reduced significantly by adopting
the recommended procedure for obtaining C* from Eq. (4) .
However, there is still appreciable scatter associated with
this loading parameter, particularly in the early stages of
cracking.
Alloy 800 H
The degree of scatter displayed by the initial creep crack
growth rate plots for the Alloy 800 H was lower than that
exhibited by the 1% CrMoV steel (the original C* data
collation for Alloy 8 00 H are shown in Fig. 2 7 ) , covering about
- 83

8/21/2019 Caso Rotura
http://slidepdf.com/reader/full/caso-rotura 96/200
one order of magnitude on a. In part, this was due to the fact
that the database for the alloy was less extensive and that
the results were gathered using fewer specimen geometries and
sizes. It was also due to the fact that the crack growth rate
'tails' were less pronounced for this material.
The results of applying a single standard analysis are given
for K and C* in Figs. 28 and 2 9, respectively. Using a uni fed
approach had no influence on the extent of the à versus K
databand (and hence the K results are only given once in Fig.
3 0) . The overall scatter of the C* data is reduced by about
half a decade by adopting the procedures described above.
The correlation between à and C* is about the same as
determined by [38] for the same batch of material and for
different geometries and sizes of specimens (see Fig. 3 0 ) .
That is shown by the power law correlation
à = 0.0034 • c*0,733 (10)
with k in mm/s and C* in N/(mm-s), which is represented by the
straight line in Figs. 29 and 39.
DISCUSSION
Unified Correlations
The collations of the creep crack growth rate results from the
Round Robin programme, 'as-determined' by the individual
partners, give poor correlations with K and, at least for the
1% CrMoV steel, with the C* parameter. The situation is not
much improved for the à versus K correlations when a single
assessment procedure is adopted, suggesting that the linear
elastic expression is not a satisfactory parameter for
describing creep crack growth data over a wide range of
cracking rates in 1% CrMoV at 550°C and Alloy 800 H at 800°C.
84 -

8/21/2019 Caso Rotura
http://slidepdf.com/reader/full/caso-rotura 97/200
The observations, that a correlation with C* is improved when
a standard analysis of the data is carried out, implies that
an appreciable cause of the initial scatter was due to the
application of different methods of data assessment. For
example in the present study, à and ^ were derived from the crack length and displacement versus time records using a
range of techniques. These included manual, cubic spline and
seven-point polynomial curve fitting routines. In the
calculation of C*, some participants used analytical
estimates, which are very sensitive to the choice of n in the
creep law, and others utilised total load line displacement
rate rather than that due to creep alone (i.e. ) . Similarly,
some used gross rather than net section thickness. The degree
of scatter was particularly exaggerated with the C* estimates derived using theoretical representations of ţ according to
Ref. [42] in Eq. (5). The most consistent interpretations are
obtained using the preferred standard evaluation route of the
unified analysis.
The scatter of the unified analysis can be reduced by
separating out data on specimens of different size and
geometry. The effect of specimen size is shown in Fig. 31 for
the 1% CrMoV steel, compact tension results.
It can be seen that the total spread in the data is much less
than is depicted in Fig. 26. However, there is still
significant scatter at the lower cracking rates observed in
the initial stages of a test. This is the so-called 'tail'
region where a small increase in C* (or K) is responsible for
a large increase in a. Later a linear relationship is obtained
in Fig. 31 with little scatter consistent with the form of Eq. (9) assumed in the numerical predictions.
A detailed examination of the experimental data has revealed
that the tails represent a period during which a decreasing or
an approximately constant displacement rate prevails. It can
occupy up to about 3 of the overall lifetime [6] of a test.
- 85 -

8/21/2019 Caso Rotura
http://slidepdf.com/reader/full/caso-rotura 98/200
The linear region on Fig. 31 corresponds with a progressively
accelerating displacement rate and is associated with having
achieved a steady-state distribution of stress and damage
ahead of a crack tip. An approximate expression for describing
this behaviour has been given by Nikbin, Smith and Webster[48] as
à = 3 • C*°'85/e£ (11)
with â in mm/h, C* in MJ/m h and e4 is creep ductility
appropriate to the state of stress at the crack tip. This is
taken as the uniaxial creep ductility c_ for plane stress
conditions and ef/50 for plane strain. The predictions of this
expression, for an average uni-axial creep ductility from Fig.10 of e f = 0.15 for the 1% CrMoV steel, are shown in Fig.
31. It is apparent that good agreement is obtained when plane
stress is assumed consistent with the numerical calculations
shown in Fig. 20 to 22. In addition there is no evidence of
size effects in Fig. 31 over a range of specimen thicknesses
from 10 to 63.5 mm.
Initiation of Crack Growth in 1 % CrMoV steel
An example, which sheds light on the first part of an
experiment with the 1 % CrMoV-steel specimens after loading is
shown in Fig. 32. Plotted are the evolution of the load-line
crack opening displacement V and of the final crack extension
Aa in the CT 50/100 specimens AP2 and AF3 (thickness B = 50
mm, width W = 100 mm, 20% side grooves). The crack growth was
measured also by the direct-current potential differencemethod, see Fig. 33. From these data, it can be seen that the
initial crack growth is approximately linear with time. The
microstructure in the crack tip area in the middle of specimen
AP2 is shown in Fig. 34.
In addition, extrapolation of the crack growth and potential
values, respectively, in Figs. 32 and 33 to the beginning of
86
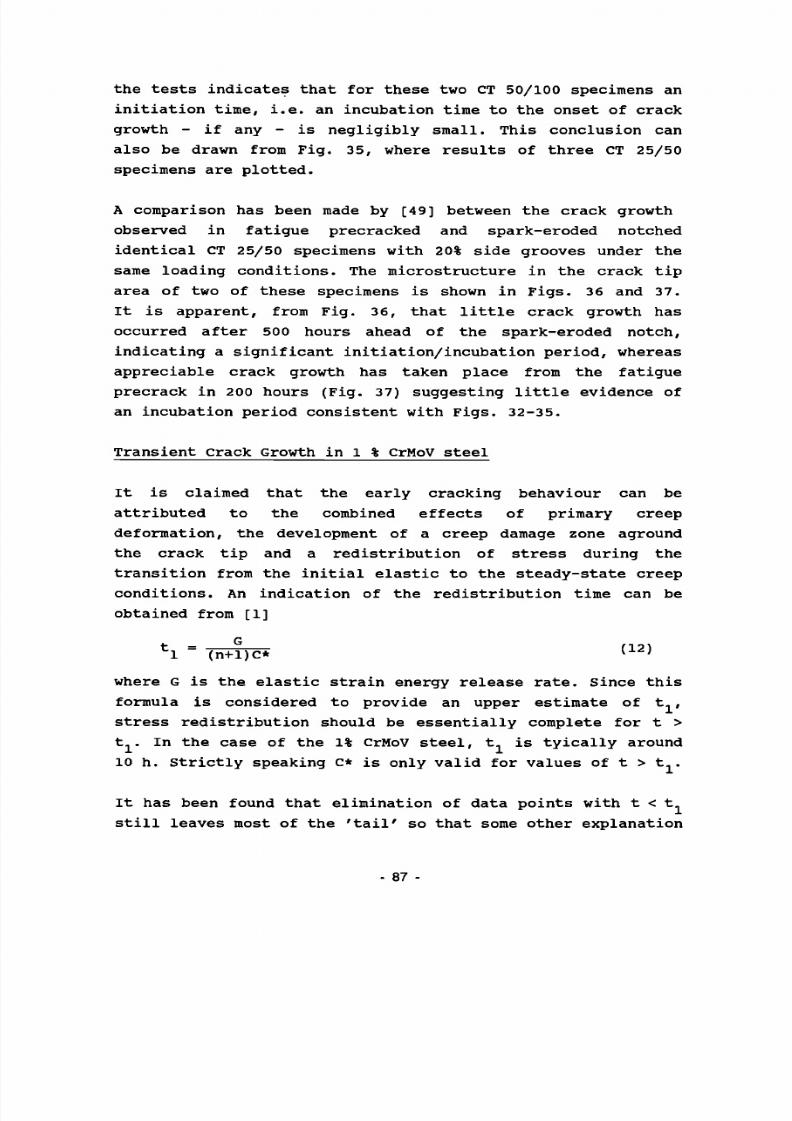
8/21/2019 Caso Rotura
http://slidepdf.com/reader/full/caso-rotura 99/200
the tests indicates that for these two CT 50/100 specimens an
initiation time , i.e. an incubation time to the onset of crack
growth - if any - is negligibly small. This conclusion can
also be drawn from Fig. 35, where results of three CT 25/50
specimens are plotted.
A comparison has been made by [49] between the crack growth
observed in fatigue precracked and spark-eroded notched
identical CT 25/50 specimens with 20% side grooves under the
same loading conditions. The microstructure in the crack tip
area of two of these specimens is shown in Figs. 36 and 37.
It is apparent, from Fig. 36, that little crack growth has
occurred after 500 hours ahead of the spark-eroded notch,
indicating a significant initiation/incubation period, whereas
appreciable crack growth has taken place from the fatigue
precrack in 200 hours (Fig. 37) suggesting little evidence of
an incubation period consistent with Figs. 32-35.
Transient Crack Growth in 1 % CrMoV steel
It is claimed that the early cracking behaviour can be
attributed to the combined effects of primary creepdeformation, the development of a creep damage zone aground
the crack tip and a redistribution of stress during the
transition from the initial elastic to the steady-state creep
conditions. An indication of the redistribution time can be
obtained from [1]
fc i = T ïS îyc * <12>
where G is the elastic strain energy release rate. Since this
formula is considered to provide an upper estimate of t.,
stress redistribution should be essentially complete for t >
t 1. In the case of the 1% CrMoV steel, t. is tyically around
10 h. Strictly speaking C* is only valid for values of t > t..
It has been found that elimination of data points with t < t.
still leaves most of the 'tail' so that some other explanation
- 87 -

8/21/2019 Caso Rotura
http://slidepdf.com/reader/full/caso-rotura 100/200
is required of this behaviour. This can be obtained as
follows.
Consider Fig. 38 which shows a creep damage zone ahead of a
crack. When a steady state distribution of damage has developed in this region it has been shown [48] that the
steady state creep crack growth rate å is given by
as = 1 - 1 ) [ Ş ^ ]n / n + 1 )
c r c ) V n + D (13)
where I is a non-dimensional function of n and state of n
stress and C is the proportionality factor in the Norton creep law. In deriving this relation, it was assumed that crack
advance takes place when the creep ductility is exhausted at
the crack tip. Under steady state conditions progressively
more damage exists as the crack tip is approached and little
extra strain is required to break a ligament dr at the crack
tip since it will be almost broken before the crack reaches
it.
This situation does not exist on first loading. The small ligament dr will not have suffered any creep strain and
failure will not occur until a time dt has elapsed, given by
e_ = e dt
This leads to an initial creep crack growth rate a of
_ . C*l n/(n+1),„'_ /< o=-b-[?] / V ' ^dr)V(n +l) (14)
which is similar in form to the steady-state relation Eq. (13) . Because the dr and r are raised to a small fractional ' c power in Eqs. (13) and (14),
s WIT as < 1 5>
For most materials therefore the initial crack growth rate is
88

8/21/2019 Caso Rotura
http://slidepdf.com/reader/full/caso-rotura 101/200
expected to be approximately an order of magnitude less than
that predicted from the steady state analysis. This is
consistent with the experimental results shown in Fig. 31. For
each crack advance dr, each successive ligament in Fig. 38
will progressively accumulate more damage prior to fracture.The cracking rate will increase correspondingly to
(€{"€*)[-r
/(n+1)(c'dr)VCn+D (16)
L n J
where e* is the creep ductility used up in the ligament prior
to the arrival of the crack. Numerical integration is required
to evaluate Eq. (16). Its prediction of some tests is shown in
Fig. 39. The satisfactory correlation indicates that the
majority of the 'tail' can be attributed to the build up of
damage at the crack tip during the early stages of cracking.
On similar physical grounds, but in a more mathematical
formulation, the 'tails' have been described by Kubo et al
[50], Riedel [ 51], and Bassani [52].
For most tests it has been found that the build up of damageoccupies about the first 0.5 mm of crack extension. When this
cracking is eliminated from Fig. 39, as shown in Fig. 40, the
scatter in the data is further reduced.
Geometry Effects
In order to examine these effects for the 1 % CrMoV-steel, the
'tails' have been eliminated from the data for clarity. Theresults are shown in Fig. 41. It is evident that there is
little influence of geometry on the cracking rate although the
CT data tend to be distributed towards the top of the scatter
band. The use of CT data in design should therefore be
preferred as they will result in the safest predictions. In
Alloy 800 H, a geometry effect could not be found, see Figs.
29 and 30
89

8/21/2019 Caso Rotura
http://slidepdf.com/reader/full/caso-rotura 102/200
Comparisons with ASTM and JSPS data on 1 % CrMoV-steels
These data are summarized together with the EGF results in
Fig. 42. It can be seen that, although the test conditions
were different, broadly similar correlations are achieved.
This would be expected from Egs . (11) and (13) unless a change
in temperature causes a significant change in creep ductility.
It has been advocated that the C(t) and C. [53] parameters can
be employed to interpret creep crack growth data when t < t..
Both of these parameters tend to C* at long times. Since it
has been found that t. a 10 hours for the test conditions
imposed, it is expected that the data should mostly correlatewith C* and the use of C(t) and C. is not necessary.
Initial Cracking Rates
It can be argued that the inital cracking rates for the
1 % CrMoV stee l, with a transition time of typically 10 h or
more before stress redistribution has had time to occur,
should be described by K. The correlations for standard size
CT geometries and the other geometries are shown in Fig. 43.
It can be seen that all the data can be described
'satisfactorily by the same equation [3 ] .
90 -

8/21/2019 Caso Rotura
http://slidepdf.com/reader/full/caso-rotura 103/200
CONCLUSIONS
Experiments and analyses have been performed on a 1% CrMoV
steel and on Alloy 800 H which have shown that creep crack
growth in these materials is described most satisfactorily bythe creep fracture mechanics parameter C*. Recommendations
have been made about how to obtain the most reliable estimates
of C* from experimental measurements. These have been
supported by numerical computations. It has been found that
the use of 20% side grooves (10% of the total thickness each
side) in compact tension specimens, and a seven-point
polynomial fit to obtain crack growth and displacement rates,
produces the most consistent correlations.
It has been demonstrated for the 1% CrMoV steel that all the
cracking took place under plane stress conditions. Increased
scatter, due to 'tails' in the early stages of cracking, has
been shown to be caused mainly by the progressive build up of
damage at the crack tip until a steady state distribution is
reached. This can take up to 30% of the life of a specimen and
can be important in practical applications. However, little
evidence of a 'tail' was noticed for Alloy 800 H.
Comparisons have been made with data obtained in other test
programmes on the 1% CrMoV steel. These have reinforced the
findings of this investigation.
91

8/21/2019 Caso Rotura
http://slidepdf.com/reader/full/caso-rotura 104/200
References
[I] Riedel, H., Fracture at High Temperatures, SpringerVerlag, Berlin, Heidelberg, New York, 1987.
[2] Ewald, J., Berger, C , Brachvogel, H., Investigations onCrack Initiation and Propagation under Static, Cyclicand Combined Loading Conditions of 1% CrMoV Steels at530'C; COST 505-D20/D21, Annual Progress Reports andFinal Report, Siemens-KWU, Mülheim, June 1989.
[3] Hollstein, T., Kienzier, R., Numerical Simulation ofCreep Crack Growth Experiments; COST 505-D22, AnnualProgress Reports and Final Report, IWM Freiburg,December 1988.
[4] Kanbach, H., Crack Growth in Welded Turbine Materialsand Elevated Temperatures; COST 505-D35, Annual Progress
Reports and Final Report, AEG Frankfurt, March 1989.
[5] Raggazzoni, S., High Temperature Crack Growth in SteamTurbine Rotor Material under Static and Cyclic Loading;COST 505-13, Annual Progress Reports and Final Report,ENEL, Milano, March 1989.
[6] Holdsworth, S.R., High Temperature Crack Growth inTurbine Steels; COST 505-UK5, Annual Progress Reportsand Final Report, GEC Turbine Generators Ltd., Rugby,1989.
[7] Webster, G.A., Djavanroodi, F., Elevated TemperatureCrack Growth in Steam Turbine Materials, COST 505-UK18,Annual Progress Reports and Final Report, ImperialCollege, London, January, 1989.
[8] Rintamaa, R., Salonen, J., Auerkari, P., Residual Lifeand Strength of Steam Pipings and Turbines, VTT, Espoo,Annual Progress Reports and Final Report, 1989.
[9] Bressers, J., JRC, Petten, priv. comm.
[10] Curbishley, J., UKEA, Risley, priv. comm.
[II] Fesneau-Falbriard, P., Héritier, J, UNIREC, Firminy,priv. comm.
[12] Guedou, J.-Y, SNECMA, Evry, priv. comm.
[13] Gooch, D.J., CEGB/CERL, Leatherhead, priv. comm.
[14] Hay, E., NEI, Newcastle upon Tyne, priv. comm.
[15] Hippsley, C.A., UKEA, Harwell, priv. comm.
[16] Huthmann, H., Interatom, Berg.-Gladbach, priv. comm.
92

8/21/2019 Caso Rotura
http://slidepdf.com/reader/full/caso-rotura 105/200
[17] Krasovsky, A., Baumstein, M., Institute for Problems ofStrength, Kiev, priv. comm.
[18] Maile, K., MPA , Stuttgart, priv. comm.
[19] Mandorini, V., IR B, Milano, priv. comm.
[20] Nazmy, M., AB B, Baden, priv. comm.
[21] Pique s, R., ENSMP, Evry, priv. comm.
[22] Rant ala, J., Imatran Voima, Vantaa, priv. comm.
[23] Remke, M., RWTÜV, Essen, priv. comm.
[24] Rõdig, M., IRW-KFA, Jülich, priv. comm.
[25] Saxena, A., Ha n, J., Georgia Tech., Atlanta,priv. comm.
[26] Tscheuschner, R., Granacher, J., IfW, Darmstadt,priv. comm.
[27] American Society for Testing and M ateri als, ASTMCommittee E 24.04: Cooperating Program on Creep CrackGrowth, Chairman: A. Saxena.
[28 ] Japane se Society for the Promotion of Science (JSPS),Committee 129 and National Research Institute for Metals(NRIM), Chairman: A.T. Yokobori.
[29] VAMAS : Creep Crack Growth - A State of the Art Repor t,Issue 1, February 19 89, Ed. T.B. Gibb ons,NPL, Teddington.ton.
[30] Tscheuschner, R., IfW, TH Darmstadt, priv. comm.
[31] Kempf, B., Bothe, K., Gerold, V., Study of Fatigue andCreep-Fatigue Interaction in a High-Temperature Alloy, COST501-D11, Final Report , Stuttgart, 1987.
[32] Drossier, E., Danzer, R., Aigner, H., Mitter, W.,Lebensdauer von Alloy 800H unter kriechnahen Bedingungen,COST 5 01-Al, Endbericht, Leoben, 1987.
[33] ASTM-E 399-78 , Standard Method of Test for Plane StrainFracture Toughness of Metallic Materials, Annual Book ofASTM Standards, Section 3, Vol. 03.01.
[34] ASTM-E 8 13-8 1, Standard Test for Jic, A Measure ofFracture Toughness, Annual Book of ASTM Standards,Section 3, Vol . 03.01.
- 93

8/21/2019 Caso Rotura
http://slidepdf.com/reader/full/caso-rotura 106/200
[35] Saxena A., Han, J., Evaluation of Crack Tip P arametersfor Characterising Crack Growth Behaviour in CreepingMaterials, ASTM Task Group Report, Joint Task Group:E24.08.07/E24.04.08, 1987.
[36] Webster, G.A., Crack Growth at High Temperatures, inEngineering Approaches to High Temperature Design, Eds.B. Hilshire and D.R.J. Owen, Pineridge Press, 1983.
[37] Hollstein, T., Djavanroodl, F., Webster, G.A.,Holdsworth, S.R., High Temperature Crack Growth in Alloy800 H and 1% CrMoV Steel - The Results of an EGF RoundRobin; in: Failure Analysis - Theory and Practice, ECF7,Ed. E. Czoboly, EMAS (1988) Vol. II, 656-668.668.
[38] Hollstein, T. and Kienzier, R., Fracture MechanicsCharacterization of Crack Growth Under Creep and FatigueConditions, IWM Report W 2/87, Freiburg, February 1987.
[39] Kienzier, R. and Hollstein, T., Experimental andNumerical Investigations of Creep Crack Growth, Proc.3rd Intern. Conf. Creep and Fracture of EngineeringMaterials and Structures, Swansea, The Institute ofMetals, 1987, 563-576.
[40] Hollstein, T. and Kienzier, R., "Numerical Simulation ofCreep Crack Growth Experiments", IWM Report Z13/87,Freiburg, December 1987.
[41] Koterazawa, R. and Mori, T., Applicability of FractureMechanics Parameters to Crack Propagation under Creep
Conditions", Trans. ASME, J. Eng. Mat. Tech. 99, 1977,298-305.
[42] Kumar, V., German, M.D . and Shih, C F . , An EngineeringApproach for Elastic-Plastic Fracture MechanicsAnalysis, Topical Report No. EPRI NP-1931, ResearchP roject 1237-1, General Electric Co., Schenectady, July1981.
[43] Landes, J.D., Begley, J.A., A Fracture MechanicsApproach to Creep Crack Growth, ASTM STP 590, AmericanSociety of Testing and Materials (1976) 128-148.
[44] Bathe, K,.-J., ADINA, A Finite-Element Program forAutomatic Dynamic Incremental Nonlinear Analysis. ReportAE 84-1, Massachusetts Institute of Technolgy, Cambridge,Mass., USA (1984).
[45] P arks, D.M., The Virtual Crack Extension Method forNonlinear Material Behavior. Comp. Methods Appi. Mech.Eng. 12 (1977) 353-364.
94
8/21/2019 Caso Rotura
http://slidepdf.com/reader/full/caso-rotura 107/200
[46] Shih, C F . , DeLorenzi, H.G., Andrews, W.R., ElasticCompliance and Stress Intensity Factors for Side-GroovedCompact Specimens. Int. Journ. of Fracture 13 (1977)544-548.
[47] Siegele D., Ockewi tz, A., Hollstein T., Berechnung des
ij-Faktors für eine 3-Punkt-Biegeprobe, IWM-BerichtV 25/87, Freiburg, July 1987.
[48] Nikbin, K.M., Smith, D.J. and Webster, G.A., AnEngineering Approach to the Prediction of Creep CrackGrowth, J. Eng. Mat. and Tech., ASME, 108, 1986,186-161.
[49] Tscheuschner, R., Ma ile, K., Stichprobenartige Untersuchung des Kriechrißverhaltens von Proben mit angeschwungener und von Proben mit erodierter Rißstartfront,26. Oktober 1989
[50] S. Kubo, K. Ohji, and K. Ogura, An Analysis of CreepCrack Propagation on the Basis of the Plastic SingularStress Field, Engineering Fracture Mechanics 11, (1979)315-329.
[51] H. R ied el, The Extension of a Macroscopic Crack atElevated Temperature by the Growth and Coalescence ofMicrovoids, in Creep in Structures, (A.R.S. Ponter andD.R. Hayhurst, eds.) Springer-Verlag, Berlin Heidelberg(1981) 504-519.
[52] J.L. Bassani, Creep Crack Extension by Grain BoundaryCavitation, in Creep and Fracture of EngineeringMaterials and Structures (B. Wilshire and D.R.J. Owen,eds.), Pineridge Press, Swansea (1981) 329-344.
[53] Saxen a, A., Creep Crack Growth under Non-Steady-StateConditions, Fracture Mechanics, Vol. 1 7, ASTM STP 905 ,1986, 185-20 1.
[54] Rödi g, M., Kienzier, R., Nickel, H., Schubert, F.,Ermüdungs- und Kriechrißwachstum in Rohren einesRöhrenspaltofens bei Temperaturen oberhalb 700"C,13. MPA-Seminar, 8 .-9.10.1987.
95
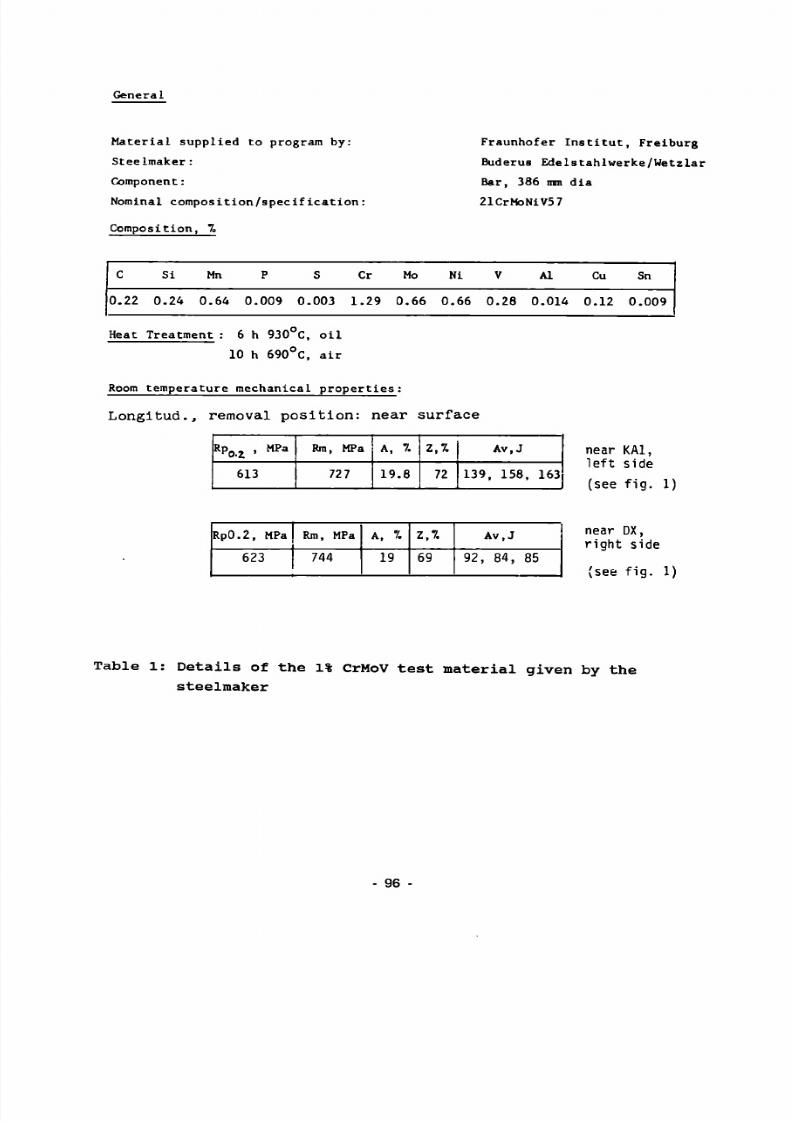
8/21/2019 Caso Rotura
http://slidepdf.com/reader/full/caso-rotura 108/200
General
Material supplied to program by:
Steelmaker :
Component :
Nominal composition/specification :
Composition, 7.
Fraunhofer Institut, Freiburg
Buderus Edelstahlwerke/Wetzlar
Bar, 386 mm dia
21CrMoNiV57
C
0 . 2 2
S i
0 . 2 4
Mn
0 . 6 4
P
0.009
S
0.003
Cr
1 . 2 9
Mo
0 . 6 6
Ni
0 . 6 6
V
0 . 2 8
Al
0 . 0 1 4
Cu
0 . 1 2
Sn
0.009
Heat Treatment : 6 h 930 C, oil
10 h 690°C, air
Room temperature mechanical properties:
Lo ng i tud . , removal p o s i t io n: near sur face
R p o z , MPa
613
Rm, MPa
727
A, 7.
1 9 . 8
Z , l
72
Av,J
1 3 9 , 158, 163
R p 0 . 2 , MPa
623
Rm, MPa
744
A, 7.
19
Z.7.
6 9
A v , J
9 2 , 84, 85
near KA1,
left side
see f i g . 1)
near DX,right side
(see fig. 1)
Table 1: D etails of the 1% CrMoV test materia l give n by the
steelmaker
96 -

8/21/2019 Caso Rotura
http://slidepdf.com/reader/full/caso-rotura 109/200
Spec imen P o s i t io n R „ R Z Ac A, , n
po .2 m 5 L=60[MP a] [MP a] [%] [%] [%]
1-
< U
a.El1—EO
oOí
0oLT)L D
II
1—
AB 7
AA8A
AA63
AA65
CG61
CG63
CG65
AB8
AA8B
AA62
AA64
CG60
CG62CG64
center
0.23 R
R/2
surface
center
R/2
surface
center
0.23 R
R/2
surface
center
R/2surface
483
536
594
608
561
600
615
316
355
372
388
380
375397
635
676
705
712
683
714
721
345
389
400
410
398
400416
70
72
68
71
72
72
86
89
89
88
8989
21.0
22.0
20.5
/21.5
/
27.5
24.5
23.5
/
25.522.0
19.0
19.0
18.0
19.0
19.0
16.5
22.5
17.0
16.5
20.5
20.520.5
Table 2 : Re su l t s o f th e te n s i l e t e s t s on 1% CrMoV s t e e l (Rra d i us o f b ar ) , from [3 ]
- 97
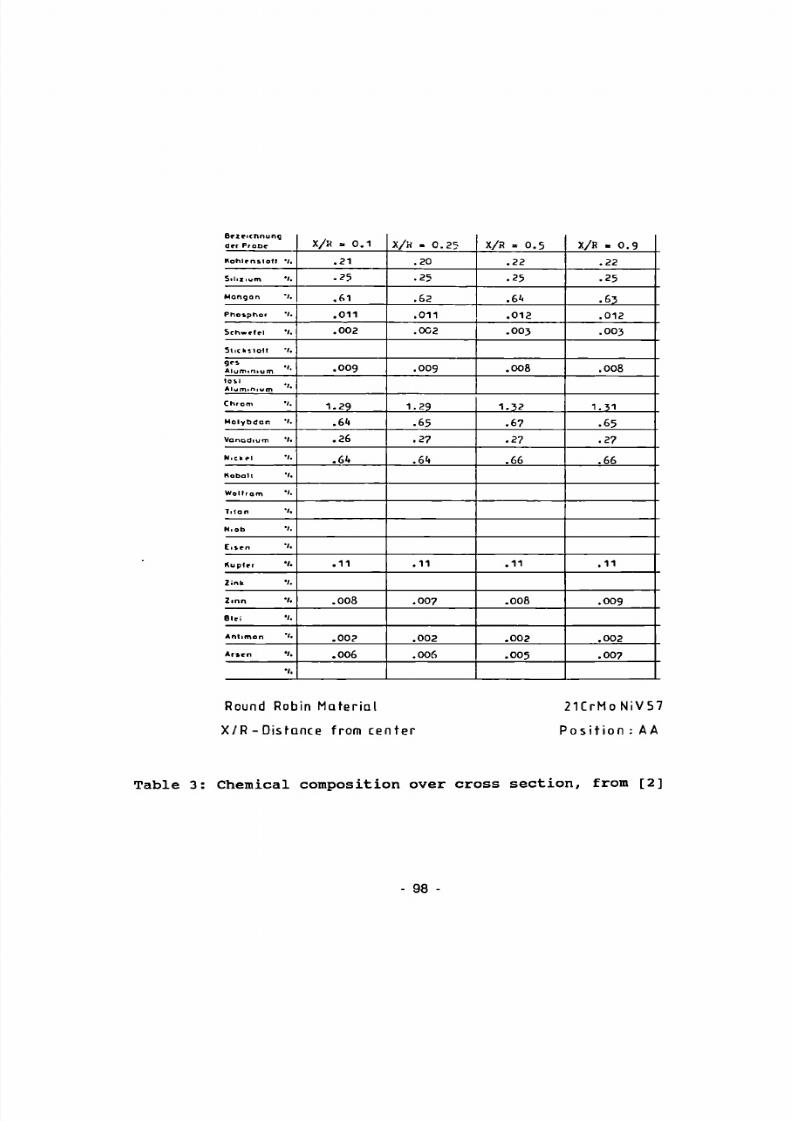
8/21/2019 Caso Rotura
http://slidepdf.com/reader/full/caso-rotura 110/200
Bezeichnung
der Probe
Kohlen toll *;.
Silizium ' I .
Mangan *' .
Phosphat * •
Schwein •/.
Stichïlolt 'f .
Aluminium ' losl Aluminium
Chrom '' .
Molybdän *'•
Vanadium 'f.
Nichel *'•
Kobalt V.
Wollram *'•
Tilan *'•
Niob *' .
Eisen ■'•
Kupier '•
Zink V.
Zinn *' .
Blei •'•
Antimon '■
Arsen */ .
/.
X /K = 0 . 1
. 2 1
. 2 5
. 6 1
. 0 1 1
. 0 0 2
. 0 0 9
1 . 2 9
. 6 H
. 2 6
.61»
. 1 1
. 0 0 8
. 0 0 ?
. 0 0 6
X /H - 0 . 2 5
. 2 0
. 2 5
. 6 2
. 0 1 1
. 0 0 2
. 0 0 9
1 . 2 9
.6 5
. 2 7
. 6 s
. 1 1
. 0 0 ?
. 0 0 2
. 0 0 6
X /R . 0 . 5
. 2 2
. 2 5
. 6 M
. 0 1 2
. 0 0 3
. 0 0 8
1 . 3 2
. 6 7
. 2 7
. 6 6
. 1 1
. 0 0 8
. 0 0 2
. 0 0 5
X /R . 0 . 9
. 2 2
. 2 5
. 6 3
. 0 1 2
. 0 0 3
. 0 0 8
1 . 3 1
.65
. 2 7
.66
. 1 1
. 0 0 9
. 0 0 2
. 0 0 7
Round Robin Mate r i a l
X / R - D i s t a n c e from cen te r
21C rMoN iV57
Po s i t i o n ; A A
Table 3 : Chemical composition over cross s e c t i o n , from [ 2 ]
- 98
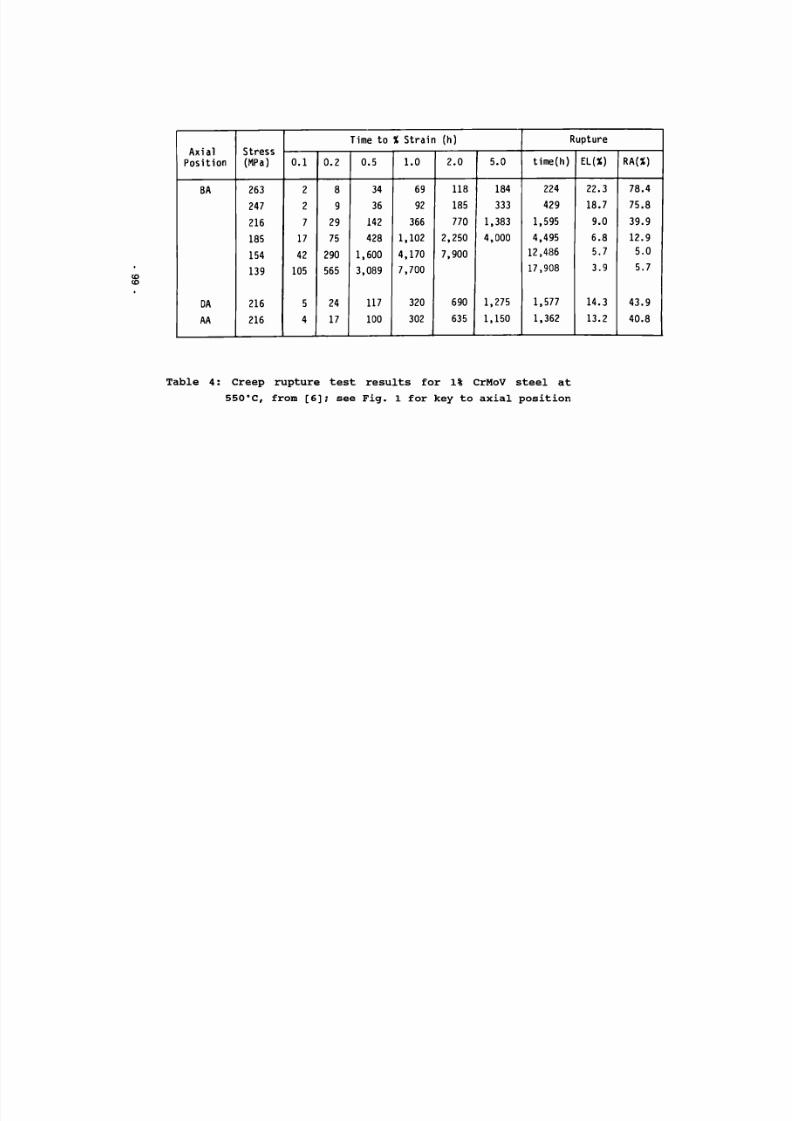
8/21/2019 Caso Rotura
http://slidepdf.com/reader/full/caso-rotura 111/200
(OCO
AxialPosition
BA
DA
AA
Stress(MPa)
263247
216
185
154
139
216
216
0.1
22
7
17
42105
5
4
0.2
89
29
75
290565
24
17
Time to X Strair
0.5
3436
142
428
1,600
3,089
117
100
1.0
6992
3661,102
4,170
7,700
320
302
(h)
2.0
118
185
770
2,250
7,900
690
635
5.0
184
333
1,383
4,000
1,275
1,150
Rupture
time(h)
224
429
1,595
4,49512,486
17,908
1,577
1,362
EL(X)
22.3
18.7
9.06.85.7
3.9
14.3
13.2
RA(X)
78.4
75.8
39.9
12.95.0
5.7
43.9
40.8
Table 4: Creep rupture test results for 1% CrMoV steel at
550"C, from [ 6] ; see Fig. 1 for key to axial pos ition
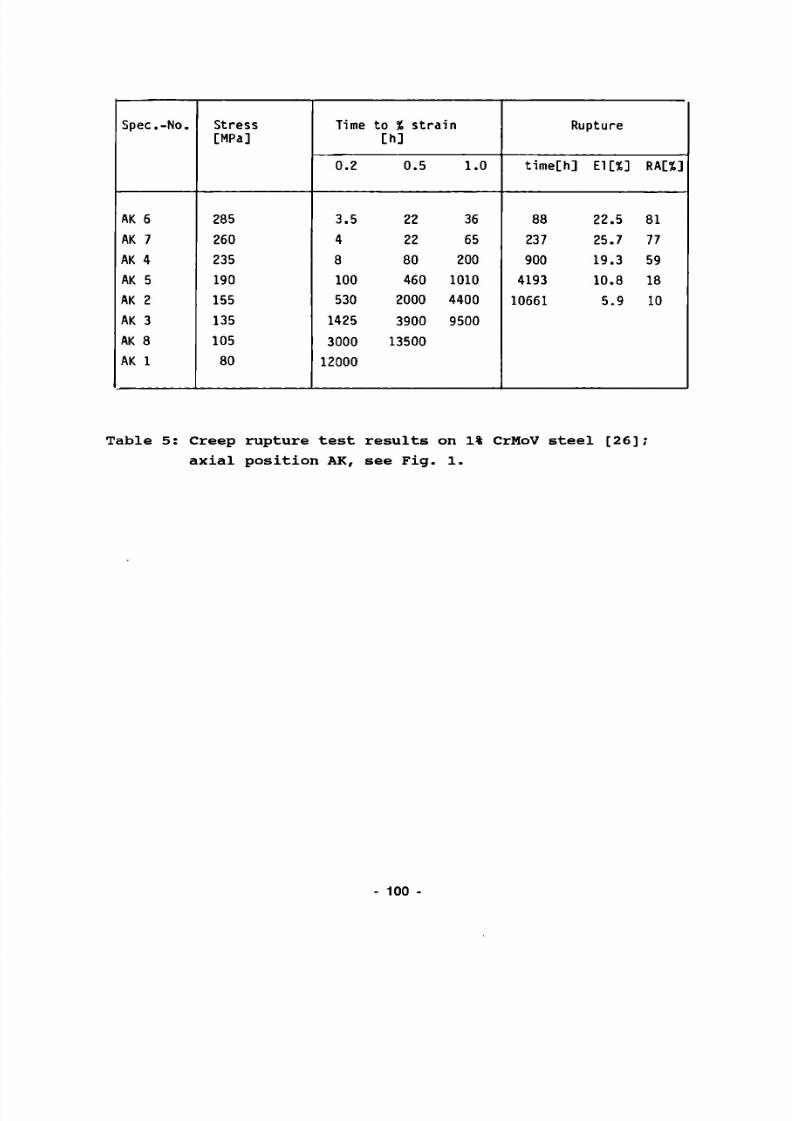
8/21/2019 Caso Rotura
http://slidepdf.com/reader/full/caso-rotura 112/200
Spec.-No.
AK 6
AK 7
AK 4
AK 5
AK 2
AK 3
AK 8AK 1
Stress[MPa]
285
260
235
190
155
135
10580
Time
0.2
3.5
4
8
100
530
1425
300012000
to % strå[h]
0.5
22
22
80
460
2000
3900
13500
in
1.0
36
65
200
1010
4400
9500
Rupture
time[h] El[%]
88 22.5
237 25.7
900 19.3
4193 10.8
10661 5.9
RA[%]
81
77
59
18
10
Table 5: Creep rupture test results on 1% CrMoV steel [26],
axial position AK, see Fig. 1.
100
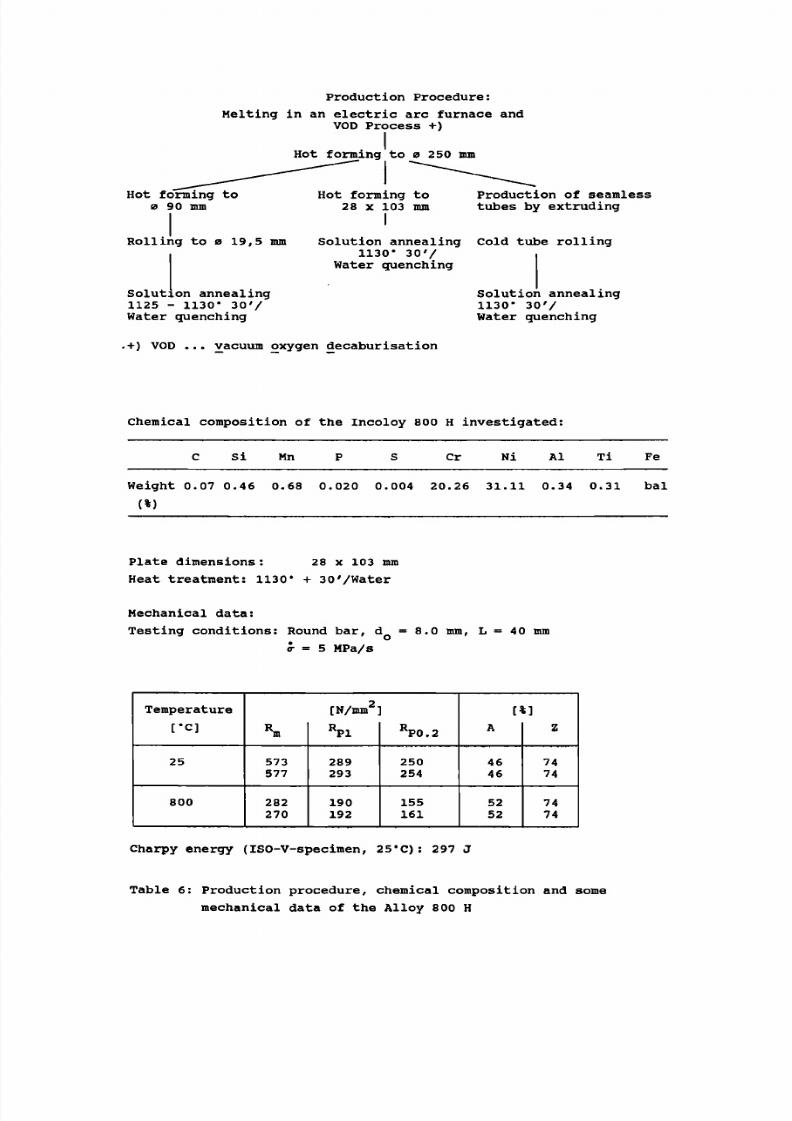
8/21/2019 Caso Rotura
http://slidepdf.com/reader/full/caso-rotura 113/200
Production Procedure:
Melting in an electric arc furnace andVOD Process +)
Hot forming to ø 250 mm
Hot forming toa 90 mm
Rolling to a 19,5 mm
Solution annealing1125 - 1130* 30'/Water quenching
Hot forming to P roduction of seamless28 x 103 mm tubes by extruding
Solution annealing Cold tube rolling1130* 30'/
Water quenching
Solution annealing1130" 30'/Water quenching
.+) VOD ... vacuum oxygen decaburisation
Chemical composition of the Incoloy 800 H investigated:
Si Mn Cr Ni Al Ti Fe
Weight 0.07 0.46 0.68 0.020 0.004 20.26 31.11 0.34 0.31 bal
(%)
Plate dimensions : 28 x 103 mm
Heat treatment: 1130' + 30'/Water
Mechanical data:
Testing conditions: Round bar, d = 8.0 mm, L = 40 mm
Temperature
[•C]
25
800
or =
%
573577
282270
5 MPa/s
[N/mm2
RP 1
289293
190192
RP0.2
250254
155161
[i
A
4646
5252
Z
7474
7474
Charpy energy (ISO-V-specimen, 25"C): 297 J
Table 6: Production procedure, chemical composition and some
mechanical data of the Alloy 800 H

8/21/2019 Caso Rotura
http://slidepdf.com/reader/full/caso-rotura 114/200
No.
1
2
3
4
S
6
7
S
9
10
11
12
13
14
15
16
17
18
19
20
21
22
23
24
25
Specimenno.
AF 2
BW 1
BW 2
BW 3
AH 3
AH 4
AM 1
AH 2
AO 3
AO 5
AQ 5
BC 1
BC 2
BB 1
AB 2A
AB 2B
AN 6
AE 1
AE 2
AP 2
AP 3
AQ 1
AQ 2
RR 5
RR 7
Specimentype
CT 25/50
CT 20/50
CT 20/50
CT 20/50
CT 25/50
CT 25/50
SENT12/20SENT12/20
CT 20/40
CT 25/50
CT 25/50
CT 25/50
CT 25/50
CT63.5/127CT12.5/40CT12.5/40
CT 25/50
CT 25/50
CT 25/50
CT50/100CT50/100CN12.5/50CN12.5/50SENB9.5/19
CT 13/26
S i d e -groove[*]
20
20
20
20
20
20
0
0
20
20
20
20
20
20
20
20
20
20
20
20
20
0
0
20
20
F[kNJ
16.5
10.2
13.5
17.0
11.1
19.1
30.5
40.0
15.1
16.2
24.1
16.5
12.1
70.0
7.6
5.1
8.5
17.8
20.0
32.1
32.0
50.0
60.7
6.0
5.6
a/W
0.498
0.547
0.569
0.548
0.539
0.540
0.214
0.188
0.450
0.505
0.516
0.532
0.535
0.535
0.513
0.513
0.538
0.536
0.538
0.539
0.540
0.426
0.547
0.449
0.556
NO.
26
27
28
29
30
31
32
33
34
35
36
37
38
39
40
41
42
43
44
45
46
47
48
49
50
Specimenno.
BF1/CC P 5
B F 2/CC P 6
AN 1
AN 3
AN 4
AA 69
AB 3
AB 4
AP 1
AH 1
AH 2
AG 1
AG 2
AG 3
AI 1
AI 2
AB 5
AB 6
AI 6
AI 7
AE 5
AC 1-6/AD 1-6
BD 3
BD 5
AK 4
Specimentype
CN 26/51
CN 26/51
CT 20/40
CT 20/40
CT 20/40
SENB 6/6
CT 2 5/50
CT 25/50
CT50/100
CT 25/50
CT 25/50
CT 25/50
CT 25/50
CT 25/50
CT 25/50
CT 25/50
CT 25/50
CT 25/50
CT 15/30
CT 15/30
CT 25/50
CT 25/50
CT 25/50
CT 25/50
CT12.5/40
S i d e -groove[*]
20
20
20
20
20
0
20
20
20
20
20
20
20
20
20
20
20
20
20
20
20
20
20
20
20
FfkN]
84.7
107.6
12.5
12.5
10.0
0.88
11.5
18.5
26.7
11.1
19.1
10.5
17.9
16.1
16.0
10.8
10.8
26.7
10.9
14.1
20.0
20.0
a/W
0.509
0.504
0.548
0.563
0.550
0.528
0.566
0.555
0.535
0.628
0.545
0.557
0.561
0.536
0.536
0.515
0.506
0.491
0.550
0.564
0.470
0.375
Table 7: Data of fracture mechanics specimens; 21 CrMoNiV 5 7
T = 550 °C; constant force
- 102
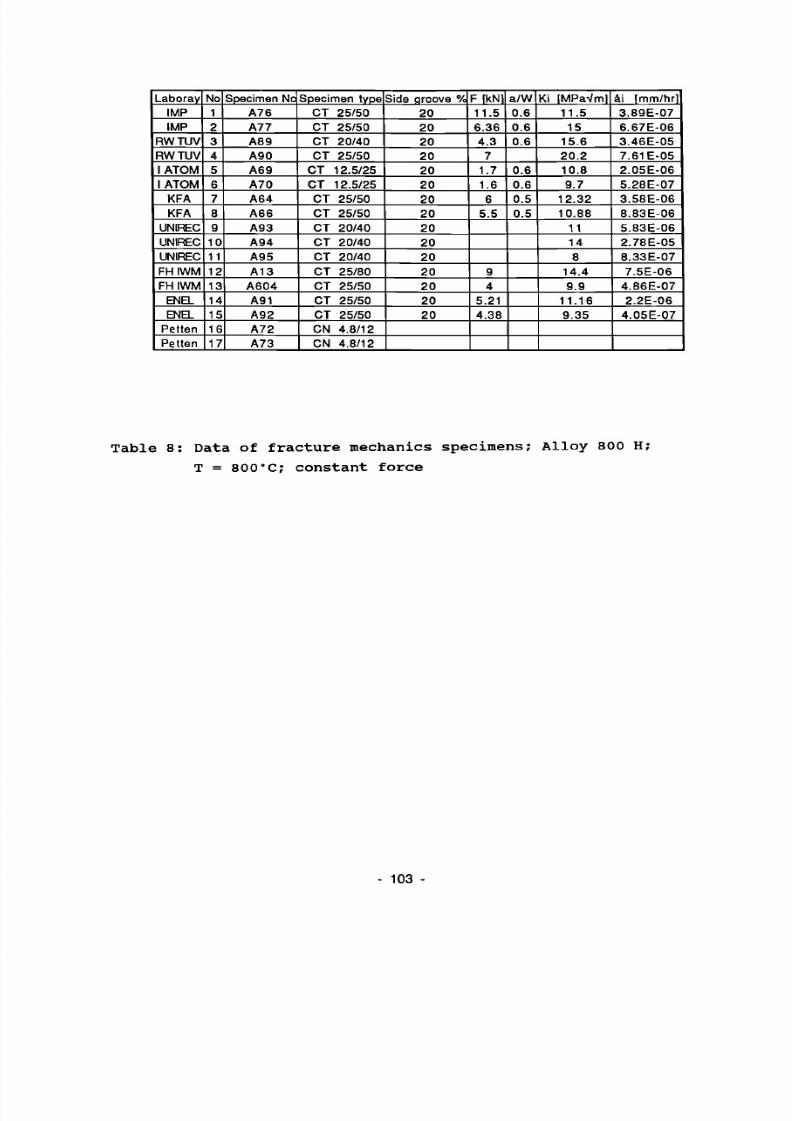
8/21/2019 Caso Rotura
http://slidepdf.com/reader/full/caso-rotura 115/200
LaborayIMPIMP
RWTUV
RWT UV
1 ATOM1 ATOM
KFA
KFAUNIREC
UNIRECUNIREC
F HIWMF HIWM
ENELENEL
P e l t e n
Petten
No1
234
56
78g
1011
1213141516
17
Spec imen NeA76
A77A89
A90
A69A70A64
A66
A93A94A95
A13A 6 0 4A91
A92A72
A73
S p e c im e n t y p eCT 25/50CT 25/50CT 20/40CT 25/50
CT 12.5 /25CT 12.5/25
CT 25/50CT 25/50
CT 20/40CT 20/40CT 20/40
CT 25/80CT 25/50CT 25/50CT 25/50
CN 4.8/12
CN 4.8/12
Side qroove %
202 02 02 0
2 02 020
2020
2 02 0
2 0
2 02 02 0
F rkNl11.56.364.3
7
1.71.6
65.5
9
45.214 .38
a /W0.60.60.6
0.60.60.5
0.5
Ki [MPaVml11.5
1515 .62 0 . 2
10 .89.7
12 .3210 .88
1114
8
14.49.9
11 .169 .35
a i imm/hr l3.89E-07
6.67E-06
3.46E-05
7.61 E-05
2.05E-065.28E-07
3.58E-06
8.83E-06
5.83E-06
2.78E-05
8.33E-07
7.5E-06
4.86E-07
2.2E-06
4.05E-07
Table 8: Data of fracture mechanics specimens; Alloy 800 H;
T = 800°C; constant force
103

8/21/2019 Caso Rotura
http://slidepdf.com/reader/full/caso-rotura 116/200
EE
toA
. J _A A
- 2 * J -S A
1000
^ c h a r p y s p e c i m e n s
L A
2000
D"X
I3000 mm
^ c h a r p y s p e c i m e n s
Fig. 1: Specinen layout for the tension tests
Rptt2
IM P Q]
700-
6 0 0 -
500
400-
300
2 1 C r M o N i V 5 7
25 °C
25°C
550°C
550°C
~i 1 1 r0
I I I I I ~0.5 1
d i s t a n c e f ro m c e n t r e x /R
Fig. 2: 0.2% proof stress RPo.2 and ultimate tensilestrength Rn for different radial and axial positions(see Fig. 1, from [3])
104

8/21/2019 Caso Rotura
http://slidepdf.com/reader/full/caso-rotura 117/200
« 150
D
- 3
T=20"C
2 U r M o N i V 5 7
O O
D AA. tang / rad
O DA, t an g /rad
' 0,9 0,8 0,7 0,6 0,5 0,4 0.3 0,2 0,1
Distance fram cen ter x/R
Fig. 3: Charpy energy variation with radius , from [2]
» I S O
50
O OD
aa a
a_ o
ego
CDtb
8o
. 4G
- 1 6 0 -120 -8 0 -tO
21CrMoNiV57
D AA, x/R= 0 55, ta n g/ra d, FATT=2S°C
O DA. x/R= 0.55. ton g/rad, FATT=25°C
*0 60 120 160 Temp era ti«¡n »C
Fig. 4: Charpy energy versus temperature, R/2 - position,from [2]
105 -

8/21/2019 Caso Rotura
http://slidepdf.com/reader/full/caso-rotura 118/200
•E 150 -
100 - '
50 -•
OO o
D ü
ooDB
O DD
-160 -120 -80 -40 to 80
21CrMoN¡V57
D AA,x/R=0.rang/rod,FATT= 55 "C
O DA.x/R=0, tang / rad, FATT= 35 'C
120 160 Temperature ¡n C
Fig. 5.:Charpy energy versus temperature, centre position,from [2]
21CrMoNiV57
Av in J
20°C 80°CAA, ra n / ro dDA. " "
Fig. 6: Impact energy over cross section [2]
- 106 -

8/21/2019 Caso Rotura
http://slidepdf.com/reader/full/caso-rotura 119/200
: -. fjft.̂ tv,jv..:.- _\ i 9 8 2 3
CJS^-TTT^ i f p i - / - w p i » nn**i * -«(»> ^ «• »**»■
■^ ̂ ^¿¿¿^afc^'i, ̂ ^ '::A »J?* 9827
y OP*-« *v.
0.1 mm
k«..« 9831
Fig. 7: Microstructure of 1% CrMoV steel, longitudinal sections

8/21/2019 Caso Rotura
http://slidepdf.com/reader/full/caso-rotura 120/200
Creep stra in %7
6
5
U
3
2
1
0
216MPaf-550°C AA/ /
/ -0A,-
-
.4?^
/ // ' /' ' /
•' '' // ' ' /
''''/
.si''Cs^ 9 *?° ,3P°^¿¿¿^
,
AA BA
RA
2600 mm
DA
T I IAK
•I BCG
500 1000 1500Time - hours
Fig. 8: The effect of axial position on the creep propertiesof 1% CrMoV at 550"C, from [6]
e [%]
100O 2000 3000 4000 50Ò0t [h]
Fig. 9: Creep properties at 550'C, ( : Region BA [6], :Region AK [26]; for axial position see Fig. 1)
108

8/21/2019 Caso Rotura
http://slidepdf.com/reader/full/caso-rotura 121/200
500
200
100
20
A sec t i on A A 1
• s e c t i o n B A > H o l dsw of t h ( 1 9 8 6 ) [ G ]f s e c t i on O A J
O sec t i on A K . G r a n a ch e r . Tsch e usch n e r 1 13 88 } 1 2 6 1
10
o -& I
_ W
« 20
010 102 W3 10' Ws
Time to Rupture [h )
Fig. 10: The creep rupture properties of 1% CrMoV steel at550'C
21 CrMoNiVS7, 550°C
100 200
a [ M P Q ]
F i g . 1 1 : T he e f f e c t o f s t r e s s o n m inim um c r e e p r a t e a t550*C
- 109
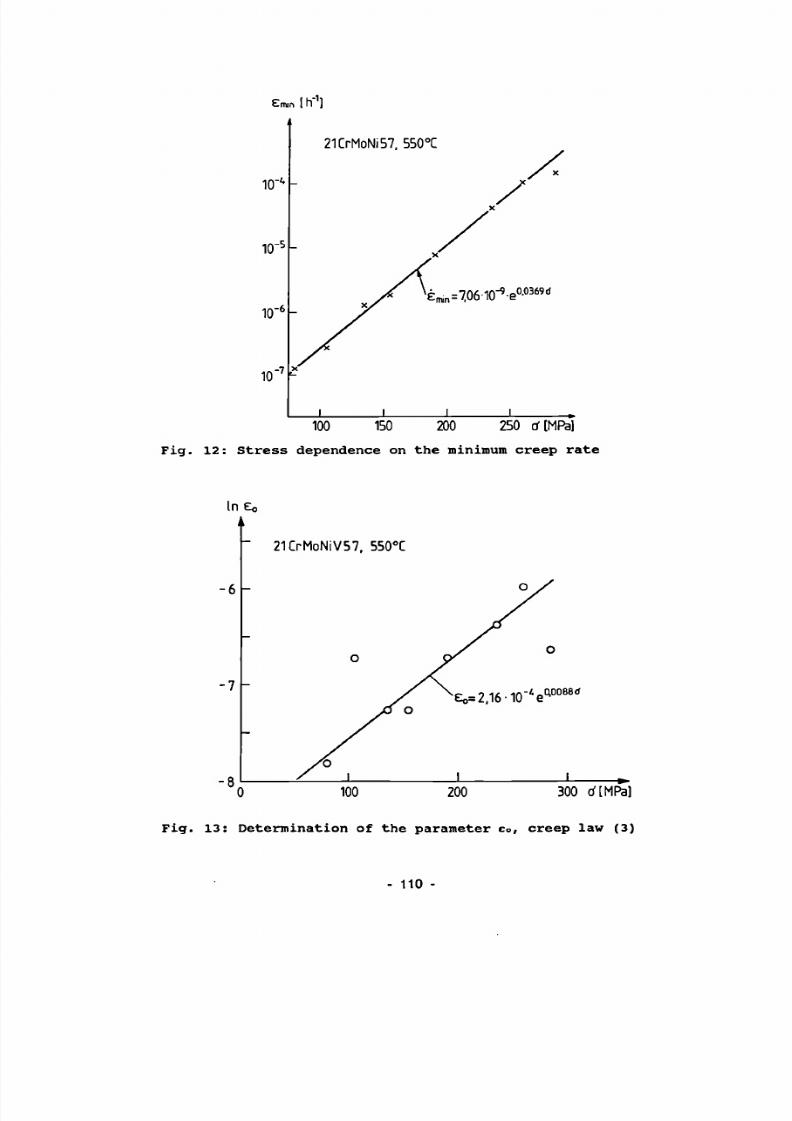
8/21/2019 Caso Rotura
http://slidepdf.com/reader/full/caso-rotura 122/200
Erran [ h"1
10
10 5
10
10"
-6 _
21CrMoN¡57. 550°C
è m n =7,06-10- 9e W 3 6 9 d
_L j L100 150 200 250 tf[M Pa]
F i g . 1 2 : S t r e s s d e p e n d e n c e on t h e m inim um c r e e p r a t e
' 0 100 200 300 dWPa]
F i g . 1 3 : D e t e r m i n a t i o n o f t h e p a r a m e t e r c o, c r e e p la w ( 3 )
110

8/21/2019 Caso Rotura
http://slidepdf.com/reader/full/caso-rotura 123/200
log R
-1,5
- 2
21 CrMoNiV57, 550 °C
R=0,00308-cr0-5183
80 100 150 200 250 300 d [MPa]
2,1T
1,9 2,1 2,3 2,5 log d
Fig. 14: Determination of the parameter R creep law (3)
YfXVW/ <J
Fig. 15: Microstructure of Alloy 800 H
- 111

8/21/2019 Caso Rotura
http://slidepdf.com/reader/full/caso-rotura 124/200
l ø - 3
10
10
10 -
10
10
•
:
:
i a^d^
s ^Q
L^
V ***
£» in _
^
xx S
- 1 5 . 2 4 + 6 ,4 Log v [h ~ , i
10 □ [ M p a ]
Fig. 16a: Ţhe stress dependence of êmin (full symbols) and of e at 1% plastic strain (open symbols); round bar results (19.5 mm ø ) , see Table 6, from [31]
[ M p a ]
Fig. 16b: Relationship between the life time tt and the applied stress o- from [31]
112

8/21/2019 Caso Rotura
http://slidepdf.com/reader/full/caso-rotura 125/200
55
A
A
1 4 -
27
A
B
14
i
A
C
.27
A
D
.27 ■ ,
A
E
27.
A
F
2i
A
G
.27.
A
H
2 7i
A
I
2:
A
K
,27
A
L
,27
A
M
27,
A
N
27
-
A
0
.5 3
A
P
, 53 22 5 5
A t
Q
\ A
? S
■800
m m
Schn i t t A-A
io i
mm m m
27 A I B 27 A T E
Fig. 17: Typical layout for 1% CrMoV specimens; CT 25/50 specimens, ABl, AB3 - AB6 and CT 12.4/40 specimens AB2A and AB2B and CT 25/50 specimens AE1 - AE6.
113

8/21/2019 Caso Rotura
http://slidepdf.com/reader/full/caso-rotura 126/200
108
500
471 ţ 1
A 61
o |o
A6 2
o|o
475 [ 1 T 1
A6 3
o |o
A64
o |o
« • [ — 1 — 1
AGS A66
o |o o |o
A67
o |o
A70
o|o A69
o|o AGS o | o
O' o o jo o jo o o
O O
o |o o |o o j o
o jo
o jo
o jo
o|o
AB7
o|o A8G
o lo
A89
o|o ABS
o|o
A 90
o|o A91
o|o A92
o|o A93
o|o A9 Í
o |o A95
o |o
F i g . 1 8 : A l l o y 800 H c u t - u p p l a n
2.0
15
1.0 -
0.5
A
A
-ffrlV-f). Ref. (35)
^ ( 2 + 0 . 5 2 b / W ) , Ref.(3M
FE-Results:
Reference
plane stress
plane strain Specimen
(Í2)
V
CN
A
A
CT
(38-41) O
X
CN
□ + CT
2n -1
n
Fig. 19: Values of uc, a comparison of different approaches; CT: a/W » 0.54, CN: a/W » 0.43, 7 and ß are functions of a/W, from [37]
- 114 -

8/21/2019 Caso Rotura
http://slidepdf.com/reader/full/caso-rotura 127/200
^ J
21CrMoNiV57, 550 °C
CN 12.5/50, AQ1
-Rt
E c r=e 0 {1 -e -R ,
} +
emin-t, Eq.(3)é m i n = 1 . 3 -10 " 2 O a 6 5 [h - , ] l d i n MPa
plane stress
-i 1 1 1 1 1 1 1 1 1 1 1 1 1 1 1 1 1 1 r
0 .00 1 .00 2 .00 3 .00 4 .00 5 .00 6 .00 7 . 00 8 .0 0 9 .00 10 .00 11 .00
i . sec CE+06)Fig. 20: Experimental and numerical values of C* for CN
12.5/50 specimen AQ1, from [3]
Fig. 21: Experimental and numerical evaluation of C* for CT12.5/40 specimen AB2B, with and without crackgrowth, creep law (1), from [3]
115
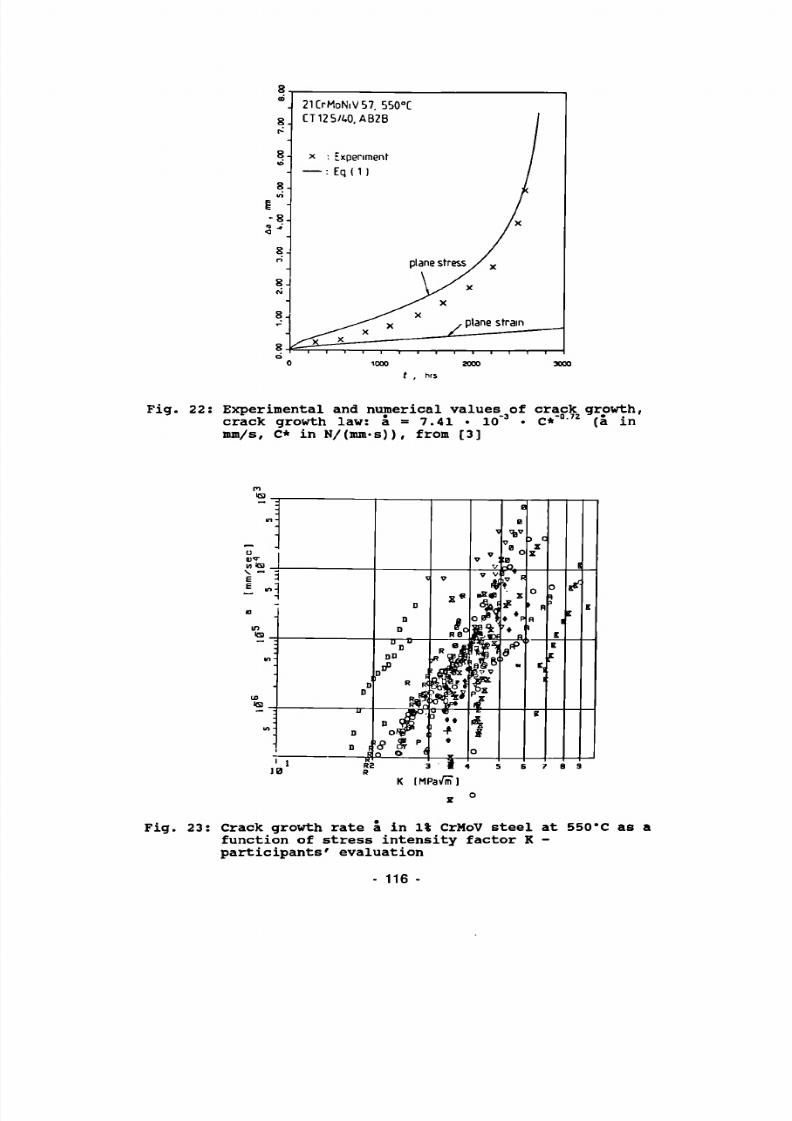
8/21/2019 Caso Rotura
http://slidepdf.com/reader/full/caso-rotura 128/200
Fig. 22: Experimental and numerical values of crack growth, crack growth law: â = 7.41 • IO-3 • C* °'72 (a in mm/s, C* in N/(urn-s)), from [3]
• . in -
U
T « S
s - : E
m ■G)
m ■
10 KS
in -
: D 0
0
*
D
D
U D D
DO
l/ir
D o #
- i? i \ 1 :
V
X *
ín RB
« å
Wf i f l
ko* J . . 1 +
I 4
^
V
* •u e dk *
»fei ¡s fB
£ 4
B
B V B
'B
T u k„ H
S
#
' ♦
M
o
5 G
5 0 Z
x
o
» B
H 1
' l 1
E
?
O 1
1
I K
F
1
^
[ K
1 1 9
K IMPaÆ]
Fig. 23: Crack growth rate å in 1% CrMoV steel at 550*C as a function of stress intensity factor K -participants' evaluation
116
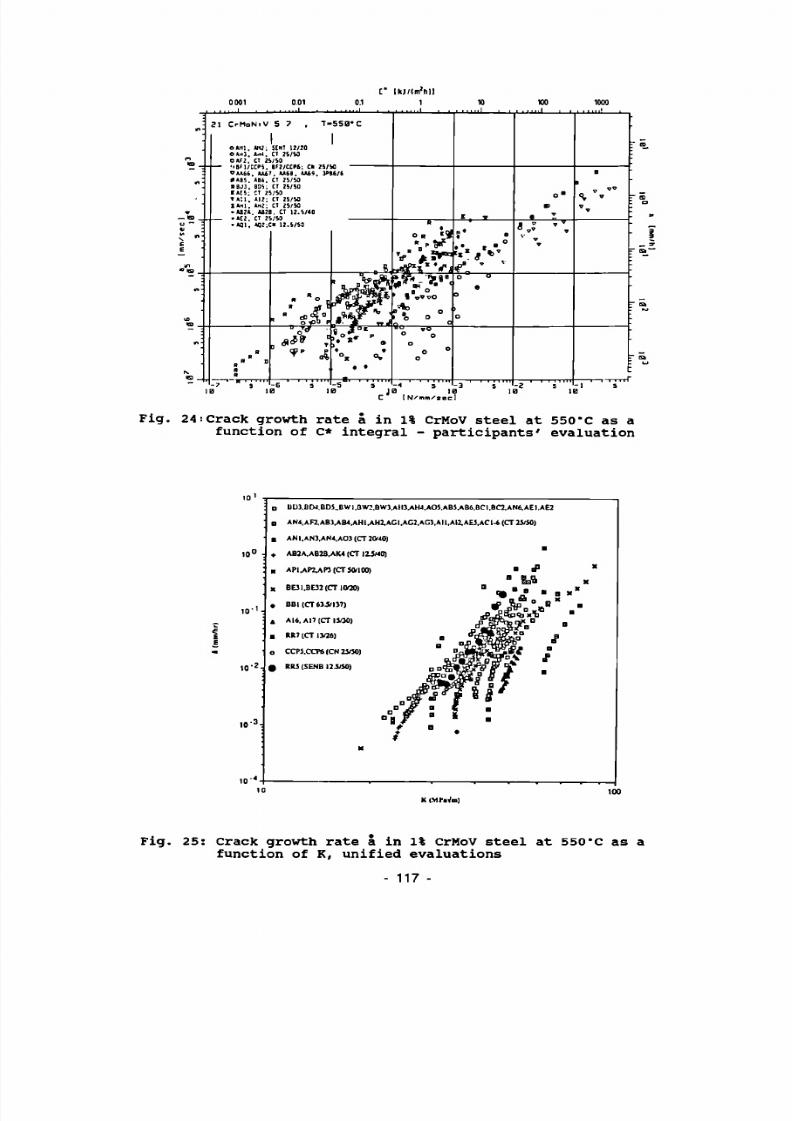
8/21/2019 Caso Rotura
http://slidepdf.com/reader/full/caso-rotura 129/200
C IkJ/fmelili
5 -A ¡ J 0
C [ N / i n m / scc l
Fig. 24 Crack growth rate å in 1% CrMoV steel at 550'C as a function of C* integral - participants' evaluation
D UÜ3.B[HBD3.,BWI.BW2IBW3.AII3.AH4.A03.AB5.AB6.BCI,BC2.AN6.AEI.AE2
a AN41AF2,AB3.AB4.AHl.AH2.AGI.AG2,AG3,All,Al2.AE5.ACI-6 (CT 25/50)
■ ANI,AN3.AN4,AO3(CT20/40)
* AB2A.AB2B.AK4 (CT I2JM0)
■ APl.AP2j\PJ(CTSttlOO)
X BE3I.BE32(CTIO20)
. BBI1CT63J/I37)
A A16, AP (CT 13/30)
■ RR7 (CT 1 3/2È)
a CCP3.CCPÍICN257S»
g R U (SENB I2J/50)
K IMPaVm)
Fig. 25: Crack growth rate à in 1% CrMoV steel at 550'C as a function of K, unified evaluations
117 -
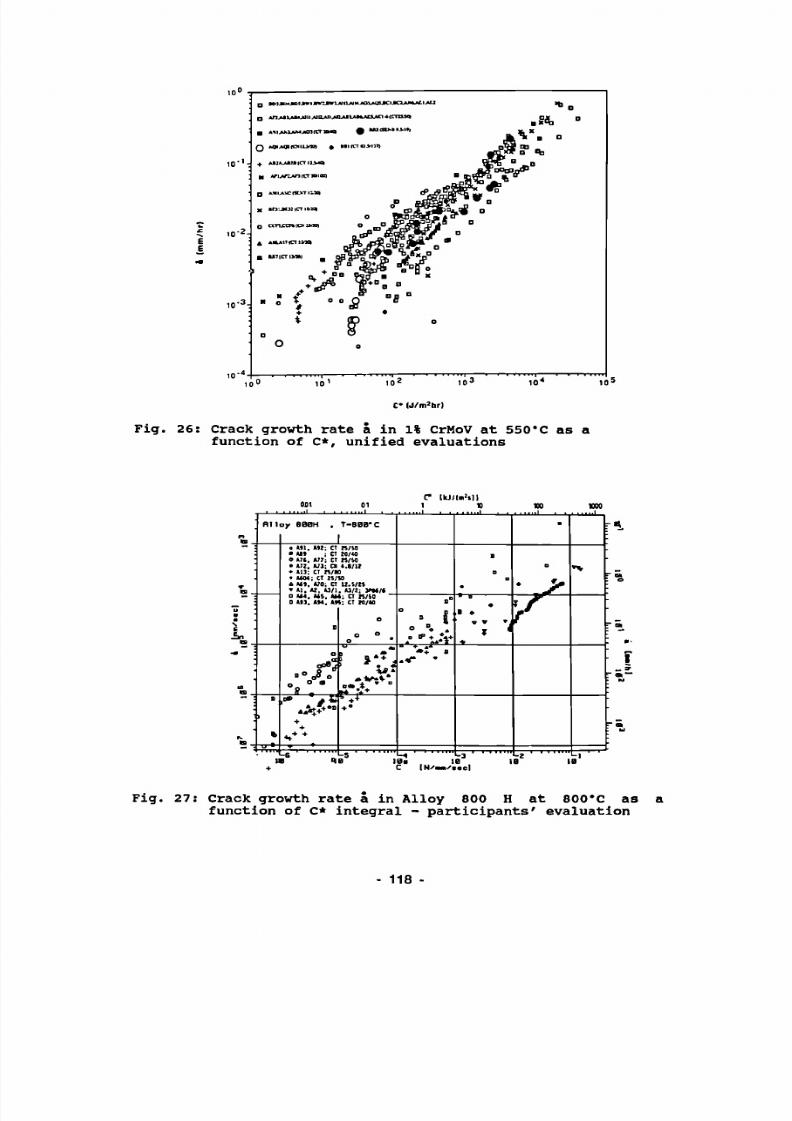
8/21/2019 Caso Rotura
http://slidepdf.com/reader/full/caso-rotura 130/200
Q *qoMH COILHDI * ■■tlCTOi'1»)
+ A * J A » U | C T IU - ^
C* (J/m 2hr )
Fig. 26: Crack growth rate â in 1 CrMoV at 550'C as a function of C*, unified evaluations
1 10 1000
RI to y 6BBH , T-B00*C
a Ml ■ Ul O
A M 9, » M . □ U4 , 0 U ) ,
, U l ; CT H /W ; CT M/40
, ui-, cr H/sa , Ul ; CD 4 . 8 ƒ I I; CT » / S Ol; CT IS/SO, «0 ; CT II. S/ISAI. U/ l . U/2; VM/*, M S , M t ; CT H/SO, A M . U S ; CT n / 4 0
° M
.fo a
»•«H '
î r ^^ «
Fig. 27: Crack growth rate å in Alloy 800 H at 800*C as afunction of C* integral - participants' evaluation
118

8/21/2019 Caso Rotura
http://slidepdf.com/reader/full/caso-rotura 131/200
10 '
IO '
I O 4 '
■ A T M 7 7 . A » 0 J W I . A W > 6 4 , A 6 6 . A « M Í C T Í Í ' » )
♦ A».A»3.AW.A«(CT2(Wtl)
M AW.A70 (CT UJ /2 5 )
M A IUCTH /W )
10° 101
K ( M P A VW )
1 0 *
Fig. 28: Crack growth rate à in Alloy 800 H at 800 C as a function of stress intensity factor K, participants' analysis.
Æ
È E
iu ■
I O ' :
i o 0 -
l o -
i o : -
l O ' -
i o J -
o
♦
X
o
H
A76. A77,A64.A66.A90.A<)1,A9
Afc9.A93.A94.A95 (C T 20/40)
Af.<>.A70(CT 12.5/25)
A 7 2 .A 7 3 (C I * H I / | 2 )
A13(CT2S/>0)
'A?
A' /i
DO t
, A 6 W | C T : 5 - S 0 )
tp u
o
D
♦ - /
oo -o o o / ♦
få /9
i ¥/t
á = 0003¿ - C * 0 - 7 3 3
. r mu l i a [ — J
c* M M L ImmsJ
■i t— i IO 2 IO 3 IO4
C* (J/m7hr)
Fig. 29: Dependence of creep crack growth rate on experimental C* for Alloy 800 H at 800'C (unified evaluation)
- 119

8/21/2019 Caso Rotura
http://slidepdf.com/reader/full/caso-rotura 132/200
SL
å = 0.0034 C
0.733
Incoloy 800H , T « 800 t ;
Specimen (LT)
PTC
•
125/50
CN
X
12.5 /50
CT
+
2 5 / 5 0
CT
• ■
25/BO
CT
o
D
12 5 « 0
Looding
F = const V = const ï = cons t
B /W
207* side grooves
2 3 4 3
C* , N/mm / s e c
Fig. 30: Creep crack growth rate å as a function of C* for Incoloy 800 H (Z= constant rate of cross head displacement). From [38].
o CT63J/I37
a CT5CH00
+ CT25I50
a CT2IV40
■ cr IISMO
m CT 13/36
4 CT 13/30
D (Titrai
v. /y
'S êi:
>mP
*? — E q ( 1 1 )
C« ( J /m ' h r )
Fig. 31: Effect of specimen size on crack growth rate in 1% CrMoV steel at 550 C for compact tension (CT) specimens
120

8/21/2019 Caso Rotura
http://slidepdf.com/reader/full/caso-rotura 133/200
v Imml
0.6 -
ûa
[mm]
0.4
0 2
21CrMoNiV57, T = 55 0 C CT 50/100, 20V. SG F = 32.1 k N , ao /W = 054
- 2
Fig. 32: Crack opening displacement at the load line and final values of creep crack growth as a function of time; CT 50/100 specimens
PROBE RP3
. 262
. 2 G
. 2 5 8
. 2 5 G
J 254
« . 2 5 2
0
\ 25 u E . 2 4 8
a. 2 4 4 -
. 2 4 2
. 2 4
CT50/100-AP3. 20V. SG
- j 1 1 1 1 1 1 1 1 1 1 1 i i i i ■ » ■ ■
2 0 0 400 G 0 0 B 0 0 1000
time [h]
Fig. 33: Normalized potential difference as a function of time; specimen AP3, see Fig. 32
121

8/21/2019 Caso Rotura
http://slidepdf.com/reader/full/caso-rotura 134/200
Fig. 34: Microstructure in the crack tip area of CT 50/100specimen AP2
i — i — i — i — i — i — i — i — i — i i ' r
Fig. 35: Crack opening displacement at the load line and final
creep crack growth values as a function of time; CT25/50 specimens
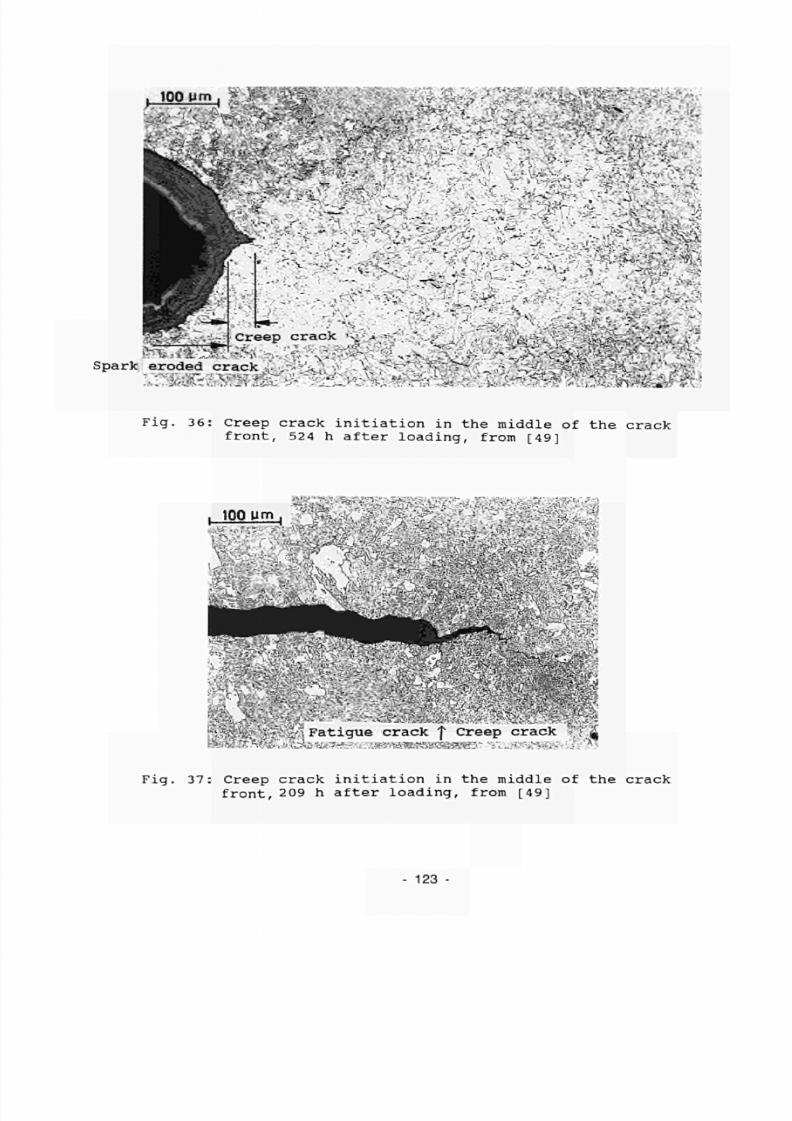
8/21/2019 Caso Rotura
http://slidepdf.com/reader/full/caso-rotura 135/200
*V- r- X
.■Í » T
Spark eroded crack l i
,A
T ^ ^ W ^
l
^ « reep crack H *ţ-f > ;£,/, ^ ^ V : ? & 3 eroded cracks ,-* ̂ _.\ \ V -w^^kjtr*'~ 3 0 5 * « ^ , X
Fig. 36: Creep crack initiation in the middle of the crack front, 524 h after loading, from [49]
^¡fesífí Fa t i g u e c r a ck Creep c r a ck T 2 - ^ í ^ V ^ U l l r l i . wr-- - ^ T aw ' S uK r t ß SB v ■?>■ < V ^
Fig. 37: Creep crack initiation in the middle of the crack front, 209 h after loading, from [49]
123 -
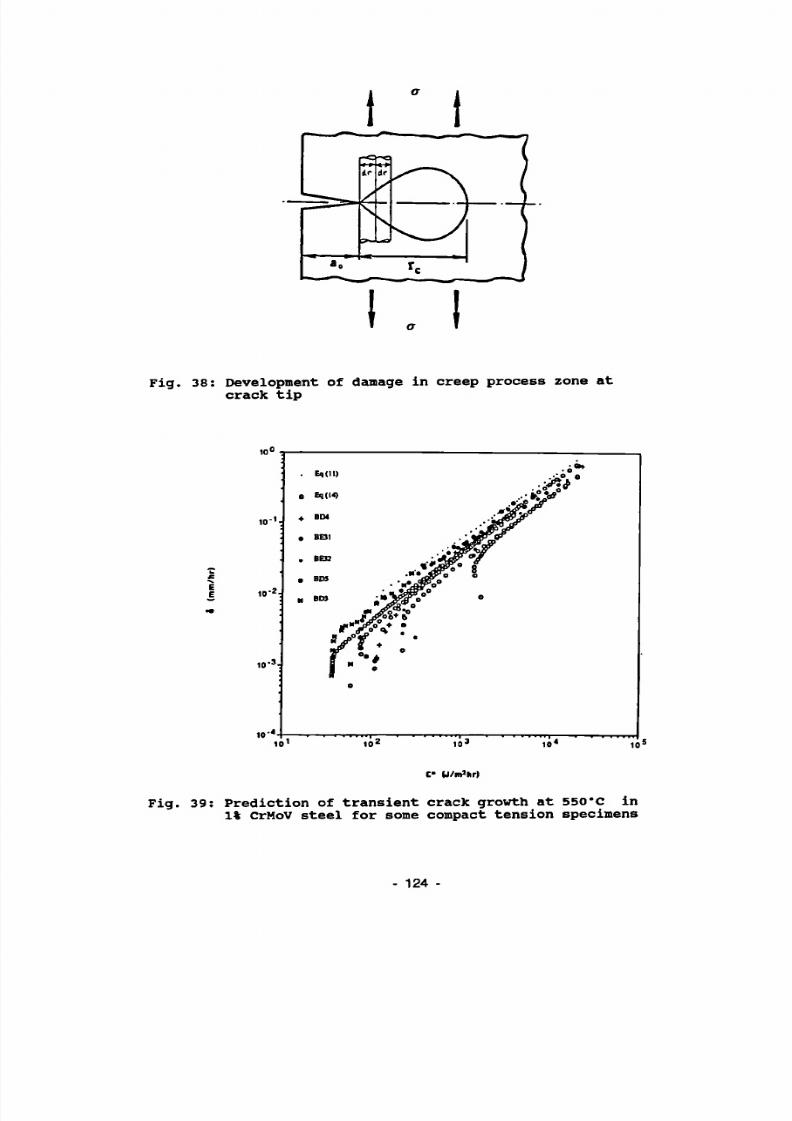
8/21/2019 Caso Rotura
http://slidepdf.com/reader/full/caso-rotura 136/200
Fig. 38: Development of damage in creep process zone atcrack tip
t' (J/m'hr)
Fig. 39: P rediction of transient crack growth at 550'C in1% CrMoV steel for some compact tension specimens
124

8/21/2019 Caso Rotura
http://slidepdf.com/reader/full/caso-rotura 137/200
o CT6Î-VH7
( CT » 1 0 0
♦ CTJS50 /
a CT 20140 , . » *
B CT 12 J/40
■ CT1VI6
aï: / ?
¿¿F-A CT 15/30
a CTiaao
♦ v * : * * * //;:vy
Eq.111)
C* ( J / m *h r l
Fig. 40: Effect of specimen size on creep crack growth rate in CT specimens with 'tails' omitted
E I O 2
E
CT
CN
S E N T
S END
A * ♦ •
* # *
?r.y
C» M/m>hr )
Fig. 41: Effect of specinen geometry on creep crack growth rate in 1% CrMoV steel at 550'C with 'tails' omitted
125

8/21/2019 Caso Rotura
http://slidepdf.com/reader/full/caso-rotura 138/200
EGF 550°C
EGF550*C
JSPS S38°C
— — JSPS S38-C
ASTM538°C
— — ASTMS38«C
C» (J /m 2 h r )
~ I""1-
•S 10"21
EGF 550*0
EGFS50"C
JSPS 594-C
JSPS 594»C
ASTM594°C
ASTM 5940C
10' 10° 10
C* (J/m2hr)
Fig. 42: Comparison between EGF data at 550*C with ASTM [27]
and JSPS [28] results at
a) 538'C and b) 594*C
126

8/21/2019 Caso Rotura
http://slidepdf.com/reader/full/caso-rotura 139/200
1.0E-
1 .0E-
06-
07-
08-
21 Cr Mo Ni V 57
T = 550 °C
x Ä
•
X
X
XX .
o s*°
•
X jS Q
jf X
x X x / \
; jy^ a N à i = 6t4-10"13-K*'
*X * Ref 1 3]
x / x/ *x/ ° X/ D
XX
X
X
• CN 26/51
x CT 25/50 ; CT 20/50 ; CT 20/40
• CN 12.5/50
n CT 12.5/40 : CT 13/26 ; CT 15/30» SENB 6/6 ; SENB 9.5/19
a CT 50/100 : CT 63.S/127
o SENT 12/20
30
K¡ [MPa*fm ]
40 60 70 80
Fig. 43: Initial crack growth rate vs. initial stressintensity factor
127 -

8/21/2019 Caso Rotura
http://slidepdf.com/reader/full/caso-rotura 140/200

8/21/2019 Caso Rotura
http://slidepdf.com/reader/full/caso-rotura 141/200
HIGH TEMPERATURE CRACK GROWTHIN STEAM TURBINE MATERIALS
Part III
High Temperature Fatigue Crack Growth
S.R. Holdsworth
GEC - Alsthom Turbine Generators Ltd, Rugby, UK
129 -

8/21/2019 Caso Rotura
http://slidepdf.com/reader/full/caso-rotura 142/200

8/21/2019 Caso Rotura
http://slidepdf.com/reader/full/caso-rotura 143/200
INTRODUCTION
High temperature fatigue crack growth (HTFCG) data may be used in the power plantindustry to assist in the specification of acceptable defect sizes, in remaininglife assessment and in failure diagnosis. It is also used as an aid to materialselection. Fracture mechanics parameters have been used to model crack
propagation at elevated temperatures for over 20 years. However, for much of thisperiod, a major difficulty has been the inherent size and geometry dependence ofthe available crack growth correlating parameters when creep processes havedominated the fracture process. In practical terms, this has meant that it hasnot always been possible to accurately assess defect tolerance in large powerplant components on the basis of results from relatively small laboratorytestpieces. The main aim of the COST 505 High Temperature Crack Growth WorkingGroup (Table 1) was therefore to pool the resources of a number of Europeanindustrial organisations and academic institutions in a joint consideration of theproblem. The following Review examines the results of the Group investigationsrelating to High Temperature Fatigue Crack Growth in Steam Turbine Materials[ 1 - 7 ] , with reference to other published findings.
The term high temperature fatigue crack growth covers a range of crackingmechanisms resulting from a wide spectrum of loading cycle types. Stress-straincycles may be linear elastic or elastic-plastic and have been applied in load orstrain control. HTFCG may be due to one or a combination of pure cyclic, primarystress creep or secondary stress creep loading, and is dependent on such factorsas material properties, temperature, strain rate, cycle type and hold time. Theservice cycles experienced by high temperature steam turbine components such asrotors, valve chests and inner casings are complex and comprise a variety ofloading transients conceivably spanning the entire range of behaviour.
In laboratory tests mounted to generate HTFCG data for the above components, it isoften convenient to adopt an idealised isothermal cycle which closely models themost damaging service loading transient at the specific location being assessed.
For example, the operational cycle experienced by a rotor is composed of acombination of rotational and thermal transients ( F i g . l ) . The particularcombination varies with position in the rotor, and may be dominated by either theprimary stress or secondary stress cycle. Hence load control cycle tests may beadopted to model the rotational stress cycle at the rotor bore, whereas straincontrol cycle tests may be selected to model the thermal stress transient at a rimposition. A similar situation exists for valve chests, inner casings and mainsteam pipework, which experience operational cycles comprising superimposedpressure and thermal transients. Thermal stress variations tend to provide themost likely driving force for cracking at critical locations in valve chests andcasings whereas pressure stress cycles are likely to be more influential in thecase of pipework. The load and strain control cycles selected by the COST 505HTFCG investigators are typical of idealised isothermal cycles adopted to model
service loading transients in such components ( F i g . 2 ) .
FATIGUE CRACK GROWTH REGIMES
Fatigue crack growth behaviour is conveniently considered in terms of threeregimes (Fig.3) [8]. These are a lowAK regime close to the fatigue crackthreshold, A , K ° . a mid AK regime in which propagation rates are modelled by a powerlaw [9] ( E q n . l ) , and a high AK regime in which K M » approaches K c
At low AK levels close to A K ° , the magnitude of da/dN is very sensitive to smallincreases in AK and dependent on the same factors which influence ̂ Ko. These are
- 131 -

8/21/2019 Caso Rotura
http://slidepdf.com/reader/full/caso-rotura 144/200
material microstructure and yield strength, temperature, environment and R ratio(ie. mean stress). Various expressions have been devised to model \Ko[eg. 10,11], although none are specific to low alloy creep resistant steels atelevated temperatures.
In the mid AK regime, crack growth rates are effectively modelled by an expressionof the form:
da/dN = C (AK)m (1)
where C and m are constants dependent on material, temperature and environment,and m is typically in the range 2 to 4. Propagation rates in this regime are lesssensitive to microstructure and mean stress effects. There have been a number ofmodifications to the Paris Law which, for example, minimise its dependency onmaterial properties and temperature [10] or extend its range of applicability intothe low and high AK regimes [12,13].
In the highAK regime, da/dN becomes increasingly sensitive to the level of AK,
and particularly to K M J U C
as critical Kc or plastic collapse is approached.Depending on the deformation and fracture characteristics of the material, crackgrowth rates can be strongly influenced by size and geometry. In thesecircumstances, AK is not the most effective correlating parameter, and alternativecyclic load functions have to be employed to minimise any dependence on size andgeometry (see below). In addition to the factors already listed, da/dN in thisregime is strongly dependent on microstructure, temperature, environment andfrequency (ie. strain rate). Tearing fatigue [14] does not fall within the scopeof this Review.
In the following text, the term low strain fatigue (LSF) is used to refer to theload/strain transients resulting in linear elastic loading cycles and crack growthin the low and mid AK regimes (Fig.3). Load/strain transients responsible forcyclic plastic loading involving some degree of general yield in tension and/orcompression are referred to as high strain fatigue (HSF) cycles.
HSF crack growth rates are due to higher AKs and may be influenced by theload/displacement control mode, particularly when there is superimposed creeploading. Since HSF cycles can involve yield in compression but not tension, thereare circumstances when the effective AK responsible for crack opening may belinear elastic. Consequently, it is not possible to rigidly fix the lower boundof the HSF crack growth rate regime in Fig.3, and caution with the terminologyused in this area is necessary.
HTFCG CORRELATION PARAMETERS
Low strain fatigue crack growth rates expressed as a function of AK areindependent of size and geometry for a wide spectrum of engineering materials attemperatures below the creep range. This means that crack growth rates determinedusing laboratory specimens may be reliably applied to large components. AK isalso an effective correlating parameter in the LSF regime at elevated temperatureswhen frequencies are relatively high (ie. f>lHz). Cyclic stress intensity factoris a function of cyclic stress, A0\ and crack size, 'a' (Eqn.2), and K solutionsare now available for a wide range of laboratory testpiece and componentgeometries [15].
AK = Y A < ra°- s (2)
132

8/21/2019 Caso Rotura
http://slidepdf.com/reader/full/caso-rotura 145/200
where Y is a compliance/geometry function.
It is sometimes convenient to consider the mechanics of fatigue crack growth interms of cyclic CTOD [ 1 6 , 1 7 ] . For example, da/dN = ¿CTOD/2 is regarded as auseful upper bound fatigue crack growth law for non-work hardening materials [17].
The crack tip opening displacement is generally taken to be [ 18]:CTOD = 0.44 K 2 (3a)
E OV
Assuming that local crack tip flow stresses are increased by hardening to 2ÖV, anestimate of maximum cyclic CTOD is given by:
¿CTOD = 0.22 ( A K T Q T ) 3 (3b)(1 - R) E CÑ-
where R = K M I N / K M A X .
In practice, fatigue crack growth is the result of cyclic crack tip opening anddoes not occur when the crack is closed [19]. Eqn.3b is a reasonableapproximation of the situation when the R ratio is positive (ie. when K M I N andK M A X are both due to tensile loading) and when there is no premature crackclosure, for example due to crack face oxidation. However, this is notnecessarily the case when the crack tip is loaded in compression for part of thecycle (ie. when R is negative). It is then more appropriate to think in terms ofcrack propagation being due to the effective A K responsible for crack opening, ie.
ACTOD = 0.22 Í A K g . ^ ) * (3c)
E ÖV
To derive A K E F F it is necessary to know the crack opening load ratio, ie.
qo = (PMAJC - P O )/( P M A X - P M I N) (4a)
where P o is the crack opening load determined experimentally from P-Vc hysteresisloops (Fig.4) [ 4 , 2 0 ] . This approach is not a simple matter in practicalsituations, but there are now a number of empirical formulations to estimate qo[ 2 1 , 2 2 ] , eg.
qo = (1 - R/2)/(l - R) (4b)
AKeff is then simply defined by Eqn.5, and the well documented K solutions for awide range of laboratory testpiece and component geometries are still applicable[ e g . 1 5 ] .
AKarr = qo AKTOT ( 5 )
As the magnitude of A K increases, the crack tip plastic zone increases to a sizewhich is no longer small relative to other significant dimensions. Fatigue crackgrowth rates expressed in terms of A K= r r a r e no longer size and geometryindependent when general yield occurs in tension, and alternative parameters arerequired to describe HSF crack growth rates.
Cyclic J integral has been shown to be independent of size and geometry in bothlow and high strain fatigue regimes [23], and there are now 3 solutions availablefor a large number of standard geometries [ 2 3 , 2 4 ] . For example, for a simple
133
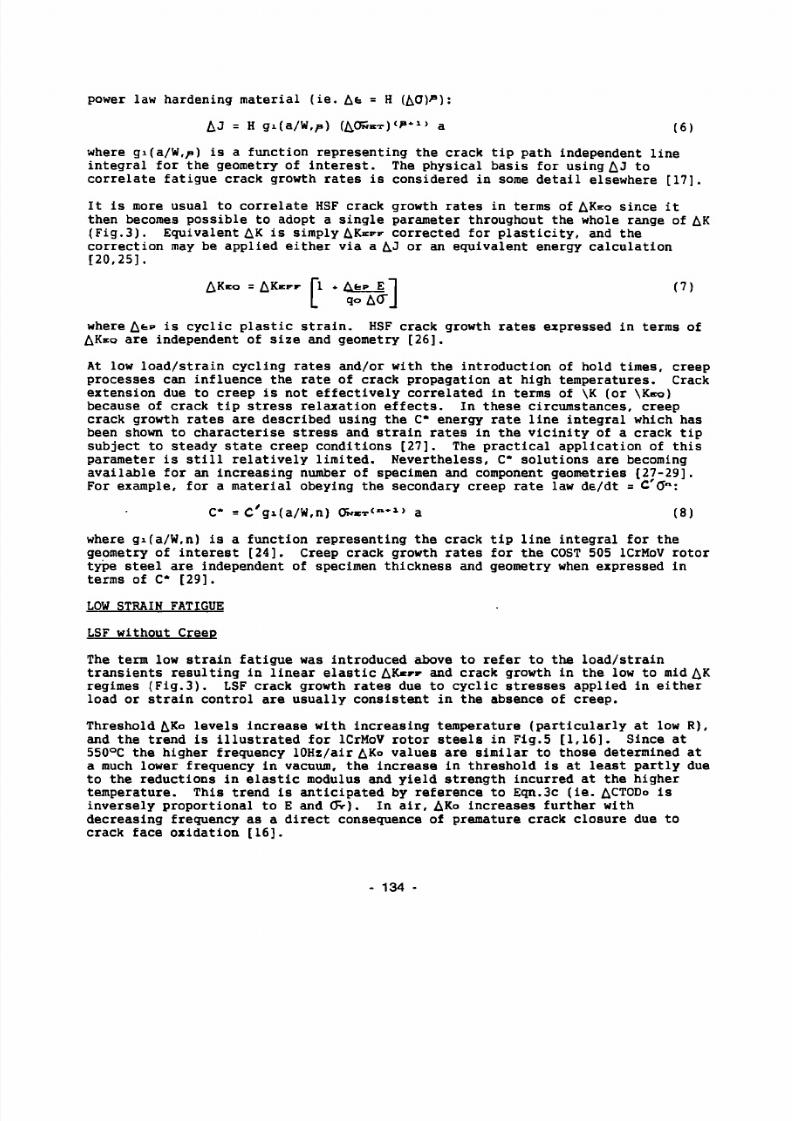
8/21/2019 Caso Rotura
http://slidepdf.com/reader/full/caso-rotura 146/200
power law hardening m ater ial ( i e . Afe = H (¿O)*1):
kJ = H gi( a/W ,p ) (AOS**-)'*1*1» a (6)
where gi(a/w,/0 is a function representing the crack tip path independent lineintegral
for the geometry
of interest.
The physical basis
for using& 3
tocorrelate fatigue crack growth rates is considered in some detail elsewhere [17],
It is more usual to correlate HSF crack growth rates in terms of AK=o since itthen becomes possible to adopt a single parameter throughout the whole range of AK( F i g . 3 ) . Equivalent AK is simply AK=pr corrected for plasticity, and thecorrection may be applied either via a ¿J or an equivalent energy calculation[ 2 0 , 2 5 ] .
AK*o = A K ^ r Tl « AfeP E 1 (7)l «• A f e p E 1
where Afep is cyclic plastic strain. HSF crack growth rates expressed in terms ofA K E O
are independent of size and geometry [26],At low load/strain cycling rates and/or with the introduction of hold times, creepprocesses can influence the rate of crack propagation at high temperatures. Crackextension due to creep is not effectively correlated in terms of \K (or \K=o)because of crack tip stress relaxation effects. In these circumstances, creepcrack growth rates are described using the C* energy rate line integral which hasbeen shown to characterise stress and strain rates in the vicinity of a crack tipsubject to steady state creep conditions [27], The practical application of thisparameter is still relatively limited. Nevertheless, C* solutions are becomingavailable for an increasing number of specimen and component geometries [ 2 7 - 2 9 ] .For example, for a material obeying the secondary creep rate law de/dt = C'o"":
C* =C'gi(a/W,n) (5»«x'"*
l
> a (8)where gi(a/W,n) is a function representing the crack tip line integral for thegeometry of interest [24] , Creep crack growth rates for the COST 505 lCrMoV rotortype steel are independent of specimen thickness and geometry when expressed interms of C* [29].
LOW STRAIN FATIGUE
LSF without Creep
The term low strain fatigue was introduced above to refer to the load/straintransients resulting in linear elastic AK*rr and crack growth in the low to mid A Kregimes ( F i g . 3 ) . LSF crack growth rates due to cyclic stresses applied in eitherload or strain control are usually consistent in the absence of creep.
Threshold A K o levels increase with increasing temperature (particularly at low R),and the trend is illustrated for lCrMoV rotor steels in Fig.5 [ 1 , 1 6 ] . Since at550°C the higher frequency 10Hz/air AKo values are similar to those determined ata much lower frequency in vacuum, the increase in threshold is at least partly dueto the reductions in elastic modulus and yield strength incurred at the highertemperature. This trend is anticipated by reference to Eqn.3c (ie. ACTODo isinversely proportional to E and Ö V ) . In air, AKo increases further withdecreasing frequency as a direct consequence of premature crack closure due tocrack face oxidation [16] .
- 134
8/21/2019 Caso Rotura
http://slidepdf.com/reader/full/caso-rotura 147/200
LSF crack growth rates increase with increasing temperature. In vacuum, crackpropagation rates are inversely proportional to elastic modulus and yield strength( i e . da/dN o«. ACTOD I * ( A K ) 2 / E O Y ) both E and OV decreasing with increasingtemperature. Modulus normalised crack propagation laws have been proposed toaccount for the effect of temperature [10], but their application should really belimited to the consideration of internal defects or to materials which do not
oxidise in the environment of interest.
With increasing temperature and decreasing frequency in air, oxidation becomesincreasingly influential in controlling fatigue crack growth rates [16,30,31].Even at relatively high frequencies, LSF crack propagation rates are generally notaccurately predicted on the basis of room temperature behaviour and a modulusnormalised growth law. Crack propagation rates are notably accelerated by oxideassisted growth at low AK levels in excess of AKo, and the effect is enhanced withdecreasing frequency ( F i g . 6 ) .
High frequency LSF crack growth rates for lCrMoV rotor steel at 530/550°C (f>lHz)are shown in Fig.7 [ 1 , 3 , 5 ] . This data was collected as part of the COST 505 HTFCGprogramme, and the chemical compositions and mechanical properties of all the
steels forming part of this collaborative activity are summarised in Table 2.
The use of high frequency high temperature LSF crack growth data for steam turbineapplications is limited since defects are generally not tolerated in componentssubject to this type of loading, eg. blading. Those parts in which certaindefects may be acceptable tend to operate at cyclic frequencies much lower than1Hz and in these circumstances, oxidation and creep become increasingly importantconsiderations. The bores of rotors and main steam pipe welaments are examples ofhigh temperature component locations for which low frequency LSF crack growth datadetermined in load control may be applicable ( F i g . l ) .
LSF-Creep
As frequencies are reduced by either lowering the cyclic load/strain rate and/orby extending hold time durations, crack face oxidation and creep strainaccumulation at the crack tip increasingly influence LSF crack propagation rates.In addition, as time dependent processes become more influential, the cyclecontrol mode also becomes important. For example, the load is sustained duringthe hold time in a load controlled cycle whereas it relaxes when the cycle iscontrolled within strain limits ( F i g . 2 ) . Consequently, lower frequency LSF crackgrowth rates are usually faster when the cycle is applied in load control. Theeffect is not great at low AK but becomes pronounced in the HSF regime (seeF i g . 2 1 ) .
Providing that the magnitude of the peak tensile stress is sufficiently low toavoid general yield in tension or creep deformation, high temperature fatigue
crack growth rates may still be described in terms of A K = » - F , using a power law ofthe type given by Eqn.l, but with C being very dependent on frequency. It is alsonoticeable that the m exponent tends towards 2 with increasing temperature. Thevalidity limit to using linear elastic fracture mechanics is provided by acritical &CTOD, above which creep deformation causes cracking [30].
At very low AK, crack face oxidation is primarily responsible for retardingfatigue crack growth rates due to crack closure, as seen by the effect on AKo inFigs.5 and 6 [16]. There is a marked beneficial effect of reducing frequency onthe apparent AKo for lCrMoV rotor steel at 550°C in air.
135

8/21/2019 Caso Rotura
http://slidepdf.com/reader/full/caso-rotura 148/200
At somewhat higher &K, the combined effects of enhanced oxide growth and creep oncrack extension more than outweigh the influence of crack closure ( F i g . 6 ) .Initially, strain assisted oxidation is the primary driving force for the observedincreases in crack growth rate but with increasing & K (ie. &K>20MPa/l for lCrMoVat 5 5 0 ° C ) , the relative effect of environment diminishes and creep increasinglybecomes the controlling factor [ 7 , 3 1 ] .
Hence for ûK> & Ko, the main influence of reducing frequency at elevatedtemperatures is to increase LSF crack growth rates. The effect is shown forlCrMoV rotor steel (Fig.Ba) [5], 2.25CrMo pipe steel (Fig.8b) [6], 2.25CrMoweldment microstructures (Fig.8c) [7] and two turbine casting steels, ie. lCrMoV(GS-17CrMoV 5 11) (Fig.8d) [2] and 12CrMoV (G-X22CrMoV 12 1) (Fig.8e) [2] . Thedata in Fig.8a also indicate the tendency for Kc to reduce with decreasingfrequency.
The effect of frequency on LSF crack growth rates for the COST 505 lCrMoV rotorsteel cycled in load control at 530/550°C is conveniently summarised for&K=35MPa/JT in Fig.9. For f>lHz, da/dNxoxxi. is fatigue dominated and frequencyindependent (ie. da/dNror* . = da/dNcvcuc). Static load creep crack growth ratesare also plotted in Fig.9 and it is clear that da/dN is creep dominated forf<10_ 3Hz (ie. da/dNroTAi. = da/DNcRKp).
The point is also demonstrated in Fig.10 [5] , in which low frequency LSF crackgrowth rates per unit time (ie. da/dt = da/dN x dN/dt) are consistent with staticload creep crack growth rates for CT10/20 and CTas/so specimens. Crack growthrates are plotted here in terms of C* determined by substituting P M A X into O N * T inEqn.8, in addition to using the appropriate value for gi(a/w,n) [24]. A similarconclusion has been drawn with load control test data for a O.SCrMoV pipe steel[ 3 2 ] .
At intermediate frequencies (ie. 10*3<f<lHz, F i g . 9 ) , fatigue crack growth ratescomprise cyclic and creep components, ie.
da/dN-roTAi, = da/dNc-rct-ic + d a / d N c n u * (9)
In these circumstances, cyclic crack growth rates are influenced by oxidation andcrack tip creep processes. For example, da/dNcvctic may be accelerated by thepresence of creep damage established at the crack tip during prior dwell periods(Fig.11), and the C and m terms in Eqn.l become functions of frequency, hold timeand creep ductility, ie.
da/dNcvcL.ic = C(f,th,6 .) (AK«j)-"- ,: h-*' ,> (10)
where en is uniaxial creep rupture ductility.
For a given AKio, da/dNcv«.ic typically increases to a plateau level withincreasing hold time (Fig.12) [33,34,35]. The behaviour is associated with anincrease in the magnitude of C(f,t»,&it) and some reduction in m(f,tt»,ei») due tothe development of a creep damage zone at the crack tip during the hold time(Fig.13). For hold times out to to (ie. the time at which crack tip creep damageis first formed), any changes to the values of C(f,th,6i») and m(f,tn,fen) aremainly due to oxidation. The damage intensity and zone size increase withincreasing hold time to ti (ie. the time at which crack tip creep damage achievesa critical condition resulting in the onset of creep crack growth due to localductility exhaustion). As a generality, da/dNcvcnc is not accelerated by further
136
8/21/2019 Caso Rotura
http://slidepdf.com/reader/full/caso-rotura 149/200
increases in hold time (ie. for tn>ti), except perhaps in extremely creep brittlesteels [ 36]. Both the extent to which da/dNc-rcnc is accelerated and the holdtime dependence of C(f,t>»,eR) & m(f,tt»,en) are determined by 6R, since creepductility influences ta, ti and the intensity and size of the damage zone. Forexample, ta, ti and the critical crack tip damage density for creep crackinitiation increase with increasing creep ductility.
Creep crack growth rates are conveniently expressed in the form of Eqn.lla [37],ie.
da/dtcREEP = b_ (C *) " (11a)6 R
and alternatively as
th
da/dNcREEP = f b(th,6R) (C*)- dt (lib)b(th,6R) (C*)
where b and q are constants dependent on material and temperature, which may beinfluenced by prior cyclic damage. The exponent q is typically in the range 0.8to 1. The term b(t»,eR) is a function of tn and 6R, since creep crack growth doesnot occur until t> ti.
In the intermediate frequency regime of Fig.9, creep-fatigue crack growth ratesare the summation of Eqn.10 and Eqn.llb (ie. as given by Eqn.9). The magnitudesof both crack growth rate components decrease with increasing 6R, and henceturbine steels with high creep ductilities are more resistant to high temperaturefatigue crack growth than those with low ductilities.
LSF with Prior Thermal Exposure
It has been shown above that creep crack growth may dominate the HTFCG processwhen cyclic primary loads are linear elastic, when loading rates are slow and/orwhen hold times (steady running periods) are long. One COST 505 projectinvestigated the situation for a lCrMoV (28CrMoNiV 4 9) rotor steel when periodsof creep crack growth (ie. 1,000 to 4,000h @ 530°C/Kx-30MPa/m) are followed by aperiod of low AK cyclic loading at 530°C [1] . In these circumstances, cycliccrack growth rates are initially retarded until the crack has extended beyond theinfluence of the prior creep damage (Fig.14).
The crack tip damage in the creep pre-cracked CTis/so specimens was typicallydiscontinuous grain boundary microcracking (Fig.15) [1] . The condition is notdissimilar to that observed ahead of creep-fatigue cracks in lCrMoV [35] and other
turbine and power plant steels [20,33,34,36] (cf. Fig.11), although in the latterexamples the damage is associated with an acceleration in cyclic cracking rate(ie. da/dNcvcLic). It has already been noted that, with decreasing frequency,high temperature ÀKo levels increase due to oxide blocking and crack closure whileda/dNxoTAi. increases for somewhat higher & Ks when oxide assisted crack growthbecomes more influential [16,31] (Fig.6). The behaviour displayed in Fig.14 isconsistent with cyclic crack growth rates being retarded by crack closure atrelatively low initial levels of AK.
Prior ageing for up to 5,000 hours at 530°C (with no applied load) has noinfluence on high temperature LSF crack growth rates for lCrMoV type steels [1,2]
137
8/21/2019 Caso Rotura
http://slidepdf.com/reader/full/caso-rotura 150/200
(Fig.L4). Similarly, LSF crack growth rates for a 2.25CrMo pipe steel areapparently unaffected by 120,000 hours service at 565°C (Fig.16) [6] . It is notedthat reductions in creep ductility were not reported for either the lCrMoV rotorsteel after 5,000 hours at 530°C or the 2.25CrMo pipe steel after 120,000 hours at565°C. The possibility of a reduction in HTFCG resistance should not bediscounted in steels which suffer a deterioration in creep ductility due to
isothermal/service exposure.
HIGH STRAIN FATIGUE
In high temperature turbine components, HSF crack growth may occur due to cyclicprimary stress loading in regions of stress concentration, but is more likely tobe due to thermal loading. The thermal transients experienced at, for example,steam inlet locations in valve chests and inner casings include on-load periods atrelatively constant temperature when creep deformation is most likely to be due tosecondary stresses ( F i g . l ) . Consequently, with reference to steam turbineapplications, most effort has been directed to the measurement of HSF crack growthrates resulting from strain controlled cycles with hold times [4,20,22,26,33-36].
HSF-Creeo
It has already been noted that the thermal strain cycles experienced by realcomponents are invariably complex, and that engineering assessments usually assumeidealised cycle types. For example, at turbine start-up, through section thermalgradients can be responsible for the generation of large compressive strains inexcess of the cyclic yield strain (OA, Fig. 17). During steady running,temperature gradients are low and thermally induced strain levels are effectivelyzero. Nevertheless residual tensile stresses can be initially high due toreversed plasticity following compressive yield during start-up (B, F i g . 1 7 ) .Creep strain accumulation occurs as these stresses relax while the turbine is onload (BC, F i g . 1 7 ) . On shut-down, components may cool down slowly or rapidlydepending on their location in the unit. Thermally induced strain transients are
minor on slow cooling (CO, Fig.17a), whereas more rapid cooling is responsible fora tensile peak strain (CDO, Fig.17b). These two service cycle types are referredto as Type I and Type II respectively, and form the basis of the UKCEGB/Turbinemakers' HSF endurance database [38] .
HSF crack growth rates have been measured for a 2.25CrMo turbine casting steel at540°C using the two cycle types described above [ 4] . The approach adopted in thisCOST 505 study was novel in that large SENB-rs/ioo specimens with short pre-crackswere used to model the constraint existing in the wall section of a turbinecasting. Typical test records are shown in Fig.18, and these show how peak andeffective load ranges and the loads at the start and end of the dwell periodreduce with cycle number in this type of test. The result is that crack growthrates are initially relatively constant and then reduce to zero as the crack
length approaches -75mm (Fig.19) (ie. a/W-0.75). The behaviour is qualitativelysimilar to that displayed by thermal fatigue cracks in service. This contrastswith crack growth rate records determined from fatigue tests conducted in loadcontrol which continuously increase with increasing crack length.
The effect of dwell period on HSF crack growth rates is shown in Fig.20. For aType I cycle, da/dNTorju. increases significantly with increasing hold time. Crackgrowth rates resulting from a cycle with t»=4h are 4 to 5 times faster than thosefor tn=0. In contrast, there is a relatively small influence of increasing holdtime for a Type II cycle (Fig.20). The higher residual stress level at the startof the hold time of the Type I cycle is responsible for a greater degree of creep
- 138 -

8/21/2019 Caso Rotura
http://slidepdf.com/reader/full/caso-rotura 151/200
strain accumulation at the crack tip. This can lead to creep crack growth duringthe dwell period for tn>t<=, although the evidence indicates that crack extensionby this mechanism was limited in the highly ductile cast 2.25CrMo steel, even fora Type I cycle with a 4 hour hold time. The observed differences in growth ratedue to cycle type and hold time were mainly related to the extent of the crack tipcreep damage zone and its effect on da/dNcvci.ic. In less creep ductile steels,
the da/dNcREEP component is more significant after 4 hour hold time durations[ 3 4 , 3 6 ] . Furthermore, the effect on da/dNcycLic and the contribution ofda/dNcREEp becomes increasingly more notable in turbine steels at longer holdtimes (ie. 16<t»<200h) [ 3 3 - 3 6 ] .
There is a marked effect of load/strain control mode on HSF crack growth rates in2.25CrMo at 540/550°C, particularly at low frequency (Fig.21). With decreasingfrequency, propagation rates due to a Type I cycle shape applied in strain controlare increasingly lower than the da/dNTOTAL. values resulting from the same cycleshape and KE O applied in load control. This is because the magnitude ofda/dNcREEP reduces during the hold time of a strain control cycle due to stressrelaxation and a reducing C*. In contrast, da/dNcREEP increases during the holdtime of a load control cycle.
HIGH TEMPERATURE FATIGUE CRACK GROWTH IN WELDMENT MICROSTRUCTURES
The HTFCG properties of a number of parent steels have been reviewed. However inpractice, parts such as steam pipework, valve chests and turbine casings arejoined by welded connections and it is therefore important to know the propertiesof weldment microstructures. The incidence of defects in weld metal and heataffected zone regions is not uncommon either during manufacture or in service, andit may be necessary to assess their acceptability using fracture mechanicsmethodology. In many cases, the properties of the weld metal and the HAZ can beinferior to those of the parent steel and therefore need to be taken into accountin design assessments. HTFCG properties have been determined for both simulated[32,39] and real [2] weldment microstructures.
The metallurgical structure of multi-pass weldments in turbine components iscomplex [40] . For example, each weld bead may comprise a region of as-weldedcolumnar grains adjacent to a region of fully transformed fine equiaxed grains,the latter being the result of re-austenisation during a subsequent weld pass.The HAZ may similarly consist of pockets of coarse grain HAZ contained by thefusion boundary on one side and regions of fine grain HAZ elsewhere. Modernwelding procedures aim to limit the extent of coarse grain HAZ regions such thatthey are not continuous and can, in the limit and with extreme care, be whollyrefined by re-austenisation during a subsequent weld pass. Typically, steam pipeweld heat affected zones extend no more than 2 to 3 mms from the fusion line andthis band contains not only the fully transformed HAZ microstuctures referred toabove, but also a transition region comprising a similarly complex mixture of
partially transformed intercritical tempered ICHAZ and untransformed subcriticaitempered SCHAZ microstructures.
There are two schools of thought as to how the properties of weldmentmicrostructures should be established. The first is to identify the metallurgicalregion responsible for minimum properties and then to simulate the appropriatemicrostructure as a homogeneous matrix in a block of material of sufficient sizeto yield the requisite number of laboratory specimens. This approach is adoptedto minimise data scatter and to ensure that the properties determined have notbeen influenced by surrounding microstructures. The alternative opinionacknowledges that it is very difficult to precisely simulate individual HAZ
139
8/21/2019 Caso Rotura
http://slidepdf.com/reader/full/caso-rotura 152/200
microstructures and that in practice the performance of these regions is almostcertainly influenced by the properties of the surrounding matrix. Theprotagonists of this view support the use of specimens machined from real welds,even with the associated difficulties in producing a weldment which is trulyrepresentative of the actual welded joint to be assessed, and experimentally in
conducting the laboratory test.High temperature fatigue crack growth rates have been determined for realweldments based on cast lCrMoV (GS-17CrMoV 5 11) and 12CrMoV (G-X22CrMoV 12 1)parent steels [2] . HSF crack growth rates have been measured using both CTao/«oand CÎ29/SO specimens cycled in load control. The two testpiece types weremanufactured with pre-cracks running adjacent and parallel to weldment fusionboundaries (Fig.22). During testing, propagating cracks followed the HAZmicrostructure offering minimum resistance to cracking.
The fatigue crack growth rates determined for the HAZ structures of twoGS-17CrMoV 5 11 steels are 2 to 3 times faster than the rates measured for theparent materials at cyclic frequencies of 0.5 and 0.05Hz (Fig.23). With the
introduction of a 20 minute hold time at peak load, there is a more notable effecton da/dN-TOTAL. relative to that for the parent steels. The fracture paths followedin the continuous cycle tests were just contained within the 'visible' HAZ, in therelatively soft ICHAZ (Fig.24). In contrast, the fracture paths observed in holdtime tests tended to follow the coarse grain HAZ immediately adjacent to thefusion boundary. This is consistent with the observation that the creep crackgrowth resistance of CrMoV HAZ microstructures (and particularly the coarse grainHAZ) is notably less than that of the parent steel [41] . The creep ductility ofcoarse grain CrMoV weld heat affected zones is notoriously low, and the higherHSF-creep crack growth rates are therefore probably due to the effect of low creepductility being responsible for increases in both da/dN<=vct.ic and da/dNet»*?(Eqns.9-11).
At cyclic frequencies of 0.5 and 0.05Hz, fatigue crack growth rates in both theG-X22CrMoV 12 1 parent and HAZ structures are similar (Fig.25). However, incontrast to the low alloy creep resistant steel, there is no reduction inHSF-creep crack growth rates measured in the HAZ of the cast 12CrMoV steel, evenwith the introduction of a 20 minute hold time at peak load in the cycle. Thefracture path adopted in the 12CrMoV specimens is outside the 'visible' HAZ andfollows the soft SCHAZ, irrespective of hold time (Fig.26).
GENERAL OBSERVATIONS
The main collaborative effort of the COST 505 High Temperature Crack. GrowthWorking Group was based around a Creep Crack Growth Round Robin [29] . In additionto this activity, six members of the Group (Table 1) were also concerned with the
investigation of certain HTFCG properties for a number of high temperature turbinesteels. The high temperature fatigue crack growth studies covered a variety ofaspects which were generally unrelated, and the present Review has had to draw onfindings from outside COST 505 in order to complete the story. Nevertheless, theCOST 505 HTFCG results have added to the turbine materials database and to thegeneral understanding of the subject. They have also highlighted those areaswhere our knowledge is incomplete. These include:
(a) a quantitative understanding of the effect of long hold timesrepresentative of service applications on da/dNcvcuc and da/dNcM » forrelatively small cracks in critical turbine materials,
(b) an understanding of the effect of combined primary and secondary stress
140

8/21/2019 Caso Rotura
http://slidepdf.com/reader/full/caso-rotura 153/200
creep loading transients on high temperature fatigue crack growth rates,(c) economic methods of accurately calculating A K E O , & J and C* for relatively
small defects in large complex turbine components.
Overall, the COST 505 High Temperature Crack Growth activity was extremelyproductive and a useful vehicle for exchanging ideas, and establishing workingcontacts throughout Europe.
CONCLUSIONS
The high temperature fatigue crack growth properties of a number of steam turbinematerials have been reviewed. Many of the results referred to in the text weregathered by members of the COST 505 High Temperature Crack Growth Working Groupwho were active during the period 1985 to 1988, but additional information hasalso been collated from the published literature. The following conclusionssummarise the current understanding of high temperature fatigue crack growth insteam turbine materials.
1. It is convenient to consider both low and high strain high temperature fatigue
crack growth rates in terms of two components, one due to cyclic loading andthe second due to creep, ie.
da/dNTOTAt, = da/dNcYci.ic + da/dNcREsp
The da/dNcYct.ic term i9 a power law function of ¿K=o and may be influenced bycrack tip damage due to oxidation and prior creep loading. da/dNcniEp isexpressed in terms of the C* parameter.
2 . At 530/550°C and for a range of steam turbine forging, casting and pipesteels, there is no apparent effect of creep on LSF crack growth rates forf>lHz (ie. the magnitude of da/dNciusEP is negligible).
3. HTFCG threshold AKo levels increase with decreasing frequency due to oxideblocking and crack closure whereas at somewhat higherAKs, LSF crack growthrates increase with decreasing frequency due to enhanced oxide growth.
4. For frequencies less than 1Hz, da/dNTOT»L is still mainly influenced by oxideassisted growth effects on da/dNcvcL.xc at relatively low AKs. With increasingA,K, the role of oxidation diminishes and creep becomes more important throughits effect on da/dNcvcuc and its contribution in terms of da/dNcnKEP.
5. In a simple engineering model da/dNcvcuc, for a given AK» o, increases to amaximum as the crack tip damage zone develops to the critical conditionnecessary for the onset of creep crack growth. The prior hold time necessaryto achieve this peak acceleration increases with increasing creep ductility.
6. At frequencies less than 10~ 3Hz when the cycle is in load control, fatiguecrack growth rates are determined by the rate of creep crack growth (ie. themagnitude of da/dNcrci.xc is small relative to that of da/dNcMutp). This isnot always the case when HTFCG is due to a strain controlled cycle. In thesecircumstances, stress relaxation occurs and da/dNcnEEP is not the dominantcrack growth component until lower frequencies.
7. The resistance of a material to creep-fatigue crack growth is stronglyinfluenced by creep ductility. The magnitudes of both cyclic and creep crackgrowth rate components are lower for steels with high creep ductility.
- 141

8/21/2019 Caso Rotura
http://slidepdf.com/reader/full/caso-rotura 154/200
8. Prior long term thermal exposure (without load) has no influence on hightemperature fatigue crack growth rates, at least while the ageing treatment isnot responsible for a significant reduction in creep ductility.
9. In load controlled tests, high temperature fatigue crack growth rates throughthe weld heat affected zone of a cast lCrHoV steel are faster than thosethrough the parent material at frequencies of around 0.1Hz. The difference incracking rates increases dramatically with the introduction of a hold time atpeak load, coinciding with a change in fracture path from the partiallytransformed ICHAZ to the fully transformed coarse grain HAZ immediatelyadjacent to the fusion boundary.
1 0 . High temperature fatigue crack growth rates through the weld HAZ and parentstructures of a cast 12CrMoV steel are similar in both low frequencycontinuous cycle and peak load hold time tests. For the test conditionsadopted, all fracture paths in weldment tests are contained within the softSCHAZ.
ACKNOWLEDGEMENTS
The study has been conducted with the financial assistance of the Commission ofthe European Communities, under Contract no. COST 0015 UK (CH).
The author wishes to acknowledge the many constructive discussions withMr D.V. Thornton (GEC Alsthom) and members of the COST 505 High TemperatureWorking Group, particularly Dr J. Ewald (Siemens KWU), Dr T. Hollstein (FhG-IWM),Dr H. Kanbach ( A E G ) , and Dr. G.A. Webster (Imperial College).
142

8/21/2019 Caso Rotura
http://slidepdf.com/reader/full/caso-rotura 155/200
REFERENCES
1. J. Ewald, C. Berger & H. Brachvogel; "Investigation on crack initiation andpropagation under static, cyclic and combined loading conditions of lCrMoNiVsteels at 530°C\ COST 505 D20/D21 Final Report, Siemens Report No. TW1187/89,1 9 8 9 , June.
2 . H. Kanbach; "Crack growth in welded turbine materials at elevatedtemperatures", COST 505 D35 Final Report, AEG, 1989, April.3. I. Ragazzoni; COST 505 13 Final Report, ENEL, to be issued.4. S.R. Holdsworth; "High temperature crack growth in turbine steels", COST 505
UK5 Final Report, GEC Alsthom Report No. RM872/89, 1989, November.5. G.A. Webster & F. Djavanroodi; "Elevated temperature crack growth in steam
turbine materials", COST 505 UK1S Final Report, Imperial College(Mech.Eng.Dept.), 1989, January.
6. G.A. Webster & F. Djavanroodi; "Determination of the crack growth behaviourand failure mode of pre-exposed material", COST 505 UK26 Final Report,Imperial College (Mech. Eng. D e p t . ) , 1989, January.
7 . J.F. Knott; "High temperature crack growth in steam turbine materials",COST 505 UK25 1st Interim Report, Cambridge university (Met. & Mat. Sci.
D e p t . ) , 1986, June.8. T.C. Lindley, C E . Richards & R.O. Ritchie; "The mechanics and mechanisms offatigue crack growth in metals", Conf.Proc. The Mechanics and Physics ofFracture, Churchill College, Cambridge, 1975, January.
9. P.C. Paris & F. Erdogan; "A critical examination of crack propagation laws",J.Basic Eng., 1963, 85, 528.
1 0 . M.O. Speidel; "Fatigue crack growth at high temperatures", Proc. Symp. HighTemperature Materials in Gas Turbines, Brown Boveri, Baden, 1973, March.
1 1 . S.J. Garwood; "Fatigue crack growth threshold determination", Welding Inst.R e s . Bull., 1979, 20, 262.
1 2 . R.T. Davenport & R. Brook; "The threshold stress intensity in fatigue", Fat.Eng. Mat. Struc, 1979, 1, 151.
1 3 . G.K. Haritos, T. Nicholas & G.O. Painter; "Evaluation of crack growth models
for elevated temperature fatigue", ASTM STP 945, 1988, 206.1 4 . K.J. Nix, N. Knee, T.C. Lindley & G.G. Cheli; "An investigation of fatiguecrack growth in ductile materials at high growth rates", CEGB (CERL) ReportN o . TPRD/L/3168/R87, 1987, October.
1 5 . Stress Intensity Factors Handbook, Ed. Y. Murakami et al, 1987, Pergamon.1 6 . R.P. Skelton b J.R. Haigh; "Fatigue crack growth rates and thresholds in
steels under oxidising conditions", Mat. Sei. Eng., 1978, 36, 17.1 7 . G.J. Lloyd; "High temperature fatigue and creep-fatigue crack propagation:
Mechanics, mechanisms and observed behaviour in structural materials", Fatigueat High Temperatures, Ed. R.P. Skelton, App. Sci. Pubi., 1983, 187.
1 8 . J.R. Rice; "Crack tip placticity and fracture initiation criteria", Proc. 3rdInt. Conf. Fracture, Munich, Part 2, 1-441.
1 9 . W. Elber; "The significance of crack closure", ASTM STP 486, 1971, 230.
2 0 . S.R. Holdsworth; "Remaining life assessment of high temperature turbinecastings", Inst. Metals Conf. Proc. Metals Development in Turbo-MachineryDesign, Churchill College, Cambridge, 1988, September, 136.
2 1 . J. Schivje; "Some formulae for the crack opening stress level", Eng. Frac.Mech., 1981, 14, 461.
2 2 . R.P. Skelton; "Cyclic crack growth and closure effects in low alloy ferriticsteels during creep-fatigue at 550°C", High Temp. Tech., 1989, 7, 3, 115.
2 3 . N.E. Dowling; "Crack growth during low cycle fatigue", ASTM STP 637, 1977, 97.2 4 . V. Kumar, M.D. German & C F . Shih; "An engineering approach for
elastic-plastic fracture analysis", EPRI Report No. NP-1931, 1981, July.
- 143

8/21/2019 Caso Rotura
http://slidepdf.com/reader/full/caso-rotura 156/200
25. R.P. Skelton; "Review - The application of small specimen crack growth data toengineering components at high temperature", ASTM Conf. Proc. Low CycleFatigue - Directions for the Future, Lake George, 1985, September.
26. R.P. Skelton, S.M. Beech, S.R. Holdsworth, G.J. Neate, D.A. Miller & R.H.Priest; "Results of a Round Robin test on creep-fatigue crack growth in aferritic steel at 550°C", NPTEC Report to be issued.
2 7 . H. Riedel; Fracture at High Temperatures, MRE, Springer-Verlag, 1987.2 8 . R.A. Ainsworth, G.G. Cheli, M.C. Coleman, I.W. Goodall, D.J. Gooch, J.R.
Haigh, S.T. Kimmins & G.J. Neate; "Assessment procedures for defects in plantoperating in the creep range", Fatigue Fract. Engng Mater. Struct., 1986, 10,115.
29. T. Hollstein, F. Djavanroodi, G.A. Webster & S.R. Holdsworth; "Hightemperature crack growth in Alloy 800 and a lCrMoV steel. The results of anEGF Round Robin", Conf. Proc. ECF7, Failure Analysis - Theory and Practice,Budapest, 1988.
3 0 . J.R. Haigh; "The growth of fatigue cracks in turbine casing steels at hightemperatures under predominantly elastic loading", CEGB (CERL) Report No.RD/L/N9/74, 1974, January.
3 1 . J.R. Haigh, R.P. Skelton & C E . Richards; "Oxidation-assisted crack growthduring high cycle fatigue of a lCrMoV steel at 550°C", Mat. Sei. Eng., 1976,26, 167.
3 2 . G.J. Neate; "Crack growth in bainitic 0.5CrMoV steel at elevated temperatureunder cyclic loading conditions", ASME Conf. Proc. Advances in Life PredictionMethods, 1983.
33. D.N. Gladwin, D.A. Miller, G.J. Neate & R.H. Priest; "Creep fatigue andcreep-fatigue crack growth rates in parent and simulated HAZ type 321stainless steel". Fat. Fract. Engng Mater. Struct., 1988, 11, 5, 355.
3 4 . G.J. Neate: "Creep fatigue crack growth in 0.5CrMoV steel", Mat. Sci. & Tech.,1988, 4, June, 524.
35. R.H. Priest, D.A. Miller, D.N. Gladwin & J. Maguire; "The creep fatigue crackgrowth behaviour of a lCrMoV rotor steel". Proc. ASM Intern. Conf. FossilPower Plant Rehabilitation, Cincinnati, 1989, March.
36. D.N. Gladwin, D.A. Miller & R.H. Priest; "Examination of fatigue andcreep-fatigue crack growth behaviour of aged type 347 stainless steel weldmetal at 650°C", Mat. Sci. E> Tech., 1989, 5, 40.
3 7 . K.M. Nikbin, D.J. Smith St G.A. Webster; "An engineering approach to theprediction of creep crack growth", J. Eng. Mat. Tech., Trans ASME, 1986, 108,186.
3 8 . G. Thomas & R.A.T. Dawson; "The effect of dwell period and cycle type on thehigh strain fatigue properties of a lCrMoV rotor forging steel at 500-550°C",1980, Inst. Mech. Engrs. Conf. Proc. Engineering Aspects of Creep, Sheffield,Paper C335/80.
39. D. Armstrong Si G.J. Neate; "Creack growth in bainitic 0.5CrMoV steel undercreep-fatigue conditions", Mat. Sci. & Tech., 1985, 1, January, 19.
4 0 . P.J. Alberry S¡ W.K.C. Jones; "Structure and hardness of 0.5CrMoV and 2.25CrMosimulated heat affected zones", Metals Technology, 1977, December, 557.
4 1 . S.R. Holdsworth Si D.V. Thornton; "The effect of stress relief heat treatmenton the resistance to creep crack growth of the weld and heat affected zones ofCrMoV type joints", WI Conf. Proc. Residual Stresses In Welded Constructionand their Effects, 1977, November, 133.
- 144
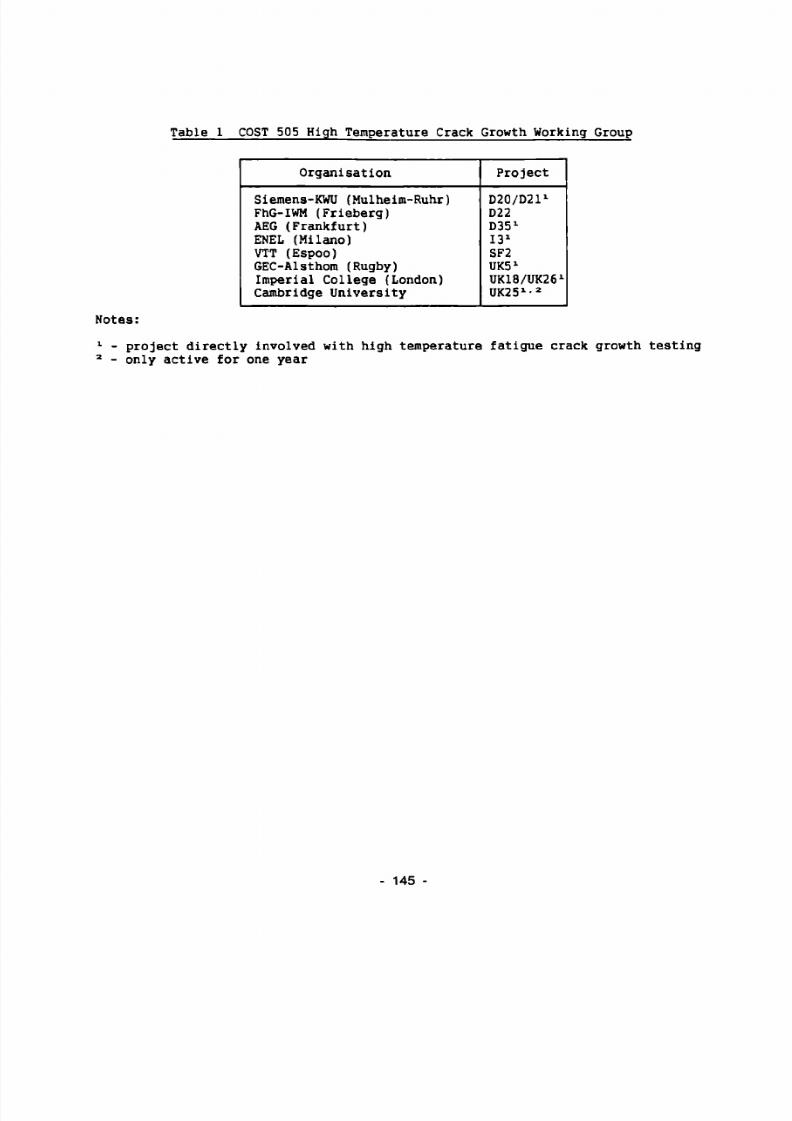
8/21/2019 Caso Rotura
http://slidepdf.com/reader/full/caso-rotura 157/200
Table 1 COST 505 High Temperature Crack Growth Working Group
Notes:
Organisation
Siemens-KWU (Mulheim-Ruhr)FhG-IWM (Frieberg)AEG (Frankfurt)ENEL (Milano)VTT (Espoo)GEC-Alsthora (Rugby)Imperial College (London)Cambridge University
Project
D20/D211
D22D351
I31
SF2UK51
UK18/UK261
UK251-2
project directly involved with high temperature fatigue crack growth testingonly active for one year
145
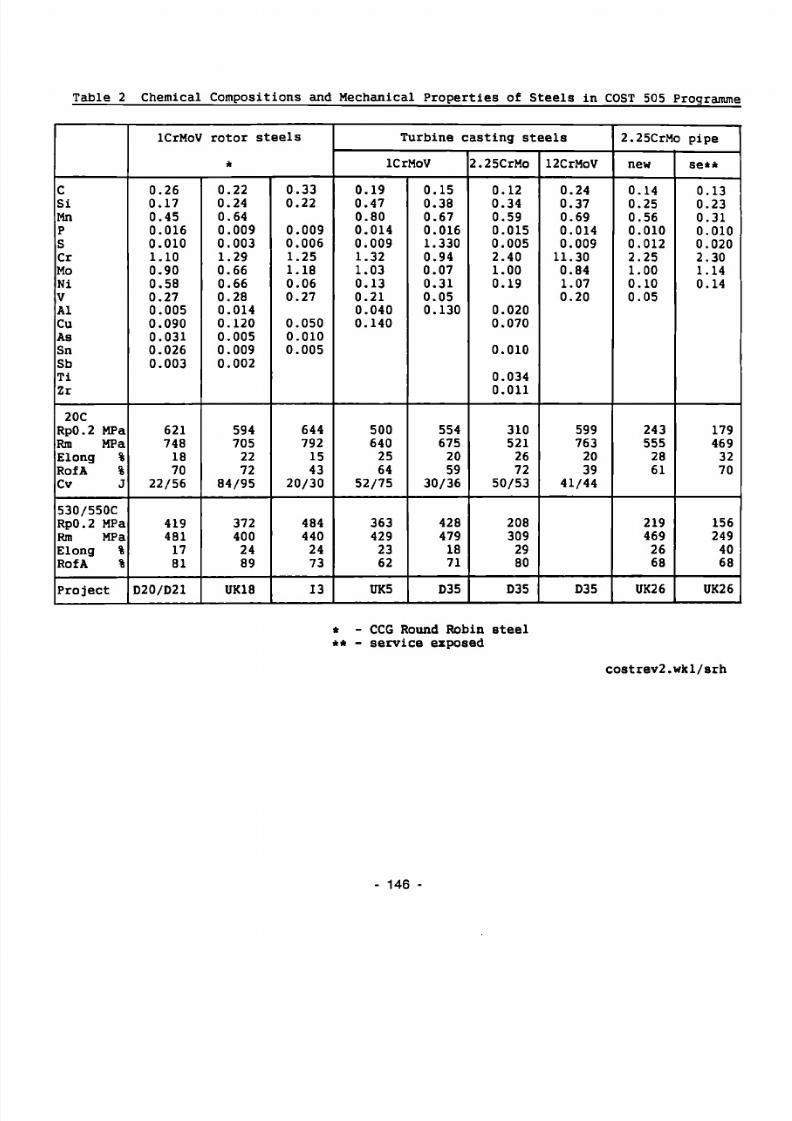
8/21/2019 Caso Rotura
http://slidepdf.com/reader/full/caso-rotura 158/200
Table 2 Chemical Compositions and Mechanical Properties of Steels in COST 505 Programme
C
Si
Mn
P
S
Cr
Mo
Ni
V
Al
Cu
As
Sn
Sb
Ti
Zr
20C
RpO.2 MPaRm MPa
Elong %
RofA %
Cv J
530/550CRp0.2 MPaRm MPa
Elong %
RofA %
Project
lCrMoV
0.26
0.17
0.45
0.016
0.010
1.10
0.90
0.58
0.27
0.005
0.090
0.031
0.026
0.003
621
748
18
70
22/56
419
481
17
81
D20/D21
rotor steels
*
0.22
0.24
0.64
0.009
0.003
1.29
0.66
0.66
0.28
0.014
0.120
0.005
0.009
0.002
594
705
22
72
84/95
372
400
24
89
UK18
0.33
0.22
0.009
0.006
1.25
1.18
0.06
0.27
0.050
0.010
0.005
644
792
15
43
20/30
484
440
24
73
13
Turbine casting steels
lCrMoV
0.19
0.47
0.80
0.014
0.009
1.32
1.03
0.13
0.21
0.040
0.140
500
640
25
64
52/75
363
429
23
62
UK5
0.15
0.38
0.67
0.016
1.330
0.94
0.07
0.31
0.05
0.130
554
675
20
59
30/36
428
479
18
71
D35
2.25CrMo
0.12
0.34
0.59
0.015
0.005
2.40
1.00
0.19
0.020
0.070
0.010
0.034
0.011
310
521
26
72
50/53
208309
29
80
D35
12CrMoV
0.24
0.37
0.69
0.014
0.009
11.300.84
1.07
0.20
599
763
20
39
41/44
D35
2.25CrMo pipe
new
0.14
0.25
0.56
0.010
0.012
2.25
1.00
0.10
0.05
243
555
28
61
219469
26
68
UK26
se**
0.13
0.23
0.31
0.010
0.020
2.30
1.14
0.14
179
469
32
70
156249
40
68
UK26
* - CCG Round Robin steel** - service exposed
costrev2.wkl/srh
146 -

8/21/2019 Caso Rotura
http://slidepdf.com/reader/full/caso-rotura 159/200
EXAMPLES OF PRIMARY AND SECONDARY STRESS CYCLES IN
TURBINE COMPONENTS
ROTORSteg. bore)
c rrotationalstress
\thermalstress
CASINGS
ROTORS (eg. rim)
*— ' ^ i
rotationalK stress
-v- Y-.' v i thermal
stress
PIPEWORK
0"
N thermal
' ^ „ stress
\ ' pressure\ i stress\ ,
pressure
stress" - - 1
v
\ ¡Jt iermalN g stress
^ .
Examples of primary and secondary stress cycles in steamturbine components
Fili Rff: Org. No. Fig. Sht. No . 1
147 -

8/21/2019 Caso Rotura
http://slidepdf.com/reader/full/caso-rotura 160/200
LABORATORY CYCLE TYPES
( a ) ÇT E
Siemens
ENELA " " Ä ~ Ä " ~ "A A A /
t
(b) CT
Imp. Col.»h
t
A A AA A A /E
/ V ^ t
(c) (T E
AEG
1
V " " T T
/ V \/ r\ r\\J vt
(d) O" E
GEC A ^ ^ -
vAA V V V(e) CT E
GEC ^ A ^ AV \ / ^
'^ A V A T
I d e a l i s e d c y c l e t y p e s u s e d I n COST 505 HTFCG a c t i v i t y( a ) - ( c ) : l oa d c o n t ro l c y c l e s , ( d ) - ( e ) : s t r a i n c o n t ro l c y c l e s
Da u Fil i Rtf: Org. No. Flg. SM. No. 2
148

8/21/2019 Caso Rotura
http://slidepdf.com/reader/full/caso-rotura 161/200
1.0E-01da/dN - mm/cycle
1 . 0 E - 0 2 b
1 . 0 E - 0 3 k
1.0E-04
1 . 0 E - 0 5 b
1.0E-06
LOW &K REGIME MID &K REGIME HIGH AK REGIME
Kc
HSFREGIME
1 . 0 E - 0 7 1 ÛKo
da /dN • C (ÙK) '
Log AK
LSFREGIME
Fat igua crack growth reg imes due to cycl ic loading
Filt Raf: Drg. No. Fig. Sht . No.3
149
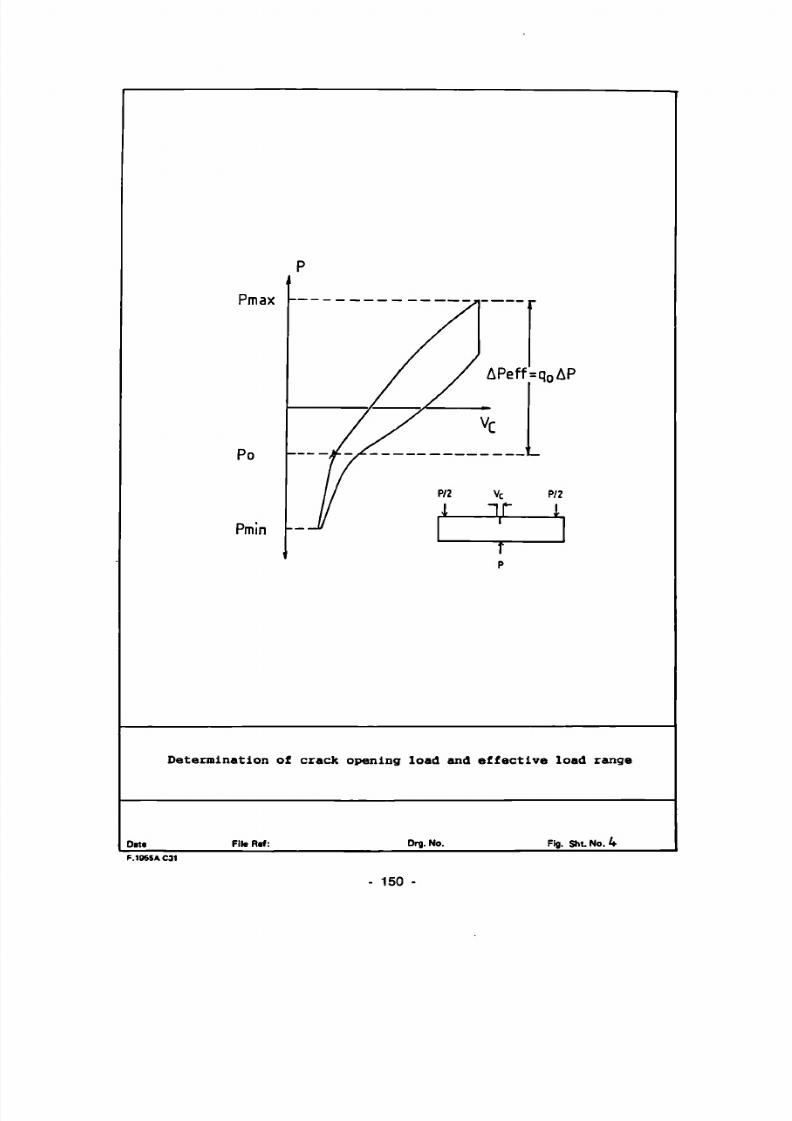
8/21/2019 Caso Rotura
http://slidepdf.com/reader/full/caso-rotura 162/200
Pmax
Po
Pmin
APeff=q0AP
Determination of crack opening load and effective load range
Fila R * f : D r g . N o . Fig, S h i N o , I*
- 150
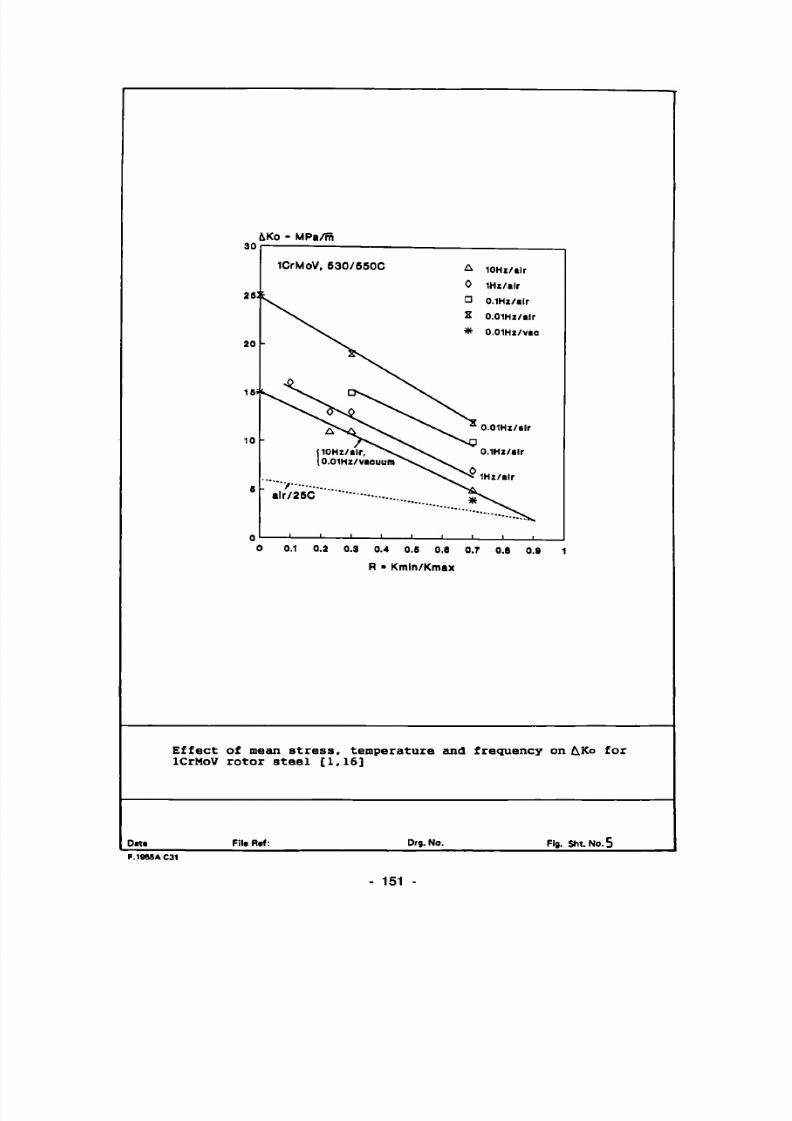
8/21/2019 Caso Rotura
http://slidepdf.com/reader/full/caso-rotura 163/200
Ko - MPa/m
0.1 0.2 0.3 0.4 0.S 0.8 0.7 O.S 0.9
R ■ Kmln/Kmax
Effect of mean stress temperature and frequency on K o for lCrMoV rotor steel [1 16]
i l t R i f Drg. No. Fig. SM. No. 5
151 -

8/21/2019 Caso Rotura
http://slidepdf.com/reader/full/caso-rotura 164/200
da/dN mm/cycle
1.0E-02 e
1.0E-03
1.0E-04
1.0E-05
1.0E-07
d e c r e a s i n g f r e q u e n c y ( 5 5 0 C )
¿Ko
a l l f r eq u en c i e s ( 26C )
d e c r e a a i n g f r e q u e n c y ( 6 6 0 C )
Log&K
Schematic representation of effect of frequency on LSF crack
growth rates [16
Oats File Rrf: Org. No . Fig. Sit. No. 6
152

8/21/2019 Caso Rotura
http://slidepdf.com/reader/full/caso-rotura 165/200
Di t t
da/dN - mm/cycle
10°
- 1
10
1Õ2
«ä
IO
155
1Õ̂
1 1 1 1 1 1 1 1 KrMoV l28CrMoNiV<.9) • Siemens [D20/21I Load control ■ Imp Col IUK18I
R=0-1
530/550°C
~ Frequencies>1Hz ~~
da = 7x 1 8 Û K2 5 n,m;CyCle
dN \ s
J^ Ï • 0 • — •
• 1
• 1 1 1
IO 20 30 M) SO 60 70 BO 90 100 AK - MPa/m
LSF crack growth r a t e s i n lCrMoV r o t o r s t e e l a t 530/550°C [ 1 . 5 ]
F1l«(taf: Drg.No. Fig. SM . No.7
153

8/21/2019 Caso Rotura
http://slidepdf.com/reader/full/caso-rotura 166/200
Dits
10°
1 0 - 1 -
'm
I , io -2-u
■s. E £
•o O
I O ,
IO « T
j
I O 5 -
ï rMoV rotor steel ƒ I m p c r i a l C o U l g e
R=»1 j IUK18I
/ Veld* Hz
/
ff l x«3
Hz j S x I p H z
• r xf *
'* -<dr ^ ¿* ***í 2 | t e
i? f£*^£/^*<3f j jo 0"0"
^^r"^^
/ffr u Hz
10 100
ÍK ( Mp g V m )
T h e e f f e c t o f f r e q u e n c y on f a t i g u e c r a c k g r o w t h r a t e s f o rl C rM o V r o t o r s t e e l a t 5 5 0 ° C [ 5 ]
FlliRtf: Drg. No. Flg. Sht. No.ßa
154

8/21/2019 Caso Rotura
http://slidepdf.com/reader/full/caso-rotura 167/200
10 ° T
K T 1
10 2 - ¡
10-3-J
l o - S
« ■ S
10_
As received 2-25CrMo pipe steel 550°r R=0
10
1xlõ2 Hz
Imperial College IIIK26)
AK (MPiVm) 10 '
The effect of frequency on fatigue crack growth rates for 2.25CrMo pipe steel at 550°C [6]
Fila R i f : D r g N o Fi g S h t N o 8 b
155

8/21/2019 Caso Rotura
http://slidepdf.com/reader/full/caso-rotura 168/200
I
1
S
T E S T E G IN V I U » « i . 1 0 » M r . SO O C .
• B.OI.MHi.
• R.M.IOHi.
• Oi I Hl.
■ R-M.OlHz.
2.2SCrMo (UK25)
P A R E N T P U T E . C O A R S E ¡ R A I N E D M A R T E N S I T E I
= 0 - 5 , M H z , p p .
■ R . 0 5 . 1 H i . V E I U - M E T A L
A S - R E C E I V E O I
10Hz, pp.
I I , , , , I , , I - ■■ - I
2 0 3 «1 SO 6 7 1APPUEO ALTERNATING STRESS INTENSITY. AK.HPiÆ
The effect of frequency on fatigua crack growth rates for 2 25CrMo weldment microstructure at 5 °C in vacuus [7]
Dm RI« Rtf: O r g No. Fig S h t N o 8 c
156

8/21/2019 Caso Rotura
http://slidepdf.com/reader/full/caso-rotura 169/200
da/dN- mm /cycle
10°
15'
IO*
« i
M *
« S
10°
1 1 1 1 1 1 1 1
GS-17CrMoV 5l1 AEG ID35)
Load control
R=0-1
S30-C
~ o -
* r » o 530-C
- œ$m# l C r M o V ^ / g
f o r g i n g /lines /
(f»IHzl
D-0-5Hz, o - 0 0 5 H z .
open points: parenl steel,
solid points: HAZ
I 1
0 20 30 M> 50 60 70 60 90 1
ÄK - MPa/ø
)0
n
The e f f e c t of f requency on fa t i gu e crack growth ra te s fo r
lCrMoV tu rbi ne ca st in g st e el a t 530°C [2]
O n * Fita Raf: Drg. No. Fig. S h t . N o . 8 d
157

8/21/2019 Caso Rotura
http://slidepdf.com/reader/full/caso-rotura 170/200
da/dN - mm/cyc le
IO»,
Iff*
»*
IO?
rG-X22CrMoV121
Load control
R=0-1
530»C
i — i — i — i - rAEG 1035]
D - 0 5Hz; o - 0-OSHz,
open points: parent steel ,
solid points: HAZ
I I I I I I20 30 40 SO 60 70 00 90 HO
¿K • HPa/m
The effect of frequency on fatigue crack growth rates for12CrMoV turbine casting steel at 530°C [2]
Filt Ref: Drg. No. Fig. S h t. N o . 8 e
158

8/21/2019 Caso Rotura
http://slidepdf.com/reader/full/caso-rotura 171/200
tia/dN - mm/cycle
MP l i l i
4 K r 3 5 M P a / m
Loid Control IR=01 ]
, 530 / 550 'C
^¿^C *x>> -^ v X ^ > * > ~ ~
i i i i
1
i
1
lCrMoV forcings
• Siemens (020/21)
■ Imp. Col. lUKlBI
i ENEL 1131
-
S ' \ '
i
152
» 3 -
10<-
«5 lõ > 103 152 1Í' 10' 10 ' 102
Frequency - d N / d t - H z
Fatigue crack growth rate versus frequency for lCrMoV rotor steel at 530/550°C and ^K=35MPa/õT [1,3,5]
FII« Rtf: Org. No . Flg. Sht.No9
159
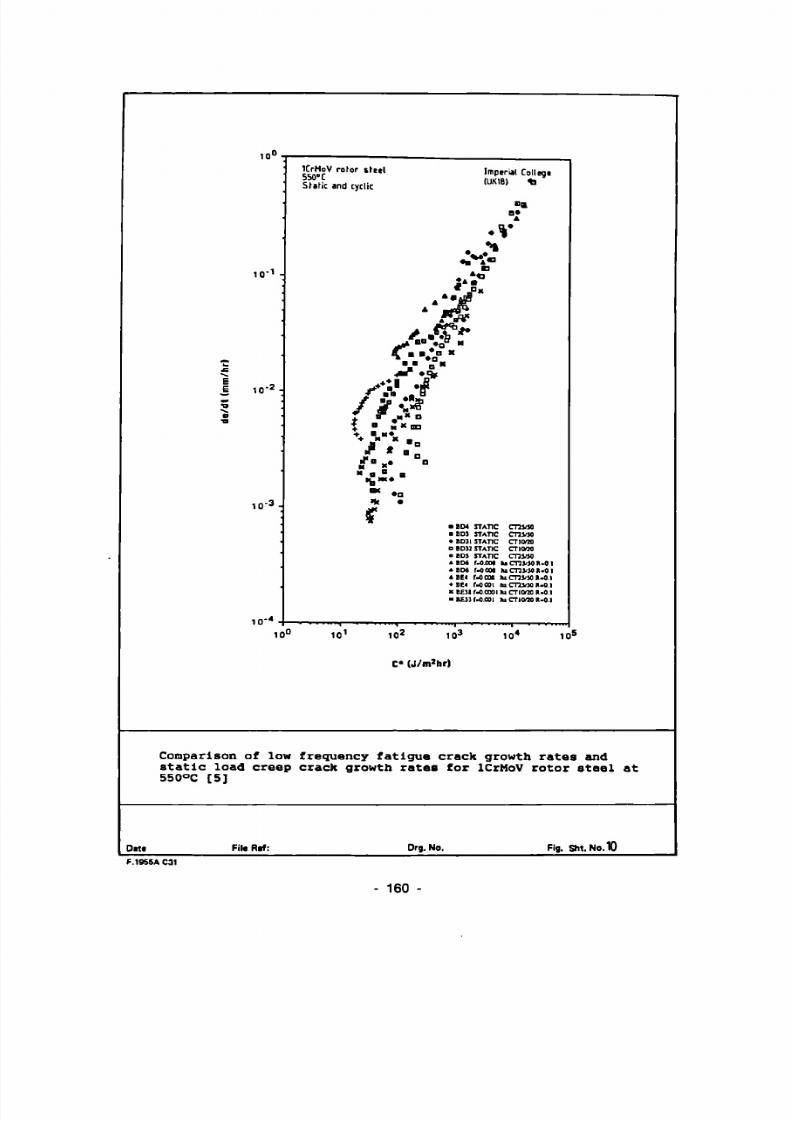
8/21/2019 Caso Rotura
http://slidepdf.com/reader/full/caso-rotura 172/200
Im
•̂ E E
5 ^ e
Comparison s t a t i c load 550°C [5]
10°
I O ' -
i o 2 :
i o - a -
' '
'
I O ' 4 -
St.fic and cyclic IUK,8
>
■a B* A
c
» Ê « * Ä *
/..: Fr
i ■ M OD
♦ B « • ♦ M X _
i - . . -■ M g B B
« B »
a
■fc •
■ BE M S T A T I C emisa
m BDI STATIC CT2VU• BDll STATIC CTIMO
a BDll STATIC CTKRO
• BDÍ STATIC CT3S/J0 ABM M M kiCTU/SOA.QI
* BD4 uoooi luCnVMR.OI
• BE4 r-0001 hi CTÎVJ0 K.O.t ♦ BE4 M 001 hi CTU/U JU0.1
K BEÎIf-O.OOOI hiCTKWOIUO.i
■ BE» r-aooi hi CTicno R-O.I
10° 101 10
2 10
3 IO
4 IO
5
C* (J /m 2h r)
□f low f requency f a t i g u e crack growth r a t e s and creep crack growth r a t e s for lCrMoV r o t o r s t e e l at
Oatf Fila Rif: Org. No. Flg. Sht. No. 10
- 160

8/21/2019 Caso Rotura
http://slidepdf.com/reader/full/caso-rotura 173/200
lOOjjm
Crack tip damage in lCrMoV specimen creep pre-cracked for2,000 hours at 530°C [1]
D r g . N o . Fig. Sht . N o . 1 1
- 161

8/21/2019 Caso Rotura
http://slidepdf.com/reader/full/caso-rotura 174/200
1.0E-01da / dNcyc l i c - mm/ cyc l e
1.0E-04
1.0E-OS
th(0)<th(1)<th(2)<th(3)<th(4)
¿K
Crack tip creep damage associated with a high strain fatiguecrack in a 0.5CrMoV turbine casting steel [20]
Dit« F il e R a f : D r g . N o . F ig . S h t . N o . 1 2
162

8/21/2019 Caso Rotura
http://slidepdf.com/reader/full/caso-rotura 175/200
HOLDTIME
th(0)
th(1)
th (2)
th (3)
th (4)
p re crack b d f
cy c l i c c r a c k g rowth —c r e e p c r a c k g ro wth - v ^
fâ©
ß \ ¡Ã \ f
'a Ve Ve
c r e e pd a m a g e
zone
I n f l u e n c e o f p r i o r h o l d t i m e o n c y c l i c c r a c k gr o w th r a t e
Date File Ref: Org. No . Fig. Sht. No . 13
163 -

8/21/2019 Caso Rotura
http://slidepdf.com/reader/full/caso-rotura 176/200
Dite
1 0 - 2 - ,
d
d
m
m
c
e
3
O
O
Ól
¿
¿
■ ■ ■
Symbol X A
D B D
AS-RECEIVED 1000h/530*C „ „ p . „ „ soooh/S3o-c P R E - A C E D
1000h/530*C-da/dl 3000h/530*C-da/dt fRE-CREEP
4000h/530 ,C-da/dt C R A C K E D
SIEMENS ID20/211
o
Q ■ D
% B
□ 4
i>*
JET
x íf < a D
JCX ■ V * X D O
x # i r fi T = 5 3 0 ° c
x # o « R = 0.1
F = 1 0 H z x S CT25S/CT25
10
The i n f l u e n c e o r a t e s i n lCrMoV
Fila Ref:
2 0 / IK ( M P a v m ) 5 0 1 0 D
C p r i o r c r e e p damage o n c y c l i c c r a c k g r o w t h r o t o r s t e e l a t 530 °C [ 1 ]
Drg. No. Fig. SM. No. K
164
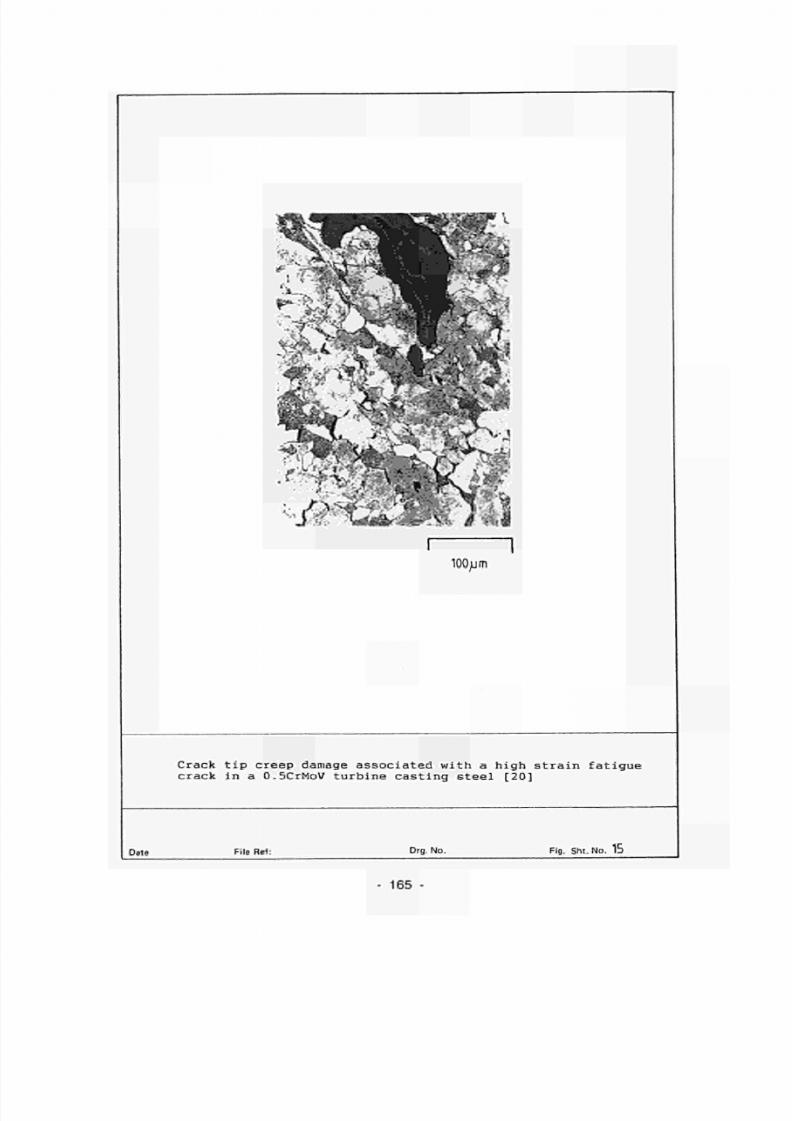
8/21/2019 Caso Rotura
http://slidepdf.com/reader/full/caso-rotura 177/200
s >Awls
100^jm
Crack tip creep damage associated with a high strain fatiguecrack in a 0.5CrMoV turbine casting steel [20]
D r g . N o . Fig. S h t. N o . 15
- 165

8/21/2019 Caso Rotura
http://slidepdf.com/reader/full/caso-rotura 178/200
da/dN-mm/cycle
ir>0
1Õ2
1Õ3
1Õ'
1
AK=35MPa/m
Load Control ( R= 0 I )
SSO C \ s ~
VS \
-
1
1 1 1
\ %^
X \ ^
\ \ Q v
s ■ \ ^ \ a s ^ - ^ \
1 1 1
1 1
2-25CrMo pipe s tee l
■ new material
o ex-service material
Imperial College (UK26)
0
1 1
-
ro3 m »'
Frequency-dN/dt -Hz
The influence of prior exposure on creep-fatigue crack growth rates in 2.25CrMo pipe steel (ie. after 120,000h @ 565°C) [6]
File Ref: Org. No. F i g S h t N o 6
166

8/21/2019 Caso Rotura
http://slidepdf.com/reader/full/caso-rotura 179/200
(a) Type I cyc le
A
(b) Type n cycle
t r
he-
Type I and Type II service cycles
Oat» Fila Raf: Drg. No. Fig. SM. No. 17
- 167 -
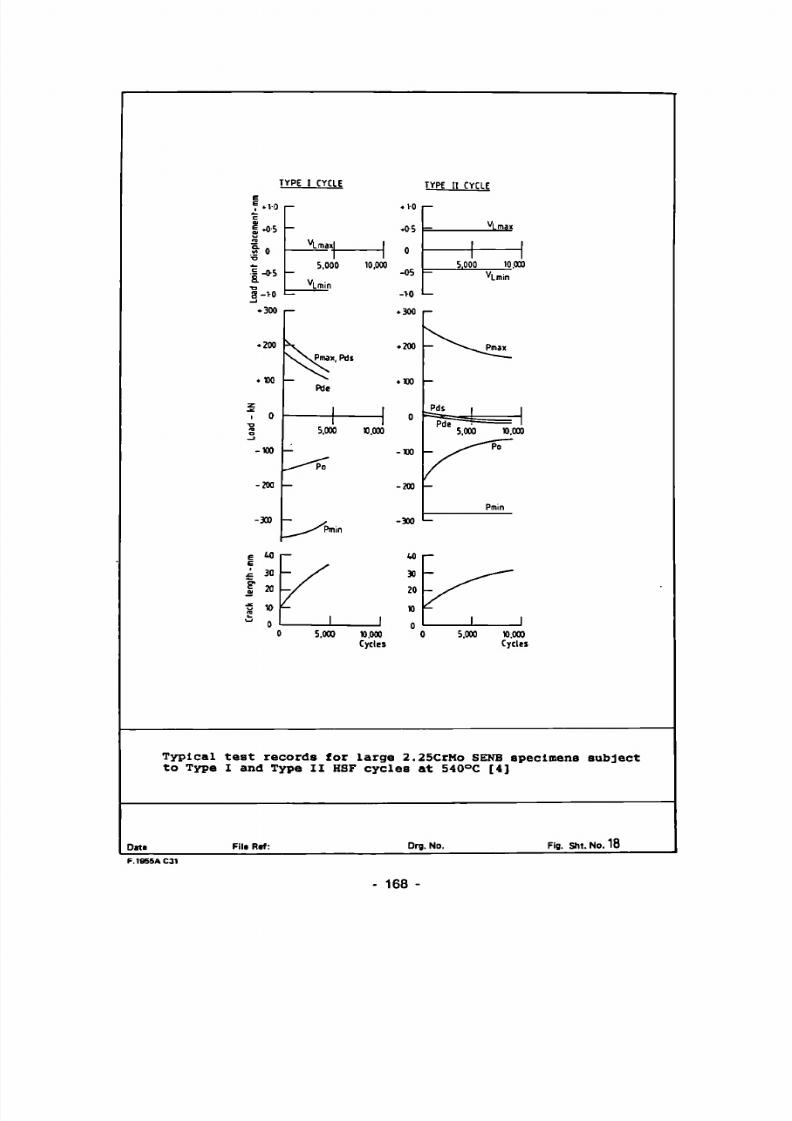
8/21/2019 Caso Rotura
http://slidepdf.com/reader/full/caso-rotura 180/200
TYPE 1 CYCLE TYPE [I CYCLE
E
f .10 c
i0
5 i i
f 0 o
t«* O 3-VO
- . 1 0
— *o-5
VLmaxI 1 .
1 1 5,000 10,000
-05
L̂min
1— -V0
- v Lmax
1 1 i l
5.000 10.000
^Lmin
_» BOO
WOO
♦ XXI
z
i 0 ■o m o _ j
-100
-200
-300
— -300
\ . .200 \ \ P m a x , Pds
We
1 n 1 °
5.000 n.ooo
- - W )
— -200
- * 3̂00
— ^ * ^ P m a x
_Pds | |
P d T ^ = 1 5,000 n.ooo
- ^—^°~
Pmin
^ — P m i n
s M r M i— E 30
J 20
1 » o
s
- X » / / - K 1 1 1 1
0 5,000 10.000 0 5.000 » .000 Cycles Cycles
Typ i ca l t e s t records fo r l a rge 2.25CrMo SENB specimens sub ject t o Type I and Type I I HSF cyc les at 540°C [4 ]
Da ta F i l a Re f : D r g . N o . F i g . S h t . N o . 1 8
168

8/21/2019 Caso Rotura
http://slidepdf.com/reader/full/caso-rotura 181/200
d a / d N Cy C |¡ c - m m /cyc l e
1 0 '
1Õ2
1 Õ 3 -
1 Õ < »
225C r Mo D i sp l a c em e n t co n t r o l5 W C SEN B 75 /100I cp mAVj_= 102 mm
25 50 75 100
C r ack l en g t h - m m
Variation of HSF crack growth rate with crack length indisplacement control bend test for 2.25CrMo at 540°C [4]
Data Fila Rff: Drg. No. Fig. Sht. No . 19
- 169

8/21/2019 Caso Rotura
http://slidepdf.com/reader/full/caso-rotura 182/200
da /dN | .0 f a | -mm/c y c l e
101
10 2
10-3
10*
«S
I I I I I I I M 2-25CrMo Cast Steel 5 W C . 1cpm
Typenţ A ue t ì o f )
V b 0-56 J Type l i * 0-W tf>
- rnrr • 038 ^ J \j V r 0-33 >*■ f r V Ï 0-24 > • y /
S 0-19 > / ~ / j ó
- p^ -
/ dwell — /
(hours)
/ open points 0 / part solid points 0-5
/ solid points t
/100 Hz Data Line
1 1 1 1 1 1 1 1 1 0 20 30 In 50 60 70 80 90 BO 201 0
A K g q - M f W m
The i n f l u ence of cyc l e type and hold t ime on HSF crack growth r a t e s f o r cast 2.5CrMo a t 540°C [ 4 ]
D i u File R«f : Org. No . Fig. Sht. No. 2 0
170

8/21/2019 Caso Rotura
http://slidepdf.com/reader/full/caso-rotura 183/200
da / dN-mm/ cyc le
id
1Õ2
I03
mi
1 1
¿K=3SMPa/m
2 ZSCrKo
55 0 C \ \ ¿s
K
X VS X. ^\ X. S
_ Cast 2.2SCrMo / ¿ * ~ ^ - ^ ^ ^
Type I s t r a i n con t r o l cycle ^ — . ^ .
CEC (UKSI
, ,
1 1
s
S. v
s ■ ^ ^ \ ■ \ ^ - ^ x ^
_\^J^V i i
i i
2.2SOMO pipe steel lud control cycle IR:0-11
y imperial College IUK26)
1 i
-
•
IO1 IO2
F requency -dN / d r -Hz
The influence of frequency and load/strain control mode on high temperature fatigue crack growth rates for 2.25CrMo at 540/550°C K̂=35MPa/K) [4,6]
Data F i l a Ra f : Drg. N o . Fig. Sht. No . 21
171

8/21/2019 Caso Rotura
http://slidepdf.com/reader/full/caso-rotura 184/200
CT 25/50 fes p i e c e s
Specimen location in cast lCrMoV and 12CrMoV welaments [2]
Oat« FII« Rtf: Drg. No. Fig. S h t . N o . 2 2
- 172 -

8/21/2019 Caso Rotura
http://slidepdf.com/reader/full/caso-rotura 185/200
da/dN-mm/cycle
10°
10
10-2
M í
io4
10-5
|Õ 6
I 1 1 1 1 1 1 1
GS-17CrMoV511 AE G I D35 I
Lead c o n t r o l
R=01 * J *
530»C é i
i
h ¡i è&
- ^ßi1 0 M o V ¿ / ¡ f forging / lines / ( M Hz )
□ - 05Hz . o - 0 0 5 H z ,
licked symbols: 20min hold,
open points: parent steel,
solid points: HAZ
1 1 l i l i l í
0 20 30 IO 50 60 70 SO 90 1
ÛK - HPa/f
)0
n
H i g h t e m p e r a t u r e f a t i g u e c r a c k g r o w t h r a t e s i n c a s t l C r M o V s t e e l ( G S - 1 7 C r M o V 5 1 1 ) w e i d m a n t s [ 2 ]
Data F i l « R« f : O r g . N o . F i g . S M . N o . 2 3
173

8/21/2019 Caso Rotura
http://slidepdf.com/reader/full/caso-rotura 186/200
base material HAZ f i l ler metal T ?
2 5° -
> X a
Hardnes
CD
1. Hardness p ro f i l e , specimen B1.3.2
fractur*
hit» a i u r l l l ^
3 e \ ^ / \
» 1 ■ l ' 1 ' 1 ' l
- 2 - 1 D 1 2
Dis t ance in mm.
Fracture path in cast lCrMoV steel (GS-17CrMoV511) weldraent HTFCG testpiece (0.05<f<0.5Hz, t»=0) [2]
Drg. No. Fig. S h t . N o . 2U
174 -

8/21/2019 Caso Rotura
http://slidepdf.com/reader/full/caso-rotura 187/200
d a / dN - m m / c y c l e
10 ° i
1 5 2 -
1 0 - 3 -
G - X 2 2 C r M o V I 2 1
L o ad co n t ro l
B=0-1
530" C
" i—i—r~rAEG (035)
D - 0-5HZ; o - 00 5Hz ; « - CCG
o p e n p o i n t s : p a r e n t s t e e l ,
so l id po in ts: HAZ
t i cked s ymb o l s : 20mi n ho l d
I I I I I—L20 to 50 60 70 90 90 100
AK - M P a / m
High temperature fatigue crack growth rates in cast 12CrMoVsteel (G-X22CrMoV121) weldments [2]
File Rlf: Org. N o . Fig. S M . N o . 2 5
175

8/21/2019 Caso Rotura
http://slidepdf.com/reader/full/caso-rotura 188/200
base metal HAZ filler metal
3 0 0 -
O
> X
m in 2 5 0 -
Hardn
2 0 0 -
2. H a r d n e s s p r o f i l e , s p e c i m e n C 1.1
•
• — - e e ■ «<
I l - 3 - 2 - 1
i i
1 y^ | \ ^
1 f 1
1 ■ rJ—- r - ^ r -3 1 2 3
D i s t a n c e (mm)
u,
Fracture path in cast 12CrMoV steel (G-X22CrMoV121) weldment HTFCG testpiece (0.05<f<0.5Hz, t»»=0) [2]
Drg. No. Fig. S h t . N o . 2 6
176
8/21/2019 Caso Rotura
http://slidepdf.com/reader/full/caso-rotura 189/200
The Communities res earch an d developme ntinformation se rvice
C O R D I S
A vital p art of your p rogramme 'sdissemination strategy
CORDIS is the information service set up under the VALUE programme to give quick and easy accessto information on Eunpean Community research programmes. It is available froo of-charge online viathe European Commission host organization (ECHO), and now also on a newly released CD-ROM.
CORDIS offers the European R tD community:
— a comprehensive up-to-date view of EC R&TD activities, through a set of databases and relatedservices,
— quick and easy access to information on EC research programmes and results,— a continuously evolving C ommission service tailored to the needs of the research com munity and
industry,— full user support, including doc umentation, training and the CORDIS help desk.
Th e CORDIS Databasas are:
R&TD-programme s - R&TD-projects - R&TD-pa rtne rs - R&TD-resultsR&TD-publications - R&TD-comdocuments - R&TD-acrony ms - R&TD-news
Make sure your programme gains the maximum benefit from CORDIS
— Inform the CORDIS unit of your programme initiatives,— contribu te information regularly to CORDIS databases such as R&TD-news. R&TD-puohcations and
R&TD-programmes,— use CORDIS databases, such as R&TD-partners, in the implementation of your programme.— consult CORDIS for up-to-date information on other programmes relevant to your activities.
— inform your programme participants about CORDIS and the importance of their contnoution to theservice as well as the benefits w hich they will derive from it,
— contribute to the evolution of CORDIS by sending your comments on the service to ;ne CORDISUnit.
For more in formation about con tributing to CORDIS,con tact the DQ XIII CORDIS Unit
Brussels LuxembourgMs I. Vounakis M. B. Niessen
Tel. +(32) 2 299 0464 Tel. +(352) 4301 33638Fax +(32) 2 299 0467 Fax +(352) 4301 34989
To register for online access to CORDIS, contact:
ECHO Customer ServiceBP 2373
L-1023 LuxembourgTel. +(352) 3498 1240Fax +(352) 3498 1248
If you are already an ECHO user, please mention your customer number.

8/21/2019 Caso Rotura
http://slidepdf.com/reader/full/caso-rotura 190/200

8/21/2019 Caso Rotura
http://slidepdf.com/reader/full/caso-rotura 191/200

8/21/2019 Caso Rotura
http://slidepdf.com/reader/full/caso-rotura 192/200

8/21/2019 Caso Rotura
http://slidepdf.com/reader/full/caso-rotura 193/200

8/21/2019 Caso Rotura
http://slidepdf.com/reader/full/caso-rotura 194/200
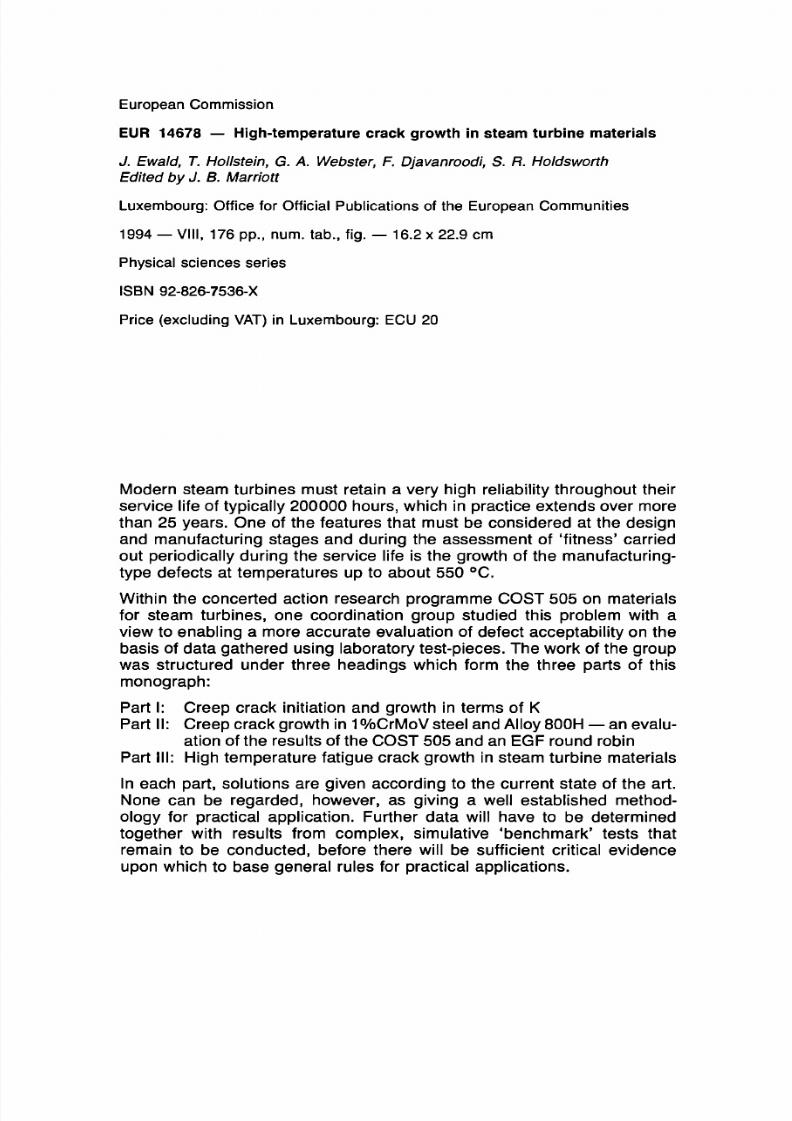
8/21/2019 Caso Rotura
http://slidepdf.com/reader/full/caso-rotura 195/200
European Commission
EUR 14678 — High-temperature crack growth in steam turbine materials
J. Ewald T. Hollstein, G. A. Webster F. Djavanroodi S. R. Holdsworth
dited by J. B. Marriott
Luxembourg: Office for Official Publications of the European Communities
1994 — VIII, 176 pp. , num. tab., fig. — 16.2 x 22.9 cm
Physical sciences series
ISBN 92-826-7536-X
Price (excluding VAT) in Luxembourg: ECU 20
Modern steam turbines must retain a very high reliability throughout theirservice life of typically 2000 00 hours, wh ich in practice extends over more
than 25 years. One of the features that must be considered at the designand manufacturing stages and during the assessment of 'fitness' carriedout periodically during the service life is the growth of the manufacturing-type defects at temperatures up to about 550 °C.
Within the concerted action research programme COST 505 on materialsfor steam turbines, one coordination group studied this problem with aview to enabling a more accurate evaluation of defect acceptability on thebasis of data gathered using laboratory test-pieces. The work of the groupwas structured under three headings which form the three parts of thismonograph:
Part I: Creep crack initiation and growth in term s of KPart II: Creep crack growth in 1 %C rMoV steel and Alloy 800H — an evalu
ation of the results of the CO ST 505 and an EGF round robinPart III: High tem perature fatigue crack grow th in steam turbine materials
In each part, solutions are given according to the current state of the art.None can be regarded, however, as giving a well established methodology for practical application. Further data will have to be determinedtogether with results from complex, simulative 'benchmark' tests thatremain to be conducted, before there will be sufficient critical evidence
upon which to base general rules for practical applications.

8/21/2019 Caso Rotura
http://slidepdf.com/reader/full/caso-rotura 196/200

8/21/2019 Caso Rotura
http://slidepdf.com/reader/full/caso-rotura 197/200

8/21/2019 Caso Rotura
http://slidepdf.com/reader/full/caso-rotura 198/200

8/21/2019 Caso Rotura
http://slidepdf.com/reader/full/caso-rotura 199/200
Venta y suscripciones • Salg og abonnement • Verkauf und Abonnement • nuAr¡oci<; Kai ouvCpoucc, Sales and subscriptions • Vente et abonnements • Vendita e abbonamenti
Verkoop en abonnementen • Venda e assinaturas
B E L G IQU E /B E L G IË
Ru « d» Louvam 42 / L e u v a n u w M 4 2
1000 Bruxelles
/ 1 0 0 0
Brussel
T « {021 51 2 » 2 6 Fa « ( 02 )511 01 8 4
Avenue du R a 20 2 / Koningslaen 2 02 1060 Bruxelles / 1 0 6 0 Brussei Te l (02) 53 8 51 69 Télex 63220 UNBOOK B Fa x (02) 53 8 OS 41
Autres rjrstributours/ Ovenge verkooppunten:
Ubcelr ie eu ropéenne ) E u r o p e t e boeknende l Ru e de la Loi 244/WetstreM 24 4 1040 Bruxe l les /1040 Brussel T « (021231 04 35 Fa x ( 0 2 , 7 3 5 08 6 0
Documen t delivery:
Breite Straße 78 -60 Postfach 1 0 0 5 3 4 50445 Köln Tel. (0 2 2 1 ) 2 0 20 -0 Telex ANZEIGER BONN 6 6 Fa x 2 02 92 7 8
GREECE /EAAAoA
G .C . De f tha roudek ia SA
trsernevonal Bookstore Nkrs Strest 4 10563 Aliisns Te l ( 0 1 ) 3 2 2 8 3 2 3 Telex 21B410ELEF Fa x 3 2 3 9 6 2 1
ESPAÑA
Trafalgar. 27 -29 28071 Madrid Tel. ( » 1 ) 5 3 6 22 9 5 Fa x (91) 53 6 23 4 9
reuma -P rense L lo ros , SA
C e s i e » . 37 28001 Madrid Te l (91)431 33 99 (Ubros)
43 1 32 2 2 (Susa ¿clones) 43 5 36 37 (a reccMin )
Telex 4 9 3 7 0 M P U - E Fex (91) 575 39 96 Sucursal:
Conssfo de Ciento. 39 1 06009 Barcelona Te l (93) 46 6 34 9 2 Fa x ( 9 3 ) 4 6 7 76 5 9
d a C e W u n y e
Rambla dsfs Eshjdrs, 11 8 (P i 08002 Barcelona Tel (93)302 6635 Ta l 9 3 ) 3 0 2 64 6 2 Fa x (93) 3 02 12 9 9
FRANCE
Service de s pubNcattono
26 . ru e D e s t o 75727 Pans Cedex ÍS Tel. ( 1 ) 4 0 56 77 01131 Fa x ( 1 ) 4 0 56 7 7 0 0
IRELAND
Go v e r n m e n l SuppSse Agency
4- 5 Harcourt Roed Durjun2
Ta l ( 1 ) 6 6 1 3 11 1 Fa x ( 1 ) 4 7 60 64 5
ITALIA
Licosa Sp A
vi a Duca rj C a l e b ™ 1/1
50125 Firenze Te l ( 0 5 5 ) 6 4 5 4 1 5 Fa x 64 12 57 Telex 570466 L ICOSA I
GRAND -DUCHÉ D E L U X E M B OU R G
5. ru e Raiftetsen 2411 üjxernbourg Te l 4 0 10 2 0 Fa x 4 9 06 6 1
Ru e de la Montagna 3 4 / rlergatraal 34 B t e 1 1 / B u s 1 1 1000 Bruxelles / 1 0 0 0 Brussel
Te l
( 0 2 ) 5 1 1 6 9 41
Fa x (02) 51 3 31 9 5
DANMARK ~
J. H. Schüret IrytonTajIion AVS
Herstedvang 10-12 2620 Albertslund TU 4363 23 00 Fa x (Sales) 43 63 19 6 9 Fa x (Managarnsnl) 4 3 S 3 1 9 4 9
DEUTSCHLAND
N E D E R L A N D
S O U C
Externe Fondsen Postbus 20014 25 (»EA 's -Grave r ihaga Ta l . (070) 3 7 69 88 0 Fa x 0 7 0 3 7 89 7 83
P OR T U GA L
k n p r a n u Newton i i
Casa da Moeda . E P Ru a D Francisco Manual de Malo. 5 1092 UsboB Codex Te l . ( 0 1 ) 6 9 34 14 Fa x (Ol) 69 3 1 66
D t s W b u k k x a d e U v r o e Be r t r a nd , L d . '
Gr u p o rsertrend, S A
Ru a da s Terras do s Valea, 4- A Apartado 37 2700 Amadora Codex Te l . ( 0 1 ) 4 9 5 9 0 50 Telex 15798 BERD IS Fax 49 60 255
UN ITED K IN GD OM
H U S O B o o k e (Agency section)
H M S O Publications Centre 51 rene Elms Lene London S W 8 5D R Tel. 1071)873 9090 Fax 873 8463 Telex 2 9 71 13 8
ÖS T E R R E IC H
nz sche Verìoge-d Urttvera ltå tabucftrrendhe
Kohlmarld16 1014 Wien Te l . ( 1 ) 5 3 1 6 1 0 T e l e x 1 1 2 50 0 B O X A Fa x (1 ) 53 1 61-161
SUOMI /F INLAND
eUuMsMftsiflsMI Ke^oeKrMjppia
K4*kuska tu1
P O Box 21 8 00381 HaêsinM T U . (0 ) 12 1 41 Fa x ( 0 ) 1 2 1 44 4 1
N O R G E .
NsHWsMn In to Csn l tc Bertrand Narveaons ve l 2 P O Box 6125 Enerstad 0602 Celo 6 Te l . (22) 57 33 0 0 Telex 79666 N IC N Fa x (22) 68 19 01
S V E R IGE
B T J A B
T raMMvgen 13 22100 Lund Te l (046) 18 M 0 0 F a s ( 0 4 6 ) 1 6 0 1 2 S
3 0 7 9 4 7
Skòlavordustlg. 2
10 1 Reykiavik T e l . 1 1 56 50
S C H W E IZ / SU ISSE / SV IZZERA
StamrjrenbectiatraBe 65 8035 Zurich Te l . ( 0 1 ) 3 6 5 5 4 4 9 Fa x ( 0 1 ) 3 6 5 5 4 11
Europ rees Kleeetce BK U d
66 . bdVitosha 1463 Sofia T e l / F a x 2 52 74 75
CESKÁ REPUBLIKA
H a v e k o v a 2 2 13 0 00 Praha 3 Te l . (2 ) 24 22 94 33 Fa x (2 ) 24 22 14 84
M A GY A R OR S Z A G
IS. Krucza 38 /42 00 -512 Warszawa Te l . (2 ) 62 1 99 93 , 6 2 6 - 2 8 4 2 International Fax&Phone (0-39) 12-00-77
ROMAN IA
65 . Strada Dionisio Lupu 70184 Bucuresti T e U F s x 0 1 2 9 6 4 6
9.604etiya Oktyabrya Avenue 117312MOSOOW Tel/Fax (095) 1355227
SLOVAK IA
S lovak Techn ica l U b r a r y
N m slobody 19 61 2 23 Bratislava 1 Te l . ( 7 ) 2 2 0 4 5 2
Fa x : (7 ) 29 5 78 5
C Y P R U S
Cyp ruaC I ndue t ry
Chamber Buerjng 38 Gnvas Drageres A 3 Deligkxgis Street P O Box 1455
I. (2) 449500/462312 X (2) 456630
LO A OS M e t a Te l . 6 6 44 88 Fa x 6 7 6 7 9 9
TÜRKJYE
Pree Gaze te Krtep Dergl Paze r ieme DeøtOTi T ica re t v e A Ş
r fe iaoaehe Sokak N 15 btanbutCagaloglu Tel. (I) 52 0 92 96 - 52 8 55 66 Fa x 5 20 64 57 Telex 23622 DSVO-TR
ISRAEL
R O Y hitorrratunal
P O Bo x 13056 41 Mishmar Hayardan Street Te l Aviv 61130 Tel. 3 496106 F a x 3 6 4 8 6 0 3 9
4 1 S h e r i l S l Cairo Tel/Fax 39 39 73 2
UN ITED S T A T E S O F AMER ICA / CANADA
Lanham . M D 20706 -4391 Te l . Toll Free (800) 27 4 4688 Fa x (301) 4 59 0056
Subscript ions only Un iquemen t a tex inemen ts
R e n o u l Pub l ish ing C o. Lt d
1294 Algoma Road Ottawa. Ontario K1 B 3 W 8 Te l . (613) 74 1 4 3 33 Fa x (613) 74 1 54 3 9 Telex 0534783
AUSTRALIA Hun te r ftablteeoone 56 A Glpps Street CcVtingwocd
Victorie 3066 Te l . ( 3 ) 4 1 7 5 3 6 1 Fa x ( 3 ) 4 1 9 7 1 5 4
JAPAN
IGnokiinrya Company Lt d
17-7 S»n luku 3-Chome ShinfukLhku Tokyo 160-91 Te l . (03) 34394 )121
tJountM DopArtUoSfit P O Box 55 Ctirlose Tokyo 15 6 Te l . (03) 3439 -0124
S OU T H -E A S T ASIA
Lega l U b r e r y Serv ices Lt d
Orchard P O Bo x 0523 Singapore 9123
Te l 7 3 0 4 24 1 F a i 24 3 2 4 7 9
S OU T H AFR ICA
Serlo 5t h Floor. Expon House O r Maude 6 Wea l Streets Sandten 2146 T e l . ( 0 1 1 ) 6 6 3 4 7 3 7 Fa x ( 011 )863 -6569
A U T R E S PAYS OT H E R C OU N T R IE S A N D E R E LANDER
Of f ice d ee p u M c a U o t r a órnetenos
2. ru e Merrier 2965 Luxembourg T e l . 4 9 9 2 6 - 1 T e k s x P U B O F L U 1 3 2 4 b F ax 4 6 85 73 /48 66 17
I f f i U I W ^ ^
8/21/2019 Caso Rotura
http://slidepdf.com/reader/full/caso-rotura 200/200
NOTICE TO THE READER
All scientific and technical reports published by the EuropeanCommission are announced in the monthly periodical 'euroabstracts'. For subscription (1 year: ECU 60) please write to theaddress below.
o9z>


