Page 1
CATALOGING AND STATISTICAL EVALUATION OF COMMON MISTAKES
IN GEOTECHNICAL INVESTIGATION REPORTS FOR BUILDINGS ON
SHALLOW FOUNDATIONS
A THESIS SUBMITTED TO
THE GRADUATE SCHOOL OF NATURAL AND APPLIED SCIENCES
OF
MIDDLE EAST TECHNICAL UNIVERSITY
BY
GÖKHAN ÖZYURT
IN PARTIAL FULFILLMENT OF THE REQUIREMENTS
FOR
THE DEGREE OF MASTER OF SCIENCE
IN
CIVIL ENGINEERING
SEPTEMBER 2012
Page 2
Approval of the thesis:
CATALOGING AND STATISTICAL EVALUATION OF COMMON
MISTAKES IN GEOTECHNICAL INVESTIGATION REPORTS FOR
BUILDINGS ON SHALLOW FOUNDATIONS
submitted by GÖKHAN ÖZYURT in partial fulfillment of the requirements for the
degree of Master of Science in Civil Engineering Department, Middle East
Technical University by;
Prof. Dr. Canan Özgen
Dean, Graduate School of Natural and Applied Sciences
Prof. Dr. Güney Özcebe
Head of Department, Civil Engineering
Inst. Dr. N. Kartal Toker
Supervisor, Civil Engineering Dept., METU
Examining Committee Members:
Prof. Dr. Orhan Erol
Civil Engineering Dept., METU
Inst. Dr. N. Kartal Toker
Civil Engineering Dept., METU
Prof. Dr. Erdal Çokça
Civil Engineering Dept., METU
Asst. Prof. Dr. Nejan Huvaj Sarıhan
Civil Engineering Dept., METU
Dr. Orhan Bülent Kiper
Bülent Kiper Eng. Comp., ANKARA
Date: 14.09.2012
Page 3
iii
I hereby declare that all information in this document has been obtained and
presented in accordance with academic rules and ethical conduct. I also declare
that, as required by these rules and conduct, I have fully cited and referenced
all material and results that are not original to this work.
Name, Last Name: Gökhan ÖZYURT
Signature:
Page 4
iv
ABSTRACT
CATALOGING AND STATISTICAL EVALUATION OF COMMON
MISTAKES IN GEOTECHNICAL INVESTIGATION REPORTS FOR
BUILDINGS ON SHALLOW FOUNDATIONS
ÖZYURT, Gökhan
M.Sc., Department of Civil Engineering
Supervisor: Inst. Dr. N. Kartal TOKER
September, 2012, 113 pages
Information presented in site investigation reports has a strong influence in design,
project costs and safety. For this reason, both the quality and the reliability of site
investigation reports are important. However in our country, geotechnical
engineering is relegated to second place and site investigation studies, especially
parcel-basis ground investigation works; do not receive the attention they deserve. In
this study, site investigation reports, that are required for the license of design
projects, are examined and the missing/incorrect site investigations, laboratory tests,
geotechnical evaluations and geotechnical suggestions that occur in the reports are
catalogued. Also, frequency of each mistake is statistically examined; for
geotechnical engineers, recommendations and solutions are presented to help them
avoid frequent problems.
Key words: Geotechnical report, site investigation, in-situ testing, laboratory
testing, shallow foundations, geotechnical engineering.
Page 5
v
ÖZ
SIĞ TEMELLİ BİNALAR İÇİN HAZIRLANAN GEOTEKNİK ETÜT
RAPORLARINDAKİ YAYGIN HATALARIN BELİRLENMESİ VE
İSTATİSTİKSEL DEĞERLENDİRİLMESİ
ÖZYURT, Gökhan
Yüksek Lisans, İnşaat Mühendisliği Bölümü
Tez Yöneticisi: Inst. Dr. N. Kartal TOKER
Eylül, 2012, 113 sayfa
Zemin etüt raporlarında sunulan bilgilerin, yapılacak olan yapının tasarımı, maliyeti
ve dayanıklılığı üzerindeki etkisi büyüktür. Bu nedenle etüt raporlarının kalitesi ve
güvenilirliği önem arz etmektedir. Ancak ülkemizde, geoteknik mühendisliği ikinci
plana itilmekte ve özellikle parsel bazındaki zemin etüt incelemelerine gereken
önem verilmemektedir. Bu çalışmada, yapıların ruhsatına esas üstyapı projelerinin
hazırlanması için gerekli olan ada/parsel bazında zemin-temel etüdü raporlarının
incelenmesi yapılmış olup, bu raporlardaki yanlış/eksik arazi araştırmaları,
laboratuvar çalışmaları, geoteknik hesaplar ve geoteknik öneriler tespit edilmeye
çalışılmıştır. Ayrıca, bulunan hata ve eksikliklerin istatistiksel değerlendirilmesi
yapılmış, geoteknik mühendislerinin sıkça karşılaşılan hatalardan kaçınmasını
kolaylaştıracak tavsiyeler ve çözüm yolları sunulmuştur.
Anahtar kelimeler: Geoteknik rapor, saha araştırmaları, arazi testleri, laboratuvar
testleri, sığ temeller, geoteknik mühendisliği.
Page 6
vi
ACKNOWLEDGEMENTS
The author would like to express his deepest gratitude to Inst. Dr. N. Kartal Toker
for his theoretical support, guidance, criticism and encouragement throughout all
stages of the study.
The author would like to thank to his mother Şemsi Özyurt, his father Musa Özyurt,
his grandmother Sultan Danacı, his aunt Şenay Türk Danacı, and his uncle Halil
Danacı for their patience, love and encouragement during the preparation of this
thesis. Sincere thanks are extended to other family members and friends for their
support and encouragement whenever needed.
The author would like to express his thanks to 5th
Division of Hydraulic Works for
positive approach and acknowledgement of this study.
The author also would like to thank to Hüseyin Erdoğan, Mahir Akyurt for their
guidance of obtainment of the necessary geotechnical reports from the
municipalities.
Finally, the author would like to express sincere thanks to Gözde Çelik for her
patience, technical support and guidance.
Page 7
vii
TABLE OF CONTENTS
ABSTRACT .............................................................................................................. iv
ÖZ ............................................................................................................................... v
ACKNOWLEDGEMENTS ..................................................................................... vi
TABLE OF CONTENTS ........................................................................................ vii
LIST OF TABLES .................................................................................................... x
LIST OF FIGURES ................................................................................................ xii
LIST OF ABBREVIATIONS ............................................................................... xiv
CHAPTERS
1. INTRODUCTION ................................................................................................. 1
1.1 Research Motivation .......................................................................................... 1
1.2 Purpose and Scope ............................................................................................. 2
1.3 Outline of Thesis ............................................................................................... 3
2. SITE INVESTIGATION ...................................................................................... 4
2.1 Phases of Site Investigation ............................................................................... 5
2.1.1 The desk study and walk over survey ......................................................... 6
2.1.2 Surface investigation (Geophysical exploration) ........................................ 7
2.1.3 Sub-Surface investigation ........................................................................... 8
2.1.3.1 Subsurface exploration planning .......................................................... 8
2.1.3.2 Recovery of samples and cores .......................................................... 12
2.1.3.2.1 Soil sampling ............................................................................... 12
2.1.3.2.2 Coring of rocks ............................................................................ 14
2.1.3.2.3 Sampling interval and appropriate type of sampler .................... 15
2.1.3.2.4 Sample quality ............................................................................. 17
2.1.3.3 Groundwater observations ................................................................. 17
2.1.4 In-situ geotechnical tests ........................................................................... 18
2.1.5 Laboratory testing ..................................................................................... 24
2.1.5.1 Laboratory testing for soils ................................................................ 26
2.1.5.2 Laboratory testing of rocks ................................................................ 34
Page 8
viii
3. FOUNDATION DESIGN ................................................................................... 36
3.1 Bearing Capacity of Foundations .................................................................... 36
3.1.1 Bearing capacity of shallow foundations .................................................. 38
3.1.1.1 Effect of water table ........................................................................... 41
3.1.2 Bearing capacity of layered subsoil .......................................................... 41
3.1.3 Bearing capacity of shallow foundations on rock ..................................... 45
3.2 Bearing Capacity from Field Tests .................................................................. 47
3.2.1 Bearing capacity from SPT ....................................................................... 47
3.2.2 Bearing capacity from CPT ...................................................................... 48
3.2.3 Bearing capacity from PMT ..................................................................... 49
3.3 Foundation Settlements ................................................................................... 50
3.3.1 Immediate settlement calculations ............................................................ 51
3.3.2 Primary consolidation settlement calculations ......................................... 52
3.3.3 Secondary consolidation settlement calculations ..................................... 54
3.4 Structural Tolerance to Settlement and Differential Settlements .................... 54
3.5 Modulus of Subgrade Reaction ....................................................................... 55
4. GEOTECHNICAL REPORT ............................................................................ 58
4.1 What is Geotechnical Report? ......................................................................... 58
4.2 General Information ........................................................................................ 59
4.3 Field Studies and Tests .................................................................................... 61
4.4 Laboratory Tests and Experiments .................................................................. 61
4.5 Engineering Analyses and Evaluations ........................................................... 61
4.6 Conclusions and Recommendations ................................................................ 62
4.7 References and Appendices ............................................................................. 62
5. EVALUATION OF GEOTECHNICAL REPORTS ....................................... 63
5.1 Methodology ................................................................................................... 63
5.2 Results ............................................................................................................. 68
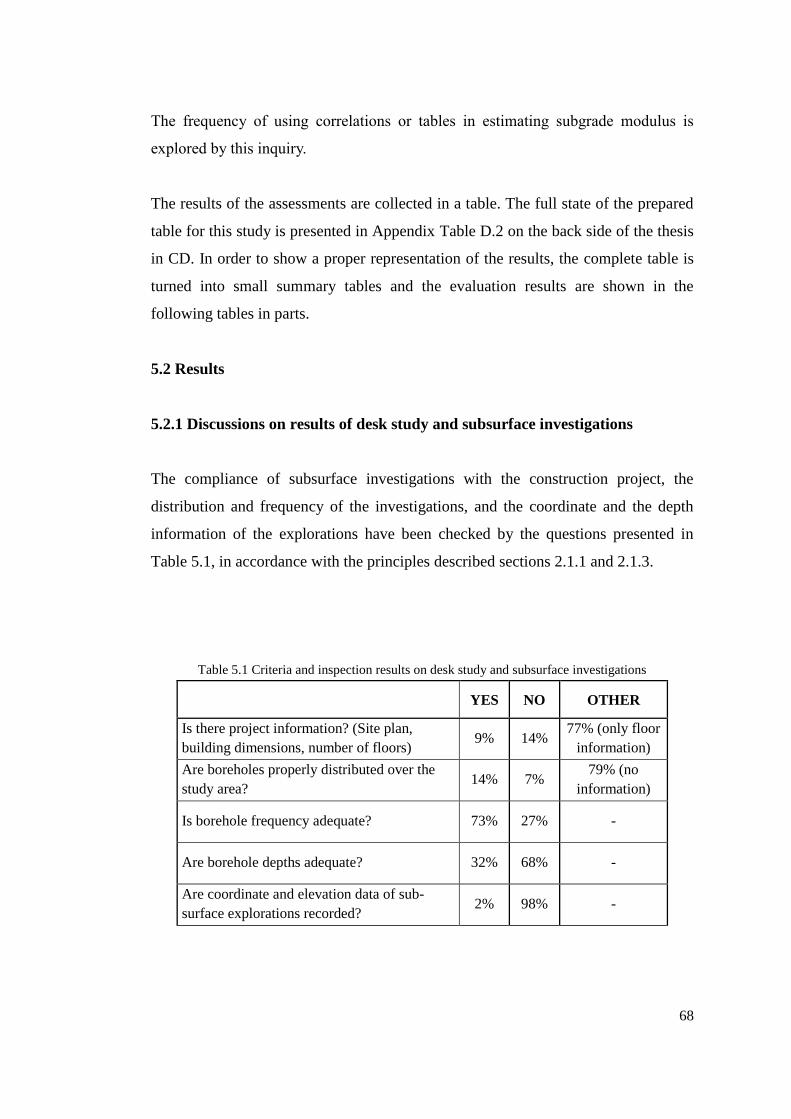
5.2.1 Discussions on results of desk study and subsurface investigations ........ 68
5.2.2 Discussions on results of sampling ........................................................... 69
5.2.3 Discussions on results of in-situ tests ....................................................... 70
5.2.4 Discussions on results of laboratory experiments..................................... 71
5.2.5 Discussions on results of foundation calculations .................................... 73
Page 9
ix
6. CONCLUSION AND RECOMMENDATIONS .............................................. 76
6.1 Conclusion ....................................................................................................... 76
6.2 Technical Recommendations .......................................................................... 77
6.3 Policy Recommendations ................................................................................ 78
6.4 Recommendations to Widen the Scope for Future Work ................................ 79
REFERENCES ........................................................................................................ 80
APPENDICES
A. SITE INVESTIGATION ................................................................................... 86
B. FOUNDATION DESIGN .................................................................................. 99
C. GEOTECHNICAL REPORT ......................................................................... 109
D. EVALUATION OF GEOTECHNICAL REPORTS .................................... 111
Page 10
x
LIST OF TABLES
TABLES
Table 2.1 Geotechnical requirements (Look, 2007).................................................... 5
Table 2.2 Desk study and walkover survey checklist for low-rise buildings (Building
Research Establishment, 1987) ............................................................................ 7
Table 2.3 Guidelines for boring layout (Day, 2006) ................................................... 9
Table 2.4 Common soil sampling methods (Mayne et al., 2001) ............................. 13
Table 2.5 Factors affecting the SPT (after Kulhawy and Mayne, 1990) .................. 20
Table 2.6 Corrections to the SPT (Skempton, 1986) ................................................ 21
Table 2.7 AASHTO, ASTM and Turkish Standards for frequently used laboratory
testing of soils and rocks .................................................................................... 25
Table 3.1 Summary of type of bearing capacity failure versus soil properties (Day,
2006) .................................................................................................................. 38
Table 3.2 Tolerable differential settlement of buildings (Skempton and MacDonald,
1956) .................................................................................................................. 55
Table 3.3 Range of modulus of subgrade reaction (Bowles, 1996) .......................... 57
Table 4.1 General report format of geotechnical investigations for ordinary buildings
(Ministry of Environment and Urbanism, 2005) ............................................... 60
Table 5.1 Criteria and inspection results on desk study and subsurface investigations
........................................................................................................................... 68
Table 5.2 Criteria related to sampling and core recovery, and the percentage values
of the results ....................................................................................................... 69
Table 5.3 Criteria related to in-situ tests and the percentage values of the
examination results ............................................................................................ 70
Table 5.4 Criteria related to laboratory experiments and the results of inspection in
percentage .......................................................................................................... 72
Table 5.5 Criteria related to foundation design and the results of inspection in
percentage .......................................................................................................... 73
Page 11
xi
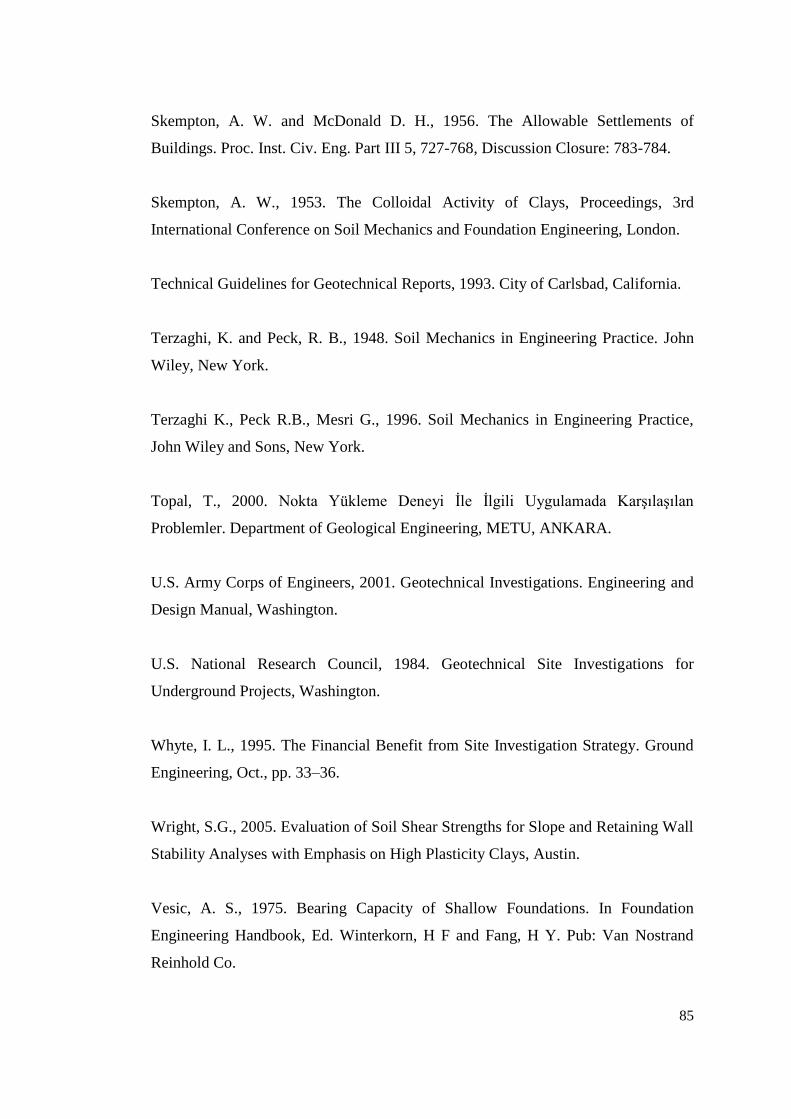
Table A.1 Application of selected geophysical methods for determination of
engineering parameters (US Army Corps of Engineers, 2001) ......................... 86
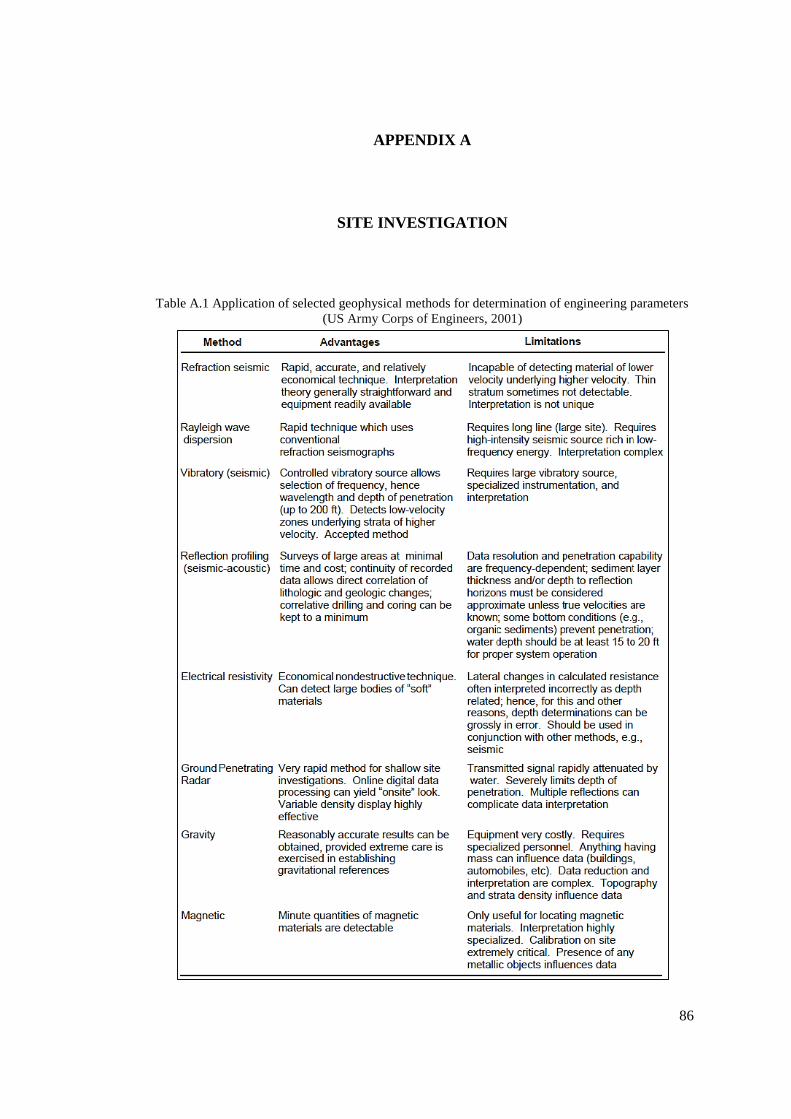
Table A.2 Numerical rating of geophysical methods to provide specific engineering
parameters for engineering applications (US Army Corps of Engineers, 2001) 87
Table A.3 Sampling tools and methods (Hunt, 2005) ............................................... 90
Table A.4 Specimen quality in terms of volumetric strain (Terzaghi et al., 1996) ... 92
Table A.5 In-situ test methods and general application (Bowles, 1996) .................. 92
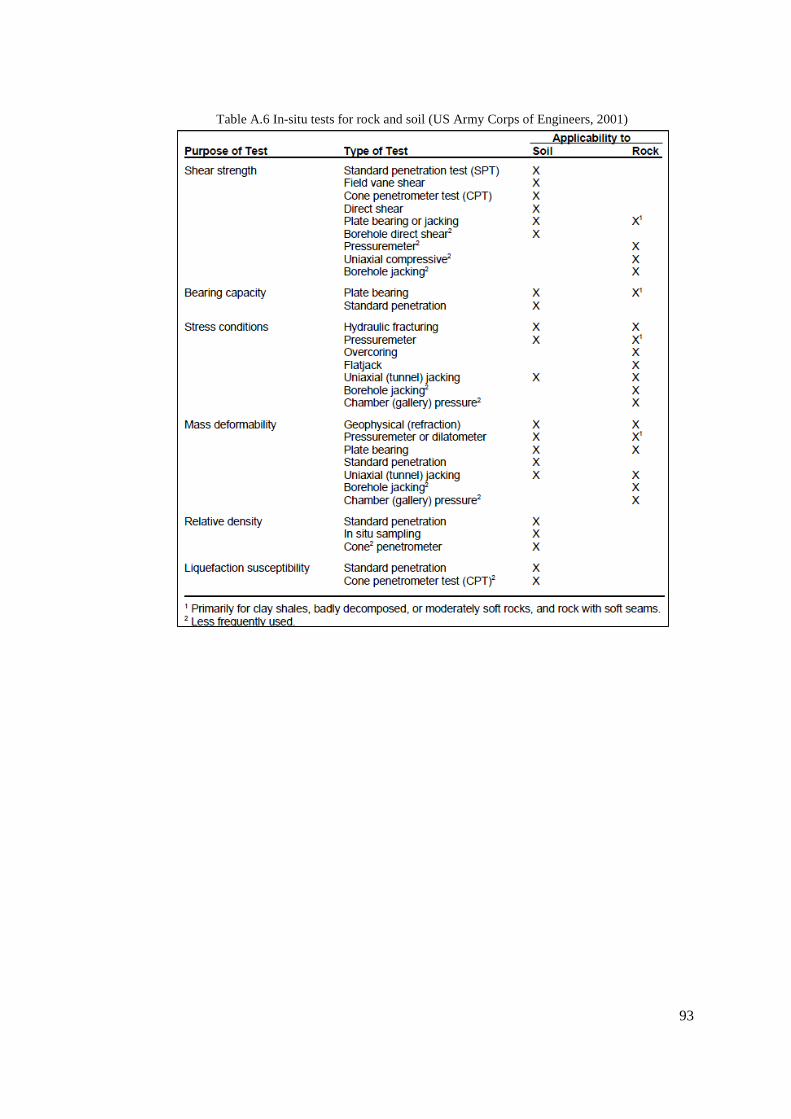
Table A.6 In-situ tests for rock and soil (US Army Corps of Engineers, 2001) ....... 93
Table A.7 Typical values of liquid limit, plastic limit, and activity of some clay
minerals (Mitchell, 1976; Skempton, 1953) ...................................................... 96
Table A.8 Unified soil classification system (American Society for Testing and
Materials, 1985) ................................................................................................. 97
Table A.9 Conversion factors, k, by various researchers (Topal, 2000) ................... 98
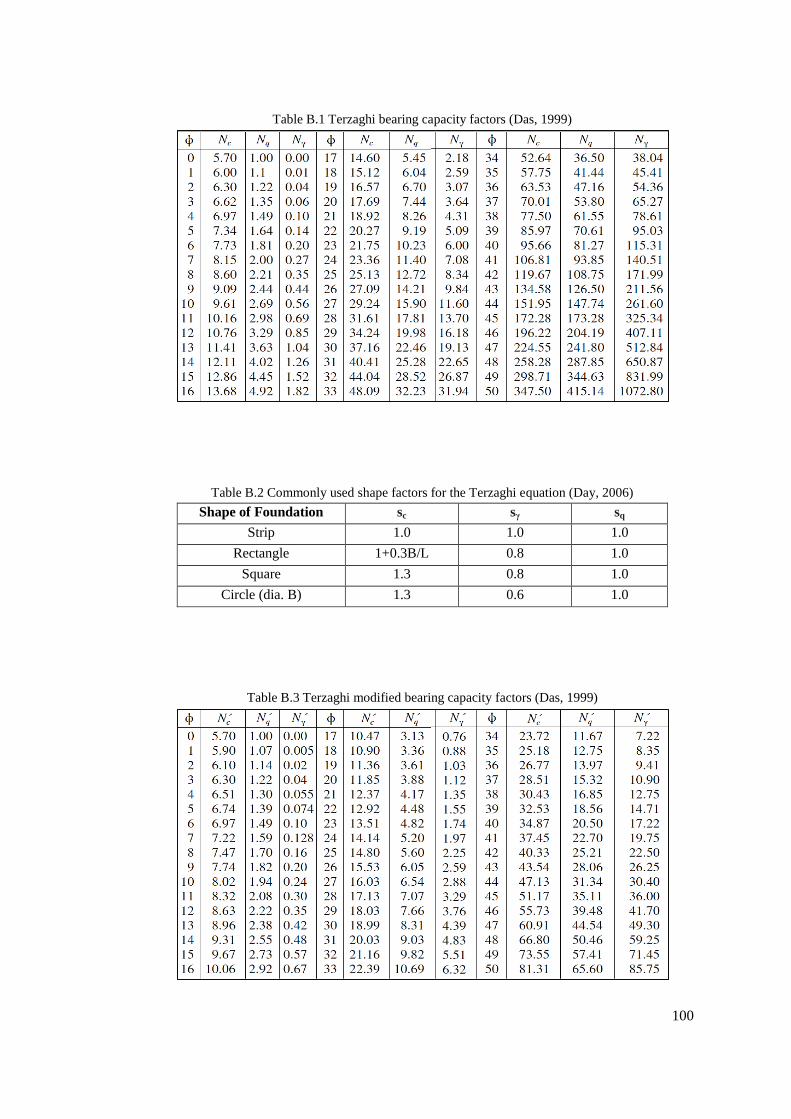
Table B.1 Terzaghi bearing capacity factors (Das, 1999) ....................................... 100
Table B.2 Commonly used shape factors for the Terzaghi equation (Day, 2006) .. 100
Table B.3 Terzaghi modified bearing capacity factors (Das, 1999) ....................... 100
Table B.4 Meyerhof bearing capacity factors (Das, 1999) ..................................... 101
Table B.5 Meyerhof shape factors (Das, 1999) ...................................................... 101
Table B.6 Meyerhof depth factors (Das, 1999)....................................................... 101
Table B.7 Approximate relationships between rock mass quality and material
constants used in defining nonlinear strength (Hoek and Brown, 1988) ......... 103
Table B.8 Suggested values for Poisson’s ratio, µ (Das, 1999) .............................. 104
Table B.9 Elasticity modulus, Es (Erol, 2009) ........................................................ 104
Table B.10 Shape and rigidity factors Is (NAVFAC DM, 1982) ............................ 105
Table B.11 Correlation equations for soil compressibility/consolidation (Bowles,
1996) ................................................................................................................ 107
Table B.12 Values of geological factor μg (Skempton-Bjerrum, 1957) ................. 107
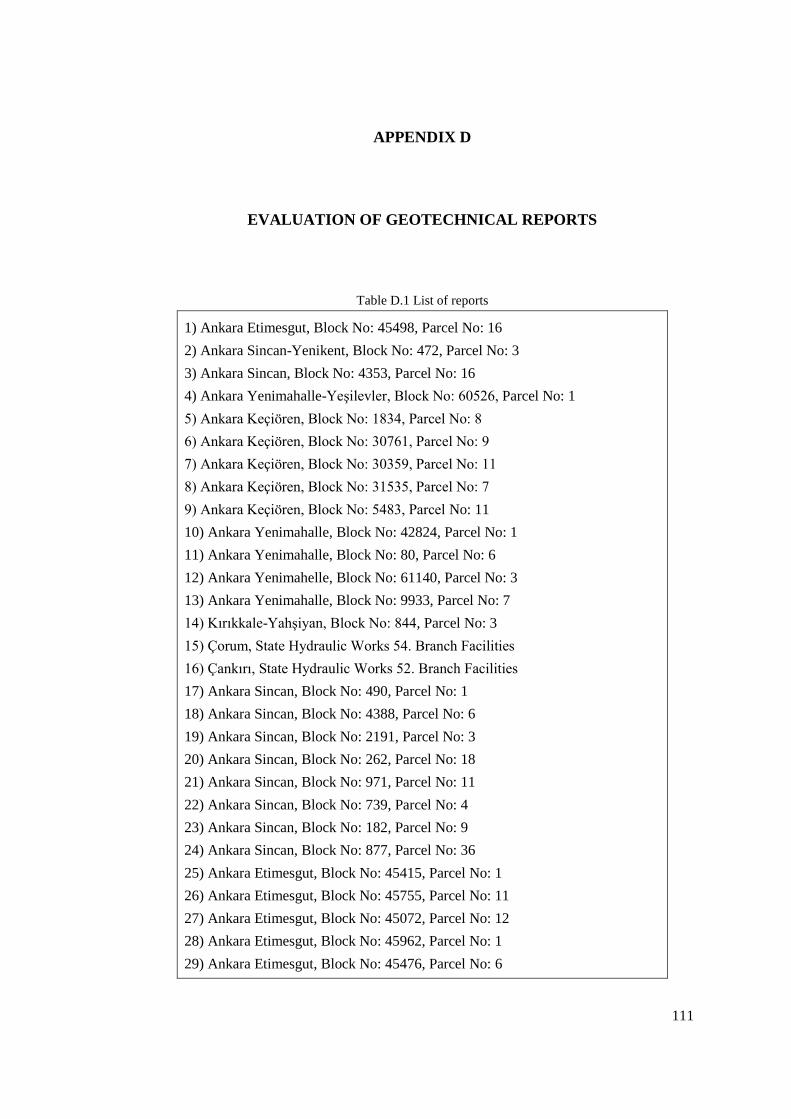
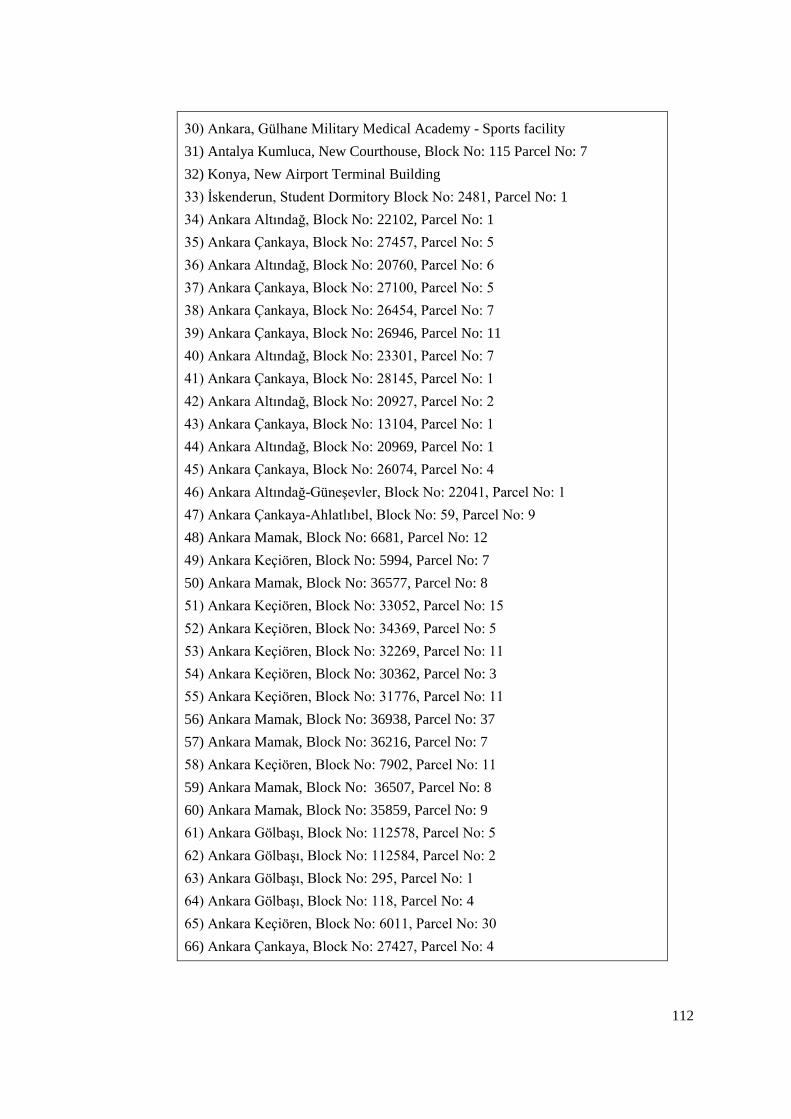
Table D.1 List of reports ......................................................................................... 111
Table D.2 Evaluation criteria and results (On the back side of the thesis in CD)
Page 12
xii
LIST OF FIGURES
FIGURES
Figure 2.1 Necessary borehole depths for foundations (Clayton et al., 1995). ......... 11
Figure 2.2 Common sampling tools for various soil and rock conditions (Hunt,
2005). ................................................................................................................. 16
Figure 2.3 Sequence of driving split-barrel sampler during the SPT (Mayne et al.,
2001). ................................................................................................................. 19
Figure 2.4 Procedures and components of the cone penetration test (Mayne et al.,
2001). ................................................................................................................. 23
Figure 2.5 Idealized graph of e-log σ′v for obtaining parameters (Mayne et al., 2001).
........................................................................................................................... 30
Figure 2.6 Representative stress-strain curve for unconfined compressive test
(Mayne et al., 2001). .......................................................................................... 31
Figure 2.7 Equivalent linear representation of Mohr failure envelope for undrained
shear strength of an unsaturated soil (Wright, 2005). ........................................ 32
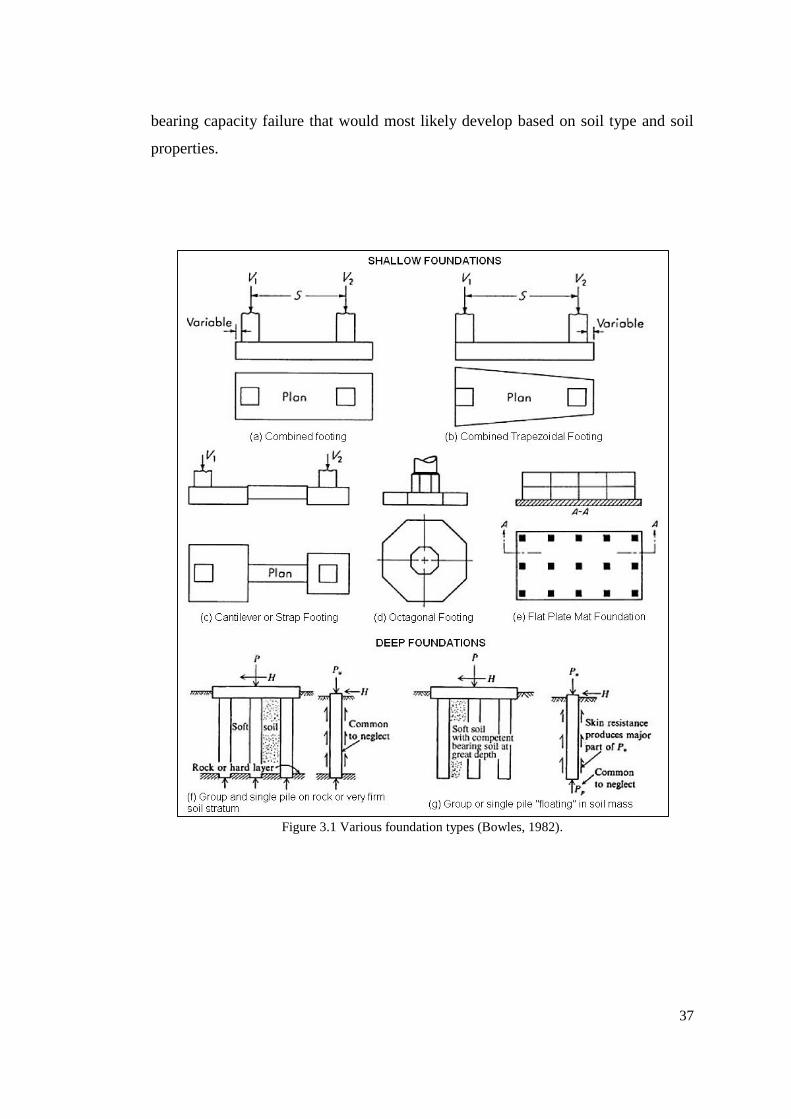
Figure 3.1 Various foundation types (Bowles, 1982). .............................................. 37
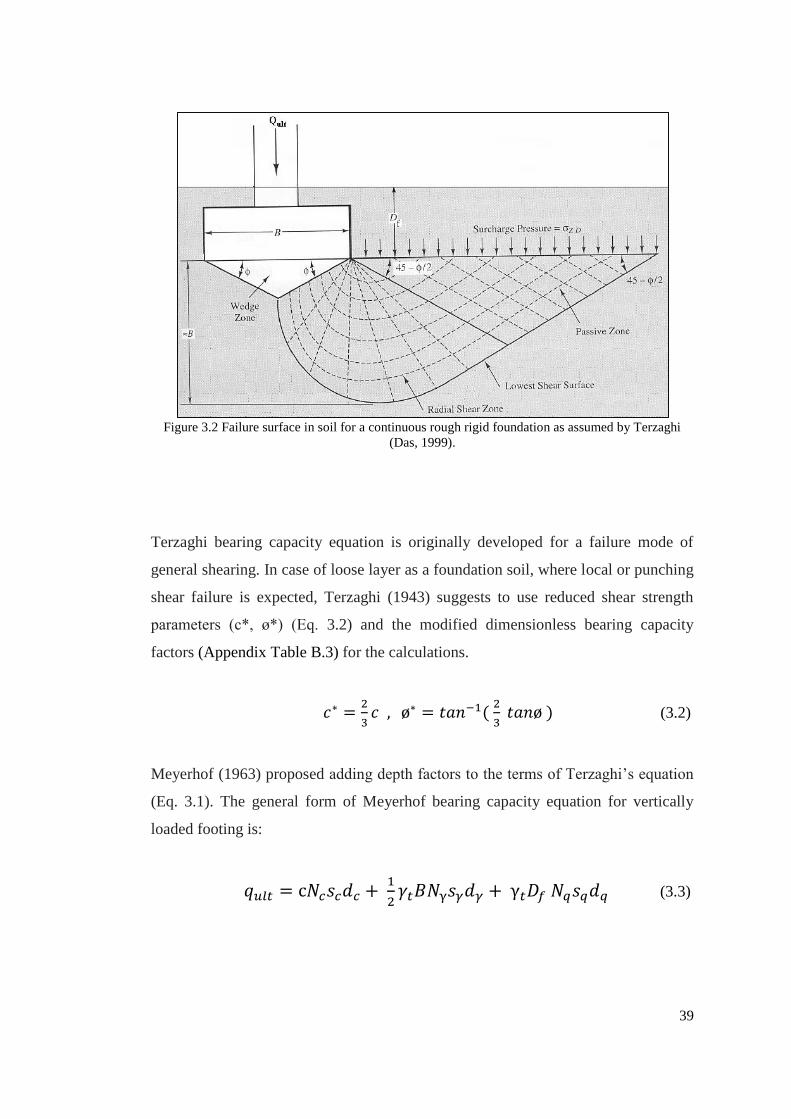
Figure 3.2 Failure surface in soil for a continuous rough rigid foundation as assumed
by Terzaghi (Das, 1999). ................................................................................... 39
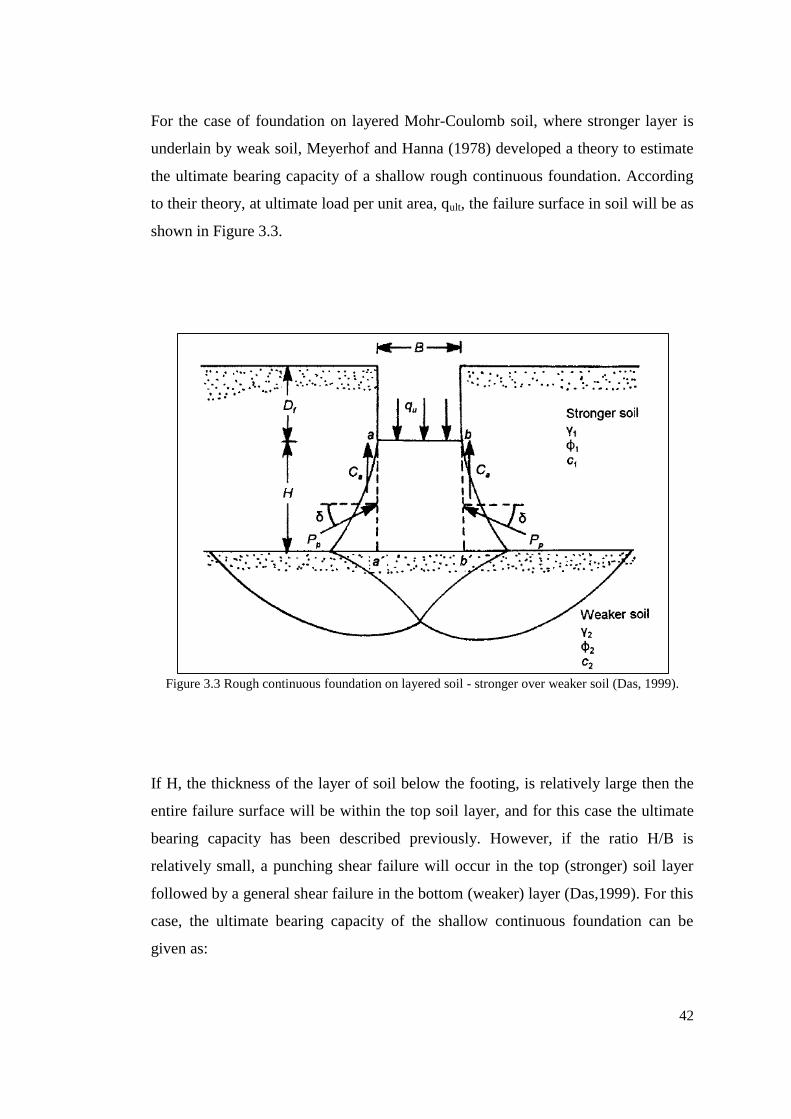
Figure 3.3 Rough continuous foundation on layered soil - stronger over weaker soil
(Das, 1999)......................................................................................................... 42
Figure 3.4 Foundation on weaker soil layer underlain by stronger layer (Das, 1999).
........................................................................................................................... 44
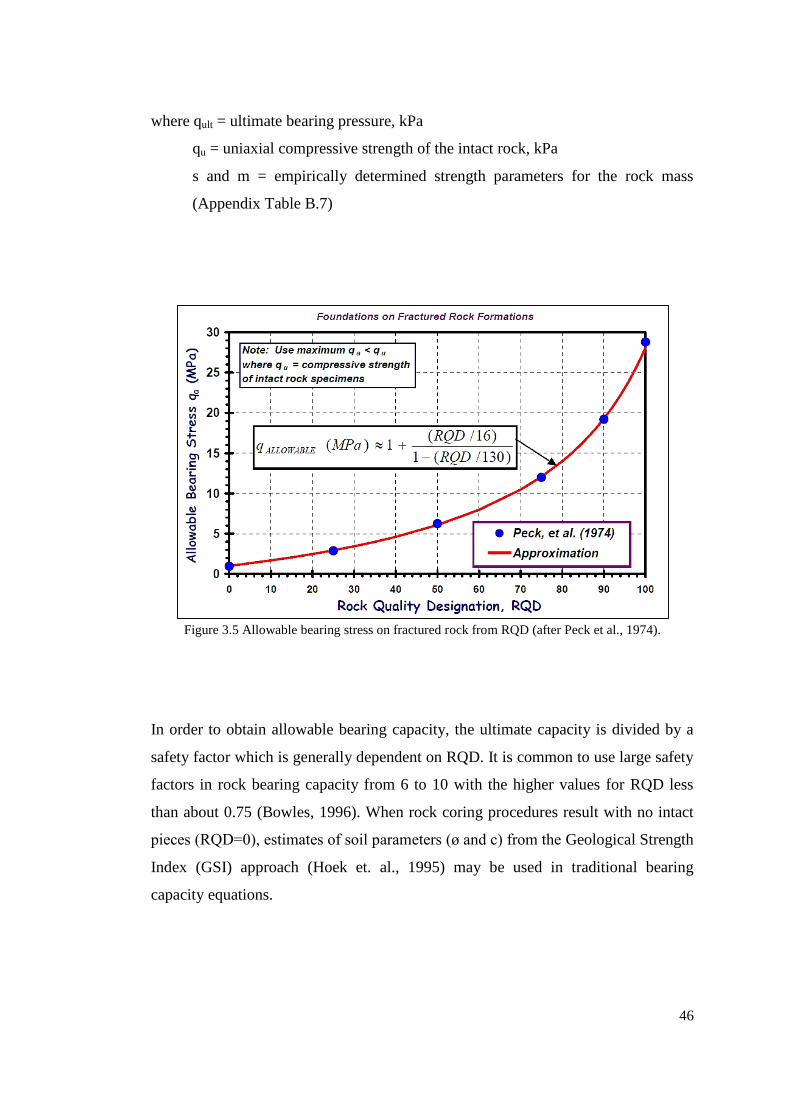
Figure 3.5 Allowable bearing stress on fractured rock from RQD (after Peck et al.,
1974). ................................................................................................................. 46
Figure 5.1 Bearing capacity calculation methods used in reports for shallow
foundations on soil. ............................................................................................ 75
Page 13
xiii
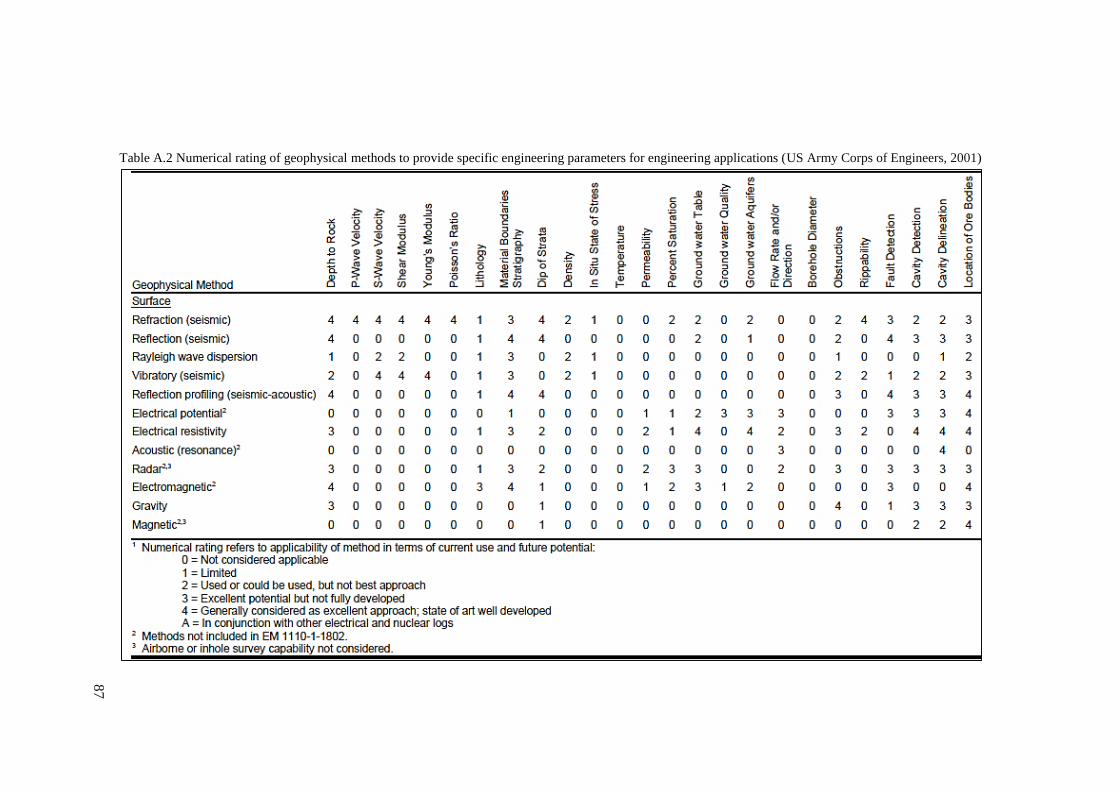
Figure A. 1 a) Single tube core barrel, b) rigid type double tube core barrel, c) swivel
type double tube core barrel (Mayne et al., 2001). ............................................ 88
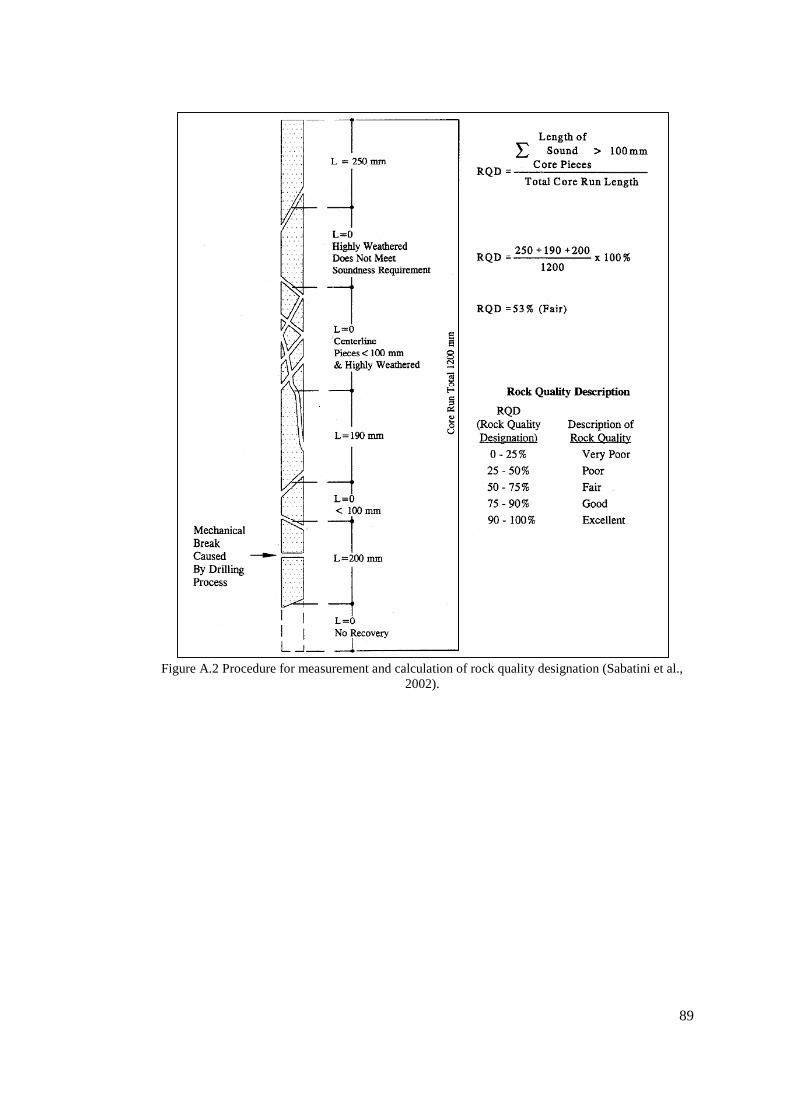
Figure A.2 Procedure for measurement and calculation of rock quality designation
(Sabatini et al., 2002). ........................................................................................ 89
Figure A.3 Classification of soil based on CPT test results (Robertson and Wride,
1997). ................................................................................................................. 94
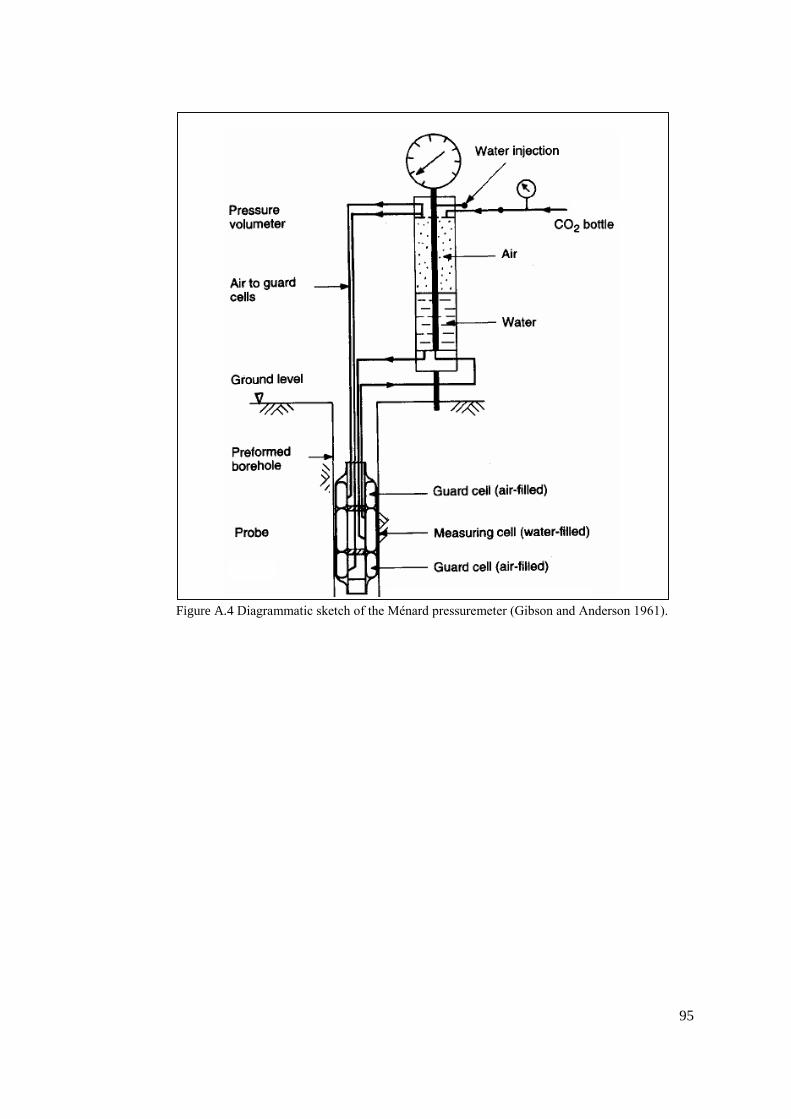
Figure A.4 Diagrammatic sketch of the Ménard pressuremeter (Gibson and
Anderson 1961).................................................................................................. 95
Figure A.5 Representative grain size distribution curve (San Diego State University
Geo. 552 lec. notes, 2011). ................................................................................ 96
Figure A.6 The point load tester (Rusnak, 2000). ..................................................... 97
Figure B.1 Modes of bearing capacity failure (Vesic, 1973). ................................... 99
Figure B.2 Unit adhesion, ca (Das, 1999). .............................................................. 102
Figure B.3 Punching shear coefficient, Ks (Das, 1999). ......................................... 102
Figure B.4 Values of empirical capacity coefficient, k (After Canadian Geotechnical
Society, 1988). ................................................................................................. 104
Figure B.5 Factors for calculating the average immediate settlement (after Christian
and Carrier, 1978). ........................................................................................... 106
Figure B.6 Determination of modulus of subgrade reaction (Das, 2011) ............... 108
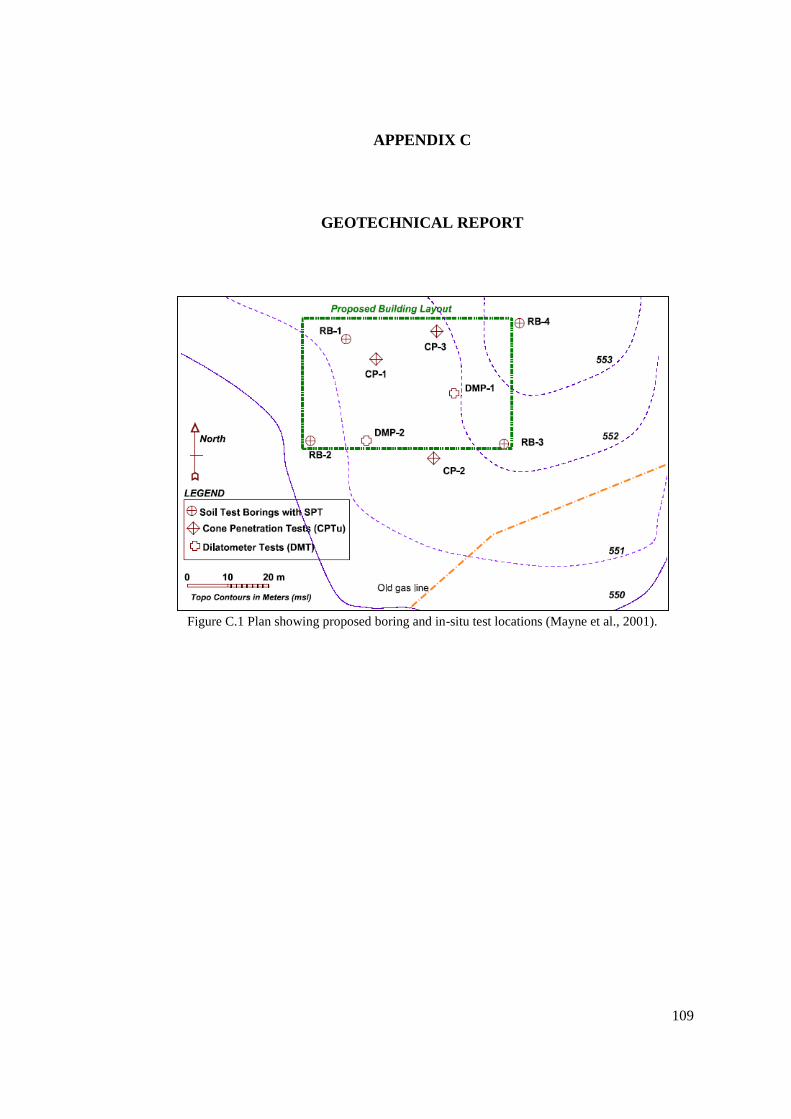
Figure C.1 Plan showing proposed boring and in-situ test locations (Mayne et al.,
2001). ............................................................................................................... 109
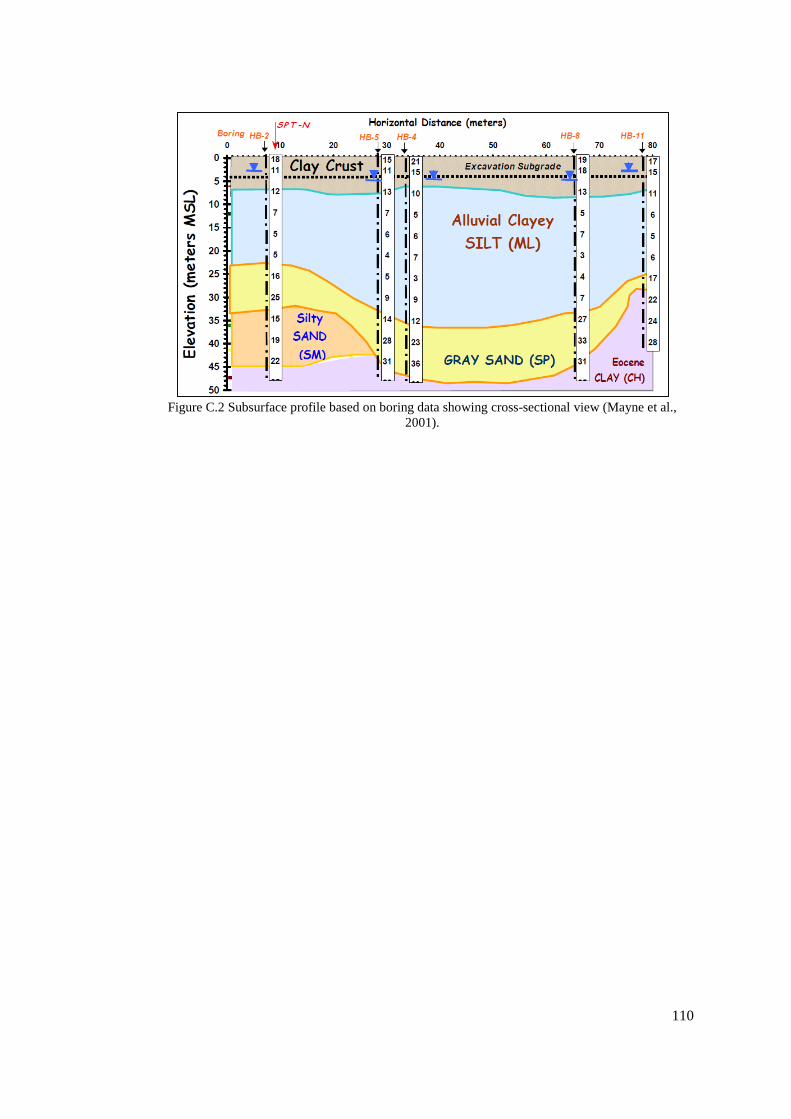
Figure C.2 Subsurface profile based on boring data showing cross-sectional view
(Mayne et al., 2001). ........................................................................................ 110
Figure D.1 Distribution of the geotechnical reports collected from central
municipalities of Ankara. ................................................................................. 113
Page 14
xiv
LIST OF ABBREVIATIONS
Cc compression index
Cr recompression index
Cs swelling index
CD consolidated drained
CU consolidated undrained
CPT cone penetration test
c cohesion of soil
Dr relative density
Es stress-strain modulus or modulus of deformation (also modulus of elasticity)
of soil; may include additional subscripts to indicate method of determination
ks modulus of subgrade reaction
N SPT blow count
Ni SPT blow count at i = efficiency of 55, 60, 70, etc., percent
OCR overconsolidation ratio
qc cone bearing pressure
qult ultimate computed bearing capacity
RQD rock quality designation
su undrained shear strength
SPT standard penetration test
UU unconsolidated undrained
γ unit weight of material; subscript is used with γ to identify type or state, as
c = concrete, dry, wet, sat, etc.
δ differential settlement between two points
µ Poisson’s ratio
Page 15
1
CHAPTER 1
INTRODUCTION
Every civil engineering structure is in a direct relationship with the ground due to
being founded in, on or with ground. The structure we put in or on the ground is
man-made; every item that goes into it, like concrete, steel and bricks can be
controlled and designed as desired. However, our knowledge about the ground is
limited and we have no way of exactly controlling the behavior of the ground. For
this reason, detailed investigation and accurate determination of natural ground
characteristics is necessary, because reliability and cost of the engineering structure
is substantially affected by ground properties.
1.1 Research Motivation
Although our country is located in one of the world’s prominent earthquake zones
(Alpine-Himalayan earthquake belt), geotechnical engineering is relegated to second
place and geotechnical studies, especially parcel-basis ground investigation works,
do not receive the attention they deserve. The geological/geotechnical reports that
are prepared for low-rise housing projects are undertreated and seen merely as a
procedural requirement.
In recent years, geotechnical engineering has regularly been in the news not only
due to the earthquake disasters that we have experienced, but also to a lesser extent,
due to slope stability and urban excavation failures. And yet, geotechnical
investigations and reports that are inaccurate, incorrect or inadequate are still an
important problem of geotechnical engineering in Turkey. It is hoped that the results
of this study will attract attention and create awareness on this important issue,
which are the first necessary steps towards widespread engagement of the problem.
Page 16
2
1.2 Purpose and Scope
The purpose of this study is to determine the deficiencies, mistakes and incorrect
suggestions that are frequently performed in geological/geotechnical reports
prepared by different institutions for low-rise housing projects. An addition aim is to
provide information and solutions for avoiding common errors and for obtaining
more reliable geotechnical reports. The scope of the work is to collect geotechnical
reports of housing projects, to examine the geotechnical investigations, calculations
and suggestions according to the criteria considered by the literature to be important,
and to emphasize common mistakes. Not only statistical evaluations of these
frequent problems are carried out, but also guidelines of true solutions for engineers
to avoid these frequent problems are presented. In this study, a total number of 66
geological/geotechnical reports are pitted against 36 different technical criteria.
From municipalities of all central districts of Ankara (Altındağ, Çankaya, Etimesgut,
Gölbaşı, Keçiören, Mamak, Sincan and Yenimahalle), 60 different geotechnical
reports are randomly collected and each are evaluated according to different
technical criteria. In order to add breadth to the data and to attribute the results of
this study to whole country, 6 additional reports that are obtained from other city
municipalities are also included into the assessment. The missing/incorrect site
investigations, laboratory tests, geotechnical evaluations and geotechnical
suggestions that occur in these reports are investigated and catalogued. Also,
frequency of each deficiency and mistake is statistically examined.
Examination is only made on geotechnical point of view, parts related to geology
and geophysics are not included in this study. In Turkey, both the field
investigations and the geological/geotechnical reports are carried out by geological
or geophysical engineers. It should clearly be noted that; the aim of this study is not
to question this situation or not to create a feud between engineering branches; aim
is only to help prevent common errors to obtain more reliable
geological/geotechnical reports.
Page 17
3
1.3 Outline of Thesis
In order to complete this study, several stages were considered. As a first stage,
literature survey about site investigation methods, geotechnical calculation
procedures and geotechnical reports are reviewed. The extensive background
knowledge required for the scope of work is presented in Chapters 2, 3 and 4. In
Chapter 2, necessary information, which will be used and cited in the later chapters,
is provided for proper and correct procedures of site investigation and laboratory test
experiments. In the same manner, Chapter 3 includes information about bearing
capacity, foundation settlement and foundation design. Chapter 4 is the part that
includes guidelines for geotechnical report writing. Information about not only
geotechnical knowledge and instructions to be included in the report content, but
also information about their format and sequential order is given in Chapter 4.
Second stage of the study comprises the evaluation of collected geotechnical reports
that are required for the license of design projects. In Chapter 5, assessment criteria
and obtained results are presented in tables. Also, discussions and opinions about the
results given in tables are expressed. In Chapter 6, as a final stage, comments and
conclusions are presented. Additionally, recommendations and solutions to various
issues are presented to help geological and/or geotechnical engineers avoid frequent
problems.
Page 18
4
CHAPTER 2
SITE INVESTIGATION
Site investigation is the general process of collecting information, evaluating,
interpreting and reporting of data. The purpose of site investigation is to gather and
identify the geological, geotechnical, and other relevant information of the ground at
a site in order to accomplish efficient, safe and economic designs.
The sub-soils, in/on which a structure will stand, are created by many geological
processes out of a wide variety of materials. We usually know very little about them,
therefore, an adequate and properly configured site investigation is essential to
understand the distribution of the materials, their properties and behavior under
various influences during the construction and lifetime of the structure.
Geological conditions can be extremely complex and may change over time. It is not
possible to identify all the information of the ground exactly, regardless of the
comprehensiveness of the investigation, which means no one can always be 100%
right when site investigation is completed. However, a properly procured,
supervised and well interpreted site investigation that is tailored both to the
conditions existing on site and to the form of construction, represents reliable and
representative information that can be used in design by the engineer with
confidence.
Inadequate or improper site investigation may result in construction delays, extra
costs, or even structural collapse. According to Institution of Civil Engineers (1991),
Littlejohn et al. (1994), Whyte (1995), ground engineering risk is one of the largest
elements of technical and financial risk in civil engineering and building projects. In
order to reduce the risk of cost overrun and structural collapse, expenditure of site
investigations, which is sometimes as low as 0.1% to 0.2% (Building Research
Page 19
5
Establishment, 1987) of the total project cost, should be increased. In today’s
general practice, site investigation is often based on minimum cost and maximum
speed. Without a doubt, this increases the risk of poor quality work. The National
Research Council (1984) suggests that site investigation expenditure should be at
least 3% of the cost of the project. However, it should not be forgotten that site
investigations that are not planned and conducted with geotechnical expertise, but
only just fill this financial percentage, are useless.
2.1 Phases of Site Investigation
Site investigation process can be divided into a number of phases based on their
purpose, with various investigation stages in each phase. Table 2.1 provides
information about the general phases of site investigation and their properties.
Table 2.1 Geotechnical requirements (Look, 2007)
Page 20
6
2.1.1 The desk study and walk over survey
The desk study and walk-over survey are the two necessary constituents of the site
investigation. Both the desk study and walk-over survey provide many benefits at
negligible cost. They are by far the most cost-effective parts of the site investigation
process (Clayton et al., 1995).
The early stage of site investigation usually involves a desk study to collect and
collate information already available about a site, and the likely problems that they
will produce for the proposed type of construction. This is likely to involve multiple
sources of information including ordnance survey maps, geological and groundwater
vulnerability maps, aerial photographs, records of previous site investigation reports,
service records to locate subsurface utilities such as electricity cables, sewers and
telephone wires.
Subsequent to the initial document search, the walk-over survey is performed to
collect extra information about the current condition of the site and on likely
construction problems. The walk-over survey should complement the desk study and
typically provide valuable information on features such as; topography, geology,
surface and groundwater, ecology, damage of existing structures (settlement,
cracks), access and services.
When these surveys are completed, the outputs should be reported in a formal way.
The routine check-list recommended by the Building Research Establishment (1987)
for desk and walk-over studies associated with low-rise building is shown in Table
2.2.
Page 21
7
Table 2.2 Desk study and walkover survey checklist for low-rise buildings (Building Research
Establishment, 1987)
2.1.2 Surface investigation (Geophysical exploration)
Geophysical techniques consist of making indirect measurements from ground
surface or in subsurface explorations to obtain subsurface information. They are
helpful in correlating geologic features such as stratigraphy, ground water, locating
cavities and discontinuities. For example, subsurface distribution of the geologic
materials and groundwater conditions between boreholes can be checked to see
whether ground conditions at the boreholes are representative of that elsewhere. The
cost of geophysical explorations is generally low and considerable savings may be
obtained by using the right technique at the right place. The main geophysical
exploration techniques are seismic, electrical, sonic, magnetic, radar and gravity.
Geophysical exploration is not within the scope of this study, so detailed
information about geophysical methods is not provided in this study. Some basic
geophysical methods are summarized in Appendix Table A.1. Their abilities to
obtain different types of subsurface data are summarized in Appendix Table A.2.
Page 22
8
2.1.3 Sub-Surface investigation
Sub-surface investigation is carried out for the purpose of detailed site
characterization to be used for design. This involves using direct methods of
investigation, such as drilling, sampling, field tests, and it requires use of specialized
equipment. According to Clayton et al. (1995) exploration survey are carried out for
a number of reasons, such as:
1. to establish the general nature of the strata below a site;
2. to establish the vertical or lateral variability of soil conditions;
3. to verify the interpretation of geophysical surveys;
4. to obtain samples for laboratory testing;
5. to allow in situ tests to be carried out; and
6. to install instruments such as piezometers, inclinometers or extensometers.
When compared with the other stages of site investigation, exploration techniques
are relatively expensive and therefore should be carefully planned and controlled to
increase benefits. Irrelevant and incorrect conclusions can be acquired if the
procedures are not followed carefully and data not interpreted properly. For instance,
inaccurate soil profile and strength parameters can be obtained as a result of poor
drilling and sampling techniques. According to U.S. Army Corps of Engineers
(2001), only competent, senior geotechnical personnel should be charged with
planning a subsurface investigation, and only qualified geotechnical professionals
and technicians should do the drilling, data collecting, analyzing and interpreting.
2.1.3.1 Subsurface exploration planning
After evaluation of available information from the previous stages, the next step is to
plan the field exploration program. The field exploration methods, locations and
frequency are mostly controlled by the geological conditions, project design
requirements and the availability of equipment.
Page 23
9
Boring and test pit locations and frequency depend largely on the proposed
structure. The layout of the subsurface investigation should aim not only to
characterize geotechnical conditions related to the proposed structures and their
foundations but also to verify the collected information from previous investigation
stages. At the site, all subsurface exploration locations and elevations should be
determined and recorded using either conventional surveying methods or by global
positioning systems (GPS). It is important to allow cross-sections to be drawn when
needed and to interpret the ground conditions between boreholes properly. In
general, boring layouts should not be random. For example, borings could be drilled
at the four corners of a proposed building, with an additional (and deepest) one
located at the center of the proposed building. Table 2.3 provides guidelines on the
typical boring layout versus type of project.
Table 2.3 Guidelines for boring layout (Day, 2006)
Page 24
10
In Turkey, it is recommended to drill at least five boreholes, four at corners and one
at center, for parcels greater than 1000 m2 and for smaller ones at least one drilling
for every 300 m2 (GDDA, 2005). Özdemir (2005) suggests 2 boreholes for building
area smaller than 500 m2, 3 boreholes for area between 500 m
2 and 1000 m
2 and 5
boreholes for the ones greater than 1000 m2.
As in the boring layout, experience plays an important role and there is no simple
answer in determining the extent of the subsurface exploration. The extent of the
subsurface exploration depends on the size, loading level, sensitivity of the proposed
structure and properties of the strata that will underlie the foundation.
Hvorslev (1949) proposed some general rules which remain applicable:
The borings should be extended to strata of adequate bearing capacity and should penetrate all
deposits which are unsuitable for foundation purposes — such as unconsolidated fill, peat,
organic silt and very soft and compressible clay. The soft strata should be penetrated even
when they are covered with a surface layer of high bearing capacity.
When structures are to be founded on clay and other materials with adequate strength to
support the structure but subject to consolidation by an increase in the load, the borings should
penetrate the compressible strata or be extended to such a depth that the stress increase for still
deeper strata is reduced to values so small that the corresponding consolidation of these strata
will not materially influence the settlement of the proposed structure.
Except in the case of very heavy loads or when seepage or other considerations are governing,
the borings may be stopped when rock is encountered or after a short penetration into strata of
exceptional bearing capacity and stiffness, provided it is known from explorations in the
vicinity or the general stratigraphy of the area that these strata have adequate thickness or are
underlain by still stronger formations. When these conditions are not fulfilled, some of the
borings must be extended until it has been established that the strong strata have adequate
thickness irrespective of the character of the underlying material.
When the structure is to be founded on rock, it must be verified that bedrock and not boulders
have been encountered, and it is advisable to extend one or more borings from 3 to 6 m into
solid rock in order to determine the extent and character of the weathered zone of the rock.
In regions where rock or strata of exceptional bearing capacity are found at relatively shallow
depths — say from 30 to 45 m — it is advisable to extend at least one of the borings to such
strata, even when other considerations may indicate that a smaller depth would be sufficient.
Page 25
11
Another commonly used rule is De Beer’s (1976) proposal which suggests that the
depth of exploration should reach such a depth where vertical stress increase due to
weight of structure would approximately be equal to ten percent of the existing
overburden pressure. Figure 2.1 presents additional guidelines for different types of
foundation projects.
Figure 2.1 Necessary borehole depths for foundations (Clayton et al., 1995).
Page 26
12
In our country, for ordinary buildings Özdemir (2005) suggests;
1- Drilling should continue until 3 consecutive SPT N values>50 are
obtained.
2- If rock is encountered during drilling, a minimum of 3 m of rock core
shall be obtained at each exploration location and if rock shows a
fractured feature, drilling should extend to a minimum depth of 5 m.
3- If the above circumstances do not occur, the exploration depth would be
up to 1.5 times the short side of the building plan below the foundation
level.
4- Drilling depth should not be less than 12 m in any case, should be
minimum 15 m for buildings with basement and 20 m for building taller
than 10 floors.
2.1.3.2 Recovery of samples and cores
Sampling is carried out to allow detailed examination of soil and rock, and to supply
specimens for laboratory testing to determine their physical and engineering
properties. Samples obtained should represent all the characteristics of the ground
from which they are taken. They should be large enough to contain representative
particle sizes, fabric, and fissuring and fracturing (Clayton et al., 1995).
2.1.3.2.1 Soil sampling
There are lots of samplers and sampling methods. In order to provide that the
sample disturbance is sufficiently small, a suitable technique of sampling and
adequate sample size should be selected. In general, two types of samples are
specified:
Disturbed (but representative)
Undisturbed
Page 27
13
A disturbed sample is one in which the in-situ properties of the soil has been
destroyed sufficiently during the collection process that only visual classification
can be done and some laboratory tests can be carried out to determine properties of
the soil grains accurately.
Undisturbed samples preserve in situ structural properties of soil, however, it should
not be forgotten that no soil sample can be obtained in a perfectly undisturbed state.
Considerable experience and specialized equipment is needed to minimize the
disturbance of sample. According to Mayne et al. (2001), undisturbed samples are
obtained in clay soil strata for use in laboratory testing to determine the engineering
properties such as strength, permeability, compressibility and fracture patterns of
those soils. They also state that undisturbed samples of granular soils can be
obtained, but often specialized procedures are required such as freezing or resin
impregnation and block or core type sampling. Common methods for obtaining
disturbed and undisturbed samples are summarized in Table 2.4.
Table 2.4 Common soil sampling methods (Mayne et al., 2001)
Page 28
14
2.1.3.2.2 Coring of rocks
Where borings must extend into rock formations, rock coring is required. According
to Mayne et al. (2001), defining the top of rock from drilling operations can be
difficult, especially where large boulders exist, below irregular residual soil profiles,
and in karst terrain. They also assert that a penetration of 25 mm (1 in) or less by a
51 mm (2 in) diameter split-barrel sampler following 50 blows using standard
penetration energy indicates that soil sampling methods are not applicable and rock
drilling or coring is required. Also geophysical methods, such as seismic refraction,
can be used to specify the elevations of rock layers.
For coring of rocks, a core barrel, with a coring bit at the bottom, is attached to a
drilling rod. There are three basic types of core barrels, namely, single-tube, double-
tube, or triple-tube. Appendix Figure A.1 illustrates single and double tube core
barrels. Rock cores obtained by single-tube core barrels can be highly disturbed and
fractured because of torsion so they are often used as a starter barrel during the
beginning of coring operations. Double-tube core barrel, which is the standard,
consists of an inner and outer core barrel and offers a better recovery because it
isolates the rock core from the drilling fluid stream. Triple-tube barrels are identical
to double-tube barrels except that a liner tube is used inside the inner barrel which
retains the cored sample and helps to reduce the frictional heat that may damage
samples. Triple-tube barrels are useful in coring fractured and highly weathered
rocks.
In core logging, relevant information such as the method of drilling and summary of
rock coring parameters including total core recovery (TCR) and rock quality
designation (RQD) shall be provided. TCR is the length of the total amount of core
sample recovered, expressed as a percentage of the length of the core run, and RQD
is a modified core recovery percentage in which the lengths of all recovered core
pieces (NX size) equal to or longer than 100 mm are summed and divided by the
length of the entire core run. The correct procedure for measuring RQD is illustrated
in Appendix Figure A.2.
Page 29
15
2.1.3.2.3 Sampling interval and appropriate type of sampler
The sampling interval varies according to project requirements. Generally, sampling
intervals range between 0.75 and 1.5 m (Rowe, 2001). Seldom is the interval greater
than 3 m and sometimes continuous sampling may be necessary through formations
with highly variable strata. In general, disturbed samples are taken in both granular
and cohesive soils for 1.5 m intervals as a result of standard penetration test.
However, for granular soils under groundwater level, especially in the first 10 m
depth, standard penetration test should be performed on every 1 m intervals (GDDA,
2005). In cohesive soils, with the help of information collected by standard
penetration test samples, sufficient number of undisturbed samples should be
obtained to determine the properties of each layer. For example if the first 4 m
below the foundation base is a cohesive layer, at least two undisturbed samples
should be taken (GDDA, 2005). In some instances, a greater sample interval, often 3
m, is allowed below depths of 30 m (Mayne et al, 2001).
An important aspect for minimizing the sample disturbance is selecting the most
appropriate sampler type. According to Hunt (2005), a number of factors are
considered in the selection of samplers, including:
Sample use, which varies from general determination of material, to
examination of material and fabric and in situ testing, to performing
laboratory index tests, and to carrying out laboratory engineering-properties
tests.
Soil type, since some samplers are suited only for particular conditions, such
as soft to firm soils vs. hard soils.
Rock conditions, since various combinations of rock bits and core barrels are
used, depending on rock type and quality and the amount of recovery
required.
Surface conditions, which vary from land or quiet water to shallow or deep
water with moderate to heavy swells.
Page 30
16
Applications of some common sampling tools to various subsurface conditions are
illustrated in Figure 2.2. More detailed information about sampling methods and
limitations are described in Appendix Table A.3.
Figure 2.2 Common sampling tools for various soil and rock conditions (Hunt, 2005).
Page 31
17
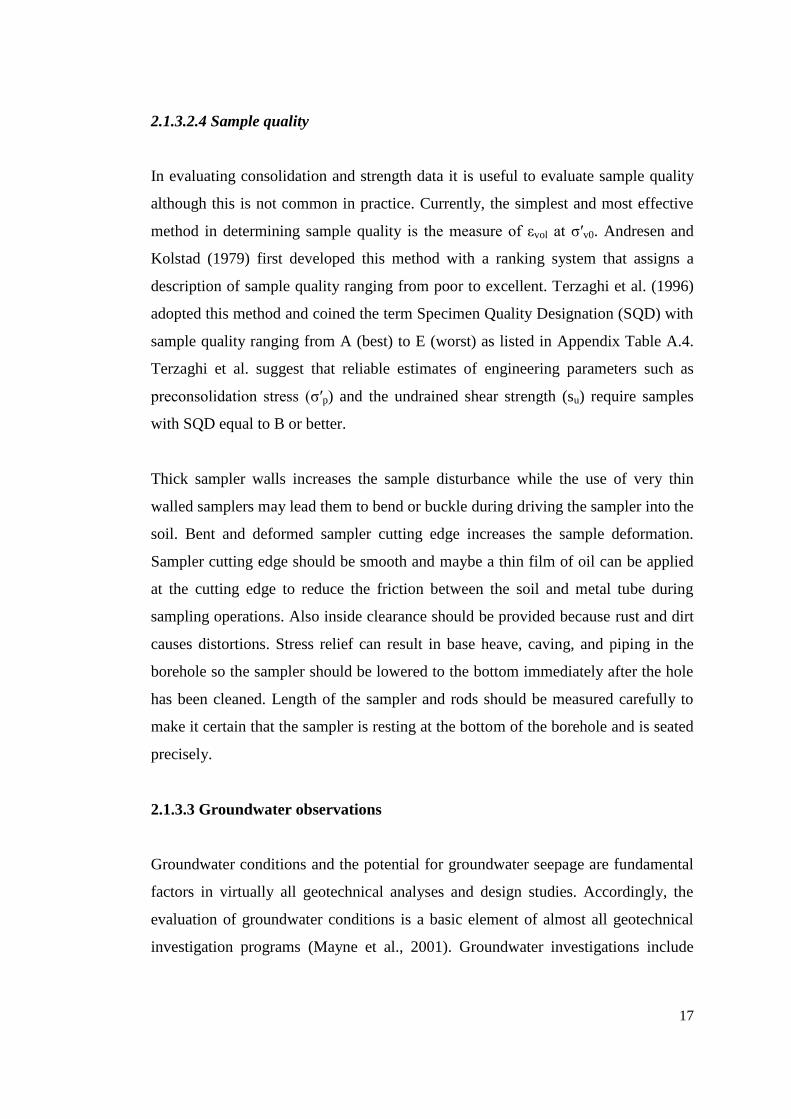
2.1.3.2.4 Sample quality
In evaluating consolidation and strength data it is useful to evaluate sample quality
although this is not common in practice. Currently, the simplest and most effective
method in determining sample quality is the measure of εvol at σ′v0. Andresen and
Kolstad (1979) first developed this method with a ranking system that assigns a
description of sample quality ranging from poor to excellent. Terzaghi et al. (1996)
adopted this method and coined the term Specimen Quality Designation (SQD) with
sample quality ranging from A (best) to E (worst) as listed in Appendix Table A.4.
Terzaghi et al. suggest that reliable estimates of engineering parameters such as
preconsolidation stress (σ′p) and the undrained shear strength (su) require samples
with SQD equal to B or better.
Thick sampler walls increases the sample disturbance while the use of very thin
walled samplers may lead them to bend or buckle during driving the sampler into the
soil. Bent and deformed sampler cutting edge increases the sample deformation.
Sampler cutting edge should be smooth and maybe a thin film of oil can be applied
at the cutting edge to reduce the friction between the soil and metal tube during
sampling operations. Also inside clearance should be provided because rust and dirt
causes distortions. Stress relief can result in base heave, caving, and piping in the
borehole so the sampler should be lowered to the bottom immediately after the hole
has been cleaned. Length of the sampler and rods should be measured carefully to
make it certain that the sampler is resting at the bottom of the borehole and is seated
precisely.
2.1.3.3 Groundwater observations
Groundwater conditions and the potential for groundwater seepage are fundamental
factors in virtually all geotechnical analyses and design studies. Accordingly, the
evaluation of groundwater conditions is a basic element of almost all geotechnical
investigation programs (Mayne et al., 2001). Groundwater investigations include
Page 32
18
measurements of the elevation of the groundwater surface or water table and its
variation in short term (couple of weeks) and in long term (season of the year); the
location of aquifers; and the presence of artesian pressures. Piezometers are used
where the measurement of the ground water pressures are specifically required.
2.1.4 In-situ geotechnical tests
In-situ tests are conducted to obtain direct measurements of geotechnical parameters
and soil properties. In-situ tests are generally performed to investigate a much
greater volume of material more quickly than possible for sampling and laboratory
tests. They also facilitate testing at the in situ stress state. Therefore, they have the
potential to realize high statistical reliability for foundation design (Failmezger,
2008). For designs involving coarse-grained foundation materials, where
undisturbed sampling is usually impractical, in situ testing is the only feasible way
to estimate the material properties.
This section presents an overview of the most common in-situ tests in Turkey and
points out some important details that are often overlooked. Further information can
be obtained from Sabatini et al. (2002) and Mayne et al. (2001), which are presented
in the references, and from relevant testing standards (ASTM). Appendix Table A.5
and Table A.6 list in-situ test methods and their general application and purposes.
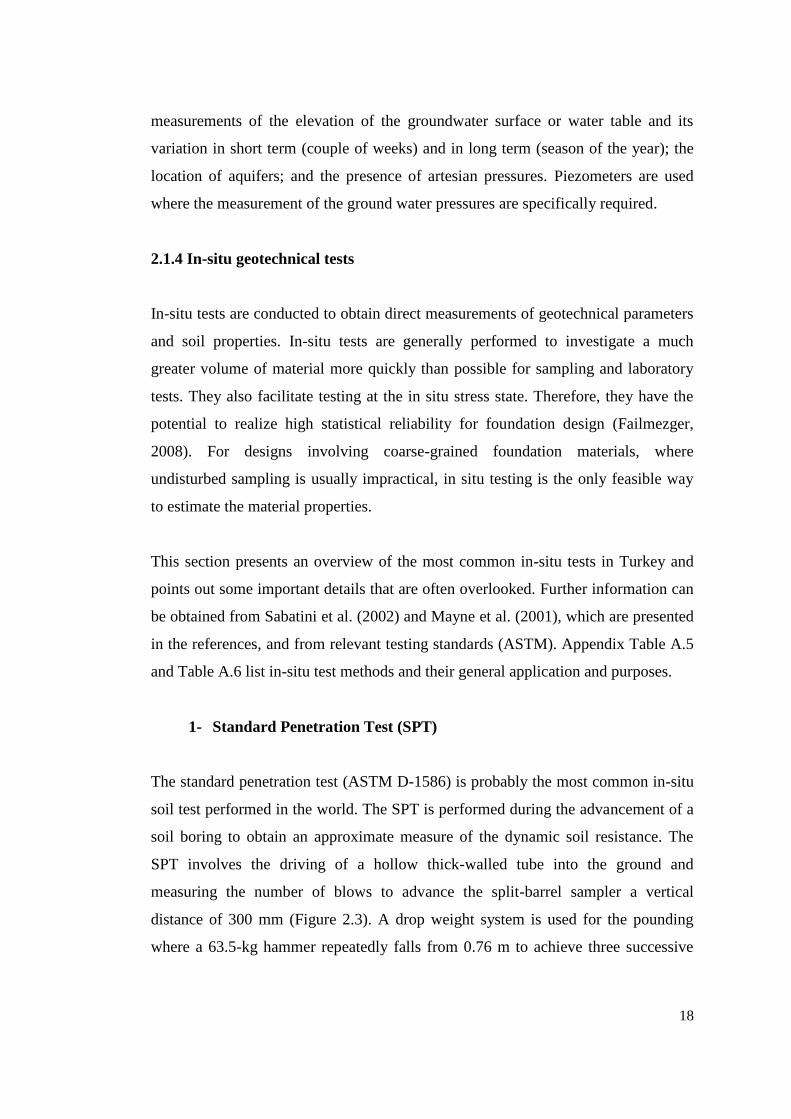
1- Standard Penetration Test (SPT)
The standard penetration test (ASTM D-1586) is probably the most common in-situ
soil test performed in the world. The SPT is performed during the advancement of a
soil boring to obtain an approximate measure of the dynamic soil resistance. The
SPT involves the driving of a hollow thick-walled tube into the ground and
measuring the number of blows to advance the split-barrel sampler a vertical
distance of 300 mm (Figure 2.3). A drop weight system is used for the pounding
where a 63.5-kg hammer repeatedly falls from 0.76 m to achieve three successive
Page 33
19
increments of 150-mm each. The second and third increments, following the 150
mm seating drive, are summed to give the N-value ("blow count") or SPT-
resistance. The SPT can be halted when 100 blows has been achieved or if the
number of blows exceeds 50 in any given 150-mm increment (Mayne et al., 2001).
Figure 2.3 Sequence of driving split-barrel sampler during the SPT (Mayne et al., 2001).
The test can be performed in a wide variety of soil types, as well as weak rocks, but
it is not particularly useful in the characterization of gravel deposits and soft clays
(Mayne et al., 2001). SPT is recommended for essentially all subsurface
investigations since it both provides a disturbed sample and a useful number, N-
value. It is also a very fast and inexpensive test. Although the test is relatively
simple to perform, it should be performed with only appropriate equipment and by
only skilled drillers to achieve meaningful results. The main factors affecting the
SPT results are summarized in Table 2.5.
Page 34
20
Table 2.5 Factors affecting the SPT (after Kulhawy and Mayne, 1990)
Cause Effects Influence on
SPT N Value
Inadequate cleaning of hole
Soil may become trapped in sampler
and may be compressed as sampler is
driven, reducing recovery
Increases
Failure to maintain adequate
head of water in borehole Bottom of borehole may become quick Decreases
Careless measure of drop Hammer energy varies (generally
variations cluster on low side) Increases
Hammer weight inaccurate
Hammer energy varies (driller supplies
weight; variations of 5 – 7 percent
common)
Increases or
decreases
Hammer strikes drill rod
collar eccentrically Hammer energy reduced Increases
Lack of hammer free fall
because of ungreased heaves Hammer energy reduced Increases
Sampler driven above
bottom of casing
Sampler driven in disturbed,
artificially densified soil
Increases
greatly
Careless blow count Inaccurate results Increases or
decreases
Use of non-standard sampler Correlations with standard sampler
invalid
Increases or
decreases
Coarse gravel or cobbles in
soil Sampler becomes clogged or impeded Increases
Use of bent drill rods Inhibited transfer of energy of sampler Increases
For routine engineering practice, correlations for engineering properties are based on
SPT N values measured based on a 60 percent efficient system (Sabatini et al.,
2002). The N values corresponding to 60 percent efficiency are termed N60. In
Turkey, notation N30 is common to indicate N value of the last 30 cm penetration of
SPT hammer, which is misleading, because the N subscript indicates the energy
efficiency, not the penetration depth.
Many different correction factors to the measured N-value are necessary because of
energy inefficiencies and procedural variation in practice. By applying certain
correction factors to the field recorded raw N-value, the corrected value is calculated
as:
Page 35
21
N60= Nfield CE CB CS CR (2.1)
where; CE is energy correction factor, CB is borehole diameter correction, CS is
sampler correction, CR is rod length correction. The correction factors are presented
in Table 2.6.
Table 2.6 Corrections to the SPT (Skempton, 1986)
Factor Equipment Variable Term Correction
Energy Ratio (ER) Donut Hammer
Safety Hammer
Automatic Hammer
CE = ER/60 0.5 to 1.0
0.7 to 1.2
0.8 to 1.5
Borehole Diameter 65 to 115 mm
150 mm
CB 1.0
1.05
Sampling method Standard sampler
Non-standard sampler
CS 1.0
1.1 to 1.3
Rod Length 3 to 4 m
4 to 6 m
6 to 10 m
10 to >30 m
CR 0.75
0.85
0.95
1.0
The corrected SPT N60 value may also be adjusted using an overburden correction
that balances the effects of stress level. Since in a uniform soil deposit deep tests
will have higher N values than shallow tests, the overburden correction factor is
used to adjust the N60 value to a reference point of vertical stress equal to 100 kPa.
The overburden corrected (N1)60 values are expressed as:
(N1)60 = CN N60 (2.2)
where CN is the correction factor for overburden stress. The expression for CN is
given below with a restriction that CN≤2 (Liao and Whitman, 1986):
CN = (100 / σ'v)
0.5 (2.3)
Page 36
22
where σ'v the effective overburden pressure at the point of measurement. It should be
noted that the overburden correction generally is applied only for granular soils
(Das, 2011).
When the test carried out in very fine sand or silty sand below the water table, field
measured N values greater than 15 should be corrected by using the following
equation (Terzaghi & Peck, 1948):
N 15 1/2 (N-15) (2.4)
2- Cone Penetration Test (CPT)
The cone penetration test involves insertion of an instrumented, cone-tipped
cylindrical steel probe into the ground to determine the penetration resistance of the
soil (Figure 2.4). The mechanical system (ASTM D-3441) and the electronic system
(ASTM D-5778) are the two most common types of cone penetration testing. The
mechanical cone measures cone tip resistance (qc) and side resistance (fc) at intervals
of about 20 cm, whereas the electric cone is able to measure qc and fc continuously
with depth. Also by using cones equipped with pore pressure transducers
(piezecones), the excess pore pressures that develop during the advancement of the
probe can be measured. This enhanced procedure is known as a CPTU test.
Especially in saturated clays, it is very important and useful to monitor the pore
water pressure.
The test is applicable to most soils, except gravelly soils, soil fills containing stones
and brick bats, and soil with standard penetration resistance N greater than 50 (Das,
2011). In order to perform this test, boreholes are not necessary. It is also an
inexpensive and a fast method but not recovering a soil sample and the necessity of
a special rig to perform the test can be listed as the two disadvantages. Besides, raw
cone penetration test measurements may require pore water correction and
overburden stress normalization. These correction methods are available in the paper
Page 37
23
published by Mayne et al. (2001). Despite not recovering any soil samples, it is
possible to obtain an approximate soil classification using the chart shown in
Appendix Figure A.3. By using correlations, based on the soil type as determined by
the CPT, the undrained strength can be estimated for clays (Jamiolkowski et al.,
1982; Schmertmann, 1970), and the relative density (and friction angle) estimated
for sands (Durgunoglu and Mitchell, 1975; Mitchell, Guzikewski and Villet, 1978;
Schmertmann, 1978).
Figure 2.4 Procedures and components of the cone penetration test (Mayne et al., 2001).
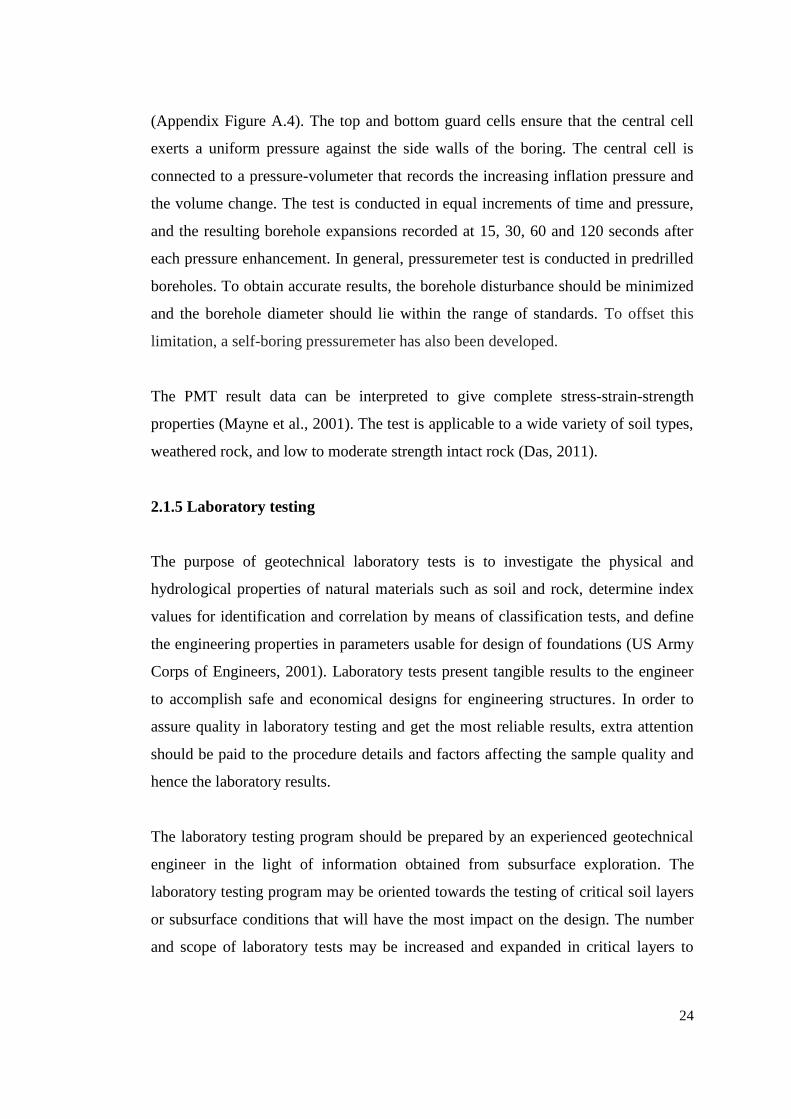
3- Pressuremeter Test (PMT)
The pressuremeter test (ASTM D-4719) consists of a radially expanding cylindrical
probe and a ground monitoring unit. The cylindrical probe consists of three cells
Page 38
24
(Appendix Figure A.4). The top and bottom guard cells ensure that the central cell
exerts a uniform pressure against the side walls of the boring. The central cell is
connected to a pressure-volumeter that records the increasing inflation pressure and
the volume change. The test is conducted in equal increments of time and pressure,
and the resulting borehole expansions recorded at 15, 30, 60 and 120 seconds after
each pressure enhancement. In general, pressuremeter test is conducted in predrilled
boreholes. To obtain accurate results, the borehole disturbance should be minimized
and the borehole diameter should lie within the range of standards. To offset this
limitation, a self-boring pressuremeter has also been developed.
The PMT result data can be interpreted to give complete stress-strain-strength
properties (Mayne et al., 2001). The test is applicable to a wide variety of soil types,
weathered rock, and low to moderate strength intact rock (Das, 2011).
2.1.5 Laboratory testing
The purpose of geotechnical laboratory tests is to investigate the physical and
hydrological properties of natural materials such as soil and rock, determine index
values for identification and correlation by means of classification tests, and define
the engineering properties in parameters usable for design of foundations (US Army
Corps of Engineers, 2001). Laboratory tests present tangible results to the engineer
to accomplish safe and economical designs for engineering structures. In order to
assure quality in laboratory testing and get the most reliable results, extra attention
should be paid to the procedure details and factors affecting the sample quality and
hence the laboratory results.
The laboratory testing program should be prepared by an experienced geotechnical
engineer in the light of information obtained from subsurface exploration. The
laboratory testing program may be oriented towards the testing of critical soil layers
or subsurface conditions that will have the most impact on the design. The number
and scope of laboratory tests may be increased and expanded in critical layers to
Page 39
25
improve reliability. Conversely, the laboratory program may be limited on the
samples of layers with least effect on design, to avoid extra cost and time loss.
In this study, procedures for performing laboratory tests are not described;
references are provided for that purpose (Table 2.7). However, basic definitions are
provided and some discussions are set up on the commonly used laboratory tests for
low-rise building foundation designs in the following section.
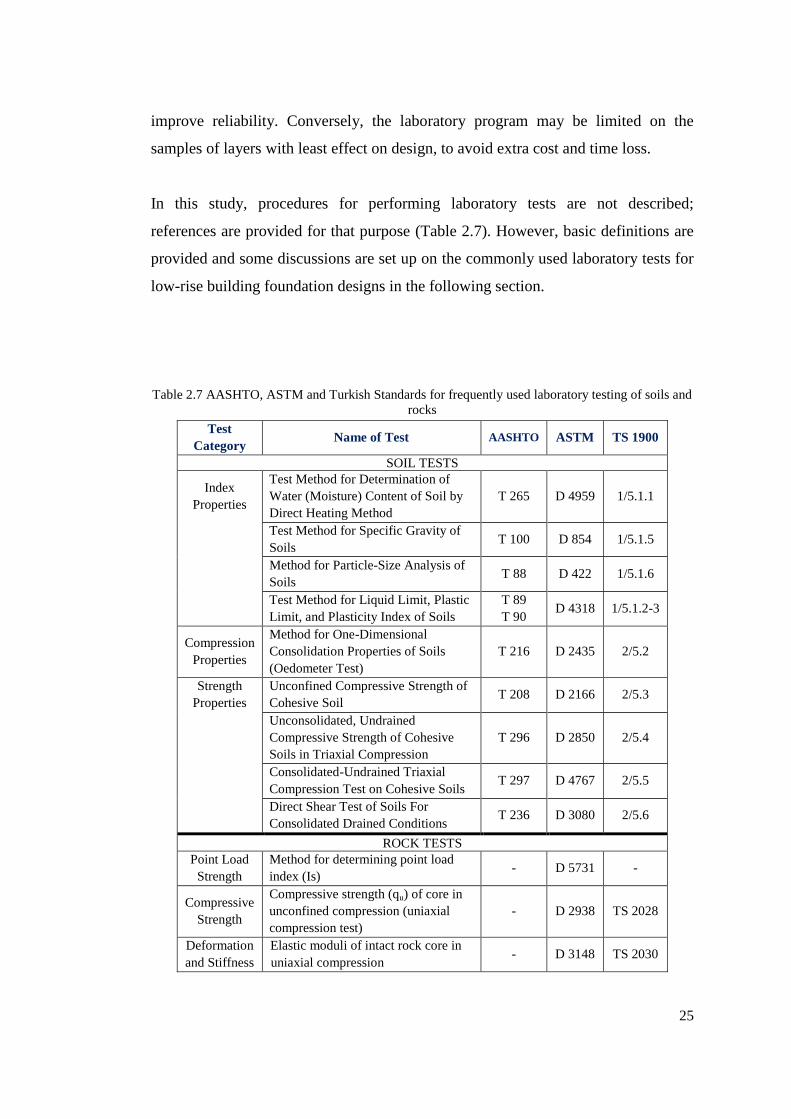
Table 2.7 AASHTO, ASTM and Turkish Standards for frequently used laboratory testing of soils and
rocks
Test
Category Name of Test AASHTO ASTM TS 1900
SOIL TESTS
Index
Properties
Test Method for Determination of
Water (Moisture) Content of Soil by
Direct Heating Method
T 265 D 4959 1/5.1.1
Test Method for Specific Gravity of
Soils T 100 D 854 1/5.1.5
Method for Particle-Size Analysis of
Soils T 88 D 422 1/5.1.6
Test Method for Liquid Limit, Plastic
Limit, and Plasticity Index of Soils
T 89
T 90 D 4318 1/5.1.2-3
Compression
Properties
Method for One-Dimensional
Consolidation Properties of Soils
(Oedometer Test)
T 216 D 2435 2/5.2
Strength
Properties
Unconfined Compressive Strength of
Cohesive Soil T 208 D 2166 2/5.3
Unconsolidated, Undrained
Compressive Strength of Cohesive
Soils in Triaxial Compression
T 296 D 2850 2/5.4
Consolidated-Undrained Triaxial
Compression Test on Cohesive Soils T 297 D 4767 2/5.5
Direct Shear Test of Soils For
Consolidated Drained Conditions T 236 D 3080 2/5.6
ROCK TESTS
Point Load
Strength
Method for determining point load
index (Is) - D 5731 -
Compressive
Strength
Compressive strength (qu) of core in
unconfined compression (uniaxial
compression test)
- D 2938 TS 2028
Deformation
and Stiffness
Elastic moduli of intact rock core in
uniaxial compression - D 3148 TS 2030
Page 40
26
2.1.5.1 Laboratory testing for soils
1-Moisture content
Determination of moisture content is one of the most common and least expensive
laboratory tests. This test can be performed on disturbed or undisturbed soil
specimens. The aim is to determine the amount of water present in a quantity of soil
in terms of its dry weight and to provide general correlations with strength,
settlement, workability and other properties (Mayne et al., 2001). Moisture content
is defined as the ratio of the mass of the water in a soil specimen to the mass of the
dry soil solids.
Water content, when combined with data obtained from other tests can provide
valuable information on possible foundation problems. For example, Day (2006)
claims that if a clay layer located below a proposed shallow foundation has a water
content of 100 percent, then it is likely that this clay will be highly compressible.
Likewise if the same clay layer below the shallow foundation has a water content of
5 percent, then it is likely that the clay layer is dry and desiccated and could subject
the shallow foundation to expansive soil uplift.
2-Total unit weight
In the laboratory, the total density, which is also known as the wet density, is simply
determined by dividing mass of soil sample to sample volume and can only be
obtained from undisturbed soil specimens. The international system of units for
density is kg/m3. To convert the wet density (ρt) to total unit weight (γt), the wet
density is multiplied by g (where g is acceleration of gravity = 9.81 m/sec2), which
has units of N/m3. For example, the density of water (ρw) is 1000 kg/m
3, while the
unit weight of water is 9810 N/m3.
Page 41
27
3- Specific gravity of solids
The specific gravity is a dimensionless parameter that relates the density of the soil
particles to the density of water. Specific gravity (Gs) of solids is defined as
Gs = Ms/(Vs × ρw) (2.5)
where Ms is the mass of soil particles used for the test, Vs is the volume of the soil
solids and ρw is density of water.
4 Particle size analysis of soils (Grain Size Distribution)
This test is performed to determine the percentage (by mass) of various grain sizes
contained within a soil. The distribution of particles coarser than 0.075 mm (No. 200
sieve) is determined by sieving, while a sedimentation process (hydrometer test) is
used to determine the distribution of particle sizes smaller than 0.075 mm. The
particle size distribution is obtained from records of the weight of soil particles and
is usually shown on a graph of percentage passing by weight versus particle size
(Appendix Figure A.5). If the size distribution of particles finer than 0.075 mm is an
important parameter, hydrometer analyses need to be performed. The most common
purpose of the hydrometer analysis is to obtain the clay fraction (percentage of
particles finer than 0.002 mm).
The grain size distribution is used to determine the textural classification of soils
(i.e., gravel, sand, silty clay, etc.) which in turn is useful in evaluating the
engineering characteristics such as permeability, strength, swelling potential, and
susceptibility to frost action (Mayne et al., 2001).
5- Atterberg limits
The objective of the Atterberg limits test is to illustrate the consistency and behavior
of fine-grained soils with varying degrees of moisture. The tests for the Atterberg
Page 42
28
limits are referred to as index tests because they serve as an indication of several
physical properties of the soil, including strength, permeability, compressibility, and
shrink/swell potential (Sabatini et al., 2002).
In geotechnical engineering practice, the term Atterberg limits refers to three stages
of water content known as the liquid limit (LL), plastic limit (PL), and shrinkage
limit (SL). These stages are shortly defined below but for laboratory testing
procedures and details, see ASTM D-4318 (2004).
• Liquid Limit (LL): The water content at which the behavior of soil change
from plastic state to liquid.
• Plastic Limit (PL): The water content corresponding to the behavior change
between the plastic and semi-solid state of a silt or clay.
• Shrinkage limit (SL): The water content at which any further loss of moisture
will not result in a decrease in the volume of the soil.
By using these limits, other indices including the plasticity index (PI), liquidity
index (LI) and the activity (A) of a soil can be obtained. Plasticity index, a measure
of soil plasticity, is calculated as
PI = LL – PL (2.6)
The liquidity index, an indicator of stress history, is defined as
LI = (wn-PL) / PI (2.7)
where wn is the natural moisture content of the soil. The activity (A) of a soil is the
PI divided by the percentage of particles finer than 0.002 mm. Appendix Table A.7
gives the ranges of liquid limit, plastic limit, and activity of some clay minerals. The
use of the liquidity index and activity can provide very useful information. For
example, a LI value less than or equal to zero usually indicates a heavily
consolidated soil that may have considerable expansion potential and a LI value of
unity indicates that the soil likely is relatively weak and compressible.
Page 43
29
If the soil is nonplastic, the Atterberg limits tests are not performed. According to
ASTM (2004), the liquid and plastic limit tests must be conducted only on the
portion of the soil finer than the No.40 (0.425 mm) sieve. By both using particle size
and Atterberg limits data, the soil is classified using the pre-established group
symbols. In Appendix Table A.8 shows the most widely used classification system,
Unified Soil Classification System (ASTM D-2487 and D-2488). Atterberg limits
tests results are not only used for classification of soils, but they also allow the use
of a large number of rough empirical relationships for characterizing soils. It is
important that these tests should be performed by skilled and careful technicians.
6- One-dimensional consolidation (Oedometer test)
One-dimensional consolidation test (or oedometer test) is the most common
laboratory method to determine the consolidation and expansion properties of soils.
Consolidation test is typically performed on undisturbed samples of fine-grained
soils. It is relatively expensive and time consuming as compared to simpler index
type tests but it provides one of the most useful and reliable laboratory
measurements for soil behavior. The test determines the deformation parameters (Cr,
Cc, Cs), stiffness in terms of constrained modulus (Dr = 1/mv), preconsolidation
stress (σ′p), coefficient of consolidation (cv), creep rate (Cα), and approximate value
of permeability (k) (Mayne et al., 2001). Results of one-dimensional consolidation
tests are commonly presented on an e-log σ′v graph whereby the deformation indices
(Cr, Cc, Cs) are determined as the slopes of Δe vs. Δlog σ′v for the recompression,
virgin compression, and swelling lines, respectively (Figure 2.5).
Page 44
30
Figure 2.5 Idealized graph of e-log σ′v for obtaining parameters (Mayne et al., 2001).
A customary consolidation test is performed by increasing loading steps. The range
of applied loads should cover the stress range from the initial in-situ state of the soil
to the final stress level that is expected to take place due to the proposed
construction. Also, Samtani (2006) advises that the anticipated preconsolidation
stress should be exceeded by at least a factor of four during the laboratory test. The
time period between the stress increments should be long enough to obtain reliable
results. In order to understand elastic characteristics of soil layer, it is recommended
that an unload-reload cycle be performed, especially for cases where accurate
settlement predictions are required.
7- Unconfined compressive strength of cohesive soil
The unconfined compression test requires a short period of time to complete and is
relatively inexpensive means to obtain approximate estimation undrained shear
strength (su) of clay and silty clay soils. This test cannot be performed on granular
Page 45
31
soils, dry or crumbly soils, peat, or fissured materials. The unconfined compression
test is a very simple type of test that consists of applying a vertical compressive
pressure without any lateral confinement to a cylindrical cohesive soil sample, at a
sufficiently high rate to prevent drainage. Despite some shortcomings and
limitations due to the absence of lateral pressures and lack of control over pore
pressures, in most cases test results from an unconfined compression test are
consistent.
The shear stresses induced in the specimen by the axial load result in a shear failure.
The maximum axial compressive stress applied to the specimen represents the
unconfined compressive strength (qu). The undrained shear strength (su) is calculated
as half of the unconfined compressive strength (qu) (Figure 2.6). The reliability of
this test decreases with respect to increasing sampling depth because the sample
tends to swell after sampling resulting in greater particle separation and reduced
shear strength.
Figure 2.6 Representative stress-strain curve for unconfined compressive test (Mayne et al., 2001).
Page 46
32
8- Triaxial tests
The triaxial test is probably the most important and extensively used laboratory test
to determine strength characteristics of cohesive soils including detailed information
on the effects of lateral confinement, porewater pressure, drainage. The triaxial test
procedure is to place a cylindrical specimen of cohesive soil in triaxial apparatus,
seal the soil with a rubber membrane, subject the specimen to an all-around
confining fluid pressure and apply deviator stress through a vertical loading ram to
cause shear failure in the sample. Traditionally, triaxial tests results are represented
by graphical means using Mohr's circles and a failure envelope tangent to these
circles (Figure 2.7). In theory only two circles would be sufficient to construct this
tangent, but the recommended procedure involves doing at least three triaxial
compression tests, each at a different lateral pressure, on the samples to define
failure envelope consistently (Heck, 1970). Triaxial tests are classified according to
whether the initial effective stress is controlled, and according to the soil specimen
drainage conditions. There are three types of triaxial tests:
Figure 2.7 Equivalent linear representation of Mohr failure envelope for undrained shear strength of
an unsaturated soil (Wright, 2005).
Page 47
33
Unconsolidated-Undrained test (UU): In the UU test, no drainage or consolidation
is allowed during either the application of the confining pressure or the application
of the axial load that induces shear stress. This test models the response of a soil that
has been subject to a rapid application of confining pressure and shearing load. The
unconsolidated-undrained (UU) test provides a measure of the shear strength for
short term stability which is in most circumstances the most critical case for
buildings. Method generally does not cover measurement of pore water pressures
and therefore parameters are determined in terms of total stresses. The failure
envelope of a completely saturated cohesive soil is horizontal in an undrained test.
Consolidated-Drained test (CD): In this test, the specimen is allowed to
completely consolidate under the confining pressure prior to performing the shearing
portion of the test. During shearing, load is applied at a rate slow enough to allow
drainage of pore water and no buildup of pore water pressures. The time required to
conduct this test in low permeability soil may be as long as several months;
therefore it is not common to conduct this test on low permeability soils. This test
models the long-term (drained) condition in soil. Effective stress strength parameters
(i.e., φ′ and c′) and volume deformations during shearing are evaluated in this test.
Consolidated-Undrained test (CU): The initial part of this test is similar to the CD
test in that the specimen is allowed to consolidate under the confining pressure. The
shearing for this test is undrained, and is more rapid than that for a CD test. Pore
pressures are measured during axial load application so that both total stress and
effective stress strength parameters can be obtained. Consolidated-undrained tests
can be performed faster than CD tests, and results show that both tests (CD and CU)
yield similar shear strength envelopes when plotted in terms of effective stress
(Wright, 2005).
9- Direct shear test
The direct shear test is one of the oldest and simplest tests to determine the soil shear
strength. In the direct shear test, the soil is first consolidated under a normal force.
Page 48
34
The soil is then sheared with a constant rate tangential shear force along a
predefined horizontal failure plane. Since there is no way to measure excess pore
water pressures generated during shearing, the loading rates must be so slow to
allow the specimen to fully drain. Hereby, the direct shear test is only appropriate to
measure the shear strength under drained (long-term) conditions. Direct shear testing
is commonly performed on compacted materials used for embankment fills and
retaining structures. It is also applicable to natural materials where it is necessary to
determine the angle of friction between the soil and the material of which the
foundation is constructed (Mayne et al, 2001). In such cases, the upper box contains
the foundation material and the lower box contains the soil sample. In addition to
peak effective shear strength, the direct shear test can be used for the evaluation of
effective stress residual strengths by repeating cycles of shearing along the slip
surface.
2.1.5.2 Laboratory testing of rocks
1- Point load index test
The point load strength test is an appropriate method used to estimate the
unconfined compressive strength of rock in which both core samples and fractured
rock samples can be tested (Sabatini et al., 2002). The test is conducted by
compressing a piece of the rock sample between two conical hardened steel platens
(Appendix Figure A.6) until the rock specimen fails in tension between these two
points. In order to evaluate uniaxial compressive strength (UCS), index-to-strength
conversion factor is applied to point load test index. Conversion factor is dependent
upon rock type and generally varies between 16 and 24, with even lower values for
some shales and mudstones (Rusnak, 2000). The relationship between UCS and the
point load strength could be expressed as (Bieniawski, 1975; Broch and Franklin,
1972):
(2.8)
Page 49
35
where k= conversion factor
Is50= size corrected point load index
Proposed conversion factors by various researchers are represented in Appendix
Table A.9. Point Load Index Test is generally not appropriate for rock with uniaxial
compressive strength less than 25 MPa (Sabatini et al., 2002).
2- Unconfined compressive strength of intact rock core
The unconfined compression test is conducted to identify the uniaxial compressive
strength of a cored rock sample. The uniaxial test is probably the most important
laboratory test in rock mechanics because it is the most direct way of determining
the strength of rock. In this test, cylindrical rock specimens are tested in
compression without any lateral confinement. The test sample should be cut with a
length/diameter ratio of at least 2 and both the condition of the two ends of the rock
core and the rate of loading should be within the tolerances. This test is more
expensive than the point load strength test, but is also more accurate.
3- Elastic moduli of intact rock core
This test is performed similarly to the unconfined compressive test discussed above,
as a plus deformation of the specimen is monitored as a function of load. This test is
performed when it is necessary to estimate deformation characteristics of intact rock
at intermediate strains. During the test both axial and lateral strain during
compression are measured and axial stress versus axial strain curves are generated.
The test results are reasonably reliable for engineering applications involving rock
classification type, however because of localized variations in rock mass such as
jointing, fissuring, and weathering the result are unique for each rock specimen.
Page 50
36
CHAPTER 3
FOUNDATION DESIGN
A foundation is defined as the part of a structure that supports the weight of the
structure and transmits the load to underlying soil or rock (Day, 2006). Foundations
are generally divided into two categories: shallow foundations and deep foundations
(Figure 3.1). Shallow foundations comprise footings and rafts, which convey the
structural loads to shallow depths. However, if the soil stratum near the surface is
not capable of supporting the structural loads adequately, deep foundations are used
to transmit the loads to deeper and more stable soil (or rock). Deep foundations
include pile foundations, stone columns, jet grout columns etc. The selection of
foundation type is generally based on two main factors; bearing capacity and
settlement.
3.1 Bearing Capacity of Foundations
Bearing capacity failure is defined as a foundation failure that occurs when the shear
stresses in the soil exceed the shear strength of the soil (Day, 2006). There are three
modes of shear failure: general, local and punching shear failures (Appendix Figure
B.1). In the general shear failure mode, continuous failure surfaces are well defined
and reach out from the edges of footing to ground surface. General shear failure is
observed in dense or stiff soils. In the mode of local shear failure the failure surfaces
do not reach to ground surface, only slight bulging occurs. Local shear failure occurs
in medium dense soils with high compressibility. Punching shear failure occurs by
shearing of the soil directly below footing in vertical direction while the area
surrounding the footing remains relatively unaffected. In this mode, no bulging of
ground surface and no tilting of footing is expected. Punching shear failure occurs in
soils that are in a loose or soft state. Table 3.1 presents a summary of the type of
Page 51
37
bearing capacity failure that would most likely develop based on soil type and soil
properties.
Figure 3.1 Various foundation types (Bowles, 1982).
Page 52
38
Table 3.1 Summary of type of bearing capacity failure versus soil properties (Day, 2006)
3.1.1 Bearing capacity of shallow foundations
Most commonly used bearing capacity equation for shallow foundations is the
equation developed by Terzaghi (1943) (Figure 3.2). For developing the equation,
some assumptions (i.e. the soil is semi-infinite homogeneous and isotropic, the base
of the footing is level and rough, the failure is by general shear mode, the load is
vertical and without eccentricity) are made. The ultimate bearing capacity, qult, is
expressed in Equation 3.1 (Terzaghi, 1943):
(3.1)
where qult = ultimate bearing capacity for the footing, kPa
Qult = vertical concentric load causing a general shear failure of the
underlying soil, kN
B = width of the footing, m
L = length of the footing, m
γt = total unit weight of the soil, kN/m3
Df = vertical distance from ground surface to bottom of footing, m
c = cohesion of the soil underlying the footing, kPa
Nc, Nγ, and Nq = Terzaghi dimensionless bearing capacity factors (Appendix
Table B.1)
sc, sγ and sq = Terzaghi dimensionless shape factors (Appendix Table B.2)
Page 53
39
Figure 3.2 Failure surface in soil for a continuous rough rigid foundation as assumed by Terzaghi
(Das, 1999).
Terzaghi bearing capacity equation is originally developed for a failure mode of
general shearing. In case of loose layer as a foundation soil, where local or punching
shear failure is expected, Terzaghi (1943) suggests to use reduced shear strength
parameters (c , ø ) (Eq. 3.2) and the modified dimensionless bearing capacity
factors (Appendix Table B.3) for the calculations.
(3.2)
Meyerhof (1963) proposed adding depth factors to the terms of Terzaghi’s equation
(Eq. 3.1). The general form of Meyerhof bearing capacity equation for vertically
loaded footing is:
(3.3)
Page 54
40
where Nc, Nγ, and Nq = Meyerhof dimensionless bearing capacity factors (Appendix
Table B.4)
sc, sγ and sq = Meyerhof dimensionless shape factors (Appendix Table B.5)
dc, dγ and dq = Meyerhof dimensionless depth factors (Appendix Table B.6)
(Other terms are previously defined)
Up to a depth of Df ≈ B in Figure 3.2, the Meyerhof qult is not greatly different from
the Terzaghi value but the difference becomes more pronounced at larger Df/B ratios
(Bowles, 1996). Bowles (1996) suggests that the Terzaghi bearing capacity method
is useful for estimating of qult of cohesive soils where Df/B ≤ 1. It is a good practice
to use at least two methods and compare the computed values of qult. If the two
values do not compare well, it would be good to use a third calculation method (i.e.
Hansen Method, Vesic Method).
The ultimate bearing capacity is the maximum foundation pressure that soil under
the footing can support before failure in shear failure. In order to obtain the net
ultimate bearing capacity (qnu), which expresses the net maximum pressure that may
be applied to the base of foundation, the overburden pressure at depth Df should be
subtracted:
(3.4)
Dividing the net ultimate bearing capacity by a factor of safety, F, the net safe
bearing capacity can be calculated. Net safe bearing capacity, qn(safe), is the
maximum net intensity of loading that the soil can safely support without the risk of
shear failure (Shroff & Shah, 2003) (Eq. 3.5). The vital point is not to confuse net
safe bearing capacity with the allowable bearing capacity (qall). Allowable bearing
capacity embodies not only safety against shear but also acceptable settlement
criteria and is used in foundation design.
(3.5)
Page 55
41
where qn(safe) = net safe bearing capacity, kPa
qnu = net ultimate bearing capacity, kPa
F= factor of safety, (commonly 2.0~3.0 for apartments and office buildings)
(Vesic, 1975)
3.1.1.1 Effect of water table
The basic theory of bearing capacity is derived by assuming that the depth of water
table from the ground surface is equal or greater than (Df + B). However, the
presence of water table at any intermediate depth less than the depth (Df + B), the
strength of the soil is affected due to the presence of the water table. In determining
the effect of the water table on bearing capacity two cases may be considered.
Case I; 0 ≤ dw ≤ Df (dw is the depth of groundwater below ground surface)
For this case, the γtDf term should be changed to γtdw + (Df-dw)γ' and the term γt
associated with Nγ should be replaced by γ' (γ' effective unit weight of soil).
Case II; Df < dw ≤ Df +B
In this condition, ground water table is located below the bottom of the foundation.
In such case, the term γtDf remains unchanged but the term γt associated with Nγ
should be replaced by an average effective unit weight of soil, γav (Das, 1999) ;
(3.6)
3.1.2 Bearing capacity of layered subsoil
The bearing capacity methods described in previous section presume that the soil
underlying the foundation is uniform and extends to a great depth below the bottom
of the foundation; however, this is not always the case. The underlying soil strata
may be layered and may have different shear strength parameters. In the case of
layered soil profile, the depth of failure surface and the bearing capacity of the
footing are influenced.
Page 56
42
For the case of foundation on layered Mohr-Coulomb soil, where stronger layer is
underlain by weak soil, Meyerhof and Hanna (1978) developed a theory to estimate
the ultimate bearing capacity of a shallow rough continuous foundation. According
to their theory, at ultimate load per unit area, qult, the failure surface in soil will be as
shown in Figure 3.3.
Figure 3.3 Rough continuous foundation on layered soil - stronger over weaker soil (Das, 1999).
If H, the thickness of the layer of soil below the footing, is relatively large then the
entire failure surface will be within the top soil layer, and for this case the ultimate
bearing capacity has been described previously. However, if the ratio H/B is
relatively small, a punching shear failure will occur in the top (stronger) soil layer
followed by a general shear failure in the bottom (weaker) layer (Das,1999). For this
case, the ultimate bearing capacity of the shallow continuous foundation can be
given as:
Page 57
43
(
)
(3.7)
where,
(3.8)
and
(3.9)
where H = height of the top layer
Df = vertical distance from ground surface to bottom of footing, m
B = width of the footing
qt = bearing capacity of the top soil layer
qb = bearing capacity of the bottom soil layer
ø1 = angle of internal friction of top soil
Nc(1), Nq(1), Nγ(1) = bearing capacity factors corresponding to soil friction angle
ø1 (Appendix Table B.4)
Nc(2), Nq(2), Nγ(2) = bearing capacity factors for the bottom soil layer
corresponding to soil friction angle ø2 (Appendix Table B.4)
c1, c2 = cohesion of the top and the bottom (weaker) layer of soil, respectively
γ1, γ2 = unit weight of the top and the bottom soil layer, respectively
ca = unit adhesion (Appendix Figure B.2)
Ks = punching shear coefficient (a function of q2/q1 ratio) (Appendix Figure
B.3)
Note that q1 and q2 are the ultimate bearing capacities of a continuous surface
foundation of width B under vertical load on homogenous beds of upper and lower
soils, respectively, or (Das, 1999);
(3.10)
(3.11)
Page 58
44
For the case of when a foundation is supported by a weaker soil layer underlain by a
stronger soil at a shallow depth, as shown in the left-hand side of Figure 3.4, the
failure surface at ultimate load will pass through both soil layers (Das, 1999).
Figure 3.4 Foundation on weaker soil layer underlain by stronger layer (Das, 1999).
For estimating the ultimate bearing capacity of such foundations, Meyerhof (1974)
and Meyerhof and Hanna (1978) proposed the following semi-empirical
relationship.
(
) (3.12)
where D = depth of failure surface beneath the foundation in the thick bed of the
upper weaker soil layer (The magnitude of D/B varies from 1 for loose sand
and clay to about 2 for dense sands)
qt = ultimate bearing capacity in a thick bed of the upper soil layer
qb = ultimate bearing capacity in a thick bed of the lower soil layer
Page 59
45
So
(3.13)
And
(3.14)
3.1.3 Bearing capacity of shallow foundations on rock
The bearing capacity of foundations founded on rock masses depends mostly on the
ratio of joint spacing to foundation width, as well as intact and rock mass qualities,
joint condition, rock type, and intact and mass rock strengths. Various empirical
procedures for estimating allowable bearing capacity of shallow foundations on rock
are available in the literature. Peck et al. (1974) suggest an empirical procedure
based on the rock quality designation (RQD) index for estimating allowable bearing
pressures of foundations on jointed rock. In this regard, the approach of Peck et al.
(1974) uses the RQD directly to assess the allowable bearing stress (qall), provided
that the applied stress does not exceed the uniaxial compressive strength of the intact
rock (qall < qu). The predicted bearing capacities by this method shall be used with
the assumption that the foundation settlement does not exceed 12.7 mm (Peck et al.,
1974). The RQD relationship is shown in Figure 3.5.
Another empirical approach is proposed by Carter and Kulhawy (1988) by which
ultimate bearing capacity of fractured rock can be estimated. They suggest that the
Hoek and Brown strength criterion for jointed rock masses can be used in the
evaluation of bearing capacity. Their method is based on the unconfined
compressive strength of the intact rock core sample and rock mass quality (For
detailed information please see reference NCHPR, 2010). The ultimate bearing
capacity of the strip footing may be evaluated from Equation 3.15 as:
[√ ( √ )
] (3.15)
Page 60
46
where qult = ultimate bearing pressure, kPa
qu = uniaxial compressive strength of the intact rock, kPa
s and m = empirically determined strength parameters for the rock mass
(Appendix Table B.7)
Figure 3.5 Allowable bearing stress on fractured rock from RQD (after Peck et al., 1974).
In order to obtain allowable bearing capacity, the ultimate capacity is divided by a
safety factor which is generally dependent on RQD. It is common to use large safety
factors in rock bearing capacity from 6 to 10 with the higher values for RQD less
than about 0.75 (Bowles, 1996). When rock coring procedures result with no intact
pieces (RQD 0), estimates of soil parameters (ø and c) from the Geological Strength
Index (GSI) approach (Hoek et. al., 1995) may be used in traditional bearing
capacity equations.
Page 61
47
3.2 Bearing Capacity from Field Tests
In order to determine the bearing capacity of a foundation by using bearing capacity
equations, experimental determination of shear strength parameters is necessary but
it is better to remember that that field tests, if administered properly in the field,
ensure accurate results and take precedence because they constitute to lowest level
of disturbance (GDDA, 2005). In addition, for noncohesive foundation materials,
where undisturbed sampling is usually impractical, field tests are the only way to
estimate the material properties. So it is a common practice to estimate both the
bearing capacity and other soil properties by using internationally agreed empirical
correlations with field tests. The following in-situ tests may be used in determining
bearing capacity:
Standard Penetration Test (SPT)
Cone Penetration Test (CPT)
Pressuremeter Test (PMT)
3.2.1 Bearing capacity from SPT
The SPT is widely used to obtain the bearing capacity of soils directly. Meyerhof
(1956, 1974) proposed equations for computing allowable bearing capacity. Since
Meyerhof published equations, researchers have observed that its results are rather
conservative. Bowles (1977) adjusted the Meyerhof equation for an approximate 50
percent increase in allowable bearing capacity to obtain the following:
(
) (for B≤1.2 m) (3.16)
(
)
(
) (for B>1.2 m) (3.17)
Page 62
48
where qall = allowable bearing pressure, kPa
Kd = depth factor = 1 + 0.33(Df/B) ≤1.33
S = tolerable settlement, mm
B = width of the footing, m
In these equations, corrections, including overburden stress effects, should be done
on SPT “N” values and energy level adjustment should be 55 percent. N is the
statistical average value for the footing influence zone of about 0.5B above footing
base to at least 2B below (Bowles, 1996). Parry (1977) proposed computing the
allowable bearing capacity of cohesionless soils as
(kPa) (Df ≤ B) (3.18)
where N55 is the average SPT value at a depth about 0.75B below the proposed base
of the footing.
3.2.2 Bearing capacity from CPT
According to Meyerhof (1956) the allowable bearing capacity of foundations can be
computed using Eqs. (3.19) and (3.20).
(
) (for B≤1.2 m) (3.19)
(
)
(
) (for B>1.2 m) (3.20)
where qall = allowable bearing pressure, kPa
qc = average value of cone penetration resistance measured at depths from
footing base to 1.5B below the footing base, kPa
S = tolerable settlement, mm
B = width of the footing, m
Page 63
49
Bowles (1988), by reference to Schmertmann's studies, suggests using the following
relationships between ultimate bearing capacity and cone penetration resistance. For
cohesionless soils one may use
Strip foundation; (kg/cm
2) (3.21)
Square foundation; (kg/cm
2) (3.21a)
For clay one may use
Strip foundation; (kg/cm2) (3.22)
Square foundation; (kg/cm2) (3.22a)
where qc is averaged over depth interval from about B/2 above to 1.1B below the
footing base. This approximation should be applicable for Df/B≤1.5.
3.2.3 Bearing capacity from PMT
Menard (1965) proposed using the limit pressure measured in PMT to estimate
ultimate bearing capacity:
(3.23)
where qult = ultimate bearing pressure, kPa
Po = initial total vertical pressure at the foundation level, kPa
k dimensionless bearing capacity coefficient (Appendix Figure B.4)
PL* = net limit pressure = PL-P0h, kPa
PL = limit pressure (from test), kPa
P0h= total horizontal stress at rest, kPa
PLe* = equivalent net limit pressure near the foundation level, kPa
√
(3.24)
Page 64
50
where PL1…, PLn are the net limit pressures obtained from pressuremeter tests
performed within the depth from 1.5B above to 1.5B below foundation level.
3.3 Foundation Settlements
The other primary consideration that affects the selection and design of foundations
is foundation settlement. In the design of any foundation, both the safety against
bearing capacity failure and the excessive settlement of the foundation must be taken
into consideration. Settlement can be defined as the permanent downward
displacement of the foundation (Das, 1999). The settlement of a foundation can have
three components and results from one, or more likely, a combination of the
following:
a) Immediate Settlement (si): It takes place during load application and is
completed shortly after loading. This settlement may result from elastic
deformation of the material supporting the foundation without any change
in the moisture content. Immediate settlement analyses are used for all fine-
grained soils including silts and clays with a degree of saturation S<90
percent and for all coarse-grained soils with a large coefficient of
permeability [say, above 10-3
m/s] (Bowles, 1996).
b) Primary Consolidation Settlement (sc): It is a time-dependent process and
takes place as a result of expulsion of some pore water from soil as the
loads are applied. Consolidation settlement analyses are used for all
saturated, or nearly saturated, fine-grained soils (Bowles, 1996).
c) Secondary Consolidation Settlement (ssec): It is due to structural
reorientation of soil particles under constant loading. It is also referred as
creep settlement and occurs after the completion of the primary
consolidation settlement. It occurs in organic and sensitive soils.
Page 65
51
3.3.1 Immediate settlement calculations
The immediate vertical displacement (si) of a semi-infinite, homogeneous and
isotropic mass under a uniformly loaded area can be calculated from an equation
from the Theory of Elasticity as follows:
(3.25)
where si = immediate settlement of the footing, m.
qo = net vertical footing pressure, kPa
B' = least lateral dimension of contributing base area, m,
B' = B/2 for center; = B for corner.
µ Poisson’s ratio (Appendix Table B.8)
Es = Elasticity modulus (Appendix Table B.9)
m = number of corners contributing to settlement,
m = 4 for center; = 1 at a corner
Is = shape and rigidity factor (dimensionless) (Appendix Table B.10)
Bowles (1996) states that the stratum depth (H) actually causing settlement is not
infinitely deep, but is either equal to 5B, where B is the least total lateral dimension
of base, or is the depth to where a hard stratum is encountered. Bowles (1996)
suggests taking “hard” as that where Es in the hard layer is about 10Es of the
adjacent upper layer. Also in most cases, the modulus in the formula is not constant
throughout the depth of soil. In order to obtain quite good settlement estimates, the
use of weighted average Es over the influence depth H would be correct.
An alternative immediate settlement calculation method for estimating the average
elastic settlement of a uniformly loaded flexible footing on a saturated clay (µ 0.5)
is proposed by Janbu et al., (1956). The equation for computing the settlement may
be expressed as
Page 66
52
(3.26)
where si = immediate settlement of the footing
μ0 and μ1 = empirical factors dependent on the foundation geometry
(Appendix Figure B.5)
q, B, Es are described previously
3.3.2 Primary consolidation settlement calculations
Consolidation settlement of saturated cohesive soils is calculated on the basis of
parameters obtained in the oedometer test. Equation 3.27 is used for one-
dimensional consolidation (soed) settlements of normally consolidated soils.
(3.27)
where soed = One-dimensional oedometer consolidation settlement, m
Cc compression index from e versus log σ' plot
e0 = in situ void ratio in the stratum where Cc was obtained
H = Stratum thickness, m. If the stratum is very thick (say 6+ m) it should be
subdivided into several sublayers of Hi = 2 to 3 m, with each having its own
e0 and Cc (Bowles, 1996)
σ'0 = Effective overburden pressure at midheight of H
Δσav = average stress increase from the foundation loads at the middle of the
clay layer
For soils in an overconsolidated state, the settlement calculation is similar to that of
normally consolidated ones, except that now some compression will be along the
recompression line (recompression index Cr is used for calculations) and then it
follows the normal consolidation line. In Appendix Table B.11 several correlation
equations are listed that might be used to make compression index estimates.
Page 67
53
The alternative form of one-dimensional consolidation settlement calculation is
given in Equation 3.28:
(3.28)
where soed = One-dimensional consolidation settlement, m
H = Stratum thickness, m (If H is very thick, it should be subdivided as stated
before.)
mv = coefficient of volume compressibility obtained from oedometer test
Δσ' = average effective stress increase at the middle of the clay layer
is also used. It should be taken into consideration that the mv value varies with the
range of vertical stress, and in the calculations, the mv value that corresponds to
stress increase caused by foundation should be used. The average vertical stress
increase in the stratum of thickness H due to foundation load can be obtained by
using numerical integration process or by approximate considerations such as
trapezoidal rule.
Correction is necessary for these two methods because compressibility parameters
obtained from oedometer test is one-dimensional. However at site this condition is
not valid and deformations are three-dimensional. The correction is made by
applying a ‘geological factor’ μg to the one-dimensional oedometer settlement by the
following expression.
(3.29)
where sc = Three dimensional consolidation settlement, m
Published values of μg have been based on comparison of the settlement of actual
structures with computations made from laboratory oedometer tests. Values
established by Skempton and Bjerrum (1957) are shown in Appendix Table B.12.
Page 68
54
3.3.3 Secondary consolidation settlement calculations
The secondary consolidation settlement, ssec, can be calculated as
(3.30)
where ssec = Secondary consolidation settlement, m
Cα = secondary compression index (Appendix Table B.11)
H = thickness of consolidating stratum at the end of primary consolidation
tp = time corresponding to the completion of the primary consolidation
t = time at which the secondary compression settlement is to be computed
3.4 Structural Tolerance to Settlement and Differential Settlements
Both the total downward settlement and the differential settlement of various parts
of a structure should be within acceptable limits to not to cause structural or
architectural distress. Hence, it is important to determine the total settlement and
differential settlements of a structure. Differential settlement is relative settlement
between different parts of a structure and occurs due to one or more of the following
reasons (Birand et al., 2002);
a. Variations in soil strata
b. Variations in foundation loading
c. Large loaded areas on flexible foundations
d. Differences in time of construction of adjacent parts of a structure
e. Variations in site conditions (old and new parts)
Another parameter that may be useful in the design of the foundation is the
maximum angular distortion (δ/L), defined as the differential settlement between
two points divided by the distance between them (Day, 2006). In Table 3.2, limiting
values for maximum settlement, maximum differential settlement, and maximum
angular distortion to be used for building purposes, are summarized.
Page 69
55
Table 3.2 Tolerable differential settlement of buildings (Skempton and MacDonald, 1956)
3.5 Modulus of Subgrade Reaction
The modulus of subgrade reaction, ks, is a conceptual relationship between soil
pressure and deflection that is widely used in the structural analysis of foundation
members (Bowles, 1996) (Appendix Figure B.6). It is most commonly determined
from plate loading tests and is affected by factors such as size, shape and embedded
depth of the plate. Terzaghi (1955) proposed that ks for footings of width B could be
obtained from plate load test data using the following equations:
For footings on clay;
(3.31)
For footings on sand;
(3.32)
where ks = desired value of modulus of subgrade reaction for full size foundation
k1 = value obtained from a plate-load test
Page 70
56
B1 = side dimension of the square base used in the load test. In most cases
B1=0.3 m, but whatever B1 dimension was used should be input. Also this
equation disrupts when B/B1 ≈ >3
On large projects it may be feasible to construct a test section and perform plate load
tests but because the plate load test is time consuming and expensive, is not
commonly run in practice. Besides the plate load test, the subgrade modulus can also
be obtained from empirical correlations. One useful correlation proposed for sandy
soils by Scott (1981) between coefficient of subgrade reaction (k) and corrected SPT
blow count (N1)45 is:
(MN/m3) (3.33)
Another correlation is suggested by Bowles (1996) in which ultimate bearing
capacity qult furnished by the geotechnical consultant is used for approximating ks.
The equation can be expressed as:
(kN/m3) (3.34)
where qult is furnished in kPa. This equation is based on the ultimate soil pressure
causing a settlement of ΔH 0.0254 m and ks is qult / ΔH. For ΔH 6, 12, 20 mm, the
factor 40 can be adjusted to 160, 83, 50 respectively. Table 3.3 may be used as guide
and for comparison when using approximate equations.
Page 71
57
Table 3.3 Range of modulus of subgrade reaction (Bowles, 1996)
Page 72
58
CHAPTER 4
GEOTECHNICAL REPORT
After completion of the field and laboratory works of a geotechnical investigation,
the collected data is evaluated, interpreted and presented in a report. The preparation
of geotechnical investigation report requires special knowledge and skills therefore
they must be prepared by an appropriately qualified professional, geotechnical
engineer.
4.1 What is Geotechnical Report?
The geotechnical report is the tool used to communicate the site conditions, design
and construction recommendations to the contractor, design and construction
personnel. A geotechnical report typically provides an assessment of existing
subsurface conditions at a project site, by presenting, describing and summarizing
the procedures and findings of any geotechnical analyses performed. In addition, the
report provides appropriate recommendations for design and construction of
foundations, earth retaining structures, embankments, cuts, and other required
facilities (Mayne et al., 2001). The report also includes background information
about site conditions, geologic features, work scope and data presentation obtained
from field and laboratory tests. The report serves as the permanent record of all
geotechnical data known to be pertinent to the project and is referred to throughout
the design, construction, and service life of the project (NDOT, 2005). Hence, it is
very important that all the obtained information, calculations and recommendations
should be presented in a logical and orderly format in the geotechnical report. Most
companies have their own format for presenting their reports, which makes it
difficult to understand and control the reports. In Turkey, the format of Ministry of
Environment and Urbanism is used for geotechnical investigation reports of
Page 73
59
ordinary buildings (Table 4.1). In Table 4.1, the major elements of the report
contents are presented in subtitles.
4.2 General Information
In the first part of the report, the scope of the work is introduced and general
information about the investigation site is presented. The purpose of the
investigation should be explained briefly and site location should clearly be
described. Information about the size and shape of the site and its location relative to
any roads and access routes should also be presented. The geomorphological and
environmental information, project information including formal name of the
project, dimensions and purpose of use of the proposed construction, information
from previous reports, and general geology information of the site are given in the
first part.
Page 74
60
Table 4.1 General report format of geotechnical investigations for ordinary buildings (Ministry of
Environment and Urbanism, 2005)
COVER PAGE
TABLE OF CONTENTS
1. GENERAL INFORMATION
1.1 Objectives and Scope of Study
1.2 Introduction of Study Area
1.2.1 Geomorphological and Environmental Information
1.2.2 Information about the Project
1.2.3 Development Plan Status
1.2.4 Previous Site Investigations
1.3 Geology
1.3.1 General Geology
1.3.2 Engineering Geology of the Study Area
2. FIELD STUDIES AND TESTS
2.1 Description of field and laboratory working methods and equipment
used in
2.2 Trial Pits
2.3 Drilling Wells
2.4 Groundwater and Surface Water
2.5 Field Experiments
2.5.1 Standard Penetration Test
2.5.2 Cone Penetration Test
2.5.3 Pressuremeter Test
2.5.4 Vane Test
2.5.5 Plate Loading Test
2.5.6 Geophysical Surveys
3. LABORATORY TESTS and ANALYSES
3.1 Determination of Soil Index/ Physical Characteristics
3.2 Determination of Mechanical Properties of Soils
3.3 Determination of Mechanical Properties of Rocks
4. ENGINEERING ANALYSES and EVALUATIONS
4.1 Examination of Building-Soil Relationship
4.2 Evaluation of Soil and Rock Types
4.2.1 Classification of Weathered Rocks and Soils
4.2.2 Classification of Rocks
4.2.3 Soil Profile Interpretation
4.2.4 Liquefaction Analysis
4.2.5 Evaluation of Shrink/Swell Potential
4.2.6 Assessment of Karst Cavities
4.2.7 Evaluation of Foundation Soil Properties
4.2.8 Slope Stability Analysis
4.2.9 Interpretation of Security of Excavation and Necessary
Measures
4.2.10 Natural Disaster Risk Assessment
5. CONCLUSION and RECOMMENDATIONS
6. REFERENCES
7. APPENDICES
Page 75
61
4.3 Field Studies and Tests
This section should describe the procedures followed in field studies and tests. It
should contain an identification of each fieldwork technique employed, the locations
and elevations at which each was used, the range of depths to which each was taken
and the dates over which this work was done (AGS, 2005). Any supplementary
references which define procedures for each investigation technique and references
appropriate to interpretation should be given. Both the constraints on access and the
difficulties that are encountered during each field test should be explained.
The sampling strategy should be stated, the types of samples taken should be
identified and their transportation and storage conditions should be described.
Groundwater conditions encountered during the investigation should also be
presented. Monitoring records, with their location information, should be given in
this section.
4.4 Laboratory Tests and Experiments
In this part of the report, the type and number of tests, as well as the relevant test
reference numbers together with the location in the report should be presented. The
conformity of laboratory tests to ground conditions and the reasons of which
laboratory test is chosen should declared. Test results should be presented, together
with tabulations of the results of all tests of the same type and if appropriate the
results of different test types on the same material (AGS, 2005). The detailed results
and graphs of the laboratory tests are to be presented in tabular form in the
appendices part of the report.
4.5 Engineering Analyses and Evaluations
The purpose of this section is to provide enough supporting analyses, computations
and discussions so that the basis for the geotechnical conclusions is clear to the
Page 76
62
reader. Selection of design parameters, whether values are determined by
laboratory/field testing or through other approaches such as correlations, should be
discussed and any assumptions should be clarified. The methods of analyses, such as
Meyerhof’s bearing capacity analysis or Terzaghi's consolidation theory for
settlement analysis, should be identified. When applicable, analyses for alternate
foundations including spread footings, driven piles and drilled shafts should be
provided (NDOT, 2005).
4.6 Conclusions and Recommendations
The report should contain a general conclusion or opinion as to the adequacy of the
site for the intended use, conclusions as to the site’s overall stability, and ability of
the onsite materials to support the proposed structures (Technical Guidelines for
Geotechnical Reports, 1993). The reader of the report should be able to understand
the geotechnical settings and possible engineering limitations after reading the
report. The detailed recommendations and discussions, such as (i) whether the
proposed development will adversely affect the current state of stability of adjoining
land, (ii) whether the proposed development should allow cuts and fills and if so, to
what depth, (iii) whether any special design features are required to stabilize or
maintain the stability of the subject land, or portions of the subject land; should be
submitted. Also, construction recommendations should be included at the end of the
report for a clear description telling the contractor what to or not to do during
construction.
4.7 References and Appendices
After a formal list of references, appendices are to be presented. In typical
appendices, topographic site plan, test location plans (Appendix Figure C.1),
geologic cross-sections and idealized soil profile (Appendix Figure C.2), subsurface
exploration data in the form of borehole logs, and finally laboratory test and
instrumentation results are to be presented in a complete manner.
Page 77
63
CHAPTER 5
EVALUATION OF GEOTECHNICAL REPORTS
In this study, a total number of 60 geotechnical reports from all central
municipalities of Ankara (Altındağ, Çankaya, Etimesgut, Gölbaşı, Keçiören,
Mamak, Sincan and Yenimahalle) and 6 geotechnical reports from other city
municipalities (Antalya, Çankırı, Çorum, İskenderun, Kırıkkale, and Konya) are
randomly collected and evaluated. In order to clarify the word “randomly”, it can be
said that these collected reports are not specifically chosen for being deficient. They
are casually collected from current archives of municipalities by taking the
necessary permissions from the related people and institutions, which is the most
challenging part of this study. All the evaluated reports are listed in Appendix Table
D.1 and the locations of reports from Ankara municipalities are illustrated in
Appendix Figure D.1. In the collected reports, main soil types of the study areas are
specified as 37% rock, 29% high plasticity clay, 23% low plasticity clay, 5% sand,
4% silt and 2% gravel.
5.1 Methodology
The evaluation of the collected reports is performed according to 36 different
criteria. These criteria are shortly explained item by item below:
Is there project information?
By this criterion, whether project information about proposed structure such as, site
plan, building dimensions, number of floors, is presented in reports is checked.
Are boreholes properly distributed over the study area?
With this criterion, the distribution plan of subsurface exploration locations on the
study and building area is checked.
Page 78
64
Is borehole frequency adequate?
In evaluation of this criterion, minimum 2 boreholes for building area smaller than
500 m2, and one extra borehole for each additional 250 m
2 is adopted as necessary.
In reports in which project information is not presented, the building area is assumed
to be one-third of the study area.
Are borehole depths adequate?
In this point of evaluation, suggestions of Özdemir (2005), which are stated in
section 2.1.3.1, are taken into consideration.
Are coordinate and elevation data of sub-surface explorations recorded?
This audit question is incorporated in this study because this information is
important in interpreting cross-section between sub-surface locations in a good
manner. It can be also regarded as a proof of the undertaken explorations.
Are undisturbed soil samples taken from each layer?
By this criterion, whether undisturbed samples are obtained from each defined
soil/rock layer is checked.
Are core samples obtained from rock masses?
With this criterion, it is controlled that whether core samples are obtained from rock
masses or not.
Is the number of undisturbed soil samples or cores sufficient?
If there are at least two samples taken from each identified appropriate layer is
checked by this query.
Are core recovery parameters determined?
Whether and how often core recovery parameters (TCR and RQD) of rock samples,
are determined in field studies and specified in the reports.
Are the field experiments suitable for the ground they were applied?
In accordance with the borehole logs, the control of suitability of the in-situ tests
with the ground they were applied is done by this criterion. The most appropriate in-
situ tests for the related ground conditions are explained in section 2.1.4.
Is information about level of groundwater presented?
By this criterion, it is controlled that whether groundwater level of the study area is
measured or not.
Page 79
65
Is the frequency of SPT sufficient in a borehole?
By this criterion, it is checked that whether SPT is performed in boreholes at regular
intervals of 1.5 m.
Are the SPT correction factors applied to raw data?
This criterion is used to evaluate the implementation of necessary correction factors,
which are discussed in section 2.1.4, on obtained field SPT raw data.
Are the laboratory tests performed for each layer? (UD. core)
By this criterion, laboratory tests, which are only able to be performed on
undisturbed soil samples and rock cores, are checked. A minimum number of two
tests for each layer is the basis of this criterion.
Are the laboratory tests performed for each layer? (index)
With this audit question, it is checked that whether “index tests”, which are specified
in Table 2.7, is performed for each layer.
Is hydrometer test performed on soil samples containing high ratio of fine
particles?
The frequency of implementation of hydrometer test on soil samples containing fine
particles more than 70 percent is assessed by this criterion.
Is consolidation test conducted?
The interest point of this criterion is, if consolidation test is conducted on
proper/necessary samples.
Is unload-reload cycle performed in consolidation test?
The aim of this inquiry is to determine that how often unload-reload cycle is
implemented within the scope of consolidation tests.
Are swelling pressure and percentage data obtained from consolidation
test?
By this criterion, the information obtained and presented about the swelling
properties of the ground is investigated.
Is any other parameter except from the coefficient of volume of
compressibility (mv) obtained from consolidation test?
Whether other parameters, such as compression/swelling/reloading index/ratio are
presented in consolidation test results are examined by this criterion.
Page 80
66
Is triaxial test conducted?
Whether triaxial test is performed or not on necessary samples is controlled with this
question.
Are there 3 Mohr’s circles in determining failure envelope?
Although two compression test results are theoretically sufficient for determining
the failure envelope, use of at least three Mohr’s circles is suggested, as stated in
section 2.1.5.1. By this interrogation, the number of Mohr’s circles used in
determining the failure envelope is controlled.
Are Mohr’s circles that are used in determining failure envelope far enough
away from each other?
For a proper failure envelope, it is necessary that Mohr’s circles should be distant
from each other. Otherwise, small errors in measured stresses may cause large errors
in the strength parameters. For this reason, it is checked that whether center points of
Mohr’s circles are not located in the area of former circles.
Is failure envelope properly drawn?
This examination is concentrated on whether the failure envelope is the best tangent
of Mohr’s circles and whether the failure envelope is horizontal for a completely
saturated cohesive soil in an UU test.
Which laboratory tests are conducted on core samples?
By this question, the frequency of laboratory tests on rock core specimens (point
load test, uniaxial (unconfined) compression test, triaxial (confined) compression
test, etc.) is investigated.
Is idealized soil profile created?
This question is about, whether an idealized sub-surface profile(s) showing the
differentiation of the various formations of the study area is constructed or not.
Are the strength parameters of soil obtained with more than one way and
get averaged?
By this criterion, it is tried to be determined that how the strength parameters of soils
or rocks (cu, c, ø, E) are obtained, using both the laboratory test and in-situ test
results or adhering to only a single test or method.
What is the bearing capacity calculation method?
Page 81
67
It is investigated that which formula or method for calculating the bearing capacity
of soils and rocks is used more intensively.
Are SPT results used in determining bearing capacity of soil?
Whether the corrected standard penetration test results are used in design
calculations is controlled by this query. The reason of why specifically “SPT results”
is stated in query will be clarified in section 5.2.5.
Is bearing capacity calculated from allowed settlement consideration?
Since allowable bearing capacity comprises not only safety against shear but also
acceptable settlement criteria, technical calculations in collected reports are
controlled in this respect.
Are bearing capacity and settlement calculations correct?
The calculations done for the two major causes for foundation failure, bearing
capacity and settlement, is tested by this audit question.
Are bearing capacity and settlement calculations calculated for the same
foundation dimensions?
In order to represent meaningful information to design engineer, it is necessary to
calculate both the bearing capacity and settlement for the same foundation
dimensions. The validity of this keynote is examined by this criterion.
Is the depth of foundation used in calculations reasonable?
By this criterion, the foundation depth used in technical calculations is checked in
accordance with the project information presented in reports. For example, for a
building with a basement floor, a foundation depth of 1 m from surface level, or a
depth of 7 m for a building without a basement, are accepted as incorrect.
Is stress dissipation calculated?
It is checked that whether stress dissipation with depth is computed and used in
calculations, by this criterion.
Are the foundation dimensions taken into consideration in determining the
modulus of subgrade reaction?
As it is clearly stated in question, it is checked that whether foundation dimensions
are considered in determining the subgrade modulus.
Is the subgrade modulus found by using correlations or tables?
Page 82
68
The frequency of using correlations or tables in estimating subgrade modulus is
explored by this inquiry.
The results of the assessments are collected in a table. The full state of the prepared
table for this study is presented in Appendix Table D.2 on the back side of the thesis
in CD. In order to show a proper representation of the results, the complete table is
turned into small summary tables and the evaluation results are shown in the
following tables in parts.
5.2 Results
5.2.1 Discussions on results of desk study and subsurface investigations
The compliance of subsurface investigations with the construction project, the
distribution and frequency of the investigations, and the coordinate and the depth
information of the explorations have been checked by the questions presented in
Table 5.1, in accordance with the principles described sections 2.1.1 and 2.1.3.
Table 5.1 Criteria and inspection results on desk study and subsurface investigations
YES NO OTHER
Is there project information? (Site plan,
building dimensions, number of floors) 9% 14%
77% (only floor
information)
Are boreholes properly distributed over the
study area? 14% 7%
79% (no
information)
Is borehole frequency adequate? 73% 27% -
Are borehole depths adequate? 32% 68% -
Are coordinate and elevation data of sub-
surface explorations recorded? 2% 98% -
Page 83
69
When Table 5.1 is analyzed, it is seen that the desk studies and field survey plans are
insufficient in current practice. Information, such as the sitting area of the proposed
structure, dimensions, numbers of floors, basement-foundation depth are only
presented in 9% of the reports and the reports that have no such information are
14%. In 77% of the reports, this section is glossed over by just giving number of
floors only. The same negligence is continued while establishing the drilling
location plans, frequency and the depth of drillings. It is striking that coordinate and
elevation information for subsurface explorations is given in only one of the reports,
and in 79% of the reports, where the subsurface explorations were conducted is not
shown on a scaled plan. Also, in a significant proportion of the field studies the
frequency of explorations is insufficient. Furthermore, more than two thirds of
drilling studies do not extend to the required depth.
5.2.2 Discussions on results of sampling
The number and frequency of samples taken from the site for the laboratory
experiments are checked by also considering the soil structure of the site. The
criteria and the evaluation results are presented in Table 5.2.
Table 5.2 Criteria related to sampling and core recovery, and the percentage values of the results
YES NO
Are undisturbed soil samples taken from each layer? 7% 93%
Are core samples obtained from rock masses? 86% 14%
Is the number of undisturbed soil samples or cores
sufficient? 17% 83%
Are core recovery parameters determined? (TCR, RQD) 100% RQD, 75% TCR
Page 84
70
Table 5.2 shows us that the sampling studies do not comply with relevant rules. A
frequently seen condition on the subject of taking undisturbed samples is to obtain
samples at a depth of two to three meters and not to obtain any additional samples
from deeper depths, even if this sole sample is above the foundation level. With a
starting point below foundation level, undisturbed sampling at regular intervals, and
if stratification is present, sampling from each proper layer is necessary. However, in
nearly all reports it seems like there is no awareness of this. Although, rock core
samples are mostly taken from rock formations, the number of core samples taken is
insufficient. The situation is same with that of undisturbed sampling, only taking a
core from a level close to surface and not taking any from greater depths. 83% of the
reports are not sufficient in undisturbed and core sampling. Core recovery
parameters, RQD and TCR, are indicated in most of the reports, however, the type
of coring equipment, which affects these parameters generally goes unspecified.
5.2.3 Discussions on results of in-situ tests
The experimental data of in-situ tests, presented in geotechnical reports, are
examined not only according to their properness to ground they were applied, but
also their number, frequency and correction states of obtained raw data are
controlled. Assessments are done by considering the soil-ground structure. Results
are presented in Table 5.3.
Table 5.3 Criteria related to in-situ tests and the percentage values of the examination results
YES NO
Are the field experiments suitable for the ground they
were applied? 87% 13%
Is information about level of groundwater presented? 70% 30%
Is the frequency of SPT sufficient in a borehole? 79% 21%
Are the SPT correction factors applied to raw data? 29% 71%
Page 85
71
As a result of the examinations related to in-situ tests, it is seen that no test other
than SPT is conducted. In-situ tests suitable for the study area are not selected,
implemented and standard penetration test is conducted in all kinds of soil and rock.
Whereas, as discussed in section 2.1.4, the most suitable in-situ test method for the
soil structure should be selected and properly applied. A promising 87% of the
reports answer “yes” to the question “Are the field experiments suitable for the
ground they were applied?”. This is not necessarily because people are adept in
selecting the suitable field test type, but more likely it is because the SPT is suitable
for a great variety of ground conditions. However, SPT is not particularly useful in
the characterization of gravel deposits and soft clays. The percentage of insufficient
standard penetration tests in boreholes is 21, which shows us that SPT is not
occasionally performed regularly on 1.5 m intervals. In the reports of 71%, no
correction factor is applied to the raw field SPT N-value and even information about
the energy level of the test system used is not given. In thirty percent of the reports
information about groundwater level is not submitted. Additionally in none of the
studies, short or long term changes of groundwater level is measured or discussed.
5.2.4 Discussions on results of laboratory experiments
At the part of the study related to laboratory experiments, the tests are controlled
whether they meet the project requirements and also whether they are compatible
with soil structure or not. In addition, number and frequency of laboratory tests, and
the experiment results presented in reports are checked. The results of examination
are shown in Table 5.4.
By examining the table containing the criteria and results related to laboratory
experiments, it can safely be said that, as in the previous stages, an adequate level of
awareness does not exist in current practice. As a result of not taking sufficient
number of undisturbed samples, it is observed that laboratory tests for determining
engineering properties of soil is not performed in necessary numbers. The
hydrometer test is performed on only 3% of samples in which the fine particles are
Page 86
72
identified at a high ratio. Consolidation test is not conducted on almost one-third of
the appropriate samples and none of the performed tests have an unload-reload
cycle. Additionally, triaxial compression test is not conducted on the appropriate
samples of 51%. None of the triaxial test results includes three Mohr’s circles. Even
though, two circles is sufficient for determining the failure envelope, use of at least
three Mohr’s circles, each obtained at different lateral pressure, would prevent
variability in experimental results. Additionally, circles that are used in determining
failure envelope are not away from each other in 33% of the test results.
Table 5.4 Criteria related to laboratory experiments and the results of inspection in percentage
YES NO
Are the laboratory tests performed for each layer? (two
tests for each layer)(UD, core) 3% 97%
Are the laboratory tests performed for each layer? (two
tests for each layer)(Index) 17% 83%
Is hydrometer test performed on soil samples containing
high ratio of fine particles? 3% 97%
Is consolidation test conducted? 70% 30%
Is unload-reload cycle performed in consolidation test? 0% 100%
Is any other parameter except from the coefficient of
volume comp. (mv) obtained from consolidation test? 0% 100%
Is Triaxial test conducted? 49% 51%
Are there 3 Mohr’s circles in determining failure
envelope? 0% 100%
Are Mohr’s circles that used in determining failure
envelope far enough away from each other? 67% 33%
According to triaxial test results, is the failure envelope
properly drawn? 83% 17%
Are swelling pressure and percentage obtained from
consolidation tests?
62% only percentage,
38% both of them
Which laboratory tests are conducted on core samples?
(Point load test, Uniaxial compressive strength)
96% Point load test,
4% Uniaxial comp.
Page 87
73
Whether the failure envelope is properly drawn or not is also examined. As a result,
17% of the envelopes are not properly drawn. The uniaxial compressive strength of
rock core samples is mostly obtained by the indirect method such as point load test.
The usage frequency of uniaxial compression test, which is more expensive but
more accurate, is remains at 4% of the reports that characterize rock formations.
5.2.5 Discussions on results of foundation calculations
Within the scope of the study, the bearing capacity and settlement calculations
presented in geotechnical reports are examined, and questioning of whether the
results obtained from laboratory and field experiments are properly used in technical
calculations is made. The resulting percentage values are presented in Table 5.5.
Table 5.5 Criteria related to foundation design and the results of inspection in percentage
YES NO
Is idealized soil profile created? 4% 96%
Are the strength parameters (cu, c, ø, E) of soil obtained
with more than one way and get averaged? 9% 91%
Are SPT results used in determining bearing capacity of
soil? 32% 68%
Is bearing capacity calculated from allowed settlement
consideration? 22% 78%
Are bearing capacity and settlement calculations
correct? 67% 33%
Are bearing capacity and settlement calculations
calculated for the same foundation dimensions? 29% 71%
Is the depth of foundation used in calculations
reasonable? 67% 33%
Is stress dissipation calculated? 2% 98%
Are the foundation dimensions taken into consideration
in determining the modulus of subgrade reaction? 0% 100%
Is the subgrade modulus found by using correlations or
tables?
5% correlation, 95%
table
Page 88
74
As shown in Table 5.5, an idealized soil profile for the study area is being prepared
and submitted in only three of the reports. In 91% of the reports, geotechnical design
parameters, which are used in calculations and directly affect the design principles,
are obtained by adhering to only a single test or method. As a result of
investigations, no any other in-situ test other than SPT is encountered. In addition, in
68% of the reports, which have SPT in their contents, SPT results are not used in
design calculations. Disregarding field test results, which reliably reflect the in-situ
properties of underlying soil, is really surprising. If this were the proper conduct,
there would be no need to perform in-situ tests that would not be used. Another
mistake observed in reports is related to allowable bearing capacity values. The
allowable bearing capacity is directly found by dividing the ultimate strength
capacity by a safety factor. However, allowable bearing capacity embodies not only
safety against shear but also acceptable settlement criteria. In 78% of the reports,
acceptable settlement criterion is not taken into consideration in determining
allowable bearing capacity. Also, bearing capacity or settlement calculation are
incorrect in one-third of the reports. In 71% of the reports, foundation dimensions
used in bearing capacity and settlement calculations are different from each other,
which do not make any physical sense. As emphasized in the explanation for the
related question, unacceptable foundation depth values are suggested and used in
bearing capacity or settlement calculations in a third of the reports. Only in one the
reports, dissipation of vertical stress with depth is specified. In determination of
modulus of subgrade reaction, foundation dimensions are not taken into account,
values of subgrade modulus were simply selected from related tables. The
percentage distribution of bearing capacity calculation methods used in collected
reports are presented in Figure 5.1.
None of the examined reports can be regarded as perfect, however, report no. 66,
which is rated best, is presented on the back side of the thesis in CD to set as an
example. It should be noted that none of the evaluated geological/geotechnical
reports, except report no. 66 which is for a high-rise project, are signed by
geotechnical engineers.
Page 89
75
Figure 5.1 Bearing capacity calculation methods used in reports for shallow foundations on soil.
60%
21%
7% 12%
Terzaghi (1943)
Peck&Hanson (1974)
Meyerhof (1963)
Unknown
Page 90
76
CHAPTER 6
CONCLUSION AND RECOMMENDATIONS
This thesis intends to identify missing/incorrect suggestions that are frequently
performed in geotechnical reports prepared by different institutions for low-rise
housing projects. Because of experiencing most of the loss of property and life due
to earthquakes in low-rise buildings, it is clear that there are some problems in this
field. For this purpose, 66 geotechnical reports are randomly collected from current
archives of municipalities and evaluated. 60 pieces of reports out of these 66 are
collected from municipalities of all central districts of Ankara (Altındağ, Çankaya,
Etimesgut, Gölbaşı, Keçiören, Mamak, Sincan and Yenimahalle), and the remaining
6 reports are obtained from other city municipalities (Antalya, Çankırı, Çorum,
İskenderun, Kırıkkale, and Konya). The evaluation is done according to 36 different
technical criteria considered important. Statistical evaluation of deficiencies and
mistakes, determined according to these assessment criteria, is made.
6.1 Conclusion
The results of this thesis study do find that there are significant deficiencies and
mistakes in geotechnical reports of low-rise housing projects. Most of the reports are
inadequate in terms of office work and walk-over studies. In addition, it is observed
that in order to shorten the period of study and to reduce the work cost, the sampling
studies, in-situ tests and laboratory tests are not conducted in adequate numbers and
required context. In most of the reports, as there are insufficient numbers of tests,
the results obtained or interpreted from these inadequate investigations are not used
correctly in design calculations. Selections of suitable characteristic geotechnical
design parameters for the requirements of the project, settlement and stability
computations, which are perhaps the most important part of a geotechnical report,
are incomplete, insufficient or incorrect in a significant part of the reports. Also,
Page 91
77
general recommendations concerning problems that may be encountered during
excavations or construction of structures are mostly insufficient and consist of copy-
paste sentences. As a result of this study, it is believed that most of the people who
prepare and the people who control the reports either do not possess adequate
knowledge and background about geotechnical subjects, or are simply unaware of
the consequences of their substandard work.
6.2 Technical Recommendations
On the basis of the findings in this thesis, the following recommendations are made:
For an economic site investigation, also with an ability to meet project requirements,
preliminary information related to project site should be collected by an office work.
Geotechnical reconnaissance study should enclose review of geotechnical literature,
maps and aerial photographs, and detailed description of geotechnical conditions of
the site. A preliminary field investigation with a limited subsurface exploration may
also be included. In determining the frequency and the depth of drillings, the
geologic structure and seismicity of the region, load that will be applied by the
planned structure on the ground and stress distribution should be taken into account.
In-situ tests should be conducted by trained technicians under the control of
experienced engineers. In-situ testing should be done at frequent intervals and care
should be taken for quality of both testing and sampling equipment. Expenditures
for geotechnical site exploration should be increased. The numbers of undisturbed
soil samples taken and the laboratory testing of subsurface materials generally need
to be increased. In order to calculate primary foundation settlements, consolidation
test should be absolutely carried out on samples taken from all necessary layers. In
consolidation test loadings, the probable building load should be considered. Also,
unconsolidated-undrained triaxial compression test should definitely be done on
undisturbed samples taken from appropriate layers. It should not be forgotten that
this type of triaxial test is done for determining short term (undrained) parameters of
Page 92
78
soil and failure envelope of saturated fine grained soils should be drawn as ø 0°.
Consolidated triaxial tests must be employed if drained behavior is to be modeled.
On core samples, not only point load index test, but also other laboratory tests such
as unconfined compressive strength and elastic modulus should be performed.
In determining soil strength parameters, both the results obtained from laboratory
tests and strength values obtained by empirical approaches using in-situ results
should be considered together. In addition, an idealized soil profile must be created
with a realistic approach. Geotechnical engineer should be in contact with both
contractor and project engineer to be able to design all the investigations and
calculations according to the proposed structure. Foundation and slab design
recommendations based on site conditions should be provided. The report should
contain a general conclusion or opinion as to the adequacy of the site for its intended
use and ability of the onsite materials to support the proposed structures.
6.3 Policy Recommendations
All of the analyzed reports in this study are prepared and controlled without any
contribution of civil engineers. It is seen that civil engineers are left outside of these
studies. However, like many engineering issues, soil investigation and evaluation are
multi-disciplinary engineering subjects. Especially in building foundation works,
leaving civil engineers outside the issue and not allowing them to get involved in
preparation of geotechnical reports create greater problems. For this reason, the
correct approach for preparation of geotechnical reports is that different disciplines
that study the ground come together to deal with the topic, with their respective
education and experience.
In current practice, geotechnical investigations are performed with minimum cost
and maximum speed. By adding ignorance and inattentiveness to these two
erroneous approaches, the results that lack with engineering emerge. Also, there is
not a functioning control mechanism that may prevent these malpractice issues. To
Page 93
79
sum up, it is clear that geotechnical investigations are just seen as a procedural
detail. In order to construct safe and economic structures, greater attention to
geotechnical investigations is needed, and both professional chambers and
government agencies should seriously enhance their training and control
mechanisms without losing more time.
6.4 Recommendations to Widen the Scope for Future Work
The scope of this study can be expanded by increasing the number of analyzed
geological/geotechnical reports. Increasing the number of the reports results in
obtaining more accurate results and as well as determining the common errors.
Furthermore, the number of reports obtained from outside Ankara can be increased.
Obtaining greater number of reports from other cities prevents study remaining
limited to Ankara and attributes the results of study to whole country.
This thesis focused on reports that belong to small residential buildings. Other cases
that may be investigated are the condition of geotechnical reports prepared for large
projects (industrial buildings, skyscrapers, etc.) that have more capital to invest in
the site investigation, or projects containing complex or difficult geotechnical
problems.
Page 94
80
REFERENCES
Andresen A., Kolstad P., The NGI 54-mm Samplers for Undisturbed Sampling of
Clays and Representative Sampling of Coarser Materials, 1979. Proc. of the Int.
Conference on Soil Sampling, Singapore.
AGS (Association of Geotechnical and Geoenvironmental Specialists), 2005.
Guidelines for the Preparation of the Ground Report, UK.
Bieniawski Z. T., 1975. The Point Load Test in Geotechnical Practice. Eng. Geol.,
Sept., pp. 1-11.
Birand, A., Ergun, U., Erol, O., 2002. CE 366 Foundation Engineering-1 Lecture
Notes. METU, Ankara.
Broch, E. and Franklin, J.A., 1972. The Point Load Strength Test. International
Journal Rock Mechanics and Mining Science, Vol. 9, pp. 669-697.
Bowles, J. E., 1996. Foundation Analysis and Design. McGrawhill Book Co, New
York-USA.
Bowles, J. E., 1988. Foundatıon Analyses and Design, McGrawhill. Book Co, New
York-USA.
Building Research Establishment, 1987. Site investigation for Low Rise Building:
Procurement. Bldg Res. Dig. No: 322.
Page 95
81
Carter, J. P., and F. H. Kulhawy, 1988. Analysis and Design of Foundations
Socketed into Rock. Report No. EL-5918. Empire State Electric Engineering
Research Corporation and Electric Power Research Institute, New York.
Clayton, C.R.I., Matthews, M.C., Simons, N.E., 1995. Site Investigation.
Department of Civil Engineering, University of Survey.
Das, B. M., 2011. Geotechnical Engineering Handbook. J. Ross Publishing Inc.
Company., USA.
Das, B. M., 1999. Shallow Foundations Bearing Capacity and Foundations. CRC
Press, London.
Day, R. W., 2006. Foundation Engineering Handbook. The McGrawhill Companies.
Durgunoglu, H.T. and Mitchell, J.K., 1975. Static Penetration Resistance of Soils,
Evaluation of Theory and Implication for Practice. Proceedings of the In-situ
Measurement of Soil Properties, Raleigh, NC, vol. 1, pp. 172-189.
Failmezger, R.A., 2008. Which in-situ test should I use? - A designer’s guide. Ohio
River Valley Soils Seminar 39, Cincinnati, Ohio.
GDDA (General Directorate of Disaster Affairs), 2005. Parsel Bazında Zemin-
Temel Etütleri ve Zemin İyileştirme İşleri Hakkında Yönetmelik Taslağı Ön Raporu.
Ankara.
Heck, W.J., 1970. Suggested Method of Test for Triaxial Compressive Strength of
Undrained Rock Core Specimens with Induced Pore Pressure Measurements.
Special Procedures for Testing Soil and Rock for Engineering Purposes, No: 479.
Hunt, R.E., 2005. Geotechnical Engineering Handbook. Second Edition, London.
Page 96
82
Hvorslev, 1949. Subsurface Exploration and Sampling of Soils for Civil Engineering
Purposes. Waterways Experimental Station, Vicksburg, USA.
Institution of Civil Engineers, 1991. Inadequate Site Investigation. London.
Janbu, N., Bjerrum, L. and Kjaernsli, B., 1956. Veiledring ved losning av
fundermenteringsoppgaver. Norwegian Geotechnical Institute Publication No.16,
Oslo.
Liao and R.V. Whitman, 1986. Overburden Correction Factors for SPT in Sand:
Journal of Geotechnical Engineering. ASCE, v. 112:3, p. 373-377.
Littlejohn, G. S., Cole, K. W. and Mellors, T. W., 1994. Without Site Investigation
Ground is a Hazard. Proceedings Inst. Civ. Eng., Vol. 102, May, pp. 72–78.
Look, B. G., 2007. Handbook of Geotechnical Investigation and Design Tables.
London.
Mayne, P. W., Christopher, B. R., DeJong, J., 2001. Manual on Subsurface
Investigations. Federal Highway Administration, Washington D.C.
Menard, L., 1965. The Determination of the Bearing Capacity and Settlement of
Foundations from Pressuremeter Tests: Proc. 6th Int. Conf. SMFE, Montreal, V.2.
Meyerhof, G. G. and Hanna A. M., 1978. Ultimate Bearing Capacity of Foundations
on Layered Soils under Inclined Load. Can. Geotech. J., vol. 15, pp. 565-572.
Meyerhof, G. G., 1974. Ultimate Bearing Capacity of Footings on Sand Layer
Overlaying Clay. Can. Geotech. J., vol. 11, no. 2, pp. 223-229.
Page 97
83
Ministry of Environment and Urbanism, 2005. Bina ve Bina türü Yapılar için
Zemin ve Temel Etüdü Raporu Genel Formatı.
http://www.csb.gov.tr/turkce/dosya/zemin.pdf [arrived on 27.01.2012].
National Research Council, 1984. Geotechnical Site Investigations for Underground
Projects. US National Committee on Tunneling Technology, Vol. 1, National
Academy Press, Washington.
NAVFAC DM (Naval Facilities Engineering Command), 1982. Soil Mechanics.
Available from Naval Facilities Engineering Command, 200 Stovall Street,
Alexandria
NCHPR (National Cooperative Highway Research Program), 2010. Design and
Construction of Shallow Foundations for Highway Bridge Structures. Washington.
NDOT (Nevada Department of Transportation), 2005. Geotechnical Policies and
Procedures Manual. Carson City, Nevada.
Özdemir, A., Ülgen, D., Özkan, Y., 2007. Ülkemizde Yapılan Geoteknik Etüt
Sondajları İle İlgili Bazı Değerlendirmeler. İnşaat Mühendisleri Odası 2. Geoteknik
Sempozyumu, Bildiriler Kitabı, pp. 473-479.
Özdemir, A., 2005. Türkiye Sondaj Yayınları (1934-2004). Sondaj Dünyası Dergisi.
Parry, R.H.G., 1977. Journal of Geotechnical Eng. Div. ASCE, 103, 1014.
Peck, R.B., Hanson, W.E. and Thornburn, T.H., 1974. Foundation Engineering.
Second edition, John Wiley and Sons, New York.
Rowe, R.K., 2001. Geotechnical and Geoenvironmental Engineering Handbook.
Academic Publishing, USA.
Page 98
84
Rusnak, J., 2000. Using the Point Load Test to Determine the Uniaxial Compressive
Strength of Coal Measure Rock. St. Louis, MO.
Sabatini, P.J., Bachus, R.C., Mayne, P.W., Schneider, T.E., 2002. Geotechnical
Engineering Circular No: 5, Georgia.
Samtani, N. C. and Nowatzki, E. A., 2006. Soils and Foundations Reference
Manual. National Highway Institute, U.S. Department of Transportation, Federal
Highway Administration, Washington, D.C.
Schmertmann, J. H. 1978. Guidelines for Cone Penetrometer Test, Performance and
Design. FHWA-TS-78-209, Federal Highway Administration, Washington, DC.
Schmertmann, J. H., 1970. Static Cone to Compute Static Settlement over Sand.
Journal of the Soil Mech. and Foundation Division. Vol. 96, No. 3, pp. 1011 1043.
Scott, R.F. 1981. Foundation Analysis. Prentice-Hall. Englewood Cliffs, N.J.
Shaik, A.W., 2007. Towards More Reliable Site Investigation Information. Jurutera
Perunding GEA (M) Sdn Bhd, Malaysia.
Shroff, A.V., Shah, D.L., 2003. Soil Mechanics and Geotechnical Engineering.
India.
Skempton, A. W., 1986. Standard Penetration Test Procedures and the Effects in
Sands of Overburden Pressure, Relative Density, Particle Size, Ageing and Over
Consolidation. Geotechnique 36: 3, September.
Skempton, A. W. and Bjerrum, L., 1957. A Contribution to the Settlement Analysis
of Foundation on Clay. Geotechnique, Vol. 7, pp. 168-178.
Page 99
85
Skempton, A. W. and McDonald D. H., 1956. The Allowable Settlements of
Buildings. Proc. Inst. Civ. Eng. Part III 5, 727-768, Discussion Closure: 783-784.
Skempton, A. W., 1953. The Colloidal Activity of Clays, Proceedings, 3rd
International Conference on Soil Mechanics and Foundation Engineering, London.
Technical Guidelines for Geotechnical Reports, 1993. City of Carlsbad, California.
Terzaghi, K. and Peck, R. B., 1948. Soil Mechanics in Engineering Practice. John
Wiley, New York.
Terzaghi K., Peck R.B., Mesri G., 1996. Soil Mechanics in Engineering Practice,
John Wiley and Sons, New York.
Topal, T., 2000. Nokta Yükleme Deneyi İle İlgili Uygulamada Karşılaşılan
Problemler. Department of Geological Engineering, METU, ANKARA.
U.S. Army Corps of Engineers, 2001. Geotechnical Investigations. Engineering and
Design Manual, Washington.
U.S. National Research Council, 1984. Geotechnical Site Investigations for
Underground Projects, Washington.
Whyte, I. L., 1995. The Financial Benefit from Site Investigation Strategy. Ground
Engineering, Oct., pp. 33–36.
Wright, S.G., 2005. Evaluation of Soil Shear Strengths for Slope and Retaining Wall
Stability Analyses with Emphasis on High Plasticity Clays, Austin.
Vesic, A. S., 1975. Bearing Capacity of Shallow Foundations. In Foundation
Engineering Handbook, Ed. Winterkorn, H F and Fang, H Y. Pub: Van Nostrand
Reinhold Co.
Page 100
86
APPENDIX A
SITE INVESTIGATION
Table A.1 Application of selected geophysical methods for determination of engineering parameters
(US Army Corps of Engineers, 2001)
Page 101
Table A.2 Numerical rating of geophysical methods to provide specific engineering parameters for engineering applications (US Army Corps of Engineers, 2001)
87
Page 102
88
Figure A. 1 a) Single tube core barrel, b) rigid type double tube core barrel, c) swivel type double
tube core barrel (Mayne et al., 2001).
Page 103
89
Figure A.2 Procedure for measurement and calculation of rock quality designation (Sabatini et al.,
2002).
Page 104
Table A.3 Sampling tools and methods (Hunt, 2005)
90
Page 105
Table A.3 Sampling tools and methods (Hunt, 2005) (continued)
91
Page 106
92
Table A.4 Specimen quality in terms of volumetric strain (Terzaghi et al., 1996)
Table A.5 In-situ test methods and general application (Bowles, 1996)
Page 107
93
Table A.6 In-situ tests for rock and soil (US Army Corps of Engineers, 2001)
Page 108
94
Figure A.3 Classification of soil based on CPT test results (Robertson and Wride, 1997).
Page 109
95
Figure A.4 Diagrammatic sketch of the Ménard pressuremeter (Gibson and Anderson 1961).
Page 110
96
Figure A.5 Representative grain size distribution curve (San Diego State University Geo. 552 lec.
notes, 2011).
Table A.7 Typical values of liquid limit, plastic limit, and activity of some clay minerals (Mitchell,
1976; Skempton, 1953)
Page 111
97
Table A.8 Unified soil classification system (American Society for Testing and Materials, 1985)
Figure A.6 The point load tester (Rusnak, 2000).
Page 112
98
Table A.9 Conversion factors, k, by various researchers (Topal, 2000)
Researcher Rock type k value
Bieniawski (1975) Sandstone 24
Wilson (1976) Very poor mudstone 8
Carter (1977 ) Limestone 26-28.5
Sandstone 24.5
Hassanı et al. (1980) Sedimentary rocks 29
Beawisetal (1982) Shale 8
Norbury (1986)
Sandstone 8-30 (generally 20-25)
Siltstone 15-35
Mudstone 18-35 (generally 20)
Hawkins & Olver (1986) Limestone 26.5
Bell (1992) Sandstone (dry) 12-19 (dry) - 7-12 (wet)
Limestone (dry) 20-30 (dry) - 14-24 (wet)
Anıl et al. (1996) Marble 24
Bowden et al. (1998) Chalk 11-21 (generally 14-17)
Page 113
99
APPENDIX B
FOUNDATION DESIGN
Figure B.1 Modes of bearing capacity failure (Vesic, 1973).
Page 114
100
Table B.1 Terzaghi bearing capacity factors (Das, 1999)
Table B.2 Commonly used shape factors for the Terzaghi equation (Day, 2006)
Shape of Foundation sc sγ sq
Strip 1.0 1.0 1.0
Rectangle 1+0.3B/L 0.8 1.0
Square 1.3 0.8 1.0
Circle (dia. B) 1.3 0.6 1.0
Table B.3 Terzaghi modified bearing capacity factors (Das, 1999)
Page 115
101
Table B.4 Meyerhof bearing capacity factors (Das, 1999)
Table B.5 Meyerhof shape factors (Das, 1999)
Table B.6 Meyerhof depth factors (Das, 1999)
Page 116
102
Figure B.2 Unit adhesion, ca (Das, 1999).
Figure B.3 Punching shear coefficient, Ks (Das, 1999).
Page 117
103
Table B.7 Approximate relationships between rock mass quality and material constants used in
defining nonlinear strength (Hoek and Brown, 1988)
Page 118
104
Figure B.4 Values of empirical capacity coefficient, k (After Canadian Geotechnical Society, 1988).
Table B.8 Suggested values for Poisson’s ratio, µ (Das, 1999)
Soil type Poisson’s ratio, µ
Coarse sand
Medium loose sand
Fine sand
Sandy silt and silt
Saturated clay (undrained)
0.15 - 0.20
0.20 - 0.25
0.25 – 0.30
0.30 – 0.35
0.50
Table B.9 Elasticity modulus, Es (Erol, 2009)
Soil type Es (MN/m2)
Soft clay
Hard clay
Sandy clay
Silty clay
Loose sand
Dense sand
Dense sand and gravel
2 – 5
7 – 20
30 – 40
7 – 20
10 – 25
50 – 90
100 – 200
Page 119
105
Table B.10 Shape and rigidity factors Is (NAVFAC DM, 1982)
Page 120
106
Figure B.5 Factors for calculating the average immediate settlement (after Christian and Carrier,
1978).
Page 121
107
Table B.11 Correlation equations for soil compressibility/consolidation (Bowles, 1996)
Table B.12 Values of geological factor μg (Skempton-Bjerrum, 1957)
Type of clay µg
Sensitive clays, soft alluvial clays
Medium loose sand
Fine sand
Sandy silt and silt
1.0 - 2.0
0.7 - 1.0
0.5 - 0.7
0.2 - 0.5
Page 122
108
Figure B.6 Determination of modulus of subgrade reaction (Das, 2011)
Page 123
109
APPENDIX C
GEOTECHNICAL REPORT
Figure C.1 Plan showing proposed boring and in-situ test locations (Mayne et al., 2001).
Page 124
110
Figure C.2 Subsurface profile based on boring data showing cross-sectional view (Mayne et al.,
2001).
Page 125
111
APPENDIX D
EVALUATION OF GEOTECHNICAL REPORTS
Table D.1 List of reports
1) Ankara Etimesgut, Block No: 45498, Parcel No: 16
2) Ankara Sincan-Yenikent, Block No: 472, Parcel No: 3
3) Ankara Sincan, Block No: 4353, Parcel No: 16
4) Ankara Yenimahalle-Yeşilevler, Block No: 60526, Parcel No: 1
5) Ankara Keçiören, Block No: 1834, Parcel No: 8
6) Ankara Keçiören, Block No: 30761, Parcel No: 9
7) Ankara Keçiören, Block No: 30359, Parcel No: 11
8) Ankara Keçiören, Block No: 31535, Parcel No: 7
9) Ankara Keçiören, Block No: 5483, Parcel No: 11
10) Ankara Yenimahalle, Block No: 42824, Parcel No: 1
11) Ankara Yenimahalle, Block No: 80, Parcel No: 6
12) Ankara Yenimahelle, Block No: 61140, Parcel No: 3
13) Ankara Yenimahalle, Block No: 9933, Parcel No: 7
14) Kırıkkale-Yahşiyan, Block No: 844, Parcel No: 3
15) Çorum, State Hydraulic Works 54. Branch Facilities
16) Çankırı, State Hydraulic Works 52. Branch Facilities
17) Ankara Sincan, Block No: 490, Parcel No: 1
18) Ankara Sincan, Block No: 4388, Parcel No: 6
19) Ankara Sincan, Block No: 2191, Parcel No: 3
20) Ankara Sincan, Block No: 262, Parcel No: 18
21) Ankara Sincan, Block No: 971, Parcel No: 11
22) Ankara Sincan, Block No: 739, Parcel No: 4
23) Ankara Sincan, Block No: 182, Parcel No: 9
24) Ankara Sincan, Block No: 877, Parcel No: 36
25) Ankara Etimesgut, Block No: 45415, Parcel No: 1
26) Ankara Etimesgut, Block No: 45755, Parcel No: 11
27) Ankara Etimesgut, Block No: 45072, Parcel No: 12
28) Ankara Etimesgut, Block No: 45962, Parcel No: 1
29) Ankara Etimesgut, Block No: 45476, Parcel No: 6
Page 126
112
30) Ankara, Gülhane Military Medical Academy - Sports facility
31) Antalya Kumluca, New Courthouse, Block No: 115 Parcel No: 7
32) Konya, New Airport Terminal Building
33) İskenderun, Student Dormitory Block No: 2481, Parcel No: 1
34) Ankara Altındağ, Block No: 22102, Parcel No: 1
35) Ankara Çankaya, Block No: 27457, Parcel No: 5
36) Ankara Altındağ, Block No: 20760, Parcel No: 6
37) Ankara Çankaya, Block No: 27100, Parcel No: 5
38) Ankara Çankaya, Block No: 26454, Parcel No: 7
39) Ankara Çankaya, Block No: 26946, Parcel No: 11
40) Ankara Altındağ, Block No: 23301, Parcel No: 7
41) Ankara Çankaya, Block No: 28145, Parcel No: 1
42) Ankara Altındağ, Block No: 20927, Parcel No: 2
43) Ankara Çankaya, Block No: 13104, Parcel No: 1
44) Ankara Altındağ, Block No: 20969, Parcel No: 1
45) Ankara Çankaya, Block No: 26074, Parcel No: 4
46) Ankara Altındağ-Güneşevler, Block No: 22041, Parcel No: 1
47) Ankara Çankaya-Ahlatlıbel, Block No: 59, Parcel No: 9
48) Ankara Mamak, Block No: 6681, Parcel No: 12
49) Ankara Keçiören, Block No: 5994, Parcel No: 7
50) Ankara Mamak, Block No: 36577, Parcel No: 8
51) Ankara Keçiören, Block No: 33052, Parcel No: 15
52) Ankara Keçiören, Block No: 34369, Parcel No: 5
53) Ankara Keçiören, Block No: 32269, Parcel No: 11
54) Ankara Keçiören, Block No: 30362, Parcel No: 3
55) Ankara Keçiören, Block No: 31776, Parcel No: 11
56) Ankara Mamak, Block No: 36938, Parcel No: 37
57) Ankara Mamak, Block No: 36216, Parcel No: 7
58) Ankara Keçiören, Block No: 7902, Parcel No: 11
59) Ankara Mamak, Block No: 36507, Parcel No: 8
60) Ankara Mamak, Block No: 35859, Parcel No: 9
61) Ankara Gölbaşı, Block No: 112578, Parcel No: 5
62) Ankara Gölbaşı, Block No: 112584, Parcel No: 2
63) Ankara Gölbaşı, Block No: 295, Parcel No: 1
64) Ankara Gölbaşı, Block No: 118, Parcel No: 4
65) Ankara Keçiören, Block No: 6011, Parcel No: 30
66) Ankara Çankaya, Block No: 27427, Parcel No: 4
Page 127
113
Figure D.1 Distribution of the geotechnical reports collected from central municipalities of Ankara.