Received 2nd August 2019,Accepted 19th September 2019
DOI: 10.1039/c9cy01548e
rsc.li/catalysis
Molecular behaviour of phenol in zeolite Betacatalysts as a function of acid site presence: aquasielastic neutron scattering and moleculardynamics simulation study†
Carlos Hernandez-Tamargo, a Alexander O'Malley, *bc
simulations at 393–443 K were employed in a study of the mobility and interactions of phenol in acidic
zeolite H-Beta, to understand systems relevant to potential routes for the depolymerization and
hydrodeoxygenation of lignin. QENS experiments observed isotropic phenol rotation with a fraction of
static molecules, yielding rotational diffusion coefficients between 2.60 × 10¹⁰ and 3.33 × 10¹⁰ s−1 and an
activation energy of rotation of 7.2 kJ mol−1. The MD simulations of phenol in the acidic and all-silica
zeolite corroborate the experimental results, where molecules strongly adsorbed to the acidic sites behave
as an immobile fraction with minimal contribution to the rotational diffusion, and the mobile molecules
yield similar rotational diffusion coefficients to experiment. Translational diffusion is too slow to be
detected in the instrumental time window of the QENS experiments, which is supported by MD-calculated
activation energies of translation larger than 25 kJ mol−1. The study illustrates the effect of active sites in
potential catalyst structures on the dynamical behaviour of molecules relevant to biomass conversion.
1 Introduction
Lignin, which is one of the main components of biomass hasan extraordinary potential as a renewable source of fuels andvaluable chemicals.1 However, the transformation of lignin ishampered by its complex polymeric structure, i.e. a three-dimensional polymer constituted of phenolic building blocks,with many points of unsaturation and multiple links amongthe phenolic monomers. Consequently, appropriate catalystsare needed for the effective and efficient conversion oflignin.1–3 The dehydration and hydrogenation capacity of thecatalyst are the features of interest with regard to promotingthe conversion of compounds derived from the
depolymerisation of lignin. The hydrodeoxygenation (HDO)process assists the further depolymerisation of lignin to itssimple molecular forms and increases the H :C and C :Oratios, thus enhancing the energy content of the finalproducts intended to be used as fuels. In this regard,bifunctional catalysts consisting of metal nanoparticlessupported on solid acids have shown remarkableperformance towards the conversion of lignin-derivedcompounds.4–7 Zeolites, owing to their versatility asmicroporous solid acids and their hydrothermal stability,8–11
are a common choice to act as supports of the metalnanoparticles. For instance, recent studies have reported thedeposition of Ru, Ni, Pd and Pt on zeolites ZSM-5, Beta andHY, where the hydrogenation is controlled by the metalclusters, whilst the acid sites of the support govern thedehydration and alkylation of the hydrogenation products.4–7
Phenolic monomers, such as phenol and cresols,constitute the simplest molecular forms obtained after thedepolymerisation of lignin,12,13 and thus they constitute asuitable starting model for the study of the HDO of lignin-derived compounds.14–19 These low-molecular weight phenolsmay be hydrogenated and deoxygenated at the metalnanoparticle to form monocycloalkanes and aromatics, orremain inside the micropore system of the zeolite, wherefurther coupling reactions transform the phenols into
bicycloalkanes.3 Hence, the dynamical behaviour of thesorbate as dictated by both the micropore size andcomposition (mainly through active site-sorbate interactions)of the zeolite is an important feature in determining theproduct selectivity during the upgrading of lignin. Onlyzeolites with relatively large micropores, such as zeolite Beta,will allow the diffusion of phenols and the subsequentcoupling reactions, while frameworks with smaller pores willinfluence the pathway towards monocycloalkanes.4,20,21
Therefore, a detailed analysis of the dynamical behaviour ofphenolic monomers inside the micropores will provide amore complete understanding of the HDO of lignin-derivedcompounds using bifunctional catalysts.
Techniques based on neutron spectroscopy are of growingsignificance in the field of heterogeneous catalysis,22 both inthe study of the catalyst itself,23,24 and investigation of therelevant molecular species upon adsorption.25,26 Quasielasticneutron scattering (QENS) is particularly effective in thestudy of microporous catalysts,27 allowing the measurementof molecular movements taking place over timescales of 2ps–100 ns depending on the instrument, and thus it may beemployed to measure both nanoscale diffusion,28–30 and alsolocal motions such as rotation.31–34 Crucially, this techniquecan be employed on sub-micron crystals, in contrast to other
methods, such as PFG-NMR, which have timescales frommicro- to milliseconds and hence need crystal sizes in theorder of micrometres or larger to be able to measure intra-crystalline diffusion.
Details of the dynamical behaviour on the molecular andnanoscale are provided by molecular dynamics (MD)simulations using classical interatomic potentials, which arecapable of modelling sizable crystal systems (2–100 nm) andtime ranges of up to hundreds of nanoseconds, allowing usto observe self-diffusive motion. The dynamicalcharacteristics derived from the MD analysis are an essentialcomplement to the QENS experiments, as shown in previousreports on a range of zeolite-sorbate systems.35–39 QENSobservables such as the intermediate scattering function andits temporal Fourier transform, the dynamic structure factor,may be calculated directly to compare simulation results withexperiment.40,41
In the present work, we have studied the mobility ofphenol in zeolite Beta using QENS experimentscomplemented by density functional theory (DFT)calculations and classical MD simulations. We areparticularly interested in the behaviour of phenol since it isthe simplest representation of the set of phenolic monomersderived from the depolymerisation and upgrading of lignin.
Fig. 1 (a) Periodic building unit (PerBU) of zeolite Beta, polymorph A; the numeration of each non-equivalent T-site is included. (b) PerBUreplicated along different lattice directions. (c) Bulk structure of zeolite Beta with the PerBU highlighted in blue, and the unit cell defined by blacklines. (d) Zeolite Beta with four aluminium substitutions at the T6 position with the proton binding the oxygen O12 (oxygen bridging the sites T4and T6). Colour code: Si (dark blue or orange), O (red), Al (light blue) and H (white).
In addition, zeolite Beta with framework type BEA (see Fig. 1),was chosen on account of its extensive use as a support formetal nanoparticles during the catalysis of HDO reactions,42–44
and also because this zeolite has pore openings of 12 T-sites,which allows for diffusion of phenol into the zeolite.20
The commercial zeolite Beta samples used in the presentwork were obtained from Zeolyst International (CP814E*, Si/Al = 12.5), and received originally in the NH4 form. Thesesamples were activated into the catalytic H-Beta form byheating from room temperature to 798 K for 4 hours, with aheating rate of 5 K min−1, and then dried for 10 hours undervacuum at 170 °C. Next, the samples were ground using apestle and mortar with 10% weight of phenol (approximately4 molecules per unit cell) in a glovebox under argon. Finally,the samples (4.4 grams in total for phenol mixed samples)were transferred to thin walled aluminium cans of annulargeometry, where a 1 mm annulus was used to avoid multiplescattering from the sample.
QENS experiments were carried out using the time-of-flight backscattering neutron spectrometer OSIRIS45 at theISIS Pulsed Neutron and Muon Source. The cells were placedin a top-loading closed cycle refrigerator. Initially the sampleswere heated to 333 K in order to melt the phenol and ensureits adsorption into the zeolite pores. The samples were thencooled to a base temperature of 10 K and a resolutionmeasurement was taken, before being heated to 393, 418 and443 K where the QENS spectra were measured. This range oftemperatures has been selected by considering thetemperatures used during the hydroprocessing of phenoliccompounds,21,43,46 and also to avoid any moleculardecomposition associated with pyrolytic processes.47
The 002 reflection from the pyrolytic graphite analyser wasused, giving an energy resolution of 24.5 μeV at full width athalf maximum (FWHM) with energy transfers measured in awindow of ±0.55 meV; the detector covered measurementsover a Q range of 0.2–1.6 Å−1. We measured the neutronscattering of the empty zeolite Beta samples (which contain asmall amount of hydrogen compared to the dosed samples)and the signal was then subtracted from that of the phenolloaded Beta, so that only the signal from the phenol could beextracted. In this way any scattering from the aluminiumcontainer, which is very low in comparison with the zeolite isalso subtracted. No further corrections were necessary. AllQENS spectra were fitted using the neutron scatteringanalysis software packages DAVE48 and Mantid.49
2.2 Computational simulations
The interatomic potentials (IP) and density functional theory(DFT) calculations were employed to analyse the interactionof phenol with the Brønsted acid site and its mobility in thepore system of the zeolite. The IP calculations involved bothgeometry optimizations and molecular dynamics simulations,
which were performed by the codes General Utility LatticeProgram (GULP)50,51 and DL_POLY,52 respectively. The DFTcalculations were carried out by the planewave code ViennaAb initio Simulation Package (VASP).53–56 The analysis of thealuminium substitution at the intra-framework position ofzeolite Beta was achieved by the code Site OccupancyDisorder (SOD).57
2.2.1 IP calculations. The description of the zeolitestructure in the IP method is based on the Born model of ionicsolids,58 where the forces acting between pairs of ions aredefined by Coulombic interactions and Buckingham potentials.The energy of the systems is described by a combination ofCoulombic contributions, which are calculated following theEwald summation method,59 short-range repulsions anddispersion forces defined by Buckingham and Lennard-Jonespotentials,60,61 and harmonic potentials to account for therigidity induced by covalent bonds and bond-bending angles.In the present work, we have used full ionic charges to definethe silicon, aluminium and non-protonated oxygen atoms thatform the zeolite framework: Si4+, Al3+ and O2−. The parametersdescribing the interaction between the pairs (Si4+, O2−) and(O2−, O2−) were derived by Sanders et al. after fitting to theelastic and dielectric properties of α-quartz.62 Sanders and co-workers also proposed the addition of bond-bending terms toaccount for the rigidity of the SiO4 tetrahedra, which allows thequantitative reproduction of the experimental properties ofSiO2 polymorphs (α-quartz, α-cristobalite, coesite andα-tridymite) and improves the transferability to otherframeworks, such as zeolites.62 The parameters for the (Al3+,O2−) pair were obtained by Catlow et al. following an optimal fitto the lattice properties of α-Al2O3.
63 We have made use offractional charges to define the oxygen (−1.426 e−) andhydrogen (+0.426 e−) atoms in the OH groups of the Brønstedacid sites of the zeolite, employing the parameters proposed bySchröder et al. to represent the interaction between these OHgroups and the rest of the zeolite framework.64 The full set ofpotentials describing the zeolite framework is listed in Table 1.
We have adapted the parametrization reported by Mooneyet al. to define the intra- and inter-molecular interactions ofphenol.65 These parameters have been designed to reproducethe pure liquid properties of phenol over a range oftemperatures, spanning from 333.15 to 523.15 K. The originalparametrization keeps the phenol bond lengths fixed duringthe simulation, while employing harmonic and torsionalpotentials for the bond angles and dihedrals. In the presentwork, we have allowed the C–C and C–H bond lengths tochange according to the harmonic parameters reported bySastre and collaborators.66 The C–O and O–H bond lengthswere kept fixed as originally proposed by Mooney et al.65
using the SHAKE algorithm.67 The full set of potentials islisted in Table 2.
The interaction of the oxygen atom of phenol with thesilicon and aluminium atoms of the zeolite was modelledbased on the Buckingham potentials reported for theframework pairs (Si4+, O2−) and (Al3+, O2−),62,63 but rescalingthe repulsion parameter A following a procedure similar to
the protocol used by Schröder and collaborators.64 We haveemployed the same inter-molecular parameters reported byMooney et al. to describe the interaction between the acidicproton of the zeolite and the oxygen atom of phenol.65 Wedefined the remaining interactions between the zeoliteframework and phenol by introducing the Lennard-Jonesparameters reported by Vetrivel and co-workers.68 The full setof potentials is listed in Table 3.
2.2.2 Zeolite Beta structure and aluminium substitution.In all simulations presented in this work, we have used thepolymorph A of zeolite Beta, with tetragonal symmetry(P4122). Fig. 1 shows the periodic building unit (PerBU) ofzeolite Beta, which compromises 16 tetrahedral sites (T-sites)with the four six-membered rings (6MRs) fused together.69
The unit cell of zeolite Beta was optimized at constantpressure using the IP method, yielding the latticeparameters a = 12.465 Å and c = 26.224 Å, which are ingood agreement with the experimental values of a = 12.5 Åand c = 26.6 Å.70 We observed that the most stablesubstitution of a single Al atom at the intra-frameworkpositions of zeolite Beta preferred the site T6 (Fig. 1 fornumeration). The analysis with two Al substitutions, whichgenerates a total of 273 structures, also identified two T6sites located in different parallel pores along the [100]direction and separated by 14 Å, as the most probablepositions for the double Al substitution. Note that for thesingle and double Al-substituted systems, the negativecharge introduced by the incorporation of Al was notcounterbalanced by adding protons H+ to the system, but bydiluting it among the framework O atoms, as this protocoldecreased considerably the otherwise prohibitively largenumber of configurations that would need to besimulated.71
In order to approach the Si/Al ratio used in experiment,we replaced four Si atoms with Al (Si/Al = 15). Unfortunately,this number of substitutions still produces an exceedinglyhigh number of unique combinations by the SOD code,which it is not feasible to examine. Therefore, using theevidence of the single and double substitutions, we placedthe four Al atoms at T6 sites, each in a different pore out offour that exist in the unit cell of zeolite Beta. Once the fourAl atoms were added to the structure, we inspected all thepossible configurations to counterbalance the charge withprotons, leading to the most stable structure shown inFig. 1d, where the proton is bound to the oxygen atomnumbered 12 (O12), that bridges the sites T4 and T6.
2.2.3 Classical MD simulations. We employed both the all-silica Beta structure and the acidic H-Beta structure with fourAl substitutions (Fig. 1d) to simulate the mobility of phenolin zeolite Beta. A 4 × 4 × 2 supercell of zeolite Beta wascreated, replicating the unit cell 4 times along the latticevectors a and b, and two times along c. Next, 32, 64 and 128molecules of phenol were homogeneously loaded in the poresof the material, which corresponds to 1, 2 and 4 moleculesper unit cell (mpuc), respectively, where the highest loadingused in the simulations is very close to the experimentalloading of 10 mass% employed in the QENS experiments.The systems were equilibrated at the three experimentaltemperatures, 393, 418 and 443 K, during 1 ns of micro-canonical ensemble (NVE), and then during 1 ns of canonicalensemble (NVT) using a Berendsen thermostat with a timeconstant for thermal energy exchange of 1.0 ps.72 Thisprocedure led to a proper equilibration of the system withtemperature fluctuations of only 3 to 5 K for both the NVEand NVT ensembles. Afterwards, the production runconsisted of 6 ns of micro-canonical (NVE) ensemble. A
Table 1 Potential parameters that describe the interatomic interactions within the zeolite structure
a The same three-body potential was used for the four triads O2−⋯Si4+⋯O2−, O2−⋯Al3+⋯O2−, O2−⋯Si4+⋯O1.426− and O2−⋯Al3+⋯O1.426−. It isimportant to note that a cut-off of 2.5 Å was necessary for the triads O2−⋯Si4+⋯O1.426− and O2−⋯Al3+⋯O1.426− during the MD simulations withthe DL_POLY code. Energy and temperature drifts are observed if the cut-off is shorter or larger than 2.5 Å by 0.5 Å.
timestep of 0.5 fs was used for all simulation, saving theatomic coordinates every picosecond.
The method of multiple initial times was employed toaverage the trajectory over the 6 ns of production run into 1ns, shifting the initial time every 25 ps. We observed that 1ns was enough to obtain mean-squared displacement (MSD)plots with acceptable linearity to calculate the self-diffusivityof phenol throughout the pore system of zeolite Beta.38,39
The MSD was calculated from the variation in thecoordinates of the centre of mass of the molecules. The self-diffusion coefficients were derived from the Einsteinrelationship:
Ds ¼ 16limx→∞
ddt
r tð Þ − r tð Þ½ �2� �(1)
2.2.4 DFT calculations. The DFT calculations wereperformed under periodic boundary conditions, employingthe general gradient approximation (GGA) in the form of the
non-empirical functional proposed by Perdew, Burke, andErnzerhof (PBE).73,74 A basis set of plane waves, with anenergy cut-off of 400 eV, was used to treat explicitly thevalence states, whilst its nodal features and the core stateswere described by the projector-augmented-wave (PAW)method.75,76 As a consequence of the relatively large unit cellsize of zeolite Beta, the Γ point alone was enough for thenumerical integration within the Brillouin zone.77 TheGaussian smearing method accounted for the occupation ofthe electronic bands and the integration over the reciprocalspace during the electronic relaxation, with a width of 0.05eV.78–80 We adopted convergence thresholds of 10−5 eV and0.03 eV Å−1 for the electronic and ionic relaxation,respectively. We included Grimme's correction D3 to the DFTenergy to describe the dispersion interactions within thezeolite and between the zeolite and the adsorbed molecule,choosing the damping function of Becke-Johnson, whichprevents near-singularities at small distances and doublecounting of correlation effects at intermediate distances.81,82
The variation of the ionic positions during the geometryoptimizations was carried out by the conjugate-gradientalgorithm.83
The optimization of the unit cell of zeolite Beta proceededby a set of fixed-volume calculations, allowing only therelaxation of the atomic positions and the shape of the cell.The correlation between energy versus cell volume was thenfitted with the Birch-Murnaghan equation of state.84 Thisprocedure provided an optimized volume for the unit cell of4189 Å,3 lattice parameters a = 12.589 Å and c = 26.428 Å anda predicted isotropic bulk modulus of 33.4 GPa.
We then performed short MD simulations in order tovalidate the classical MD simulations regarding theinteraction between phenol and the Brønsted acid sites. Asingle molecule of phenol was loaded in zeolite Beta, whichwas represented by a single unit cell. The acid site consistedof an aluminium atom at the position T6, with the proton atO12. The structure obtained after the geometry optimization
Table 2 Potential parameters that describe the intra- and inter-atomicinteractions in phenol
was annealed for 2.5 ps from 0 to 443 K, followed by 2.5 ps ofequilibration at 443 K with a time step of 0.5 fs; in both casesthe temperature was scaled every 50 steps. Afterwards, theproduction run consisted of 7.5 ps of a NVT ensemble, wherethe temperature was controlled by a Nosé-thermostat.85–87
3 Results and discussion3.1 Quasielastic neutron scattering experiments
QENS spectra as a function of the momentum transfer vectorQ at 393 K are shown for phenol in zeolite Beta in Fig. 2, (theQENS spectra for 418 and 443 K are shown in the ESI,†section S1). The QENS spectra at Q = 0.56 Å−1 were omitteddue to the presence of a Bragg peak in zeolite Beta at this Qvalue, which caused issues upon subtraction of the emptyzeolite spectrum from that of the loaded zeolite. The spectrawere fitted to a delta function convoluted with the resolutionmeasurement taken at 10 K, a single Lorentzian function(which was enough to describe the data satisfactorily) and aflat background function to account for any motions too fastfor the instrumental window and the Debye–Waller factor.The figure contains the data points, the total fit (black), andthe quasielastic component of the spectra (red) given by aLorentzian function.
We note that the Lorentzian component is very small,particularly at low Q values, and the elastic component is verylarge at all Q values. This suggests that we are eitherobserving localised motions (rotation or confined diffusion),or that a large proportion of the molecules are static on thetimescales probed by the instrument. The fact that only oneLorentzian function is required to fit the broadening of thespectra suggests that only one dominant mode of motion isobserved on the timescale of the instrument. Thecontribution from the Lorentizan component increases withtemperature, suggesting more movement is observed in thesystem as the temperature increases.
Given the large elastic component throughout the spectra,we now analyse the possible localised motions present, whichcan be characterised using the elastic incoherent structurefactor (EISF), which is given by
and is the proportion of the total scattered intensity which iselastic. The experimental EISFs are shown in Fig. 3. It is clearthat the EISF drops as the temperature increases, either dueto a differing localised motion, or an increasing mobilecomponent. However, the shape of the EISF remains similarat all temperatures, suggesting that the same nature ofmotion is taking place, but more molecules are moving asthe temperature increases.
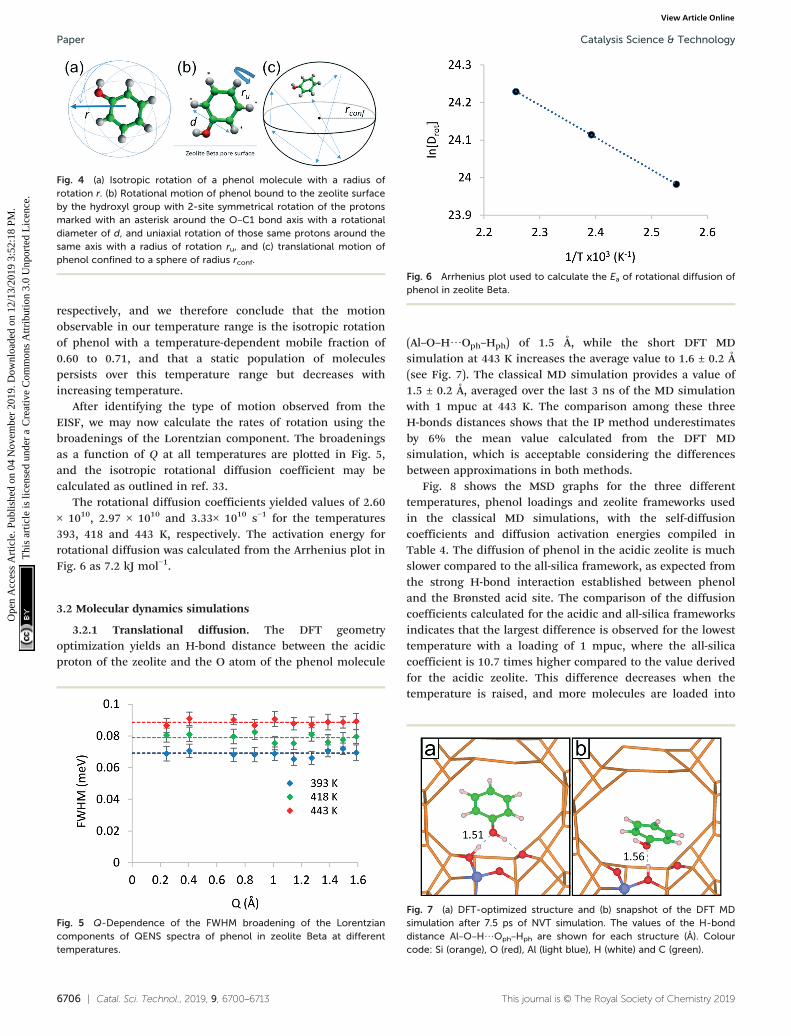
A number of models are available to characterise thelocalised motions of phenol, related to the geometries ofmotion of the protons in the molecule. The models used tofit the experimental EISF at 393 K are detailed in section S2of the ESI† and are depicted in Fig. 4. They include theisotropic rotation model derived by Sears,88 the 2-site jumprotation model, the uniaxial rotation model and the model oftranslational diffusion confined to a sphere as derived byVolino and Dianoux.89 It was found that the best fit to theexperimental data was the model of isotropic rotation with afraction of immobile molecules. Good fits were also achievedwith the model of diffusion confined to a sphere, howeverthe widths of the Lorentzian component of the QENS spectrawere found to be independent of Q, as opposed to exhibitinga Q-dependence associated with confined diffusion, similarto previous work90 (further detail on the broadenings can befound in the ESI†).
Having reached this conclusion, we next proceed to fit theexperimental EISF at 418 and 443 K with the isotropicrotational models with the same radius of rotation, but avarying mobile fraction, as shown in Fig. 3. We find thatmobile fractions of 0.66 and 0.71 fit 418 and 443 K
Fig. 2 QENS spectra as a function of Q for phenol in zeolite Beta at393 K. (−) is the total fit to the data points, ( ) is the quasielasticLorentzian component.
Fig. 3 Experimental EISF plots of phenol in zeolite Beta at 393, 418and 443 K. The isotropic rotation model with an immobile fraction isplotted for each temperature. The optimum px values are listed inbrackets.
respectively, and we therefore conclude that the motionobservable in our temperature range is the isotropic rotationof phenol with a temperature-dependent mobile fraction of0.60 to 0.71, and that a static population of moleculespersists over this temperature range but decreases withincreasing temperature.
After identifying the type of motion observed from theEISF, we may now calculate the rates of rotation using thebroadenings of the Lorentzian component. The broadeningsas a function of Q at all temperatures are plotted in Fig. 5,and the isotropic rotational diffusion coefficient may becalculated as outlined in ref. 33.
The rotational diffusion coefficients yielded values of 2.60× 10¹⁰, 2.97 × 10¹⁰ and 3.33× 10¹⁰ s−1 for the temperatures393, 418 and 443 K, respectively. The activation energy forrotational diffusion was calculated from the Arrhenius plot inFig. 6 as 7.2 kJ mol−1.
3.2 Molecular dynamics simulations
3.2.1 Translational diffusion. The DFT geometryoptimization yields an H-bond distance between the acidicproton of the zeolite and the O atom of the phenol molecule
(Al–O–H⋯Oph–Hph) of 1.5 Å, while the short DFT MDsimulation at 443 K increases the average value to 1.6 ± 0.2 Å(see Fig. 7). The classical MD simulation provides a value of1.5 ± 0.2 Å, averaged over the last 3 ns of the MD simulationwith 1 mpuc at 443 K. The comparison among these threeH-bonds distances shows that the IP method underestimatesby 6% the mean value calculated from the DFT MDsimulation, which is acceptable considering the differencesbetween approximations in both methods.
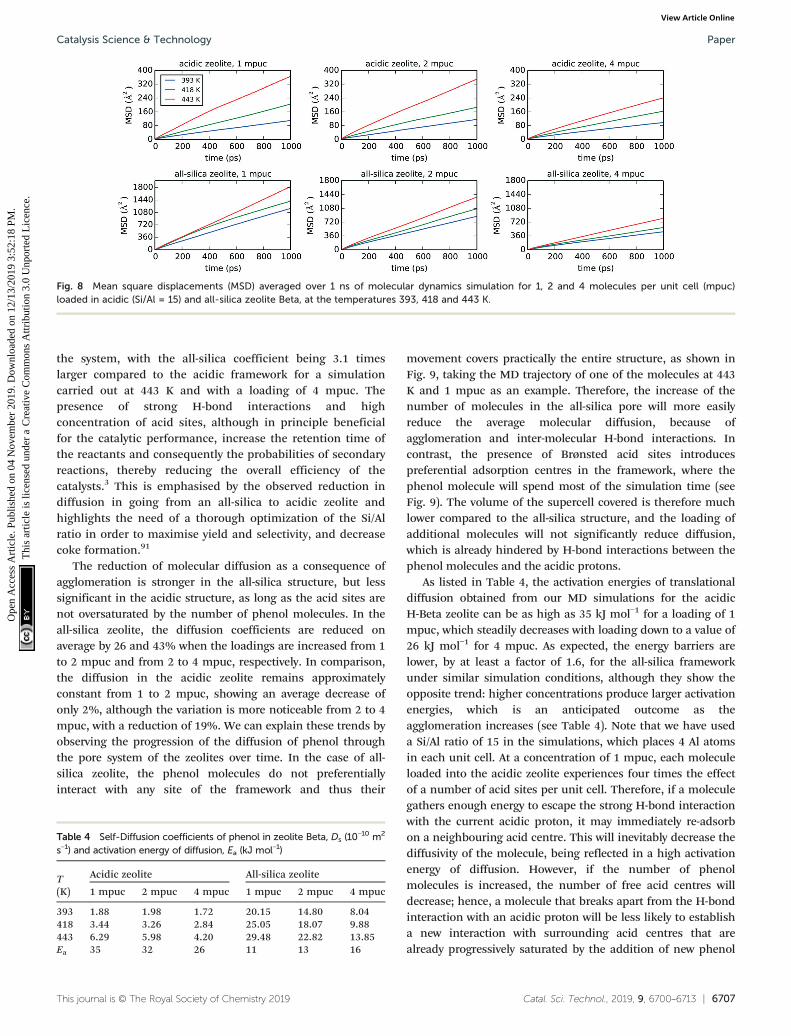
Fig. 8 shows the MSD graphs for the three differenttemperatures, phenol loadings and zeolite frameworks usedin the classical MD simulations, with the self-diffusioncoefficients and diffusion activation energies compiled inTable 4. The diffusion of phenol in the acidic zeolite is muchslower compared to the all-silica framework, as expected fromthe strong H-bond interaction established between phenoland the Brønsted acid site. The comparison of the diffusioncoefficients calculated for the acidic and all-silica frameworksindicates that the largest difference is observed for the lowesttemperature with a loading of 1 mpuc, where the all-silicacoefficient is 10.7 times higher compared to the value derivedfor the acidic zeolite. This difference decreases when thetemperature is raised, and more molecules are loaded into
Fig. 5 Q-Dependence of the FWHM broadening of the Lorentziancomponents of QENS spectra of phenol in zeolite Beta at differenttemperatures.
Fig. 4 (a) Isotropic rotation of a phenol molecule with a radius ofrotation r. (b) Rotational motion of phenol bound to the zeolite surfaceby the hydroxyl group with 2-site symmetrical rotation of the protonsmarked with an asterisk around the O–C1 bond axis with a rotationaldiameter of d, and uniaxial rotation of those same protons around thesame axis with a radius of rotation ru, and (c) translational motion ofphenol confined to a sphere of radius rconf.
Fig. 6 Arrhenius plot used to calculate the Ea of rotational diffusion ofphenol in zeolite Beta.
Fig. 7 (a) DFT-optimized structure and (b) snapshot of the DFT MDsimulation after 7.5 ps of NVT simulation. The values of the H-bonddistance Al–O–H⋯Oph–Hph are shown for each structure (Å). Colourcode: Si (orange), O (red), Al (light blue), H (white) and C (green).
the system, with the all-silica coefficient being 3.1 timeslarger compared to the acidic framework for a simulationcarried out at 443 K and with a loading of 4 mpuc. Thepresence of strong H-bond interactions and highconcentration of acid sites, although in principle beneficialfor the catalytic performance, increase the retention time ofthe reactants and consequently the probabilities of secondaryreactions, thereby reducing the overall efficiency of thecatalysts.3 This is emphasised by the observed reduction indiffusion in going from an all-silica to acidic zeolite andhighlights the need of a thorough optimization of the Si/Alratio in order to maximise yield and selectivity, and decreasecoke formation.91
The reduction of molecular diffusion as a consequence ofagglomeration is stronger in the all-silica structure, but lesssignificant in the acidic structure, as long as the acid sites arenot oversaturated by the number of phenol molecules. In theall-silica zeolite, the diffusion coefficients are reduced onaverage by 26 and 43% when the loadings are increased from 1to 2 mpuc and from 2 to 4 mpuc, respectively. In comparison,the diffusion in the acidic zeolite remains approximatelyconstant from 1 to 2 mpuc, showing an average decrease ofonly 2%, although the variation is more noticeable from 2 to 4mpuc, with a reduction of 19%. We can explain these trends byobserving the progression of the diffusion of phenol throughthe pore system of the zeolites over time. In the case of all-silica zeolite, the phenol molecules do not preferentiallyinteract with any site of the framework and thus their
movement covers practically the entire structure, as shown inFig. 9, taking the MD trajectory of one of the molecules at 443K and 1 mpuc as an example. Therefore, the increase of thenumber of molecules in the all-silica pore will more easilyreduce the average molecular diffusion, because ofagglomeration and inter-molecular H-bond interactions. Incontrast, the presence of Brønsted acid sites introducespreferential adsorption centres in the framework, where thephenol molecule will spend most of the simulation time (seeFig. 9). The volume of the supercell covered is therefore muchlower compared to the all-silica structure, and the loading ofadditional molecules will not significantly reduce diffusion,which is already hindered by H-bond interactions between thephenol molecules and the acidic protons.
As listed in Table 4, the activation energies of translationaldiffusion obtained from our MD simulations for the acidicH-Beta zeolite can be as high as 35 kJ mol−1 for a loading of 1mpuc, which steadily decreases with loading down to a value of26 kJ mol−1 for 4 mpuc. As expected, the energy barriers arelower, by at least a factor of 1.6, for the all-silica frameworkunder similar simulation conditions, although they show theopposite trend: higher concentrations produce larger activationenergies, which is an anticipated outcome as theagglomeration increases (see Table 4). Note that we have useda Si/Al ratio of 15 in the simulations, which places 4 Al atomsin each unit cell. At a concentration of 1 mpuc, each moleculeloaded into the acidic zeolite experiences four times the effectof a number of acid sites per unit cell. Therefore, if a moleculegathers enough energy to escape the strong H-bond interactionwith the current acidic proton, it may immediately re-adsorbon a neighbouring acid centre. This will inevitably decrease thediffusivity of the molecule, being reflected in a high activationenergy of diffusion. However, if the number of phenolmolecules is increased, the number of free acid centres willdecrease; hence, a molecule that breaks apart from the H-bondinteraction with an acidic proton will be less likely to establisha new interaction with surrounding acid centres that arealready progressively saturated by the addition of new phenol
Fig. 8 Mean square displacements (MSD) averaged over 1 ns of molecular dynamics simulation for 1, 2 and 4 molecules per unit cell (mpuc)loaded in acidic (Si/Al = 15) and all-silica zeolite Beta, at the temperatures 393, 418 and 443 K.
Table 4 Self-Diffusion coefficients of phenol in zeolite Beta, Ds (10−10 m2
s−1) and activation energy of diffusion, Ea (kJ mol−1)
molecules. For this reason, the energy barrier of diffusion inthe acidic zeolite decreases in our simulations when moremolecules are loaded into the pore system. We should also notethat the maximum loading employed was 4 mpuc, whichsignifies full saturation of acid sites by phenol molecules. Wesuggest that a further increase above 4 mpuc may produce asimilar trend as observed for all-silica zeolite, since the effectsof molecular agglomeration will play a more prominent roleonce the acid sites are fully saturated.
Translational diffusion is not detected in the presentQENS experiments, which could be tentatively justifiedconsidering the increment in energy barrier when thetranslational diffusion of phenol in all-silica zeolite iscompared to acidic zeolite. We therefore consider theinteraction between phenol and the Brønsted acid sitesslows down the molecules, making translation to goundetected in experiment. Supporting this analysis, we haveincluded more information at the end of the present sectionby comparing the timescales of rotational and translationalmotions.
3.2.2 Rotational diffusion. In terms of direct comparisonbetween the MD simulations and the QENS data, the incoherentdynamical structure factor SincIJQ,ω) is related to the single-particle time-correlation function of the system, represented bythe self-part of the intermediate scattering function FsIJQ,t), by aFourier transformation in the frequency domain:27
Sinc Q;ωð Þ ¼ 1π
ZFs Q; tð Þexp − iωtð Þdt (3)
In order to extract information from the MD simulationsto be compared with the experiment, it is more convenient toretain the time-domain of the data and work with thefunction FsIJQ,t). Owing to the polycrystallinity of the zeolitesamples used in experiment, we derived the powder averageof the function FsIJQ,t) (the modulus |Q|, represented by Q,replaces Q hereafter) from the MD simulations for a suitablecomparison to the QENS data:41,92
Fs Q; tð Þ ¼ 1N
XNi¼1
sin Q di t þ t0ð Þ −di t0ð Þj jð ÞQ di t þ t0ð Þ −di t0ð Þj j
�(4)
where N is the number of hydrogen atoms in a phenolmolecule and di is the position of the hydrogen atom i withrespect to the center of mass of the molecule. Amicrocanonical ensemble average over the set of initial timest0 is represented by the angular brackets.
We have initially applied eqn (4) to the rotational part ofthe intermediate scattering function, Frots (Q,t), since it is themovement detected in experiment, leaving the analysis of thetranslational part, Ftranss (Q,t), for a later comparison betweenthe timescales of rotation and translation.
We need two exponential decays to properly fit the calculatedFrots (Q,t) (a single exponential function provides a poor fit forthe ISF), with each exponential representing a motion in aspecific frequency domain.40 In the present case, the first decaywithin below the experimental window of 0.55 meV, while thesecond is above the 0.55 meV mark, which is an indication of amotion too fast to be observed by the experiment:
Fig. 9 Trajectory of the center of mass over 6 ns of simulation at 443 K of a phenol molecule out of a total of 32 in (a–c) acidic zeolite Beta and(d–f) all-silica zeolite Beta. (a and d) View along direction a. (b and e) View along direction b. (c and f) View along direction c.
The Ci parameter is a pre-exponential factor that weightsthe contribution of the rotational motion represented by therespective exponential. The decay constant Γi can be treatedin the same way as the half-width at half-maximum of aLorentzian used to fit the quasielastic part of an experimentalQENS signal.40 The constant BIJQ) can be considered as anexponential where t = ∞, and thus it represents the finalatomic arrangement in Q space; the relation of BIJQ) with Qwill provide the rotation symmetry of the molecule.41 Hence,the constant BIJQ) is equivalent to the EISF, which is given byeqn (2). The EISFs thus derived from the MD simulations arefitted with an isotropic rotation model given by:
A0(Q) = j02(Qr) (6)
where r is the radius of rotation, and j0 is the 0th orderspherical Bessel function:
j0 ¼sin Qrð ÞQr
(7)
Fig. 10 shows the EISF plot derived from our MDsimulations for each temperature, molecular loading andframework, with the isotropic fitting for the highesttemperature serving as lower bound of the plots. The radii ofgyration for the fitting with the isotropic model are listed inTable 5.
We observe the most hindered rotational diffusion ofphenol in H-Beta at the temperature of 393 K, since thecalculated EISF minimum for this temperature lies farthestabove the isotropic model (see Fig. 10), which is a directconsequence of the strong H-bond interaction betweenphenol and the Brønsted acid site. Upon increasing thetemperature, a steady decrease of the EISF minimum towardsthe full isotropic rotation model is observed, indicating abreaking of the interaction between phenol and the acid site
as more molecules are able to freely rotate. Notably, the EISFcalculated for phenol in the all-silica system matches the fullisotropic diffusion model very well at all three temperaturesand concentrations, with radii of gyration that fluctuatewithin a narrow range of 2.52 to 2.56 Å, showing that themovement is far less inhibited by the Van der Waalsinteractions with the wall of the micro-pores, due to the lackof Brønsted acid sites.
We note that, although the MD simulations include allpossible forms of proton motion in the sampled time, andthus the EISF would be a complicated mixture of all suchdifferent motions, the isotropic rotation should bepredominant as suggested by experiment. In addition,considering that the isotropic model fits the MD data atlower Q values for all systems, we can therefore feel confidentto use the isotropic model to directly fit the Frots (Q,t) decaysderived from the MD simulation over the range of lower Qvalues, thus allowing us to calculate rotational diffusioncoefficients:41
Frots Q; tð Þ ¼
X∞l¼0
2l þ 1ð Þj2l QRð Þe − l lþ1ð ÞDrt (8)
where R is the radius of gyration and Dr the rotationaldiffusion coefficient, both obtained from the fitting to theexponential decays derived from eqn (4). The five first termsare retained in the expansion of eqn (8) since thecontribution of higher terms is negligible for the studiedrange of Q values.
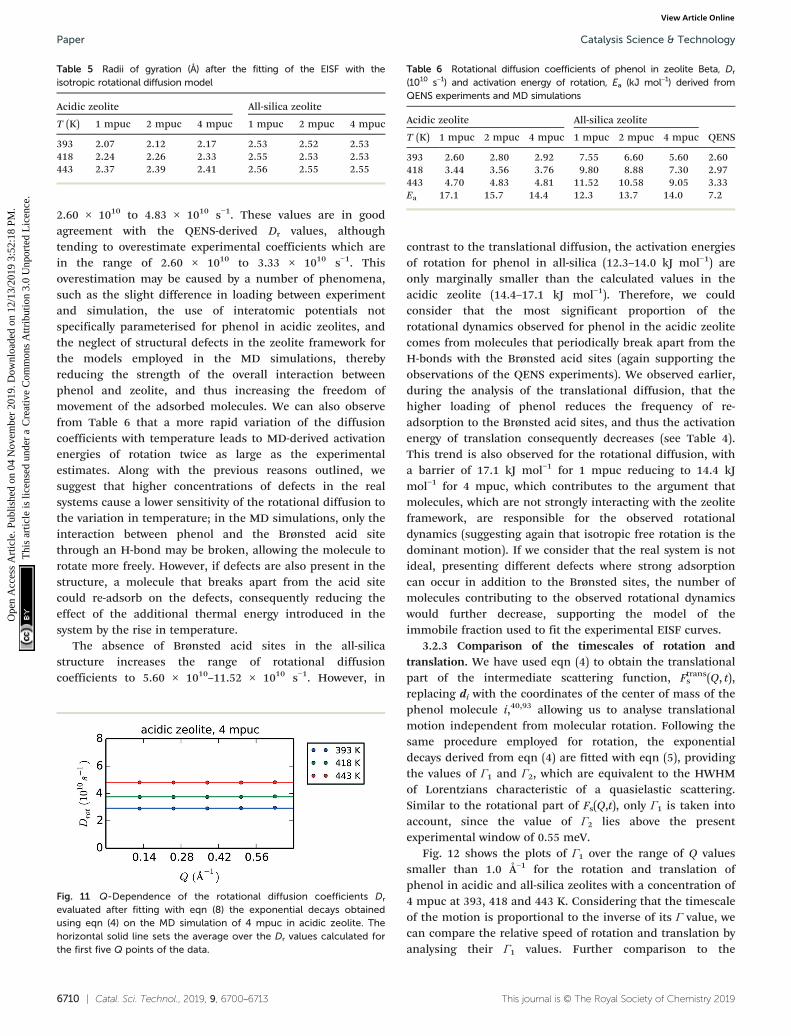
Fig. 11 shows the Q-dependence of the calculated Dr
values for the first five Q points of the MD data obtained forphenol in the H-Beta system (4 mpuc), revealing theinvariability of Dr with Q. Table 6 lists the values of Dr foreach zeolite framework, phenol loading and temperature,together with the activation energies of rotation.
We obtained rotational diffusion coefficients from the MDsimulations of phenol in H-Beta zeolite within the range of
Fig. 10 Elastic incoherent structure factor (EISF) averaged over 100 ps of molecular dynamics simulation for 1, 2 and 4 molecules per unit cell(mpuc) loaded in acidic (Si/Al = 15) and all-silica zeolite Beta, at the temperatures 393, 418 and 443 K. The isotropic rotational diffusion model for443 K is included with the EISF plots.
2.60 × 10¹⁰ to 4.83 × 10¹⁰ s−1. These values are in goodagreement with the QENS-derived Dr values, althoughtending to overestimate experimental coefficients which arein the range of 2.60 × 10¹⁰ to 3.33 × 10¹⁰ s−1. Thisoverestimation may be caused by a number of phenomena,such as the slight difference in loading between experimentand simulation, the use of interatomic potentials notspecifically parameterised for phenol in acidic zeolites, andthe neglect of structural defects in the zeolite framework forthe models employed in the MD simulations, therebyreducing the strength of the overall interaction betweenphenol and zeolite, and thus increasing the freedom ofmovement of the adsorbed molecules. We can also observefrom Table 6 that a more rapid variation of the diffusioncoefficients with temperature leads to MD-derived activationenergies of rotation twice as large as the experimentalestimates. Along with the previous reasons outlined, wesuggest that higher concentrations of defects in the realsystems cause a lower sensitivity of the rotational diffusion tothe variation in temperature; in the MD simulations, only theinteraction between phenol and the Brønsted acid sitethrough an H-bond may be broken, allowing the molecule torotate more freely. However, if defects are also present in thestructure, a molecule that breaks apart from the acid sitecould re-adsorb on the defects, consequently reducing theeffect of the additional thermal energy introduced in thesystem by the rise in temperature.
The absence of Brønsted acid sites in the all-silicastructure increases the range of rotational diffusioncoefficients to 5.60 × 10¹⁰–11.52 × 10¹⁰ s−1. However, in
contrast to the translational diffusion, the activation energiesof rotation for phenol in all-silica (12.3–14.0 kJ mol−1) areonly marginally smaller than the calculated values in theacidic zeolite (14.4–17.1 kJ mol−1). Therefore, we couldconsider that the most significant proportion of therotational dynamics observed for phenol in the acidic zeolitecomes from molecules that periodically break apart from theH-bonds with the Brønsted acid sites (again supporting theobservations of the QENS experiments). We observed earlier,during the analysis of the translational diffusion, that thehigher loading of phenol reduces the frequency of re-adsorption to the Brønsted acid sites, and thus the activationenergy of translation consequently decreases (see Table 4).This trend is also observed for the rotational diffusion, witha barrier of 17.1 kJ mol−1 for 1 mpuc reducing to 14.4 kJmol−1 for 4 mpuc, which contributes to the argument thatmolecules, which are not strongly interacting with the zeoliteframework, are responsible for the observed rotationaldynamics (suggesting again that isotropic free rotation is thedominant motion). If we consider that the real system is notideal, presenting different defects where strong adsorptioncan occur in addition to the Brønsted sites, the number ofmolecules contributing to the observed rotational dynamicswould further decrease, supporting the model of theimmobile fraction used to fit the experimental EISF curves.
3.2.3 Comparison of the timescales of rotation andtranslation. We have used eqn (4) to obtain the translationalpart of the intermediate scattering function, Ftranss (Q, t),replacing di with the coordinates of the center of mass of thephenol molecule i,40,93 allowing us to analyse translationalmotion independent from molecular rotation. Following thesame procedure employed for rotation, the exponentialdecays derived from eqn (4) are fitted with eqn (5), providingthe values of Γ1 and Γ2, which are equivalent to the HWHMof Lorentzians characteristic of a quasielastic scattering.Similar to the rotational part of FsIJQ,t), only Γ1 is taken intoaccount, since the value of Γ2 lies above the presentexperimental window of 0.55 meV.
Fig. 12 shows the plots of Γ1 over the range of Q valuessmaller than 1.0 Å−1 for the rotation and translation ofphenol in acidic and all-silica zeolites with a concentration of4 mpuc at 393, 418 and 443 K. Considering that the timescaleof the motion is proportional to the inverse of its Γ value, wecan compare the relative speed of rotation and translation byanalysing their Γ1 values. Further comparison to the
Table 5 Radii of gyration (Å) after the fitting of the EISF with theisotropic rotational diffusion model
Fig. 11 Q-Dependence of the rotational diffusion coefficients Dr
evaluated after fitting with eqn (8) the exponential decays obtainedusing eqn (4) on the MD simulation of 4 mpuc in acidic zeolite. Thehorizontal solid line sets the average over the Dr values calculated forthe first five Q points of the data.
Table 6 Rotational diffusion coefficients of phenol in zeolite Beta, Dr
(1010 s−1) and activation energy of rotation, Ea (kJ mol−1) derived fromQENS experiments and MD simulations
experimental HWHM shows that rotation is the most likelyform of motion detected by QENS, as the rotationalbroadening calculated from the MD simulations for acidiczeolite is far closer to the experimental value than thebroadening simulated for translation, motion that is likelytoo close to the resolution limit of the instrument to bedetected. The values of Γ1 for both rotation and translationin the all-silica zeolite increase compared to the acidicframework, corresponding to motions occurring in a shortertimescale, which is expected from the absence of strongH-bond interactions between phenol and the zeolite; thissuggests that we might observe translation in QENSexperiments of all-silica zeolites with similar instrumentalconfiguration.
4 Conclusions
The dynamical behaviour of phenol was measured in zeoliteBeta (Si/Al = 12.5) using quasielastic neutron scattering, toprobe the behaviour of phenolic monomers of lignin inpotential biomass conversion catalysts. The significant elasticcomponent in all spectra at all temperatures, and subsequentfitting of the EISF to the relevant models of localised motion,suggest that on the instrumental timescale we are observingisotropic rotation of the phenol molecule in the zeolite pores,with rotational diffusion coefficients of 2.60 × 10¹⁰–3.33 ×10¹⁰ s−1. The EISF also showed that at each temperature thereis a population of molecules which remain static, and thispopulation decreases with increasing temperature; we canconsider this population to be phenol molecules bound tothe Brønsted acid sites or other defects in the acidic zeolitecatalyst.
Molecular dynamics simulations of phenol in zeolite Betawere performed to complement the QENS experiments. Theactivation energies of translation derived from the MDcalculations, with values between 26 and 35 kJ mol−1, support
the idea that phenol translational diffusion is likely to be tooslow to be observed in the instrumental time window.Calculation of the EISF, and subsequent calculation ofrotational diffusion coefficients gave values of 2.60 × 10¹⁰ to4.83 × 1010 s−1, which are in close agreement with theexperimental values, although overestimating slightly thefreedom of mobility, as is common in such studies. Thecomparison of the activation energies of rotation in theacidic and all-silica zeolites indicates that molecules notbound to the acidic sites are responsible for the observedrotational dynamics in the MD simulations, supporting theexperimental observations that a fraction of phenol isimmobile (due to H-bonding to the acidic sites), while therest undergo isotropic rotation in the H-Beta catalyst pores.
Conflicts of interest
There are no conflicts to declare.
Acknowledgements
This work was performed using the computational facilitiesof the Advanced Research Computing @ Cardiff (ARCCA)Division, Cardiff University, and HPC Wales. Via ourmembership of the UK's HEC Materials ChemistryConsortium, which is funded by EPSRC [grant number: EP/L000202], this work used the ARCHER UK NationalSupercomputing Service (http://www.archer.ac.uk). Theauthors acknowledge EPSRC [grant number: EP/K009567/2]and NERC [grant number: NE/R009376/1] for funding. C. H.T. thanks Dr. S. E. Ruiz-Hernandez for valuable consultations.A. J. O. M. acknowledges the Ramsay Memorial Trust for theprovision of a Ramsay Memorial Fellowship, and Roger andSue Whorrod for the funding of the Whorrod Fellowship. TheSTFC Rutherford Appleton Laboratory is thanked for access toneutron beam facilities; the data from our experiment
Fig. 12 Values of Γ1 after fitting with eqn 5 the exponential decays that represent the intermediate structure factors FsIJQ,t) for rotation (blue) andtranslation (green) for each value of Q smaller than 1.0 Å−1. In the case of translation, the coordinates of the center of mass are used in eqn (4) toobtain the exponential decays. The plots show acidic zeolite (first row) and all-silica zeolite (second row), with a concentration of 4 mpuc, at thetemperatures 393, 418 and 443 K. The horizontal red line in each graph indicates the experimental average of the HWHM at the correspondingtemperature.
RB1720221 can be found at DOI:10.5286/ISIS.E.87772570. Allcomputer simulation data created during this research isopenly available from the University of Cardiff ResearchPortal at http://doi.org/10.17035/d.2019.0082440884.
References
1 R. Rinaldi and F. Schüth, Energy Environ. Sci., 2009, 2,610–626.
2 C. Li, X. Zhao, A. Wang, G. W. Huber and T. Zhang, Chem.Rev., 2015, 115, 11559–11624.
3 T. Ennaert, J. Van Aelst, J. Dijkmans, R. De Clercq, W.Schutyser, M. Dusselier, D. Verboekend and B. F. Sels, Chem.Soc. Rev., 2016, 45, 584–611.
4 D. Y. Hong, S. J. Miller, P. K. Agrawal and C. W. Jones,Chem. Commun., 2010, 46, 1038–1040.
5 W. Zhang, J. Chen, R. Liu, S. Wang, L. Chen and K. Li, ACSSustainable Chem. Eng., 2014, 2, 683–691.
6 C. Zhao and J. A. Lercher, ChemCatChem, 2012, 4, 64–68.7 S. Kasakov, H. Shi, D. M. Camaioni, C. Zhao, E. Baráth, A.
Jentys and J. A. Lercher, Green Chem., 2015, 17, 5079–5090.8 C. Costa, I. P. Dzikh, J. M. Lopes, F. Lemos and F. R.
Ribeiro, J. Mol. Catal. A: Chem., 2000, 154, 193–201.9 M. Hunger, Catal. Rev.: Sci. Eng., 1997, 39, 345–393.
10 K. Tanabe and W. F. Hölderich, Appl. Catal., A, 1999, 181,399–434.
11 A. Galadima and O. Muraza, Microporous Mesoporous Mater.,2017, 249, 42–54.
12 B. Güvenatam, E. H. Heeres, E. A. Pidko and E. J. Hensen,Catal. Today, 2016, 269, 9–20.
13 B. Güvenatam, E. H. Heeres, E. A. Pidko and E. J. Hensen,J. Mol. Catal. A: Chem., 2015, 410, 89–99.
14 J. Lu, S. Behtash, O. Mamun and A. Heyden, ACS Catal.,2015, 5, 2423–2435.
15 L. Nie, P. M. De Souza, F. B. Noronha, W. An, T. Sooknoiand D. E. Resasco, J. Mol. Catal. A: Chem., 2014, 388–389,47–55.
16 Q. Tan, G. Wang, L. Nie, A. Dinse, C. Buda, J. Shabaker andD. E. Resasco, ACS Catal., 2015, 5, 6271–6283.
17 L. Nie and D. E. Resasco, J. Catal., 2014, 317, 22–29.18 C. Hernandez-Tamargo, A. Roldan and N. H. de Leeuw,
J. Phys. Chem. C, 2019, 123, 7604–7614.19 C. E. Hernandez-Tamargo, A. Roldan and N. H. de Leeuw,
Mol. Catal., 2017, 433, 334–345.20 C. Zhao, D. M. Camaioni and J. A. Lercher, J. Catal.,
2012, 288, 92–103.21 C. Zhao, S. Kasakov, J. He and J. A. Lercher, J. Catal.,
2012, 296, 12–23.22 A. J. O'Malley, S. F. Parker and C. R. A. Catlow, Chem.
Commun., 2017, 53, 12164–12176.23 D. T. Lundie, A. R. McInroy, R. Marshall, J. M. Winfield, P.
Jones, C. C. Dudman, S. F. Parker, C. Mitchell and D.Lennon, J. Phys. Chem. B, 2005, 109, 11592–11601.
24 M. E. Potter, S. Chapman, A. J. O'Malley, A. Levy, M.Carravetta, T. M. Mezza, S. F. Parker and R. Raja,ChemCatChem, 2017, 9, 1897–1900.
25 R. F. Howe, J. McGregor, S. F. Parker, P. Collier and D.Lennon, Catal. Lett., 2016, 146, 1242–1248.
26 A. J. O'Malley, S. F. Parker, A. Chutia, M. R. Farrow, I. P.Silverwood, V. García-Sakai and C. R. A. Catlow, Chem.Commun., 2016, 52, 2897–2900.
27 H. Jobic and D. N. Theodorou, Microporous MesoporousMater., 2007, 102, 21–50.
28 H. Jobic, J. Mol. Catal. A: Chem., 2000, 158, 135–142.29 H. Jobic and D. N. Theodorou, J. Phys. Chem. B, 2006, 110,
1964–1967.30 H. Paoli, A. Méthivier, H. Jobic, C. Krause, H. Pfeifer, F.
Stallmach and J. Kärger, Microporous Mesoporous Mater.,2002, 55, 147–158.
31 S. Mitra, A. Tripathy, N. Gupta and R. Mukhopadhyay, Appl.Phys. A: Mater. Sci. Process., 2002, 74, s1308–s1310.
32 H. Jobic, M. Bée and A. J. Dianoux, J. Chem. Soc., FaradayTrans. 1, 1989, 85, 2525.
33 S. K. Matam, A. J. O'Malley, C. R. A. Catlow, S. Suwardiyanto,P. Collier, A. P. Hawkins, A. Zachariou, D. Lennon, I.Silverwood, S. F. Parker and R. F. Howe, Catal. Sci. Technol.,2018, 8, 3304–3312.
34 H. Jobic, A. Renouprez, M. Bee and C. Poinsignon, J. Phys.Chem., 1986, 90, 1059–1065.
35 V. K. Sharma, S. Gautam, S. Mitra and R. Mukhopadhyay, Z.Phys. Chem., 2010, 224, 133–152.
36 A. J. O'Malley, I. Hitchcock, M. Sarwar, I. P. Silverwood, S.Hindocha, C. R. A. Catlow, A. P. E. York and P. J. Collier,Phys. Chem. Chem. Phys., 2016, 18, 17159–17168.
37 B. J. Borah, H. Jobic and S. Yashonath, J. Chem. Phys.,2010, 132, 144507.
38 A. J. O'Malley, C. R. A. Catlow, M. Monkenbusch and H.Jobic, J. Phys. Chem. C, 2015, 119, 26999–27006.
39 A. J. O'Malley, V. García Sakai, I. P. Silverwood, N.Dimitratos, S. F. Parker and C. R. A. Catlow, Phys. Chem.Chem. Phys., 2016, 18, 17294–17302.
40 A. Sayeed, S. Mitra, A. V. Anil Kumar, R. Mukhopadhyay, S.Yashonath and S. L. Chaplot, J. Phys. Chem. B, 2003, 107,527–533.
41 R. Mukhopadhyay, A. Sayeed, S. Mitra, A. V. Anil Kumar,M. N. Rao, S. Yashonath and S. L. Chaplot, Phys. Rev. E:Stat., Nonlinear, Soft Matter Phys., 2002, 66, 061201.
42 X. Zhu, L. L. Lobban, R. G. Mallinson and D. E. Resasco,J. Catal., 2011, 281, 21–29.
43 C. Zhao, W. Song and J. A. Lercher, ACS Catal., 2012, 2,2714–2723.
44 X. Zhu, L. Nie, L. L. Lobban, R. G. Mallinson and D. E.Resasco, Energy Fuels, 2014, 28, 4104–4111.
45 M. T. F. Telling and K. H. Andersen, Phys. Chem. Chem.Phys., 2005, 7, 1255–1261.
46 X. Wang and R. Rinaldi, Angew. Chem., Int. Ed., 2013, 52,11499–11503.
47 Z. Ma, V. Custodis and J. A. Van Bokhoven, Catal. Sci.Technol., 2014, 4, 766–772.
48 R. T. Azuah, L. R. Kneller, Y. Qiu, P. L. Tregenna-Piggott,C. M. Brown, J. R. Copley and R. M. Dimeo, J. Res. Natl. Inst.Stand. Technol., 2009, 114, 341–358.
49 O. Arnold, J. Bilheux, J. Borreguero, A. Buts, S. Campbell, L.Chapon, M. Doucet, N. Draper, R. Ferraz Leal, M. Gigg, V.Lynch, A. Markvardsen, D. Mikkelson, R. Mikkelson, R.Miller, K. Palmen, P. Parker, G. Passos, T. Perring, P.Peterson, S. Ren, M. Reuter, A. Savici, J. Taylor, R. Taylor, R.Tolchenov, W. Zhou and J. Zikovsky, Nucl. Instrum. MethodsPhys. Res., Sect. A, 2014, 764, 156–166.
50 J. D. Gale and A. L. Rohl, Mol. Simul., 2003, 29, 291–341.51 J. D. Gale, Z. Kristallogr., 2005, 220, 552–554.52 I. T. Todorov, W. Smith, K. Trachenko and M. T. Dove,
J. Mater. Chem., 2006, 16, 1911–1918.53 G. Kresse and J. Hafner, Phys. Rev. B: Condens. Matter Mater.
Phys., 1993, 47, 558–561.54 G. Kresse and J. Hafner, Phys. Rev. B: Condens. Matter Mater.
Phys., 1994, 49, 14251–14269.55 G. Kresse and J. Furthmüller, Phys. Rev. B: Condens. Matter
Mater. Phys., 1996, 54, 11169–11186.56 G. Kresse and J. Furthmüller, Comput. Mater. Sci., 1996, 6,
15–50.57 R. Grau-Crespo, S. Hamad, C. R. A. Catlow and N. H. De
Leeuw, J. Phys.: Condens. Matter, 2007, 19, 256201.58 M. Born and K. Huang, Dynamical Theory of Crystal Lattices,
Oxford University Press, Oxford, 1988.59 P. P. Ewald, Ann. Phys., 1921, 369, 253–287.60 J. E. Jones, Proc. R. Soc. London, Ser. A, 1924, 106, 463–477.61 R. A. Buckingham, Proc. R. Soc. London, Ser. A, 1938, 168,
264–283.62 M. J. Sanders, M. Leslie and C. R. Catlow, J. Chem. Soc.,
Chem. Commun., 1984, 1271–1273.63 C. R. Catlow, R. James, W. C. MacKrodt and R. F. Stewart,
Phys. Rev. B, 1982, 25, 1006–1026.64 K. P. Schröder, J. Sauer, M. Leslie, C. Richard, A. Catlow and
J. M. Thomas, Chem. Phys. Lett., 1992, 188, 320–325.65 D. A. Mooney, F. Müller-Plathe and K. Kremer, Chem. Phys.
Lett., 1998, 294, 135–142.66 G. Sastre, N. Raj, C. R. A. Catlow, R. Roque-Malherbe and A.
Corma, J. Phys. Chem. B, 1998, 102, 3198–3209.67 J. P. Ryckaert, G. Ciccotti and H. J. Berendsen, J. Comput.
Phys., 1977, 23, 327–341.68 R. Vetrivel, C. R. A. Catlow and E. A. Colbourn, J. Chem. Soc.,
Faraday Trans. 2, 1989, 85, 497–503.69 International Zeolite Association, http://www.iza-structure.org/
databases/ModelBuilding/BEA.pdf.
70 J. M. Newsam, M. M. J. Treacy, W. T. Koetsier andC. B. D. Gruyter, Proc. R. Soc. London, Ser. A, 1988, 420,375–405.
71 A. R. Ruiz-Salvador, R. Grau-Crespo, A. E. Gray and D. W.Lewis, J. Solid State Chem., 2013, 198, 330–336.
72 H. J. C. Berendsen, J. P. M. Postma, W. F. van Gunsteren, A.DiNola and J. R. Haak, J. Chem. Phys., 1984, 81, 3684–3690.
73 J. P. Perdew, K. Burke and M. Ernzerhof, Phys. Rev. Lett.,1996, 77, 3865–3868.
74 W. Kohn and L. J. Sham, Phys. Rev., 1965, 140, A1133–A1138.75 P. E. Blöchl, Phys. Rev. B, 1994, 50, 17953–17979.76 G. Kresse and D. Joubert, Phys. Rev. B, 1999, 59, 1758–1775.77 H. Monkhorst and J. Pack, Phys. Rev. B, 1976, 13,
5188–5192.78 K. M. Ho, C. L. Fu, B. N. Harmon, W. Weber and D. R.
Hamann, Phys. Rev. Lett., 1982, 49, 673–676.79 C. L. Fu and K. M. Ho, Phys. Rev. B, 1983, 28, 5480–5486.80 M. Methfessel and A. T. Paxton, Phys. Rev. B, 1989, 40,
3616–3621.81 S. Grimme, J. Antony, S. Ehrlich and H. Krieg, J. Chem.
Phys., 2010, 132, 154104.82 S. Grimme, S. Ehrlich and L. Goerigk, J. Comput. Chem.,
2011, 32, 1456–1465.83 W. H. Press, S. A. Teukolsky, W. T. Vetterling and B. P.
Flannery, The Art of Scientific Computing, CambridgeUniversity Press, New York, 3rd edn, 2007.
84 F. Birch, Phys. Rev., 1947, 71, 809–824.85 S. Nosé, J. Chem. Phys., 1984, 81, 511–519.86 S. Nosé, Prog. Theor. Phys. Suppl., 1991, 103, 1–46.87 D. M. Bylander and L. Kleinman, Phys. Rev. B, 1992, 46,
13756–13761.88 V. F. Sears, Can. J. Phys., 1966, 44, 1279–1297.89 F. Volino and A. Dianoux, Mol. Phys., 1980, 41, 271–279.90 A. J. O'Malley, M. Sarwar, J. Armstrong, C. R. A. Catlow, I. P.
Silverwood, A. P. E. York and I. Hitchcock, Phys. Chem.Chem. Phys., 2018, 20, 11976–11986.
91 S. C. Wiedemann, A. Muñoz-Murillo, R. Oord, T. van Bergen-Brenkman, B. Wels, P. C. Bruijnincx and B. M. Weckhuysen,J. Catal., 2015, 329, 195–205.
92 K. W. Herwig, Z. Wu, P. Dai, H. Taub and F. Y. Hansen,J. Chem. Phys., 1997, 107, 5186–5196.
93 S. Gautam, T. Le, A. Striolo and D. Cole, Phys. Chem. Chem.Phys., 2017, 19, 32320–32332.