187
January 2004 COMMUNITY TRAINING AND ASSISTANCE CENTER Catalyst for Change Pay for Performance in Denver Final Report

January 2004
COMMUNITY TRAINING AND ASSISTANCE CENTER
Catalyst for ChangePay for Performance in DenverFinal Report
30 WINTER STREET • BOSTON, MA 02108TEL: 617.423.1444 • E-MAIL: [email protected]
www.ctacusa.com
COMMUNITY TRAINING AND ASSISTANCE CENTER
ABOUT CTAC:
The Community Training and Assistance Center
is a national not-for-profit organization with a
demonstrated record of success in urban communities.
It focuses on developing leadership, planning and
managerial expertise within community-based
organizations, school systems, collaborative partner-
ships, state and municipal governments, and health
and human service agencies. Since 1979, CTAC has
provided assistance to hundreds of community-based
organizations, coalitions and public institutions in the
United States and several other countries.
CTAC’s staff is comprised of nationally recognized
executives, educators, policy makers and organizers
who have extensive experience working with city,
county and state agencies, educational institutions,
federal legislative bodies, not-for-profit organizations,
philanthropic institutions and the private sector.
© Community Training and Assistance Center
Boston, Massachusetts
January 2004
All rights reserved

January 2004
COMMUNITY TRAINING AND ASSISTANCE CENTER
Catalyst for ChangePay for Performance in DenverFinal Report

Acknowledgements
The Community Training and Assistance Center wishes to thank the sponsors of this research study, the DenverPublic Schools Board of Education and the Denver Classroom Teachers Association.Their commitment tobringing quality and accountability to public education is exemplary. During the four years of the pilot, theyhave been able to maintain a critical focus on the development and implementation of Pay for Performance.
CTAC would like to acknowledge the many people who have contributed both to the pilot and to makingthis study possible.The leadership of the Board of Education has been pivotal to the pilot.This has involved allboard members: President Les Woodward, former President Elaine Gantz Berman, Lucia Guzman, Bruce Hoyt,Michelle Moss, Kevin Patterson,Theresa Peña, and previous board members Sue Edwards, Sharon Macdonald,James Mejia and Bennie Milliner.The leadership of the Association has also been essential, including PresidentRebecca Wissink, former President Andrea Giunta and Executive Director Bruce Dickinson.Thank you forbeing willing to share this professional challenge with CTAC; we have appreciated your support and confidence.
The CTAC research study provides a solid foundation for the ideas and desires of those who wish to createa new design for a public school system.We wish to thank those individuals who, during these past four years,have contributed so much to this effort.We have been assisted by many leaders of the Denver Public Schools,including Superintendent Jerry Wartgow and former superintendents Bernadette Seick, Chip Zullinger, SharonJohnson and Irv Moskowitz.They have been uniformly helpful.
The coordination and implementation of the many facets of this study could not have been conductedwithout the assistance of Design Team Leader Brad Jupp, current Design Team members Cheryl Betz, HenryRoman and Shirley Scott, former members Pat Sandos and Rebecca Wissink, and assistant Ginger Doyle.Theirdrive, passion and sense of urgency are inspiring.
We would like to extend a special thank you to the unsung heroes of the pilot and study—the pilot schoolteachers, administrators and parents.They have made special efforts on behalf of students.
We have been assisted by many current and former members of the central administration.While there are too many such people to mention everyone individually, we would like to identify the following with ourappreciation:Assistant Superintendents Richard Allen,Wayne Eckerling and Andre Pettigrew, Chief AcademicOfficer Sally Mentor Hay, and former administrators Beth Celva, Craig Cook, Larry Lindauer and Dianne Lefly.Key contributions have also been made by James McIntosh and Richard Machado of Assessment and Testing;Ethan Hemming of Educational Services; Joyce Fell, Peggy Flynn and Billy Gould of Human Resources; andDirector Aaron Gray and Flor Amaro of Community Relations.They have all been generous with their timeand attention.
There were two groups which have assumed additional responsibility for the progress of the pilot.They arethe pilot Leadership Team and the Joint Task Force on Teacher Compensation.The participating individuals havededicated an inordinate amount of their professional and personal time to understand and facilitate importantelements of this project.
CTAC is grateful for all those listed above, and the many other people who helped to make this study a reality.
This study has been made possible through the generous support of Rose Community Foundation,TheBroad Foundation,The Daniels Fund,The Sturm Family Foundation, Jay and Rose Phillips Family Foundation,The Denver Foundation, Donnell-Kay Foundation, and The Piton Foundation.
The findings, analyses and recommendations expressed in this study are those of the Community Trainingand Assistance Center.
© Community Training and Assistance Center, January 2004
Denver Project Team
Principal Study AuthorsWilliam J. SlotnikMaribeth D. Smith
Contributing AuthorsRoberta J. GlassBarbara J. Helms, Ph.D.
Field Operations DirectorDonald W. Ingwerson, Ph.D.
Team MembersDenise A. BellLee BrayPeggie L. BrownRobin C. Burr, Ph.D.Mary Ann CraytonWilliam M. EglintonDonald B. Gratz, Ph.D.Mimi HowardWilliam C. LannonJuan J. MayaCandy Miller
Marcia J. Plumleigh, Ph.D.Lynn J. StinnetteMartha SwartzJulia D.ThoméBarbara Zeno
Statistical Measurement Task ForceRobert H. Meyer, Ph.D.John B.Willett, Ph.D.Statistical ReviewKathleen Calore
CreditsThis study was conducted and prepared by the Community Training and Assistance Center ofBoston, Massachusetts.

3Pay for Performance in Denver
Contents4
Executive Summary
12
CHAPTER I
Overview
18
CHAPTER I I
Pay for Performance
26
CHAPTER I I I
Research Design
42
CHAPTER IV
Objectives:The Nexus
64
CHAPTER V
The Teacher Perspective
82
CHAPTER VI
Quantitative Analyses
104
CHAPTER VI I
Catalyst for Change
112
CHAPTER VI I I
Organizational Alignment and System Quality
128
CHAPTER IX
Issues and Recommendations
136
CHAPTER X
National Implications
148
Appendix
4 Catalyst for Change
The Denver Public Schools (DPS) and the Denver Class-room Teachers Association (DCTA) jointly sponsored thePay for Performance (PFP) pilot.This four-year pilot,conducted during the 1999-2003 school years, focusedon developing a direct link between student achieve-ment and teacher compensation.The sponsoring parties
committed to implementing the pilot and to studying the results of this initiative. Catalyst forChange is the final report of the results of this innovative collaboration on behalf of students and teachers.
The centerpiece of Pay for Performance in Denver has been the teacher objectives at the 16 pilot schools.Teachers developed two annual objectives based on student achievement thatrequired the approval of the principal.Teachers received additional compensation if they met theirobjectives.The entire pilot was stewarded by a four-person Design Team that included district andunion appointees.The pilot involved 13% of Denver’s schools.These schools represented a crosssection of the district’s client and service base. In microcosm, the pilot schools presented the chal-lenges of the broader district.Their experiences provided a foundation for a study of pilot impact.
The Community Training and Assistance Center (CTAC) was commissioned in November 1999to conduct a comprehensive study of the impact of the pilot and to provide the technical assistancenecessary to help assure a pilot of quality and integrity.The study’s mid-point report, Pathway toResults: Pay for Performance in Denver was presented in December 2001. Catalyst for Change is thesummative report.
The study has four core components. First, it examines the impact of the pilot on studentachievement based on two independent assessments. Second, it examines teacher objectives: theirsubstance, quality and relationship to student achievement.Third, the study considers the effect of a range of student, teacher, and school factors on the results of the pilot. Finally, it identifies thebroader institutional factors that have affected implementation.
The data for this four-year study has been extensive. CTAC conducted surveys and examinedresponses from 2,870 teachers, parents, administrators and others involved in the pilot; conductedand reviewed 615 interviews; and organized and analyzed tens of thousands of student records plusteacher and demographic data for the pilot and control schools.The study also involved the carefulreview of artifact and documentary data and the detailed examination of 4,012 teacher objectives.Human resource records and school documentation were linked to school, teacher, and studentinformation to create a comprehensive database. Finally, the study included hundreds of hours ofobservations, from classrooms to boardrooms, which contributed a strong sense of the context andthe everyday work of the pilot.
The nature of a pilot is experimentation. Denver conducted the pilot in order to examine theeffectiveness and impact of a new direction. By building around the objective setting process, thepilot design was straightforward and honored both teacher judgment and perspective.The imple-mentation of the pilot, though, was necessarily more complex.As teachers were learning aboutdeveloping and meeting measurable annual objectives, the schools and the district were learningabout the necessary alignment of the curriculum, assessment, student data, human resources andother parts of the larger system with Pay for Performance.The alignment and strengthening of these functions proved complicated and challenging.
The pilot has demonstrated that the focus on student achievement and a teacher’s contributionto such achievement can be a major trigger for change—if the initiative also addresses the district factors that shape the schools.The findings show promising results in many of the areas studied.However, the pilot’s implementation also revealed areas of practice and policy that will need to bestrengthened further in order to continue improving student achievement as the key elements of Pay for Performance are taken to scale in the district.
E x e c u t i v eS u m m a r y

5Pay for Performance in Denver
Highlighted below are CTAC’s analyses, findings and recommendations.All of the recommen-dations are crafted to meet the standard of increasing the manageability, fairness and sustainabilityof Pay for Performance.The report also examines the national implications of Denver’s Pay forPerformance pilot.The issues are complex and multi-faceted, and are discussed in full detail in the chapters of the report.
A. Primary Findings Impact on Student Achievement• At all three academic levels—elementary, middle, and high school—higher mean student
achievement in the pilot schools is positively associated with the highest quality objectives.Students whose teachers had excellent objectives, based on a four-level rubric developed byCTAC, achieved higher mean scores than students whose teachers’ objectives were scored lower on the rubric.This holds true on most tests of the Iowa Test of Basic Skills (ITBS)and the Colorado Student Assessment Program (CSAP).
At the elementary school level, students of teachers with excellent objectives (rubric level 4) had significantly higher mean normal curve equivalent (NCE) scores on the ITBS Reading,ITBS Language, and CSAP Math tests than students of teachers with lower rubric levels.
At the middle school level, students of teachers with level 4 objectives had significantly highermean scores than students of teachers with level 3 and level 2 objectives on the CSAP Math test.
At the high school level, there were significantly higher mean scores on the ITBS Reading andCSAP Writing tests at Manual High School and on the CSAP Writing test at Thomas JeffersonHigh School for students whose teachers had level 4 objectives.
Six other tests (one elementary, three middle school, and two high school level) show a positive relationship between highest quality objectives and higher achievement level that is not statistically significant.
• Pilot students were compared to control students, estimating the change in mean NCE scoresover time (e.g., from the baseline year through the end of the pilot) on three tests of the ITBS and three tests of the CSAP.Two-stage hierarchical linear modeling (HLM) was used to account for correlation between observations and to adjust for differences in school andstudent characteristics.The use of NCEs makes it possible to determine whether students areperforming better than expected based on previous scores—attaining more than an expectedyear of growth—or not.
The effect of the pilot varies by level of school:
The pilot elementary school mean NCE scores declined on the ITBS Math, CSAP Readingand CSAP Math tests.The control school mean NCE scores declined on the ITBS Math test and increased on the CSAP Writing test.These results were statistically significant.The performance of the pilot students was lower than the controls on the tests except on the ITBS Language.
The pilot middle school students performed significantly higher than the controls on the ITBSReading, CSAP Writing, and CSAP Math tests.The average NCE scores of middle school pilotstudents increased significantly over time (i.e., attained more than a year’s expected growth) onthe ITBS Reading, CSAP Writing, and CSAP Math tests.The controls experienced statisticallysignificant declines in mean NCE scores on the three ITBS tests over the course of the pilot andstatistically significant increases on the three CSAP tests. On the ITBS Language test, both thepilots and controls decreased by comparable amounts.

The high school pilots and controls experienced statistically significant increases in mean NCEscores over time on most tests. Manual High School students had significantly higher increasesthan the control school students on the ITBS Language and Math tests.Thomas JeffersonHigh School students performed significantly higher than the control school students on theITBS Language, ITBS Math and the CSAP Reading tests and significantly lower on the ITBSReading test.
• Meeting two objectives is positively associated with higher mean achievement scores.
At the elementary schools, the students of teachers who met two objectives had significantlyhigher mean NCE scores on all six tests than students of teachers who met one objective.
At the middle schools, meeting one or two objectives was associated with significantly highermean NCE scores than meeting no objectives on the ITBS Reading and Language tests. Similarpositive relationships were seen on the ITBS Math and CSAP Math tests but they are not statistically significant.
At the high schools, the students of teachers who met two objectives (at both Manual andThomas Jefferson) had significantly higher mean NCE scores than students of teachers who metone objective or no objectives on the ITBS Reading test. Similar positive relationships are foundon the ITBS Math, CSAP Writing, and CSAP Math tests at Manual High School and on ITBSMath, CSAP Reading, and CSAP Math at Thomas Jefferson High School but they are not statistically significant.
• Student achievement rises as length of teacher participation in the pilot rises.
Elementary students whose teacher had been in the pilot for two, three, and four years hadmean ITBS Reading scores 0.8, 1.3, and 2.2 NCEs higher than students of one-year teachers.Elementary students of four-year teachers also had mean ITBS Math scores significantlyhigher than those of one-year teachers.
Middle school students of two-year teachers scored 2 NCEs higher on average and students of three-year teachers scored 3.2 NCEs higher than students of one-year teachers.
High school students of two-year pilot teachers scored higher on ITBS Reading, ITBS Math,and CSAP Reading at both pilot high schools, but the difference was only statistically signifi-cant for the Thomas Jefferson ITBS Reading exam.
• The pilot has been the catalyst for developing a fundamentally new compensation plan forteachers in Denver which is based, in part, on student achievement.
Impact of Objectives• The percent of teachers who developed objectives that were rated at the two highest levels of
the rubric increased steadily over the course of the pilot.The particular improvement in theobjectives in the final year of the pilot is largely attributable to greater attention to learningcontent in the objectives. By the close of the pilot, 28% of the objectives were at level four(excellent) and 44% were at level three (adequate).
• There is a significant increase in the quality of the objectives as the number of years a classroomteacher participated in the pilot increases.
• Teachers met their objectives at a high rate.The data collected by the district over the four yearsof the pilot show that from 89% to 93% of the teachers met one or more objectives and wereawarded additional compensation.
6 Catalyst for Change

• As teachers gained more years of experience in the pilot, their ability to meet their objectivesalso increased significantly. One-year pilot participants met 89% of their objectives.The successrate rose to 98% for four-year participants.
• Educational background and years of experience in the Denver Public Schools are related towhether classroom teachers met their objectives.
Certified teachers met 92% of their objectives, while teachers participating in the Teacher-in-Residence alternative certification program met 83% of their objectives.
First year teachers met 86% of their objectives, while teachers with two or more years of experience met 92% of their objectives.
Teachers with 15 or more years of experience in the Denver Public Schools met their objectivesat lower rates (85%) than teachers with fewer than four years (95%), four to 10 years (90%), or11 to 14 years (95%) of experience.
• There are similarities between pilot school teacher objectives and control school teacher goals.However, the control school teachers make less use of baseline data. Some of the similarities areattributable to the pilot's objective setting protocol being in full or partial use in nearly one-third(32%) of the control school goals reviewed in 2002-2003.
• The objectives and their learning content are not included as part of the strategies in the schoolimprovement plans.
Perceptions of Participants and Other Parties• The pilot has significantly increased the school and district focus on student achievement.This
focus has increased with each succeeding year of pilot implementation.
• Teachers indicate that they have greater access to student achievement data and that they use thedata more effectively, particularly baseline data, to establish growth expectations, to focus earlieron students who may need more assistance and to monitor progress.
• Most pilot teachers do not attribute changes in their core classroom instructional practices to the pilot.Teachers indicate that they did not receive a mandate to make such changes.
• Most teachers feel that cooperation among teachers has improved or stayed the same at thepilot schools.
• Pilot teachers are less fearful of pay for performance than control school teachers. By the end of the pilot, pilot participants were more likely to offer suggestions for improvement than toindicate that pay for performance was not viable.
• Pilot teachers continued throughout the pilot to raise issues of fairness and trust in the objectivesetting and review process. However, they believe that it is possible to set fair objectives.
• The quality of interaction between the principals and teachers is pivotal to the implementationof Pay for Performance at the school sites.Teachers in the pilot schools believe that there areinconsistencies from school to school in how principals review and analyze progress on teacherobjectives. Principals indicate that there is a lack of clarity regarding their role and authority and a need for targeted professional development.
• Parents indicate that a teacher's contribution to student achievement should be rewarded in financial terms.
7Pay for Performance in Denver

• The vast majority of parents (94%) and teachers (93%) feel that more than one measure of studentachievement should be used to determine teacher performance.
• Participants value the training they received, but express a need for more professional developmentbased on the specific student achievement levels in the individual schools and classrooms and theinstructional challenges of meeting objectives.
Institutional Factors• The DPS/DCTA collaboration on behalf of student achievement has been significant.This collabora-
tion has been pivotal to the development of Pay for Performance despite changes in district leadershipand structure.
• Pay for Performance has enabled issues which have adversely affected district progress, sometimes formany years, to be put on center stage. Operating in a climate protected by external supporters andinternal reformers, the pilot provided a vehicle for problems to be discussed, analyzed and acted upon.These actions have helped the district to develop an increased capacity to make mid-course corrections.
• Teachers and principals were provided with multiple opportunities through the study to influence thecourse of the pilot. For many, this was a marked and positive departure from past district practice.
• The Design Team contributed significantly to the progress of the pilot.
• District support systems were seriously challenged by the implementation of Pay for Performance.Many opportunities for change were identified and district action resulted. Challenges of organizationalalignment still lie ahead for the district.
• The turnover in leadership positions during the course of the pilot, particularly at the level of the pilotschool principals and the superintendency, contributed to some of the concerns related to trust andinstitutional priority that have affected the implementation of the pilot.
• The lack of an agreed-upon and aligned portfolio of district assessments for measuring student achieve-ment meant that 166 identifiable assessments were used to measure progress in meeting objectives,and 256 teachers used generally referenced measurements, in the last year of the pilot.
• The task of linking student achievement results to specific teachers has proven more challenging thanoriginally anticipated by the district.As pilot efforts go to a broader scale of implementation in the district, this type of data capacity will be greatly needed.
• Several factors, including the state and national high stakes testing environment and the district’sexperiences with pay for performance for administrators, adversely affected the climate for implementing the pilot.
B. RecommendationsIssue One: AlignmentSince the purpose of the district’s major initiatives is to increase student achievement, the organization willbenefit from continuing to align its initiatives around that goal in a clear and purposeful manner.
Recommendations include:
• Bring the objective setting to scale with instructional support. Crafting objectives is a key initial step in planning and delivering instruction. It is not merely an exercise in writing. It will be important to align instructional support to assist teachers to meet the specific targets in their objectives.
8 Catalyst for Change

• Strengthen the linkage between classroom objectives, school improvement plans and district standards and goals.To the extent that objectives, school plans, and standards and goals are mutually reinforcing, the imple-mentation of all three will be strengthened and there will be greater clarity of purpose.
• Increase the connection between student information systems and human resources systems. Building on the district’s progress in supporting the pilot schools, this recommendation focuses on establishinggreater district-wide linkages among the data systems for student assessment, planning, and humanresources.These linkages are critical for any effort that seeks to examine the contribution of ateacher to student achievement.
• Project the costs of changing internal practices and requirements. There are direct financial costs to imple-menting Pay for Performance systemwide.To maintain teacher commitment, the momentum of thepilot needs to continue under a range of financial circumstances.
Issue Two: Assessment A portfolio and appropriate usage of high quality assessments are the marks of a district that is aligned andaccountable for its students. Using student assessments for a new purpose—compensation—requires greaterassessment and data capacity, as well as a skillfully supervised and consistently administered effort at theschool sites so that all students have regular assessments.
Recommendations include:
• Expand the district’s assessment strategy. The existing assessment plan should become a component of a more comprehensive assessment strategy that includes aligning fair and valid assessments with the district's standards and curricula, ensuring practitioner input into the selection and use of assessments,and establishing a clear direction about who is to be assessed.
• Define which assessments can be used for objective setting and compensation purposes. There continues to be aneed for a rational level of prescriptive direction regarding which assessments can be used as part of anynew system that involves pay for performance.A pay for performance system or companion educationalinitiative that has too many allowable assessments will be unmanageable, will cause discord and will failto promote valid increases in student achievement.
• Make the use of multiple measures a developmental priority. For four years, Denver teachers and site admin-istrators have been raising questions about the fairness and accuracy of single measures.The charge is for the district to develop a means to link several assessments together to more meaningfully identifystudent progress.
• Increase the district capacity to disaggregate and analyze student achievement data. Regular analyses of thesedata strengthen decisions about delivering classroom instruction, developing school improvement plans, and managing strategically at the district level and, in the era of No Child Left Behind, it will provide communities with high quality information about its schools.
• Convene select urban districts to analyze and take action on problems in assessments. As a result of the Pay forPerformance pilot, Denver is positioned as a national leader in the area of tying teacher compensa-tion, in part, to student achievement.The ensuing challenges that Denver faces are shared in commonby other districts. Denver should convene a small number of urban districts and assessment specialiststo guide test developers to link their efforts more directly to the growing needs of urban districts.
9Pay for Performance in Denver

Issue Three: Professional DevelopmentVirtuosity in teaching is the goal of professional development for teachers. Initiatives often assume thatteachers will embrace the concept of the reform and change their practices when, in fact, they may notknow about new practices that would be appropriate. Both educational research and the pilot outcomesindicate that there is a profound connection between objectives based on learning content, a teacher’s subject matter knowledge, specific teaching practices, and student achievement.
Recommendations include:
• Establish district standards for professional development. Establishing quality standards for professionaldevelopment is a natural and necessary complement to instructional priorities.They should be tied to the Colorado Teacher Standards, research about best teaching practices, the district’s curriculumstandards, and the assessment strategy described above.This work will result in a roadmap for provid-ing professional development services and ensuring quality control.
• Predicate professional development on student achievement. The priorities for professional development needto be based on continuous reviews of student achievement results by school staffs. Such a review identi-fies schoolwide, classroom and individual student instructional needs and instructional areas which needto be updated or improved.This, in turn, may reveal areas in which school staff or the community mayneed assistance in meeting these needs.
• Create opportunities for teachers and principals to shape professional development. One of the key findingsfrom the pilot is that the ability of site practitioners to influence implementation contributes toimprovements in the overall effort.This kind of involvement increases the prospects of professionaldevelopment to effectively target teacher needs, school priorities and district goals.
Issue Four: LeadershipMany reforms fail for lack of sustained leadership.The Board of Education and the Association demon-strated leadership as they joined to create the pilot.The Design Team has provided creative leadership in advancing the pilot through uncharted pathways.As the effort moves forward to institutionalize thecritical elements of the pilot into district practice, quality leadership will be essential to shape and guidethe reform through its next steps.
Recommendations include:
• Broaden the collaboration on behalf of student achievement. The pilot is the result of an unprecedented collaboration between the Board of Education and the Association.This collaboration has been substantive and effective. It should be extended to other parts of district educational operations,regardless of the outcome of the Association and Board votes on a new compensation plan.
• Continue to place problems on center stage. A central factor contributing to the accomplishments of thepilot has been the ability to place critical issues that affect the district on center stage.The districtwill benefit by continuing and extending this function.
• Create a Principals Leadership and Achievement Institute. All principals need to understand deeply howlearning occurs and how it is nourished, measured and supported.They need ongoing, sustainedopportunities to identify salient site issues, analyze trends in student achievement data, reflect onemerging issues, develop their skill in observing classrooms and providing support to teachers, andbuild the knowledge to work effectively with diverse students and families. Building these capacitieswill complement the current district plans to prepare principals to carry out targeted educational initiatives.
10 Catalyst for Change

• Prepare for the post-pilot and post-vote transition. The pilot benefited greatly from having a special internal implementation team with the commitment and sense of urgency that is essential to createchange.As the learnings and practices from the pilot are implemented district-wide, it will be essential to institutionalize the qualities that the Design Team brought to the implementation of the pilot.
C. SummaryA major initiative that focuses on student achievement—while concurrently exploring changes in theteacher compensation system—goes to the heart of the district mission and structure.As such, the Payfor Performance pilot and study were significant undertakings.
Denver introduced Pay for Performance as a new element in a large urban district.The pilot has beena catalyst for changing the district so that it could become focused on student achievement in a morecoordinated and consolidated way.A key part of Denver’s story is how a pilot, with key internal andexternal supporters, engendered positive change in a larger institution. Many of the changes have beensystemic—changing how the system thinks and behaves.They are, though, works in progress. Challengesof organizational alignment remain distinct.
As in many large urban districts, Denver experienced leadership transitions over the four years of the pilot. However, the Board of Education and the Association stayed the course.As a result, the pilotachieved a substantial degree of reach into the system. By so doing, Denver has contributed to its ownsystemic improvement efforts as well as to those of other districts who may want to go down this path.
The issue of aligning a district in support of a pay for performance system cuts to the very essence ofhow—and to what extent—a school district is functioning in support of student learning.The changesrequired to identify, strengthen and reward individual student growth and individual teacher contributionsunder pay for performance have the added effect of stimulating other parts of the school system to improvethe quality of support and service.The result is a catalyst for change that benefits all students and teachers.
11Pay for Performance in Denver

Overview
A. Background and ChargeIn September 1999, the Denver Public Schools (DPS) and the Denver ClassroomTeachers Association (DCTA) embarked on what would become a four-yearpilot and study of Pay for Performance in 16 schools in the district.An initiativein teacher improvement and accountability, the pilot was established to develop a link between teacher compensation and student achievement through a designthat came out of the negotiations process and was captured in the negotiatedagreement between the district and its teachers.
Efforts to institute performance or incentive pay for teachers have a record ofunsuccessful implementations and have characteristically been anathema to teacherorganizations and “folly” to many teacher researchers.1 For this reason many eyeshave been on Denver, as the district and the Association collaborated to designand implement a pilot that would overcome some of the well-documented objec-tions to pay for performance in education and, additionally, lead to improvementsin student achievement.
Coming at a time of increased accountability measures coupled with a scarcityof qualified teachers, the pilot in Denver recognized that teachers are the criticallink to children achieving high standards and that compensation schedules shouldreflect this fact.Aiming at more rigorous standards for students requires teacherswho are capable of transmitting deeper knowledge and greater skills to their students.According to a recent national analysis:
“State education leaders recognize that teaching, perhaps more than any otherelement of a child’s education that occurs at school, is critical to achievinghigh standards.To bolster the professionalism of the teaching field, meaningfulsalary increases must be tied to improvements in teacher performance.”2
At the core of the Pay for Performance pilot is a process whereby teachersset two classroom-specific objectives with the approval of the building principaland then present evidence of attainment to the principal for verification at the
IC H A P T E R

13Overview
end of the year. If the evidence substantiated that the teacher had met one or both of his/herobjectives, then a performance bonus per objec-tive was awarded to the teacher. Other significantfeatures of the negotiated agreement between the district and the Association were (1) theauthorization of the Design Team as the stewards of the pilot and (2) the commission of a compre-hensive research study to explore the impact ofthe pilot and the effect of a range of contributingfactors on the outcome of the pilot.A thirdimportant negotiated feature was introduced laterin a separate memorandum of understanding—the establishment of the Joint Task Force onTeacher Salary (later the Joint Task Force onTeacher Compensation), formed for the purposeof designing and recommending for adoption anew compensation plan that would be based, inpart, on student achievement.
The charge of the four-member Design Teamwas two-pronged: to develop the pilot as a study of the “feasibility of linking student achievement to teacher compensation” and to evaluate the“capacity of the school system to implement such a program successfully should it be adopted.”3 Tohelp meet this charge, the Community Trainingand Assistance Center (CTAC) was selected toconduct a study of the impact of the pilot and toprovide technical assistance that would help builddistrict capacity to implement a pilot of quality andintegrity. CTAC is a national non-profit organiza-tion, based in Boston, which has been a leadingprovider of technical assistance and research ser-vices to community-based organizations, coalitions,and public institutions in the United States andseveral other countries for twenty-five years. In thisrole, CTAC has worked extensively with schooldistricts that are attempting to improve studentachievement, community involvement, and overallschool and district performance and accountability.
School participation in Pay for Performancewas voluntary, based on faculty votes. During thefirst year 12 elementary schools entered the pilot.In the second year a middle school entered thepilot. By the close of the pilot in June 2003, 16schools were participating in Pay for Performance.
Originally the negotiated agreement identifiedthree approaches to be compared in the pilot.Schools entered the pilot designated as one of
the following: (1) an Approach One school,which measured student progress on a norm-referenced test; (2) an Approach Two school,which measured student progress on a criterion-referenced test or teacher-created measures; or (3) an Approach Three school, which focused onthe teachers’ acquisition of skills and knowledge.These were seen as two output approaches andone input approach.At the mid-point of the pilot,the three approaches were integrated into onebecause all approaches were linked to student out-come measures and all teachers required profes-sional development opportunities. In addition, nosignificant difference among the approaches hademerged in the first two years of data.
B. Areas of Inquiry The study of Pay for Performance, as conducted by CTAC, examines four overarching and inter-acting areas of the pilot, which collectively focuson results and the key factors that may contribute to these results.
Impact on Student Achievement The focus of the pilot, and concomitantly of thestudy, is student achievement. Individual studentgrowth (from spring to spring) is the basic unit of measurement in the study.The study examineschanges in student achievement that have occurredin the participating schools in comparison to thosein the designated control schools, as well as howstudent achievement gains correlate to the qualityand attainment of teacher objectives. For this pur-pose, the study uses student achievement data fromthe Iowa Test of Basic Skills (ITBS) and the ColoradoStudent Assessment Program (CSAP).The ITBS is a national norm-referenced assessment for grades 2-11; the CSAP is the Colorado standards-basedassessment that has been phased in by grade levelduring the course of the pilot.
Impact of the ObjectivesThe spotlight of the pilot has been on the teacher-developed objectives through which additionalcompensation may be earned.The study examinesthe quality and rigor of the objectives, their impacton student achievement, and the perceptions ofpilot participants about the nature and effect of

14 Catalyst for Change
objectives in the school setting. Additionally,objectives are considered from the perspective of whether the teacher met them based on theirown measurements and from the perspective ofstudent growth in each teacher’s classroom at theelementary school level.
School,Teacher and Student Factors The study examines school, teacher, and stu-
dent factors for their potential contribution to theachievement of students and the outcomes of thepilot.The schools participating in the pilot servedifferent populations, therefore it was necessary to control for student and school characteristics.The study also explored the relationship betweenachievement outcomes and teacher characteristics.Additionally, factors such as school plans, teacherexperience, and leadership quality and stability areexamples of potential influences on the results ofthe pilot.
Broader Institutional Factors The study examines a range of institutional fac-tors that have influenced the outcomes of thepilot and from which important lessons can bederived. For example, the availability of adequateand reliable measures for teacher use, as well asalignment between standards, assessments, andprofessional development, and the availability andaccess to student data for teachers are significantsystemic factors that affect a pilot of this nature.
C. Data ComponentsThe study of the impact of the pilot is based on several primary sets of data, collected in each of the four years of the study, which have beensubjected to several layers of analysis. A briefdescription of data sources is provided below andsources are referenced throughout the text of thereport. Data components for the study include:
Comprehensive SurveysConfidential surveys of participants, includingteachers, administrators and parents at both thepilot and control schools, elicited the perspectivesof a range of stakeholders on the status of thepilot, including perceived changes as the pilotprogressed. Additionally, survey questions were
used to test how widespread an issue or opinionidentified in interview data might be among allparticipants.A random sample of pilot and controlschool parents received surveys in English andSpanish.All surveys were returned directly to anindependent scanning service.
Individual and Group InterviewsThe surveys were supplemented by a series ofconfidential individual and/or group interviews of pilot and control teachers and principals, boardmembers, district staff members, Design Teammembers,Association leaders, parents and a rangeof external stakeholders and funders.The inter-view protocols were designed to gain perspectiveon the impact of the pilot and changes in theimpact, as well as an understanding of how indi-viduals were experiencing elements of the pilotsuch as objective setting.Additionally, in seeking to identify factors or conditions that were poten-tially contributing to or impeding the success ofthe pilot, teacher perceptions of the fairness andcredibility of Pay for Performance were followedthrough the life of the pilot.
Student Achievement DataThe analyses of the student achievement data forthe pilot and control schools were based on thedistrict’s two most commonly administered assess-ments, the ITBS and the CSAP.These data havebeen used to follow achievement over the fouryears of the pilot.
Documentary DataDocumentary or artifact data were used to gaingreater perspective on areas such as school plans,teacher orientations, policy development, otherinitiatives, and internal and external communica-tion related to the pilot.The most significant bodyof artifact data for this study were the teacher-developed objectives, which were read each of thefour years and rated based on four quality criteria.
ObservationsThere were also observations of and participation in pilot implementation processes. CTAC was present each month at key planning meetings,both formal and informal, in order to gain an

15Overview
understanding of the decision-making processes,the complications and methods of resolution dur-ing pilot implementation, as well as the ongoingdevelopment of the compensation plan.Althoughteaching was not a subject of this study per se,observations based on the Performance-based Standards for Colorado Teachers were conducted in the classrooms of sixteen pilot teachers selected as representative of the total participant group.
The analyses of these data constitute the substance and findings of the Pay for Performance study.
D.The Content of the Mid-Pointand Final ReportsThe negotiated agreements called for two reportsof the results of the pilot.The mid-point report,Pathway to Results: Pay for Performance in Denver,was published in December 2001 and delineatedthe findings from the baseline year (1999-2000)and the subsequent year (2000-2001).This finalreport is based on data from all four years (1999-2003) of the pilot. It is possible to read the finalreport and understand the character and outcomeof the pilot without having read the earlier reportbecause the areas of inquiry remained constant asadditional years of data and different types of datawere added to the study.The aggregation of fouryears of data, the identification of trends, and thefindings that emerged from the analyses of thesedata present a fuller picture with more longitudi-nal data than the earlier report.4 However, the tworeports are written as companions.
As the reader of this report will discover, thestudy of the Pay for Performance pilot is more than an examination and analysis of data. It is astory as well.Thus, within this report and alongsidethe evidence and findings, there is also a narrative.Like all stories it has beginnings, decisions, players,complications, resolutions, and results.A large bodyof the evidence supporting the findings can befound in the accumulated experience of partici-pants who have told their stories each year to theresearchers. One participant, a member of the Joint Task Force on Teacher Compensation, saysthis eloquently:
“PFP is a story and it must be told right.Wemust get set up to accomplish the mission…Designing and implementing infrastructure ishigh art.We must recognize that it won’t beperfect.We must create an environment and be allowed to recreate it over and over again.We are always going to be planning the per-fect new system and good leadership can helpmake this transition from one iteration to thenext. Each new attempt will have its strengthsand weaknesses. But it’s this process that allowsfor new staff growth and commitment.”
The chapters that follow contain the analyses,the story, the process, and the results of the firstiteration of Pay for Performance in Denver.
Chapter II describes in more detail the genesisof the pilot.The origins of the pilot were rootedin a unique collaboration between the Board ofEducation and the Denver Classroom TeachersAssociation.The design of the pilot is an outcomeof the interests of the two parties rather than onebased on an adopted model or an experimentalresearch design.Additionally, this chapter considersthe Denver pilot in the context of documentedobjections to merit or incentive pay plans of thelast two decades.
Chapter III explains the research design of thestudy. Because this study uses a mixed-methoddesign and because it was conducted in a largeschool district with an evolving educational pro-gram, the design is complex and multi-faceted.As the chapter shows, CTAC worked diligentlywith the school district and Design Team toensure high quality research standards.The effortwas not without its complications, which areexplained in the chapter. Additionally, CTACengaged the thinking of outside experts to addresssome of the statistical and research dilemmas thatemerged. Deeper qualitative studies were added in the fourth year in order to broaden the under-standing of and verify several findings.
Chapters IV and V explain the process used by teachers to set and measure objectives and the methodology used by CTAC to study theseobjectives. Since this was new ground not onlyfor the teacher participants and the leaders of the

pilot but also for educational research, it required comprehensive methodologies. Because there is a significant relationship between the highest quality of the objectives written by teachers and the growth of (elementary) students on independent measures that has held up even as the number of high quality objectives written by teachers increased, objectives as an element of PFP inspire thought-provoking questions about teacher planning and practice.
Chapter VI discusses the four-year trends inthe effects of the pilot on student achievement in the pilot and control schools.These are resultsfrom the Iowa Test of Basic Skills and the ColoradoStudent Assessment Program. The chapter discussesthe utility of the two measures and the impor-tance of being able to follow individual studentgrowth over multiple years. Additionally, thereader will learn how CTAC worked to overcomesome of the bias inherent in the pilot design andimplementation.
Chapters VII and VIII look at the impact of the pilot on the Denver Public Schools, discussingthe way in which the pilot has acted as a catalystfor change of the larger organization and alsoidentifying the challenges to organizational align-ment and systemic quality that implementing apay for performance system entails. Most of theissues of fairness and credibility in PFP that wereidentified by teacher participants result from systemic weaknesses and gaps, the most glaring of which concern the adequacy of student assess-ments and professional development for teachersand principals.
Chapter IX contains recommendations for theDenver Public Schools and the Denver ClassroomTeachers Association as they move to the nextiteration of Pay for Performance.
Chapter X provides an analysis of the nationalimplications of performance pay systems with aset of recommendations for districts and unionsembarking on this type of reform and for founda-tions seeking to promote systemic change inAmerican public education.
16 Catalyst for Change

Pay for Performance
A. IntroductionBy the end of the 1990s, an education accountability movement in the form of state standards and assessments, school report cards, and an emphasis onincreased teacher effectiveness was in full swing nationally and in Colorado.While many of the reforms aimed at improving student achievement wereshowing uneven results, there were compelling data demonstrating that “differ-ences in teacher effectiveness were a dominant factor affecting student gain.”1
Secondly, findings from other teacher effect studies identified teachers withstrong verbal and math skills and deep content knowledge as having signifi-cantly positive effects on student achievement.As one study concludes, even if the findings are not sufficient to explain effective teaching fully, these twotraits alone form a sufficient basis upon which to take action until furtherresearch advances a fuller explanation of teacher effectiveness.2
In Colorado, discussions at an August 1998 retreat of the Denver PublicSchools Board of Education culminated in a paper wherein a cornerstone of theBoard’s vision was to “change the way teachers are paid.”With the intention oflinking teacher compensation to student achievement, the Board of Educationestablished criteria for a plan that would be “fair, competitive and attractive toemployees.” Board members wanted, among other things, to eliminate automaticraises, link them to the achievement of specified goals, and create a compensationsystem that would lead to a focus on student achievement without teachers feelingcompetitive with one another. Board members also wanted to measure achieve-ment in terms of individual student growth, or the value added by individualteachers.These interests became the basis of discussion and negotiation with theDenver Classroom Teachers Association. By the fall of 1999, the Denver PublicSchools and the Association had committed contractually to a greater emphasison results for students and teachers.They collaboratively sponsored a pilot designedto link teacher compensation and student achievement: Pay for Performance.
IIC H A P T E R

19Pay for Performance
At the outset, the pilot was a momentousmeeting of the minds between labor and manage-ment in a large urban school district on mattersdear to the hearts of both parties. Both wereinterested in improved student achievement andprofessional performance.The Board of Educationdesignated the pilot as one of the district’s highestpriorities; it was also one of the highest prioritiesof the Association.They both committed to thesuccessful implementation of the pilot.
The agreement between the two parties alsoestablished new structures to advance the imple-mentation of the pilot and develop a new com-pensation plan: (1) the Design Team, comprised of two Association appointees and two districtappointees, which set to work immediately ondesigning and implementing the pilot; and later,(2) the Joint Task Force, comprised of appointeesfrom the Association, district and community,which began to create the architecture for a newcompensation system. Several other informalcommittees and partnerships from the district and the Association were essential to the successof the pilot. Ultimately, the interest and commit-ment of resources from private foundations helpedmake the full pilot and study possible.
Four years later, in the spring of 2003, as thepilot phase of Pay for Performance came to aclose for the district and its teachers, the account-ability environment in Denver, as in all districts inthe country, had greatly intensified.The ColoradoStudent Assessment Program (CSAP) together withthe No Child Left Behind Act (NCLB)—the2001 reauthorization of the Elementary andSecondary Education Act that guides most federaleducation spending—have absorbed and escalatedmany of the components of the school account-ability reforms of the previous decade, includingstandards-based education, highly qualified teach-ers for all students, research-based strategies, anda defined series of consequences for underper-forming states, districts, and schools.
An outcome of Pay for Performance in Denver may prove to be, among other contribu-tions, a serious consideration of how reform inteacher compensation systems can contribute tosystemic accountability for student achievement.
B. Genesis of the Pilot in DenverThere are many perspectives on how the Pay for Performance pilot emerged from contractnegotiations and what chances such a pilot hadfor success. Indeed, the definition of success variedamong key players even as the pilot was under-way. In the spring of 2000, one board membersuggested that success meant “a compensation system based on outcomes and the performance of teachers.” For another board member, successwas seen as “whether we get it ultimatelyadopted, whether there is enough success toimplement.” A central administrator describedsuccess as “getting into the schools:What’s theimpact on kids? On the teacher’s sense of pur-pose? On morale issues? On strategically andadministratively dealing with PFP as an asset?”A teacher leader responded that success would be:“Curriculum and Instruction, and Assessment[two different departments] aligned. If they werealigned, that would be a success.A good salaryschedule would be a success, but it is not whatcauses success. If student achievement goes up,then we are successful. If systems were put inplace to support the sites, that would also be a success.”
While the Board had designated teacher com-pensation and student performance as the corner-stone of its vision in 1998, the Association had acommittee that had been studying pay for perfor-mance since 1994. During negotiations,Associationleaders were not only aware of various systems ofperformance-based pay in Colorado and acrossthe country, but were also concerned about thepossibility that teachers might become the targetsof an administrative fiat. One teacher leader notedat the time:“Oregon has imposed PFP throughlegislation. If Colorado imposes it, we’ll be gladthat we tried it out on our own and that we havedata.” Getting involved meant getting a voice, asanother teacher leader reports:“[Teachers] wanteda voice . . . Now we have two members on theDesign Team who are the leaders and who helpteachers.We want to be a part of reform insteadof just being the object of it.”
With a program design that was the creationof negotiations and with so little lead time before

20 Catalyst for Change
implementation got underway, the Pay for Perfor-mance pilot nonetheless proved resilient duringthe fall start-up. Partly this was because participa-tion in the pilot was permissive, based on a facultyvote, and partly because teachers already hadexperience in setting annual objectives.Theywould get bonuses for “doing what they alreadydo” and, as a fall back at the end of the pilot, theycould vote for or against a permanent system thatinvolved pay for performance. Further,“relation-ships among teachers [were] cohesive,” accordingto a teacher leader.There was also a perceptionthat, via the Design Team, teachers were leadingthe implementation of the pilot.
Altogether teachers maintained a significantpiece of autonomy during the negotiations on thedesign of Pay for Performance.The leadership feelthis was achieved by (1) basing performance-basedcompensation on teacher-set objectives; (2) limit-ing the scale of the implementation to 12 schoolsinitially; (3) letting schools opt in; and (4) promot-ing the engagement of an independent outsideorganization to conduct the study.
The quick start-up did mean that many of thedetails of the design of PFP were worked out asthe pilot was being implemented. It also meantthat many of the central administrators and build-ing principals, major stakeholders in a teacher payfor performance system, were not initially exposedto the concept of the pilot in a systematic way,leading to some of the implementation difficultiesthat emerged along the way.
A teacher leader described the implementationof the pilot:“The needs of PFP are out ahead ofthe district....This has been like ‘skunk work’since we have to make up everything as we go.We also have had trouble getting into someoneelse’s backyard... [a central administrator] calledPFP a “virus” that gets into every department inthe district... all of which have their own agenda.The pilot is forcing speed in places where therehave been no timelines, so we have had to buildbridges and alliances [in order to get the needs of the pilot met].”
Since there were not a significant number ofsuccessful performance-based compensation mod-els to follow, and since the two major teacherunions have been wary of performance pay, manyof the sources of information and support that
underpin the work of reform were not availableto Denver participants.The pilot was breakingnew ground.
C. Merit Compensation inEducationThe idea of paying teachers according to theirperformance has a long history, yet actual attemptsto do so have not successfully competed with theprevalent single salary schedule.This schedule isbased on the accrual of teaching experience andthe acquisition of education units.The attempt topay teachers based on their performance or per-ceived performance has been traced back to 1710in England where the practice became a part ofthe British Revised Educational Code in 1862.However, in the 1890s, it was removed based onthe belief that it produced teaching to tests, rotelearning, and cheating.3 More recently, in the1980s, a variety of incentive plans were imple-mented by state and local school agencies in orderto improve the attractiveness and quality of careersin teaching, retain the best teachers and theoreti-cally improve teacher performance and effective-ness. In 1986, a review of incentive programsintended to motivate teachers, identified threetheories upon which such measures are based: (1)expectancy theory, that individuals will work for a valued reward, such as a bonus or promotion; (2)equity theory, that individuals will be dissatisfiedbased on feelings of unjust compensation for theirefforts and accomplishments; and (3) job enrich-ment theory, that challenge and variety lead togreater productivity.4 The first two theories sup-port merit pay and career ladders, while the thirdone suggests that opportunities for new and differ-ent work should be structured into the workplace.
Even more recently, a study argues that it istime to break out of the single salary schedule andto change how teachers are paid.This positionargues that merit pay systems have not lastedbecause (1) teachers are uncomfortable with thesubjective judgments of administrators; (2) fundingstreams have not lasted; (3) merit pay conflictswith the collegiality that characterizes goodschools; and (4) the education community has not had viable models upon which to constructnew pay systems.5

21Pay for Performance
The lack of models may soon be addressed as more school districts and states enter into payfor performance experiments and as prominentorganizations promote initiatives that link teachercompensation to teacher effectiveness.“Investing in Teaching”—sponsored by the Business Round-table, the National Association of Manufacturers,the U. S. Chamber of Commerce and theNational Alliance of Business—has indicated support for a range of experiments with teachercompensation, including the Denver pilot.6
Further, while many teacher unions at the localand national level have opposed direct linkagesbetween compensation and student performance,some, including several districts represented in the Teacher Union Reform Network, have promoted union sponsorship of such initiatives.7
Additionally, many local unions, as in Denver,have worked with boards and district managers to develop customized approaches to promote and reward teacher effectiveness.
There are differences in the approaches to performance pay. Some are based on teacherdemonstration of skills and knowledge; others onthe performance of groups of teachers or schools;and some, like Denver’s Pay for Performance pilot,are based on the belief that student achievement is the bottom line and that part of compensationneeds to connect directly to student results.Despite the increased numbers of experimentsand the various approaches, there is yet to emerge a single approach that has demonstrated sustainedsuccess in supporting student learning in a largeschool district. Concomitantly, few comprehensivestudies of the results of performance-based com-pensation experiments have been undertaken.
D. Potential of PFP in an Era ofAccountabilityIn its final design, Pay for Performance focuses onteacher output—what students learn during theirtime with individual teachers. By emphasizing student growth, the design of the Denver pilotovercomes several of the objections raised aboutperformance-based compensation.The designaddresses these objections in the following manner:
• The teacher sets the objectives, either indi-vidually or with a group of colleagues, and
with the approval of the building principal.At the end of the year, he or she providesevidence of attainment to that principal forvalidation. In this manner, the judgment of the administrator tends to be objective,based on student achievement data providedby the teacher.
• The teacher measures growth from wherethe student starts at the beginning of theyear and then sets the growth target. Conse-quently, there is less likelihood that studentfactors (e.g., socioeconomic status, etc.) willaffect the teacher’s ability to earn a bonus or additional compensation.
• The teacher selects the measures, therebydecreasing the potential of teachers teachingto one monolithic test.
• The implementation of Pay for Perfor-mance has apparently contributed to colle-giality rather than increasing competition.For example, the Spring 2001 survey find-ings indicated that 23.0% of pilot schoolteachers and principals believed that coop-eration among teachers had increased;66.7% indicated that it had stayed the same;and 10.3% indicated that it had declined.On the same survey, 9.4% of teachers andbuilding principals indicated that competi-tion among teachers had increased; 83.1%indicated that it had stayed the same; and7.5% reported that it had declined. InSpring 2002, 39.8% reported that coopera-tion among teachers had improved; 51.3%that cooperation had stayed the same; and8% that it had declined. In Spring 2003,53.4% of respondents reported that PFP had had a positive impact on cooperationamong teachers; 44.5% no impact; and 2.1% a negative impact.
Figure 2-1 compares several of the longstandingconcerns about performance-based compensationto the Denver pilot.
The realities of pilot implementation of PFP have brought up legitimate issues of credi-bility and fairness among teachers, administrators,pilot leaders, and researchers that are discussed inthis report.There remains a belief among pilotleaders and many pilot teachers that continued

refinements in the design of and support for Payfor Performance can address such issues.As dis-cussed in Chapter VII, teachers have regularlybeen making recommendations for improvementsin the design.A pilot teacher indicates,“We needuniform procedures for objectives.The timeline didn’t make sense.We started the school year in mid-August, goals written by mid-October,reviewed by November or December. It shouldhave been done earlier in the year. I didn’t get the‘OK’ on my objectives until December.”Anotherpilot teacher says,“The one thing that bothers me about PFP is that the objectives [for] non-academic teachers (music, PE, library, etc.) do notcompare to what regular classroom teachers aredoing. It’s not equitable.”Another pilot teacherstates,“We have to find a way to distinguishbetween school politics and the pecking order
in schools and actual teacher performance. Rightnow those are meshed together. Right now theleadership has too much decision-making powerand that causes anxiety.”
As Pay for Performance moves to another iteration in Denver, issues of credibility and fair-ness—identified during the implementation of the pilot—will continue to provide a basis forneeded improvements. However, the fundamentaldesign—examining progress based on the attain-ment of teacher-set objectives—will likely have staying power.
E. The Bargaining Agreement
Initial TermsAppendix E of the Bargaining Agreementbetween the Board and the Association containsthe terms of Pay for Performance. Key features of the agreement include:
• Setting a two-year term for the pilot.
• Commissioning the Design Team, comprisedof two teachers selected by the AssociationPresident and two administrators selected bythe Superintendent, and releasing all fourmembers from their present duties.
• Charging the Design Team with designing,overseeing, implementing, and evaluating thepilot, including the authorization to seek anoutside evaluator.
• Defining the terms for participation in thepilot (initially 12 elementary and three middleschools), where 85% of the faculty had votedto participate.
• Establishing the financial terms whichincluded: (1) maintenance of the salary sched-ule; (2) in year one a $500 stipend for partici-pation and $500 bonus for each objectiveobtained; and (3) in year two a $750 bonus for each objective met.
• Setting up three approaches that teachers inparticipating schools would use to measureprogress: (1) the Iowa Test of Basic Skills, anationally normed test; (2) teacher-developedcriterion-referenced tests or other teacher-
22 Catalyst for Change
FIG. 2-1
Areas of Concern About Performance-Based Pay
Objections/Issues/Concerns Pay for Performance in Denver
1. Subjectivity of the Teacher develops and administrator brings evidence of
attainment to the administrator who hasalready collaborated in the development of the objectives
2. Differences in student Student growth is background measured in annual terms
3. Teaching to the test Teachers select their ownmeasures so, if they areteaching to the test, it is notone monolithic test
4. Increased teacher 53% report a positive competitiveness impact on cooperation;
44% no impact; and 2%a negative impact
5. Unstable funding streams The Joint Task Force onTeacher Compensationbegan to address this issue
6. Lack of reliable and Measures used by PFP valid measures of student too open-ended to be achievement for teacher use tested in the study

developed measures; or (3) increases in teacherknowledge and skill.
• Establishing dates for the Design Team toreport to the Board and the Association.
Revised TermsThe agreement between the two parties allowedfor mid-course corrections and revisions to thepilot. Most of the substantive modifications to thedesign of the pilot occurred during the first yearand were the result of efforts to make a greaterlevel of science possible in the study. Based onconcerns presented by the Design Team andCTAC, and with the collaborative support of theBoard of Education, the Association and externalparties, several revisions to Appendix E at the policy and operational levels were worked out inJanuary 2000.These are detailed in the mid-pointreport, Pathway to Results. They included:
• Extending the pilot to a period of four yearsin order to establish a baseline year and to pro-vide more than two years of student achieve-ment data for a more accurate identification of student achievement trends.
• Establishing new reporting dates and products,including a mid-point report and a final reportto be provided by CTAC.
• Defining the baseline year for study purposesas 1999-2000.
• Changing the threshold for faculty votes toparticipate from 85% to 67%.
• Establishing the need for a group of controlschools.
In June of 2000, two additional challengeswere addressed through another collaboration of the key parties: (1) the need for a writtenstatement of purpose to provide direction andclarity to the pilot; and (2) the need for a vehicleto directly address the development of a newcompensation system.
The formal Statement of Purpose follows:
The mission of the Denver Public Schools (DPS) is to graduate students who are literate and whopossess the thinking skills and personal characteris-tics needed for a successful transition to the post-high
school experience. Our teachers offer the key link to ensuring that each child reaches their fullestpotential.The value placed on the teaching corps isreflected in the financial commitment the district hasmade to teachers’ salaries, which is the single largestitem in the budget.To establish a structure of salaryadvancement that recognizes the efforts of teachers in a child’s academic success, the Board of Educationand the Denver Classroom Teachers Association(DCTA) have initiated a Pay for Performance pilot.The pilot has been designed to identify an appropri-ate method of measuring a teacher’s effectiveness inthe classroom.
The Pay for Performance pilot is a learningendeavor in which DPS and DCTA will jointlydevelop a compensation system based in part on student achievement.To do so, DPS and DCTAhave established a Design Team to oversee the pilotand to develop a method for teachers and principalsto set academic achievement objectives.The DPSand DCTA will establish a joint task force todesign and recommend the salary structure that will support this system.
In the fall of 2003, the Design Team will drawtogether the results of the pilot and the work of thejoint task force.The pilot will be evaluated by a thirdparty, the Community Training and Assistance Center,and results of the pilot will be presented to the Boardof Education and the members of the Association.
In a separate Memorandum of Understanding,the Joint Task Force on Teacher Salary was laterestablished with the charge to “develop and ana-lyze a model salary system for appropriate teacherpay for performance in the Denver Public Schools.”This group is comprised of representatives of theAssociation, administration, and the community at large.
Although numerous corrections occurred after the presentation of the mid-point report,which is discussed later, most revisions to the basicstructure of the pilot occurred within the firsttwo years and with the consent of all parties.Undertaking revisions such as the ones outlinedabove showed the commitment of the sponsors to the concept of pay for performance.They were prepared to make corrections to strengthen theimplementation and the study of the pilot.
23Pay for Performance

F. The Role of CommunityTraining and Assistance CenterIn November of 1999, CTAC was selected to fill a dual role with regard to Pay for Performance.First, it provided technical assistance to assure pilot quality and integrity. Second, it conducted the study of the impact of the pilot.
In meeting Denver’s expectations, CTACbecame a participant-observer developing a casestudy of the implementation of Pay for Perfor-mance. Specific recommendations or technicalassistance have the potential of introducing biasinto a study.While this potential cannot be elimi-nated, CTAC has taken the steps identified asappropriate for this form of research.8 First, thestudy draws on multiple sources and has clearlyidentified those sources in describing what hastaken place and in drawing conclusions. Second,the two reports have described this relationship to pilot participants and readers.Third, the studyidentifies the sources of and routes to conclusions.The quantitative data (student achievement dataand survey results) are a matter of record; thequalitative data (interviews, focus groups, observa-tions, and artifact analyses) have been collectedand analyzed in written format and, for reasons of participant confidentiality, are less accessible.
The involvement of CTAC staff has alsoincluded: (1) observation of district activities andregular pilot leadership meetings; (2) assistance toDenver assessment, planning and data professionalsin the maintenance of student and teacher data-bases; and (3) reports of annual collections of data(without interpretation) to the Design Team,Board of Education, the Association, superinten-dent, funders, and other interested stakeholders fortheir use in determining the status of the pilot.
The identification of issues and subsequentrecommendations are matters of interpretationand should be seen in light of CTAC’s completerole. However, these findings and recommenda-tions have been formally submitted to the superintendent, pilot leaders and sponsors in management letters, as well as presented in themid-point and final reports.The superintendent,pilot leadership and sponsors determined the level and quality of response to the findings andrecommendations. CTAC played no role in the
initial design or structure of the pilot, nor in anyof the related negotiations, but it has been a closeobserver of subsequent activity.
Denver leadership wanted to know not justwhat happened, but also why and what needed to be considered next. Responding required a certain level and form of involvement. Context is critically important both in interpreting out-comes and in determining next steps.Therefore,CTAC’s active involvement in the pilot imple-mentation was both a requirement and a strengthof this study.
G. Summary As this chapter shows, the Pay for Performancepilot in Denver has benefited from the spirit ofcollaboration and innovation demonstrated by theDenver Public Schools Board of Education andthe Denver Classroom Teachers Association. Byestablishing a pilot where the potential growth ofstudent achievement and teacher professionalismcould be explored and by removing the conceptof pay for performance from the level of ideologi-cal discourse to a more scientific discourse, thedistrict has created a pilot and study of merit.Theimpact of pay for performance and its potentialfor increasing student achievement and teacherprofessionalism will be better understood not onlyby Denver, but by others who are interested inthis type of reform.
Of all of the current experiments in teacheraccountability, compensating teachers based, inpart, on student performance is among the mostcontroversial. Based on failed attempts of the past,and legitimate concerns of teachers about thebasis of their compensation, the concept enjoysboth strong support and strong resistance in theeducation community. Pay for Performance inDenver, as shown in this chapter, addresses severalof the criticisms of this type of approach. It alsoreveals issues and challenges that still need to beaddressed.As a method of reform, support andaccountability, Pay for Performance cannot bedescribed as an effort to “tinker around theedges.” It goes to the heart of a school district’ssystems in order to make serious reforms andaccountability a way of life in a large district.
24 Catalyst for Change

Research Design
A. IntroductionThe primary purpose of this study is to examine the impact of the Pay for Performance pilot.As noted in the district’s formal Statement of Purpose:“The Pay for Performance pilot is a learning endeavor in which DPS and DCTA willjointly develop a compensation system based in part on student achievement.”1
A central question is whether growth on measures of student achievement canbe linked to teacher performance in the Pay for Performance pilot. For this reason, the study focuses on changes in student achievement within the pilotschools and between pilot and control schools, as well as student growth associ-ated with teacher objectives.Additionally, the study examines the nature andinfluence of teacher objective setting in detail; the impact of school, teacher,and student factors; and the differential impact of the pilot implementation on school and district-wide practices as perceived by teachers, administrators,and parents. Finally, the study examines the institutional factors that haveaffected implementation.The study is not an evaluation of the pilot. Rather, it is a much broader examination of the results of the pilot using both quantitativeand qualitative measures, addressing questions of immediate impact and issues of policy making appropriate to Denver.
This chapter discusses the research design of the study, including researchquestions, methods of data collection, and methodological choices and rationales,along with dilemmas that arose in the use of district data.
B. Research DesignIn order to answer the questions raised by the pilot, a mixed-method design was used, combining the results of quantitative data (e.g., student achievementdata from the Iowa Test of Basic Skills (ITBS) and the Colorado Student Assessment Program (CSAP) and perceptual data from survey questionnaires) and qualitativedata (i.e., interviews, focus groups, artifacts, and observations) collected in allfour years of the pilot.The use of more than one method to study the same
IIIC H A P T E R

phenomenon, called triangulation, strengthens thevalidity of the results.
Another advantage of the mixed-methodapproach is that it may lead researchers to modifyor expand the design and/or data collectionmethods.This action may occur when inconsis-tencies and discrepancies have been uncovered.For example, some interview and survey dataindicated that teachers were not changing theirteaching practices, but still other findings, such as the increased quality of objectives and theincreased focus on student achievement, suggestedthat teachers were doing something differently.Tofurther investigate anecdotal evidence of changesin behavior, a deeper qualitative study, includingfocus groups and classroom observations, wasimplemented.This study and other such responsesto unexpected events are described in detail in thechapters that follow.
Research QuestionsBuilding on the pilot infrastructure established bythe Denver Public Schools, the Denver ClassroomTeachers Association and the Design Team, theresearch study was designed to address four over-arching research questions:
1.What is the impact of Pay for Performance on student achievement?Providing additional compensation based on student performance is what most distinguishesPay for Performance in Denver from effortsattempted in other school districts in the UnitedStates and abroad.The study examines: (a) thechanges in student achievement which haveoccurred at the pilot schools, and (b) how thesechanges in achievement at the pilot schools com-pare to those in control schools.The analyses ofstudent achievement data also incorporate student,school, or teacher factors.
2.What is the impact of the teacher-developedobjectives?At the pilot school level, the objectives set by indi-vidual teachers were the centerpiece of Pay forPerformance.Teachers received additional com-pensation only when they met their objectives.The study examines the relationship betweenteachers’ meeting their objectives based on their
own assessments and actual increases in studentachievement based on independent measures. Fur-ther, the study explores the substance of the objec-tives—as based on a four-trait rubric—in order todetermine whether the quality of objectives can beassociated with increases in student achievement.
Other questions are also addressed. For exam-ple, how have objectives changed since the pilotbegan? How do student achievement results com-pare to teacher objective ratings? How has theobjective setting process impacted teacher practice?How has the objective setting process worked forspecial subject teachers (e.g., art, music, physicaleducation), special educators and specialists (e.g.,nurses, psychologists, speech and language special-ists)? What issues arose for various pilot partici-pants? What kinds of supports were received?
3.To what extent do school, teacher and student factors impact and/or explain student achievement? The implementation of Pay for Performanceoccurred within a functioning school systemwhere other site level factors, beyond teachercompensation, may have influenced studentachievement.The study attempted to identify tothe greatest degree possible those site level factorsthat contribute to, and may prove to enhance orimpede, the achievement of students or the effec-tiveness of the pilot.
There are significant differences among thestudent populations at pilot and control schools aswell as teacher factors, such as years of experience.Are there differences in student or teacher demo-graphics that explain student achievement? Arethere differences in the achievement history ofpilot and control schools? How do we control forthese variables in assessing the impact of the piloton student achievement?
4.What broader institutional factors have influ-enced the implementation of the pilot, and how have these factors affected pilot results?The pilot exists within a broader institutionalcontext, a large, urban school district, that mustrespond to challenges from both within and with-out and over a four-year period. Pay for Perfor-mance, as an initiative with significant systemicimplications, was limited by the ability of the
27Research Design

district to implement a major new initiative.Thestudy analyzes the institutional factors that havehad the most marked impact on the pilot.Thestudy examines policy and operational decisions,support structures and assignments, mid-coursecorrections and related interventions, the percep-tions of different constituencies, and the lessonsthat have emerged during the implementation of the pilot.
What institutional factors influenced the imple-mentation and outcomes of the pilot? What sys-temic barriers confronted the implementation ofthe pilot? What factors outside of the district, suchas state and national initiatives, affected the pilot?
Selection of Pilot SchoolsIn the fall of 1999, the Design Team held sectormeetings and more than a dozen school visits topromote participation in the Pay for Performancepilot. Elementary and middle schools voted todetermine if their schools would participate.Theoriginal DPS/DCTA Agreement required 85% of the faculty to vote in favor of participation inorder for a school to be included in the pilot.Thetwelve elementary schools that met this thresholdcomprised the original pilot schools.The thresh-old was later lowered to 67% and additional elections were held.
In June 2000 or beginning in the 2000-2001school year, Horace Mann Middle School becamethe first secondary school to join the pilot.Theoriginal 12 schools were given the opportunity towithdraw from the pilot in December 2000.Atthat time, Smith Renaissance Elementary Schoolchose to withdraw. In the third year of the pilot,another elementary school (Philips), another mid-dle school (Lake) and two high schools (Manualand Thomas Jefferson) joined the pilot. Figure 3-1shows the participation of schools by year andexplains the fact that analyses and discussions mayrefer to different numbers of schools in differentyears of the study.
In the 2002-2003 school year, Manual HighSchool officially split into three smaller schools:Arts & Culture, Millennium Quest, and Leader-ship Academy. For analytical purposes, the threeschools were treated as a single entity throughoutthe study.An analysis of the new school popula-tions shows that students selected or were selected
into the new small schools such that ability groupsare concentrated rather than diffused throughouteach of the three smaller schools. Nonetheless, it isnot possible to assess the impact of the pilot accu-rately at Manual High School independent of thechange in school structure. For this reason,achievement results are presented separately forManual and Thomas Jefferson High Schools.
Selection of Control Schools and Related IssuesThe study design included comparison schools to control for (1) the effects of contemporary his-tory, and the effects of selection-maturation inter-action. In the first case, the inclusion of controlgroups limits the possibility that contemporaneousevents account for the change observed achieve-ment in the pilot schools since both groups haveexperienced the particular event (e.g., the tragedyof September 11). In the latter case, the use of control groups limits the likelihood that anunmeasured factor not reflected in the pre-test,but operating to contaminate the post-test data(e.g., changes in the administration and impor-tance of CSAP over the life of the pilot).
In the original pilot proposal in January 2000,CTAC requested control elementary schools to beused as a non-treatment comparison group.Threeschools were to be selected for each pilot elemen-tary school. In January 2001, the district identifiedthe elementary control schools in the followingmanner: the schools were chosen to “match” eachpilot school based on three criteria: (1) the percentof free/reduced lunch students; (2) the percent of English language learners; and (3) school size/enrollment (where possible). District assessmentstaff determined that the first two criteria were the most important and the third wasmatched where possible. In the case of one school,Smith, although the district included Smith as acontrol, CTAC included only the baseline and theone year in which Smith participated in the pilotand did not use Smith as a control school becausethere may have been lingering effects from thepilot.) The district determined that all middle andhigh schools were to serve as control schools at the secondary level.The schools designated by thedistrict are listed in Figure 3-2. The Career Educa-tion Center was not used in the study as a control
28 Catalyst for Change
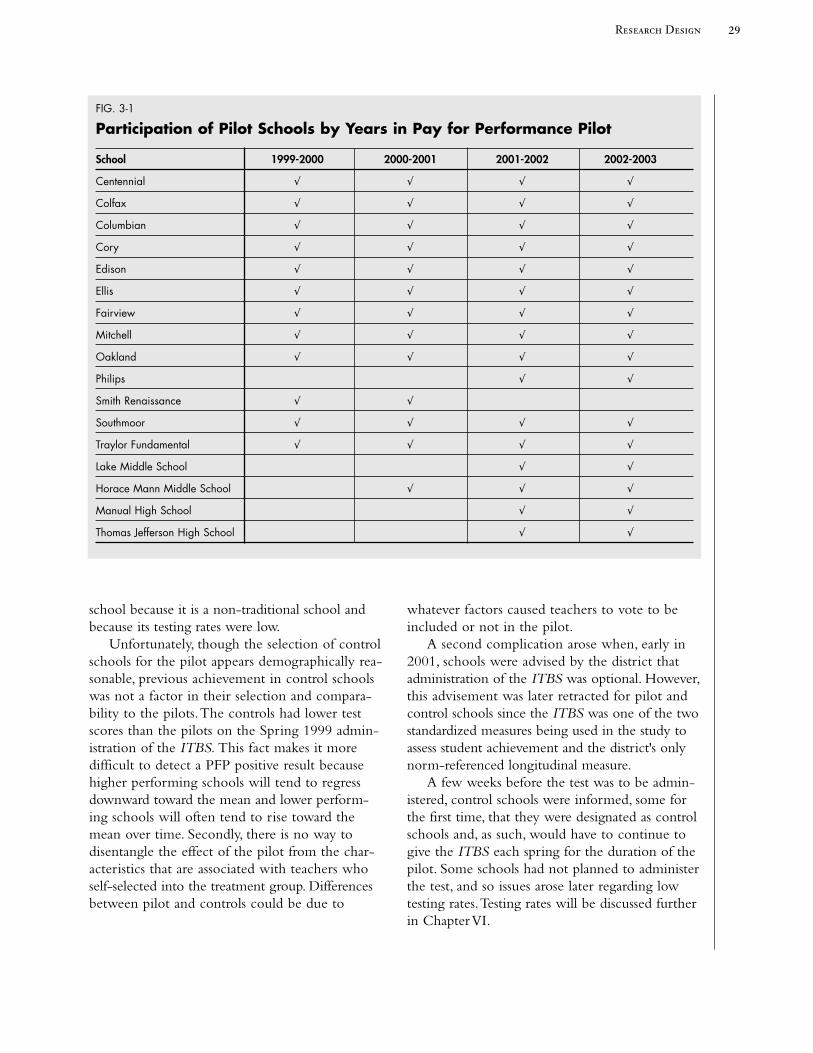
school because it is a non-traditional school andbecause its testing rates were low.
Unfortunately, though the selection of controlschools for the pilot appears demographically rea-sonable, previous achievement in control schoolswas not a factor in their selection and compara-bility to the pilots.The controls had lower testscores than the pilots on the Spring 1999 admin-istration of the ITBS. This fact makes it more difficult to detect a PFP positive result becausehigher performing schools will tend to regressdownward toward the mean and lower perform-ing schools will often tend to rise toward themean over time. Secondly, there is no way to disentangle the effect of the pilot from the char-acteristics that are associated with teachers whoself-selected into the treatment group. Differencesbetween pilot and controls could be due to
whatever factors caused teachers to vote to beincluded or not in the pilot.
A second complication arose when, early in2001, schools were advised by the district thatadministration of the ITBS was optional. However,this advisement was later retracted for pilot andcontrol schools since the ITBS was one of the twostandardized measures being used in the study toassess student achievement and the district's onlynorm-referenced longitudinal measure.
A few weeks before the test was to be admin-istered, control schools were informed, some forthe first time, that they were designated as controlschools and, as such, would have to continue togive the ITBS each spring for the duration of thepilot. Some schools had not planned to administerthe test, and so issues arose later regarding lowtesting rates.Testing rates will be discussed furtherin Chapter VI.
29Research Design
FIG. 3-1
Participation of Pilot Schools by Years in Pay for Performance Pilot
School 1999-2000 2000-2001 2001-2002 2002-2003
Centennial √ √ √ √
Colfax √ √ √ √
Columbian √ √ √ √
Cory √ √ √ √
Edison √ √ √ √
Ellis √ √ √ √
Fairview √ √ √ √
Mitchell √ √ √ √
Oakland √ √ √ √
Philips √ √
Smith Renaissance √ √
Southmoor √ √ √ √
Traylor Fundamental √ √ √ √
Lake Middle School √ √
Horace Mann Middle School √ √ √
Manual High School √ √
Thomas Jefferson High School √ √

Mid-point Changes to the Design ofthe PilotAt the end of the first year, a review ofthe original design was conducted to gaindirection for the Pay for Performancepilot as it was developing and to answersuch questions as:Which of the activitiesor strategies are aiding the participants to move toward the goals of the pilot?What barriers have been encountered and what needs to occur in order toovercome these barriers? Some changeswere identified as early as June 2000:
• Extending the pilot to a period offour years.
• Defining the baseline year for studypurposes.
• Changing the threshold for facultyvotes to participate from the initial of 85% to 67%.
• Establishing the need for a group ofcontrol schools for study purposes.
In December 2001, the mid-pointreport was presented to the Denver educa-tional community. It defined the impact of the pilot at the halfway mark and delineated changes needed to increase theeffectiveness of the pilot and barriers yet tobe addressed. Changes in the pilot designand implementation that resulted from therecommendations made at the time of theearlier report include the following (whichare described in more detail in the comingchapters of this report):
• Developing learning content explicitly in the objectives.
• Addressing the fairness related to special subject teachers, special education teachers,and specialists.
• Providing teachers with more support inobjective setting.
• Integrating the three approaches that wereoriginally part of the pilot design.
Another critical change occurred in June 2002when the supervision and reporting of the DesignTeam and the pilot was transferred to the district’schief academic officer.While this change gave the Design Team and the pilot a more mainstreamrelationship within the district and moved it intothe center of the instructional program, it alsocreated some confusion between the pilot andnewer instituted initiatives such as the district’snew literacy initiative.
30 Catalyst for Change
FIG. 3-2
Elementary, Middle and High School Controls
Elementary School Controls
Amesse Goldrick Remington
Asbury Greenlee Rosedale
Ashley Gust Samuels
Bromwell Holm Schmitt
Cheltenham Kaiser Slavens
Doull Lincoln Steck
Ebert Maxwell Steele
Fallis McGlone Teller
Force McMeen University Park
Garden Place Montclair Valverde
Gilpin Moore Whittier
Godsman Newlon
Middle School Controls
Baker Hamilton Merrill
Career Education Center Henry Morey
Cole Hill Place
Denver Schools of the Arts Kepner Rishel
Gove Kunsmiller Skinner
Grant Martin Luther King Smiley
High School Controls
Abraham Lincoln George Washington North
Career Education Center John F. Kennedy South
Denver School of the Arts Montbello West
East

Dilemmas and Caveats Interpretation of the quantitative results is limitedby a number of the study’s design and implemen-tation features.Though some of these wereamenable to mid-course corrections, others werenot. Entry into the pilot was by self-selection, byvote of the teachers in each school.This methodof selecting pilot schools ensured greater teachercooperation, but also limited the applicability ofthe pilot findings to other settings. In a settingwhere teachers are not given the choice to participate, the outcomes could be quite different.Self-selection also leaves the possibility that anunmeasured or ‘latent’ characteristic of the pilotschools both led the schools to select into thestudy and caused any differences in studentachievement noted between pilots and controls.
The use of the Online Assessment ScoreInformation System (OASIS) and the Web-BasedObjective Setting software by non-pilot schoolsfor the purpose of writing objectives. Effectively,several control schools used PFP protocols andprocesses or modified forms of them, complicat-ing the pilot-control relationship for the purposesof the study.
Testing rates (the number of students assessedannually) were not well monitored within the district, leading to lower than desirable numbersof students tested in some schools and years. Forthese reasons, the student achievement results ofthe pilot must be interpreted with caution.
C. Impact of Pay for Performanceon Student Achievement
Selection of AssessmentsThe central questions with regard to studentachievement are how achievement has changed at the pilot schools, how achievement at pilotschools differs from control schools, and whatimpact other pilot factors, such as quality ofobjectives, have had on achievement.
In September 2000 the Design Team, in conjunction with the Assessment and TestingDepartment created an Assessment Matrix whichidentified 13 district-approved assessments for use in the different elementary grades, including the Iowa Test of Basic Skills (ITBS), parts of the
Colorado Student Assessment Program (CSAP), andthe 6+1 Trait Writing Sample (Six-Trait). Measuresfor younger children were encompassed withinthe Colorado Basic Literacy Act (CBLA) and TitleOne/Grade Level Math2. Because all pilot schoolteachers are involved, including classroom teach-ers, special subject teachers (e.g., physical educa-tion, gifted/talented, music, art), special educationteachers, and support services providers (e.g.,psychologists, nurses, social workers, speech andlanguage specialists), many different measures haveactually been utilized in teachers’ objectives. In aJune 2000 report, the Design Team indicated that116 different assessments were used by at least one teacher.
With the integration of the approaches and the inclusion of middle and high schools in thepilot, the number of different assessments grewsubstantially with a great many teachers creatingtheir own tests.The assessments listed by teachersin measuring their objectives fall, for the most part,into three general categories: (1) assessments namedin the district assessment matrix and unit testswhich accompany text books; (2) assessments in amuch looser sense such as attendance log, vocabu-lary list, formal lab reports, research paper or bodychart word list; and (3) teacher-made or unspecifiedmeasures (e.g., pre- and post-tests, teacher’s rubric,informal tally, oral and written tests).
In 2002-2003, a total of 1,260 objectives werereviewed by CTAC. Of these, 166 different“assessments” fell into the first two categories.Atotal of 471 assessments listed fell into the thirdcategory or 38% of the total objectives.A furtherbreakdown indicated that of the 630 teacherswriting objectives, 256 used some form of“teacher-made test” at least once (41%), while 146 teachers listed “teacher-made test” in bothobjectives (23%).
The level of effort necessary to analyze theentire set of assessments is beyond the scope ofthe present study. It is the task of the teacher andthe principal in determining if the teacher did ordid not meet their objectives. For the purposes of this study, three assessments were originallydesignated for analysis; namely, the ITBS, theCSAP and Six-Trait. At the beginning of the thirdyear of the pilot, the district dropped Six-Traitfrom the district lexicon. It has been deleted from
31Research Design

the assessments analyzed in the study, although itwas discussed in the mid-point report and manyteachers (10.5% of the 630 teachers in 2002-2003) continue to use it in their objectives.
It is important to note, with regard to assess-ment, that because the goal is to measure teacherimpact on a classroom or group of children, mostmeasures used in objective setting are predicatedon student growth rather than comparisons ofachievement across groups of students. Initially the state’s assessment, CSAP, which was designedfor other purposes and which did not provide amechanism for pre- and post-testing of an indi-vidual child, was less appropriate for objective setting and did not lend itself to the type of analyses one would prefer to use in a comprehen-sive study such as this one.
At the time of the mid-point report, the Col-orado Department of Education indicated that inthe future, it would be possible to examine readingscores from year to year through vertical scaling.However, when that report was prepared, CSAPcould only be used for grade level comparisons andnot to assess change at the individual student level.Significant changes have occurred in this assess-ment and will be described later in this chapter.
Description of Assessments
Iowa Test of Basic Skills (ITBS)The ITBS, developed by the Riverside PublishingCompany (1993), is a norm-referenced achieve-ment battery composed of tests in several subjectareas.The district administers and scores thesetests. In the development process, as described byRiverside, all the tests were administered underuniform conditions to a representative sample of students from the nation’s public and privateschools at each grade level.This process producedthe test’s battery scores, scale scores and norms.In Denver, different grades were required to takedifferent subtests from year to year, preventingcomparisons of some grades and tests from oneyear to the next.
In the 2000-2001 school year, DPS decided touse the ITBS as the overall measure to compareacademic achievement in the Pay for Performancepilot. First, it can be used to measure studentgrowth; that is, a student’s score in third grade can
be compared to their score in fourth grade andthat comparison can be used to draw inferencesabout how much he/she learned.Second, the district had extensive longitudinaldata from these tests that allowed for trends to be examined from before the pilot began.Third,the tests are a more comprehensive battery.At the beginning of the pilot, the district’s testingprogram required that “all students in grades 1, 3,4, 6, and 7 must take, at a minimum, the Readingsection . . .” and “students in grades 2, 5, 8, and 11must take all the subtests” each spring.3
As discussed, schools were advised in Spring2001 that the spring administration of the ITBSwas optional. After discussions with the Board,central administration and the Design Team, it wasclear that in order to complete the research study,it was imperative that pilot and control schoolscontinue to administer these tests until the end of the pilot.These designated schools were advisedby the district that they would need to continueadministering these tests until Spring 2003.Thiswas met with consternation by some principals,and while some schools did continue to administerto almost all students, others appear to haveadministered on a more selective basis.This factmay have created some unintended effects discussed further in Chapter VI.
It should also be noted that some students are excluded from taking the ITBS at the princi-pal’s discretion.This discretion is not based on a set of rules and may be exercised differently ateach school.Also, in setting their objectives, teach-ers may exclude students who do not meet certaincriteria from their growth targets; for example,they may have entered a teacher’s classroom midyear, or have been chronically absent. Sincethese factors do not appear in the district database,they could not be considered in this analysis.
Colorado Student Assessment Program (CSAP)CSAP was developed for the State of Coloradoby CTB/McGraw-Hill and was first administeredin 1997.These tests are based on the ColoradoModel Content Standards and were originallyintended for accountability purposes across thestate.The Colorado Model Content Standardsrepresent the fundamental knowledge and skillsthat the State of Colorado expects students to
32 Catalyst for Change

possess at various intervals as they move throughtheir educational careers.According to the Col-orado Department of Education, CSAP tests consist of a mix of constructed response (25%)and multiple-choice items (75%). Item responsetheory methods were used for test analyses, scal-ing, equating, to form the items selection process,and to place both multiple-choice items and con-structed response items on the same scale.
When CSAP performance levels were estab-lished from 1997 to 2000, the Bookmarking Stan-dard Setting process was used for every grade leveland content area. Scale score cut-points were setthat defined four performance levels—Unsatisfac-tory, Partially Proficient, Proficient, and Advanced.
Use of the CSAP was problematic in the earlyyears of the pilot for three reasons. First, the testswere not useful for measuring student growthbecause they were not given in contiguous years;secondly, they have been phased-in in a staggeredfashion (see Figure 3-3) with one or two testsintroduced per year since 1997. Finally, the batteryof tests was not comprehensive because it did notoffer grade-by-grade data in two content areasfrom grades 2-11.
The CSAP environment changed significantlyafter the release of Senate Bill 00-186 whichrequires that the CSAP Reading tests be adminis-tered in contiguous grades and reported on onecommon, vertical score scale.An additional influ-ence on the nature and purpose of the CSAP wasthe introduction of the No Child Left Behind Act of 2001 (NCLB), which required that all studentsbe assessed longitudinally in reading and math ingrades 3-8 so that their progress can be measuredagainst state standards. Under the NCLB provi-sions, annual tests in reading and math must be in place by the 2005-2006 schools year; however,2002 is the base year for determining adequateyearly progress and efforts to make adequateyearly progress began immediately in Colorado.
The Colorado testing program was signifi-cantly changed as a result of these two events aswell as from requests from districts within thestate. In a letter dated April 24, 2001, districtswere advised by the Colorado Department ofEducation, Student Assessment Unit of the newscaling procedures and the expanded testingschedule to be implemented by the state depart-
ment.These new procedures included a verticalrescaling of all tests administered since 1997 acrossall grades and content areas.The schedule ofCSAP administrations during the life of the pilot is shown in Figure 3-3.
Quantitative Analysis Methodologies School achievement data is hierarchical in nature.Students are grouped by classroom, grade, andschool.At each level of the hierarchy, studentscores are correlated. In addition, each student’sscores are correlated over time.
Two-stage hierarchical linear modeling (HLM)makes it possible to account for the correlationwithin the school organizational structure. Becauseclassroom level data was not available for the base-line year, the student achievement analysis employsa two-stage model, grouping students withinschools.The two-stage HLM models allow eachschool to have a different intercept at baseline.
Individual growth modeling (IGM) extendsthe two-stage HLM model to take into accountthe correlation in student scores over time. IGMalso uses a two-stage design to account for corre-lation within schools. In addition, the IGM modelallows each student to have an intercept andslope: the intercept represents baseline achieve-ment level and the slope represents the student’srate of growth over time. Details on the specifica-tion of the achievement models are found inChapter VI.
D. Quality of ObjectivesIn the pilot schools, each teacher wrote twoobjectives.These were approved by the principaland formed the basis for evaluating classroomresults. Objective setting is seen as a central component, if not the foundation, of the pilot.
To gauge the rigor and overall quality of theobjectives, a four-point rubric was developedbased on the traits of learning content, complete-ness, cohesion, and expectations.The traits forquality educational objectives were derived from a review of teacher planning guides found in theERIC database, the district scope and sequence(which contains subject standards for grades K-12), and the elements listed on the form providedby the Design Team to teachers. Four levels ofperformance were established as a way to rate
33Research Design

individual objectives.The levels of performanceare as follows:
• Level 4—Excellent
• Level 3—Acceptable
• Level 2—Needs Improvement
• Level 1—Too Little to Evaluate
All objectives were read holistically and scoredby multiple readers. Figure 3-4 provides a break-down of the number of objectives read over thefour years of the pilot. In the first year of the pilotobjectives were not yet in an electronic formatand many of the objectives that were sent toCTAC for analysis and review were incomplete or duplicates.This resulted in the large number ofunrated objectives. In later years more completerating of objectives was possible due to the intro-duction of the Web-Based Objective Setting soft-ware created by the district.There were still alimited number of objectives that were duplicatesor incomplete.A complete discussion and analysis
of the rubric and the objectives are described indetail in Chapters IV and V.
Ultimately, the study used several sets of datato evaluate overall objectives quality: (1) rubriclevels for each teacher’s objectives over four years,1999-2003; (2) the summary of met/not metobjectives over four years, 1999-2003; (3) a comparison of objectives to the school plans in2000-2001 and 2002-2003; (4) a comparison ofpilot school objectives to control school goals,2000-2001 and 2002-2003; and (5) achievementdata on the ITBS and CSAP administered to allpilot schools for 1999-2003.
Objectives Met or Not Met Over the course of the pilot, more than 4,000objectives have been read and reviewed by multi-ple experts at CTAC.This review generally takesplace in March and includes all objectives deliv-ered by the Design Team.Two situations havecaused the numbers reported by the Design Teamand the numbers reported in the study to vary:
34 Catalyst for Change
FIG. 3-3
Schedule of CSAP Administrations by Content Area, Grade and Year
Grade
Content Area Year 3 4 5 6 7 8 9 10
Reading 99 √ √ √
00 √ √ √
01 √ √ √ √ √ √ √ √
02 √ √ √ √ √ √ √ √
03 √ √ √ √ √ √ √ √
Math 99 √
00 √
01 √ √ √
02 √ √ √
03 √ √ √
Writing 99 √ √
00 √ √
01 √ √ √
02 √ √ √ √ √ √ √ √
03 √ √ √ √ √ √ √ √

(1) teachers’ objectives were not submitted andapproved before March but were included in thedistrict’s report of met/not met objectives becausethey were approved before the end of the schoolyear; and (2) teachers who have had their objectivesread and reviewed left the district or moved to anon-pilot school and were not included in theend-of-year payout. Figure 3-5 presents the num-bers of objectives met and not met over the fouryears of the pilot as reported by the Design Team.
E. School,Teacher, and StudentFactors School, teacher, and student characteristics werecollected for use in the quantitative analyses.Theyare used in the models to control for differencesin school populations and characteristics betweenpilot and control schools.
School characteristics were collected from the
school report cards.The factors selected for theanalysis include number of years the principal hasbeen at the school, percent of students who areEnglish language learners, percent of studentsreceiving free or reduced-price lunch, percent ofstudents with a disability, percent of teachers whoare not fully licensed, and total enrollment.All ofthese factors were centered at the mean at theelementary level, the middle school level, and thehigh school level.This makes it possible to inter-pret the coefficients in the achievement modelsrelative to an average school.
Teacher characteristics were collected from the district human resource files. Chosen for the analysis were degree (bachelor’s, master’s, ordoctorate degree) and years of experience in theDenver schools.The study determined whichteachers were part of the Teacher-in-Residenceprogram and included this information as well.
35Research Design
FIG. 3-4
Objectives Read and Rated by School
School 1999-2000 2000-2001 2001-2002 2002-2003 Total
Centennial 70 76 76 76 298
Colfax 50 52 54 52 208
Columbian 46 32 38 44 160
Cory 54 50 50 56 210
Edison 58 64 64 60 246
Ellis 70 68 70 72 280
Fairview 54 62 56 62 234
Mitchell 66 60 72 74 272
Oakland 70 70 78 82 300
Philips 58 54 112
Smith 70 66 136
Southmoor 20 34 40 44 138
Traylor 56 60 64 62 242
Horace Mann Middle School 94 108 92 294
Lake Middle School 132 120 252
Manual High School 168 168 336
Thomas Jefferson High School 152 142 294
Total 684 788 1,280 1,260 4,012

Student characteristics were obtained from thestudent demographic files kept by the district.Included in the analysis are grade, race/ethnicity(Native American, Black,Asian, Hispanic or White),any disability, English proficiency, grade retention,gender, and socioeconomic status.The study categorized students as non-proficient in English,bilingual, or English-speaker-only based on acom-bination of home language and socioeconomic status codes which describe a student’s progress in learning English. SES is categorized as low (e.g.,ever received free or reduced lunch) or high (e.g.,never received free or reduced lunch). Studentcharacteristics were examined over time and missing data were filled in based on the student’scharacteristics in contiguous years.
F. Impact on Teachers and OtherStakeholders
Purpose and Types of Qualitative DataAs part of the overall mixed-method design of thestudy, qualitative and quantitative methodologieswere used to ascertain the impact of the Pay forPerformance pilot on pilot teachers and otherstakeholders. Surveys were sent to teachers, schooladministrators and parents. Individual interviewswith board members, association leaders, centraladministrators, external community members,parents and a random sample of teachers andprincipals were conducted each spring.
In the first two years of the pilot, surveys andinterviews were used to determine the level ofawareness of the pilot, its goals and expectations asviewed by teachers and others in the district andthe community. In the last two years of the pilot,these methods were used to explore perceptionsof the impact of the pilot on various aspects ofthe district, including student achievement, profes-sional development, the objective setting processand perceptions of a new compensation systembased in part on student achievement.
SurveysOver the course of the pilot, CTAC conductedsurveys each spring of pilot school teachers andstaff (2000-2003), control school teachers andstaff (2001-2003) and pilot and control schoolparents (2001-2003).All pilot school teachers and staff, who participated in the pilot by submit-ting objectives, as well as the principal, receivedconfidential surveys.
In the first year, the Design Team followed up with the schools to assure a strong responsesince this was to be a baseline for the study. In the case of the control schools, teachers and staffwere sampled randomly from files provided by the district’s Human Resource Department based on the size of the school (i.e., eight for smallschools; 13 for mid-sized schools; and 27 for largeschools). Surveys were also sent to the principalsat each of the control schools. Respondents were
36 Catalyst for Change
FIG. 3-5
Number and Percent of Objectives Met
Participants 1999-2000 2000-2001 2001-2002 2002-2003
12 Elementary Schools 629 Met342 Teachers/684 Objectives 92.0%
12 Elementary Schools 770 Met1 Middle School 91.4%421 Teachers/842 Objectives
12 Elementary Schools 1113 Met2 Middle Schools; 2 High Schools 87.6%635 Teachers/1270 Objectives
12 Elementary Schools 1288 Met2 Middle Schools; 2 High Schools 91.3%644 Teachers/1288 Objectives

directed to mail their completed surveys directlyto the scanning center in postage paid, pre-addressed envelopes.
Random samples of parents from both pilotand control schools were sent surveys in the lastthree years of the pilot. Because CTAC did nothave access to student names, the parent sampleswere drawn randomly using transformed studentidentification numbers which were then sent to thedistrict which mailed the questionnaires addressed“To the Parents of…”. English and Spanish ver-sions were sent.All surveys were confidential. Eachyear between 300 and 400 of the surveys werereturned by the post office as undeliverable. Figure3-6 presents a breakdown of the number of surveyssent and the number of usable surveys received forthe four years of the pilot.
In the first two years of the pilot, the focuswas mainly on the goals and expectations of thepilot as well as project support and projectimpact.This was the case with both the first yearof the pilot when only pilot teachers and admin-istrators were surveyed, and the second year whenpilot and control teachers and administratorswere surveyed. Parents, in the second year of thepilot, were asked similar questions. Beginningwith the third year of the pilot, survey questionsdealt with changes over the years of the pilot, andperceived impact of the pilot on changes in class-rooms, schools, the district, and the compensationof teachers. Parents were also asked to respond toquestions regarding the compensation of teachersand its relationship to student achievement.
Figure 3-7 provides a breakdown of therespondent groups across the four years of the surveys.
Individual and Group Interviews Over the four years of the pilot, more than 600individual interviews were conducted with pilotparticipants and other stakeholders.The range ofinterview subjects included members of the Boardof Education, Denver Classroom Teachers Associa-tion leaders, central administration, external community members and funders, Design Teammembers, other site staff, principals, teachers andparents. Figure 3-8 provides a detailed breakdownof the interviews conducted.
These interviews serve to explain and elabo-rate upon the results of the surveys, as well as tosuggest responses to many critical questions as tocontext, history, and perception. Interview proto-cols were developed for each major category ofinterviewee so that there would be consistencyacross interviewers.While the board members,association leadership, Design Team, centraladministration and external community membersand funders were identified by their role in thedistrict or the pilot, principals and teachers weredrawn randomly from the population of pilot andcontrol school principals and teachers. Parentswere identified by various sources over the yearsof the pilot, including the Community Relationsoffice, principals in pilot and control schools andparent-to-parent communications.
Objective-Focused InterviewsAt the mid-point of the pilot a positive correlationwas found between the quality of the teacher’sobjectives, as measured by the rubric, and studentgrowth on the ITBS and the CSAP.This finding,and information from interviews and surveys,
37Research Design
FIG. 3-6
Distribution of Surveys
1999-2000 2000-2001 2001-2002 2002-2003
Sent Recd Sent Recd Sent Recd Sent Recd
Pilot School Surveys 420 349 400 362 617 330 604 395
Control School Surveys 660 243 855 330 850 278
Parent Surveys 1,200 122 2,580 104 3,602 357
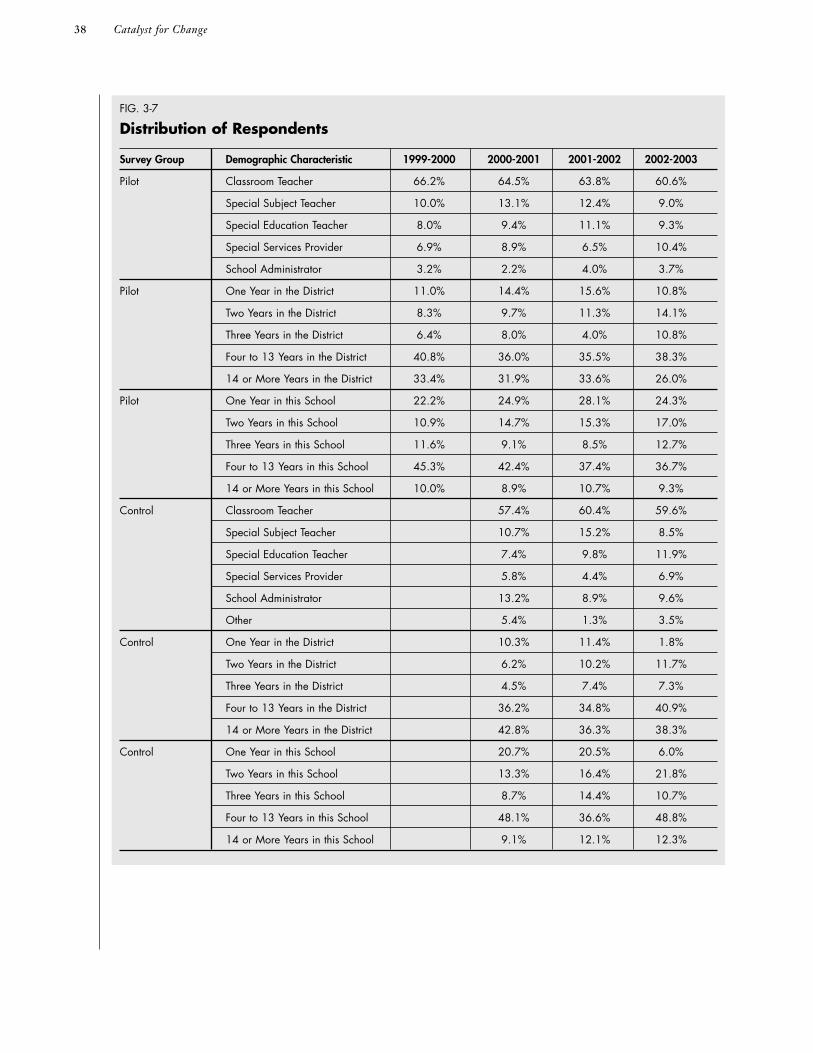
38 Catalyst for Change
FIG. 3-7
Distribution of Respondents
Survey Group Demographic Characteristic 1999-2000 2000-2001 2001-2002 2002-2003
Pilot Classroom Teacher 66.2% 64.5% 63.8% 60.6%
Special Subject Teacher 10.0% 13.1% 12.4% 9.0%
Special Education Teacher 8.0% 9.4% 11.1% 9.3%
Special Services Provider 6.9% 8.9% 6.5% 10.4%
School Administrator 3.2% 2.2% 4.0% 3.7%
Pilot One Year in the District 11.0% 14.4% 15.6% 10.8%
Two Years in the District 8.3% 9.7% 11.3% 14.1%
Three Years in the District 6.4% 8.0% 4.0% 10.8%
Four to 13 Years in the District 40.8% 36.0% 35.5% 38.3%
14 or More Years in the District 33.4% 31.9% 33.6% 26.0%
Pilot One Year in this School 22.2% 24.9% 28.1% 24.3%
Two Years in this School 10.9% 14.7% 15.3% 17.0%
Three Years in this School 11.6% 9.1% 8.5% 12.7%
Four to 13 Years in this School 45.3% 42.4% 37.4% 36.7%
14 or More Years in this School 10.0% 8.9% 10.7% 9.3%
Control Classroom Teacher 57.4% 60.4% 59.6%
Special Subject Teacher 10.7% 15.2% 8.5%
Special Education Teacher 7.4% 9.8% 11.9%
Special Services Provider 5.8% 4.4% 6.9%
School Administrator 13.2% 8.9% 9.6%
Other 5.4% 1.3% 3.5%
Control One Year in the District 10.3% 11.4% 1.8%
Two Years in the District 6.2% 10.2% 11.7%
Three Years in the District 4.5% 7.4% 7.3%
Four to 13 Years in the District 36.2% 34.8% 40.9%
14 or More Years in the District 42.8% 36.3% 38.3%
Control One Year in this School 20.7% 20.5% 6.0%
Two Years in this School 13.3% 16.4% 21.8%
Three Years in this School 8.7% 14.4% 10.7%
Four to 13 Years in this School 48.1% 36.6% 48.8%
14 or More Years in this School 9.1% 12.1% 12.3%

generated additional research questions around the process teachers used to develop objectives.
In order to address this issue, an objective-focused interview protocol was designed to ask a select number of teachers about the objectivesetting process. During the regular interviewschedule in Spring 2002, 12 out of 64 teachers in seven out of 16 pilot schools were asked todescribe their process for developing objectivesfor Pay for Performance.These teachers were asubset of the random sample of teachers whowere chosen for interviews.
The interviews were analyzed for commonthemes and ideas regarding the process of devel-oping objectives.While the number of teachersinterviewed and schools represented are too smallto generalize to the entire pilot population ofteachers, the interviews provided insight into the objective development process as perceivedand undertaken by 12 teachers, showing in particular, that teachers brought a range of think-ing styles and pedagogical beliefs to the process.These results are discussed in Chapter IV.
Qualitative StudyBased on the results of these objective-focusedinterviews and related findings from other inter-views and surveys conducted in Spring 2002,deeper qualitative studies similar to case studieswere conducted over a period of several monthsin the 2002-2003 school year. In trying to understand the relationships between setting an objective, meeting that objective, and improvingstudent achievement on independent measures,CTAC staff designed a multi-method study basedon the following proposition:
There is a positive relationship between the teacherobjectives under PFP and changes in instructionalpreparation and classroom practices that research hasshown to influence student achievement.
A sample was selected by first identifying a setof indicators representing three categories: teacherdemographics, student demographics and studentachievement on the CSAP:
• Teachers Demographics: Percent w/AdvanceDegrees, Less than 3 Years at the School, Lessthan 3 Years of Experience, More than 10 Years
Experience, Percent Hispanic Teachers, PercentWhite Teachers.
• Student Demographics: Percent ReceivingFree/Reduced Lunch, English LanguageLearners, Student Mobility, Black Students,Hispanic Students,White Students.
• Student Achievement on the CSAP: PercentAdvanced Category—Grade 3,4,5 Reading,Writing and Grade 5 Math; and Percent ofStudents in Unsatisfactory Category—Grade3, 4, 5 Reading,Writing and Grade 5 Math.
Schools were ranked on these indicators andfour schools were selected that best representedthe schools in the Denver system. Four teacherswere selected—three classroom and one specialist/special subject teacher from each of the fourschools.Where possible, teachers who had been inthe pilot for at least two years were selected.Thefour specialists/special subject teachers wereselected to include a range of assignments: specialeducation self-contained classroom, subject mattersuch as music or art, specialist such as a socialworker/counselor.
39Research Design
FIG. 3-8
Distribution of Interviews by Role in District*
Role in the District Number
Denver Classroom Teachers Association Leaders 20
Board Members (current and past) 31
Central Administration (including Superintendent) 49
Design Team Members 13
External Community Members 26
Other Site Staff 15
Parents 91
Principals 92
Teachers 278
Total 615
*This includes people who were interviewed in more thanone year.

Data collection involved three different visitsby the research team: one visit to observe all 16classrooms or workspaces for a full day, two visitsto conduct partial-day observations and two 90-minute after-school focus groups at each schoolwith the same 16 teachers.The visits were sched-uled at two-month intervals: November, January,and March.A complete discussion of the findingsof this study can be found in Chapter V.
G. Impact of School and BroaderInstitutional Factors The pilot also exists in a broader district context.The institutional capacity to implement a majornew initiative has been a factor in the success orfailure of many other educational improvementinitiatives.This capacity could also greatly affectthe results of the pilot. For that reason, the studyexamined a range of institutional factors whichmight impact the pilot.
The decisions and actions of many participantswithin the institution can substantially influencethe implementation of the pilot and its outcomes.This includes such pivotal groups as the Board of Education, the Association, the central adminis-tration, the Design Team and others.
The study examined policy and operationaldecisions, support structures, assignments, mid-course corrections and related interventionsthrough the review of documentary data.The studyalso examined the perceptions of different con-stituencies—at the central and school levels—ofthese decisions and actions with yearly interviews.
The study further examined which effortswere perceived by various constituencies as sup-porting or impeding the progress of the pilot, thefindings which have emerged, and the implica-tions of those findings for the district in terms ofthe ability to implement major new initiatives.The final source of data concerning institutionalfactors came from participation in and observa-tion of the processes.
Documents and Secondary ResourcesDocumentary data were collected from manysources including the following:
• Design Team:The Design Team providedsource data on many aspects of pilot inception
and implementation.This included the DesignTeam’s own semi-annual reports, correspon-dence and meeting minutes, training outlinesand materials, and other documents. In addi-tion, representatives from CTAC attendedmonthly Design Team meetings and receivedcopies of minutes of these meetings preparedby the Design Team.
• Administration, Board of Education and the Association: Documents requested fromthe district included board news and pressreleases, descriptive material on particularaspects of the pilot and internal newslettersand communications.The district also main-tains considerable information concerning PFP and other topics on its website(www.dpskl2.org).
• Joint Task Force on Teacher Compensationand Leadership Team: CTAC’s representativesattended monthly meetings of these twogroups, received minutes of the meetings andother documents disseminated by the groupsregarding the pilot and the proposed newcompensation plan.
• Local and National Press: Press coverage andeditorials, both on local activity and morebroadly on other attempts at merit pay andpay for performance were obtained from avariety of sources, including Education Week,ERIC, Phi Delta Kappan, the Business Round-table, and others.
InterviewsThese primary sources provide considerableinsight into the actions of different entities andhow they are perceived by people inside and out-side the district. Interviews, in particular, wereused to explore perceptions of purpose andimpact, to gauge the understanding and involve-ment of different departments and individuals, andto contrast differing viewpoints over the evolutionof the pilot.These interviews included discussionsof various issues with board members, officialsfrom both the district and DCTA, Design Teammembers, members of the corporate and philan-thropic communities and teachers, principals and parents.
40 Catalyst for Change

CTAC Participation in and Observation of ProcessesAnother source of information regarding theimpact of the broader institutional factorsinvolved the participation of and observation by representatives of CTAC at meetings of the Design Team, the Joint Task Force on TeacherCompensation, the Leadership Team, and theCommunications Group in addition to individualmeetings with the superintendent, the Board’s liaison for the pilot, and Association leadership.CTAC representatives participated in regularmonthly meetings with these groups and pre-sented reports on aspects of the research study to various constituent groups.
A project or pilot can only be successful if it can be implemented.The national experiencein school reform has repeatedly demonstrated the widely varied impact that different implemen-tation strategies and approaches have had onresults, even when the programs were similar.Accordingly, the study has paid close attention toissues of implementation—both how things aredone and how they might be more successful.The sources described above combine to providethe study with a rich and varied range of infor-mation as to institutional issues and their impacton the pilot.
The sources above are used in concert, so thatconclusions regarding the perception of institutional
factors and the impact these factors have had onthe pilot are drawn from several sources.Thesefactors are discussed throughout this report.
H. Summary The study of Pay for Performance in Denver wasdesigned to examine the impact of linking studentachievement to teacher compensation. Moreover,the study also examines the school level andbroader institutional factors which may haveinfluenced the implementation of the pilot.
Both quantitative and qualitative data werecollected and analyzed over a four-year period:student achievement results; school, teacher, andstudent factors; artifacts; participant surveys; par-ticipant interviews; and observations. Several typesof quantitative analyses have been conducted,including: two-stage hierarchical linear modeling;individual growth modeling; simple linear regression analysis; and rubric-based analyses.
Other steps have been taken to ensure therigor of the study and to probe the findings fromsome of the data sets.These include the identifica-tion of a group of control schools whose studentperformance could be compared to that of thepilot schools and the development of deeper qual-itative studies in order to probe specific findings.
These are areas that Denver will continue toaddress as PFP is potentially implemented full-scale in the district.
41Research Design

Objectives:The Nexus
A. IntroductionThe heart of the Pay for Performance pilot is the teacher objective settingprocess. Pilot school teachers individually developed two yearlong instructionalobjectives for each of the four years of the pilot, using the following process:(1) review the available baseline achievement data on their current year students;(2) write two objectives for the identified population(s); (3) select a measure foreach objective; (4) establish expected gain or growth targets for the students inthe class; and (5) confer with the building principal for approval.At the end of theschool year, the teacher presented evidence that one or both objectives had beenmet, and if the principal concurred, the teacher was compensated commensurately.In actual practice, objective setting for the pilot also called for teachers to writea rationale and teaching strategies and, over the course of the pilot, has requiredthe use of various written formats.Through this process, instructional objectivesbecame the nexus between teacher performance and student performance thatresults in additional compensation.
Instructional objectives that identify what teachers will teach and what studentswill learn have a long-established currency in educational settings.They are thehallmark of instructional planning for the year, the unit, and the lesson. Often,such objectives are written for teachers and can be found in curriculum guides,on-line data banks, and textbook publisher materials; however, teachers are alsocalled upon to write objectives (or goals or outcomes) for many purposes in theiryearly work, and objective writing as the beginning of instructional planning isa topic in most teacher training programs. However, writing objectives for com-pensation requires better information and greater precision than is customarilyassociated with planning objectives.
IVC H A P T E R

Basing additional compensation on the resultsof teacher-developed instructional objectives isboth the inspiration in the design of the Pay forPerformance pilot and the agency of many of thedilemmas of its implementation.The inspiration isin the appropriation of an existing district practice,one of writing annual goals or objectives for theteacher appraisal process, in order to house apotentially controversial reform. Developing twoor three goals or objectives and submitting themto the building principal is a familiar routine inDenver schools and, more importantly, a practicewhere teacher autonomy is well established.Educators who implement reforms recognize the importance of moving participants from thefamiliar to the new. Similarly, teacher leaders whonegotiate contracts understand the significance ofobtaining and maintaining teacher autonomy indistrict mandates to the highest degree possible.Teacher objectives, as the base component of thepilot, provided the district and the Association witha familiar launch point to test a new approach tocompensation, and then, as a teacher-developedproduct, objectives contributed a significant levelof teacher autonomy to a high stakes reform.
On the other hand, teacher objectives, which arethe intended drivers of the pilot, have, paradoxically,been the agency of many of the dilemmas in theimplementation of the pilot, both creating newissues to be resolved and encountering barrierswithin the system. For example, persuading schoolsand teachers to join the pilot with promises ofearning additional compensation for “doing whatyou already do” introduced elements of past prac-tices into the implementation of a new initiative.This marketing feature of the pilot may have alsoset teacher participants down a determined pathof “not changing what I do,” an unintended con-sequence that is explored more extensively inChapter V. Secondly, developing teacher objectivesthat are “data driven, credible, and fair” (DesignTeam Project Plan, 2000) has been limited by sys-temic barriers, the most daunting of which wasthe lack of aligned and consistently administeredassessments.Alignment and assessment issues arediscussed in Chapter VIII.
As this chapter and the subsequent one willdemonstrate, setting objectives that lead toimproved student achievement and increased
compensation requires a higher level of science onthe part of teachers, principals, and district leadersthan the routine setting of goals or objectives wherethere may be little or no accountability for theoutcome. Changing the customary and less scien-tific mode of writing and assessing objectives intoa more reliable process became the ongoing workof the Design Team. Consequently, improvementin the setting of the objectives over the course of the pilot has resulted in increased numbers ofobjectives that meet the quality criteria, which areexplained and discussed later in this chapter. Sec-ondly, higher average student achievement on inde-pendent measures is associated with higher qualityobjectives and with the number of objectives met.
This chapter addresses the topics of (1) thecomplexity of implementing objectives; (2) thequality criteria for the objectives, includingmethodology for and the results of the holisticscoring; and (3) the results of comparisons ofobjective data to other available data sets.
B. Unexpected Complexity andBarriers to ImplementationThe Complexity of ImplementationInterview and observation data from the studyshow that many teachers in Denver consider thecrafting of objectives a long-standing and routinepart of their work, something that they havealways done.Also, responses to interview questionsabout objective setting show that over the courseof the pilot, accountability for reaching objectiveshas entered teacher and principal discourse—bothpositively and negatively. For some, the objectivesetting process is a variation on “business as usual”—for others, it has increased critical thought and reflection about teaching and learning.Thefollowing excerpts from teacher interviewsdemonstrate this point:
“Objective setting [is] always the same.Theonly difference is the structure and the reward.And I look at them more than before.”–Pilot teacher
“I have always set objectives and had rubricsto see what I wanted to achieve. But for thetwo PFP goals I am more specific.”–Pilot teacher
43Objectives: The Nexus

“I have learned about the importance of setting specific goals using assessment data.”–Pilot principal
“Objectives now determine yes or no toreceiving compensation. It makes you thinkabout the objective and work toward it. I don’thave time to chase objectives down.Teachingis already a busy profession. PFP is not inherent,at the end of the day, to whether or not I haveachieved my goals. I hope that by teaching astrong curriculum and providing support fortesting it will work.”–Pilot teacher
“Last year, I had a very sincere, heartfelt objectivefor students to learn about syntax.What I feltafter struggling with it for that year is that Ireally learned a lot about my students, whatworked and what didn’t. Even though I didn’tmake the objective (by a very small bit) it wasa good experience. It was what we learnedthrough the process and what happened duringthe year that mattered, not the pay part.”–Pilot teacher
“I have always written objectives.We have hadto become more specific in our goals, percent-ages, although we did that before.We are alsolooking at goals that are reachable. So that iswhy we look at scores carefully and then wework to meet those goals. In the way we writegoals, there is no change in content.We justmake sure that it is measurable and very specific. No major change.”–Pilot teacher
These remarks also show teachers grapplingwith the differences between the old process andthe new one.There is recognition, if not clarity,about the importance of specificity, measurement,and accountability in the new process; yet, theseteachers clearly still consider objectives theirdomain and within their mastery.
Nonetheless, objective setting for PFP turnedout to be unexpectedly complex. In Pathway toResults, the mid-point report, pilot participantsfrom board members to teacher leaders to class-room teachers and principals report on their surprise that objective writing could be so com-plex and create so many dilemmas.Two boardmember comments, for example, early in theimplementation show this surprise:
“When we entered into this, I didn’t see thedifficulty in a fairly simplistic objective settingprocess. I can’t get over that objectives are sohard to write.”–Board member
“I’m more aware of the complexity of theeffort to tie—and validate the tie—betweensetting objectives and performance pay.”–Board member
And in interviews during the last year of thepilot (Spring 2003), teachers and principals werestill pondering the issues and challenges of usingobjectives as the basis of bonus pay.
“We need uniform procedures for objectives.The timeline didn’t make sense.We started the school year in mid-August, goals writtenby mid-October, reviewed by November orDecember. It should have been done earlier inthe year. I didn’t get the ‘OK’ on my objectivesuntil December.”–Pilot teacher
“We have to find a way to distinguish betweenschool politics and the pecking order inschools and actual teacher performance. Rightnow those are meshed together. Right nowthe leadership has too much decision-makingpower and that causes anxiety.”–Pilot teacher
“Teacher graded assessments leave opportuni-ties to manage the outcome.”–Pilot teacher
But a major change had taken place from theearlier interviews (Spring 2000) to the more recent(Spring 2003). Fewer participants were saying,“Itjust won’t work.” More were identifying weakpoints and suggesting changes and repairs to theprocess in order to make it work more effectively.
At the end of four years, there is a greater appreciation on the part of teachers, administrators,and Design Team members for the complexity of setting objectives for compensation purposes.Many teacher objectives at the outset of the pilotwere focused on improving student performance onan assessment (i.e.,“70% of my students will gainone year or more in reading on the Iowa Test of BasicSkills”) rather than focusing on learning content.Secondly, student achievement measures were notaligned to state and district standards. Finally, therehad been inadequate professional development forboth principals and teachers on the craft of setting
44 Catalyst for Change

objectives and aligning instructional practices tothem prior to the pilot.With only brief sessions onobjective setting in the first year (1990-2000) andwithout district direction and support on connec-tions between objectives and teaching, the custom-ary way of writing goals and objectives prevailed in the early implementation of the pilot.As a resultof these issues, concerns around the measurement,consistency, and fairness of the objectives emergedamong participants.
Over the course of the pilot, more technicalassistance and training was provided to teachersand principals by Design Team members in orderto improve the quality of objectives, including,“how to” descriptions and rubrics that guided thedevelopment of objectives for classroom teachers,special subject teachers, and specialists.Also, adatabase of student assessment information calledOnline Assessment Score Information System(OASIS) was developed for pilot teacher use inMay 2001. Improvement in the quality of theobjectives is documented later in this chapter.Also, inroads have been made into many of thesystemic barriers to implementation of a pay forperformance system based on objectives, thoughkey systemic processes still need to be addressed.
Systemic Barriers to Implementation Barriers to quality objective setting existed notonly at the teacher and school level but alsothroughout the system.At the outset, there was alack of alignment between district content stan-dards and assessments, and hundreds of assessments,some teacher-made and almost all teacher-admin-istered and scored, were in play. District directionon the appropriate and consistent use of desig-nated assessments for the district standards wasabsent, incomplete, or implemented unevenly.Administration of the norm-referenced Iowa Test of Basic Skills was permissive for many schools,and the new Colorado state test (Colorado StudentAssessment Program) was just emerging by gradelevels. Since no performance standards or annualexpected gain for students had been established for teacher use, teacher expectations for studentgrowth varied from school to school and fromteacher to teacher in the same school.
Besides assessment, there were other unad-dressed systemic issues that complicated the imple-mentation of objectives: (1) reliable integrated
student and teacher data; (2) a fully developed plan that integrated the PFP elements with districtand school educational plans; and (3) focused pro-fessional development for teachers and principalsin pilot schools.Addressing or troubleshooting as many systemic barriers as possible in order toimprove the quality, rigor, and consistency of theobjectives constituted a large block of the DesignTeam’s implementation work.
45Objectives: The Nexus
Pilot Year One 1999-2000A small staff trained the initial group of elementary pilotschools in setting objectives for PFP. The use of baseline orpre-test data was emphasized because of the need to measurestudent growth to receive bonus pay. Many of the examplesof objectives provided were in the style of pre-existing districtpractice, improvement on assessments. Some follow-up wasprovided to teachers.
Pilot Year Two 2000-2001The Design Team introduced a worksheet and heuristic ortemplate for teachers to complete with the following categories:objective, population, assessment, baseline data, rationale,teaching strategy, and evidence.
Pilot Year Three 2001-2002The Pay for Performance summer training presented the keytasks of writing an objective integrated with planning docu-ments for the teacher’s use. These included using the DenverStandards and Curriculum Matrices; how to analyze assess-ment trends in order to assist in the objective setting process;and developing a body of evidence among others. The DesignTeam and the district also introduced the use of OASIS forteachers to find the assessment history of their students onlinealong with a web-based system where teachers input theirown objectives into the new format. The categories of thenew format are similar to previous years except that the“objective” category is not included, reflecting an expecta-tion that the components of the heuristic will add up to thetotal objective. The web-based system improved the qualityof the objective information and decreased technical errors.
Pilot Year Four 2002-2003Work with groups of teachers by the Design Team resultedin the development of analytical rubrics for classroom teachersand special subject teachers and a checklist for specializedservice providers. Exemplary objectives were developed forelementary and secondary teachers based on the rubric. A key change on the rubric—adding a Learning Contentcategory—as well as a similar change in the Web-BasedObjectives format and examples of objectives using thenew category led to higher levels of scores on the pilotresearch rubric (discussed later in the chapter). Finally, theDesign Team initiated and validated a rubric-based evaluationsystem of its own.
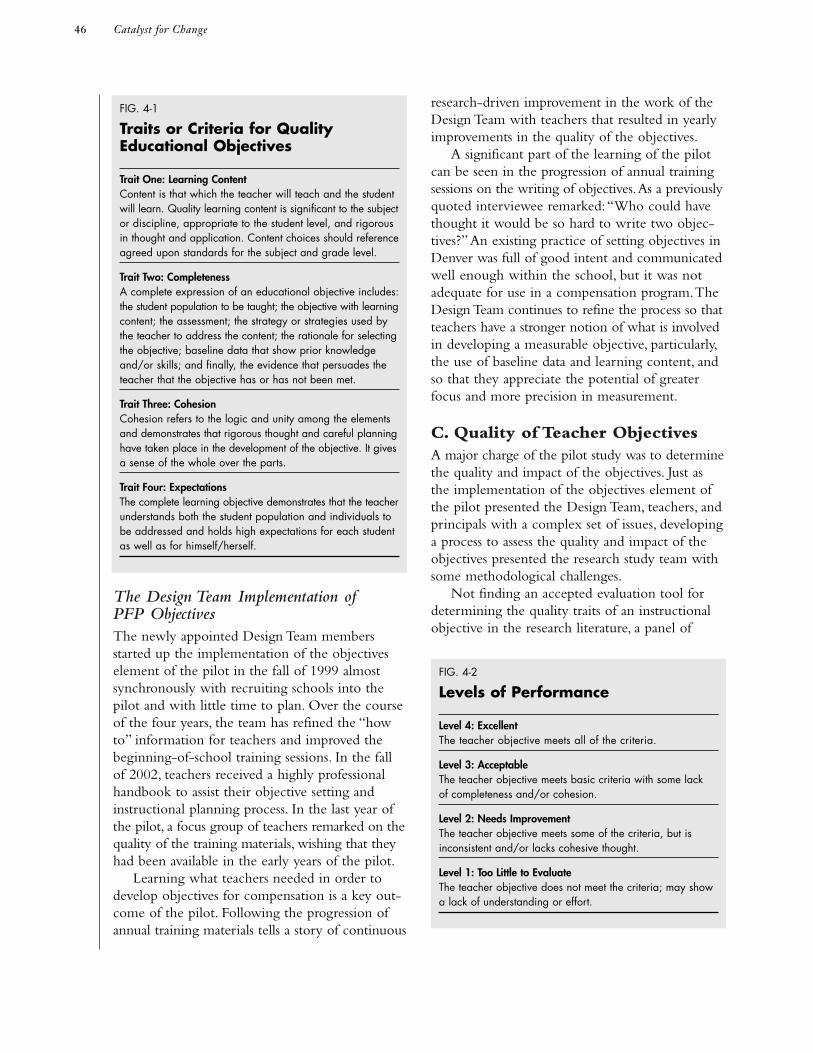
The Design Team Implementation of PFP ObjectivesThe newly appointed Design Team membersstarted up the implementation of the objectiveselement of the pilot in the fall of 1999 almost synchronously with recruiting schools into thepilot and with little time to plan. Over the courseof the four years, the team has refined the “howto” information for teachers and improved thebeginning-of-school training sessions. In the fallof 2002, teachers received a highly professionalhandbook to assist their objective setting andinstructional planning process. In the last year ofthe pilot, a focus group of teachers remarked on thequality of the training materials, wishing that theyhad been available in the early years of the pilot.
Learning what teachers needed in order todevelop objectives for compensation is a key out-come of the pilot. Following the progression ofannual training materials tells a story of continuous
research-driven improvement in the work of theDesign Team with teachers that resulted in yearlyimprovements in the quality of the objectives.
A significant part of the learning of the pilotcan be seen in the progression of annual trainingsessions on the writing of objectives.As a previouslyquoted interviewee remarked:“Who could havethought it would be so hard to write two objec-tives?”An existing practice of setting objectives inDenver was full of good intent and communicatedwell enough within the school, but it was notadequate for use in a compensation program.TheDesign Team continues to refine the process so thatteachers have a stronger notion of what is involvedin developing a measurable objective, particularly,the use of baseline data and learning content, andso that they appreciate the potential of greaterfocus and more precision in measurement.
C. Quality of Teacher ObjectivesA major charge of the pilot study was to determinethe quality and impact of the objectives. Just asthe implementation of the objectives element ofthe pilot presented the Design Team, teachers, andprincipals with a complex set of issues, developinga process to assess the quality and impact of theobjectives presented the research study team withsome methodological challenges.
Not finding an accepted evaluation tool fordetermining the quality traits of an instructionalobjective in the research literature, a panel of
46 Catalyst for Change
FIG. 4-1
Traits or Criteria for Quality Educational Objectives
Trait One: Learning ContentContent is that which the teacher will teach and the studentwill learn. Quality learning content is significant to the subjector discipline, appropriate to the student level, and rigorousin thought and application. Content choices should referenceagreed upon standards for the subject and grade level.
Trait Two: CompletenessA complete expression of an educational objective includes:the student population to be taught; the objective with learningcontent; the assessment; the strategy or strategies used bythe teacher to address the content; the rationale for selectingthe objective; baseline data that show prior knowledgeand/or skills; and finally, the evidence that persuades theteacher that the objective has or has not been met.
Trait Three: CohesionCohesion refers to the logic and unity among the elementsand demonstrates that rigorous thought and careful planninghave taken place in the development of the objective. It givesa sense of the whole over the parts.
Trait Four: ExpectationsThe complete learning objective demonstrates that the teacherunderstands both the student population and individuals tobe addressed and holds high expectations for each studentas well as for himself/herself.
FIG. 4-2
Levels of Performance
Level 4: ExcellentThe teacher objective meets all of the criteria.
Level 3: AcceptableThe teacher objective meets basic criteria with some lack of completeness and/or cohesion.
Level 2: Needs ImprovementThe teacher objective meets some of the criteria, but isinconsistent and/or lacks cohesive thought.
Level 1: Too Little to EvaluateThe teacher objective does not meet the criteria; may showa lack of understanding or effort.

educators examined (1) the literature and guidesfor teacher planning in the ERIC system: (2)Denver’s scope and sequence for K-12; and (3)the heuristic template provided to Denver teachersfor writing an objective.1 No method or style of objective writing emerged in the literature as more effective than another in getting results.The behavioral objectives in vogue in the 1960sand 1970s that included the “elements of perfor-mance, conditions, and criterion”2 have not beenassociated with significant gain.3 However, there is a stream of research to indicate that teacher les-son planning is associated with student gains, andobjectives are the accepted first step of an effectiveplanning process.4 There is some relatively recentresearch, however, which indicates that overly specific or narrow goals are negatively correlatedwith student gain.5
While there is not a research-based method or even a clearly preferred model for writinginstructional objectives, a review of models foundin the lesson planning literature indicates thatinstructional planning includes: (1) what will betaught (standards, concepts, skills, etc.); (2) howstudents will demonstrate learning (assessments,products, performances, etc.); and (3) teachingstrategies. So it was from practitioner planning literature that the key traits of quality educationalobjectives were derived for the study.
MethodologyIn order to carry out the evaluation of objectives,CTAC developed a rubric for the holistic ratingof objectives.The first stage of developing therubric was to identify the traits of quality educa-tional objectives.The categories of traits derivedfrom the review of examples in the literature andthe heuristic format provided to pilot participantsinclude: (1) learning content, what the teacher willteach and the student will learn; (2) completeness,the use of seven elements from the heuristic for-mat provided teachers by the Design Team; (3)cohesion, the logic and unity among the elements;and (4) expectations, the expected level of studentgrowth anticipated by the teacher. Figure 4-1describes these criteria.
The second stage of developing a rubric wasthe development of levels of performance. A ranking of second year objectives contributed to
the final assignment of the performance levels ofExcellent,Acceptable, Needs Improvement, and TooLittle to Evaluate. The decision to use a four-pointscale over a six-point scale was based on theobservation that there was not enough substancein the objectives to discriminate among six levelsand, of course, on the need for expediency inprocessing the large number of objectives eachyear.The performance levels are shown in Figure 4-2.
The final stage of rubric development integratesthe four traits or criteria into descriptors for eachof the four performance levels.The rubric is shownin Figure 4-3.
A panel of readers with teaching and curriculumadministration experience and expertise rated allof the objectives based on the rubric. Discrepanciesin ratings among readers were resolved through asecond, and if needed, third rubric-based readingand discussion.
For the purposes of comparisons over the lifeof the pilot and the identification of trends, it wasimportant to maintain the same rubric over thelife of the pilot.As discussed earlier, the supportprovided annually by the Design Team resulted indifferent heuristic devices and formats provided tothe pilot teachers for each of the four years of thepilot. For this reason, the readers of the objectivesre-anchored each year. However, the rubricremained robust through the changes.
Results of the Rubric-Based Evaluation,1999-2003The results of the rubric-based evaluation foreach of the four years are shown in Figure 4-4.The majority of the objectives for years one andtwo of the pilot fall into the second performancelevel, Needs Improvement; in the second year of the pilot, the percentage of objectives in the level2 category decreased substantially from 61% to54% and the percentage designated at level 4grew by eight percentage points to almost 9%.Level 3 remained relatively constant in the firsttwo years.
As discussed extensively in the mid-pointreport, most teachers scored lower than mighthave been anticipated in the first two years of thepilot, an outcome largely attributable to the factthat learning content, one of the rubric traits, was
47Objectives: The Nexus

missing from most objectives.Where it was pre-sent, it was often of a general nature (i.e., reading,mathematics). Following an existing practice inthe schools, many teachers wrote their objectivesas improvements of assessment performance ratherthan of learning the content.An example of thistype of assessment-focused objective is as follows:“75% of the identified students will show agrowth of one year or more on the DevelopmentalReading Assessment (DRA)/Qualitative ReadingInventory (QRI).”Another influence on the use ofassessment-focused objectives was the designationof approaches in the original pilot design, two of which were intended to examine the use ofspecific types of assessments.
At the time of the mid-point report, theresearch team assessed the significance of settingobjectives in this manner and determined itimportant to keep the content trait as part of therubric because it is the content that communicateswhat is being taught. Identifying the content to betaught also reduces the likelihood that the assess-ment will be perceived as the content (teaching to the test); and finally, it increases the likelihoodthat teacher reflection and planning will focus oncontent alignment and attainment, factors likely toimprove student achievement.This topic is discussedextensively in the mid-point report (pp. 32-36).
The expectation trait of the rubric was also a
pitfall in the first year of the pilot as teacherssought reasonable growth targets for their students,one that is challenging but reachable. In the secondyear, expectations grew, and by the third and forthyear of the pilot, a typical growth target within ateacher objective had settled on 75% of the studentswho were present 85% of the year.
The third year of objective scores (2001-2002)show additional increases in the percentage oflevel 4 scores (to 13%) and level 3 scores (to 34%)with the majority of objectives (52%) remainingat level 2 on the performance scale. During thisyear, the Design Team and the district introducedthe use of OASIS, where teachers could accessprior student assessment data and the Web-BasedObjectives software for inputting their objectives.In the first two years of the study the objectiveswere transferred into electronic format for analyt-ical use.With the introduction of the Web-BasedObjectives system, the percentage of objectivesthat were incomplete or contained errorsdeclined. It is possible that, in earlier years, someof the objectives that could not be rated were miss-ing information due to transcription errors.
In the fourth year (2002-2003) of the pilot,objective scores improved dramatically with thepercentage of level 4 scores more than doubling(to 28%), the level 3 scores increasing (to 44%),and concomitantly, the level 2 scores decreasing
48 Catalyst for Change
FIG. 4-3
Rubric for Describing Teacher Objectives
Level of Performance Descriptors for Performance Levels
4 The teacher states clearly what the students will learn, expressing completely and coherently Excellent all elements of the objective, including the assessment, and demonstrating high expectations
for students. There is a strong sense of the whole.
3 The teacher refers (i.e., from a skill section in a book or test or a program acronym) to what Acceptable the student will learn but may lack thoroughness in addressing the elements or in making clear
the relationship or unity among the elements. The student expectations may seem somewhatconditional or low.
2 The teacher has attempted to address most of the elements of the objective but may not have Needs Improvement stated the learning content, showing a lack of understanding about what is expected or
confusing the elements (stating the objective as an assessment goal rather than a learninggoal). Expectations for students may be low.
1 The teacher does not address the objective in a manner that shows either an understanding Too Little to Evaluate of the task at hand or an effort to complete the task as requested. Objectives may place too
many conditions or exclude too many students to be reliably assessed.

by one half.A change in the analytical rubricdeveloped by the Design Team, along with a changein the structure of the Web-Based Objectives soft-ware format, prompted most teachers to includethe content to be taught in their written objec-tives. More clearly articulated content in objec-tives accounts for most of the improvement inscores. However, the increased use of contentstatements also reveals that teachers often have difficulty in connecting all of the pieces listed inthe format into a coherent whole (i.e., measuringwhat students know and what they will learn;
holding high expectations for students; and beingthoughtful and complete in writing their objec-tives) so that merely adding content did not necessarily create a level 4 objective. In fact, therequirement to respond to the new learning content category may have been confusing. Forexample, in the learning content category, teach-ers sometimes listed teaching strategies (how, notwhat) or the content topics for the entire year’scurriculum, or they reversed the rationale andcontent categories on the format, affecting thecohesiveness trait of the rubric.These findings
49Objectives: The Nexus
FIG. 4-4
Summary of Rubric Levels, 1999-2003
Year Rubric Level First Objective Second Objective Both Objectives Percent
1999-2000 4 1 5 6 0.9
3 72 93 165 24.1
2 199 220 419 61.3
1 51 1 52 7.6
Unrated 19 23 42 6.1
Total 342 342 684 100.0
2000-2001 4 32 38 70 8.9
3 82 96 178 22.6
2 223 203 426 54.1
1 54 52 106 13.5
Unrated 3 5 8 1.0
Total 394 394 788 100.0
2001-2002 4 80 89 169 13.2
3 202 234 436 34.1
2 355 307 662 51.7
1 3 8 11 0.9
Unrated 2 2 0.2
Total 640 640 1280 100.0
2002-2003 4 179 174 353 28.0
3 281 276 557 44.2
2 168 171 339 26.9
1 2 2 4 0.3
Unrated 7 7 0.6
Total 630 630 1260 100.0
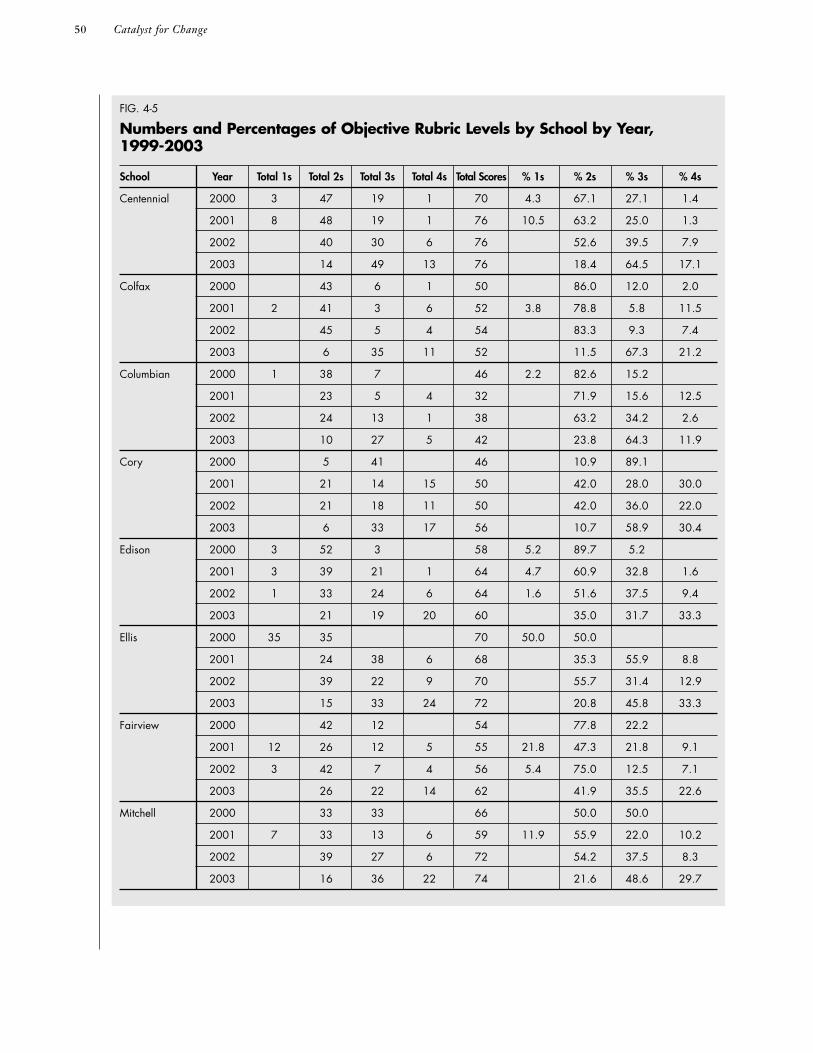
50 Catalyst for Change
FIG. 4-5
Numbers and Percentages of Objective Rubric Levels by School by Year, 1999-2003
School Year Total 1s Total 2s Total 3s Total 4s Total Scores % 1s % 2s % 3s % 4s
Centennial 2000 3 47 19 1 70 4.3 67.1 27.1 1.4
2001 8 48 19 1 76 10.5 63.2 25.0 1.3
2002 40 30 6 76 52.6 39.5 7.9
2003 14 49 13 76 18.4 64.5 17.1
Colfax 2000 43 6 1 50 86.0 12.0 2.0
2001 2 41 3 6 52 3.8 78.8 5.8 11.5
2002 45 5 4 54 83.3 9.3 7.4
2003 6 35 11 52 11.5 67.3 21.2
Columbian 2000 1 38 7 46 2.2 82.6 15.2
2001 23 5 4 32 71.9 15.6 12.5
2002 24 13 1 38 63.2 34.2 2.6
2003 10 27 5 42 23.8 64.3 11.9
Cory 2000 5 41 46 10.9 89.1
2001 21 14 15 50 42.0 28.0 30.0
2002 21 18 11 50 42.0 36.0 22.0
2003 6 33 17 56 10.7 58.9 30.4
Edison 2000 3 52 3 58 5.2 89.7 5.2
2001 3 39 21 1 64 4.7 60.9 32.8 1.6
2002 1 33 24 6 64 1.6 51.6 37.5 9.4
2003 21 19 20 60 35.0 31.7 33.3
Ellis 2000 35 35 70 50.0 50.0
2001 24 38 6 68 35.3 55.9 8.8
2002 39 22 9 70 55.7 31.4 12.9
2003 15 33 24 72 20.8 45.8 33.3
Fairview 2000 42 12 54 77.8 22.2
2001 12 26 12 5 55 21.8 47.3 21.8 9.1
2002 3 42 7 4 56 5.4 75.0 12.5 7.1
2003 26 22 14 62 41.9 35.5 22.6
Mitchell 2000 33 33 66 50.0 50.0
2001 7 33 13 6 59 11.9 55.9 22.0 10.2
2002 39 27 6 72 54.2 37.5 8.3
2003 16 36 22 74 21.6 48.6 29.7

51Objectives: The Nexus
FIG. 4-5 CONTINUED
Numbers and Percentages of Objective Rubric Levels by School by Year, 1999-2003
School Year Total 1s Total 2s Total 3s Total 4s Total Scores % 1s % 2s % 3s % 4s
Oakland 2000 59 9 68 86.8 13.2
2001 61 9 70 87.1 12.9
2002 49 14 15 78 62.8 17.9 19.2
2003 23 44 12 79 29.1 55.7 15.2
Philips 2002 38 10 10 58 65.5 17.2 17.2
2003 26 16 12 54 48.1 29.6 22.2
Smith 2000 8 27 3 38 21.1 71.1 7.9
2001 61 5 66 92.4 7.6
Southmoor 2000 19 1 20 95.0 5.0
2001 10 19 5 34 29.4 55.9 14.7
2002 8 30 2 40 20.0 75.0 5.0
2003 17 27 44 38.6 61.4
Traylor 2000 2 38 13 3 56 3.6 67.9 23.2 5.4
2001 2 37 6 15 60 3.3 61.7 10.0 25.0
2002 42 15 7 64 65.6 23.4 10.9
2003 3 45 14 62 4.8 72.6 22.6
Horace Mann 2001 11 54 23 6 94 11.7 57.4 24.5 6.4
2002 42 49 17 108 38.9 45.4 15.7
2003 1 33 35 23 92 1.1 35.9 38.0 25.0
Lake MS 2002 71 48 13 132 53.8 36.4 9.8
2003 47 35 38 120 39.2 29.2 31.7
Manual HS 2002 5 62 68 33 168 3.0 36.9 40.5 19.6
Arts & Culture 2003 3 31 17 12 63 4.8 49.2 27.0 19.0
Leadership 2003 17 20 19 56 30.4 35.7 33.9
Millennium 2003 13 21 14 48 27.1 43.8 29.2
2002 2 67 56 25 150 1.3 44.7 37.3 16.7
2003 32 53 56 141 22.7 37.6 39.7
Total 2000 52 419 165 6 642 8.1 65.3 25.7 1.0
2001 106 426 178 70 780 13.5 54.6 22.8 9.0
2002 11 662 436 169 1278 0.9 51.8 34.1 13.2
2003 4 339 557 353 1253 0.3 27.1 44.4 28.2
Thomas JeffersonHS
MS

suggest that some teachers near the end of the pilot were continuing to struggle with objective setting.
The 2002-2003 objective format was thefourth one in as many years that pilot teachersused in order to write their objectives. Each newformat template represented an improvement overthe previous year’s format but a new set of chal-lenges for teachers, principals, and researchers.Several of the teachers in focus groups recognizedthe 2002-2003 Design Team rubric and supportmaterials as superior tools and wished that theyhad been available in the first years of the pilot,but for other teachers in the study, it was justanother new form and a bit more aggravationwhen they already had their process down.
As in the previous year, the use of the Web-Based Objectives computer program enhancedthe year’s objective format.The teacher had to fillin each of the categories to complete the process,reducing the chances that a rubric level would bebased on a partial document.Where an objectivewas incomplete or not available at the time of therubric analysis, it was not rated and is shown as“unrated” in Figure 4-4.These numbers were small and are not included in subsequent figures.Annual changes in the directions and formats forthe objectives made each new set of objectives achallenge for evaluators, both in attempting tomaintain a consistent application of the researchrubric for the reliability of the study and in over-coming the different technical problems that eachformat presented.
D. Research Questions, DataSources and Findings Related to ObjectivesBy developing and applying the rubric, theresearch team began its study of pilot teacherobjectives, answering the first of the researchquestions about this element of the pilot design.
1.What are the traits of a quality objective and how are they best described?
Having developed a rubric with which toevaluate the objectives, the next step was to applythe rubric to the objectives written by pilotteachers. Did pilot teachers write quality objectives?
Is there a relationship between teacher characteristicsand the quality of objectives? Did the writing ofobjectives translate into higher student achievement?These issues are expanded upon in the followingresearch questions:
2.What are the rubric levels of objectives writtenby teachers? Is there a relationship betweenthe quality of the objective written by theteacher and the teacher’s participation in the Teacher-in-Residence program, years ofexperience in the Denver schools, educationalbackground, and years of participation in the pilot?
3.Is there a relationship between the quality of the objective written by the teacher andstudent achievement as measured on an independent, standardized test that measuresgeneral growth?
4.Is there a relationship between whether ateacher meets his or her objectives by themeasures or parameters he or she has set andthe teacher’s participation in the Teacher-in-Residence program, years of experience in the Denver schools, educational background,and years of participation in the pilot?
5.Is there a relationship between whether ateacher meets his or her objectives by themeasures or parameters he or she has set and student achievement on an independent,standardized measure of general growth?
6.Is there a relationship between the quality of a teacher’s objective and the process he or shedescribes for writing, teaching to, and assessingthat objective? (See Chapter V.)
7.Is there a relationship between teacher objectives and school improvement plan goalsand objectives?
8.Do objectives written in the pilot schools differ substantially from those of teachers incontrol schools?
The rubric ratings are compared with other datasets in an effort to answer the research questionsoutlined in the chart.The data sets include: (1)four years of rubric levels for two objectives for allteachers in the pilot; (2) four years of achievementdata; (3) four years of met/not met data—the
52 Catalyst for Change

numbers and percentages of teachers meetingtheir objectives; (4) four years of survey data; (5)four years of interviews; (6) samplings of otherartifact data; and (7) specialized interviews, focusgroups, and observations; and (8) four years ofteacher characteristics from the DPS HumanResource files. Figure 4-6 shows the questions and data sources used.
The research questions are primarily addressedin the remainder of Chapter IV. Question 6 is
explored in length in Chapter V.The relationshipbetween objectives and school improvementplans, articulated in question 7, is at root an issueof instructional and organizational alignment and,therefore, is explored in Chapter VIII.
Analyses of Teacher Objective DataIn exploring the connection between studentachievement and objectives, the study links theteacher who wrote the objective to the students
53Objectives: The Nexus
FIG. 4-6
Research Questions about Objectives and Data Sources
Questions Data Sources
2000 2001 2002 2003
1. What are the traits of a quality objective Rubric Rubric Rubric Rubric and how are they best described? Objectives Objectives Objectives Objectives
2. What are the rubric levels of the objectives written by pilot teachers? Human Resource Human Resource Human Resource Human Resource Is there a relationship between rubric Files Files Files Fileslevel and teacher characteristics? Rubric Level Rubric Level Rubric Level Rubric Level
3. Is there a relationship between the quality of the objective written by the teacher and student achievement on ITBS ITBS ITBS ITBSan independent, standardized measure, CSAP CSAP CSAP CSAP which measures general growth? Rubric Level Rubric Level Rubric Level Rubric Level
4. Is there a relationship between whether Human Resource Human Resource Human Resource Human Resourcea teacher meets his or her objectives by Files Files Files Filesthe measures or parameters he or she Met/Not Met Met/Not Met Met/Not Met Met/Not Methas set and teacher characteristics? Results Results Results Results
5. Is there a relationship between whether a teacher meets his or her objectives by the measures or parameters he or she Met/Not Met Met/Not Met Met/Not Met Met/Not Methas set and student achievement on an Results Results Results Resultsindependent, standardized measure, ITBS ITBS ITBS ITBSwhich measures general growth? CSAP CSAP CSAP CSAP
6. Is there a relationship between the quality of a teacher’s objective and the process he or she describes for writing, Process-focusedteaching to, and assessing that objective? General Interviews General Interviews Interviews General Interviews
7. Is there a relationship between teacher objectives and school improvement plan goals and objectives? School Plans School Plans
8. Do objectives written in the pilot schools differ substantially from those of teachers Control School Control School in control schools? Teacher Goals Teacher Goals
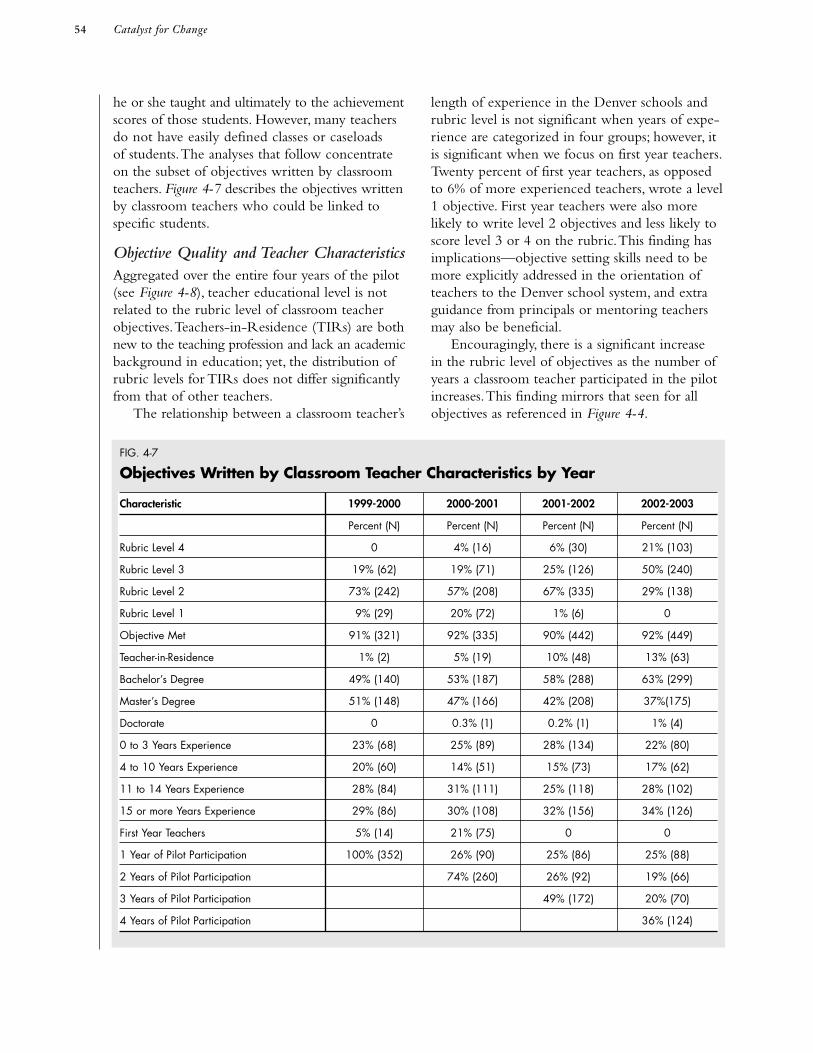
he or she taught and ultimately to the achievementscores of those students. However, many teachersdo not have easily defined classes or caseloads of students.The analyses that follow concentrateon the subset of objectives written by classroomteachers. Figure 4-7 describes the objectives writtenby classroom teachers who could be linked tospecific students.
Objective Quality and Teacher CharacteristicsAggregated over the entire four years of the pilot(see Figure 4-8), teacher educational level is notrelated to the rubric level of classroom teacherobjectives.Teachers-in-Residence (TIRs) are bothnew to the teaching profession and lack an academicbackground in education; yet, the distribution ofrubric levels for TIRs does not differ significantlyfrom that of other teachers.
The relationship between a classroom teacher’s
length of experience in the Denver schools andrubric level is not significant when years of expe-rience are categorized in four groups; however, itis significant when we focus on first year teachers.Twenty percent of first year teachers, as opposedto 6% of more experienced teachers, wrote a level1 objective. First year teachers were also morelikely to write level 2 objectives and less likely toscore level 3 or 4 on the rubric.This finding hasimplications—objective setting skills need to bemore explicitly addressed in the orientation ofteachers to the Denver school system, and extraguidance from principals or mentoring teachersmay also be beneficial.
Encouragingly, there is a significant increase in the rubric level of objectives as the number ofyears a classroom teacher participated in the pilotincreases.This finding mirrors that seen for allobjectives as referenced in Figure 4-4.
54 Catalyst for Change
FIG. 4-7
Objectives Written by Classroom Teacher Characteristics by Year
Characteristic 1999-2000 2000-2001 2001-2002 2002-2003
Percent (N) Percent (N) Percent (N) Percent (N)
Rubric Level 4 0 4% (16) 6% (30) 21% (103)
Rubric Level 3 19% (62) 19% (71) 25% (126) 50% (240)
Rubric Level 2 73% (242) 57% (208) 67% (335) 29% (138)
Rubric Level 1 9% (29) 20% (72) 1% (6) 0
Objective Met 91% (321) 92% (335) 90% (442) 92% (449)
Teacher-in-Residence 1% (2) 5% (19) 10% (48) 13% (63)
Bachelor’s Degree 49% (140) 53% (187) 58% (288) 63% (299)
Master’s Degree 51% (148) 47% (166) 42% (208) 37%(175)
Doctorate 0 0.3% (1) 0.2% (1) 1% (4)
0 to 3 Years Experience 23% (68) 25% (89) 28% (134) 22% (80)
4 to 10 Years Experience 20% (60) 14% (51) 15% (73) 17% (62)
11 to 14 Years Experience 28% (84) 31% (111) 25% (118) 28% (102)
15 or more Years Experience 29% (86) 30% (108) 32% (156) 34% (126)
First Year Teachers 5% (14) 21% (75) 0 0
1 Year of Pilot Participation 100% (352) 26% (90) 25% (86) 25% (88)
2 Years of Pilot Participation 74% (260) 26% (92) 19% (66)
3 Years of Pilot Participation 49% (172) 20% (70)
4 Years of Pilot Participation 36% (124)

Rubric Levels of Objectives and Student AchievementThe third research question explores the relation-ship between student achievement and the qualityof classroom teacher objectives. Mean achievementscores were estimated for elementary and middleschool students by the maximum rubric level oftheir teacher, adjusting for student and school char-acteristics. Mean scores were estimated separatelyfor each pilot high school as well, adjusting for stu-
dent characteristics. For the secondary analyses, onelanguage arts and one math teacher were selectedat random for each student. For the most part, ele-mentary school students spend the majority of theschool day with one teacher, however secondarystudents may have a number of teachers who couldbe expected to impact the students’ standardizedtest scores.The secondary school analysis is biasedtoward finding no relationship between achieve-ment and rubric level, since the students for whom
55Objectives: The Nexus
FIG. 4-8
Classroom Teacher Objectives—Rubric Level by Teacher Characteristics, 1999-2003
Teacher Characteristic Rubric Level 1 Rubric Level 2 Rubric Level 3 Rubric Level 4
Teacher-in-Residence Percent (N) Percent (N) Percent (N) Percent (N)
No 6% (96) 55% (858) 30% (459) 9% (135)
Yes 8% (11) 50% (65) 31% (40) 11% (14)
�2 = 2.2, p(�2=0) = 0.528
Educational Degree
Bachelor’s 6% (49) 56% (500) 30% (266) 9% (76)
Master’s 7% (46) 53% (363) 30% (209) 10% (70)
Doctorate 83% (5) 17% (1)
�2 = 5.1, p(�2=0) = 0.536
Years of Experience in DPS
0 to 3 8% (30) 55% (205) 28% (105) 8% (30)
4 to 10 5% (12) 53% (127) 32% (77) 10% (23)
11 to 14 7% (28) 54% (222) 31% (129) 8% (31)
15 or more 7% (30) 62% (284) 25% (112) 7% (31)
�2 = 12.2, p(�2=0) = 0.201
First Year Teachers
First Year 20% (17) 61% (53) 16% (14) 3% (3)
Subsequent Years 6% (82) 55% (784) 30% (424) 9% (129)
�2 = 32.4, p(�2=0) = 0.001
Years of Pilot Participation
1 8% (49) 63% (376) 25% (151) 3% (19)
2 12% (51) 57% (233) 24% (97) 7% (29)
3 1% (2) 57% (138) 32% (76) 10% (25)
4 22% (27) 59% (73) 19% (24)
�2 = 157.1, p(�2=0) = 0.001

we randomly chose a teacher with a rubric level of 1 may also have one or more teachers in otherrelated classes with higher rubric levels.The fulldescription of the student achievement analyses is presented in Chapter VI, and a summary of thefindings is presented here in Figure 4-9. Therewere years in which none of the students whotook the ITBS or CSAP exams had classroomteachers with a rubric level of 1, resulting in noestimates for rubric level 1 on those tests.
Elementary SchoolsAt the elementary school level, there is evidencethat mean student achievement NCE scoresincrease as rubric level increases:
• On the ITBS Reading test, students of teach-ers with rubric levels of 2, 3, and 4 have meanNCE scores that are significantly higher thanstudents of teachers with a level of 1.
• On the CSAP Writing test average scoresincrease as the rubric level of the students’teacher increases, however the differencesbetween levels is not statistically significant.
• On the ITBS Language and CSAP Math tests,the average scores of students with rubric level4 teachers are significantly higher than theother levels.
• Mean scores for the ITBS Math test are higherat rubric levels 2 and 3 than either level 1 orlevel 4.
• Mean scores for the CSAP Reading test areapproximately equal across rubric levels.
Overall, on four out of six tests, there is a positive relationship between achievement andrubric level. On one test, the results are mixed,and on one test, there is no difference.This resultis strong evidence that higher rubric levels areassociated with higher levels of achievement inpilot elementary schools.
Middle SchoolsFor the secondary school analyses, one of a student’steachers in a subject related to the assessmentmeasure was chosen at random. Since a studentcould have up to ten teachers over the course of
the school year, it is likely that many of the studentshad teachers with different rubric levels.This biasesthe analysis against detecting a statistically significantdifference between rubric levels. Despite this bias,the middle school pilots exhibit a positive relation-ship (i.e., achievement rises as rubric level rises)between rubric level and achievement in four outof six tests.
• At the middle school level, achievementincreases with rubric level on the ITBS Mathand the CSAP Reading and Math tests, withstatistically significant differences on the ITBSMath and CSAP Math test.
• For ITBS Reading the relationship is reversed,with level 2 significantly higher than level 3and higher than level 4.
• For CSAP Writing, students of rubric level 3teachers outperform both level 4 and level 2,but the differences between levels are not statistically significant.
High SchoolsAt the high school level, the positive relationshipbetween higher average NCE scores and higherrubric levels is also evident:
• At Manual High School on three of the tests(ITBS Reading, CSAP Reading and CSAPWriting), achievement increases with the levelof rubric, with significant results on two of the tests. At Thomas Jefferson High School,the positive relationship is found on the threeCSAP tests, with rubric level 4 on the Writingtest significantly higher than level 3.
• At Manual High School there was almost no difference between levels on the ITBSMath exam.
• On the ITBS Language and CSAP Math testsat Manual and on the ITBS Reading andCSAP Reading tests at Thomas Jefferson therelationship is mixed, with students of level 3teachers performing higher than students oflevel 4 and level 2 teachers. Significant differ-ences are noted on only one of these tests.
Like the middle school analysis, the highschool analysis is biased toward finding no rela-
56 Catalyst for Change

tionship.That we find a statistically significantpositive relationship between rubric level and student achievement on three of the subtests atthe pilot high schools, and that most of the nonsignificant results show the same relationship, isevidence that the relationship holds at the highschool level as well.
Impact of Teacher Characteristics on Meeting ObjectivesBy their own measures and bodies of evidenceand as verified by the building principals, teachers
reached their objectives at a very high rate.The“met” or “not met” data collected by the districtover the four years of the pilot show that 89% to93% of the teachers met one or more objectivesand were compensated. Figure 4-10 shows thenumbers and percentages of objectives that weremet or not met by rubric categories.
Turning to the subset of objectives written byclassroom teachers, one sees in Figure 4-11 that aclassroom teacher's educational background andexperience are related to whether classroomteachers accomplished their objectives.TIRs met
57Objectives: The Nexus
FIG. 4-9
Estimated Mean NCE by Rubric Level, Adjusting for School and Student Characteristics (at the High Schools Student Characteristics only) Estimated from HLM and LSR Models Presented in Chapter VI
Rubric Level ITBS Reading ITBS Language ITBS Math CSAP Reading CSAP Writing CSAP Math
Elementary Schools 4 50.9*1 56.8*1,2,3 39.7*2,3 54.6 52.4 56.5*2,3
3 49.7*1 44.6*4 47.1*1,4 54.8 52.0 52.9*4
2 49.5*1 43.6*4 47.0*1,4 54.2 51.9 52.5*4
1 42.7*2,3,4 39.9*4 36.9*2,3
Observations 8554 5324 6825 4556 5597 2127
Middle Schools 4 33.3 42.2 38.3*2 44.0 42.8 53.1*2,3
3 33.4*2 41.6 35.9 43.5 44.4 47.6*4
2 34.9*3 42.1 34.8*4 43.6 43.7 48.1*4
1
Observations 1789 1433 989 2238 2263 1693
Manual High School 4 40.2*2 34.2 37.2 43.2 38.6*2,3 33.8*3
3 37.6 36.0 37.5 42.1 33.9*4 37.7*4
2 37.0*4 34.2 37.7 41.8 35.8*4 35.9
1
Observations 675 415 556 685 331 491
Thomas Jefferson 4 55.7 54.3 57.8 58.2*3 60.8
3 57.4 55.7 56.9 55.5*4 57.3
2 55.7 56.7 57.2 55.8 59.4
1
Observations 1136 No Testing 807 920 471 706
*1 = different from Rubric 1 at p< 0.05*2 = different from Rubric 2 at p< 0.05*3 = different from Rubric 3 at p< 0.05*4 = different from Rubric 4 at p< 0.05
High School

83% of their objectives while regular classroomteachers met 92% of their objectives, and first yearteachers were less likely to meet their objectivesthan more experienced teachers.As mentionedearlier, inexperienced teachers could use assistancein the objective setting process; here one sees thatproviding support in meeting the objective wouldalso be of value.
Teachers with tenure of 15 or more years in theDPS system are less likely to meet their objectivesthan teachers with under four years, four to 10years, or 11 to 14 years of experience.This findingis consistent with other research that indicatesthat while inexperienced teachers (under threeyears) are typically less effective than more expe-rienced teachers, the benefits of experience even-tually begin to level off and may begin to declinebefore the twentieth year.
As teachers gain more years of experience inthe pilot, their chances of meeting their objectivesincrease significantly. Eighty-nine percent of theobjectives of first year pilot participants were met,by the fourth year of participation the success raterose to 98%.
Student Achievement and Teacher Success in Meeting ObjectivesThis analysis revealed evidence of a positive rela-tionship between the total number of objectives(out of two) a classroom teacher met and studentachievement. Mean achievement scores were esti-mated for elementary and middle school studentsby the number of objectives met by their teachers,adjusting for student and school characteristics.In addition, mean scores by number of objectivesmet were estimated separately for each pilot highschool, adjusting for student characteristics.Thisanalysis is discussed in full in Chapter VI and issummarized in Figure 4-12. At Manual and ThomasJefferson High Schools, there were no studentswith both achievement scores and a teacher whomet either one or no objectives in some years forsome tests. Indeed, for all tests the Thomas Jeffer-son High School analysis compares meeting oneobjective to meeting two objectives.
Elementary SchoolsAt the elementary school level, students of teach-ers who met both objectives had higher average
58 Catalyst for Change
FIG. 4-10
All Objectives—Rubric Levels by Met/Not Met Status by Year, 1999-2003
Year Status Rubric Level Percent of Total
1 2 3 4 Total 1 2 3 4
1999-2000 Met 50 392 157 6 605 8.3 64.8 26.0 1.0
Not Met 2 26 7 35 5.7 74.3 20.0
Total 52 418 164 6 640 8.1 65.3 25.6 0.9
2000-2001 Met 88 397 158 64 707 12.4 56.2 22.3 9.1
Not Met 12 24 14 6 56 21.4 42.9 25.0 10.7
Total 100 421 172 70 763 13.1 55.2 22.5 9.2
2001-2002 Met 7 570 379 156 1112 0.6 51.3 34.1 14.0
Not Met 4 84 51 12 151 2.6 55.6 33.8 7.9
Total 11 654 430 168 1263 0.9 51.8 34.0 13.3
2002-2003 Met 4 313 518 322 1157 0.3 27.1 44.8 27.8
Not Met 27 39 31 97 27.8 40.2 32.0
Total 4 340 557 353 1254 0.3 27.1 44.4 28.1
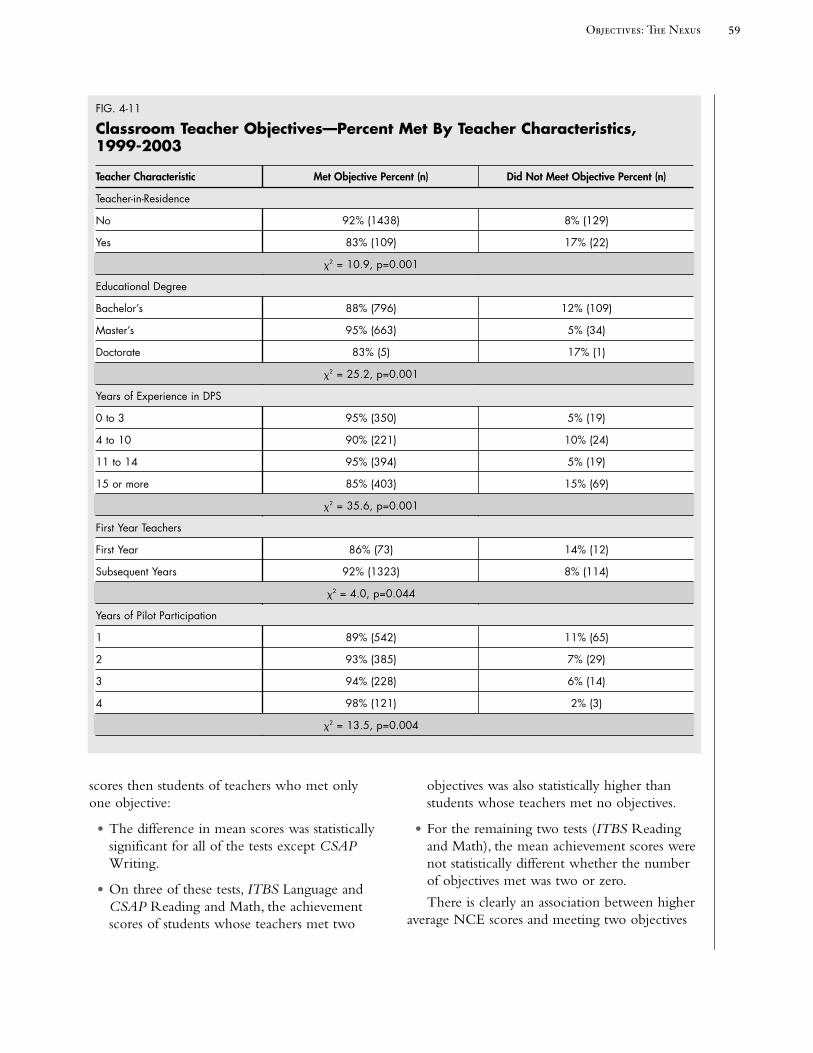
scores then students of teachers who met onlyone objective:
• The difference in mean scores was statisticallysignificant for all of the tests except CSAPWriting.
• On three of these tests, ITBS Language andCSAP Reading and Math, the achievementscores of students whose teachers met two
objectives was also statistically higher than students whose teachers met no objectives.
• For the remaining two tests (ITBS Readingand Math), the mean achievement scores werenot statistically different whether the numberof objectives met was two or zero.
There is clearly an association between higheraverage NCE scores and meeting two objectives
59Objectives: The Nexus
FIG. 4-11
Classroom Teacher Objectives—Percent Met By Teacher Characteristics, 1999-2003
Teacher Characteristic Met Objective Percent (n) Did Not Meet Objective Percent (n)
Teacher-in-Residence
No 92% (1438) 8% (129)
Yes 83% (109) 17% (22)
�2 = 10.9, p=0.001
Educational Degree
Bachelor’s 88% (796) 12% (109)
Master’s 95% (663) 5% (34)
Doctorate 83% (5) 17% (1)
�2 = 25.2, p=0.001
Years of Experience in DPS
0 to 3 95% (350) 5% (19)
4 to 10 90% (221) 10% (24)
11 to 14 95% (394) 5% (19)
15 or more 85% (403) 15% (69)
�2 = 35.6, p=0.001
First Year Teachers
First Year 86% (73) 14% (12)
Subsequent Years 92% (1323) 8% (114)
�2 = 4.0, p=0.044
Years of Pilot Participation
1 89% (542) 11% (65)
2 93% (385) 7% (29)
3 94% (228) 6% (14)
4 98% (121) 2% (3)
�2 = 13.5, p=0.004
compared to meeting one objective. However,the relationship may be more complicated whencomparing meeting two objectives to meeting noobjectives.Very few teachers met no objectives,making it more difficult to detect a significant difference between meeting one or two objectivesand meeting no objectives.
Middle SchoolsThe middle school results, as expected, are lessdefinitive than the elementary findings:
• On the ITBS Language and Math and theCSAP Math tests, having met one or twoobjectives produced similar mean studentachievement, while meeting no objectives wasassociated with lower student achievement.Thedifference between meeting one or more objec-tives and meeting no objectives was statisticallysignificant only for the ITBS Language test.
• On the ITBS Reading test students of teacherswho met one objective had significantly lowermean scores than students whose teacher meteither two or no objectives.
• For CSAP Reading and Writing there is nodifference in achievement associated withnumber of objectives met.
Despite the bias of the statistical methodologyagainst finding a relationship at the middle schoollevel, there is evidence that students of teacherswho met one or two objectives had higher average student achievement than students ofteachers who did not meet any objectives.
High SchoolsTurning to the high schools, similar results to themiddle schools can be seen:
• At Manual High School on ITBS Reading,students of teachers who met two objectiveshave significantly higher scores than studentsof teachers who met one or no objectives. Onthe ITBS Math, and CSAP Writing tests theaverage score of students whose teacher mettwo objectives is higher (but not statisticallysignificant) than the average score of studentswhose teachers met one objective. In addition,although the difference is not statistically sig-
nificant, on the CSAP Math test average scoresfor students of teachers who met two objectivesare higher than for students of teachers whomet no objectives.
• At Thomas Jefferson High School, on the ITBSReading exam, students of teachers who mettwo objectives had a significantly higher aver-age score than students of teachers who metone objective. On the ITBS Math and CSAPReading and Math tests, the students of teacherswho met two objectives had higher averagescores than students of teachers who met oneobjective, however the differences were notstatistically significant.
Statistically significant differences are seen onlyfor the ITBS Reading test (at both pilot highschools) between the average scores of studentswhose teachers met two objectives and the averagescores of students of teachers who met one objec-tive. However, the fact that the findings are biasedagainst finding a statistically significant result, coupledwith the fact that six of the remaining high schooltests exhibit a positive relationship between numberof objectives met and average achievement scores,make it reasonable to conclude that at the highschool level meeting two objectives is associatedwith higher average student achievement levelsthan meeting one objective.
With a small number of exceptions, at the elementary, middle, and high school levels, higheraverage student achievement is associated withteachers who met two objectives compared tostudents of teachers who met one or no objectives.Of the 22 subtests examined (six elementary, sixmiddle school, and 10 high school), four testsshowed that students of teachers who met twoobjectives had significantly higher mean scoresthan students of teachers who met either one orno objectives, three tests showed a significantlyhigher mean comparing meeting two objectivesto meeting one objective, and one test showed a significantly higher mean comparing meetingtwo objectives to meeting no objectives. Dueprobably to the small number of observations inthe met zero objectives category, three of the sub-tests just mentioned show that students of teacherswho met no objectives had approximately thesame average scores as students of teachers who
60 Catalyst for Change

met two objectives, while students of teachers whomet one objective had significantly lower averagescores. In addition, of the ten tests which did notexhibit statistically significant differences, nine moretests appear to show a relationship between highermean scores and meeting two objectives while onlyone appears to show a negative relationship.
Setting objectives that garner a four on therubric is not likely in and of itself to producemore learning. However, setting an excellentobjective as the first step in a reflecting, planning,teaching, assessing loop that is carried out recursivelyand meta-cognitively by the teacher is a morepersuasive explanation.The association betweenhigher quality objectives and higher average studentachievement on independent assessments, along
with the positive association between a teacher’smeeting two objectives and higher average studentachievement, provide two of the most promisingfindings of the study.
Pilot and Control School ImprovementPlans and Control School Teacher GoalsIn an effort to further understand the institutionalinfluences on teacher-written objectives, the studyexamined school improvement plans in both thepilot and control schools and the control schoolteacher goals. School plans provide insight into thegeneral focus of a school and the areas identifiedfor improvement by school councils.The controlschool teacher goals provided a picture of theprocess used throughout the district prior to the
61Objectives: The Nexus
FIG. 4-12
Estimated Mean NCE by Number of Objectives Met, Adjusting for School andStudent Characteristics (at the High Schools Student Characteristics only)Estimated from HLM and LSR Models Presented in Chapter VI
Objectives ITBS ITBS ITBS CSAP CSAP CSAP Met Reading Language Math Reading Writing Math
Elementary Schools 2 49.5*1 45.5*0,1 47.0*1 54.8*0,1 52.1 54.0*0,1
1 47.4*2 43.6*2 43.7*0,2 52.7*2 51.5 50.1*2
0 48.1 43.2*2 47.0*2 52.6*2 52.0 45.5*2
Observations 8608 5412 6870 4556 5609 2117
Middle Schools 2 33.9*1 40.7*0 35.0 43.4 45.1 46.8
1 32.1*0,2 41.4*0 35.0 43.3 45.6 46.5
0 35.0*1 37.6*1,2 33.7 43.2 45.1 44.1
Observations 1800 1453 1011 2223 1325 950
Manual High School 2 37.0*0,1 32.2 38.0 42.5 36.8 37.4
1 33.3*2 37.0 42.9 34.7
0 33.1*2 35.9 42.7 35.6
Observations 689 428 585 687 333 510
2 57.1*1 55.7 57.0 60.2
1 51.7*2 54.1 55.6 58.3
0
Observations 1137 No testing 809 917 704
*2 = different from Met 2 Objectives at p< 0.05*1 = different from Met 1 Objectives at p< 0.05*0 = different from Met 0 Objectives at p< 0.05
Thomas JeffersonHigh School

implementation of the PFP process in the pilotschools.These artifacts were examined and com-pared at two points in the pilot: Spring 2001 andSpring 2003.The analysis of school plans is dis-cussed in the context of organizational alignment inChapter VIII of this report.
There is a summary of the findings from thereview of 12 sets of control school teacher goalsfor the school year 2001-2002 in the mid-pointreport (pp. 36-37).The control teachers wrotethree annual goals, two of which were academicand focused on school and district goals.The thirdgoal was optional, but most teachers used it to seta professional or personal goal.Teachers wrotegoals on the form provided and then weightedthem, giving priority to some goals over others or treating them equally. Other sections of theform asked for teaching strategies and provided an appraisal section for the principal. Most of theobjectives were written in an assessment-focusedmanner with a percentage of attainment; however,there was almost no use of baseline data.
The reading of 19 sets of control school goalsin Summer 2003 showed some changes in theformats that teachers were using: 12 schools usedthe standard district form that was observed in2001; six schools used the PFP process and formsor modified versions (e. g., the PFP template work-sheet with the objectives transcribed to the stan-dard district form); and one school provided atwo-page summary listing one or two goals perteacher without teaching strategies. Some of thestandard forms had removed the appraisal categories.Except for those using the PFP process, there wasgenerally not a reference to baseline data or startingpoints for students.
The control school goals reflect the objective-setting process that pilot school teachers had used prior to the inception of the pilot and helpexplain the differences and difficulties of settingPFP objectives experienced by pilot teachers.Also, as noted, in the mid-point report, theyhelped explain the preference for assessment-focused objectives in the initial years of the pilot.
The control school goals reviewed in 2003show the migration of features of the pilot, in this case, the objective format, into the controlschools.This circumstance is not unexpected in light of interviews where several control school
principals indicated admiration of the pilotprocess, particularly the objective setting compo-nent. Secondly, schools other than pilot schoolswere introduced the use of the OASIS system for accessing student data. Based on this sample,however, little has changed in control school goalssince 2001, except in the 25% of this sample thathave begun to use the PFP processes.
E. SummaryThe design of Pay for Performance in Denver iscentered on the outcome of two teacher-developedobjectives.When the objectives are met, additionalcompensation is earned. Because of this pivotalrole in the design of the pilot, objectives became akey element not only of the implementation butalso of the study of PFP.This chapter explainedthat the objectives for the pilot were grounded inpast practice in the district, but new features andexpectations for the objectives made a familiarway of doing things more complex—creatingconflict between the old and the new in theobjective setting process.
A four-level rubric was developed to measurethe quality of the objectives and a set of questionsthat explored the relationship of the objectives to several other sets of data was also developed.The analyses of the objectives over the four yearsshow that (1) learning to write objectives for thepurpose of establishing and achieving growth targets for students is more complicated for teachersthan might have been expected; (2) the setting of objectives, nonetheless, improved over the life of the pilot as technical assistance improved andexperience increased; (3) inexperienced teachers(first year and TIRs) would benefit from additionalassistance in developing and implementing theirobjectives; (4) higher rubric levels are associatedwith higher average NCE scores on independentmeasures; and (5) meeting two objectives is associ-ated with higher average student achievement thanmeeting only one objective.
These findings point to the impact that objec-tive setting has on student achievement and showthe potential for objectives to be the basis of acomponent in a compensation system and thespringboard to improved student achievement.Setting objectives that garner a four on the rubric
62 Catalyst for Change
is not likely, by itself, to produce more learning.However, setting an excellent objective as the first step in a loop of thinking, planning, teaching,and assessing that is carried out recursively by theteacher is a more persuasive explanation.The posi-tive relationship between higher quality objectivesand student achievement in most areas of indepen-dent measures, along with the positive relationship
between number of objectives met and higheraverage student achievement, provide two of themost promising findings of the study.These findingssuggest an agenda for professional development notonly in Denver but also in other districts initiatingachievement reforms. In the upcoming chapter,the role and impact of objectives are explored morethoroughly through the perspective of pilot teachers.
63Objectives: The Nexus

The TeacherPerspective
A. IntroductionLaunching the Pay for Performance pilot from an established district practice of goal-setting promoted participation and a quick start-up. Doing so also addedto the complexity of implementation and affected how pilot teachers perceivedtheir roles and obligations.Although building on a pre-existing practice had adouble-edged influence on the pilot, the data indicate that this objective settingprocess holds promise for the district.There are statistically significant positivecorrelations between teacher objectives rated at higher levels on the researchrubric and student achievement on most sections of the independent assessments.Further, there is a positive correlation between teachers’ meeting two of theirobjectives and student achievement on these same measures.These results makeunderstanding and responding to pilot teacher perceptions about objectives notonly worthwhile but also essential for any future work connecting teacher andstudent performance for compensation purposes.
The evolving quality and impact of the objectives, as well as teacher descrip-tions of their work with objectives, provide a barometer of the teacher experienceof the pilot. Besides setting objectives and assessing yearly progress on objectivesfor purposes of additional compensation, teachers have participated in the studyof the pilot by responding to annual surveys and interviews.Additionally, smallersamples of pilot teachers participated in focused interviews and focus groups.Several opened up their classrooms for detailed observations. Over the four yearsof the study, pilot teacher input has been voluminous and has contributed signifi-cantly to the key findings of the pilot.
In the spring of each year of Pay for Performance (2000-2003), teachers inthe pilot schools, as well as other stakeholders in the pilot, responded to surveys.Additionally, a random sample of the groups was interviewed each spring.The
VC H A P T E R

protocols for both surveys and interviews for pilotteachers focused on the impact of various elementsof the pilot on teaching and learning, as well asother changes during the respective year thatmight be attributed to the pilot.As the pilot pro-gressed, survey questions were designed to validateperspectives that emerged in the interview data.Themes about the impact of the pilot on studentachievement emerged from these data. Most of the themes that were apparent after two years andthat were reported at the mid-point of the pilot,remained at the end of four years but were morethoroughly articulated and better understood.Teacher responses to the challenges of the objec-tive setting process have been more descriptive,analytical, and solution-oriented in the latter years of the pilot than in the beginning years.
Teaching in Denver, a large urban school district with a diverse student body, has inherentchallenges. During the span of the Pay for Performance pilot, teachers were also becomingacquainted with the new state assessment, the Colorado Student Assessment Program (CSAP), whichwas implemented in grade level segments overtime and which became a public report card onthe performance of their respective schools. Otherlarge scale reforms and programs that affectedteachers included the implementation of an areaorganizational structure, the development of threesmall schools from one of the pilot high schools,and a new literacy program mandate for most of the schools in the final year of the pilot. Simul-taneously, as described in Chapter VII, Denverexperienced personnel changes at the district andpilot school leadership levels, and several hundrednew teachers were inducted each year into theentire district.Teachers had input into few of these changes.They were, though, able to chooseto become part of the pilot.Their decision to do so started the teachers down a new and largelyuncharted path. Certainly, Pay for Performance didnot come with a roadmap that would lead teachersto expect to make fundamental changes in theirpractices in order to impact student achievement.
Therein lies one of the central stories of Payfor Performance: how teachers understood andresponded to the goals of the pilot, which had asimple design for reaching a complex outcome—improving achievement student by student.
As both the agents of the pilot and key subjectsof the study, teachers in the pilot schools haveheld a unique position as knowledgeable critics of the process.They have provided four years ofcritique and feedback through interviews and surveys.Additionally, during the third and fourthyears of the study, representative groups of teachersengaged in special in-depth components of theresearch.Vehicles for doing so included (1) a set offocused interviews wherein 12 teachers describetheir objective setting process from beginning toend, and (2) a deeper qualitative study of how 16teachers in four pilot schools experienced the pilot.Through these efforts, teachers provided theirinsights into the process and their interpretationsof some of the survey and interview findings that,on the surface, seemed contradictory.Thus, teachershave been de facto researchers as well.This chapterpursues a deeper understanding of the teacherexperience of the pilot through surveys, interviews,and two qualitative studies that included focusedinterviews, group interviews, and classroom observations. Finally, this chapter examines theideas and suggestions tendered by teachers forimproving the processes of Pay for Performance.
B. The Intent, Impact, andProcess of Setting Objectives Teacher Understanding and Descriptions of the Intent and Impact of PFPClearly, one intent of Pay for Performance was to increase student achievement by providingadditional compensation to teachers for meetingstudent growth targets. However, there is not necessarily a direct link between setting an objec-tive with a growth target and increased studentachievement. Further, the design of the pilot didnot provide a blueprint for what should happenbetween setting objectives, based on studentachievement data, and collecting evidence ofmeeting those objectives. It is a design respectfulof teacher autonomy. It is based on the assump-tion that, in setting more informed objectives andbeing accountable for the outcome, teachers willmake any necessary changes in classroom practice.
Working with a familiar process and maintain-ing a degree of autonomy allowed pilot teachersto engage in what could have been a high stakes
65The Teacher Perspective

program with a minimum of risk or commitmentto fundamental change. Based on what teachershave said over the course of the pilot about theirreasons for joining the pilot and the actual impactof PFP on their teaching, most did not plan tochange what they were doing in the classroomwhen they first entered the pilot.
According to Spring 2000 survey data, someteachers intended to get the bonus.As one teachercomments,“We joined the pilot to get a bonusfor what we already do.”Another adds,“We havebeen setting goals for many years.We are a schoolwith excellent teachers.Why not get paid for theextra hours we work?”A third teacher indicates,“I felt I would at least get $500 for trying. I didnot change my teaching. I feel I work hardwhether there [is] PFP or not.”
Others thought of joining the pilot as doingone’s professional duty. One teacher suggests,“Being part of the pilot would help me to betterevaluate and have input into the program before itis ruled on by teachers.”Another notes,“I wantedto have the experience of PFP so I would havevalid information when voting.”
Other less prevalent reasons for joining the pilotincluded the influence of the building principal,the opportunity for professional development, thesatisfaction of intellectual curiosity, and lastly, a beliefthat PFP might improve student achievement.
Some teachers reported that they were toldeither by their principals or by some representa-tives of the Design Team that they did not have tomake changes. Since most teachers believed thatthey were already giving their best, such statementsgained currency among many teachers. Nonethe-less, survey and interview data show that mostpilot teachers did understand the goals of PFP at theoutset. In the Spring 2000 survey, not long afterthe pilot was underway, 85% of pilot teachersagreed or strongly agreed with the statement that agoal of PFP is to “increase student achievement.”Seventy-five percent agreed or strongly agreed thatanother goal of PFP was to “focus district activityon improving teaching and learning,” and 78%agreed or strongly agreed that increasing “teacheraccountability for student achievement” was a goal.
Early on, teachers did realize that setting objec-tives for compensation was not exactly business as
66 Catalyst for Change
FIG. 5-1
Project Support Needed for Pilot to be Successful, 2000
Project Support Strongly Agree/ Strongly Disagree/ N Rank*Agree Disagree
Training in objective setting 68.4% 31.6% 345 9
Greater access to student achievement data 70.9% 29.1% 344 8
Better understanding of studentachievement data 71.4% 28.6% 343 7
Help in developing and implementingnew teaching strategies 70.9% 29.1% 340 6
Feedback on the success of my methods 84.8% 15.2% 341 1
Greater clarity on how objectives shouldbe set and measured 83.3% 16.7% 342 2
Ways to set objectives based on the needsof my students 81.1% 18.9% 339 4
More time to analyze data and developmy skills 82.2% 17.8% 342 3
Greater access to technology to analyzestudent achievement 72.1% 27.9% 341 5
*Based on percent strongly agree/agree

usual.They quickly identified areas where greaterknowledge, access, and support would improvetheir objective writing.There was training in set-ting objectives that particularly focused on thesenew elements, but as some teachers would laterreport,“Not enough.”The Spring 2000 surveyresponses show that teachers believed that, for thepilot to be successful, participants would need:greater clarity on how objectives should be setand measured (83%); greater access to technologyto analyze student achievement (72%); and moretime to analyze data and develop their skills(82%).Additionally, 81% indicated that theyneeded ways to set objectives based on the stu-dent needs. (See Figure 5-1) Thus, there was earlyrecognition that setting objectives for compensa-tion purposes did require changes from the priordistrict practice, most notably, the use of baselinedata and the projection of a growth target for aclass of students. Further, there would be conse-quences for the teacher’s performance in relationto the objectives.Teachers asked for more assis-tance to build their capacities in these areas.
Near the end of the pilot (Spring 2003), manyteachers identified positive impacts (See Figure 5-2) of the pilot in the areas of setting expecta-tions for students, having access to data, andunderstanding and using student data in settingobjectives and planning.These are the areas thatthey had identified in 2000 as ones where theyneeded more information and support.Thus, fromtheir own descriptions, most teachers understood
the goals of PFP to be the improvement of teach-ing and learning.They came to recognize theimportance of using achievement data to measurestudent growth, wanted more assistance in work-ing with data and establishing student expecta-tions, and ultimately believed that they or theirschools had experienced positive impacts fromparticipating in the pilot.These teacher percep-tions are discussed in greater detail in Chapter VII.Few identified negative impacts and approxi-mately one-third identified no impact.The itemwith the lowest positive impact—the availabilityof appropriate assessments—is an organizationalissue that has plagued the pilot and is addressed in Chapter VIII.
Perceptions about the Impact on StudentAchievement AreasPay for Performance, as noted above, had gener-ally well-understood goals for improving studentachievement, as well as a required format andprocess for objective setting that prompted teachersto use student achievement data more effectivelyto identify the baseline and measure growth.Acharge of the pilot study was to follow the impactof the pilot on student achievement, not onlythrough analysis of the achievement data but alsothrough teacher perceptions. From the feedbackprovided by pilot teachers in the first two years of the pilot in interviews, the theme of “greaterfocus on student achievement” emerged as onemajor response to questions about the impact of
67The Teacher Perspective
FIG. 5-2
Identification of Impact of PFP, Spring, 2003
Areas of Impact Positive Impact Negative Impact No Impact N
Expectations that I set for my students 63.5% 0.6% 35.9% 345
Timely access to student achievement data 62.2% 4.4% 33.3% 339
Understanding of student achievement data 64.9% 0.9% 34.2% 339
Use of student achievement data to set objectives 66.1% 0.6% 33.3% 342
Use of student achievement data to plan instruction 59.9% 0.6% 39.5% 337
Availability of appropriate assessments to measure growth of my students 54.1% 2.7% 43.2% 338

Pay for Performance. In subsequent years, thefocus on student achievement for the teacher andthe school strengthened; it became the most fre-quent response to questions of impact.
The following sample of teacher responses from Spring 2003 interviews demonstrates that pilotteachers became more articulate about what “greaterfocus” meant to them personally and in theirschools, particularly the impact on school culture:
“With PFP, you don’t forget the goals, and it ispossible to be more consistent over the courseof the year.”–Pilot teacher
“I’m placing my ideas on paper and that isvery helpful to me. By being more formal and deliberate about my objectives, I find that I reflect more on the substance of thedocuments and it helps me communicate my efforts more clearly to others. PFP helpsthe staff focus on analysis rather than justassuming. It allows us to share more with each other at a deeper level.”–Pilot teacher
“I have been observing the dialogue aroundPFP and I think we have a better environmentfor students because of PFP in this school year.We started this year by looking at more dataabout our students and I think many teachersare checking the growth of their studentsmore often. I think teachers are reflectingmore upon the needs of their students than in the past.”–Pilot teacher
“There is a lot more teamwork.We are on thesame page.There is a lot of discussion aboutschool-wide goals.There is lots of focus onstudents who are borderline or below gradelevel.”–Pilot teacher
Survey data also show that there is a significantdifference between the percentage of respondentsin Spring 2002, who felt that the focus on studentachievement had stayed the same (31%) and thosewho felt that there had been an improvement orincrease in focus (64%).This difference increasedagain in Spring 2003, with 68% reporting a positive impact or change in “my school’s focus on student achievement.”Twenty-nine percentreported that there had been no impact on theschool focus.These perceptions are described further in Chapter VII.
Another area where respondents increasinglyattributed a positive impact to Pay for Performanceat a significantly higher level than to “negativeimpacts” or “no impact” is in the expectations that I set for my students. In the Spring 2003 surveyresponses, 64% identified a positive impact as com-pared to those who saw a negative impact (less than1%) or no impact (36%).Thus, by the end of thepilot, the surveys identified three positive impacts inthe student achievement area, each emerging fromthe data at a consistent and significant level:
• Increased focus on student achievement;
• The expectations set for my students; and
• A cluster of positive impact responses aroundthe availability and use of student achievementdata to set objectives and plan instruction.
These are the kinds of changes that should predict positive impacts on teaching and learningand lead to changes in teaching practice.Yet, one-half to two-thirds of teachers surveyed and inter-viewed over the life of the pilot have maintainedthat they have not changed their teaching.Thisapparent disconnect among the responses consti-tuted one of the more puzzling aspects of thestudy and required additional probing to understand.
The ambivalence that pilot school teachers felt about the impact of PFP on their teaching isshown with 53% responding that PFP has had noimpact on “my knowledge and skill in deliveringinstruction” in Spring 2003, though 63% hadreported improvement in Spring 2002. Fewerthan half of the pilot teachers surveyed saw a positive impact of PFP on their knowledge andskill in delivering instruction (47%) or theirknowledge of subject matter (44%).As teacherresearch indicates, these are areas likely to impactstudent achievement.1
Teacher Descriptions of the Objective Setting Process It was important to gain more insight from teachersthemselves about how they engaged in the processof setting objectives and how that process affectedtheir teaching.An interview protocol was designedduring the Spring 2002 interview season for thepurpose of asking a sample of teachers to describetheir processes from beginning to end.Twelve
68 Catalyst for Change

teachers were selected from the 64 randomlyselected pilot teachers already scheduled for springinterviews.The 12 teachers did not know aheadof time that they would be asked to describe theirprocesses with objectives. Of the 12 teachers, twohad been in the district for two years, but hadtaught elsewhere, and another was a new teacherin his first year working on alternative certification.Nine of the 12 had been in the pilot schools for allthree years of the pilot at the time of the interviews.
The interview protocol, administered bythree different interviewers, was comprised ofthe five questions listed in Figure 5-3 withprompts as needed:
The analysis of the objective-focused interviewswas based on how teachers described key decisionsduring the process, what they learned during theprocess, what obstacles they confronted, and howthey thought through the process and its potentialoutcome. Based on the similarities of the responsesof teachers, three patterns of thinking about objec-tives were identified—innate, purposive, and account-able. The three groups of teachers, one for eachpattern detected, are described and discussed below.There were five teachers each in Groups One andTwo and two teachers in Group Three.
The five teachers in Group One are diverse:a first-year teacher, a third-year teacher, a mid-career teacher, and two teachers who have taught25 or more years.They teach in four differentpilot schools.The new teacher admitted that hemade a “muddle of objective setting” and that “itwas a low priority.”All of the other teachers in
this group can describe a full process, though theirdescriptions, until prompted for greater detail, aregeneral or cursory in nature.
The major learning from the objective settingprocess for this group has been around the use of student achievement data and thinking about“reasonable growth,” although they did not refer-ence it as such.The objective process obstacle mostmentioned was the determination of what consti-tutes reasonable growth and how to set a growthtarget that can be reached. Some descriptionsabout how they addressed these issues include:
“I followed the Design Team recommendationfor the first year (3% overall) and then adjustedit in subsequent years based on additional data.”
“I thought about what I could do if I workedreally hard with the kids but without settingmy goal so high that I have no chance of getting there.”
“[Setting growth targets is] pretty trickybecause the levels on the DRA are not even.”This teacher resolved this dilemma by taking a “cut-off ” point of five levels beyond whereeach student started, but he tries to “take students as far as they can go in reading andmath, so setting lower than 100% is not reflective of what I do.”
The descriptions of their processes suggest thatthey relied on their teaching instincts to arrive ata reasonable growth target. Several implied thatthey were allowed to be “less stringent” on PFPgoals so that they could meet them, and at leasttwo mentioned this fact as a problem with theconcept of the pilot.There is a tendency to blamethe pilot for the setting of lower growth targetsthan they might have done without the pilot.One teacher expressed concern that setting onlytwo objectives will “narrow the curriculum.”
Except for the first year teacher, teachers inthis group were certain that they had not changedtheir teaching as a result of PFP. One teacherexplained that there has been “no altering of thecurriculum.” However, while he had thoughtwriting goals a waste of time in the past, he isnow “paying more attention because of the factthat I made a prediction about growth” and wantsto see how it comes out.Another teacher was
69The Teacher Perspective
FIG. 5-3
Objective-Focused Interview Protocol
How do you develop objectives for PFP?
Regarding the objectives you set, what interactions do youand the principal have over the course of the year?
Has setting objectives under PFP had an impact on learning?
What kinds of support or professional development havebeen helpful or would be helpful in achieving the objectivesthat you set?
If you could change anything about how the PFP objectivesetting process is designed what would it be?

“almost insulted” by the idea that she shouldchange her teaching for PFP, a concept withwhich she disagrees. Still another teacherexpressed “shock” that the pilot as she has experi-enced it is “not a negative, even though it is not a positive.” Still another observation:“I think the[objectives] have had an impact on learning. Ican’t say that PFP has had an impact.”
Most, including the very newest, struggle withdifficult-to-teach students and seem to try to dis-tance themselves from the student learning issues.One teacher, in describing options available forstudents who are not learning, noted that sinceparents are informed “there shouldn’t be anybodywho is surprised if they don’t meet the mark.”
In general, teachers in Group One believe intheir own innate teaching abilities and are generallyunscientific about objective setting. One explainsthat he has been “teaching reading successfully fora long time.”The new teacher believes that if hecan just spend more time with his students, theywill learn (provided some other home conditionsare met).Two of the teachers in this group makeseveral “we” statements suggesting that some oftheir process may be collegial, but three do not.Goal or objective writing seems to be what onedoes to meet a requirement not what one does tofocus one’s teaching, engage with one’s colleagues,or improve one’s own performance.
Yet, all of the teachers in this group recog-nized that their use of data in setting objectiveshad improved. Using data to determine the base-line and measure progress is the part of objectivesetting about which this group of teachers saidthe most, but they did not connect this part of theprocess with student outcomes. For one teacher,following data on his students is like an athletemeasuring his personal best. Still another teacherstates the mixed response that is evident in somuch of the perceptual data:
“Has PFP had an impact on learning? Notreally. Has it made me a better teacher? Notreally. But it did help me to use data.We havealways been doing the same thing. Now it’sjust on a piece of paper.”
Each teacher in Group One pondered andresolved the issues of reasonable growth in waysthat satisfied them, but none connected the explo-ration of student data—particularly schoolwide—
with the potential for clearer or more scientificanswers to the question of reasonable growth.Overall, Group One contained both teachers whoare inexperienced and teachers who are wellmeaning but unable or unwilling to use reformsto think systematically about teaching.
The five teachers in Group Two are experi-enced, most having taught from 12 to 27 years,though one had only four years of experience.They teach in five different pilot schools.Two of the teachers talk in first person singular, whilethree speak as “we,” describing school/grade level processes of reviewing data and consideringgrowth and setting a focus.The interviews showpositive talk about participation in the pilot andits potential for their students:
“We embraced PFP from the beginning.”
“There is no doubt about our purpose and focus.”
“With all of this focus, the students have to be the beneficiaries.”
“I’m looking for more techniques that motivate children.”
“Students benefit indirectly from teachergrowth.”
These interviews contain evidence of morepositive attitudes about learning from Pay for Per-formance and about interactions with other staffmembers, students, and the principal:“This staff isstable and loaded with master teachers.”They aregenerally thoughtful about the objective process.A specialist notes that other teachers, in writingPay for Performance objectives, must do “some-thing similar to [what I do to write] my IEP[Individual Education Plan].”There is a mentionin one instance of the need for multiple measuresand for vigilance on the part of principals toavoid dishonesty, indicating some reflection abouthow to improve the process.
Group Two can be best described as purposiveabout objective setting.There is a positive sense ofmotivation and mission in the responses of thesefive, both from past experiences and from PFP,that teachers with “plenty of information” canfocus on areas for improvement and that studentswill be the “beneficiaries.” Giving specific examplesof how they use data and what the limitations
70 Catalyst for Change

of certain data are, they are more scientific abouttheir use of data than the first group, though notnecessarily scientific about teaching choices.Thereis greater motivation than skill in this group.
The two teachers in Group Three had eachtaught over 12 years and were working in twodifferent pilot schools.They spoke as “we” teach-ing at schools where staffs are working togetheron assessment, screening, and gathering informa-tion to establish objectives. One spoke of an analytical tool that the whole staff uses:“We use a matrix to determine where we are strongest,where we need to fine tune, and where we needthe greatest emphasis.” In both schools, there is a collegial relationship with the principal (onenew principal and one established principal).
Without prompting, they elaborated on therelationship of objectives to standards, of researchabout how students learn, and of research on teach-ing (pedagogy) as they describe their processes. Forthese two, students are the basis of their thoughtprocesses:“Students benefit from good teaching;”“We don’t wait until the test results to recognizestudents who may be in trouble.”
They did not claim that Pay for Performanceobjectives had led to major changes in theirteaching, but they did know how objective setting fit into their planning and teachingprocesses, as evidenced in these statements from the two interviews:
“Our objectives have been dictated by achange in our students and their families.”
“We use test scores and areas for improvementin our school’s plan to help us know where weneed to concentrate.”
“I don’t know if PFP objectives are that muchdifferent than any others for teachers who areexpected and determined to move childrenfrom one point to another.”
“We use research and staff development todetermine what is good for students and various ways to teach.”
These teachers were working in higher-per-forming pilot schools.Their interview responsesshow awareness that they are fortunate to haveinterested parents, but there is also a concern that
their schools are in a district with overall low per-formance. One teacher indicates that her schoolcannot establish the baseline by district perfor-mance because the “curriculum for DPS is toolow.” Another remarked:“We dummied downhow we wrote objectives to somewhat fit the DT[Design Team] examples.”They attribute theseissues to the lack of district curriculum leadershipand the quality of the sample objectives provided,not to the district’s students.
The process described by these two teachersmay best be described as confident and accountable.They hold high expectations for themselves, fortheir colleagues, and for their principals in termsof doing what has to be done in order to succeedwith students.They had been using data and setting goals and objectives based on available student data prior to the pilot and distinguishbetween the processes used before and the onesused for Pay for Performance. Confidence is builtnot only through knowledge and skills but alsothrough practice, reinforcement, reflection, revi-sion, and of course, success with students. Cir-cumstances in their schools support continualgrowth in confidence, yet confident and account-able teachers also contribute to the supportive circumstances in the school.
Findings: Objective-Focused Interviews
• Teachers brought different styles of thinking and sets of experiences to the pilot, impacting how theyresponded to the key requirements of writing twoobjectives, selecting assessments, setting growth targets,and conferring with the principal. Descriptionsprovided by the 12 teachers show how theimplementation of the pilot varied not only by school but by teacher, particularly based onstyles of thinking about or making decisionsabout teaching.The descriptions also indicatethe need for differentiated supports for teachers
• Teachers who showed traits of accountability identi-fied how objective setting fit into their planning andimpacted their teaching. They also had a historyof higher rubric levels.Though this examina-tion contains too small a sample to generalizeabout the relationship between the rubric levels and the way interviewees thoughtthrough the objective setting process, there is
71The Teacher Perspective

other teacher research to indicate the relation-ship between teacher planning and account-ability and effectiveness.
• The role of the building principal in the effectiveimplementation of the objective process was apparentin the teacher descriptions. Among the teachers in Groups Two and Three, there were signs ofpositive attitudes, expectations, and interactionswith their building principals even when theywere new in the principal role. Except for thenew teacher who “adored” his principal, theteachers in Group One could not articulate aclear process of interaction with their princi-pals on objectives—or where they did, theinteractions were more perfunctory than stu-dent-based. Group One teachers did indicatethat they would like more interim feedbackfrom the principal to know how they weredoing, and they had vague notions that theirprincipals would help them if they asked,which pales in comparison to the principals of schools who were noticed as frequent class-room observers and participants in grade leveldiscussions of objectives. Often, the teachers inGroup One were looking to the Design Teamliaison for leadership and feedback, hoping for more support from that quarter or againbelieving that it was there for the asking eventhough they had not asked to date.
• The importance of teacher dialogue and/or collabo-ration on the individual teacher’s perception of theirown processes was evident in both Groups Two and Three. Those who were talking as “we”articulated a more thoughtful process and were more confident about their decisions.It was evident that they had talked through or explained their decisions and rationales in other venues—either with colleagues or principals—and needed little prompting todescribe how they had approached andthought about the PFP objectives.
This set of interviews provides insights intowhat teachers brought to the objective settingprocess in the form of intellectual processes andexpectations for themselves and their students andwhat they had received at that point in the formof new or deeper understandings, professional
dialogues, and principal support.In conjunction with other data, the teacher
responses make the point that a “grass roots”approach to reform, that is, one which leaves thehow of implementation to individual teachers, willsucceed or not based on the skill, commitment,and accountability of those teachers and the com-mitment and support of the building principal.The study in the next section pursues this ideawith a more structured and representative sampleof teachers.
C. Changing Classroom PracticeAs has been noted, the intent of the Pay for Per-formance pilot was to link teacher compensationto increased student achievement.The assumptionthat underlies the design of the pilot is that as anoutcome of setting an objective and potentiallyearning a bonus, teachers will teach differently, andconcomitantly, student achievement will improve.
Yet when asked about the impact of PFP onteaching practices, pilot teachers often respondedin surveys and interviews over a period of fouryears that they had not changed their teachingpractices in order to attain their objectives.A typi-cal comment is “I’m not doing anything differ-ently.” However, responses to other survey andinterview questions indicate that, for a preponder-ance of teachers, there was an increased focus onstudent achievement, an increase in the under-standing of student achievement data, a greateruse of student achievement data in planning, andan increased understanding of the need for greateralignment between objectives, instruction andassessment. Many practitioners would say thatthese changes are doing things differently and thatthe nature of changes identified are ones recognizedin research literature as potentially contributing toincreased student achievement.
These outputs of teacher processes (objectives,changes in teaching practice, uses of assessments,attainment of results, student achievement) hadbeen largely understood through three years ofteacher interview and survey data as well as availableartifacts and documents.To augment the under-standing of teacher processes, the final year of thestudy added a special component in addition tocollecting and analyzing the fourth year of
72 Catalyst for Change

perceptual data. Notably, CTAC conducted a qualitative study with 16 teachers, seeking a deeper understanding about the relationshipbetween Pay for Performance and changes inteaching practices. Figure 5-4 demonstrates thebasics of the PFP processes with the shaded box showing the area of interest for the qualita-tive studies:
In the fall and winter of 2002-2003, thedeeper qualitative study was designed to gainmore teacher perspective on how PFP impactsteaching.The focus was on learning more from 16 teachers in four representative elementary pilotschools about how Pay for Performance affectsteaching and learning.
Sixteen Teacher StudyTen pilot elementary schools were eligible for thedeeper qualitative study based on the number ofyears in the pilot and the elementary grade span.The ten schools were ranked on the selection crite-ria and four schools were identified as the most rep-resentative of the range of pilot elementary schools.
School selection criteria for the study included:(1) math, reading, and writing performance on the Colorado Student Assessment Program (CSAP); (2)school demographics (English language proficiency,free/reduced lunch, mobility, ethnicity); and (3)teacher demographics (years experience, years in theschool, ethnicity, mobility, advanced degrees). Fourteachers from the four schools were invited to par-ticipate.The names of the schools and participantsare not used in this report.
Three classroom teachers and one specialist/special subject teacher/special education teacherin each of four elementary schools selected as rep-resentative of the elementary pilot schools werechosen.The selection criteria included: (1) theiryears in the pilot (no fewer than two) and (2) theirpotential to add new voices (not teachers whohad been interviewed in the last year).The fourspecialists/specials were selected based on full-time assignments in the school in special educa-tion classrooms or in subject matter classes, such as music and physical education.The selection alsoallowed for observing ability grouping (Englishlearners and gifted), heterogeneous grouping, andpull out instruction.The group also included analternatively certified teacher.
On three different visits, the research team (1)observed all sixteen classrooms or workspaces forone full day; (2) conducted four 90-minute after-school focus groups, comprised of the teacherparticipants; (3) made two additional partial dayvisits to the classes; and (4) conducted a secondround of 90-minute focus groups, comprised ofthe same teacher participants.This study involveda total of 12 hours of focus group interactions andmore than 160 hours of classroom observation.
Findings: Sixteen Teacher StudyThe key findings of the deeper qualitative study—as related to a positive relationship between thepilot and changes in classroom teaching prac-tices—indicate that:
• The teachers in the study did not interpret thepilot implementation as requiring changes in theircore teaching practices in order to improve studentachievement. They were, in fact, told by Asso-ciation representatives and at least one principalthat they could earn a bonus for “doing what
73The Teacher Perspective
FIG. 5-4
Pay for Performance Processes
ObjectivesEach teacher writes two objectives and provides evidenceof student attainment to the principal.
PFP StudyEach objective is evaluated along with other related documentary evidence, student achievement data, and interviews and surveys.
Teacher Practices and Student AchievementHow does writing objectives lead to changes in practicethat may increase student achievement?
Principal DecisionTeacher either meets or does not meet objectives. (Around 90% currently meet objectives.)
Cost Teacher receives extra pay. Cost to district = $855,250 (01-02)
PFP StudyDoes student achievement improve on independent measures? How does pilot improvement relate to objectives? to control school improvement?

they already [did].”Another principal encour-aged the staff to participate, reasoning thatpay for performance could be the wave ofthe future; thus the school should get intothe pilot and find out about it.Thus, as areform, it was something to try out and findout about.
• The teachers in the study implemented the man-dated elements of PFP: write two objectives basedon baseline data, set growth targets, assess, and pro-vide evidence of attainment to the principal. Theseelements are the fundamentals that all teachershad to complete in order for their schools tobe a participant.At least half of the teachers in the study indicated that the objective set-ting process had been more onerous thanexpected, particularly in “paper work,” thatchanges in the format for objectives had comeabout each year, and that the availability ofassistance has been inconsistent. Several hadproblems with the technology when enteringtheir objectives. Nonetheless, they all tried to comply and meet the requirements of themandate.All 16 teachers agreed that settingobjectives for student growth based on baseline data is what they should be doing,though several said their school would haveused baseline data anyway or, in the case ofone school, were already using baseline datawithout a bonus.
• Most of the teachers in the study did think thatthey have had better access to data and that theywere currently using student data more systemati-cally as a result of PFP. However, three teachersof the 16 were adamant that any changes in the way that they use student data areattributable only to the Colorado Student Assessment Program, which pressures them toimprove student achievement scores. Otherssaw both PFP and CSAP as influential ontheir use of data.The OASIS system was valuedbut its development was not attributed to thepilot. Interestingly enough, the teachers in thegroup that seemed to engage with the studentdata most readily and to see potential for theimpact of better student assessment data ontheir teaching were special subject teachers:(1) a special education teacher sees the PFP
process in light of the individual educationplan process and helps other teachers in theschool write measurable objectives; (2) a physi-cal education teacher measures students (largenumbers of them) by his own written andperformance assessments, but follows theirreading and math scores to see if there arerelationships; and (3) the GATE teachersphilosophically prefer authentic assessments,but understand that doing well on standard-ized tests is important to their students and maybe a quality indicator of their program.
• The teachers in the study were articulate about whyand when they do change their core teaching practices.As teachers in the first focus group sessionstalked about why and how they do or do notchange their teaching practices, a model ofconcentric circles emerged: the core practicesin the inner circle, primary or immediateinfluences on core practices in the second circle; and secondary or potential influences in the outer circle. In the second focus groupsession, participants reviewed the model, maderevisions, and elaborated on it.
Levels of Influence on Core PracticeFigure 5-5 shows the graphic developed with theteachers in the focus group to help explain whyand when they make changes in their practices in order to implement new programs or goals.
The graphic describes how teachers in thequalitative study talked about their practice andwhat has influenced them to change. Items inLevel One are the most likely to penetrate core practice.The teachers in the study are relatively experienced, and as they suggested,new teachers might place some of the elements in different categories. For example, teacherevaluation may be more influential on anuntenured teacher.
Pay for Performance and the Levels ofInfluence SchematicWhere does Pay for Performance reside in thisschematic? Level One or Two? As teachers in thestudy describe the influences on their teachingpractices, PFP resides in Level Two, not immedi-ately influential on core teaching practice. How-
74 Catalyst for Change

ever, some features of PFP, such as theincreased focus on student achievement,use of baseline data and more effectiveuses of data at the end of the year (to seehow they have done), reside in LevelOne and have become part of core prac-tice at least for the duration of the pilot.One group insists that increased focus onstudent achievement is a result of CSAP,not PFP, and that the school was “alreadydoing all of this, anyway.” Most of theteachers believe that they will continueto use what they have learned from thepilot even if it does not become institu-tionalized or if additional compensationdoes not continue. Several teachers con-fessed that now that they were used tothe process and knew how to write asuccessful objective, they would just assoon that Pay for Performance continuedso they got the bonuses.
Study participants said that districtor state mandates influence their corepractice even when they do not agreephilosophically with the change. As thestudy was underway, teachers in three ofthe schools were implementing a newdistrict literacy program.They used thisprogram as an example of a change inpractice because it is mandated. Earlyon, they thought that the program,which was prescriptive, was makingthem worse teachers, but as the yearwore on, many felt less negative aboutthe program and more certain that theycould make the required changes.
The mandated part of PFP (e.g.,what each school agreed to as part ofjoining the pilot and becoming eligiblefor bonuses) is to write two objectivesfor student achievement based on baseline data (prior year usually), desig-nate the expected attainment orgrowth, and measure it at the end of theyear for additional compensation. Basedon the reports of most of the teachers inthe study, these objective setting andmeasuring activities have become partof their core practice. But most do not
75The Teacher Perspective
FIG. 5-5
Level of Influences on Change in Teaching Practice
Secondary or Potential Influences that may Change Teaching PracticeThis level contains elements more removed from what teachers see astheir core work. The elements may actually be completely external to ateacher’s situation or they may be internal elements from which teachersdistance themselves. If such elements are internal, they may be describedas “administrative or paper work” or be perceived as something thathas to be done but which has little or no impact on day-to-day teachingpractice, such as teacher evaluation; standardized assessments (withoutaccountability); objective setting; parent/school governance structures.General reforms that may be identified as good ideas but do not seemrelevant to their situation or for which they do not have enough time inthe day may also be in this area. They may also dismiss such reforms,believing or saying “I/we already do that.”
Primary or Immediate Influences that are Changing Teaching PracticeThis first level can be described as an internal change environment thatcontains elements pressing the teacher’s practices such that there is alikely chance of penetrating the core. The teachers in the study identifyinfluential elements in this environment as the following: agreementswith colleagues (grade level articulation); new school focus, which maybe articulated by the principal or come from the school plan or both;district-mandated programs; state-mandated assessments that labelschool performance; and new textbook series. Teachers may be tryingout new practices, evaluating and incorporating them or parts of theminto their core practice. These new practices may look different as inte-gration occurs or they may become add-ons to the core practice.
Core Teaching PracticeThe core teaching practices, described by the teachers in the study as“my style,” “the way I do things,” “what I know works,” and “I knowwhat’s best for my kids,” represent sets of teaching strategies (pedagogy)and styles of interactions with students (interpersonal relationships) in use by teachers. The core is personal and may be perceived by theteacher as an outgrowth of his or her personalities and ethos, basedon particular talents or skill sets that are unique to the person, and/or based on teaching experience. It may reflect what one believes aboutthe nature of teaching and learning or about the developmental needs of their students, though these beliefs may not be articulated explicitly.
Prim
ary or Immediate InfluencesCore
Teaching Practices
Seco
ndary or Potential Influences

believe that they have fundamentally changedthe way that they teach as a result of PFP.
When asked what they believed the districtand the Association expected to happen when the pilot was initiated, they said that the districtwanted higher test scores and more accountabilityfrom teachers and that the Association was support-ing the pilot in order to find out what a pay for performance or merit system is all about.Some teachers in the study observed that thoseteachers who are not philosophically in favor of performance-based compensation may beunwilling to attribute positive results or changesin their teaching to the pilot even where theyactually exist.
To answer the key question of the study,the work with the 16 teachers showed that theapparent inconsistency in the data—changes in focus, use of baseline data, and awareness of student growth versus no changes in classroom practice attributable to the pilot—is a function of how teachers compartmentalize and separatetheir planning and assessment functions from“teaching activity” in the classrooms when think-ing and talking about their practices.The productof their explanations of how they conceivedchange in practice is captured in Figure 5-5.
The qualitative study, like the objective-focused interview study, underlines the signifi-cance of a teaching staff ’s engagement with thebuilding principal and with one another in pur-suit of the best teaching practices on behalf ofstudents. One teacher summed up what hadbeen a theme in all of the focus group sessions:“I would rather any day to have good leadership,professional development, and time with my col-leagues than $1500.” Professional developmentwas best for these teachers when they couldlearn with their building colleagues and principals.Some teachers in the study felt limited by whattheir students brought to the classroom; others feltempowered by the challenge, but most longedfor better professional development and collegialinteractions that would assist them with difficult-to-teach students. It is a reminder that teacherscannot change when they do not learn new orbetter practices to adopt.2
D. The Credibility and Fairnessof Objectives for CompensationPurposesIn the mid-point report, several concerns relatedto the fairness of using objectives as the basis ofcompensation were identified from teacher inter-views and surveys: (1) the diversity of students;(2) the potential for other teachers setting lowerexpectations or otherwise manipulating the data;(3) the fallacy of judging student outcomes onone measure; (4) the issue of judging teachersbased on what their students do; and (5) the useof standardized tests as a measure of student per-formance. Other fairness issues not directly relatedto objectives included the potential for principalbias or gaps in skills and knowledge to influenceoutcomes; and the variation in the way specialsubject teachers, and specialists (non-classroomteachers and other service providers) were developing and assessing objectives in the elementary schools.
In the last two years of the pilot, while severalissues continued to be of high importance toteachers, specific efforts and pilot learningsremoved some of the concerns. For example, adifferentiated rubric was developed for specialsand specialists. Secondly, teachers came to under-stand that student diversity is controlled for in theprocess by (1) using baseline data and (2) allowingexpected growth percentages less than 100.Thefollowing chart (Figure 5-6) shows the results fromthe Spring 2003 survey where teachers were askedto indicate the conditions or supports that wouldincrease their confidence in a compensation planbased, in part, on student achievement.
In 2003, pilot teachers considered the mostimportant condition of a compensation plan to be that “each student’s growth is measured fromhis/her starting point at the beginning of theyear” (93%).This same criterion was also rankedfirst (95%) in the 2002 survey.The second rankedcondition is that “teachers are able to set objec-tives for student achievement in their class” (91%),indicating that school or district-establishedobjectives were less desirable than teacher-devel-oped objectives.The third ranked criterion forboth 2002 and 2003 is “alternate measures of student achievement for use by specials, specialists,
76 Catalyst for Change

77The Teacher Perspective
FIG. 5-6
Conditions and Supports for Confidence in Compensation Plan, Spring 2003
Compensation Conditions Strongly Agree/ Strongly Disagree/ N Rank*Agree Disagree
District standards, instruction, and assessments are aligned. 84.9% 15.1% 357 4
Teachers are able to set objectives for student achievement in their class 91.0% 9.0% 366 2
Each student’s growth is measured from his/her starting point at the beginning of the year 93.1% 6.9% 363 1
Teachers use district-approved assessments that are appropriate for their grade level and subject matter 72.2% 27.8% 360 8
Assessments administered using consistent and standardized procedures across the district 72.6% 27.4% 361 7
The relationship between the formal teacher evaluation system and a compensation plan is clearly defined 77.0% 23.0% 357 6
One measure is used to gauge student achievement in the compensation plan 37.1% 62.9% 356 9
Two or more measures are used to gauge student achievement in the compensation plan 78.0% 22.0% 355 5
Alternate measures of student achievement are available for use by specials, specialists,and special educators 89.7% 10.3% 360 3
Compensation Supports
The principal has the skills and knowledge to administer a compensation plan fairly 80.2% 19.8% 364 5
Professional development addresses the learning needs of students in my school 86.3% 13.7% 364 2
Professional development addresses the appropriate administration of assessments 77.3% 22.7% 362 6
Professional development addresses the appropriate use of assessments 81.1% 18.9% 360 4
Teachers have ready access to student achievement data 89.9% 10.1% 366 1
An opportunity to work on student achievement issues with colleagues 86.2% 13.8% 363 3
Parent knowledge of and support for the compensation plan 64.2% 35.8% 355 7
*Based on percent strongly agree/agree

and special educators” (93% in 2002; 90% in2003). In both 2002 and 2003, an important con-dition was the use of two or more measures ofstudent achievement (93% in 2002 and 78% in2003). In Spring 2003, this was further confirmedwhen only 37% of the respondents supported theuse of one measure to gauge student achievement;however the steady decline of this condition mayindicate that many pilot teachers had becomecomfortable with a single measure.
The most important support identified in the2003 survey was ready access to student achieve-ment data by teachers (90%). Respondents alsoidentified the need for professional developmentthat addresses the learning needs of the students intheir school (86%) and an opportunity to work onstudent achievement issues with colleagues (86%).
From the early years of the pilot to the lateryears, teacher participants have gained experienceand sophistication with the concept of pay for performance.Although the items in the last surveyare ranked by the largest percentage of stronglyagree/agree, they are mostly all of high importanceto people who have been involved with the pilot.
Interview data for this same year (2003) indi-cate that pilot teachers as well as some controlschool teachers and central administrators are stillconcerned about (1) the potential for individualsgaming or rigging the system; (2) the potential forprincipal bias in the signoff of the objectives; (3)the inequity between classroom teachers and spe-cials and specialists; and (4) issues of inconsistentadministration from school to school (i.e., thatsome principals are more lenient than others).
Surprisingly, the emphasis on principal bias,identified earlier in the pilot, has tilted somewhattoward the bias that teachers may have on theirown behalf:
“Assessments—how can you grade your ownwork?”–Pilot teacher
“I think there is always going to be a way for teachers to try to beat it or cheat it (PFP)which will affect the results.”–Pilot teacher
“The process (PFP) is flawed—teachers writetheir own objectives, do their own testing, mayeven make up their own tests, do their ownscoring.There are differences in the grading/
scoring. Even with an open rubric, it requiresteacher judgment. No one checks the scoring—just look at the outcomes. It’s bad because theycreate their own objectives and decide whomto exclude.”–Pilot teacher
“I would like to see guidelines changed so that teachers can’t set a target lower than80%.”–Pilot principal
“I could see a danger in what goals are set andthe care or lack of care that some principalsmight take in checking the appropriateness ofthe goals.”–Pilot teacher
Interviewees had many suggestions for improv-ing Pay for Performance, indicating that for most, it is workable but revisions are still needed.Many of their recommendations are discussed in Chapters VII and VIII. Some examples follow:
“I think that with PFP we’ve gotten a lot ofinformation on how to write objectives andhow to use OASIS. But it’s missing the humanelement. How can we make this more success-ful? How can we hone in on making studentsachieve? Maybe focusing more training onclassroom skills and management … how they[teachers] can operationalize their objectives,giving teachers tools.”–Pilot teacher
“The principal signs off on whether theobjectives were met or not met. If the teacheris not on the same page as the principal, thiscould be a problem. Maybe there needs to bea committee of staff, colleagues, principal, anda community person.”–Parent
“There isn’t much equity among objectives. Iwould like to see the bar raised on objectives.Objectives can be changed mid-course whichallows people to lower the bar if kids aren’tdoing well.”–Pilot teacher
E. Pilot Principals and TeacherEvidence of AttainmentAs explained earlier in this report, Pay for Perfor-mance relies on an objective setting process thatincludes the concurrence of building principals,who then, review the body of evidence or dataprovided by a teacher to confirm that he or shehas met the objectives.As indicated above, there
78 Catalyst for Change

is concern among teachers that there is an incon-sistency in the way principals carry out theirobligations in this process. In the Spring 2003 survey data (see Figure 5-6), more than 80% ofpilot teachers agreed or strongly agreed that aprincipal with the skills and knowledge to admin-ister a compensation plan fairly is important totheir confidence in a compensation plan that isbased, in part, on student achievement.Addition-ally, teacher and principal interview data indicateconcerns about the variation in the process bywhich principals review the “bodies of evidence.”
In order to gain a picture of how principalsrespond, five sets of evidence presented by teach-ers to principals were gathered from a sample of five elementary schools.The samples werereviewed for eight factors. Figure 5-7 shows thepresence of the following eight factors related to the data collected.a. Individual assessment scores for students for
each classroom, which are important becauseexpected growth is based on the number or percent reaching the target and not the classperformance average
b.Pre-test scores for each student
c. Post-test scores for each student
d.Use of the Design Team Reporting Form,which, if used, will show that teachers havenot reported averages
e. Supporting data, if needed
f. Objectives attached
g.Presence of the principal’s organizational system for PFP
h.Evidence that PFP records are maintainedfrom year to year
As Figure 5-7 demonstrates, how principals arereviewing evidence to determine whether teach-ers have or have not met their objectives appearsinconsistent among the five schools reviewed.Theprincipal of School One has a system for collectingthe objectives, a cover sheet for listing teachersand met/not met status, and a system for recordingand following teacher attainment for the purposeof giving feedback and suggestions; the principalof School Three has a consistent process andrecord as well.The principals of Schools Two andFour do not have a consistent method or record,and the principal of School Five “does not lookfor data at the beginning of the year becauseteachers know how to use data and are trusted to set appropriate objectives” and does not believe itnecessary to keep any of that information.
The concerns of both teachers and principalsabout the consistency of effort may be wellfounded.The fact that principals show inconsis-tent efforts and skill in working with data thatteachers present at the end of the year leads to aperception of unfairness whether it exists or not,but mostly, where the principal’s process is notthorough, opportunities for that principal to exerta positive influence on student achievement and
79The Teacher Perspective
FIG. 5-7
Bodies of Evidence in Five Schools, 2003
Desirable Attributes of Bodies of Evidence Reviewed by Building Principals School One School Two School Three School Four School Five
Individual assessment scores for each classroom Yes Partial Yes Mixed No
Pre-test scores for each student Yes Yes Yes Mixed No
Post-test scores for each student Yes Yes Yes Mixed No
Design Team Reporting Form used Yes No No Mixed No
Supporting data (if needed) Yes No Yes No No
Objectives attached Yes No Yes Mixed No
Principal has organizational system for PFP records Yes No Yes No No
Records are maintained from year to year Yes No Yes No No

teacher growth through the PFP process may belost. Principal interviewees point to several factorsthat may have led to uneven principal motivationand processes with the PFP evidence: (1)turnover; (2) inadequate communication from thedistrict about the pilot; (3) lack of professionaldevelopment in how PFP aligns with the role ofthe principal in improving student achievement;(4) a feeling on the part of principals that thiswork was heaped on an already full plate withouttheir input; (5) a new supervisory structure forprincipals; and (6) dissatisfaction with a merit paysystem that had been implemented for principalsprior to PFP.
Nonetheless, principals at the pilot schools and control schools are identifying the potentialof a good objective setting process in maintaininga focus on student achievement and fostering a dialogue among teachers about student growth.Recommendations for professional developmentfor principals are contained in Chapter IX.
F. SummaryLooking at Pay for Performance from the per-spective of the pilot school teacher, one can seethat the outcomes of the pilot have been greatlyinfluenced by: (1) the manner in which teachers
were invited or persuaded to join a pilot for thestudy of a compensation plan linked to studentachievement; (2) the skill, commitment, andaccountability that each teacher brought to theimplementation; (3) the lack of district direction,assessments, and staff development supports; (4)the helpful role of teacher collegial structures; and(5) the skill, commitment, stability, and account-ability of the building principals.
Nonetheless, the learning for teachers in thepilot schools has been exceptional. Regardless ofwhat happens to Pay for Performance, pilot teachershave learned about and can talk about objectivesin such a way that it is unlikely that they willreturn to previous objective-writing practices.Even among the lesser skilled and naysayers, theconcept of a well-scaffolded objective has caughton; among the more skilled and open teachers,a well-scaffolded objective has become the pre-cursor to greater student growth.The ability tocraft objectives is improving.
There are clearly teachers who believe thatPay for Performance will work with some neededimprovements to the instructional delivery systemand the quality of school leadership, both ofwhich should be strengthened whether or notthere is Pay for Performance in the district.
80 Catalyst for Change

QuantitativeAnalyses
A. IntroductionThe fundamental measurement of student achievement in the design of Pay forPerformance is at the classroom level: the classroom teachers establish objectivesbased on an assessment of their own choosing and measure student attainmentat the end of the year. Inherent in this model are the personal and professionaljudgments of the teacher and principal which represent a depth of understand-ing about teaching and learning with a particular group of students. However,these individual classroom level results are not comparable within or acrossschools. For this reason, the study design includes an independent analysis ofstudent performance on two standard measures, the Iowa Test of Basic Skills(ITBS) and the Colorado Student Assessment Program (CSAP). These standardizedtests provide a consistent measure with which to compare student achievementbefore and after the pilot and between pilot and control schools.
This chapter describes the analysis of student performance conducted by CTACon these two standard measures. Measuring student achievement on standardmeasures has its own limitations as well. First, the Denver Public School curriculumis not clearly aligned to either test. Secondly, the pilot coincided with a time inthe district when these assessments were in flux.The CSAP, a new assessmentfor the state of Colorado, was phased in over the life of the pilot. Althoughdesigned to be a criterion-referenced test, the CSAP has been scaled to allowfor year-to-year comparisons of individual students.There has been a de factophasing out of the ITBS in the district coincident with the first year of the pilotwhen the state test gained more importance in the district and schools. Finally,the district administration of the assessments does not involve clear criteria forstudent exclusions and allows principal discretion in exempting students from
VIC H A P T E R

the assessment.Thus, the analyses indicate notonly variations in practice across schools, but alsonon-random exclusions. In particular, studentswho are not English proficient are more likely tobe excluded.The assessments with their changesand limitations are discussed in Chapter III.
In order to analyze the effects of the pilot onstudent achievement, CTAC uses two statisticalmethods—Hierarchical Linear Modeling (HLM)and Individual Growth Modeling (IGM), whichare explained in Chapter III and will be elabo-rated upon in this chapter.Teachers, in settinggrowth targets and reviewing the evidence ofattainment at the end of the year, are able to takeinto consideration each student’s past performancealong with features of his or her current behaviorand performance.This can be seen in the condi-tions and expectations set forth in objectives. Forexample, the attendance record of a student or hisor her level of language acquisition may be consid-ered by the teacher in setting expectations. CTACdoes not have access to all of these factors underconsideration when attainment of teacher objec-tives is reviewed. However, the HLM and IGMmodels are able to control for differences inschool and student characteristics which areknown to affect student achievement.
B. Design FeaturesOutcome Measure: Normal Curve Equivalent ScoreThe quantitative study design employs the use of normal curve equivalent (NCE) scores ratherthan scale scores.The NCE indicates where a student ranks relative to a reference population of other students in the same grade on a normaldistribution curve.A difference of zero betweenthis year’s NCE score and last year’s NCE scoremeans that a student has achieved the academicgrowth expected for one year of development and instruction.This property of the NCE makesit possible to interpret a positive slope, or anincrease in score over time, to mean that the stu-dent is performing better than expected based onprevious scores—or attaining more than anexpected year of growth. Conversely, a negativeslope indicates that the student is not achieving as
expected relative to the reference population,given that student’s past performance. It is impor-tant to note that NCEs are not grade equivalentsand that a statistically significant increase in NCEsfrom one year to the next is not a measure of thenumber of academic years increased.
Choice of ITBS and CSAP; Need forWeightingAdministration of the Iowa Test of Basic Skills(ITBS) was mandatory for all schools at the timethe study began. During the study period, theColorado Student Assessment Program (CSAP) wasphased into use in all schools.The CSAP, althoughnot originally designed to make comparisonsacross years, has now been scaled, allowing year-to-year comparisons for the same student. CTACconverted the scale scores into normal curveequivalents, using the local school district as thereference population.The ITBS normal curveequivalents are referenced to a national population.The ITBS and CSAP assessments each have threecomponents: the ITBS has Reading, Language,and Math tests, while CSAP has Reading,Writing,and Math tests. During the phase-in period theCSAP was not administered to every grade, andthe individual component tests were not alladministered to the same grades.This means thatfor analysis purposes, two consecutive years of testscores are not always available.
The ITBS is given in the fall and spring.Thisanalysis uses only spring scores because testing inthe fall is unusual in the Denver schools.
Unfortunately for the pilot’s purposes, ITBStesting became voluntary rather than mandatoryin the district during the first year of the pilot andtesting rates fell dramatically in both pilot andcontrol schools.Although CSAP is state mandated,testing rates for CSAP also differed across schoolsand grades.An analysis of testing rates by studentdemographic factors showed that testing was notrandom for both ITBS and CSAP. For example,Figure 6-1 shows that with the exception of highschools in 2001, the ITBS and CSAP reading testswere least likely to be administered to non Englishproficient students, while for the most part bilin-gual students were more likely to take the tests thannative English speakers.Variation at the school
83Quantitative Analyses
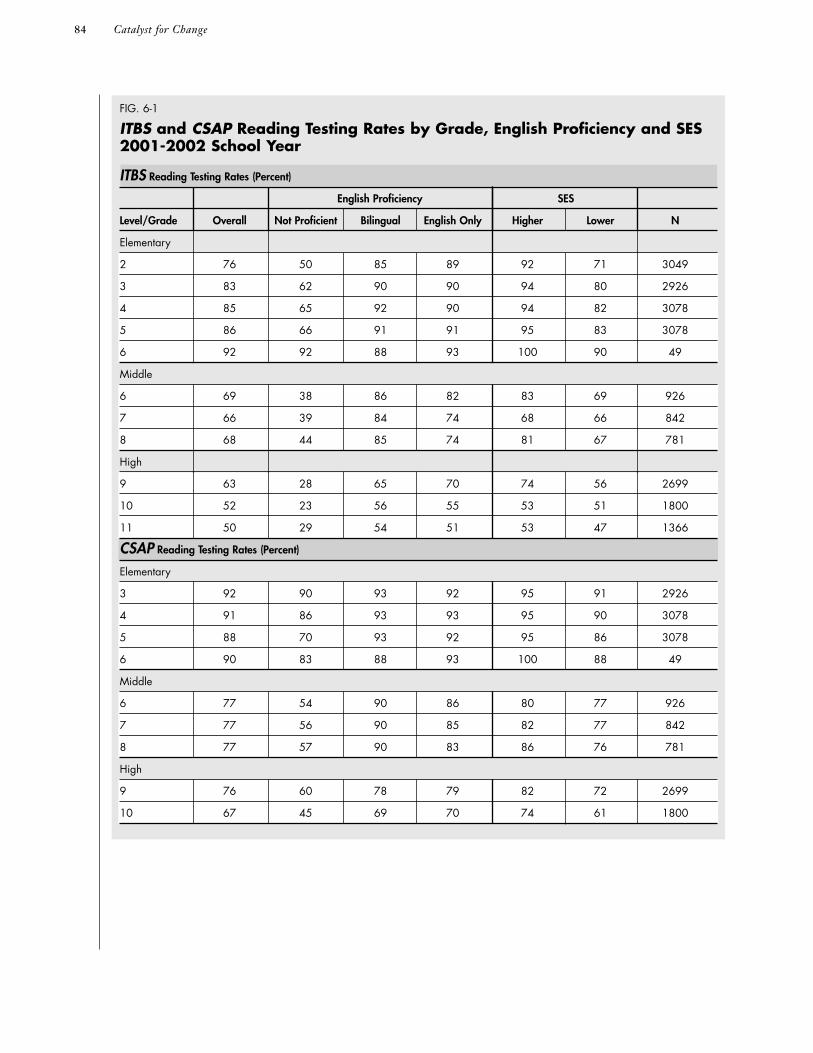
84 Catalyst for Change
FIG. 6-1
ITBS and CSAP Reading Testing Rates by Grade, English Proficiency and SES2001-2002 School Year
ITBS Reading Testing Rates (Percent)
English Proficiency SES
Level/Grade Overall Not Proficient Bilingual English Only Higher Lower N
Elementary
2 76 50 85 89 92 71 3049
3 83 62 90 90 94 80 2926
4 85 65 92 90 94 82 3078
5 86 66 91 91 95 83 3078
6 92 92 88 93 100 90 49
Middle
6 69 38 86 82 83 69 926
7 66 39 84 74 68 66 842
8 68 44 85 74 81 67 781
High
9 63 28 65 70 74 56 2699
10 52 23 56 55 53 51 1800
11 50 29 54 51 53 47 1366
CSAP Reading Testing Rates (Percent)
Elementary
3 92 90 93 92 95 91 2926
4 91 86 93 93 95 90 3078
5 88 70 93 92 95 86 3078
6 90 83 88 93 100 88 49
Middle
6 77 54 90 86 80 77 926
7 77 56 90 85 82 77 842
8 77 57 90 83 86 76 781
High
9 76 60 78 79 82 72 2699
10 67 45 69 70 74 61 1800

level (not shown here) is greater. Exemptions fromstandardized testing for students with disabilities orstudents who are not English proficient, are at thediscretion of each school. Rather than excludingnon-English speakers and students with disabilitiesfrom the analysis, we chose to weight the data toreduce the possibility that pilot effects are due todifferences in testing policy between pilot andcontrol schools.
In particular, low SES (socioeconomic statusbased on student participation in the free andreduced lunch program) and non-English proficientstudents were tested at lower rates across schools,thus the data have been weighted to reflect thepopulation distribution of SES and English profi-ciency within year, school, and grade.The rate oftesting also differs within standardized test—studentsare less likely to take the Math, Language andWriting components than the Reading component.Thus, six weights were developed, one for eachtest component. By weighting, we reduce thepossibility that a difference in achievement isattributable to differences in testing policiesbetween schools, rather than due to the pilot.The results of the weighting process for the ITBSReading test sample for the baseline year arefound in Figure 6-2. Looking at the elementaryschools, we see that the actual percentage of stu-dents who are not English proficient is 25% forthe pilots and 21% for the controls, based on thestudents present in October. In the sample of stu-dents who were tested in the baseline year, non-English proficient students are under represented—20% of the pilot group and 15% of the controlgroup. In the weighted sample, the distribution is closer to the actual population distribution—24% of the weighted pilot students and 20% ofthe weighted controls are non-proficient.Theweighted sample does not precisely reflect theOctober school population since some of the proficiency/SES groups within schools had nostudents tested.
Pre/Post—Pilot/Control ComparisonsAs mentioned earlier in this chapter, the slope (orchange) in NCEs over time have the useful prop-erty of measuring whether students have attainedless than a year’s expected growth (a statisticallysignificant negative slope), a year’s growth (a slope
which is not significantly different from zero), ormore than a year’s growth (a statistically significantpositive slope).To measure the effect of Pay forPerformance, the analysis compares the average ofthe slopes of pilot school students to the averageof the slopes for control students.A positive andstatistically significant slope for the pilot studentsindicates that pilot students attained more than ayear’s growth. However in order to assess whetherthis increase would have happened without thepilot treatment, we also compare the pilot slope to the slope for the control students. If the controlslope is equal to or higher than the pilot slope,we conclude that the pilot treatment has notincreased student achievement—or that theincrease seen in pilot student scores would havehappened without the pilot treatment.
Thus it is the difference between pilot andcontrol slopes in the current analysis which measuresthe effect of the pilot.A positive difference whichis statistically different from zero demonstrates thatthe pilot had a positive effect on student achieve-ment over the course of the study period. Similarly,a negative difference in slopes demonstrates thatthe pilot had a negative effect on student achieve-ment.A result that is not statistically different fromzero demonstrates that the pilot had no effect onstudent achievement.
Pilot School SelectionThe Design Team presented the PFP pilot to mostof the elementary schools, and invited all of themiddle and high schools to join the pilot. Followinga presentation, the teachers voted on whether ornot to participate. Schools at which 85% (later67%) or more of the teachers voted affirmativelybecame pilot schools.A full list of pilot and controlschools is found in Chapter III. Manual HighSchool underwent a major reorganization duringthe first year of the pilot, so separate analyses wereperformed for the two pilot high schools, becausethe effect of the reorganization of Manual cannotbe separated from the effect of the pilot.
Allowing schools to self-select has the advantageof gaining the cooperation of teachers, but it alsoposes a threat to the validity of the research.Theremay have been an unmeasured (or impossible tomeasure) ‘latent’ characteristic that caused someschools to select into the pilot. For example, one
85Quantitative Analyses

86 Catalyst for Change
FIG. 6-2
Demographics for ITBS Reading Sample, Baseline YearUnweighted and Weighted, by Level of School
October Count Unweighted Sample Weighted Sample
pilot control pilot control pilot control
n % n % n % n % n % n %
Elementary Schools
Not English Proficient 948 25 1980 21 614 20 1118 15 690 24 1352 20
Bilingual 585 15 1336 14 500 16 1141 15 430 15 1035 15
English Only 2327 60 6037 65 1942 64 5300 70 1720 61 4408 65
Any Disability 592 15 1379 15 462 15 1106 15 446 16 969 14
No Disability 3268 85 7974 85 2594 85 6453 85 2394 84 5826 86
Male 1950 51 4820 52 1542 50 3900 52 1409 50 3563 52
Female 1910 49 4533 48 1514 50 3659 48 1431 50 3232 48
Lower SES 2762 72 6952 74 2121 69 5448 72 2030 71 5066 75
Higher SES 1098 28 2401 26 935 31 2111 28 810 29 1729 25
Native American 34 1 88 1 31 1 75 1 27 1 61 1
Black 599 16 1392 15 526 17 1235 16 478 17 1077 16
Asian 94 2 226 2 79 3 204 3 67 2 176 3
Hispanic 1406 36 3491 37 1080 35 2701 36 1046 37 2547 37
White 1727 45 4156 44 1340 44 3344 44 1222 43 2933 43
Middle Schools
Not English Proficient 469 30 2078 16 199 21 1294 13 454 30 2057 16
Bilingual 405 26 2272 18 306 32 1926 19 391 26 2232 18
English Only 666 43 8327 66 453 47 6915 68 666 44 8254 66
Any Disability 182 12 1531 12 122 13 1034 10 177 12 1307 10
No Disability 1358 88 11146 88 836 87 9101 90 1334 88 11236 90
Male 780 51 6496 51 488 51 5115 50 748 49 6386 51
Female 760 49 6181 49 470 49 5020 50 763 51 6157 49
Lower SES 1364 89 7196 57 885 92 5772 57 1364 90 7173 57
Higher SES 176 11 5481 43 73 8 4363 43 147 10 5370 43
Native American 16 1 103 1 14 1 93 1 37 2 123 1
Black 28 2 2302 18 23 2 2043 20 86 6 2463 20
Asian 7 0.5 343 3 6 1 336 3 7 0.5 392 3
Hispanic 989 64 4424 35 674 40 3555 35 995 66 4502 36
White 500 32 5505 43 241 25 4108 41 386 26 5062 40

could hypothesize that pilot schools have leadershipthat is willing to take chances while the controlschools have leadership that is conservative aboutchange.The analyses cannot rule out that differ-ences in achievement between control and pilotschools are due to this latent characteristic.Will-ingness to participate in a research study may berelated to the overall achievement level of aschool—teachers of high achieving students maybe more willing to be scrutinized than teachers of low achieving students. Since we are looking forgrowth in average NCE scores, we are more likelyto see gains among the lower achieving students.If schools which have higher average achievementare more likely to self-select into the pilot, theresults would be biased against seeing a piloteffect.This may indeed have happened at the ele-mentary level where the baseline average ITBSReading score is 43.8 for elementary pilot schoolsand 40.8 for the control schools. Starting with
pilot schools which have higher achievement lev-els at baseline may also introduce bias due toregression to the mean, this form of bias wouldmake it more likely to see a negative effect. Incontrast, the middle school pilots had lower aver-age ITBS Reading scores at baseline—32.6 forpilot schools versus 42.9 for control schools, herethe bias is towards finding a positive effect.Twoschools of very different baseline achievement lev-els participated as pilots at the high school level.Manual had a mean ITBS Reading NCE of 34.8,Thomas Jefferson had a mean of 55.8, and thecontrol schools averaged 44.2 NCEs.Thus Manualis biased toward a positive effect while ThomasJefferson is biased towards a negative effect.
Self selection also restricts the representative-ness of the pilot sample, making the results onlyapplicable to PFP programs which are institutedwith teacher approval.
87Quantitative Analyses
FIG. 6-2 CONTINUED
Demographics for ITBS Reading Sample, Baseline YearUnweighted and Weighted, by Level of School
October Count Unweighted Sample Weighted Sample
pilot control pilot control pilot control
n % n % n % n % n % n %
High Schools
Not English Proficient 249 14 1316 12 129 12 354 12 238 13 1156 14
Bilingual 315 18 2383 22 211 19 773 27 315 18 1814 22
English Only 1214 68 7133 66 760 69 1732 61 1214 69 5391 64
Any Disability 254 14 1183 11 117 11 235 8 199 11 509 6
No Disability 1524 86 9649 89 983 89 2624 92 1568 89 7853 94
Male 883 50 5552 51 514 47 1417 50 824 47 4341 52
Female 895 50 5280 49 586 53 1442 50 943 53 4019 48
Lower SES 994 56 5689 53 578 53 1675 59 992 56 4597 55
Higher SES 784 44 5143 47 522 47 1184 41 775 44 3764 45
Native American 5 0.3 62 0.6 4 0.4 28 1 7 0.4 121 1
Black 288 16 1189 11 212 19 520 18 372 21 1414 17
Asian 12 0.7 261 2 8 0.7 122 4 13 0.7 246 3
Hispanic 343 19 2566 24 245 22 1018 36 402 23 2038 24
White 1130 64 6754 62 631 57 1171 41 974 55 4543 54
Control Schools and Treatment ContaminationFor the elementary school analysis, three controlschools were chosen by the district as matches for each pilot school on the basis of demographiccharacteristics as described in Chapter III.At thesecondary level, all of the non-pilot middle schoolsserve as middle school controls and all of thenon-pilot high schools serve as high school con-trols. Generally, matching introduces bias into the analysis and imposes limits on the amount ofinformation which the matching characteristicscan provide. For instance, matching on socioeco-nomic characteristics at the elementary level precludes us from analyzing the influence of SES,English proficiency, and school enrollment on the pilot outcomes.
Half of the elementary school controls and all ofthe middle and high school controls were selectedfrom schools that had been recruited for the pilotand voted not to participate. Controls by definitionshould not be aware of the pilot.This introducesanother source of bias that would tend to dilutethe effect of the pilot program.There is anecdotalevidence to indicate that several control schoolprincipals and teachers implemented the PFPobjective writing process or a modified version of it.When control schools implement portions of the treatment, the contamination of the studydesign makes it more difficult to detect an effectof the pilot program on student achievement. Sec-ondly, during the 2002-2003 school year, most ofthe elementary schools, including all of the pilotelementary schools but one, took part in a literacyinitiative which required teachers to write literacyobjectives.Thus for the last year of the study, partof the pilot’s “unique” treatment occurred in bothpilot and control elementary schools.This willbias the results toward observing no pilot effecton reading tests.
School, Student, and Teacher CharacteristicsFactors other than the pilot ‘treatment’ affect studentachievement and these factors differ betweenschools.To insure that the estimates of pilot effec-tiveness are not due to differences in school popula-tions certain school and student characteristics havebeen controlled for and where possible teachercharacteristics as well.
The school characteristics used in the studentachievement analysis are taken from the DenverPublic Schools report cards from school years1998-1999 through 2000-2003. CTAC chose asubset of the reported measures that were availablefor the whole study period.To control for thelack of continuity in school administration, weincluded the number of years the principal hasbeen at the school. Factors that control for differ-ences in student population include the following:percent of students with low SES (measured byparticipation in the free/reduced lunch program);percent of students with a disability; and percentof students classified as English language learners.The percent of teachers not fully licensed is usedto control for qualitative differences in the teacherpopulation between schools. School enrollmentprovides a control for overall size of the school.All of these school factors, with the exception ofprincipal years at the school, have been centeredat the grand mean by type of school: for elementaryschools the mean of the pilot and control schoolsparticipating in PFP was used; for middle schoolsthe mean for all middle schools in Denver wasused; and for the high schools the grand mean isbased on the mean for all high schools. Centeringthe school characteristics makes it possible to inter-pret their coefficients as an increase of one unitabove the average Denver Public School at themiddle and high school levels.At the elementaryschool level, this equates to the average elementaryschool participating as either a pilot or control.
The student demographic data collected by theDenver Public Schools provide measures of thenon-school influences on a student’s performance.For this study, gender, ethnicity, language profi-ciency, grade, the presence of any disability, partic-ipation in the free/reduced lunch program, andgrade retention were collected.
Teacher characteristics are available for thestudy years, but not the baseline years, and for theelementary and middle schools, the teacher char-acteristics are not available for the control schoolsfor the first pilot year.This lack of data makes itimpossible to use teacher characteristics in thepre/post pilot/control analyses. In the analyses of the post period that include only pilot schools,teacher characteristics are used.The characteristicscollected from the DPS Human Resource files are
88 Catalyst for Change

degree (bachelor’s, master’s, or doctorate degree),years of experience in the DPS system, andwhether the teacher is part of the Teacher-in-Residence (TIR) program, an alternative certifica-tion program. Class lists linking teachers tostudents were collected and entered by hand forthe 1999-2000 school year for the elementarypilot schools.After that, records were obtainedfrom the DPS electronic files at three points dur-ing the school year.These class lists were used tolink teacher data to student achievement records.After the teacher and student data were linked,an indicator was created to identify students whohad two or more teachers during one school year.
C. Comparison of Pilot Schoolsto Control SchoolsStudent achievement scores are not independentobservations. Students are grouped within classroomsand schools, and at each level of the hierarchy thestudent’s scores are correlated.An individual student’sscores are also correlated across years.Two-stagehierarchical linear modeling (HLM) is used in thisanalysis to appropriately control for the lack ofindependence among observations.The HLManalysis groups children within schools onlybecause classroom assignment data are not available
for all years. Collection of teacher assignments was not done retroactively, thus, we do not knowclassroom assignments for students during thebaseline year.
In the first stage of the model, we predict astudent’s NCE score as the sum of an intercept forthe student’s school (�0j), the effects of the pilot,time, the interaction of pilot and time, languageproficiency, disability, ethnicity, gender, grade, andSES, and the random error (rij) associated with theith student at the jth school.This model gives usintercepts for pilot (�j+ �1) and control schools(�j), which tell us how the two groups comparedbefore the pilot treatment began. It also estimatesthe control students’ slope �2, describing thechange in student achievement scores over timefor the control schools.The coefficient for theinteraction of pilot treatment with time (�3)measures whether the pilot schools have the sameslope as the control schools.A positive and statisti-cally significant value for �3 indicates that PFPhas improved student achievement and converselya negative and statistically significant �3 indicatesthat the pilot is associated with a decrease in studentachievement.The pilot students’ slope is calculatedby adding together �2 and �3.A slope which isnot significantly different from zero indicates oneyear of expected growth, a statistically significant
89Quantitative Analyses
FIG. 6-3
PFP Effect—Elementary Schools—ITBSWeighted Two-Stage Hierarchical Linear Models
ITBS Reading ITBS Language ITBS Math
Unadjusted Adjusted Adjusted Unadjusted Adjusted Adjusted Unadjusted Adjusted Adjusted for School for School for School for School for School for School
Factors and Student Factors and Student Factors and Student Factors Factors Factors
Control Intercept 43.5*** 42.3*** 56.1*** 43.7*** 43.5*** 56.5*** 43.6*** 42.7*** 52.6***
Pilot Intercept 43.8*** 44.5*** 58.6*** 41.4*** 42.7*** 55.9*** 45.9*** 46.0*** 56.4***
Difference Between Pilot and Control Intercepts 0.4 2.1* 2.5** -2.3 -0.7 -0.6 2.3 3.3*** 3.7***
Control Slope -0.3*** -0.1 0.1 -0.2* -0.1 -0.03 -0.6*** -0.4*** -0.3***
Pilot Slope -0.1 -0.2 -0.2 -0.3* -0.2 -0.1 -0.7*** -0.6*** -0.7***
Difference Between Pilot and Control Slopes 0.2 -0.1 -0.3* -0.1 -0.1 -0.1 -0.1 -0.2 -0.4*
* statistically significant at p < 0.05; ** statistically significant at p < 0.01; *** statistically significant at p < 0.001

positive slope indicates more than an expectedyear of growth, and a statistically significant negativeslope indicates less than a year’s growth.
Level 1:�ij = �j + �1(Pilotij) + �2(Timeij) + �3(Pilotij x Timeij) +
�4(SESij) + �5(Disabledij) + �6(Retained a Gradeij) + �7(Not Proficientij) + �8(Bilingualij) + �9(Native Americanij) + �10(Blackij) + �11(Asianij) +�12(Hispanicij) + �13(Maleij) + rij
where rij ~ N(0,�2)
The Level 2 model expresses the intercept ofschool j as the grand mean and deviations from thatmean associated with school level characteristics anda random error term (�0j).
Level 2:�j = � + �14(Principal Years at Schoolj) +
�15(Percent Disabledj) + �16(Percent English Language Learnersj) + �17(Percent Free/Reduced Lunchj)+ �18(Percent Teachers not Fully Licensedj) +�19(Total Enrollmentj) + �j
where �j ~ N(0, �00)
Three models are presented for each of the sixtests, a model testing for pilot effect without adjust-ing for any covariates (Model A), a second modeladjusting for school level covariates (Model B),
and a third model adjusting for school and studentlevel factors as described in the equations above(Model C). Four analyses were performed, oneeach at the elementary and middle school level,and two at the high school level.The full HLMmodels are presented in the Appendix, summarytables showing the estimated intercepts and slopesare presented in this chapter.
Elementary School PFP OutcomesThe unadjusted model (Model A) reflects mostclosely what happened ‘in the real world’.Themodel adjusting for school factors (Model B)allows us to estimate what the results of PFPwould have been had the characteristics of thepilot and control schools been equal, and the thirdmodel (Model C), adjusting for school and stu-dent factors, estimates the effects of PFP had thestudent populations been the same.The pilot andcontrol intercepts represent the average achieve-ment level of pilot and control students before thestudy began.The intercept in the third model ishigher than the previous two models because theinfluences of being poor, disabled, failing the pre-vious grade, lacking proficiency in English, orbeing bilingual, male, and non-white (not alreadycontrolled by the matching process) have all beenremoved.Thus, the intercept of the third model is
90 Catalyst for Change
FIG. 6-4
PFP Effect—Elementary Schools—CSAPWeighted Two-Stage Hierarchical Linear Models
CSAP Reading CSAP Writing CSAP Math
Unadjusted Adjusted Adjusted Unadjusted Adjusted Adjusted Unadjusted Adjusted Adjusted for School for School for School for School for School for School
Factors and Student Factors and Student Factors and Student Factors Factors Factors
Control Intercept 51.6*** 51.0*** 65.3*** 49.5*** 49.4*** 63.0*** 51.0*** 49.4*** 61.2***
Pilot Intercept 54.6*** 53.0*** 67.9*** 55.6*** 52.6*** 66.8*** 56.5*** 54.6*** 67.4***
Difference Between Pilot and Control Intercepts 2.9 2.1* 2.6** 6.1*** 3.2** 3.7*** 5.5* 5.2*** 6.2***
Control Slope -0.2 -0.01 0.2 0.1 0.3** 0.50*** 0.002 0.2 0.2
Pilot Slope -0.5** -0.5*** -0.5*** -0.3 -0.4 -0.3 -1.3*** -1.1*** -1.3***
Difference Between Pilot and Control Slopes -0.3 -0.5** -0.7*** -0.5* -0.7** -0.8*** -1.3*** -1.3*** -1.5***
* statistically significant at p < 0.05; ** statistically significant at p < 0.01; *** statistically significant at p < 0.001
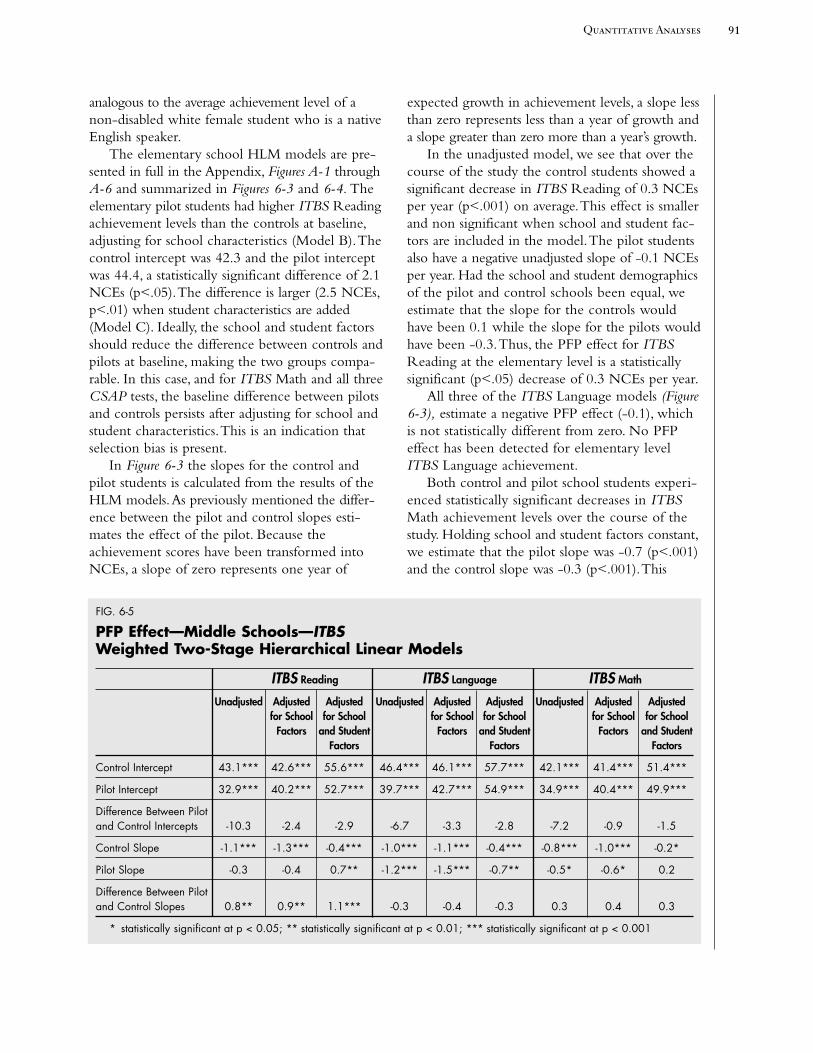
analogous to the average achievement level of anon-disabled white female student who is a nativeEnglish speaker.
The elementary school HLM models are pre-sented in full in the Appendix, Figures A-1 throughA-6 and summarized in Figures 6-3 and 6-4. Theelementary pilot students had higher ITBS Readingachievement levels than the controls at baseline,adjusting for school characteristics (Model B).Thecontrol intercept was 42.3 and the pilot interceptwas 44.4, a statistically significant difference of 2.1NCEs (p<.05).The difference is larger (2.5 NCEs,p<.01) when student characteristics are added(Model C). Ideally, the school and student factorsshould reduce the difference between controls andpilots at baseline, making the two groups compa-rable. In this case, and for ITBS Math and all threeCSAP tests, the baseline difference between pilotsand controls persists after adjusting for school and student characteristics.This is an indication thatselection bias is present.
In Figure 6-3 the slopes for the control andpilot students is calculated from the results of theHLM models.As previously mentioned the differ-ence between the pilot and control slopes esti-mates the effect of the pilot. Because theachievement scores have been transformed intoNCEs, a slope of zero represents one year of
expected growth in achievement levels, a slope lessthan zero represents less than a year of growth anda slope greater than zero more than a year’s growth.
In the unadjusted model, we see that over thecourse of the study the control students showed asignificant decrease in ITBS Reading of 0.3 NCEsper year (p<.001) on average.This effect is smallerand non significant when school and student fac-tors are included in the model.The pilot studentsalso have a negative unadjusted slope of -0.1 NCEsper year. Had the school and student demographicsof the pilot and control schools been equal, weestimate that the slope for the controls wouldhave been 0.1 while the slope for the pilots wouldhave been -0.3.Thus, the PFP effect for ITBSReading at the elementary level is a statisticallysignificant (p<.05) decrease of 0.3 NCEs per year.
All three of the ITBS Language models (Figure6-3), estimate a negative PFP effect (-0.1), whichis not statistically different from zero. No PFPeffect has been detected for elementary levelITBS Language achievement.
Both control and pilot school students experi-enced statistically significant decreases in ITBSMath achievement levels over the course of thestudy. Holding school and student factors constant,we estimate that the pilot slope was -0.7 (p<.001)and the control slope was -0.3 (p<.001).This
91Quantitative Analyses
FIG. 6-5
PFP Effect—Middle Schools—ITBSWeighted Two-Stage Hierarchical Linear Models
ITBS Reading ITBS Language ITBS Math
Unadjusted Adjusted Adjusted Unadjusted Adjusted Adjusted Unadjusted Adjusted Adjusted for School for School for School for School for School for School
Factors and Student Factors and Student Factors and Student Factors Factors Factors
Control Intercept 43.1*** 42.6*** 55.6*** 46.4*** 46.1*** 57.7*** 42.1*** 41.4*** 51.4***
Pilot Intercept 32.9*** 40.2*** 52.7*** 39.7*** 42.7*** 54.9*** 34.9*** 40.4*** 49.9***
Difference Between Pilot and Control Intercepts -10.3 -2.4 -2.9 -6.7 -3.3 -2.8 -7.2 -0.9 -1.5
Control Slope -1.1*** -1.3*** -0.4*** -1.0*** -1.1*** -0.4*** -0.8*** -1.0*** -0.2*
Pilot Slope -0.3 -0.4 0.7** -1.2*** -1.5*** -0.7** -0.5* -0.6* 0.2
Difference Between Pilot and Control Slopes 0.8** 0.9** 1.1*** -0.3 -0.4 -0.3 0.3 0.4 0.3
* statistically significant at p < 0.05; ** statistically significant at p < 0.01; *** statistically significant at p < 0.001

results in a statistically significant negative piloteffect of -0.4 NCEs per year (p<.05).
The elementary pilot students had baselineCSAP achievement levels which were 2.9 NCEshigher for Reading, 6.1 NCEs higher for Writing,and 5.5 NCEs higher for Math than the controlstudents (Figures 6-4 unadjusted models).Thesedifferences in intercepts persist after adjusting forschool and student characteristics. Statisticallynegative PFP effects are estimated for CSAPReading (-0.7, p<.001),Writing (-0.8, p<.001)and Math (-1.5, p<.001).
Middle School PFP OutcomesAt the middle school level, we compare the twopilot middle schools to all of the other Denvermiddle schools.The full descriptions of the HLMmodels are found in the Appendix, Figures A-7through A-12.The pilot middle schools at base-line have an ITBS Reading level below that ofthe controls, and the differential between pilotsand controls is similar on each of the six tests (Fig-ures 6-5 and 6-6). By controlling for school and student characteristics, we eliminate much of thedifference in baseline achievement levels. For all
six tests, the difference between the adjustedintercepts is smaller and not statistically significant.
The control students experienced statisticallysignificant decreases in ITBS scores over the studyperiod of 0.4 NCEs per year (p<.001) on theReading and Language tests and 0.2 NCEs (p<.05)on the Math test.The pilot students performedsignificantly better than the control students onthe ITBS Reading exam, with a slope of 0.7(p<.01).This is a statistically significant PFP effectof 1.1 NCEs per year (p<0.001) more than thecontrol students. On the Language exam, themiddle school pilot students lost 0.7 (p<.01)NCEs per year on average.This represents a PFPeffect of -0.3, which is not statistically differentfrom zero. Pilot students showed a small and non-significant increase of 0.1 NCEs per year on theITBS Math exam, 0.3 NCEs per year better thanthe controls.
On the CSAP exams, the control school stu-dents showed a statistically significant amount ofimprovement of 0.5 NCEs per year (p<.001) onthe Reading test and 0.6 NCEs per year (p<.001)on the Writing and Math tests.The pilot schoolstudents performed about the same as the controlschool students on the Reading test as the PFP
92 Catalyst for Change
FIG. 6-6
PFP Effect—Middle Schools—CSAPWeighted Two-Stage Hierarchical Linear Models
CSAP Reading CSAP Writing CSAP Math
Unadjusted Adjusted Adjusted Unadjusted Adjusted Adjusted Unadjusted Adjusted Adjusted for School for School for School for School for School for School
Factors and Student Factors and Student Factors and Student Factors Factors Factors
Control Intercept 49.5*** 49.0*** 63.5*** 49.7*** 49.5*** 64.2*** 50.0*** 49.6*** 59.9***
Pilot Intercept 40.6*** 49.5*** 64.4*** 40.7*** 48.5*** 63.2*** 41.1*** 48.7*** 58.6***
Difference Between Pilot and Control Intercepts -8.9 0.5 0.9 -9.0 -0.9 -1.1 -8.9 -0.9 -1.3
Control Slope 0.03 -0.3* 0.5*** 0.003 -0.3** 0.6*** -0.3* -0.6*** 0.6***
Pilot Slope 0.3 -0.2 0.5 0.3 0.2 1.2*** 1.6*** 1.3*** 2.2***
Difference Between Pilot and Control Slopes 0.3 0.1 -0.1 0.3 0.5 0.7* 1.9*** 1.9*** 1.6***
* statistically significant at p < 0.05; ** statistically significant at p < 0.01; *** statistically significant at p < 0.001

effect is -0.1 and not statistically different fromzero. Pilot students outperformed control studentsby 0.7 NCEs per year (p<.05) on the Writingexam and 1.6 NCEs per year (p<.001) on theMath exam. Pilot school students increased anaverage of 1.2 NCEs (p<.001) per year on theWriting exam and 2.2 NCEs (p<.001) per yearon the Math exam.
High School PFP OutcomesThe six high school HLM models may be found inFigures A-13 through A-18 in the Appendix.Atbaseline the unadjusted average ITBS Readingscores for Manual students were 13 NCEs belowthe control students and the Thomas Jefferson Highstudents were 10.7 NCEs higher than the controls(Figure 6-7). After adjusting for school and student
characteristics, the differences between the con-trols and the two pilot schools were smaller andnot statistically significant. Similar results occurredfor the CSAP test (Figure 6-8); however, for theITBS Language and Math tests significant baselinedifferences still exist between pilot and controlstudents in the adjusted model.
The control school students increased theirITBS Reading scores by 2 NCEs per year (p<.001)on average during the study, while Manual studentsincreased at 3.8 NCEs per year (p<.001) andThomas Jefferson students increased at a rate of0.4 NCEs per year.The positive PFP effect of 1.9for Manual is somewhat significant (p=0.09).Thenegative effect (-1.6, p<.05) for Thomas Jeffersonstudents indicates that Thomas Jefferson students,despite the intervention, showed less growth than
93Quantitative Analyses
FIG. 6-7
PFP Effect—High Schools—ITBSWeighted Two-Stage Hierarchical Linear Models
ITBS Reading ITBS Language ITBS Math
Unadjusted Adjusted Adjusted Unadjusted Adjusted Adjusted Unadjusted Adjusted Adjusted for School for School for School for School for School for School
Factors and Student Factors and Student Factors and Student Factors Factors Factors
Control Intercept 45.2*** 44.6*** 55.5*** 35.7*** 34.1*** 43.7*** 40.7*** 41.0*** 50.8***
Manual HS Intercept 32.2*** 46.8*** 51.2*** 21.8*** 15.3** 15.8* 23.0*** 28.2*** 34.5***
Jefferson HS Intercept 55.9*** 41.5*** 53.1*** 25.9** 20.8* 26.2* 25.6** 15.0* 24.7*
Difference Between Manual and Control Intercepts -13.0 2.2 -4.3 -13.9** -18.8** -28.0** -17.7** -12.8* -16.2*
Difference Between Jefferson and Control Intercepts 10.7 -3.1 -2.4 -9.7 -13.3 -17.5 -15.1 -26.0** -26.1*
Control Slope 0.9*** 1.4*** 2.0*** 2.2*** 2.7*** 3.5*** 3.5*** 3.8*** 4.2***
Manual HS Slope 0.7 1.3 3.8*** 7.2*** 8.2*** 11.7*** 6.7*** 7.7*** 9.1***
Jefferson HS Slope -1.0 -0.8 0.4 9.5*** 10.2*** 10.5*** 16.4*** 17.1*** 16.8***
Difference Between Manual and Control Slopes -0.2 -0.01 1.9 5.0*** 5.5*** 8.2*** 3.2* 3.9** 4.8***
Difference Between Jefferson and Control Slopes -2.0** -2.1** -1.6* 7.3** 7.5** 7.1** 12.9*** 13.4*** 12.6***
* statistically significant at p < 0.05; ** statistically significant at p < 0.01; *** statistically significant at p < 0.001

the control group. Positive PFP effects are seen forManual (8.2, p<.001) and Thomas Jefferson (7.1,p<.01) on the ITBS Language test.The controlschools also improved significantly on the Lan-guage exam, but at a slower rate (3.5, p<.001).Similar PFP effects are seen for the ITBS Mathexam as well, with Manual student scores increasingby 4.8 NCEs per year (p<.001) more than controlsand Thomas Jefferson students improving by 12.6NCEs per year (p<.001) more than control schools.
The control schools improved significantly on all three CSAP exams; by 1.2 NCEs per year(p<.001) on the Reading exam, 1.7 NCEs per year(p<.001) on the Writing exam, and 1.3 NCEs peryear (p<.001) on the Math exam.At Manual, pilotstudent scores increased faster than control scoreson all three tests; the PFP effects for Manual are
1.0 (p=.3), 1.1(p=.4), and 0.5(p=.7) for Reading,Writing, and Math, respectively.These effects werenot statistically different from the controls.ThomasJefferson students experienced a statistically signifi-cant positive effect on the Reading exam of 1.5NCEs per year (p<.05), and small and non-signifi-cant effects of 0.2 and -0.1 NCEs per year on theWriting and Math exams, respectively.
Individual Growth Modeling AnalysesThere are some disadvantages to the two-stageHLM models used in this analysis. First, each year there is a different cohort of students due to movement of students: advancement from ele-mentary to middle, middle to high school, andfrom grade 11 to 12, as well as transfers betweenschools and into and out of the Denver Public
94 Catalyst for Change
FIG. 6-8
PFP Effect—High Schools—CSAPWeighted Two-Stage Hierarchical Linear Models
CSAP Reading CSAP Writing CSAP Math
Unadjusted Adjusted Adjusted Unadjusted Adjusted Adjusted Unadjusted Adjusted Adjusted for School for School for School for School for School for School
Factors and Student Factors and Student Factors and Student Factors Factors Factors
Control Intercept 50.5*** 52.3*** 65.3*** 50.4*** 51.0*** 64.0*** 51.6*** 51.0*** 60.3***
Manual HS Intercept 38.2*** 51.5*** 60.7*** 34.8*** 51.5*** 57.6*** 36.7*** 51.5*** 58.0***
Jefferson HS Intercept 56.6*** 45.7*** 55.6*** 58.2*** 51.4*** 62.2*** 57.2*** 53.0*** 60.4***
Difference Between Manual and Control Intercepts -12.3 -0.8 -4.6 -15.6* 0.5 -6.4 -14.9* 0.5 -2.3
Difference Between Jefferson and Control Intercepts 6.0 -6.6 -9.8 7.8 0.3 -1.8 5.6 2.0 0.1
Control Slope 0.2 0.4* 1.2*** 0.2 0.5 1.7*** 0.1 0.3 1.3***
Manual HS Slope 0.5 0.2 2.1* 1.6 0.2 2.8* 1.3 -0.3 1.8
Jefferson HS Slope 0.5 0.9 2.6*** -0.2 -0.3 1.9** 0.2 -0.5 1.2
Difference Between Manual and Control Slopes 0.3 -0.2 1.0 1.3 -0.3 1.1 1.2 -0.5 0.5
Difference BetweenJefferson and Control Slopes 0.2 0.5 1.5* -0.5 -0.8 0.2 0.1 -0.8 -0.1
* statistically significant at p < 0.05; ** statistically significant at p < 0.01; *** statistically significant at p < 0.001

Schools. Secondly, as seen in the adjusted elemen-tary and high school models, student demograph-ics and school characteristics do not fully explaindifferences in student achievement betweenschools at baseline. Individual growth modeling(IGM) is an extension of two-stage HLM inwhich each student is allowed to have his or herown intercept and slope.These models implicitlycontrol for the factors outside of the school thatcontribute to student achievement, and in addi-tion, smooth out some of the random year-to-year variability in each student’s scores. Ideally
students included in the IGM analysisshould have at least three years of scores.Thomas Jefferson High School did notadminister the ITBSLanguage test one year, and we have onlythree years of high school data in total, soThomas Jefferson could not be includedin the model for that test. In addition, theCSAP Writing and Math exams werenot given to every grade every year, withthe result that these two tests cannot bemodeled using IGM at the elementaryand high school levels.All IGM samplesizes are smaller due to students havingincomplete testing histories or moving inor out of the study schools.Figure 6-9 presents IGM analyses for theelementary schools, the full models arepresented in Figure A-19 of the Appen-dix.The elementary models confirm
the negative PFP effects discussed earlier.The elementary PFP effects are estimated to be -0.4(p<.05), -1.1(p<.001), -0.8 (p<.001), and -0.5(p<.05) for ITBS Reading, Language, Math,and CSAP Reading, respectively.The results arevery similar to the HLM results, which were -0.3 (p<.05), -0.1(p=.7), -0.4(p<.05) and -0.7(p<.001).The one exception is the ITBS Lan-guage effect which is stronger and statistically significant in the IGM analysis.
With one exception, the IGM also confirmsthe middle school HLM results. For ITBS Language
95Quantitative Analyses
FIG. 6-9
Unadjusted Individual Growth Models—Elementary Schools
ITBS ITBS ITBS CSAPReading Language Math Reading
Control Intercept 44.5*** 45.0*** 44.9*** 51.5***
Pilot Intercept 43.1*** 45.9*** 47.2*** 53.5***
Difference between Pilot and Control Intercepts -1.3 0.9 2.2 2.0
Control Slope 0.8*** 0.2* -0.5*** 1.0***
Pilot Slope 0.4* -0.9*** -1.3*** 0.5**
Difference between Pilot and Control Slopes -0.4* -1.1*** -0.8*** -0.5*
*statistically significant at p < 0.05; ** statistically significant at p < 0.01*** statistically significant at p < 0.001
FIG. 6-10
Unadjusted Individual Growth Models—Middle Schools
ITBS Reading ITBS Language ITBS Math CSAP Reading CSAP Writing CSAP Math
Control Intercept 43.7*** 49.1*** 40.9*** 50.9*** 51.7*** 52.9***
Pilot Intercept 34.7*** 40.9*** 35.0*** 42.3*** 42.0*** 38.8***
Difference between Pilot and Control Intercepts -8.9 -8.1* -5.9 -8.5 -9.7 -14.1*
Control Slope 0.1 -2.4*** 2.7*** 0.4*** 0.01 -1.0*
Pilot Slope 0.02 -2.5*** 3.2*** 0.4 0.9* 3.9***
Difference between Pilot and Control Slopes -0.1 -0.1 0.5 -0.004 0.9 4.9***
* statistically significant at p < 0.05; ** statistically significant at p < 0.01; *** statistically significant at p < 0.001

and Math and CSAP Reading bothmethods yield PFP effects that are smalland not statistically significant. For CSAPMath the HLM estimates a PFP effect of1.6 (p<.001), while the IGM estimates alarger effect (4.9, p<.001).The models donot agree on the ITBS Reading effect.The IGM estimates a non-significant PFPeffect of -0.05, while the HLM estimatesa significant positive effect of 1.1 NCEsper year (p<.001).
At the high school level, IGM generallyconfirms the ITBS Reading results withPFP effects estimated at 0.8 (p=.3) forManual High and -0.8 for Thomas Jeffer-son High (p=.08). HLM produced largerestimates of 1.9 (p=.09) and -1.6 (p<.05),respectively.The direction of the effects isthe same for the two models, and the dif-ference in size of the estimate is not ofpractical importance. For ITBS Language,IGM produced an estimate of 4.3 (p=.07)while HLM estimated 8.2 (p<.001).TheIGM model confirms the ITBS Mathresults for Manual High.The IGM modelPFP effect is 2.9 (p<.05), while the HLMeffect is 4.8 (p<.001); both methods pro-duce statistically significant results.TheManual High CSAP Reading effect islarger and statistically significant (2.5,p<.001) as compared to the HLM effect (1.0, p=.3).
A discrepancy occurs for Thomas Jefferson inthe effect estimates for ITBS Math; the IGM esti-mates the PFP effect to be -2 (p<.05) while theHLM estimates 12.6 (p<.001). CSAP Readingalso produced different results, the IGM estimatesa PFP effect of -0.03 (p=.9) while the HLM estimates 1.5 (p<.05). It is possible that these dis-crepancies are due to the small number of ThomasJefferson students that could be included in theIGM analysis.
D. Correlation of StudentAchievement with Rubric LevelsMethodology and FindingsTo explore the relationship between the quality of objectives (as measured on the rubric discussed
in Chapter IV) and student achievement, two-stageHLM was run on treatment period data for thepilot students, controlling for baseline achieve-ment level. Once again three models were run foreach test—unadjusted, adjusted for school charac-teristics, and adjusted for school and student char-acteristics.At the elementary school level aquadratic equation for time fit the data better thana simple linear equation.The quadratic equationallows the relationship between rubric level andstudent achievement to be a curved line.At thesecondary level a simpler linear model was usedbecause fewer years of data were available.Thetwo pilot high schools are estimated in separatemodels.With only one school in each model,standard linear models (e.g., least squares linearmodel) are used, since there is no need for a two-stage model.
96 Catalyst for Change
FIG. 6-11
Unadjusted Individual Growth Models—High Schools
ITBS ITBS ITBS CSAPReading Language Math Reading
Control Intercept 48.3*** 44.5*** 48.0*** 53.4***
Manual HS Intercept 34.2*** 29.2*** 33.0*** 30.3***
Jefferson HS Intercept 57.6*** 57.9*** 60.1***
Difference between Manual and Control Intercepts -14.1* -15.3* -15.0* -23.1**
Difference between Jefferson and Control Intercepts 9.2 9.9 6.7
Control Slope 0.4* 0.2 -0.2 -2.2***
Manual HS Slope 1.2 4.5 2.7* 0.3
Jefferson HS Slope -0.5 -2.9** -2.2**
Difference between Manual and Control Slopes 0.8 4.3 2.9* 2.5**
Difference between Jefferson and Control Slopes -0.9 -2.7* -0.03
* statistically significant at p < 0.05** statistically significant at p < 0.01
*** statistically significant at p < 0.001

In the analysis files, elementary students areassigned one classroom teacher (although the stu-dent may also be taught by other teachers duringthe day).At the middle schools and high schoolsstudents have multiple teachers over the course of aschool year. CTAC classified teachers as languagearts (reading, writing, and literature courses) ormath (math and computer science courses). Forthis analysis, one language arts teacher and onemath teacher were selected randomly for eachstudent.This approach eliminates the inappropri-ate use of one student’s scores for multiple teach-ers, but it also makes it harder to detect arelationship between rubric level and achievementat the secondary level.A student taught by ateacher with a rubric level of 1 may also haveother teachers for other related classes with higherrubric levels.The secondary level analyses aretherefore biased against finding significant differ-ences in student achievement between rubric levels.We explored the possibility of using the highestrubric level from all of a student’s teachers; how-ever, this produced a file with no rubric levelsbelow 3.
Level 1:�ij = �j + �1 (Rubric 4ij) + �2(Rubric 3ij) + �3(Rubric 2ij)
+ �4(Timeij) + �5(Time2ij) + �6(Rubric 4 x Timeij) +
�7(Rubric 3 x Timeij) + �8(Rubric 2 x Timeij) + �9(Rubric 4 x Time2
ij) + �10(Rubric 3 x Time2ij) +
�11(Rubric 2 x Time2ij) + �12(Last Score) + �13(SESij)
+ �14(Disabledij) + �15(Retained a Gradeij) +�16(Not Proficientij) + �17(Bilingualij) + �18(Native Americanij) + �19(Blackij) + �20(Asianij)+ �21(Hispanicij) + �22(Maleij) + rij
where rij ~ N(0,�2)
The Level 2 model expresses the intercept ofschool j as the grand mean and deviations from thatmean associated with school level characteristicsand a random error term (�0j).
Level 2:�j = � + �23(Principal Years at Schoolj) +
�24(Percent Disabledj) + �25(Percent English Lan-guage Learnersj) + �26(Percent Free/Reduced Lunchj)+ �27(Percent Teachers not Fully Licensedj) + �2804(Total Enrollmentj) + �j
where �j ~ N(0, �00)
Since the slope of a quadratic equationchanges over time, it is not possible to simply usethe slope as a measure of PFP effect. Instead weestimate the NCE score for an average student atan average school using HLM. By testing for dif-ferences between the estimated average scores foreach rubric level, we can determine whether stu-dent achievement is related to the rubric level ofthe students’ teachers. Figures A-20 through A-42present the detailed results of the rubric analysis.The results are discussed in detail in Chapter IVand shown in Figure 4-8.
Based on whether four traits of a quality edu-cational objective (learning content, completeness,cohesion, and high expectations) were present,CTAC classified objectives into four levels.Thehighest quality objectives received a 4 (excellent),followed by 3 (acceptable), 2 (needs improvement)and 1 (lack of understanding or effort).
At the elementary level, adjusting for schooland student characteristics, three of the six testsexhibit a positive and statistically significant rela-tionship between student achievement and theteacher’s highest rubric level (see Figure 4-9 inChapter IV). On the ITBS Reading test studentsof level 4, 3, 2, and 1 teachers averaged scores of 50.9, 49.7, 49.5, and 42.7, respectively. Studentsof level 4 teachers scored significantly higher (8.1,p<.05) than students of level 1 teachers.The differ-ences between level 3 and level 1 (6.9, p<.05) andbetween level 2 and level 1 (6.8, p< .05) are alsosignificant. Students of level 4 teachers score sig-nificantly higher than students of lower rubriclevels on the ITBS Language and CSAP Mathtests. On the ITBS Language test the level 4 aver-age score of 56.8 was significantly higher thanlevel 3 by 12.2 NCEs (p<.01), significantly higherthan level 2 by 13.2 (p<.001), and significantlyhigher than level 1 by 16.9 NCEs (p<.001).Thedifference between level 4 and level 3 on theCSAP Math test was 3.6 (p<.05) and the differencebetween level 4 and level 2 was 4.0 (p<.05). ITBSMath shows a mixed relationship—the averageNCE score is significantly higher at rubric levels 2 and 3 (47.0 and 47.1, respectively) than atrubric level 4 (39.7, p<.001) and level 1 (36.9,p<.01).Although the differences are not statisti-cally significant, beginning at level 2 the averagescores on the CSAP Writing test rise from 51.9,
97Quantitative Analyses

to 52.0 and 52.4 at levels 3 and 4.The remainingtest, CSAP Reading, shows no relationshipbetween achievement and objective quality.
At the middle schools there are two statisticallysignificant positive relationships (ITBS Math andCSAP Math) and one statistically significant nega-tive relationship (ITBS Reading). Students of level4 teachers on average scored 3.5 NCEs higher(p<.05) than students of level 2 teachers. On theITBS Reading test the relationship is reversed;students of level 2 teachers scored higher on aver-age than students of level 3 and level 4 teachersby 1.5 NCEs (p<.05) and 1.6 NCEs (p=.06),respectively. Non significant positive relationshipsare exhibited on the ITBS Language and Mathand CSAP Reading tests. On the CSAP Writingtest, students of level 3 teachers (44.1) outperformboth level 4 (42.7, p=.1) and level 2 (43.8, p=.7).
Manual High School exhibits a positive relation-ship between teacher rubric levels and the studentachievement level on the ITBS Reading test andthe CSAP Writing test. On the CSAP Math testthe direction of the relationship is reversed andrubric level 3 is significantly higher than rubriclevel 4. No significant differences exist for theremaining exams. CSAP Math is the only examfor which Thomas Jefferson High students show arelationship between rubric score and achievement.On that test students of rubric level 4 teachershave scores 2.7 NCEs higher (p<.001) than students of rubric level 3 teachers.
E. Correlation of StudentAchievement with Number of Objectives MetTwo stage HLM was used to explore the relation-ship between student achievement and the numberof objectives met.
Level 1:�ij = �j + �1(Met 2 Objectivesij) + �2(Met 1 Objectiveij) +
�3(Met No Objectivesij) + �4(Timeij) + �5(Time2ij)
+ �6(Met 2 Objectives x Timeij) + �7(Met 1 Objective x Timeij) + �8(Met No Objectives x Timeij) + �9(Met 2 Objectives x Time2
ij) + �10(Met 1 Objective x Time2
ij) + �11(Met No Objectives x Time2
ij) +
�12(Last Scoreij) + �13(SESij) + �14(Disabledij) +�15(Retained a Gradeij) + �16(Not Proficientij) + �17(Bilingualij) + �18(Native Americanij) +�19(Blackij) + �20(Asianij) + �21(Hispanicij) + �22(Maleij) + rij
where rij ~ N(0,�2)
The Level 2 model expresses the intercept ofschool j as the grand mean and deviations from thatmean associated with school level characteristicsand a random error term (�0j).
Level 2:�j = � + �23(Principal Years at School j) +
�24(Percent Disabledj) + �25(Percent English LanguageLearnersj) + �26(Percent Free/Reduced Lunch j) + �27(Percent Teachers not Fully Licensed j) + �2804(Total Enrollment j) + � j
where � j ~ N(0, �00)
As in the rubric analysis, the elementary modelsuse a quadratic function for time while at the sec-ondary levels time is treated as a linear function.The high school models were run separately forManual and Thomas Jefferson High Schools, sothose models employ a simple linear regressionmethodology. No models were run for ThomasJefferson High School on ITBS Language, becausetesting rates were too low, or on CSAP Writing,because all of the teachers linked to students withCSAP Writing scores met both objectives.
The results are reported in full detail in theappendix, Figures A-43 through A-65. The findingsare discussed in Chapter IV and summarized inFigure 4-11.
Objectives were judged to have been met if ateacher submitted evidence that students had metthe achievement goals set by the objective.Althoughthe measures used by the objectives were not nec-essarily either the ITBS or the CSAP, this analysisshows that student achievement increases as thenumber of objectives met increases.The relationshipis, however, complicated by the fact that teacherswho set very challenging goals may not meetthem even though they have the same positiveimpact on their students as another teacher whomet both objectives but set less ambitious goals.
At the elementary level students of teacherswho met two objectives had higher scores than
98 Catalyst for Change

students of teachers who met only one objective,with differences of 2.1 (p<.001), 1.9 (p<.01), 3.3(p<.001) on the ITBS Reading, Language, andMath exams (see Figure 4-11 in Chapter IV).Thesame was true of the CSAP Reading,Writing,and Math exams with differences of 2.1 (p<.001),0.5 (p=.5), and 3.9 (p<.001), respectively. In addi-tion, on three tests (ITBS Language and CSAPReading and Math) the average scores differedsignificantly between students of teachers whomet two objectives and students of teachers whomet no objectives. For the remaining three tests,there was no statistical differences between the stu-dents of teachers who met two objectives and stu-dents of teachers who met no objectives.
This analysis uses the same randomly selectedsecondary teachers as the rubric analysis, and thusthe secondary results are again biased toward find-ing no significant differences.At the middle schoollevel on the ITBS Language and Math and theCSAP Math tests, meeting either one or twoobjectives was associated with higher scores thanmeeting no objectives, but the difference was onlystatistically significant for the ITBS Language test.On the ITBS Reading test the students of teacherswho met one objective had scores 1.8 NCEslower than students of teachers who met twoobjectives (p<.05) and 2.9 NCEs lower than stu-dents of teachers who met no objectives (p<.05).No association between achievement and numberof objectives met was detected on the CSAPReading and Writing tests.
At Manual High School, achievement is higherfor students of teachers who met two objectiveson four tests (ITBS Reading and Math and CSAPWriting and Math).The four tests for whichcomparisons could be made at Thomas JeffersonHigh School also reveal higher achievement levelsfor students of teachers who met two objectives.The differences are statistically significant on theITBS Reading test at Manual; the differencebetween meeting two objectives and meeting oneand no objectives are 3.7 (p<.05) and 3.8 (p<.05),respectively.The ITBS Reading test also shows sta-tistically significant results at Thomas Jefferson, witha difference of 5.2 (p<.001) NCEs between meet-ing two objectives and meeting one objective.
F. Correlation of StudentAchievement with TeacherExperience and Length of Timein the PilotThe experience levels and length of time thatteachers participated in the pilot are likely to impactstudent achievement.To investigate whether this istrue, the effects of PFP on CSAP Reading, ITBSReading, and ITBS Math scores are calculated forsubgroups of teachers and reported in Figure 6-12.The calculations are based on two stage HLManalyses which adjust for previous year’s score andstudent characteristics. In Chapter IV Teachers-in-Residence (TIRs) were found to be more likelyto write lower level objectives (Figure 4-7) and tobe less likely to meet their objectives (Figure 4-10). At the elementary level this seems to havetranslated into lower achievement levels for thestudents of pilot TIRs as compared to the studentsof control TIRs. On the CSAP Reading test thechange in score over time for students of pilotTIRs was 2.5 NCEs (p<.05) per year lower thanthat of control school TIRs.The effect for theITBS Math test was also negative, but not statisti-cally significant. In contrast, the students of middleschool TIRs performed better than those of control TIRs (1.5, p<0.05) on the CSAPReading test.
Teachers with 15 or more years of experiencewere less likely to meet their objectives thanteachers with less experience (Figure 4-10). At theelementary level this translated into lower pilotstudent achievement compared to control studentsof teachers with the same level of achievement by1 NCE per year (p<.001) on the CSAP Readingtest and by 1.9 NCEs per year (p<.001) on theITBS Math test.The effects for teachers with 11to 14 years and more than 15 years of experienceat the middle school level are positive and statisti-cally significant for CSAP Reading (2.8 NCEsper year, p<0.001 and 1.8 NCEs per year, p<.01,respectively).Also at the middle school level wesee that the students of the least experienced pilotteachers performed worse than the controls by 2.3NCEs per year (p<.01).
The quality of objectives and the percent ofobjectives met improved with the length of timethat teachers participated in the pilot. Figure 6-12
99Quantitative Analyses
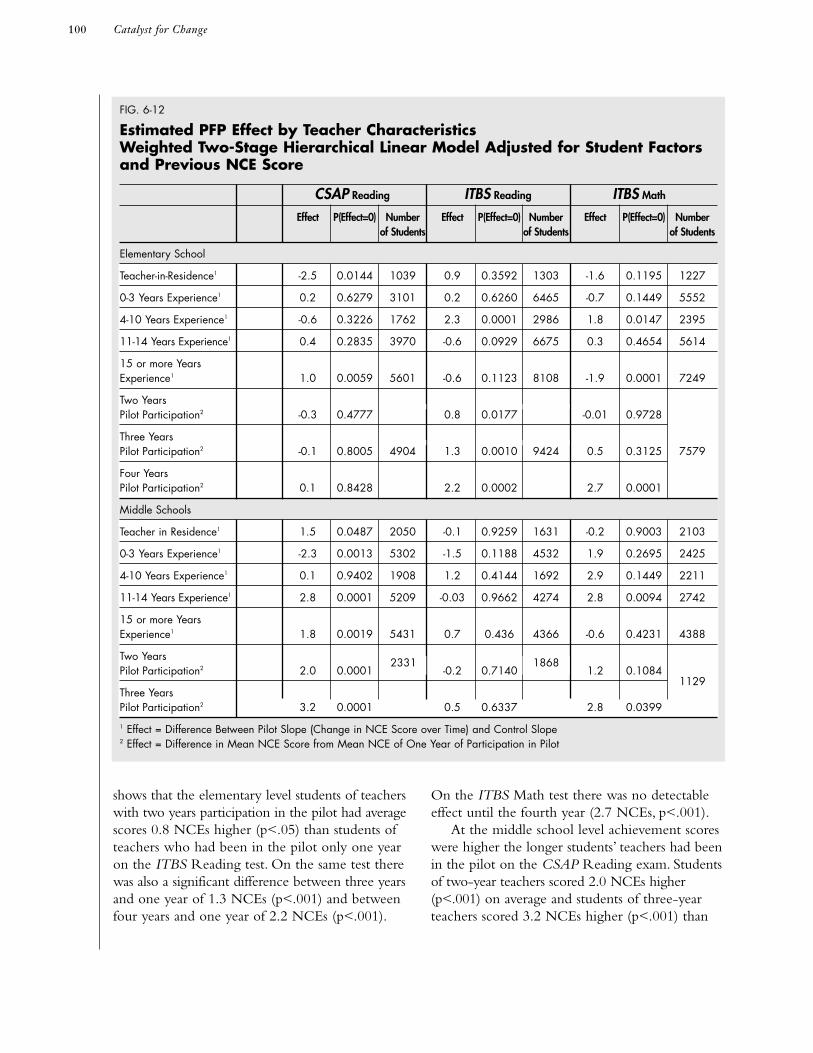
shows that the elementary level students of teacherswith two years participation in the pilot had averagescores 0.8 NCEs higher (p<.05) than students ofteachers who had been in the pilot only one yearon the ITBS Reading test. On the same test therewas also a significant difference between three yearsand one year of 1.3 NCEs (p<.001) and betweenfour years and one year of 2.2 NCEs (p<.001).
On the ITBS Math test there was no detectableeffect until the fourth year (2.7 NCEs, p<.001).
At the middle school level achievement scoreswere higher the longer students’ teachers had beenin the pilot on the CSAP Reading exam. Studentsof two-year teachers scored 2.0 NCEs higher(p<.001) on average and students of three-yearteachers scored 3.2 NCEs higher (p<.001) than
100 Catalyst for Change
FIG. 6-12
Estimated PFP Effect by Teacher Characteristics Weighted Two-Stage Hierarchical Linear Model Adjusted for Student Factorsand Previous NCE Score
CSAP Reading ITBS Reading ITBS Math
Effect P(Effect=0) Number Effect P(Effect=0) Number Effect P(Effect=0) Numberof Students of Students of Students
Elementary School
Teacher-in-Residence1 -2.5 0.0144 1039 0.9 0.3592 1303 -1.6 0.1195 1227
0-3 Years Experience1 0.2 0.6279 3101 0.2 0.6260 6465 -0.7 0.1449 5552
4-10 Years Experience1 -0.6 0.3226 1762 2.3 0.0001 2986 1.8 0.0147 2395
11-14 Years Experience1 0.4 0.2835 3970 -0.6 0.0929 6675 0.3 0.4654 5614
15 or more Years Experience1 1.0 0.0059 5601 -0.6 0.1123 8108 -1.9 0.0001 7249
Two Years Pilot Participation2 -0.3 0.4777 0.8 0.0177 -0.01 0.9728
Three Years Pilot Participation2 -0.1 0.8005 4904 1.3 0.0010 9424 0.5 0.3125 7579
Four Years Pilot Participation2 0.1 0.8428 2.2 0.0002 2.7 0.0001
Middle Schools
Teacher in Residence1 1.5 0.0487 2050 -0.1 0.9259 1631 -0.2 0.9003 2103
0-3 Years Experience1 -2.3 0.0013 5302 -1.5 0.1188 4532 1.9 0.2695 2425
4-10 Years Experience1 0.1 0.9402 1908 1.2 0.4144 1692 2.9 0.1449 2211
11-14 Years Experience1 2.8 0.0001 5209 -0.03 0.9662 4274 2.8 0.0094 2742
15 or more Years Experience1 1.8 0.0019 5431 0.7 0.436 4366 -0.6 0.4231 4388
Two Years Pilot Participation2 2.0 0.0001 -0.2 0.7140 1.2 0.1084
1129Three Years Pilot Participation2 3.2 0.0001 0.5 0.6337 2.8 0.0399
1 Effect = Difference Between Pilot Slope (Change in NCE Score over Time) and Control Slope 2 Effect = Difference in Mean NCE Score from Mean NCE of One Year of Participation in Pilot
2331 1868

students of one-year teachers.The results weresimilar for ITBS Math although the two-year dif-ference was not statistically significant. Students oftwo-year pilot participants scored higher on allthree tests at both pilot high schools, but the dif-ference was only statistically significant for theThomas Jefferson ITBS Reading exam.
G. SummaryAdjusting for differences in school and studentcharacteristics, the estimates of the effect of thepilot on elementary school achievement are nega-tive and statistically significant for five of the sixtests, with no effect evident on the sixth test. Ininterpreting these results, one must keep in mindthat with the large number of observations in thesample it is very easy to detect small differences. It isalso important to consider whether the differencesare of practical significance. For example, the PFP
effect estimate of -0.3 for the elementary ITBSReading test would result in an average drop of lessthan 1 NCE in three years, an amount that wouldbe judged by most researchers to be negligible.
At the middle schools we see more promisingresults. Both pilot and control students achievedmore than a year’s growth on the CSAP tests, withpilot students outperforming controls on the Writ-ing and Math exams.The PFP effects are 0.7 forWriting and 1.6 for Math.The Math result, in par-ticular, is both statistically and practically significant,since it represents an average increase of nearly 5NCEs over a three year period.
Students at the two pilot high schools saw largerincreases in ITBS Language and Math NCE scoresthan the control students. Manual High Schoolstudents achieved positive but not statistically sig-nificant PFP effects for ITBS Reading and allthree CSAP tests.Thomas Jefferson High students
101Quantitative Analyses
FIG. 6-12 CONTINUED
Estimated PFP Effect by Teacher CharacteristicsWeighted Two-Stage Hierarchical Linear Model Adjusted for Student Factorsand Previous NCE Score
CSAP Reading ITBS Reading ITBS Math
Effect P(Effect=0) Number Effect P(Effect=0) Number Effect P(Effect=0) Numberof Students of Students of Students
High Schools
Teacher-in-Residence1 Manual 2.0 0.7168986
-4.5 0.4184 1.6 0.83541124
Jefferson -1.8 0.4054 -2.2 0.5107 6.8 0.0253
0-3 Years Experience1 Manual 3.4 0.3083 -6.8 0.2306 2.8 0.76612014
Jefferson 0.1 0.9752 1.7 0.3024 4.9 0.0044
4-10 Years Experience1 Manual -2.6 0.4305 -6.7 0.4363 -13.2 0.16661067
Jefferson -6.4 0.0845 -4.0 0.3012 * *
11-14 Years Experience1 Manual 0.5 0.8850 -5.9 0.1868 5.2 0.18891513
Jefferson 0.7 0.7228 1.1 0.6872 -0.3 0.9713
15 or more Years Manual 2.5 0.4117 1.5 0.6954 -1.5 0.78972704Experience1
Jefferson -1.1 0.2240 -1.3 0.2920 2.3 0.1615
Two Years Manual 1.6 0.0606 704 3.0 0.0625 702 1.8 0.1718 592Pilot Participation2
Jefferson 0.9 0.1447 972 2.3 0.0011 1179 0.5 0.5451 857
1 Effect = Difference Between Pilot Slope (Change in NCE Score over Time) and Control Slope 2 Effect = Difference in Mean NCE Score from Mean NCE of One Year of Participation in Pilot * Testing rate at Thomas Jefferson High School was too small for a reliable estimate
986
2945
1018
2398
4086 3449
2478
965
2745
926

performed significantly lower on ITBS Reading,but significantly higher on CSAP Reading thancontrol students.Thomas Jefferson’s PFP effectsfor CSAP Writing and Math are small and notstatistically significant.We cannot rule out thepossibility that the achievement gains seen atManual are due at least in part to the reorganiza-tion that the school underwent simultaneouslywith joining the PFP pilot, however, since theresults are supported by those of Thomas JeffersonHigh School, PFP may also have contributed toManual’s positive results.
There is convincing evidence that the highestquality rubric level (4) is correlated with higherachievement. Eight tests (three at the elementarylevel, two at the middle school level, and three atthe high school level) exhibit a statistically signifi-cant positive difference in average achievementscores between rubric level 4 and lower rubriclevels. One of these tests also showed that rubriclevels 2 and 3 are statistically higher than rubriclevel 1. In three tests, the middle levels of therubric are statistically higher than rubric level 4,but in two of these tests the middle rubric levelsare also statistically higher than rubric level 1. Inaddition, five tests showed positive correlationsbetween rubric level and achievement that are notstatistically significant.
There is also evidence that having a teacherwho met two objectives is associated with higheraverage NCE scores at the elementary, middle and
high schools.As is the case with the rubric analysis,the strongest evidence comes from the elementaryschools, where the effects are not diluted by multipleteachers per student.
Teachers-in-Residence were found to writelower quality objectives, and to be less likely tomeet those objectives. Comparing pilot TIRs tocontrol TIRs, we find that the PFP effect is negativeat the elementary level but positive at the middleschool level. Similarly, we see that the PFP effectfor teachers with over 15 years of experience isnegative at the elementary level but positive at themiddle school level.The elementary school resultsreinforce the need for better objective setting sup-port for TIRs and other less experienced teachers.At the secondary level where students are exposedto a number of teachers, more experienced teachersmay compensate for any negative effect of TIRs.
Student achievement rises as length of teacherparticipation in the pilot rises.The increase inobjective quality and percent of objectives met arebeing matched by increases in student achievement.This is a promising result and suggests that a sus-tained focus on objective setting will over timelead to improved student achievement.
102 Catalyst for Change

Catalyst for Change
A. IntroductionThe Denver pilot has evolved in ways that have consistently tried to understand,support and reward the contributions of quality teaching to student learning.By using the progress of students as both the driver and end result, the pilot has served as a catalyst for systemic change. During the past thirty years, therehas been significant national interest in school reform initiatives. Few of thesehave achieved the degree of reach into the system as has Pay for Performance in Denver.
The pilot’s emphasis represents a departure from many earlier attempts by districts in the United States and the United Kingdom to implement some formof performance-based compensation.Their underpinning premises often derailedthese efforts. Some were based on the belief that compensation is the sole or primary incentive for teachers to perform at high levels. Others were designedto be punitive, punishing teachers who were labeled as underperforming.Virtuallyall have been predicated on the idea that merit pay or its equivalent could beimplemented without making major changes in how the school district functions.These operating premises have generally proven to be faulty.
The focus on student achievement and a teacher’s contribution to suchachievement can be a major trigger for change—if the initiative also addresses the district factors that shape the schools. For example, if the priority is on studentachievement, then the district will need to develop the ability to provide schoolswith baseline data on student, classroom and program performance. If teachersand principals are to examine performance in the classrooms, then the districtwill need to provide appropriate assessments and data that follow individual stu-dent growth. If teacher contributions to student progress are to be rewarded, thenthe district will need the capacity to integrate the human resources and studentachievement data systems. If the needs of students, teachers, principals and parentsare to shape the district agenda, then the district will have to reconfigure bud-getary allocations, curricular and instructional support, and professional develop-ment services.
VIIC H A P T E R

Denver introduced Pay for Performance as anew element in a large urban setting.The pilot has been a catalyst for changing the district sothat it could become focused on student achieve-ment in a more coordinated and consolidated wayas required by Pay for Performance.A key part ofDenver’s story is how a pilot, a subsystem func-tioning with a sense of urgency, engendered posi-tive change in a larger institution. Many of thechanges have been systemic—changing how thesystem thinks and behaves.They remain, though,works in progress.
This chapter highlights areas of change whichhave been significant and often subtle.The chapteralso identifies gaps and circumstances which are partof the challenge which lies ahead for the district.
B. The Board of Education andthe Denver Classroom TeachersAssociationUnder Pay for Performance, an unusual form ofpartnership emerged between the Board of Educa-tion and the Denver Classroom Teachers Association.There are numerous examples of collaborationbetween boards of education and unions on issuesrelated to power sharing. Indeed, through much ofthe 1990s, many districts throughout the UnitedStates engaged in various forms of shared decision-making. Differing markedly from these efforts,Denver leaders came together to collaborate andtake risks on behalf of student achievement.
The Denver Board of Education has beensteadfast in supporting the implementation of thepilot. Some board members initially had a level ofconcern about the union’s commitment to thepilot. However, over the course of the pilot, allboard members came to value the new level andform of collaboration which comprised Pay forPerformance. One board member notes,“It hasbeen a forum for the district and the union towork collaboratively and develop trust in oneanother.This is a very different relationship fromthe past, and Pay for Performance has given usthat opportunity.”Another board member adds,“The Board of Education and the Association arenow working together on PFP; this is a lesson....It’s working together on behalf of kids.... It willhelp us move closer to student achievement.”When discussing the impact of the pilot, yet
another board member stresses, “Strengtheningthe relationship [with the union] is the mostimportant thing.”The view of the board overall is summarized by one member,“The first lessonwe learned is that you can partner with teachers.It is possible to change the way business is done.”
The Denver Classroom Teachers Association hasalso made a serious commitment to this collabo-ration.A key leader comments,“DCTA has placedthis project as our top priority.We have placed ourbest people and given most of their time to thesuccessful completion of the pilot.”A leader notes,“This project has been the single best effort theDenver Public Schools and the union have beeninvolved in—without exception.”Another leaderadds,“The collaboration has been amazing.”
One of the collaboration’s most pivotal trialscame early in the life of Pay for Performance.From the time the pilot was formulated in early1999 through Spring 2001, the superintendencyof the Denver Public Schools changed five times.This turnover is described in detail in Pathway toResults. Having five chief executive officers in atwo-year period would derail most organizationsand, certainly, most new initiatives. Many schoolreforms have been undercut by far less dramaticevents. In contrast, the Denver Board of Educationand the Association worked together.They notonly ensured that Pay for Performance wouldremain a priority during this period of leadershipturmoil, but helped the pilot to achieve evengreater organizational reach.
This board/union collaboration on behalf of student achievement is one of the significantdevelopments resulting from the pilot. It is alsoone of the most tentative. If the collaboration isnot nurtured carefully and extended to other partsof district conduct and operations, it can easily fall victim to the divisiveness among boards,unions and districts that characterize much ofurban education.The pilot has demonstrated abetter way of conducting business.
C. Focus on Student AchievementThe pilot has significantly increased the schooland district focus on student achievement.Thisfocus has grown with each succeeding year of pilotimplementation. It is a trend that is identifiable inboth survey responses and interviews.
105Catalyst for Change

More than 70% of survey respondents haveconsistently indicated that student achievement is a goal of the pilot. Perceptions of the increased focuson student achievement, however, have changedover the course of the pilot. In 2001, 47.5% ofrespondents agreed that “Pay for Performance had led to a greater focus on student achieve-ment at my school,” while 52.5% disagreed. In2002, respondents were asked if they thoughttheir school’s focus on student achievement hadchanged. In response, 57.4% indicated that it hadimproved, while 40.1% noted that it had stayed the same. In 2003, when asked about the impact of Pay for Performance, 68.5% of the respondentsindicated that the pilot had had a positive impacton their “school’s focus on student achievement”compared to 29.9% who felt that the pilot had not affected this focus.The 2003 responses are particularly noteworthy when viewed by school;all but one of the pilot schools believed that Payfor Performance had a positive impact on therespective school’s focus on student achievement.
As Pay for Performance became more familiarto pilot participants, and as the implementation ofthe pilot was continuously strengthened, the focuson student achievement became a growing realityat the pilot schools and affected practices as wellas perceptions.A pilot teacher says,“I think [PFP]has brought teachers and administrators togetherworking on the learning process.”
Through the pilot, an emphasis on under-standing individual student growth emerged at theschool sites.This was a necessity for implementingPay for Performance at the pilot schools.Thisemphasis subsequently expanded to other schoolsin the district. It was later reinforced by other district initiatives and by the requirements of theNo Child Left Behind Act.
The focus on individual student growth hadimplications for the classrooms.As described inChapter V, teachers and principals were better ableto set objectives that were based on the learningneeds of students.At many of the pilot schools, theobjective setting went from being an initial exercisein writing to more of a practice of thinking dif-ferently about instruction. In addition, there werechanges in how teachers approached the meetingof these learning needs. One pilot teacher indicates:“There are many positives with PFP in our school.
School-wide focus is one of them. I feel this had a positive effect on our school.” Another pilotteacher adds: “It helps focus on achievementthrough the year. It helps teachers plan towards a goal in increments.”As they were able to examineand understand their students’ progress differently,it was easier for teachers to focus more on meetingthe needs of individual students.
At the control schools, there were principalsand teachers who began using the pilot’s templatefor preparing objectives as a tool to help them tofocus on student achievement.They indicated thatthey were going ahead with this practice evenbefore it was instituted by the district. In suchways, the pilot’s emphasis on student achievementhas seeped into the system and has created moredemand for tools that would help schools to acton this priority.
While there are varying opinions in the centraladministration as to the advisability of adoptingPay for Performance into the district, there aremany in the administration who feel the pilot hasmoved the district toward a clearer focus.“Therehas been a greater focus on student achievementbecause of the pilot,” a key leader notes.Anotheradds,“Pay for Performance has started us thinkingoutside the box.... It has helped us understand whywe must focus on accurate data concerning teach-ers and students. It has shown us how importantthe setting of objectives is to improving studentachievement. PFP has helped us build energyaround accountability and student achievement.”
This focus on student achievement has pro-gressed and been reinforced over the four years of the pilot. It represents a serious step forward for the district.
D. Shaping Implementation:TheRole of Teachers and PrincipalsTeachers and principals were provided with multipleopportunities to influence the course of the pilot.For many, this was a marked departure from pastdistrict practice.As in other large districts, Denver’ssite level practitioners characteristically describedpast reform and improvement efforts as beingdone to them, rather than with them. Othersdescribed what they perceived as a repeated patternof the needs and priorities of the sites being
106 Catalyst for Change

overlooked by district initiatives. In contrast,the Pay for Performance pilot and study made itpossible for the voices of teachers and principalsto be heard and acknowledged.
Due to the construct of the pilot, the activismof the Design Team and the application ofresearch findings and related technical assistance,teachers and principals were able to becomeactive shapers, instead of being passive beneficia-ries or victims, of the pilot.This involvementbegan at the very start and continued throughoutthe four years of the pilot.
Teachers made clear through their commentsthat their involvement would be active.As detailedin Chapter II, the participation of the pilot schoolswas based on faculty votes.Teachers indicated theywanted “a chance to have a say,”“to be part of thepilot for input,” and “to prove if PFP can or can-not be fairly implemented.” One teacher indi-cated,“This process is the future.We might as welldo it first.”Another added,“I wanted to participatein figuring out how to make it work.”At one site,a teacher commented,“I wanted to be in on thedesign of the project—to be able to have inputrather than be told how it will be a few yearsdown the road.” One teacher mentioned,“Thefact that we are an ‘at risk’ school—I wanted a realworld account of the PFP program to be put intothe records.”Another stated,“The staff is a confi-dent bunch and figured, if this would be imple-mented in the future, we should have a hand inshaping it.”
The practitioners at the pilot schools used thefull range of pilot-provided vehicles to make theirvoices heard. In particular, these included the study’sinterviews, surveys and classroom observations,regular sessions and discussions with the DesignTeam, and foundation-sponsored events.
Many teachers and principals thought carefullyabout how to shape the pilot. A teacher stated,“Just being able to be heard has been so importantto my teaching and practice.” Initially, manyteachers and principals just wanted to master thebasic mechanics of the pilot. However, as the pilotevolved, teachers and principals grew in theirunderstanding of what they needed to be successfulin their classrooms and schools. Increasingly, astrue shapers, they identified gaps in the systemand needs that had to be addressed.They began
placing demands for supports that would enhancetheir work with children. Comments ranged from“I need an assessment that complements CSAP,”to “the curriculum needs to be aligned with theassessments,” from “there have to be multiplemeasures to be fair,” to “I need to know what agood percentage for gain would be.”
Site level practitioners made these needs visibleduring the pilot’s four years.They are not isolatedissues; school staff experience similar needs through-out the district.The pilot and study provided thevehicle for the concerns of the sites to begin todrive district actions.This helped both the schoolsites and the central administration to become moresensitive to the needs of the classrooms.
E. Third Parties The national track record on reform shows thatthe participation of external parties can be helpfulto school and district improvement efforts. It hasproven most pivotal when focused on issues of realimport to students, practitioners and communities.It has proven far less helpful when it supportspiecemeal programs.
When the pilot was created, the sponsoringparties agreed that they would seek external fundingpartners, technical assistance and research support.They knew that Pay for Performance was a highstakes undertaking for the district and wanted tomaximize the results that would come from thepilot.Although there can be a tendency for anylarge organization—particularly a public institution—to be somewhat xenophobic, it is not unusual fora school district to seek outside financial andtechnical support. Using external research to helpa district be open to an honest mirror is unusual.The Board of Education and the Association feltthat it would be important to the pilot. Later,due to the commitment of the Design Team, itbecame part of a larger district interest in becomingmore of a learning organization.
There is an inside-outside dimension to effective school reform. Simply put, educationalreform has proven extremely difficult to achievewithout outside help.There are two essential reasons for this circumstance. First, due to theentrenched nature of large bureaucracies, internalreformers need to be bulwarked by external
107Catalyst for Change
advocates. Second, due to the complexity of theissues affecting public education, a broader rangeof expertise is needed than can be found solely in districts.
As detailed in Chapter X, foundations tooksignificant risks in supporting the field testing andstudy of an unproven venture in linking studentachievement, in part, to teacher compensation.Askey participants and partners, the foundationsproved one of the most critical third parties.
The impact of the third parties was “reallypositive in the end. Everybody has a differentpush on the district.Without the third party support, the union and district couldn’t have done it,” notes a leading philanthropic supporter.Another foundation leader adds:
“I don’t think we would have the pilot today if DPS didn’t think they were being watched.This project cannot drift into the night becausepeople are watching what is happening. HavingCTAC and the foundations involved brings ina significant level of accountability.They provideaccountability.The district can’t drift quietly intothe night.The third parties know their stuff.”
While the third parties functioned as the conscience of the pilot, they were also willing to venture into new educational terrain.Anotherfoundation leader comments,“This project callsfor taking huge risks on everyone’s part.AnythingI can do to help the project, I am willing andwant to do.We will want to monitor the projectas it continues.We think it is important to have a third party like CTAC involved.”Yet anotherfoundation leader states,“The impact of this project is important and designates a new timeand age.”
An important corporate leader feels that thirdparties, organizational stability and Pay for Perfor-mance have the potential to shake up the patternof business-as-usual practices. He comments,“CTAC plays a central role in really making a difference.The biggest problem is stability withthe superintendent and board.The history of educational reform is that it has been stillborntime and again and teachers are jaundiced fromreform efforts.” He believes that the blend of new
directions, more stable leadership and third partysupport are encouraging to those who seekchange in the district.
The third parties operated in a highly collabo-rative manner with the Design Team, the Board of Education through its liaison to the pilot, theadministration and Association leaders.The spe-cific entry points for the third parties varied (e.g.,funder, technical assistance and research provider,communications specialist, corporate leader).However, there was common ground in their collective emphases to help the district buildcapacity, learn from the research study and makechange. Much of this input was regularly chan-neled through the Design Team.
Particularly because of the involvement of thethird parties, issues that long affected the districtwere now put on center stage.This provided theprotection needed for the Board, the administration,the Association and, most pivotally, the Design Teamto take action on findings and recommendations,an essential function. Due to the highly visiblenature of public education, there is characteristicallya de facto tendency to manage for impressionrather than results.There is generally a worrimentabout how issues will play out in the press or thepolitical arena.This concern leads to defensiveleadership.Through the pilot, issues that neededattention began to get attention.
The district was particularly interested inlearning from the pilot research findings.A seriesof detailed management letters were prepared byCTAC for the superintendent and circulated tothe Design Team, the Board of Education and theAssociation.These management letters delineatedemerging issues, concerns related to district capac-ity, and recommendations. Many of these issuesand concerns are discussed in Chapter VIII.The management letters became the basis for analysis,discussion and follow-up by district and pilotleaders as well as by external funders.This sameapproach was used to migrate the findings andrecommendations in Pathway to Results, the mid-point report. By taking these steps, Denver leaderswere moving the system in a new direction—becoming a more research-driven district.
108 Catalyst for Change

F. Teacher Compensation andPay for PerformancePay for Performance has been the catalyst fordeveloping a fundamentally new compensationplan for teachers in Denver.This plan is nearingthe final stages of development.The members ofthe Association and the Board of Education willvote on the plan in 2004.
In June 2000, the sponsoring parties faced acritical junction.The pilot had been embedded in the contractual agreement between the districtand the Association.The final agreements in thecontract had resulted from intense, eleventh hourround-the-clock negotiations.The final contractuallanguage described the framework for Pay for Per-formance. It did not, though, focus on the desireor intent to develop a new compensation plan.
As described in Chapter II, the need emergedto clarify the purpose of the pilot.At a June 2000board retreat with CTAC, board members indicatedthey had intended for the pilot to lead to thedevelopment of a new compensation system.Yetthe pilot was built around short-term bonuses,and a new compensation system would require aspecial developmental effort.The ensuing discus-sion underscored the importance of clarifying the purpose of the pilot and addressing the issue ofthe development of a compensation plan.Thissubsequently became the joint emphasis for boththe board and the union.As described further inChapter VIII, the Joint Task Force on TeacherCompensation became the structural embodimentof this collaboration and priority.
Pursuing a new direction in a compensationsystem is a major undertaking in any district orcommunity.When this involves potentially linkingpart of a teacher’s compensation to studentachievement, it is particularly significant. In Denver,it became an opportunity for multiple parties—thecentral administration, the union and the DesignTeam—to engage diverse publics to present theirviews on the issue of compensation.The pilot, ineffect, provided the basis for engaging constituenciesaround a potential shift in public policy.
Teachers and administrators have used surveys,interviews and meetings with the Design Team,the Association and the Joint Task Force as waysto make their concerns known.They have indicated
both their preferences and their perceptions ofprevailing educational and political realities.Thiswas exemplified in the Spring 2002 survey resultsof pilot schools. Sixty-one percent of the respondingteachers agreed or strongly agreed that “studentachievement will eventually be connected toteacher compensation in this district,” while 39%disagreed or strongly disagreed. In addition, 56.1%of the teachers felt that “a teacher’s contributionto student achievement should be rewarded infinancial terms,” whereas 43.9% disagreed orstrongly disagreed. However, less than half (47%)agreed or strongly agreed that “a compensationplan that includes student achievement could workin this district; 53% disagreed or disagreed strongly.
The concerns of teachers and administratorsabout a larger scale implementation of Pay forPerformance provide a roadmap of issues that thedistrict will need to address.Their concerns covera range of critical topics.
On the overall compensation plan, a centraladministrator indicates:
“[It would work] if teachers were heldaccountable for 85% of their kids, were welltrained and well supported . . . if the agree-ment were child-centered, not adult-centered,if assessments were at their fingertips, if profes-sional development were strong—both centraland site directed—and if there were parentinvolvement, then maybe it would work.Wewould need: consistency of curricular support,lots of administrative training and methodologyaligned to support teachers. It all needs to bealigned with the formula for highly impactedschools.”
On the link between Pay for Performance,instruction and evaluation, a pilot teacher states:
“In order for PFP to work—for setting up goalsand how to meet those goals, there are somepieces that are missing.Teachers need to beevaluated on a different level. It has to be doneby people that are practitioners that know howto evaluate instruction.That piece is not there.”
On the curriculum, a pilot teacher notes:
“I have a hard time feeling that the curriculumcan be standardized across the district for every
109Catalyst for Change

sschool in order for the work of some teachersand not others. If the district is allowed tomove ahead on PFP there must be much morestandardization in the instructional areas.”
On the importance of examining individualstudent growth, a pilot teacher comments:
“Student achievement has to be looked at on an individual student basis in order to see the growth of each student.The teacher’s professional development needs to be takeninto account.”
On an issue of fairness, a control high schoolteacher asks:
“Some teachers have 12 kids in class, somehave 35.There is this huge question of fairness.It’s not like elementary school. How can youknow 160 kids?”
On the issue of mobility, a speech and languagespecialist questions:
“It’s really a great idea to supplement our pay,but how do you measure success when a largepercentage of our schools’ populations movesfrom school to school in the course of a year.”
G. ParentsSimilar to many large districts, Denver’s trackrecord in parent involvement is inconsistent acrosssites.This gap affected parental knowledge about thepilot. One active parent confirmed the sentimentsof many interviewed parents when she repeated,“I can’t believe I didn’t know that [it] was a pilotschool. I can’t believe I didn’t know that myschool is a pilot school.”
Despite ongoing communications challenges,there were regular efforts to try to reach out more effectively to parents. In particular, parentsweighed in on a possible new compensation plan.For example, in Spring 2002 and Spring 2003,they provided responses to a range of concerns.
Parents clearly identified the importance of a link between student achievement and teachercompensation. For example, 82.1% of the parentrespondents agreed or strongly agreed that “ateacher’s contribution to student achievementshould be rewarded in financial terms,” while18.8% disagreed or strongly disagreed. Regardingwhether a compensation system that includes studentachievement results could work in this district,77.5% agreed or strongly agreed. In addition, 70%agreed or strongly agreed that “student achievement
110 Catalyst for Change
FIG. 7-1
Potential Effects of a New Compensation Plan Based in Part on Student Achievement
Parents 2002 Parents 2003
Where a new compensation plan based in part on student Strongly Agree/ Strongly Disagree/ Strongly Agree/ Strongly Disagree/achievement could lead: Agree Disagree Rank Agree Disagree Rank
Improved student achievement 78.2% 21.8% 4 71.0% 29.0% 5
A greater school focus on student learning 86.9% 13.1% 1 82.5% 17.5% 2
Teachers working harder 86.9% 13.1% 2 81.8% 18.2% 3
Students working harder 64.6% 35.4% 5 66.4% 33.6% 7
Greater stress for teachers 64.4% 35.6% 6 72.3% 27.7% 4
Greater stress for students 41.8% 59.2% 8 54.0% 46.0% 8
Teaching to the test 78.4% 21.6% 3 83.2% 16.8% 1
Less attention paid to subjects not tested 59.0% 41.0% 7 70.4% 29.6% 6
should be connected to teacher compensation inthis district.” Further, approximately two-thirds(68.4%) of the parent respondents believed that“student achievement will eventually be connectedto teacher compensation in this district.”
Parents also indicated what they felt could resultfrom a new compensation plan.As Figure 7-1 indi-cates, the parental responses were consistent insequential years.
Parents in both 2002 and 2003 felt that stronglythat a greater school focus on student learningcould be the result of a new compensation plan thatwas based, in part, on student achievement.Theyalso felt strongly that teachers would be workingharder and that they would teach to the test.
Parents also indicated what they want to see in any compensation plan.They want studentachievement to be part, but not the entirety, ofthe plan.They want teachers to be both rewardedand held accountable. Parents are also in agreementwith teachers on the use of multiple measures forcompensation purposes.As an example, 94.1% ofthe parents and 93% of the teachers agreed orstrongly agreed that there should be “more thanone measure of student achievement used todetermine performance.”
While engaging more parents remains a workin progress in Denver, Pay for Performance provideda way for eliciting parental concerns on a potentiallymajor new direction for union/managementagreements and policies.
H. SummaryThe Denver pilot has been a catalyst for change.It has led the district to pursue new directions in both process and substance. Pay for Perfor-mance has been based on an unusual leadershipcollaboration involving the board and union. Ithas brought in an array of external parties asfinancial supporters, advocates, technical assistanceand research providers and, above all, as tough,honest mirrors.
The pilot has generated an increased focus on student achievement. In so doing, Pay forPerformance has enabled the voices of practitionersto shape and influence practices and procedures.Thislevel of change has, in turn, extended to the initi-ation, discussion and planning of a potential newcompensation system.Whether ultimately approvedor not, the process of engaging multiple publics isnow a part of the Denver educational landscape.
Pay for Performance has enabled issueswhich have adversely affected district progress,sometimes for many years, to be put on centerstage.This has engendered discussion and,frequently, action.Taking this course has helped the district to develop an increased capacity tomake mid-course corrections—a rare occurrence in large school districts and a result that is diffi-cult to achieve.
111Catalyst for Change
OrganizationalAlignment andSystem Quality
A. IntroductionA major initiative that focuses on improving student achievement—while con-currently exploring changes in the teacher compensation system—goes to theheart of the district mission and structure. In this context, a district can notachieve greater than usual results while using business-as-usual practices. Centraldepartments, in particular, need to move beyond responding to requests andbecome active in reshaping their services to address the issues and impedimentsrelated to the pilot implementation at the schools.This is not an easy course ofaction.All departments struggle with many pressures and deadlines.Additionaltasks are not always welcomed. In Denver, some central administrators had seriousreservations about the viability of the pilot.Yet the creation of a board and unionpriority requires that these issues be resolved and that departmental priorities be reset. Otherwise, the priority has little meaning.Addressing such a priorityinvolves taking on the serious challenge of aligning the organization, from thetop-down and the bottom-up, in support of Pay for Performance or any othersystemic initiative.
Educational reforms rarely challenge the core organized capacity of a schooldistrict, but more typically target programs, teacher development or, perhaps,school governance.This dimension of educational reform is both philosophicaland practical in its rationale.A philosophical rationale is that a reform aimed atchanging a particular aspect of student learning or feature of an educationalprogram should begin at the school or teacher level. Practically, it is often far
VIIIC H A P T E R

easier to secure internal approval and externalfunding when a project is small and discrete. Ifthere is a concern, for example, about the weaknessof mathematical problem-solving in a group ofstudents, reformers may initiate a professionaldevelopment program that helps teachers to structure problem-solving lessons for students.This is a bottom-up or grass roots approach thatmore readily engages the primary stakeholders,teachers and students.
However, this approach to improving problem-solving in mathematics may also occur for reasonsrelated to the larger organization.The advocatesof the problem-solving reform may know that the math curriculum is not articulated or alignedwith materials and assessments or that the teachersof the students lack adequate preparation in math-ematical content.Yet the task of reforming theseelements within the school district or statebureaucracy is daunting and therefore avoided.The result is the educational reform phenomenonoften labeled as “tinkering around the edges” ofthe district.As a consequence, many reforms thatare well-intentioned and implemented thoughtfullyfall significantly short of their potential.They donot resolve or address root problems because thedistricts are not changed.There can never beenough fixes at the school level for a problem thatoriginates in—and is perpetuated by—the largerorganization.At best, a quality school change willcapture the imagination of policymakers for ashort period of time.At worst, it will die due to alack of sustainability and institutional support.
The reverse of this scenario is the well-knownhorror script of top-down reforms.These arecharacteristically driven by both educational andpolitical forces.At best, they are inadequatelyfunded and ineffectively staffed.At worst, theyengender minimal commitment from school staffand can derail positive improvement efforts thatare already underway at the schools. Reforms thattarget the organization of school districts increas-ingly originate outside of the system—legislation,charters, vouchers, etc. Legislated reforms such asstandards and assessments or key elements of NoChild Left Behind can be well-founded. However,in the implementation process, they often becomecompliance-focused at the district level, rarelyresulting in classroom improvements. How many
standards-based school districts can say that all oftheir classrooms are standards-based? Ideally, schooldistricts should function on behalf of the children,self-correcting and readjusting systems as needed inorder to improve client services. In reality, though,large districts often function on behalf of thebureaucracy, such that change is cumbersome,ineffectual, and politically charged.
Denver Public Schools is a large district.Thepilot involved a cross-section of the district’s clientand service base, but a small percentage (13%) ofDenver's schools.Yet these schools presented, inmicrocosm, the challenges of the broader district.In so doing, the necessary interfaces of the pilotwith the curriculum, assessment, student data,human resources and other parts of the systemwere complex, extensive and unexpectedly difficult.This led one central administrator to refer to thepilot as “a virus.”Additionally, there was not cleardirection to central administrators about the priorityof Pay for Performance in the context of otherdistrict priorities.
Both central and site professionals describe theensuing problems.“At the beginning [of PFP], therewas a scramble of last minute negotiations. PFPwas conceived in a rush, produced in a rush, andthe labor was a mess,” notes a central administrator.Another member of the administration adds,“Abarrier at the beginning, the district was not surewhat we were doing with [PFP].”A third centraladministrator comments,“With all of the differentsuperintendents, the pilot got lurched around.”The sites also saw these issues.“There was stumblingand miscommunication in the first year.We wereunclear about where the process was going,” says a pilot school principal.A teacher leader indicates,“We have refined the process over time. I wishwhat we have now was what we started with.There was a lot of trial and error along the way.”
In Denver, district support systems were seriouslychallenged by the implementation of Pay for Performance, resulting in tensions between thepilot and the broader district. Many of these tensionswere creative. Using the site visits, the recommen-dations in Pathway to Results, and the ongoingmanagement letters as a springboard, many opportu-nities for change were identified and district actionresulted.Where district departments responded topilot needs, such as the development of an intranet
113Organizational Alignment and System Quality

system, all students and teachers benefited. However,the pilot also provided opportunities to improvedistrict systems, in the interest of all students, thatwere under-utilized.These form the challenges of organizational alignment which lie ahead forthe district.
Many necessary interfaces were worked outover the course of the pilot, but others are fartherfrom being resolved.This chapter examines severalareas of pilot impact on key district systems andthe impact of the district’s response on the qualityand outcomes of the pilot.
B. Leadership Changes, Commitment and Trust“The pilot has been the conscience of the district,”notes a teacher leader.“It has also revealed theproblems in the district.”As described in ChapterVII, Pay for Performance has placed many keyissues on center stage. It has also provided a protectedarena in which to address these issues. In so doing,the pilot created many opportunities for leaders to,in fact, lead.
A series of leadership changes occurredthroughout the life of the pilot.As discussed ear-lier, there were five superintendents or interimsuperintendents during the first two years of thefour-year pilot.Additionally, over the pilot’s fullduration, there has been 65% turnover of principalsin the pilot schools.There was a restructuring of the district into four areas supervised by fourassistant superintendents.There was a restructuringof a large pilot high school into three small schoolswith three principals. Further, there were changesin senior management positions.These changesincluded establishing the new position of the chiefacademic officer, which was unfilled for a periodof time.
Turnover in leadership positions, with a resultantamount of destabilizing, is a recurring problem inurban school districts. However, the number, typesand levels of the changes during the life of theDenver pilot greatly complicated the implementa-tion of Pay for Performance. It also exacerbatedtrust issues between pilot participants and the districtbecause communication from the district aboutthe priority of the pilot was inconsistent.
The representative opinions of participants andother stakeholders near the end of the pilot’s third
year (Spring 2002) illustrate the prevailing concerns.“PFP will not go forward in this district.Teachersdon’t trust the district. PFP is not a bad idea butwe just don’t trust the powers that be,” states a pilotteacher.A pilot principal adds,“There is a confuseddistrict mission and poor communication [betweenadministration and schools]. Now I ignore 900 Grantin order to stay focused on what is needed here.”
There is a measure of tension in the relationshipbetween any central body and its satellites.This iscertainly true in the relationship between a centraladministration and the schools. Pay for Performanceenabled these issues to move from the subterraneanlevel of discussion to a more visible forum, requiringaction. For example, a teacher leader states,“Weneed better leadership. Each department has anagenda but no one is in charge.”Another indicates,“In the past it was the hierarchy of district structure.Now it is middle management....They act likesomething awful is going to happen....They havenot taken time for the [PFP] training.”
Many of the participants felt it essential for Pay for Performance to be supported.“I just hope[district leadership] gives [PFP] a chance. So manyprograms don’t stay around long enough to knowif they work or not,” says a parent.An externalsupporter comments,“The central administrationenjoys only a modicum of trust from the trenches.I’m not sure [the new superintendent] has made adent. Five superintendents in less than three yearshas to be an impediment.With the changes insuperintendents, people become busy thinkingabout other things. PFP becomes one of manyimportant things.”A teacher adds,“There has beena failure by the administration to bring the PFPconcept along.This has caused a setback to bedealt with going into the election.”A pilot princi-pal feels,“There has been inconstant leadership.”
The stability and commitment of quality district and school leadership during significantimprovement efforts contribute markedly to thepotential success of reform. On the other hand,the lack or perceived lack of commitment andsupport detract from potentially positive results.Remaining neutral or uninvolved is perceived as alack of commitment. Similarly, if leadership is per-ceived as hedging bets—providing partial but notwholehearted support—then a mixed message issent to the sites.Through many changes of leader-
114 Catalyst for Change

ship, these issues shaped the landscape for theimplementation of the pilot.
The perceptions about the changes in the centraladministration and the related operational prioritiesshould be understood contextually.While therehave been serious concerns raised about theadministration, there also have been substantivecontributions made by central units to the pilot.These are described throughout this chapter.Thecore issue regarding priorities is encapsulated byone central administrator who, while anticipatingthe demise of Pay for Performance, states, “Inorder for PFP to have worked, it should havebeen the primary task or focus.”
The leadership of the Denver ClassroomTeachers Association, the Board of Education andthe Design Team has largely remained stable duringthe course of the pilot.The significant contributionsof the union and the board are discussed in ChapterVII. In addition, the Design Team has been pivotalin developing support systems for teacher partici-pants and building bridges between the pilot anddistrict services. However, as noted in the mid-point report, the very presence and effectivenessof the Design Team may have led a number ofcentral administrators to believe that they did notneed to assume responsibility for the pilot.
As Pay for Performance moved forward, morecentral administrators did become involved inproviding services and support to the pilot.Therewere distinct variances in the scope and extent of their involvement. For example, the currentsuperintendent assigned several key administratorsto drive major supportive changes in areas rangingfrom compensation planning to human resourcessystems. Some district administrators have workedto address specific issues, as in the loan of anassessment department staff member to work onthe development of the data system that givespilot teachers better access to student assessmentdata.The involvement of others, though, often hasfallen short of assuming responsibility for a successfulpilot implementation.
There are also issues of trust which affected theclimate for implementing Pay for Performance.All school reform efforts require a measure oftrust between district and school leadership andbetween leaders and teacher participants. Pay forPerformance, which involved a significant level of
risk-taking on the part of all participants, especiallyteachers—whose compensation was at issue—wasparticularly demanding of a trustworthy districtleadership effort.
Issues of trust within the district have come tolight at several levels.They do not just exist betweenthe central administration and the schools. Besidesthe lack of trust felt by pilot participants for districtleadership, interviewees have cited trust issuesbetween teachers, and between teachers and prin-cipals.These issues are described in Chapter V.Such concerns are important particularly in lightof recent research which indicates a correlationbetween trust and student achievement at schools.1
The interview data near the close of the pilotindicate that little progress had been made inchanging perceptions about the levels of trust inthe district.
CommunicationsThere were several dimensions to the communi-cations strategy for Pay for Performance.Theseinclude the communications within and amongthe pilot schools, between the pilot and the centraladministration,Association and Board, and broadercommunication to the non-pilot schools and thecommunity at large.These are substantive require-ments of a pilot.
Different audiences had markedly differentlevels of understanding of the pilot. Due to theirdirect participation in Pay for Performance, pilotschool teachers and administrators came to havethe greatest understanding of the overall efforts.Control school interviews and survey data showthat non-pilot teachers and principals lack funda-mental information about the nature of Pay forPerformance and, in some cases, are unintention-ally operating on misinformation.Althoughbuildings have union representatives and princi-pals who share information, it has proven difficultto communicate accurately what is happening in the pilot, particularly for the level of decisionmaking at which non-pilot teachers will have to engage.Also, as Chapter VII indicates, parentsare generally not well informed about Pay forPerformance, regardless of the schools their children attend.
Recent research shows that teachers who actually engage in performance pay efforts are
115Organizational Alignment and System Quality

far less fearful of their impact and more open to changes in compensation systems than teacherswho have not participated.2 Non-pilot teachershave not reached the same level of understandingor trust of a compensation system based in part, onstudent achievement as have pilot participants. Fur-ther, since these schools did not elect to participatein the pilot, there is likely less openness to such achange at the outset. So the non-pilot schools, bynature, are somewhat of a difficult audience.
Interview responses by the end of the pilotshow that a range of practitioners feel there havenot been sufficient communications from the districtin support of the pilot.A teacher leader comments,“District communications are flawed.What theprincipal is hearing and [what] I am hearing isdifferent.”A central administrator adds,“I don’treally have enough information about PFP.”Thechallenges of communicating a major initiative toa district and community are significant.Whilethe pilot undertook many communications efforts,greater organizational alignment in support ofthese would have benefited Pay for Performance.
The district will need to continue to exploreways to communicate to all of its constituents theimportance and potential of Pay for Performanceto improving the education of Denver’s young-sters. However, the remaining challenges shouldnot obscure a key fact.As one control schoolprincipal discussed,“perhaps the most impressivecommunication about the pilot is the fact that thedistrict, which is known for not sustaining initiatives,has stayed with the pilot for four years.”
C. Structure of the PilotLeadershipDesign TeamThe Design Team members were charged withimplementing the pilot.Their role is described indetail in Pathway to Results and Chapter II of thisreport.Throughout the pilot, the Design Team’sfour members approached the work of Pay forPerformance with a sense of passion, commitmentand urgency.This was, alternately, both facilitatedand exacerbated by the Design Team’s place in thedistrict’s organizational structure.
While the Design Team began by focusing ongetting the pilot started at the initial schools, itsscope of responsibilities soon increased.The
Design Team became the fulcrum for working withinternal leaders and departments. It was also theprimary point of contact for external supporters,including funders, research and technical assistanceproviders, and communications specialists.
Throughout the pilot, the Design Team con-tinued to refine the objective setting and pilotsupport processes (see Chapter IV), promotingimprovements that many participants appreciatedbut that some interpreted negatively.“The pilothas changed so much since inception, what itsgoals are. One problem is that the changes weren’tclearly articulated. Few people knew what wasreally happening. PFP is a moving target.They arechanging their minds about what it is about,” acentral administrator critiques.A pilot teacheradds “The DT should stop continuously makingchanges to the stated desires for objective setting.”Another pilot teacher comments,“At the begin-ning we didn’t get a lot of explanation and helpwith what we were supposed to be doing andwhat was expected. It has gotten better.”
Working collaboratively with internal andexternal allies, the Design Team pushed for districtchanges on issues related to assessments, datacapacity, professional development, and others.Over the course of the pilot, the Design Teampursued these activities in ways that did not fitneatly within the district’s organizational structure.During different administrations, the Design Teamreported formally or on a de facto basis to thesuperintendent, the pilot champions and/or thechief academic officer. It was not a traditional fitwith the organizational chart of the district.
The Design Team’s ability to operate flexibly—essentially outside of the organizational chart ofthe district—has been a double-edged sword.Acentral administrator comments,“There need to be tighter links to the line operative. [On the otherhand] it allowed the pilot to experiment by beingoff line.There are pros and cons. It gave freedomby not being buried in day-to-day [line] responsi-bilities.”The Design Team was able to advocatewith many central units for greater pilot support.Yet it had little authority with district depart-ments whose work affected the implementationand the study of the pilot.Also, there were severalcentral administrative interviewees who stated that the Design Team, rather than their respective
116 Catalyst for Change

departments, was funded to advance Pay for Per-formance.
Leadership TeamDetermining effective ways to involve district andcommunity leaders was an ongoing challenge forthe pilot.There were a few false starts before aneffective vehicle was identified.An initial steeringcommittee was formed in November 2000.Thisstructure was soon followed by a more integratedapproach—the Leadership Team—in June 2001,one which directly involved key internal andexternal partners.As this approach was honed andfocused, the broader leadership functions began tobe separated from the day-to-day functions ofimplementation.An effort was made to create anagenda that invited key partners to provide supportand react to the direction of the project.Themeetings involved leaders from the Association,the Board of Education, the district, the fundingcommunity, the Design Team and the CommunityTraining and Assistance Center (as the pilot’sresearch arm). Even though there were changes inpersonnel, the different entities met on a regularbasis to serve as a resource for the pilot.
Joint Task Force on Teacher CompensationAs reported in Chapter VII, members of theBoard of Education indicated during the June2000 retreat that a core intent of the pilot was todevelop a new salary schedule for teachers that in part links student achievement and teachercompensation.The Association shared this interest.
Later in that same year, CTAC sent a manage-ment letter to the Board of Education, indicating:
If this is the central purpose of the pilot, werecommend the formation of a Joint TaskForce on Teacher Compensation.This is anissue area in which many districts throughoutthe country are experimenting. Denver shouldmaximize the opportunity to learn from theseefforts.This task force should review thenational efforts at compensation systems thatare based on student achievement and/orteacher performance.
This task force should be discrete and separatefrom the collective bargaining process. Itshould have representation from the board,
administration, teachers association, and DesignTeam. Its numbers should be limited, and itsrole should be advisory.The task force can playa critical role in sifting through the optionsavailable, identifying their strengths and weak-nesses, successes and failures, and recommendingpossibilities to the board and the association as the pilot advances.
The learnings of the task force and the findingsthat result from Denver’s pilot can then bechanneled into the collective bargainingprocess.This would help inform Denver’sefforts to develop a new salary structure.
The Joint Task Force for Teacher Compensationwas not part of the original agreement on Pay for Performance between the Board of Educationand the Association. However, acting on the aboverecommendation, the Task Force was created by aside agreement and approved by the two partiesas a companion entity to the Pay for Performancepilot.This was another example of the pilot spon-sors making a necessary and strategic mid-coursecorrection to advance Pay for Performance.
The purpose of the Task Force was to designand recommend a compensation plan for votingapproval by the Board of Education and themembers of the Association.The participationwas generally as recommended, and communitymembers also served as members.The Task Forcesubsequently became a critical component of thereform process in Denver.The vote on the newcompensation plan will take place in 2004.
D. Data CapacityStudent Data InformationThe data system is a pivotal component of bothPay for Performance and district management.As described in Pathway to Results, the pilot beganwithout having established baseline data or a time-line sufficient for longitudinal study. Consequently,the pilot would have been unable to benchmarkprogress or conduct trend analyses.These were earlylearnings for the pilot.When technical assistanceproviders identified these issues, the Design Teammade recommendations for change to the Boardof Education and the Association.The pilot sponsors
117Organizational Alignment and System Quality

then designated a baseline year for the pilot andextended the pilot’s duration to four years.
The use of baseline data on individual studentperformance is a foundation of Pay for Performance.Understanding the contributions of a teacherstarts with a rigorous analysis of the data on eachstudent’s individual performance.Without a reliablebank of such information, teachers are unable to set targets for student gain based on studentachievement data. Particularly in a district wherethere is a great deal of student diversity and wheremany classes are heterogeneously grouped, a par-ticular concern for teachers is the importance of having data that delineates individual studentgrowth. For teachers, this is a fundamental issue of fairness. Indeed, in the 2003 survey responses,93% of pilot teachers agree or strongly agree thatin a compensation plan based, in part, on studentachievement,“each student’s growth [should be]measured from his or her starting point at thebeginning of the year.”
In responding to the needs of the pilot teachersand principals, the Assessment and Testing Depart-ment of the district worked with the Design Teamto develop the On-Line Assessment Scores Infor-mation System (OASIS).This is an intranet systemwhich provides assessment data on students fromprevious years, is customizable, and delivers scoresfor all students in a class to a teacher’s desktop. Inaddition,Assessment and Testing developed a specificinput system for the teacher objectives where theteacher logs on to enter their objective informationin the fall. Using this system, principals can alsohave access to the objectives for their schools inorder to finalize the objectives for the year.Also,the Assessment and Testing web site provides auser-friendly tutorial on practical applications ofassessment data for teachers.
These efforts form some of the most powerfuldistrict responses to the pilot. Some, but not all, ofthe teachers in the pilot reported having a princi-pal who provided beginning-of-school data inhard copies for teacher use, but most have greatlyappreciated the electronic accessibility of thisinformation for classroom planning purposes.Also, the ability of teachers to input the informa-tion on their objectives online greatly increased theaccuracy of the objectives, prompting teachers to bemore complete. Finally, these systems can be used by
non-pilot school teachers and principals, a contribu-tion to the entire district.
The survey responses particularly underscorethe growing value of the access to and use of studentachievement data. In Spring 2002, approximatelyhalf of the pilot teacher respondents reported thatimprovements were related to knowledge, under-standing, and use of student achievement data.As examples, 51% felt that their “knowledge and understanding of student achievement data”improved; 51% believed that their “use of studentachievement data to set objectives” improved; 50%indicated that “my school’s use of data in settingobjectives” improved; and 47% indicated improve-ments in “my use of student achievement data toplan instruction.” In the Spring 2003 survey, 67%of the respondents saw PFP as having a positiveimpact on their use of student achievement data,65% indicated a positive impact on their under-standing of student achievement data, and 62%saw a positive impact in their timely access to student achievement data.
As with most innovations that schools actuallyuse, there were recommendations for improve-ment. Pilot participants made these knownthrough interviews, surveys and on-site meetings.Concerns ranged from making item analysisinformation available to placing the English lan-guage learner assessment data into the system.“At present, it is not possible to do an item analysisof test data.This would cost the district money,but it would be a better investment for schools,”a pilot school principal remarks. Many of the sug-gestions and recommendations are described inChapters V and VII.
Link of Student Achievement to HumanResourcesLinking student achievement to teacher perfor-mance requires a relational database.This meansthat the district must be able to tie individual students to specific teachers.This necessitates hav-ing unique teacher identification numbers that arethen linked electronically to students.The aware-ness of this need has emerged from the pilot andstudy; previously, it was not part of the lexicon ofthe district.
There is widespread agreement within theDenver Public Schools that such a system of
118 Catalyst for Change

teacher identifiers is a requirement of Pay for Per-formance—or any other initiative that examines a teacher’s contribution to student achievement.However, the need for the coordination of severaldepartments make this a complicated undertakingand other priorities have competed for staff time.A temporary fix was established for pilot and controlschools to cover the period of the pilot and study.However, as Pay for Performance goes to scale inthe district, the importance of this gap in the district’sdata capacity will become more pronounced.
More than just inhibiting the expansion of Payfor Performance, this gap will prevent the districtfrom accurately tracking the effectiveness of pro-grams and staffing, and from meeting the reportingrequirements of No Child Left Behind. It alsoconstrains the ability to conduct high quality cost-effectiveness studies. Moreover, based on thedatabases made available for this study, it appearsthat the data about teachers—credentials, years of experience, school and class assignment, etc.—show inaccuracies and inconsistencies in differentdatabases.The need to address these issues district-wide is paramount.
E. Quality and Alignment ofAssessmentsAssessment of student progress is the point of con-nection between student performance and teacherperformance—the linkage around which Pay forPerformance is constructed.Accordingly, the pilotprovided opportunity for the district to approachthe use of assessments more carefully and thoroughly.Numerous assessment issues have emerged.
The district has subject standards with gradelevel benchmarks for all subjects and a list ofavailable assessments, but there is not an alignmentbetween standards and assessments except for somesubject areas where there are district-developedend-of-year or end-of-course assessments.Thislack of alignment results in limitations on thedistrict’s ability to ascertain progress.
During the course of the pilot, all schools inthe district did not administer the Iowa Test ofBasic Skills consistently.As described in Pathway to Results, it was required of the pilot and controlschools for this study. A related area of concernfor the study and for the validity of any test
administered in the district is the high number of students not assessed.This is discussed moreextensively in Chapter VI.The ITBS is currentlythe district’s only longitudinal student achieve-ment database. It has recently been eliminated bythe district from the testing lexicon for all schools,as has the 6+1 Trait Writing Sample. Since the CSAPis only beginning to assess all grade levels in readingand writing, and only assessed mathematics ingrades 5 and 8, the district is losing its capacity to follow student achievement longitudinally.Thisgap is a serious organizational constraint.
Within the pilot, assessment-related concernswere manifest. For example, in examining the year four teacher objectives, a total of 166 differ-ent, identifiable assessments are used to measureprogress (an increase of 19% from the total of 139in year three).This does not include 256 teachers(an increase of 60% from the total of 160 in yearthree) who list “teacher-made test,”“criterion-referenced test,” or “pre/post” as their form ofmeasurement.As a result, the actual number ofassessments used is likely to be significantly higherthan the identified number. Further, the majorityof assessments used have been identified as being“teacher-made” and/or teacher-scored. In inter-views, teachers continue to point to an inherentunfairness of an approach which involves toobroad a range of non-comparable measures.Thenumbers indicate this is a worsening situation—particularly when these assessments are used forcompensation purposes.
Over the course of the pilot, schools havebeen implementing the Colorado Student AssessmentProgram. There are many concerns specific to thisassessment, including the late availability of theassessment results, the use of the test to make com-parisons among schools by the State of Colorado,and the stress created in the schools by the focus onimproving CSAP scores.The CSAP is describedfurther in Chapter III of this report and in Pathwayto Results.
During each year of the pilot, teachers, principalsand central administrators have described their con-cerns regarding district and school assessments, theadministration and scoring of the assessments, andthe setting of appropriately rigorous growth targets.The concerns fall into the following categories:
119Organizational Alignment and System Quality

• the need for standard assessments for all areasand subjects before the implementation of anew compensation plan.
• the lack of assessments that are culturallyappropriate for Denver children.
• the need for assessments to be administeredand scored independently of the teacher.
• the need for more than one measure or multi-ple measures to determine student growth.
• the need for multiple years of data on studentsper teacher to provide greater accuracy andreliability of results.
• the lack of valid, reliable, and aligned measuresfor specials and specialists.
• the need for greater precision and rigor in settinggrowth targets.
• the lack of consistent assessments for K-2 andgrade 12.
Participants have continuously suggestedimprovements for the use of assessments in thepilot and the broader district.“Assessments shouldbe in line with what we are doing in the classroom,”says a classroom teacher.A pilot principal states,“I’d like an objective in every major content area.I’d like to see a mandatory connection with lessonplanning.”Another pilot principal discusses targets,“I would like to see guidelines changed so thatteachers can’t set a target lower than 80%....Whybother setting such low objectives?”A pilot schoolteacher expounds on this,“We need to base [PFP]not on broad schoolwide or classroom growth,although that’s what the public looks for.We needto look at each child, where they began that yearand how they improved during the year.”
Both the assessments and their administrationdraw the attention of practitioners and parents.Apilot teacher comments,“We need better assess-ments, more standardization of assessments.Wewere trained on ITBS and that’s going away. Six-Trait Writing is gone. CSAP is there, but there’s nopre and post during the year.What are we goingto use now? We were using Aprenda for ESL stu-dents and that wasn’t a good tool. QRI Readingtest is a problem because it is subjective based on
the teacher. Different teachers get different results.”A pilot teacher expresses a repeated concern,“The way tests are administered can be subjective,can depend on the teacher.Administration of testsneeds to be objective.”Another pilot teacher says,“Teacher-made tests is a cop-out.With standard-ized tests you can’t control [outcomes] and it’smore objective.”A pilot teacher offers a critique,“If you use QRI’s, there are no checks and bal-ances.”A parent reinforces the concerns of manypilot participants,“Each child has to be looked atas an individual and measured on their growth.Otherwise, don’t make the teacher accountable....There has to be some measure for individualchildren and that can take a lot of time. It has to be fair to the teacher.”
Numerous central administrators identify keysteps for district action.“The district must developend-of-course tests,” notes a central administrator,“CSAP is a very important measurement [because]the results of the test will be reported to the public.The district must find tests for kindergarten andother grades....” Another central administratoradds, “There needs to be much more dialogueabout testing and measures that are reliable.We needconversations that can begin to describe what anappropriate test or measure would look like.”Also,practitioners throughout the district believe that theservices offered by specialists are not effectivelymeasured by the assessment system currently inplace.”As a special educator says,“Severe-profound,emotionally disabled... those students need to beprovided with alternative measures.”
Throughout the pilot’s four years, participantsexpressed the need for the district to employ multiple measures when assessing student growth.“We need to have multiple ways [of measure-ment]... multiple tests but standardized across the district,” notes a pilot teacher. Many teachersshare this perspective, particularly if studentachievement becomes part of the criteria forteacher compensation.A special education teachercomments,“I would recommend that various student assessments be used to determine achieve-ment. If it were only based on CSAP, I wouldleave the district.”These concerns are also reflectedby the educational research community as statedin the Standards for Educational and PsychologicalTesting (American Educational Research Associa-
120 Catalyst for Change

tion,American Psychological Association, &National Council on Measurement in Education,1999.) Many of the suggestions and recommenda-tions are described in Chapters V and VII.Standard 13.7 states:
“In educational settings, a decision or charac-terization that will have major impact on a stu-dent should not be made on a simple testscore. Other relevant information should betaken into account if it will enhance the over-all validity of the decision (pp. 147-148).”3
As a representative example of teacherresponses, both pilot and control school teachersshowed an 88% agreement that more than onemeasure of student achievement should be used togauge student achievement in any new compensa-tion plan. Similar percentages also want to see acompensation plan where each student’s growth is measured individually from his or her previousperformance.As shown in Figure 8-1, a pluralityof teachers in both pilot and control schools agreethat teacher contributions to student achievementshould be assessed in multi-year increments.
These findings confirm the need for the districtto explore ways to use multiple measures of studentachievement at the classroom level.As discussed inChapter V, this will enhance the confidence ofteachers in the fairness of any new compensationplan that has a performance-based component. Itwill also help broaden the understanding of theimpact of the district’s educational initiatives.
The most pressing need of the organization is
to address the quality, alignment, comprehensive-ness, and integrity of assessments being used tomeasure student achievement in the district. Bynot taking this step, the district not only places aperformance pay system at peril, but also greatlyreduces the quality of information upon whichmany student decisions are based. Effective organi-zations have good information about their clients.
F. Professional DevelopmentProfessional development is a critical componentof successful change. In a Pay for Performanceplan, it is also critical to the success of the planitself.The expectations of Pay for Performanceinclude that teachers and principals obtain studentachievement data, analyze the results, and tailorinstruction both to the curriculum provided andthe students’ abilities and needs.To develop andfairly measure a teacher’s instructional ability,professional development is required.
The practitioners at the pilot schools draw asignificant distinction between the training providedto ensure the implementation of Pay for Perfor-mance and the professional development neededto deliver and measure improved instruction. Bothrequire a base in student achievement.They needto be aligned and mutually reinforcing.
The Design Team’s support to the pilot schoolshas grown in sophistication, quality and respon-siveness with each year of the pilot. Numerousrespondents indicated that they would welcomesuch support expanded even further. A pilot
121Organizational Alignment and System Quality
FIG. 8-1
Spring Survey Items, PFP, 2002
Control Schools Pilot Schools
I would like to see the following elements or Strongly Agree/ Strongly Disagree/ Strongly Agree/ Strongly Disagree/criteria in any new compensation plan. Agree Disagree Agree Disagree
More than one measure of student achievement used to gauge performance. 88% 6% 88% 7%
Each student’s growth measured individually from his or her previous performance. 88% 6% 91% 5%
Teachers’ contributions to student achievement assessed in multi-year increments (not annually). 52% 42% 54% 39%

teacher notes, “Training from the Design Team has been helpful. However, there needs to betraining where everyone, including administratorsare included.”
Teachers, in particular, are forceful whendescribing their perceptions of their professionaldevelopment experiences.“Much of the districtprofessional development is a song and dance—preaching to teachers. I need more professionaldevelopment but not just general stuff called pro-fessional development.We need to be more specificin our work,” says a pilot teacher.“We had a greatnumber of professional development sessions at ourschool toward the end of the year.They were notgood and someone should stop these activities untilthey are much improved. I did not find them help-ful and I think that they are a waste of time andmoney,” comments a pilot teacher. One controlteacher indicates,“We have had to take care of our own issues.The district has not been helpful.”Another commented,“I’m not thrilled about staffdevelopment. I find much of the time the meetingsare repetition. It’s just a circle.”
As indicated above, the intent of Pay for Per-formance and other district improvement initia-tives is for teachers to use effective classroompractices to meet their objectives and improvestudent achievement. Many times, this requiresteachers to change or improve their current prac-tices.This, in turn, calls for providing customizedsupport to the teachers.The Design Team hasmade significant progress in emphasizing the ele-ments of a high quality objective and stressing theuse of assessment data to ascertain progress. How-ever, it is incumbent upon the district to provideteachers with the ongoing assistance needed tohave a fuller impact on the classroom.This isclearly important to district leaders; significantstaff and financial resources are being allocated to professional development.
During the course of the pilot and researchstudy, teachers have described the kinds of supportsthat they need to make their instructional practiceseffective with all students.As an example, they citethe need for structured time to learn from theircolleagues as a key to changing their practices.They stress that professional development needs tobe based on the specific needs of their studentsand schools, and provided on an ongoing basis.
In effect, the teachers are describing what theyfeel is a needed pathway.To the extent that thedistrict’s professional development is perceived byteachers as being based on the differentiated needsand the specific student achievement levels of theindividual schools and classrooms, it is likely tofind an increasingly more receptive audienceamong the teachers.This will reinforce the priorityon student achievement, while helping to buildmore bridges between the central administrationand the schools.
As discussed in Chapter V, many pilot teachersdid not interpret their participation in the pilotas requiring a change in teaching practice. Instead,the pilot construct assumed to some extent that,in the pursuit of objectives and additional com-pensation, teachers would improve their practice.In many instances, this has occurred.Teacherinterview and survey data describe changes in avariety of areas, particularly the focus on studentachievement and the use of data to plan and tointervene early with underachievers.The met/not met data also show that there is a statisticallysignificant correlation between an elementaryteacher’s meeting two objectives and changes instudent achievement in that teacher’s class.
Had instructional professional developmentaccompanied the objective setting, the achieve-ment findings would likely have been moreextensive.Teacher interviewees have consistentlypointed out over the course of the pilot that they are “teaching as hard as they can” and that“they always give their best effort.” However,some teachers have also revealed, through theirobjective setting and survey and interview data,that they do not think that they can be successfulwith all students.A number of objectives are set to exclude students who have attendanceissues or diagnosed learning challenges. Becausethere were many exclusions, the Design Teampursued this issue and sought to increase the target levels in the objectives. By the end of thepilot, the growth targets are most often set at the 75% level. Nonetheless, teachers desire additional help to address the learning needs of all students.
Early in the pilot, funding was raised fromfoundations to conduct a professional developmentaudit so that the district could assess where all
122 Catalyst for Change

professional development dollars were going, whatthe needs were, and how student achievement wasdirectly impacted.This was not carried out andstill remains a serious gap in district services, notonly for the pilot teachers but also for all teachersin the district.
This gap is more pronounced under the newnational education law.The No Child Left BehindAct,Title II, Part A, states that professional develop-ment activities will be “regularly evaluated fortheir impact on increased teacher effectiveness andimproved student academic achievement, with thefindings used to improve the quality of profes-sional development.” It continues,“Ultimately,the program’s performance will be measured bychanges in student achievement over time asshown through the other NCLB reportingrequirements.”This law places new requirementson districts in the area of professional develop-ment. It also provides Denver with an opportunityto further align the organization in support ofdirections identified by the pilot and needed forall of the district’s major educational initiatives.
G. PrincipalsThe quality of interaction between the buildingprincipal and each of his or her teachers is pivotalto the success of Pay for Performance. Interviewdata indicate that there is a wide range of behaviorsaround this critical interaction. A number ofteachers express a lack of trust in their buildingadministrators, describing actions that are viewedas unhelpful or even arbitrary. Descriptions ofprincipal processes (from both the teacher andprincipal perspective) show that some principalsare extremely thorough and assiduous in oversee-ing and supporting the objectives process. Con-currently, others practice a kind of benign neglectwhen examining teacher objectives and evidenceof student performance and, particularly, in pro-viding feedback to teachers in timely or helpfulways.While some principals were able to givemid-year feedback to teachers on objectives,others did not review them until later in the year.Where principals have been engaged andsupportive, their staffs are appreciative.Teachersparticularly value learning from the principalswho are able to serve as instructional leaders.
Paradoxically, principals identify a lack of clarityand direction regarding their roles in teacherobjective setting.This is a source of ongoing frustration.They would like to be clearer on thescope of their authority or decision-making whenapproving objectives or bodies of evidence. Forexample, a few principals express a concern overobjectives with low expectations coupled with afeeling of being powerless to do anything aboutthem.They express a need for more support fromthe district in the form of professional developmentrelating to objectives and the principal’s properrole in evaluating them. Principals in both thepilot and control schools have some negative feelingsabout their own performance evaluation process,which may spill over into their work with teachers.Exacerbating the principal trust issue is the largeturnover of principals in recent years, particularlyat the pilot schools. Only five of the 16 pilotschools have had the same principal throughoutthe pilot.
The critical interactions between principals and teachers should be strengthened—particularlyas Pay for Performance goes to scale.There is asalient need for a district-sponsored program thatwould further build the principals’ capacities in the areas of instructional supervision and dataanalysis. A pilot principal adds, “We need moreprofessional development in multicultural educa-tion as our population is changing.” Principalsindicate that they need support in examiningteacher work—from the objectives and classroomplans to classroom observations and the evidenceof attainment—and ways to provide timely, helpfulfeedback to teachers. In this manner, the role ofthe principal can be clarified, and the quality andconsistency necessary for any compensation systembased on student achievement can be improved.
H. School Improvement PlansThe study also examined the relationship ofteacher objectives to the various school improve-ment plans.An analysis of the 2002-2003 pilotand control school plans reveals that the schoolswere working from a template that containedcommon elements.These elements include: anintroduction; three-year goals; annual goals; datastatements related to important needs and barriers
123Organizational Alignment and System Quality

to high achievement; six areas of plan strategies;an equity statement listing the ways the school isclosing the learning gap; a coordination of resourcespage; a plan for evaluation and monitoring progress;and a sign-off from the local Collaborative Decision-Making Committee.A key goal for most of theschools was to attain a rating of at least “average”on the State Accountability Reports, but higherperforming schools had the goal of maintaining a high rating on the reports.
In the 2002-2003 pilot school plans, there isno evidence that the teacher objectives are con-sidered as part of the strategy for improving theschools.When the plans are compared to theteacher objectives in the respective schools, it isclear that teachers in most schools used the schoolplan as a rationale—in general terms—for theirobjectives. It is not clear if they were motivated todo so through a school discussion or had beenprompted by the examples provided for completingthe objectives. Other rationales included generalreferences to the literacy program and the impor-tance of the content for students. High schoolteachers particularly used the latter rationale.Beyond that, though, the objectives and theirlearning content are not included in the strategiesin the school improvement plans.
A representative sample of the current controlschool plans showed similarities to the pilot plans,but the control school teacher objectives makefewer specific references to the plan. Interestingly,25% of the reviewed control school plans showthat staff used the PFP objectives worksheet or amodified version of it for goal setting, increasingthe use of baseline data in these schools.Thoughthis was not required by the district, it indicates away in which the pilot's reach extended infor-mally to non-pilot schools.
The way these components of educational servicedelivery should align is described by an externalcommunity leader:
“There need to be checks and balances onthese objectives.The district has to do a better job of moving from high stakes testingto focusing on other teaching services—professional development based on objectiveslinked to student improvement plans and district plans.The district needs to integrateand align all of this if it’s going to work.”
District goals, the respective school improvementplans and the teachers’ classroom objectives shouldbe carefully aligned. Each should reflect the othersand reinforce a coherent agenda for improvingstudent achievement. In this way, the district goalsprovide guidance for the school system, while theneeds and priorities of the schools shape the districtagenda. Moreover, the learning goals, standards,curricular content, instructional strategies, assessmentmethodologies and support systems should bereadily apparent to practitioners and supervisors—the readers of the plans and the implementers ofthe improvement efforts.This loop needs to betighter in Denver.
I. Relationship of PFP to MajorGoals and InitiativesThe district’s two highest educational goals are toincrease the achievement of all students and tobridge the gap between high- and low-achievingstudents.The same scope and quality of organiza-tional alignment needed to implement Pay forPerformance is required for meeting these goals.
Raising bars and bridging gaps have theirstarting points and end results rooted in a rigorousanalysis of student achievement data. It is thereforeessential to have assessments that accurately andreliably measure the progress of all studentstowards these goals. Achieving these outcomesalso requires that the teachers and principals havethe appropriate data available, and that they areable to understand and interpret the data accurately,identify student needs, set appropriate learningobjectives, and structure lessons accordingly. Evenexcellent teachers may not have all of these skills,particularly those relating to data.
A Pay for Performance system demands that a district’s standards, curriculum content, instruc-tional delivery, professional development, datacapacity, assessment, supervisory and humanresources be aligned.The issue of alignment cuts to the very essence of how—and to whatextent—the school district is functioning in support of student learning.This applies equally to implementing Pay for Performance, undertak-ing the district's major literacy and mathematicsinitiatives, and to meeting the requirements of No Child Left Behind.Addressing the issue of
124 Catalyst for Change

organizational alignment is pivotal to theprospects for success of all of Denver’s initiatives.
J. Broader FactorsThere has been an array of broader institutionaland extraneous factors that have affected the climate for implementing Pay for Performance.They have made the difficult challenges of align-ing the organization in support of the pilot evenmore daunting.These factors, and their attitudinalunderpinnings, have affected perceptions andunderstandings of the pilot across the district.The following are a few of the salient influenceswhich have influenced attitudes about Pay for Performance.
CSAP and the State of ColoradoAs discussed in Pathway to Results, CSAP is themajor statewide assessment of student achievement.It is part of the growing national trend in whichthe states are attempting to promote educationalaccountability.As Colorado’s largest city, Denverreceives significant media attention.Accordingly,the district’s scores on CSAP—and the state’s ratingsof schools based on those scores—are highly visible.
For many administrators, teachers and parents,the visibility and usages of CSAP have resulted inan extremely high stakes testing environment.TheCSAP also increases the level of confusion withinthe district. Many teachers perceive CSAP as thedriving force in the district and the state. Conse-quently, they express confusion regarding the dis-tinction between the district’s goals for the CSAPwith the goals of Pay for Performance. In addi-tion, the pilot’s focus on individual student gaindiffers from the public presentations of aggregateCSAP scores.
There are other state-level factors that affectthe climate for Pay for Performance.Administra-tors, teachers and parents frequently cite the statereport card system and several legislative initiativesas placing additional pressures on the schools andthe district.
The No Child Left Behind ActThis federal law has ushered in dramatic changesfor all school districts.There are now new nationalrequirements for districts to report highly disaggre-gated data on student and school performance,
and teacher qualifications, to the community.This provides the district with new and increasedresponsibilities. However, as described in this report,many of the organizational capacities needed tosupport Pay for Performance are equally needed tomeet the requirements of No Child Left Behind.
The EconomyDifficult economic times characteristically contributeto increased levels of stress in union/managementrelations. In Denver, this has particular consequencesfor Pay for Performance. If teachers feel that thereare insufficient resources to fund the pre-existingcompensation system, they are more likely to ques-tion whether there will be additional resourcesgenerated to support a new compensation plan.
Administrator Pay for PerformanceAt the start of the pilot, the district also launchedan effort to introduce Pay for Performance foradministrators.The district experienced numerousproblems in the conceptualization and implemen-tation of this effort. It was not well received,particularly by the principals. Shortly after beingappointed, the current superintendent analyzedthe results and ended the effort. Nonetheless,there are attitudinal vestiges remaining among theadministrative staff which adversely affect theirperceptions of Pay for Performance for teachers.
Leadership TurnoverAs discussed, there have been many changes ofleadership during the period of the pilot.Whilethe district now has stable executive leadership,there are still concerns regarding district commu-nications and priorities as a result of turnovers of leadership.
K. A Sense of MissionThe challenge of organizational alignment is attitu-dinal as well as operational. It has been describedby some individuals as a struggle between “thenew Denver Public Schools and the old DenverPublic Schools.”
Like all districts, Denver has a mission state-ment; Pay for Performance requires more thanthat. It requires a sense of mission.A centraladministrator describes this attitudinal requisite:
125Organizational Alignment and System Quality

“The project is a real intellectual challenge tothe district right now. No one else is doingwhat Denver is doing. Denver is out on thecutting edge and there are many risks in doingwhat we are doing.The district and unionneed to do what is right and do it in the rightway.The foundations are comprised of localopinion leaders and they are investing heavilyin DPS at this time. I’m sure these leaders arenot investing their funds blindly and must feelthere is much to be gained from this effort.Wemust be willing to see this pilot through andto do whatever it takes to show the Denvercommunity that we have done everything possible to be successful . . . there will be manybenefits to this pilot whether the parties voteit up or down.”
L. SummaryThe Pay for Performance pilot got underway at a time when the Denver Public Schools were par-ticularly vulnerable due to leadership changes.Whilea flurry of work was underway in the pilot schools,there was minimal communication from the districtabout the purpose of the pilot and the district’sexpectations.Also, a lack of communication anddirection to the senior and middle managers inthe district, coupled with the empowering of theDesign Team to lead the implementation, con-tributed to a lack of accountability for the successof the pilot among staff who have a great deal tocontribute. Over the course of the pilot and withnew executive leadership, district systems havebecome more responsive to the needs of the pilotand more apt to recognize that most of thechanges needed for the pilot will be critical for the entire system.
126 Catalyst for Change

Issues andRecommendations
A. IntroductionThe results of Pay for Performance in Denver have a human face. Students andteachers are highly visible in the design, implementation and impact of thepilot.The pilot and study involved several hundred teachers and thousands ofstudents over a four-year period, a fact that provides a constant reminder of thepurpose of district and school reforms—to help teachers become as effective asthey can be and to help students reach the highest learning standards. Over fouryears, teachers in the pilot schools have laid out key expectations for their studentsin their objectives and have been open to having their objectives studied, toexamining their processes in interviews and surveys, and to offering critiquesand suggestions to broaden the impact of the reform.
The Denver Board of Education and the Denver Classroom Teachers Associ-ation have undertaken a courageous experiment in American public education—creating a pilot based on the linkage between student achievement and teachercompensation.They have also promoted Pay for Performance as a concept so thatit has become a catalyst for systemic change.They have held both the pilot andthe broader district up to a rigorous external examination of results.This opennesshas contributed to an organizational climate, supported by third parties and internalreformers, focused on understanding and becoming accountable for studentgrowth and creating change that benefits students. Rather than avoiding the discussion of problem areas, challenges have became more visible and amenable to analysis and solution.
Through Pay for Performance, teachers have demonstrated that they can affectthe growth of individual students positively.As often stated, teacher-developedobjectives are the centerpiece of the pilot. Over the four years of the pilot, there
IXC H A P T E R

has been a positive relationship on many indepen-dent achievement measures between student gainand excellence of teacher objectives. In workingwith student data and setting targets for expectedgain, pilot teachers have demonstrated the impor-tance of science to the art of teaching.As a resultof the pilot, schools and the district overall havebecome more focused on student achievementand on the importance of understanding individualstudent gain.
Findings from the study indicate that a focus onstudent achievement and a teacher’s contributionto such achievement can stimulate needed changesin district systems that support and shape theschools. Despite turnover of district leadership and structure, the reach of the pilot has extendedfurther into the district in each subsequent year of implementation.Through the leadership of thecurrent administration and the activism of theDesign Team, the district is beginning to take the lessons from Pay for Performance to scale.
The pilot has benefited from a top-down/bottom-up approach to implementing reform.Teachers and principals have had significant oppor-tunities to shape the implementation of Pay forPerformance. Needs of pilot teachers have providedthe impetus for efforts to improve the access tostudent data and assessment information, the link-ages between student information systems andhuman resources systems, the quality of profes-sional development, and other areas of district support operations.While these activities wereunderway in the pilot schools and the district, thepilot gave birth to a proposed new compensationsystem for teachers.
The organizational gains resulting from thepilot to date are significant; they are also fragile.The gains can easily erode, particularly as atten-tion shifts to the vote on the new compensationplan. Indeed, even were there not a pending con-tractual vote, the national experience in reformsuggests a recurring pattern: districts review theresults of their pilot efforts, indicate that they haveintegrated the learnings into their organizationsand soon move on to the next major initiative of the day.While essentially declaring victory,districts often allow the momentum and directionof the reforms to begin to languish. Over time,systems incrementally return to earlier posturesand behaviors. In effect, the potential for real
learning and systemic reform is undercut by theresponse to near-term exigencies.
In contrast, Denver has learned that includingthe objective setting process of Pay for Performanceas a core component of the district’s operationsdemands that standards, curriculum content,instructional delivery, professional development,assessment, supervisory and human resources bealigned.As discussed throughout this report andthe mid-point report, aligning systems in supportof student achievement is key to turning a gooddistrict into an outstanding one. Not only do alignedsystems ensure better results from the performancepay initiative but they will support district successin the implementation of other initiatives, such as meeting the requirements of No Child LeftBehind.The findings of the Pay for Performancepilot have become a true, actionable priority inDenver.The stakes are high; Denver is becoming a district in which the achievement of 70,000 ormore students is in the spotlight.
The district is taking a critical turn and has an opportunity to build on the pilot.The nextstep is to build demonstrably upon the organiza-tional changes made to date—changes of think-ing, practice and system capacity—so that teachersand schools can maximize gains on behalf of stu-dents, and the overall district can maximize thephilanthropic investment in student achievementmade through the pilot to the Denver PublicSchools.
The following recommendations are based on four years of scientific research, the accom-plishments and findings of the pilot, and thenational track record in reform.The recommen-dations are all geared toward building the capacityof the district to institutionalize and expand theimpact of the most critical elements of the pilot.They target improvements that are sustainable,manageable and implementable at district scale.With strong practitioner input, they target theimprovements that teachers and principals believewill make a difference. Further, they strengthenboth the validity and fairness of the district’s continuing reform efforts.The recommendationsare grouped into four interactive and interrelatedtopics: alignment, assessment, professional develop-ment, and leadership.
129Issues and Recommendations
B. Recommendations
Issue One: Alignment
OVERVIEWAs the purpose of the district's major initiatives isto increase student achievement, the organizationwill benefit from continuing to align its initiativesaround that goal in a clear and purposeful manner.Otherwise, even increasing the district’s capacitieswill fall short of providing integrated support toschools and classrooms.The silo effect is all toofamiliar within urban districts—a plethora of indi-vidual programs and activities operating indepen-dently of one another whose sum total is less thanthe collective potential of the initiatives. Using thelearnings from the pilot, Denver can avoid a pitfallthat characteristically undercuts the potential ofmany reforms nationwide.
RECOMMENDED ACTION
• Bring the objective setting to scale with instructionalsupport. Over the course of the pilot, there hasbeen substantial progress in improving thequality of teacher-developed objectives. Craftingobjectives is the initial step in reflecting on,planning, and delivering instruction. It is notmerely a writing exercise.As this effort goes toscale, it will be important to draw on theselearnings from the pilot and to align the instruc-tional supports so that teachers are assisted inimproving practice based on their knowledgeabout student achievement in their classroomsand the specific targets in their objectives.
• Strengthen the linkage between classroom objectives,school improvement plans and district standards andgoals. This recommendation has structural andmanagerial dimensions. Structurally, to theextent that the objectives, plans and goals aremutually reinforcing, the implementation of allthree will be strengthened and there will begreater clarity of purpose. Managerially, ensur-ing this alignment will need to be a priorityfor principals and the area offices.All profes-sionals within the district should be account-able for these linkages.
• Increase the connection between student informationsystems and human resources systems. Building on
the district’s progress in supporting the pilotschools, this recommendation focuses on estab-lishing greater district-wide linkages among thedata systems for student assessment, planning,and human resources. Particular emphasisshould be placed on: (1) assigning uniqueteacher identification numbers to all teachers,which will follow the teachers throughouttheir careers in the district; and (2) structuringsystems so that students are accurately linked to teachers and so that teachers, including specialists, are accurately linked to students.These linkages are critical for any effort thatseeks to examine the contribution of a teacherto student achievement and the contribution ofa program or school to a teacher’s success. Byestablishing these linkages, the district will alsobe better positioned to address the No ChildLeft Behind requirement of demonstrating thatthe district has highly qualified teachers.
• Project the costs of changing internal practices andrequirements. There are direct financial costs to implementing Pay for Performance sys-temwide.The Joint Task Force, the district and Association leaders are all actively assessingthe level and source of projected costs for anew compensation system.The momentum of the pilot needs to continue under a rangeof financial circumstances.
One of the major findings from the nationaltrack record in reform is that when a districtmoves in new directions, it needs to give up some of the pre-existing practices andrequirements that consume resources and arenot consistent with the district’s new direc-tions. Denver should conduct a detailedreview of existing cost centers and theirimpact as part of the contingency financialplanning to support the new educational ini-tiatives and performance-based compensationsystem.The lack of sustainability is one of the reasons teachers do not trust program-matic and compensation innovations. If theresources are not aligned longitudinally tosustain the new district directions, it may be a long time before teachers may be willing to try major student achievement and com-pensation reforms again.
130 Catalyst for Change

IMPACTDenver has evidenced wisdom about this reform.Many districts function as though reform meanshaving problems in the near term and then nothaving them thereafter.True reform is a morecomplex and recursive process. It involves identi-fying and addressing problems, and then movingforward to address a more sophisticated set ofproblems that affect district directions.Throughthe pilot, confronting the challenges of organiza-tional alignment has entered the lexicon of theDenver Public Schools and become part of a district dialogue and action to shape the future.
Issue Two: Assessment
OVERVIEWA portfolio and appropriate usage of high qualityassessments are the marks of a district that isaligned and accountable for its students.The pilothas uncovered many inadequacies and inconsis-tencies in the available assessments of studentprogress, which are discussed earlier in this report.The district needs to develop a coordinated sys-tem of assessments that are fair, valid and canaddress the dual challenges of diagnosing class-room performance and making broader compar-isons across grades and schools. Using studentassessments for a new purpose—compensation—also requires greater assessment and data capacity,as well as a skillfully supervised and consistentlyadministered effort at the schools so that all stu-dents have regular assessments.The district is wellarmed with new information from the pilot andpositioned to make inroads into an area that hasbeset educational reform.
RECOMMENDED ACTION
• Expand the district’s assessment strategy. There arefive parts to this recommendation.They shouldbe addressed in a concurrent, integrated mannerso that they can collectively extend the reachand strengthen the application of the district’scurrent assessment plan. In effect, the existingplan should become a component of a morecomprehensive assessment strategy.An effectiveoverall strategy will:
a. Delineate how approved assessments alignwith the district’s standards and curricula
and identify gaps in the assessment program.Particular attention should be paid to devel-oping adequate assessments for secondaryschool subjects.
b.Anticipate how the assessments are to beused in classroom instructional planningand school improvement planning, andidentify the supports to be provided to theschools. Practitioners at the schools needopportunities to provide input into theselection and use of assessments and toreceive the assessment data in appropriateforms with the assistance necessary to makeeffective use of the data.
c. Define clearly who is to take the tests andsupervise the implementation of consistenttesting practices. For purposes of monitoringprogress, evaluating programs and providingaccurate information to the schools and thepublic, it is essential that all students—exceptthose legitimately exempted—are being tested.
d.Outline the steps that will be taken, andtimelines pursued, to develop or acquireassessments that are appropriate for specialstudent populations.This is important forboth educational and compensation reasons.
e. Require the collaboration of central admin-istrators in the curriculum, instruction andassessment areas with grade and school levelrepresentatives so that the resultant strategywill yield valuable information regardingcurrent performance, individual studentgrowth and longitudinal performancetrends across years.
• Define which assessments can be used for objectivesetting and compensation purposes. There contin-ues to be a need for a rational level of pre-scriptive direction regarding which assessmentscan be used as part of any new system thatinvolves Pay for Performance.A Pay for Per-formance system or companion educationalinitiative that has too many allowable assess-ments will be unmanageable, will cause discordand will fail to promote valid increases in student achievement.These problems will beexacerbated when the initiatives are imple-mented on a large scale.
131Issues and Recommendations

• Make the use of multiple measures a developmentalpriority. One of the major reasons pay for per-formance has not been implemented success-fully in other districts is the lack of a singlemeasure that satisfies the criteria of being fair,accurate and valid in measuring student learn-ing. For four years, Denver teachers and siteadministrators have been raising questions aboutthe fairness and accuracy of individual mea-sures.These concerns can be addressed moreeffectively in the future if the district carefullyblends the assessments that measure differentareas of student knowledge or performance.
As recommended in Pathway to Results, thedistrict should charge its academic staff withdeveloping a means to use multiple measuresat the classroom level.The importance of thisrecommendation needs to be underscored.Thecharge is for the district to develop a means tolink several assessments together to more mean-ingfully identify student progress and, as a consequence, teacher performance. The linkingof these assessments is what is meant by multiplemeasures. Moving the district in this directionis a key developmental task.
Multiple measures will help the district tomeet a higher standard of fairness and accuracywhen examining a teacher’s contribution tostudent achievement. Further, they will enablethe district to achieve a more complete under-standing of that student achievement. Until thedistrict makes strides in converting the currentcollection of assessments into a system of mul-tiple measures, the district will be vulnerablewhen making compensation decisions oninstruments that, used singly, may be ques-tioned regarding their validity.
• Increase the district capacity to disaggregate and ana-lyze student achievement data. Particularly in theera of No Child Left Behind, the districtneeds to build the in-house capacity to collect,disaggregate, analyze and act on data related tostudent achievement and school performance.This requires expanding the ability to deter-mine actual and relative progress—school by school, classroom by classroom, student
subgroup by student subgroup, and child bychild—and presenting the data in differentformats for, respectively, classroom, school and district use.The analyses of these datathen provide the foundation for deliveringclassroom instruction, developing schoolimprovement plans and managing strategicallyat the district level.This data capacity is a bottom line requisite for helping students andschools to succeed.
• Convene select urban districts to analyze and takeaction on problems in assessment. As a result ofthe Pay for Performance pilot, Denver is posi-tioned as a national leader in undertakinginnovation in the area of tying teacher com-pensation, in part, to student achievement.Thisdefinitionally places Denver at the center ofefforts to use assessment data for multiple purposes.The ensuing challenges that Denverfaces are shared in common by other districts.Denver should use its current national involve-ments as a springboard and convene a smallnumber of urban districts and assessment spe-cialists, analyze the issues of how to use assess-ment data to ascertain progress and makecomparisons, and determine potential collec-tive action that could be taken to guide testdevelopers to link their efforts more directlyto growing needs of urban districts.
IMPACTThe pilot has demonstrated the importance ofusing student achievement data to inform instruc-tion and guide decision-making.Taking the stepslisted above will be a significant help to teachersand principals who are seeking reliable means topromote individual student growth.They also willprovide the district with greater means to ascer-tain actual progress on student achievement andcraft or correct district improvement initiatives.No Child Left Behind requires districts to provideparents with extensive data on student and schoolperformance so that they can make decisionsabout schools.The better the district can under-stand, utilize and communicate student assessmentdata, the more effectively it will be able to ascertainstudent learning progress and meet the newnational requirements.
132 Catalyst for Change

Issue Three: Professional Development
OVERVIEWVirtuosity in teaching is the goal of professionaldevelopment for teachers. In order for reform tooccur, schools have to be places that stimulate andsupport teachers. Initiatives often are based on theassumption that teachers will embrace the conceptof the reform and change their practices when, infact, they may follow their prior practices in theirclassrooms. From both the educational researchperspective and Denver’s experiences in the pilot,there are profound connections between objec-tives based on learning content, a teacher’s subjectmatter knowledge, specific teaching practices, andstudent achievement that teachers need ongoingopportunities to pursue.
RECOMMENDED ACTION
• Establish district standards for professional develop-ment. The district needs to determine andcommunicate the process and content stan-dards that will guide the initiation, deliveryand evaluation of professional development.Denver is moving in the direction of providingstandards-based instruction. Establishing thestandards for professional development is a nat-ural and necessary complement to this instruc-tional priority.They should be tied to theColorado Teacher Standards, research aboutbest teaching practices, the district’s curricu-lum standards and the assessment strategydescribed above, and their implementationshould be evaluated regularly by the site levelrecipients of the professional development ser-vices.This work will result in a roadmap forproviding professional development servicesand ensuring quality control.
• Predicate professional development on studentachievement. The priorities for professionaldevelopment need to be based on continuousreviews of student achievement results byschool staffs. Such a review identifies school-wide, classroom and individual student instruc-tional needs and instructional areas whichneed to be updated or improved.This, in turn,may reveal areas in which school staff or thecommunity may need assistance in meeting
these needs. By using student achievement asboth the driver and end result, this emphasisfor professional development is more directlyconsistent with the priorities for teacherobjectives and the district goals.
• Create opportunities for teachers and principals toshape professional development. One of the keyfindings from the pilot was that the ability ofsite practitioners to influence implementationcontributed to improvements in the overalleffort.This kind of involvement increases theprospects of professional development to targeteffectively teacher needs, school priorities, anddistrict goals.Absent such opportunities, sitepractitioners are more likely to perceive thedistrict as unresponsive and lacking in under-standing of their challenges.When this occurs,teachers and principals can feel disconnectedfrom district initiatives—even when the initia-tives are well conceived.Through the study,teachers and principals also made clear that theystrongly valued opportunities to work withcolleagues on teaching and learning issues.
IMPACTTaking these steps will improve the quality andincrease the impact of professional developmentservices.The standards will provide a blueprint forinitiating, delivering and evaluating professionaldevelopment.The focus on disaggregated studentachievement data will enable the objectives andinstructional supports to be targeted and account-able. Lastly, directly involving site practitioners in shaping professional development services provides a valuable bottom-up complement to top-down district initiatives, enabling teachers and principals to articulate needs and support the overall district educational agenda.
Issue Four: Leadership
OVERVIEWMany reforms fail for lack of sustained leadership.The Board of Education and the Associationdemonstrated leadership as they joined to createthe Pay for Performance pilot.The Design Teamhas provided creative leadership in advancing thepilot through uncharted pathways. Many teachers,principals and some key district staff have made
133Issues and Recommendations

important leadership contributions. However,pilot findings also show that many parties werenot well prepared to supervise the new objectivesetting or support the implementation of theobjectives in the classrooms and the schools. Asthe effort moves forward to institutionalize thecritical elements of the pilot into district practice,the vision and strength of leaders throughout thedistrict will be essential to shape and guide thereform through its next steps.
RECOMMENDED ACTION
• Broaden the collaboration on behalf of studentachievement. Pay for Performance has beenbased on Denver’s unprecedented collabora-tion between the Board of Education and theAssociation.These parties have used their dualcommitment to student achievement as a basisfor sponsoring and regularly improving a high-risk venture.Their collaboration has proveninstrumental to making mid-course correc-tions that have consistently strengthened Payfor Performance. In so doing, they havedemonstrated a different way of conductingbusiness on behalf of students.This collabora-tion has been substantive and effective. Itshould be extended to other parts of districteducational operations, regardless of the out-come of the Association and Board votes on a new compensation plan.
• Continue to place problems on center stage. A cen-tral factor contributing to the accomplish-ments of the pilot has been the ability to placecritical issues that affect the district on centerstage. Urban school districts are characteristi-cally reluctant to make their most seriousinternal problems highly visible.Yet doing sohas been a major strength of Pay for Perfor-mance. Operating in a climate protected byexternal supporters and internal reformers, thepilot provided a functional vehicle for multipleproblems to be identified, discussed and thenacted upon.The district will benefit by contin-uing and extending this function.
• Create a Principals Leadership and AchievementInstitute. High quality principals are key toshaping, guiding and supporting schoolimprovements. Under Pay for Performance, the
district’s new educational initiatives and NoChild Left Behind, their responsibilities areexpanding and their decisions are becomingmore critical to the success of students andpublicly visible.All principals need to under-stand deeply how learning occurs and how it is nourished, measured and supported.Theyneed ongoing, sustained opportunities to iden-tify salient site issues, analyze trends in studentachievement data, reflect on emerging issues,develop their skill in observing classrooms andproviding support to teachers, and build theknowledge to work effectively with diversestudents and families.These functions are at the core of thoughtful and anticipatory schoolleadership. Building these capacities will com-plement the current district plans to prepareprincipals to carry out targeted educational initiatives, a Principals Leadership andAchievement Institute will provide the vehicle needed for strengthening these abilities in Denver’s principals.
• Prepare for the post-pilot and post-vote transition.The pilot benefited greatly from having a specialinternal implementation team with the com-mitment and sense of urgency that is essentialto create change.As the learnings and practicesfrom the pilot are implemented district-wide,it is now essential to institutionalize thesequalities.The supports for the new compensa-tion plan and expanding educational initia-tives need to be embraced by and channeledthrough the formal district structures.This is a critical step for the district even with theDesign Team on board for the next phase ofimplementation. Change agents can functioneffectively within large bureaucracies; however,they are not bureaucrats.As the transition fromthe “old Denver Public Schools” to the “newDenver Public Schools” continues, the districtneeds to ensure that the departments and unitsof the system are functioning with increasedcapacity, accountability and urgency on behalfof the district’s educational initiatives.
IMPACTAt school and central levels, the role of leadershipin a school district is to look ahead, anticipate theneeds of students, and create new approaches and
134 Catalyst for Change

solutions to existing and emerging educationalproblems. It takes courage, integrity, and personalaccountability to teach all students in a district asdiverse as Denver.The pilot has revealed outstand-ing leaders; it has also revealed gaps in leadershipknowledge and skill and vacuums in leadership.Due to the accomplishments of the pilot sponsors,the new administration, the Design Team and theJoint Task Force, Denver now has a pivotal oppor-tunity for leaders to expand a new way of con-ducting business.
C. SummaryThe Board of Education and the Denver Class-room Teachers Association have moved the Den-ver Public Schools to the forefront of educationalreform in the United States. Moreover, the partieshave committed to studying the pilot and regu-larly making results available to local and nationalaudiences. Rather than introduce a piecemeal
reform, they have sponsored and supported Payfor Performance as it has moved the entire orga-nization to make improvements which help stu-dents to learn and teachers to be more effective in the classroom.
The pilot has demonstrated that a focus onstudent achievement and a teacher’s contributionto such achievement can have a far reaching insti-tutional effect—if the initiative also addresses the districtfactors that shape the schools. In so doing, Pay forPerformance has further shown that the issue oforganizational alignment cuts to the very essence of how—and to what extent—a school district isfunctioning in support of student learning.Thechallenge ahead for the district is to build on thepilot’s foundation when implementing next itera-tions of Pay for Performance, undertaking thedistrict’s other educational initiatives, and meetingthe requirements of No Child Left Behind. Pay for Performance has been a catalyst for change.
135Issues and Recommendations

National Implications
A. IntroductionLinking what teachers earn to what students learn can be a major lever in supportof fundamental systemwide change in school districts. Pay for performance—whenwell implemented—has the salutary effect of forcing a district to operate in a muchmore effective and efficient fashion in support of student learning.That is to say,changes in district practices that are necessary to advance pay for performancealso directly support quality teaching and enhanced learning.
Based on this premise, the following discussion has four purposes. First, it laysout the core considerations for districts when undertaking pay for performanceinitiatives. Second, it identifies the types of assistance districts characteristicallyrequire to redefine traditional roles, practices, and policies.Third, the chapterexamines learnings for private foundations that have emerged from the pilot.Lastly, it presents philanthropic strategies for extending the potential and reach of pay for performance.
B. Core ConsiderationsSupport and accountability are the twin pillars of sustainable reform in schooldistricts. Embracing either one, to the exclusion of the other, is essentiallyselecting one form of myopia over another.The potential power of pay forperformance is in focusing on both support and accountability. It thereforecan be integral to critical reforms in public education.To be successful, though,districts need to learn from the failed attempts of the past and to overcomethe skepticism and barriers related to tying individual teacher performancelegitimately to student achievement. For districts preparing to head in thedirection of pay for performance, the following considerations can be the keysto success.
XC H A P T E R

ProcessPay for performance functions best when it rein-forces a district’s core goals; it is not a freestandingprogram or an adoptable model.Accordingly,the basic elements needed to undergird any cus-tomized, systemic reform have to be consideredwhen launching a major district initiative whichlinks student achievement to compensation.Theseelements include:
• Collaboration. Providing substantive opportunitiesfor teachers and principals—not only theirleaders—to shape, steer and influence the ini-tiative refines process and strengthens the out-come. Collaboration must be present from thestart of the effort through all phases of thedesign, development and implementation.Simply put, pay for performance imposed by aboard or district leadership erodes the potentialto develop real accountability.
• Trust.A high level of trust is required for anyeffort that seeks to link student achievement,adult performance and evaluation, and com-pensation. Participants need to be convincedthat the initiative is intended to be supportiveof teachers, rather than punitive.Therefore, onthe front end, the initiative needs to build trustamong diverse constituencies.This includes the trust between the schools and the district,between principals and teachers, and betweenand among teachers.
• Communication. Major initiatives are frequentlyderailed by gaps in information and communi-cation. Indeed, in the field of public education,the forces of misinformation are often greaterthan the forces of accurate information. In anera when accountability often takes the formof a hammer on perceived underperformers, itis essential to craft, carry out, regularly reviewand strengthen a communications strategy.
• Phases. Pay for performance is a marked depar-ture in culture and practice for school districts.During implementation, it will stretch the sup-port capacities of a district. It should be intro-duced in phases so that the district will have theopportunity to make mid-course corrections
and improvements as necessary. Otherwise,the distinction between the intent of the ini-tiative and how it is being implemented willget lost.When this occurs, participants willblame and subsequently oppose the initiative;this is a recurring pattern over many years inAmerican education.
• Relation to Collective Bargaining. Teacher unionsare taking leadership in the performance payarena and their commitment to the design and implementation of an initiative is essential.However, during the developmental phases,the initiative should be discrete and separatefrom the negotiation process.When imple-mented thoughtfully, pay for performancefocuses on core conditions affecting teachingand student achievement. Collective bargain-ing focuses on working conditions. If the twodovetail too quickly the confidence in pay forperformance will be undermined.
PurposeFrom the outset, it is essential to be clear on thepurpose of the initiative; this significantly affects theresults.With many performance-based initiatives,multiple purposes often compete, pulling the ini-tiative in different directions. For example, thegoals of building a new compensation plan orchanging professional development may sometimeswork against the goal of improving achievement.What then occurs is that the focus on improvingstudent achievement becomes blurred or mergedwith other purposes, leading to confusion on thepart of teachers and administrators and competitionamong district priorities.There needs to be realclarity on what will be rewarded and why.
Link of Student Achievement to CompensationWhen the primary purpose is to improve studentachievement, the initiative becomes easier tounderstand, implement, support and evaluate.Asjust one example, if the purpose is increasing studentachievement, the clear tie to the delivery ofinstruction and to motivating students becomesvitally important.Then, the need to provide sus-tained support to classroom teachers becomesparamount.When this is not the primary purpose
137National Implications

of the initiative, the entire emphasis on studentlearning can become muddied or lost.Then, payfor performance often deteriorates into a failedeffort to create incentives for teachers. Studentachievement needs to be both the driver and endresult; this cannot be overemphasized.
Data and Assessment CapacityPay for performance puts new demands on teachers.For example, it demands that they pay attentionto the starting places of each of their students invarious subjects—that they study the data andunderstand each student’s status—and that theybuild lessons and interventions based on thisknowledge.The specific identification of each student’s status at the beginning and end of theschool year, and over multiple years, is required forthe purpose of measuring the results.An under-standing of student academic progress is requiredfor the teacher to develop appropriate lessons.
Such requirements of teachers, in turn, placedemands on the district that may be surprisinglydifficult to meet. If teachers are to work withdata, for example, they must have that data avail-able to them at the beginning of school in a formthat is timely, usable and complete. In most dis-tricts, this has not been a requirement in the past.Even in the current era of No Child Left Behind,most districts are initially unable to meet thisdemand.As this problem is addressed, it helpsadvance pay for performance, while also helpingall schools and all teachers.This kind of datacapacity in support of pay for performance is critical for its success.
Assessment is necessarily at the core of anypay for performance initiative, as it is for much ofthe school improvement and accountability effortsbeing attempted across the nation. Indeed, therequirements of an assessment system under pay for performance are essentially the same as forimplementing No Child Left Behind or any effortwhich seeks to link student and teacher performance.
The potential of performance-based initiativescan be undercut if assessment-related issues areoverlooked.Too frequently, the purposes of theassessments are unclear, assessment results areinaccurate, or the interpretation applied to testresults exceeds what may legitimately be inferred
from those results.These problems are seriousenough when assessments carry high stakes forstudents.When you add teacher compensation tothe stakes, the need for reliable assessments—fairly constructed and accurately interpreted—becomes critical.
Several key considerations regarding assessmentare indicated below.This listing is not intended tobe all-inclusive. Rather, it highlights pivotal chal-lenges which can be addressed and which shouldnot be allowed to serve as barriers to undertakingpay for performance.
1.Student Growth. In a pay for performance system,a district must base its evaluations of teacherperformance, in part, on student growth.Therefore, its assessments must measure indi-vidual student growth. Many state assessmentsspeak of growth, but are used to compare onegroup of students—one class of 4th or 7thgraders—with the previous year’s class.Whilethis kind of assessment often provides valuableinformation, it compares different groups ofstudents and does not reflect the growth ofindividual students.To the extent that onegroup of 25-30 students differs from another,which can be considerable, these groups can-not fairly be compared to each other, and donot describe the success of a teacher with hisor her class of students.
2.Baseline Data. Measuring student growthassumes a starting point and an ending point.A student’s reading level at the end of fourthgrade may be an absolute, but without know-ing that student’s prior reading level it is notpossible to infer from a single score how muchthe student’s reading has improved or what hasbeen the contribution of that student’s teacher.For this reason, there must be baseline data foreach student, as well as for any broader com-parisons that are undertaken.
3.Link to Curriculum and Instruction. If an assess-ment does not measure what was taught, itcannot be said to reflect a teacher’s contribu-tion to what was learned.Thus, assessmentsthat may be generally useful in gauging studentknowledge may not be useful measures ofteacher effectiveness. Similarly, if the teacher does
138 Catalyst for Change

not teach to the curriculum, even an assessmentaligned to the curriculum does not measureteacher effectiveness.The latter is an issue thatwould have to be addressed administratively.
ValidityThere are three kinds of validity that pay for per-formance—and any program measurement—mustaddress. First, there is statistical or scientific validity.Whatever measures are reported or actions takenshould be the result of assessments that are mea-sured using statistically valid methods.While thispoint seems obvious, many states, districts andeven test companies fail the test of statistical validityin the inferences they draw from their tests. Statis-tical validity is difficult to achieve at the classroomlevel, since the numbers of students are small andthe possibility that a variation may be attributableto chance or aberrant scores is correspondinglygreat.There are various approaches to addressingthis problem, including using multiple measures ofachievement and/or multiple years of a teacher’sresults.While these methods add some complexitiesto the process, they can be used to increase thestatistical validity of an assessment, making it bothfairer and more useful.
Second, there is educational validity. It is possiblefor statistical results to support practices that arenot educationally valid, at least in the short term.It is also quite possible for educationally soundpractices to be difficult to measure or prove statis-tically.Any initiative put into place must also sat-isfy what is known about how students learn: itmust have educational validity.
Third, there is political validity.This becomesextremely important if comparing scores on stan-dardized tests is one of the methods being usedto gauge teacher success. Even where results aresignificant statistically, they may not be perceivedas legitimate. If teachers perceive that measuresbeing used to partially determine their compen-sation levels are not legitimate, no amount of statistical validation will be of value.Therefore,political validity—the perception that the system isfair—is critically important at every step of thedevelopment process.
Organizational AlignmentIf the purpose of the initiative is increasing studentachievement, the organization must align itselfaround that goal in a much clearer and more effec-tive manner than is often the case in school districts.
A pay for performance system demands that adistrict’s standards, curriculum content, instruc-tional delivery, professional development, datacapacity, assessment, supervisory and humanresources be aligned.This is frequently not thecase. Numerous failed reforms nationally havebeen based on the notion that single componentsof a district’s practices can be altered in ways thatwill change the rest of the system. However, theissue of alignment reaches far beyond organiza-tional structures or the currently popular inter-vention of the day. It cuts to the very essence ofhow—and to what extent—the school district isfunctioning systematically in support of studentlearning.Addressing the issues of organizationalalignment is pivotal to the initiative’s prospects for success.
Professional DevelopmentProfessional development is a critical componentof successful change. In a pay for performanceplan, it is also critical to the success of the planitself.The expectations of pay for performanceinclude that teachers and principals obtain studentachievement data, analyze the results, and tailorinstruction both to the curriculum provided andthe students’ abilities and needs.This requires thatthe teachers and principals have the appropriatedata available, and that they are able to understandand interpret the data accurately, identify studentneeds, set appropriate learning objectives, andstructure lessons accordingly. In our experience,however, even excellent teachers may not have allof these skills, particularly those relating to data.To fairly gauge a teacher’s instructional ability,therefore, professional development is required.
Professional development may also be requiredin standards-based instruction, differentiatedinstruction, or other related skills. Providing professional development in each of these areasenhances and reinforces the fairness, effectivenessand accuracy of the pay for performance initiative.
139National Implications
It also increases the likelihood of increasing student learning, by addressing critical gaps in the instructional process.
CostsThe range of costs connected to implementingpay for performance initiatives and making sys-temic changes take two forms. First, there arecosts that are financial in nature.These resultfrom new fiscal outlays such as salaries, equip-ment and additional staffing. School boards,unions and superintendents are highly familiarwith the financial costs of change. Second, thereare costs related to changing practices.These arenon-financial in nature and frequently underesti-mated.They include the institutional costs ofreordering district priorities, functioning withhigher levels of inter-departmental coordination,operating with a greater sense of urgency andreallocating existing funds.With an organizationalpriority as far reaching as pay for performance,it is essential to have short- and long-term pro-jections of the financial and non-financial costsof implementation.
C. Services and AssistanceAn extensive range of capacities is required toimplement pay for performance effectively.Theproblem, though, is that most districts lack thisbreadth of capacity.As a result, there is a repeatednational pattern of district misfires as they launchnew initiatives.This is not a function of poorintent. Rather, it is because districts need assis-tance to develop new capacities as they plan andimplement major initiatives.Absent such support,the already serious challenge of implementing payfor performance is exacerbated.
Districts require assistance in the multiplephases of conceptualizing, developing, implement-ing and evaluating a pay for performance initiative.The following highlights several of the substantiveareas in which responsive technical assistance canmarkedly increase district capacity.This listing is representative, rather than all-inclusive.
Identify initial levels of readiness and capacityAn essential, often overlooked step in preparing forpay for performance is to conduct a district assess-ment.This includes building the base needed to:
• Identify key participants for the buy-in, design,implementation and policy approval phases.
• Assess the district’s current level of readiness topursue a pathway of fundamental reform.
• Determine the district’s current performanceand capacity in the areas needed to supportand implement pay for performance.
• Assess the current process for teacher evaluation.
• Determine the district’s ability to link studentand teacher data.
• Identify the key constraints—legal, cultural,district rules and policies, existing contracts—that may affect the prospects for pay for performance.
Customize the design and implementationstrategy for pay for performancePay for performance needs to be approached sys-tematically. However, many districts have gonedown this path with a series of tactics, but in theabsence of a strategy.As a result, they have lackedthe ability to be anticipatory and to overcomeobstacles that emerge during implementation.Assistance is needed to:
• Develop a district-appropriate definition ofpay for performance.
• Align this initiative with district goals.
• Determine the structures and participation nec-essary to design and implement the initiative.
• Introduce and support pay for performance as a vehicle for promoting and supportingimproved student achievement and qualityteaching.
• Define project plans and phases, targets,resource requirements and timeframes.
• Establish project management goals, bench-marks and reports.
140 Catalyst for Change
• Define and communicate the accountabilitymechanisms.
• Secure requisite internal and external resources.
Build the base of institutional, constituentand community supportPay for performance requires a broad base of support, both within and from outside the dis-trict. Internally, it can only succeed with signifi-cant buy-in from teachers and principals. It alsorequires commitment from the central administra-tion. Moreover, it must be one of the highest priorities of the superintendent, the school boardand the teachers union. Externally, communityand corporate support are necessary, both to helpovercome entrenchments within the district andto provide long-term financial support. Eventually,it must be approved by teachers throughout thedistrict and by the school board.
Building this base of support requires theability to conduct consistent, sophisticated com-munications and community organizing.This,in turn, necessitates assistance that develops thecapacities to:
• Prepare and implement a coordinated communications strategy.
• Build a district- and community-wide understanding of pay for performance.
• Provide outreach to external grassroots andinstitutional constituencies, and the media.
• Train constituent groups (board members,teachers, site administrators, union officials,central administrators, parents, communitymembers and other external parties) in under-standing the design and implementation phasesof the initiative.
• Provide avenues for ongoing constituent input,participation and response.
• Demonstrate the improvements in learning,teaching and organizational support resultingfrom the initiative.
• Respond rapidly to clarify any major areas ofconfusion regarding the initiative.
Strengthen district data capacityA critical challenge when implementing a com-pensation system based on student achievement isto determine the extent of learning and progressdistrict-wide, school by school, classroom by class-room, and student by student.The district needs toknow which students are succeeding, which studentsare not succeeding, and why.This knowledge isessential for realigning district resources based onthe needs of children at each individual school siteand for establishing expectations to which everyonein the district will be held accountable.
Assistance is needed to train key staff in thedevelopment of a comprehensive district account-ability system.This specifically focuses on buildingthe capacities to:
• Identify actual and relative school performance.
• Disaggregate district performance indicatorsby various student-related subgroups such associoeconomic status, race, ethnicity, mobility,etc.
• Identify the student subgroups that have the greatest needs and represent the greatestopportunity for improvement—e.g., thosewhose performance is substantially below that of the best performing subgroup.
• Calculate the performance of the variousgroups at select schools through a process that can then be applied to all schools.
• Analyze similarities in results among high-per-forming schools and the differences in resultsbetween the high and low performing schools.
• Disaggregate data by grade and classroom toprovide comprehensive, multi-year individualstudent growth data to teachers.
• Focus on longitudinal analysis based on indi-vidual student growth.
• Involve principals, teachers and parents indeveloping the data presentation formats.
Design the compensation planThis focuses on all aspects of developing, field-testing, finalizing and engendering support for a
141National Implications

new district direction for compensation. Itincludes building the capacities to:
• Evaluate the current system of salaries and benefits.
• Examine different kinds of compensation systems within both the corporate and publiceducational sectors.
• Differentiate between the myths and realitiesof such systems.
• Evaluate the impact of different approaches toteacher compensation on student achievement.
• Identify relevant, effective practices.
• Craft a customized, pay for performance component in the compensation system.
• Assess the plan’s financial implications.
• Determine the vehicles for making the transitionfrom the existing, negotiated salary schedule to the new plan.
• Build appropriate expectations within the district.
• Determine the strategy for field-testing andimproving the new design.
• Ensure that the implementation of the plancan withstand leadership changes.
Build leadership and organizational alignmentAn expanded base of leadership is needed todevelop, implement and make mid-course cor-rections to the pay for performance initiative.Leadership is particularly needed—at school,district and policy levels—to ensure that theschool district is aligned in support of pay forperformance.
This necessitates building the capacities to:
• Analyze and strengthen the alignment betweenschool and classroom goals, curriculum con-tent, the planning and delivery of instruction,assessments, professional development andcompensation.
• Integrate and upgrade the student informationand human resources data systems.
• Identify and address gaps in the existing supervisory and support structures.
• Incorporate student achievement trendanalysis into board program and policy decision making.
• Link the emerging pay for performance initiative with the requirements of the NoChild Left Behind Act.
• Create new expectations for performancethroughout the district.
• Redefine roles and clarify changes inresponsibility.
• Evaluate leaders using measures which includestudent achievement.
• Train principals and central administrators inthe development and interpretation of individ-ual and school level student achievement datafocusing on the growth of individual studentsand school trends.
• Integrate and coordinate the systems forteacher evaluation, support and recognitionwith student achievement being both the driver and end result.
Establish a comprehensive professionaldevelopment strategyThe precursor to such a strategy is to conduct arigorous professional development audit.This will provide a detailed analysis necessary for re-allocating and deploying existing resources.Thecomponents of the audit should include: (1)defining the initiating events for the professionaldevelopment, (2) detailing training offerings, (3)assessing the content of the training, (4) assessingthe frequency of the training, (5) identifying therecipients of the training, by session, (6) identify-ing the subsidy source, (7) identifying the subsidyamounts, (8) assessing the providers and the num-ber of staff involved, (9) examining the providersin terms of their placement within the organiza-tion, (10) reviewing quality indicators and deter-minations, (11) evaluating the level of masterydemonstrated by those trained, and (12) deter-mining the overall impact of the professionaldevelopment provided.
142 Catalyst for Change

This information then becomes the basis forpreparing the district’s professional developmentstrategy and aligning it with instructional goals.Using this approach, the district is better able toprovide school sites with professional develop-ment based on actual student achievement resultsand the differentiated needs of the school sites—a sound educational practice. Moreover, particu-larly during a period of fiscal austerity, it enablesa district to better target resources to improvestudent achievement.
D. FoundationsWhen seeking to invest in public schools, founda-tions have often followed the pattern of makingincentive grants available for purposes of planningand implementation.The applicants characteristicallymust follow foundation-defined templates and prior-ities. Initially, a modest number of schools or districtssecures funds for a time-limited planning period.Subsequently, they apply for larger grants; the foun-dation then selects a smaller number of these schoolsor districts for a multi-year implementation period.
As a recurring approach to educational philan-thropy, particularly at the national level in recentdecades, it characteristically produces a dynamicthat generally falls short of the intended results. Itencourages short-term responses to a grant incen-tive, rather than fundamental change.When theextra funds and special dispensations are no longeravailable, the system returns to earlier patterns ofpractice and there are few resultant learnings.Vari-ous philanthropic requirements such as requiringmatching funds or embedding new concepts incontracts have not changed this basic outcome.Simply put, the way the system thinks andbehaves does not change.
A new form of philanthropy more wiselyfollows a different path. It is sensitive to theneed to not impose foundation priorities fromabove.Yet it is also careful because pursuing aprimarily bottom-up approach carries with itseveral cautionary red flags and distinct gaps,including the lack of district commitment tothe initiative. Supporting new ventures andadvocating for fundamental change requires a creative, concurrent top-down, bottom-upphilanthropic strategy.
Venture CapitalAchieving different results requires new ideaswhose implementation can be tested and critically examined.This, in turn, can only beachieved with a different approach to philan-thropy.With philanthropic leadership, a signifi-cant change was advanced in Denver. Ratherthan invest in the model program currently invogue or a foundation-created construct, a blendof local and national funders invested in a far-reaching district and union experiment with aconcept, pay for performance.
This is one of the rare examples of founda-tions applying the approach of venture capital topublic educational giving.The foundations tooksignificant risks in supporting the field testing and study of an unproven venture linking teachercompensation, in part, to student achievement.While the potential for district learning andchange was great, so too was the potential forpublic embarrassment for the foundations.Embarking upon this direction required leader-ship—a critical element for achieving philan-thropic impact
Throughout the pilot, the foundations sus-tained their giving, while concurrently broadeningtheir own knowledge as well as those of the dis-trict. In describing the philanthropic communityand the district, one foundation executive noted,“I don’t think any of us, including the administra-tion, really correctly estimated the size or amountof work entailed in this project.” Another added,“We all have learned that this subject is a lot morecomplicated than we first thought.The system hasalso learned a lot from this effort.”
The definition of success also expanded as thepilot achieved greater reach into the system andencountered barriers to progress. An executivedirector of a foundation commented,“Success isnot just a blanket commitment to Pay for Perfor-mance. Success is measured by how much learn-ing occurs and whether the learning is used tomake positive changes.”
Results: Research as DriverThe venture capital support was triple-tiered,supporting direct services (e.g., communica-tions), a range of technical assistance, and the
143National Implications

research study.The latter was particularly stresseddue to the philanthropic emphasis on having dis-trict actions be based on learnings.A leader of alocal foundation states,“Regardless whether [anew compensation] plan passes or not, Pay forPerformance will have an impact.The vote willnot be the final word.... [the foundation] gave themoney so that district leadership could learn.They need to get beyond the usual inertia.”
Just as pay for performance focuses on results,the foundations also stressed results.Whenresearch produced findings and recommendations,the foundations wanted to see follow-up action.This, in turn, helped internal district reformers to introduce changes.Another foundation leadercomments,“In this field, no distinction is madebetween an educational concept and the execu-tion of the concept....What to do in education is up for grabs.The impact of this project isimportant and designates a new time and age....The challenging of district personnel and the system as a whole is reshaping the district.”
It requires a delicate balance to push granteesand their beneficiaries for results, yet avoid func-tioning as de facto operating foundations. Particu-larly in the area of national school reform, thisquandary has been problematic for many founda-tions. Consequently, they have created accountabil-ity and partnership mechanisms which granteesare characteristically required to use. Beyondtheir varying levels of effectiveness, these haveoften been received as imposed mechanisms.Differing from this approach, the Pay for Perfor-mance supporters urged parties to collaborate,joined in the collaboration when asked and pro-vided additional support when gaps or deficien-cies in the pilot were revealed. However, themechanisms for leadership and accountability wereneither created nor imposed by the foundations.
Establishing the ContextDistricts exist in a larger context—equally aspolitical as educational—which needs to be influ-enced and shaped to create an environment that ismore open and conducive to a change as signifi-cant and far-reaching as pay for performance.Indeed, in our meetings with policy makers, dis-tricts, funders, commentators and the media, it isnotable how opinionated most parties are on the
topic of pay for performance—regardless of theirbase of factual information. It is reminiscent ofthe old axiom that it is incredible what conclu-sions you can draw if you do not bother to let thefacts get in the way.This has serious implicationsfor experiments with pay for performance.
Foundations need to take an expansiveapproach consistent with their core belief in the fundamental importance of improving publiceducation.The need is to create a local and/ornational context in which trailblazing districts andunions can explore and experiment with neededavenues for major change.This will build on afoundation’s rightful goal of supporting local ini-tiatives (without imposing its priorities on thefield), while shaping the context for Pay for Per-formance or comparable initiatives in ways thatwill enhance the prospects for significant—andcritically needed—success.
Recognizing there is controversy surroundingand opposition to these issues, foundations can usetheir pivotal philanthropic role to help re-shapethe context, climate and discussion of perfor-mance-based improvement strategies. By creatingsafe havens for disagreeing or conflicting parties,highlighting the need for actions in response toresearch findings, and being committed for thelong haul, foundations can greatly expand the reachof their philanthropy and the impact of systemicinitiatives such as Pay for Performance.
Differing dramatically from traditional educa-tional philanthropy, this approach is rooted in ven-ture capital. It focuses on fundamentally changingconditions and enabling school districts to movein new directions.This directly supports the goalof ensuring that students—and those who con-tribute to their achievement—are the direct beneficiaries of the improvement efforts.
E. SummaryThere are a range of the factors that must be con-sidered when developing and implementing payfor performance initiatives. Such efforts can resultin a new approach to rewarding teachers, whetherthat consists of small bonuses or a large restructur-ing of the compensation system. Most significantlythough, these initiatives can be a catalyst for align-ing district resources, actions and expectations in
144 Catalyst for Change

support of the overall goal of increasing studentachievement and supporting teachers. In this way, pay for performance can provide a basis forimproving the entire school system by tying dis-trict activities to core classroom needs.When
the school system is functioning in a much moreorganized and effective manner in support of bet-ter teaching and enhanced learning, pay for perfor-mance can become a vehicle for increasing studentachievement—the bottom line for school reform.
145National Implications

146 Catalyst for Change
Chapter I1 Kohn,A.,The Folly of Merit Pay, Education Week (September
17, 2003).2 “Rewarding Teacher Quality,” available at
http://www.nga.org/incentivepay/ [2002, November].3 From an internal project planning document of the Design
Team, December 3, 1999.4 Pathway to Results can be found on the website of the
Community Training and Assistance Center atwww.ctacusa.com.
Chapter II1 Sanders,W. J. and Horn, S. P. (1998). Research Findings from
the Tennessee Value-Added Assessment System (TVAAS)Database: Implications for Educational Evaluation andResearch. Journal of Personnel Evaluation in Education, 12(3),247-256.
2 Haycock, K. (1998). Good Teaching Matters . . .A Lot.Thinking K-16. 3(2), 3-14.
3 Wilms,W. and Chapleau, R. (1999, November 3).TheIllusion of Paying Teachers for Student Performance—Some Lessons from History. Education Week. 19(10) 48, 34.
4 Moore Johnson, S. (1986). Incentives for Teachers:WhatMotivates,What Matters. Educational Administration Quarterly,22(3), 54-79.
5 Odden,A. (2000, January). New and Better Forms of TeacherComposition are Possible, Phi Delta Kappan, 361-366.
6 Archer, J. (2001, February 7). Business Seeks TeacherRenaissance, Education Week, 34, 48.
7 Archer, J. (2000, June 21). NEA Poised to Debate Pay forPerformance. Education Week, 5.
8 Merriam, S. B. (1988). Case Study Research in Education:A Qualitative Approach. San Francisco: Jossey-Bass.
Bogdan, R. C. and Knopp Biklen, S. (1982). QualitativeResearch for Education:An Introduction to Theory and Methods.Boston:Allyn and Bacon.
Yin, R. K. (1984). Case Study Research: Design and Methods.Beverly Hills: Sage.
Chapter III1 Previously cited Agreement,Appendix E, Currently
Appendix 01-01(1), III-A-3.2 This is a math instrument developed by the district for use
in the Title I program, which was later renamed Grade LevelMath and is used in the district for Pay for Performance.
3 Denver Public Schools (2000). District Assessment Guide:Elementary and Secondary. Denver, CO.
Chapter IV1 See links for teacher lesson planning at the following:
http://www.askeric.org/Virtual/lessons/2 Mager, R. (1962). Preparing Instructional Objectives.
Palo Alto, CA: Fearon.3 Fraser, B. J. et al. (1987). Synthesis of Educational Productivity
Research, Journal of Educational Research, 11, 2, 145-252.4 Wolfe, P. (Nov 1998). Revising Effective Teaching, Educational
Leadership,V56, N3, 61-64.5 Walberg, H. J. (1999). Productive Teaching, in Waxman, H.C.
and Walberg, H.J. (Eds.), New Directions for Teaching Practice andResearch, Berkeley, CA: McCutchen, 75-104.
Chapter V1 Darling-Hammond, L. (2000, January).Teacher Quality
and Student Achievement:A Review of State PolicyEvidence, Education Policy Analysis Archives (8:1), pp. 3-6 at http://epaa.asu.edu/
2 Hinde, E. (2003). Reflections on Reform:A Former TeacherLooks at School Change and the Factors that Shape It,Teachers College Record at http://www.tcrecord.org/ IDNumber 1183, published 8/3/2003.
Chapter VIII1 Bryk,A. S. and Schneider, B. L. (2002). Trust in Schools:A
Core Resource for Improvement. Russell Sage Foundation.2 Southern Regional Education Board (SREB) (2002). Quality
Teachers: Can Incentive Policies Make a Difference? 13.3 Henderson-Montero, D., Julian, M.W., and Yen,W. M. (2003,
Summer). Multiple Measures:Alternative Design and AnalysisModels. Educational Measurement: Issues and Practice, 22, 7-12.
Endnotes

147Notes
Notes

148 Catalyst for Change
Figure A-1 through A-12, A-43 through A-46 The second and third models adjust for the following school factors: principal years at the school, percent of students with disabilities,percent of students who are English languagelearners, percent of students receiving free orreduced price lunch, percent of teachers not fullylicensed, and total school enrollment. The thirdmodel also adjusts for the following student factors: low SES, any disability, retained a grade,English proficiency, ethnicity, and gender.
Figure A-13 The second and third models adjust for the following school factors: percent of students with disabilities, percent of studentswho are English language learners, percent ofstudents receiving free or reduced price lunchand total school enrollment.The third model alsoadjusts for the following student factors: low SES,any disability, retained a grade, English proficiency,ethnicity, and gender.
Figure A-14 The second and third models adjustfor the following school factors: principal years atthe school and percent of students with disabilities.The third model also adjusts for the followingstudent factors: low SES, any disability, retained agrade, English proficiency, ethnicity, and gender.
Figure A-15 The second and third models adjustfor the following school factors: percent of studentswith disabilities and percent of students receivingfree or reduced price lunch.The third model alsoadjusts for the following student factors: low SES,any disability, retained a grade, English proficiency,ethnicity, and gender.
Figure A-16 through A-18 The second andthird models adjust for the following school factors: principal years at the school, percent ofstudents with disabilities, percent of students whoare English language learners, percent of studentsreceiving free or reduced price lunch and totalschool enrollment.The third model also adjustsfor the following student factors: low SES, anydisability, retained a grade, English proficiency,ethnicity, and gender.
Figure A-20 The second and third models adjustfor the following school factors: percent of studentswith disabilities, percent of students receiving freeor reduced price lunch and total enrollment.Thethird model also adjusts for the following studentfactors: low SES, any disability, retained a grade,English proficiency, ethnicity, and gender.
Figure A-21 The second and third models adjustfor the following school factors: principal years atthe school, percent of students who are Englishlanguage learners, percent of students receivingfree or reduced price lunch, percent of teachersnot fully licensed, and total school enrollment.The third model also adjusts for the followingstudent factors: low SES, any disability, retained agrade, English proficiency, ethnicity, and gender.
Figure A-22 The second and third models adjustfor the following school factors: percent of studentswith disabilities, percent of students who are Englishlanguage learners, percent of students receiving freeor reduced price lunch, and total school enrollment.The third model also adjusts for the followingstudent factors: low SES, any disability, retained agrade, English proficiency, ethnicity, and gender.
A p p e n d i x

149Appendix
Figure A-23 through A-24 The second andthird models adjust for the following school factors:percent of students with disabilities and percent ofstudents who are English language learners.Thethird model also adjusts for the following studentfactors: low SES, any disability, retained a grade,English proficiency, ethnicity, and gender.
Figure A-25 The second and third models adjust for the following school factors: percent of students receiving free or reduced price lunch and percent of teachers not fully licensed.The third model also adjusts for the followingstudent factors: low SES, any disability, retained agrade, English proficiency, ethnicity, and gender.
Figure A-26 through A-27, A-29 The secondand third models adjust for the following schoolfactors: principal years at the school and percentof students with disabilities.The third model alsoadjusts for the following student factors: low SES,any disability, retained a grade, English proficiency,ethnicity, and gender.
Figure A-28, A-30, A-31 The second and thirdmodels adjust for the following school factor:percent of students receiving free or reduced pricelunch.The third model also adjusts for the followingstudent factors: low SES, any disability, retained agrade, English proficiency, ethnicity, and gender.
Figure A-32 through A-42, A-55 through A-64 The second model adjusts for the followingstudent factors: low SES, any disability, retained agrade, English proficiency, ethnicity, and gender.
Figure A-49 through A-54 The second andthird models adjust for the following school factor:percent of students with disabilities.The thirdmodel also adjusts for the following student factors:low SES, any disability, retained a grade, Englishproficiency, ethnicity, and gender.

152 Catalyst for Change
FIG. A-2
PFP Effect—Elementary Schools—ITBS Language NCE ScoresWeighted Two-Stage Hierarchical Linear Model
Unadjusted Adjusted for School Factors Adjusted for School and Student Factors
� p(�=0) � p(�=0) � p(�=0)
Intercept 43.7 0.0001 43.5 0.0001 56.5 0.0001
Pilot -2.3 0.1027 -0.7 0.4885 -0.6 0.5398
Control 0.0 0.0 0.0
Time -0.2 0.0205 -0.1 0.1262 -0.03 0.6427
Time x Pilot -0.1 0.5093 -0.1 0.6769 -0.1 0.6696
Time x Control 0.0 0.0 0.0
Number of Observations 44486 44486 44486
FIG. A-3
PFP Effect—Elementary Schools—ITBS Math NCE ScoresWeighted Two-Stage Hierarchical Linear Model
Unadjusted Adjusted for School Factors Adjusted for School and Student Factors
� p(�=0) � p(�=0) � p(�=0)
Intercept 43.6 0.0001 42.7 0.0001 52.6 0.0001
Pilot 2.3 0.1088 3.3 0.0003 3.7 0.0001
Control 0.0 0.0 0.0
Time -0.6 0.0001 -0.4 0.0001 -0.3 0.0001
Time x Pilot -0.1 0.5583 -0.2 0.2325 -0.4 0.0128
Time x Control 0.0 0.0 0.0
Number of Observations 47164 47164 47164
FIG. A-1
PFP Effect—Elementary Schools—ITBS Reading NCE ScoresWeighted Two-Stage Hierarchical Linear Model
Unadjusted Adjusted for School Factors Adjusted for School and Student Factors
� p(�=0) � p(�=0) � p(�=0)
Intercept 43.5 0.0001 42.3 0.0001 56.1 0.0001
Pilot 0.4 0.7894 2.1 0.0156 2.5 0.0024
Control 0.0 0.0 0.0
Time -0.3 0.0004 -0.1 0.2870 0.1 0.0847
Time x Pilot 0.2 0.1374 -0.1 0.5716 -0.3 0.0318
Time x Control 0.0 0.0 0.0
Number of Observations 49592 49592 49592

153Appendix
FIG. A-4
PFP Effect—Elementary Schools—CSAP Reading NCE ScoresWeighted Two-Stage Hierarchical Linear Model
Unadjusted Adjusted for School Factors Adjusted for School and Student Factors
� p(�=0) � p(�=0) � p(�=0)
Intercept 51.6 0.0001 51.0 0.0001 65.3 0.0001
Pilot 2.9 0.0645 2.1 0.0289 2.6 0.0018
Control 0.0 0.0 0.0
Time -0.2 0.0735 -0.01 0.8988 0.2 0.0516
Time x Pilot -0.3 0.0694 -0.5 0.0072 -0.7 0.0001
Time x Control 0.0 0.0 0.0
Number of Observations 36398 36398 36398
FIG. A-5
PFP Effect—Elementary Schools—CSAP Writing NCE ScoresWeighted Two-Stage Hierarchical Linear Model
Unadjusted Adjusted for School Factors Adjusted for School and Student Factors
� p(�=0) � p(�=0) � p(�=0)
Intercept 49.5 0.0001 49.4 0.0001 63.0 0.0001
Pilot 6.1 0.0010 3.2 0.0018 3.7 0.0001
Control 0.0 0.0 0.0
Time 0.1 0.2053 0.3 0.0041 0.5 0.0001
Time x Pilot -0.5 0.0220 -0.7 0.0025 -0.8 0.0001
Time x Control 0.0 0.0 0.0
Number of Observations 24463 24463 24463
FIG. A-6
PFP Effect—Elementary Schools—CSAP Math NCE ScoresWeighted Two-Stage Hierarchical Linear Model
Unadjusted Adjusted for School Factors Adjusted for School and Student Factors
� p(�=0) � p(�=0) � p(�=0)
Intercept 51.0 0.0001 49.4 0.0001 61.2 0.0001
Pilot 5.5 0.0253 5.2 0.0002 6.2 0.0001
Control 0.0 0.0 0.0
Time 0.002 0.9863 0.2 0.2730 0.2 0.1618
Time x Pilot -1.3 0.0001 -1.3 0.0001 -1.5 0.0001
Time x Control 0.0 0.0 0.0
Number of Observations 11154 11154 11154

154 Catalyst for Change
FIG. A-7
PFP Effect—Middle Schools—ITBS Reading NCE ScoresWeighted Two-Stage Hierarchical Linear Model
Unadjusted Adjusted for School Factors Adjusted for School and Student Factors
� p(�=0) � p(�=0) � p(�=0)
Intercept 43.1 0.0001 42.6 0.0001 55.6 0.0001
Pilot -10.3 0.1445 -2.4 0.3592 -2.9 0.3047
Control 0.0 0.0 0.0
Time -1.1 0.0001 -1.3 0.0001 -0.4 0.0001
Time x Pilot 0.8 0.0029 0.9 0.0024 1.1 0.0001
Time x Control 0.0 0.0 0.0
Number of Observations 43375 43375 43371
FIG. A-8
PFP Effect—Middle Schools—ITBS Language NCE ScoresWeighted Two-Stage Hierarchical Linear Model
Unadjusted Adjusted for School Factors Adjusted for School and Student Factors
� p(�=0) � p(�=0) � p(�=0)
Intercept 46.4 0.0001 46.1 0.0001 57.7 0.0001
Pilot -6.7 0.2628 -3.3 0.3148 -2.8 0.3326
Control 0.0 0.0 0.0
Time -1.0 0.0001 -1.1 0.0001 -0.4 0.0001
Time x Pilot -0.3 0.3006 -0.4 0.1394 -0.3 0.1982
Time x Control 0.0 0.0 0.0
Number of Observations 41493 41493 41490
FIG. A-9
PFP Effect—Middle Schools—ITBS Math NCE ScoresWeighted Two-Stage Hierarchical Linear Model
Unadjusted Adjusted for School Factors Adjusted for School and Student Factors
� p(�=0) � p(�=0) � p(�=0)
Intercept 42.1 0.0001 41.4 0.0001 51.4 0.0001
Pilot -7.2 0.2528 -0.9 0.6854 -1.5 0.5598
Control 0.0 0.0 0.0
Time -0.8 0.0001 -1.0 0.0001 -0.2 0.0238
Time x Pilot 0.3 0.2103 0.4 0.2163 0.3 0.1828
Time x Control 0.0 0.0 0.0
Number of Observations 41815 41815 41812

155Appendix
FIG.A-10
PFP Effect—Middle Schools—CSAP Reading NCE ScoresWeighted Two-Stage Hierarchical Linear Model
Unadjusted Adjusted for School Factors Adjusted for School and Student Factors
� p(�=0) � p(�=0) � p(�=0)
Intercept 49.5 0.0001 49.0 0.0001 63.5 0.0001
Pilot -8.9 0.2199 0.5 0.8232 0.9 0.6991
Control 0.0 0.0 0.0
Time 0.03 0.7794 -0.3 0.0149 0.5 0.0001
Time x Pilot 0.3 0.3765 0.1 0.8407 -0.1 0.8075
Time x Control 0.0 0.0 0.0
Number of Observations 38363 38363 38359
FIG. A-11
PFP Effect—Middle Schools—CSAP Writing NCE ScoresWeighted Two-Stage Hierarchical Linear Model
Unadjusted Adjusted for School Factors Adjusted for School and Student Factors
� p(�=0) � p(�=0) � p(�=0)
Intercept 49.7 0.0001 49.5 0.0001 64.2 0.0001
Pilot -9.0 0.2093 -0.9 0.6476 -1.1 0.6486
Control 0.0 0.0 0.0
Time 0.003 0.9800 -0.3 0.0080 0.6 0.0001
Time x Pilot 0.3 0.3374 0.5 0.1843 0.7 0.0455
Time x Control 0.0 0.0 0.0
Number of Observations 30201 30201 30197
FIG. A-12
PFP Effect—Middle Schools—CSAP Math NCE ScoresWeighted Two-Stage Hierarchical Linear Model
Unadjusted Adjusted for School Factors Adjusted for School and Student Factors
� p(�=0) � p(�=0) � p(�=0)
Intercept 50.0 0.0001 49.6 0.0001 59.9 0.0001
Pilot -8.9 0.1887 -0.9 0.7356 -1.3 0.5782
Control 0.0 0.0 0.0
Time -0.3 0.0187 -0.6 0.0001 0.6 0.0001
Time x Pilot 1.9 0.0001 1.9 0.0001 1.6 0.0001
Time x Control 0.0 0.0 0.0
Number of Observations 30279 30279 30275

156 Catalyst for Change
FIG. A-13
PFP Effect—High Schools—ITBS Reading NCE ScoresWeighted Two-Stage Hierarchical Linear Model
Unadjusted Adjusted for School Factors Adjusted for School and Student Factors
� p(�=0) � p(�=0) � p(�=0)
Intercept 45.2 0.0001 44.6 0.0001 55.5 0.0001
Pilot : Manual -13.0 0.0601 2.2 0.6954 -4.3 0.4486
Pilot : Jefferson 10.7 0.3246 -3.1 0.6434 -2.4 0.7261
Control 0.0 0.0 0.0
Time 0.9 0.0001 1.4 0.0001 2.0 0.0001
Time x Manual -0.2 0.8712 -0.01 0.9941 1.9 0.0912
Time x Jefferson -2.0 0.0023 -2.1 0.0025 -1.6 0.0113
Time x Control 0.0 0.0 0.0
Number of Observations 20000 20000 19995
FIG. A-14
PFP Effect—High Schools—ITBS Language NCE ScoresWeighted Two-Stage Hierarchical Linear Model
Unadjusted Adjusted for School Factors Adjusted for School and Student Factors
� p(�=0) � p(�=0) � p(�=0)
Intercept 35.7 0.0001 34.1 0.0001 43.7 0.0001
Pilot : Manual -13.9 0.0052 -18.8 0.0022 -28.0 0.0026
Pilot : Jefferson -9.7 0.1626 -13.3 0.0927 -17.5 0.1672
Control 0.0 0.0 0.0
Time 2.2 0.0001 2.7 0.0001 3.5 0.0001
Time x Manual 5.0 0.0005 5.5 0.0003 8.2 0.0001
Time x Jefferson 7.3 0.0043 7.5 0.0039 7.1 0.0036
Time x Control 0.0 0.0 0.0
Number of Observations 11069 11069 11064
FIG. A-15
PFP Effect—High Schools—ITBS Math NCE ScoresWeighted Two-Stage Hierarchical Linear Model
Unadjusted Adjusted for School Factors Adjusted for School and Student Factors
� p(�=0) � p(�=0) � p(�=0)
Intercept 40.7 0.0001 41.0 0.0001 50.8 0.0001
Pilot : Manual -17.7 0.0056 -12.8 0.0377 -16.2 0.0369
Pilot : Jefferson -15.1 0.0923 -26.0 0.0038 -26.1 0.0196
Control 0.0 0.0 0.0
Time 3.5 0.0001 3.8 0.0001 4.2 0.0001
Time x Manual 3.2 0.0171 3.9 0.0042 4.8 0.0002
Time x Jefferson 12.9 0.0001 13.4 0.0001 12.6 0.0001
Time x Control 0.0 0.0 0.0
Number of Observations 16855 16855 16851

157Appendix
FIG. A-16
PFP Effect—High Schools—CSAP Reading NCE ScoresWeighted Two-Stage Hierarchical Linear Model
Unadjusted Adjusted for School Factors Adjusted for School and Student Factors
� p(�=0) � p(�=0) � p(�=0)
Intercept 50.5 0.0001 52.3 0.0001 65.3 0.0001
Pilot: Manual -12.3 0.0712 -0.8 0.8485 -4.6 0.3337
Pilot: Jefferson 6.0 0.5708 -6.6 0.1866 -9.8 0.1106
Control 0.0 0.0 0.0
Time 0.2 0.1902 0.4 0.0454 1.2 0.0001
Time x Manual 0.3 0.7972 -0.2 0.8477 1.0 0.3296
Time x Jefferson 0.2 0.7223 0.5 0.4604 1.5 0.0155
Time x Control 0.0 0.0 0.0
Number of Observations 20831 20831 20827
FIG. A-17
PFP Effect—High Schools—CSAP Writing NCE ScoresWeighted Two-Stage Hierarchical Linear Model
Unadjusted Adjusted for School Factors Adjusted for School and Student Factors
� p(�=0) � p(�=0) � p(�=0)
Intercept 50.4 0.0001 51.0 0.0001 64.0 0.0001
Pilot: Manual -15.6 0.0300 0.5 0.9216 -6.4 0.2396
Pilot: Jefferson 7.8 0.4560 0.3 0.9482 -1.8 0.7665
Control 0.0 0.0 0.0
Time 0.2 0.2563 0.5 0.0637 1.7 0.0001
Time x Manual 1.3 0.3844 -0.3 0.8459 1.1 0.3815
Time x Jefferson -0.5 0.5493 -0.8 0.3552 0.2 0.8025
Time x Control 0.0 0.0 0.0
Number of Observations 16456 16456 16452
FIG. A-18
PFP Effect—High Schools—CSAP Math NCE ScoresWeighted Two-Stage Hierarchical Linear Model
Unadjusted Adjusted for School Factors Adjusted for School and Student Factors
� p(�=0) � p(�=0) � p(�=0)
Intercept 51.6 0.0001 51.0 0.0001 60.3 0.0001
Pilot: Manual -14.9 0.0223 0.5 0.9036 -2.3 0.5870
Pilot: Jefferson 5.6 0.5408 2.0 0.6373 0.1 0.9769
Control 0.0 0.0 0.0
Time 0.1 0.7309 0.3 0.2707 1.3 0.0001
Time x Manual 1.2 0.3934 -0.5 0.7051 0.5 0.7114
Time x Jefferson 0.1 0.9125 -0.8 0.3556 -0.1 0.8641
Time x Control 0.0 0.0 0.0
Number of Observations 16649 16649 16645

158 Catalyst for Change
FIG. A-19
Individual Growth Models, Unadjusted—Elementary, Middle and High SchoolsITBS Reading ITBS Language ITBS Math CSAP Reading CSAP Writing CSAP Math
� p(�=0) � p(�=0) � p(�=0) � p(�=0) � p(�=0) � p(�=0)
Elementary Schools
Intercept 44.5 0.0001 45.0 0.0010 44.9 0.0001 51.5 0.0001
Pilot -1.3 0.3525 0.2 0.5748 2.2 0.1480 2.0 0.1823
Control 0.0 0.0 0.0 0.0
Time 0.8 0.0001 0.2 0.0147 -0.5 0.0001 1.0 0.0001
Time x Pilot -0.4 0.0143 -1.1 0.0001 -0.8 0.0001 -0.5 0.0183
Time x Control 0.0 0.0 0.0 0.0
Observations 19749 17837 18248 15417
Middle Schools
Intercept 43.7 0.0001 49.1 0.0001 40.9 0.0001 50.9 0.0001 51.7 0.0001 52.9 0.0001
Pilot -8.9 0.2022 -8.1 0.1596 -5.9 0.3276 -8.5 0.2040 -9.7 0.1444 -14.1 0.0453
Control 0.0 0.0 0.0 0.0 0.0 0.0
Time 0.1 0.5632 -2.4 0.0001 2.7 0.0001 0.4 0.0007 0.01 0.9581 -1.0 0.0208
Time x Pilot -0.1 0.8757 -0.1 0.7405 0.5 0.1406 0.004 0.9902 0.9 0.0548 4.9 0.0001
Time x Control 0.0 0.0 0.0 0.0 0.0 0.0
Observations 15384 14996 14504 13125 9505 6572
High Schools
Intercept 48.3 0.0001 44.5 0.0001 48.0 0.0001 53.4 0.0001
Pilot: Manual -14.1 0.0279 -15.3 0.0430 -15.0 0.0143 -23.1 0.0053
Pilot: Jefferson 9.2 0.3372 9.9 0.2474 6.7 0.5142
Control 0.0 0.0 0.0 0.0
Time 0.4 0.0319 0.2 0.4981 -0.2 0.5869 -2.2 0.0010
Time x Manual 0.8 0.3434 4.3 0.0732 2.9 0.0231 2.5 0.0021
Time x Jefferson -0.9 0.0830 -2.7 0.0180 -0.03 0.9702
Time x Control 0.0 0.0 0.0 0.0
Observations 7229 3530 5105 6213

159Appendix
FIG. A-20
PFP Effect by Maximum Rubric Level—Elementary Schools—ITBS Reading NCE Scores Weighted Two-Stage Hierarchical Linear Model
Unadjusted Adjusted for School Factors Adjusted for School and Student Factors
� p(�=0) � p(�=0) � p(�=0)
Intercept 9.0 0.0034 8.6 0.0022 17.6 0.0001
Rubric Level 4 12.5 0.0094 11.5 0.0175 11.1 0.0198
Rubric Level 3 6.8 0.0044 6.6 0.0032 7.2 0.0012
Rubric Level 2 6.4 0.0056 6.2 0.0036 6.4 0.0028
Rubric Level 1 0.0 0.0 0.0
Time 11.8 0.0036 11.4 0.0031 11.7 0.0021
Time Squared -5.2 0.0126 -5.1 0.0133 -5.3 0.0096
Time x Rubric Level 4 -17.7 0.0039 -16.7 0.0064 -16.2 0.0071
Time x Rubric Level 3 -10.7 0.0100 -10.4 0.0087 -11.0 0.0052
Time x Rubric Level 2 -12.2 0.0029 -11.8 0.0025 -12.0 0.0020
Time x Rubric Level 1 0.0 0.0 0.0
Time Squared x Rubric Level 4 6.5 0.0061 6.3 0.0079 6.2 0.0078
Time Squared x Rubric Level 3 4.6 0.0283 4.5 0.0290 4.7 0.0209
Time Squared x Rubric Level 2 5.4 0.0107 5.3 0.0115 5.4 0.0087
Time Squared x Rubric Level 1 0.0 0.0 0.0
Last score 0.7 0.0001 0.7 0.0001 0.6 0.0001
Least Square Means
Max Rubric Level 4 51.1 51.2 50.9
Max Rubric Level 3 49.3 49.6 49.7
Max Rubric Level 2 49.1 49.5 49.5
Max Rubric Level 1 42.6 43.1 42.7
Difference p (difference>0) Difference p (difference>0) Difference p (difference>0)
Difference Rubric Level 4 - Level 3 1.8 0.1711 1.5 0.2475 1.2 0.3681
Difference Rubric Level 4 - Level 2 1.9 0.1497 1.6 0.2275 1.4 0.3106
Difference Rubric Level 4 - Level 1 8.5 0.0134 8.1 0.0169 8.1 0.0151
Difference Rubric Level 3 - Level 2 0.1 0.7440 0.1 0.7982 0.2 0.6376
Difference Rubric Level 3 - Level 1 6.7 0.0357 6.6 0.0360 6.9 0.0243
Difference Rubric Level 2 - Level 1 6.5 0.0388 6.5 0.0384 6.8 0.0278
Number of Observations 8554 8554 8554
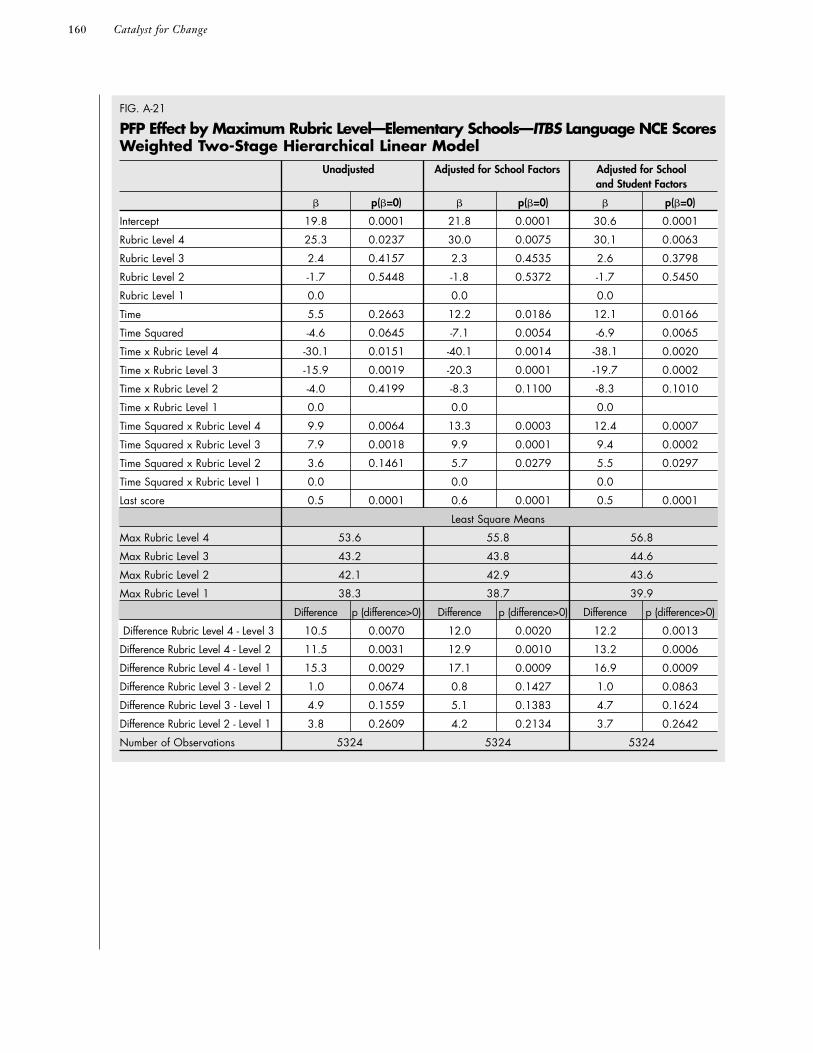
160 Catalyst for Change
FIG. A-21
PFP Effect by Maximum Rubric Level—Elementary Schools—ITBS Language NCE Scores Weighted Two-Stage Hierarchical Linear Model
Unadjusted Adjusted for School Factors Adjusted for School and Student Factors
� p(�=0) � p(�=0) � p(�=0)
Intercept 19.8 0.0001 21.8 0.0001 30.6 0.0001
Rubric Level 4 25.3 0.0237 30.0 0.0075 30.1 0.0063
Rubric Level 3 2.4 0.4157 2.3 0.4535 2.6 0.3798
Rubric Level 2 -1.7 0.5448 -1.8 0.5372 -1.7 0.5450
Rubric Level 1 0.0 0.0 0.0
Time 5.5 0.2663 12.2 0.0186 12.1 0.0166
Time Squared -4.6 0.0645 -7.1 0.0054 -6.9 0.0065
Time x Rubric Level 4 -30.1 0.0151 -40.1 0.0014 -38.1 0.0020
Time x Rubric Level 3 -15.9 0.0019 -20.3 0.0001 -19.7 0.0002
Time x Rubric Level 2 -4.0 0.4199 -8.3 0.1100 -8.3 0.1010
Time x Rubric Level 1 0.0 0.0 0.0
Time Squared x Rubric Level 4 9.9 0.0064 13.3 0.0003 12.4 0.0007
Time Squared x Rubric Level 3 7.9 0.0018 9.9 0.0001 9.4 0.0002
Time Squared x Rubric Level 2 3.6 0.1461 5.7 0.0279 5.5 0.0297
Time Squared x Rubric Level 1 0.0 0.0 0.0
Last score 0.5 0.0001 0.6 0.0001 0.5 0.0001
Least Square Means
Max Rubric Level 4 53.6 55.8 56.8
Max Rubric Level 3 43.2 43.8 44.6
Max Rubric Level 2 42.1 42.9 43.6
Max Rubric Level 1 38.3 38.7 39.9
Difference p (difference>0) Difference p (difference>0) Difference p (difference>0)
Difference Rubric Level 4 - Level 3 10.5 0.0070 12.0 0.0020 12.2 0.0013
Difference Rubric Level 4 - Level 2 11.5 0.0031 12.9 0.0010 13.2 0.0006
Difference Rubric Level 4 - Level 1 15.3 0.0029 17.1 0.0009 16.9 0.0009
Difference Rubric Level 3 - Level 2 1.0 0.0674 0.8 0.1427 1.0 0.0863
Difference Rubric Level 3 - Level 1 4.9 0.1559 5.1 0.1383 4.7 0.1624
Difference Rubric Level 2 - Level 1 3.8 0.2609 4.2 0.2134 3.7 0.2642
Number of Observations 5324 5324 5324

161Appendix
FIG. A-22
PFP Effect by Maximum Rubric Level—Elementary Schools—ITBS Math NCE Scores Weighted Two-Stage Hierarchical Linear Model
Unadjusted Adjusted for School Factors Adjusted for School and Student Factors
� p(�=0) � p(�=0) � p(�=0)
Intercept 11.0 0.0031 10.1 0.0053 17.6 0.0001
Rubric Level 4 -18.2 0.0071 -18.4 0.0069 -18.7 0.0049
Rubric Level 3 8.9 0.0022 8.4 0.0045 7.6 0.0087
Rubric Level 2 8.7 0.0018 8.6 0.0021 7.9 0.0041
Rubric Level 1 0.0 0.0 0.0
Time 18.3 0.0001 16.1 0.0009 15.0 0.0016
Time Squared -9.2 0.0001 -7.9 0.001 -7.3 0.0020
Time x Rubric Level 4 3.6 0.6483 6.5 0.4127 7.1 0.3627
Time x Rubric Level 3 -18.7 0.0002 -15.3 0.0023 -14.4 0.0037
Time x Rubric Level 2 -20.2 0.0001 -17.4 0.0004 -16.1 0.0008
Time x Rubric Level 1 0.0 0.0 0.0
Time Squared x Rubric Level 4 4.9 0.0782 3.5 0.2193 2.9 0.2901
Time Squared x Rubric Level 3 9.0 0.0002 7.5 0.0023 6.9 0.0042
Time Squared x Rubric Level 2 9.6 0.0001 8.2 0.0008 7.5 0.0017
Time Squared x Rubric Level 1 0.0 0.0 0.0
Last score 0.6 0.0001 0.6 0.0001 0.5 0.0001
Least Square Means
Max Rubric Level 4 39.4 40.2 39.7
Max Rubric Level 3 46.8 47.6 47.1
Max Rubric Level 2 46.4 47.3 47.0
Max Rubric Level 1 34.4 36.0 36.9
Difference p (difference>0) Difference p (difference>0) Difference p (difference>0)
Difference Rubric Level 4 - Level 3 -7.4 0.0001 -7.4 0.0001 -7.4 0.0001
Difference Rubric Level 4 - Level 2 -7.0 0.0001 -7.1 0.0001 -7.3 0.0001
Difference Rubric Level 4 - Level 1 5.0 0.2412 4.2 0.3275 2.8 0.5117
Difference Rubric Level 3 - Level 2 0.5 0.3325 0.3 0.5500 0.1 0.8213
Difference Rubric Level 3 - Level 1 12.4 0.0015 11.6 0.0032 10.2 0.0083
Difference Rubric Level 2 - Level 1 12.0 0.0022 11.3 0.0039 10.1 0.0088
Number of Observations 6825 6825 6825

162 Catalyst for Change
FIG. A-23
PFP Effect by Maximum Rubric Level—Elementary Schools—CSAP Reading NCE Scores Weighted Two-Stage Hierarchical Linear Model
Unadjusted Adjusted for School Factors Adjusted for School and Student Factors
� p(�=0) � p(�=0) � p(�=0)
Intercept 22.5 0.0001 21.9 0.0001 31.5 0.0001
Rubric Level 4 -16.6 0.0020 -14.7 0.0054 -15.3 0.0028
Rubric Level 3 -7.3 0.0154 -7.0 0.0184 -7.2 0.0122
Rubric Level 2 -9.2 0.0014 -8.8 0.0020 -9.2 0.0009
Rubric Level 1 0.0 0.0 0.0
Time -10.4 0.0001 -9.9 0.0002 -10.3 0.0001
Time Squared 0.4 0.1653 0.3 0.1867 0.3 0.2792
Time x Rubric Level 4 19.8 0.0005 17.3 0.0019 18.1 0.0009
Time x Rubric Level 3 6.3 0.0283 5.9 0.0400 6.2 0.0245
Time x Rubric Level 2 8.5 0.0009 8.0 0.0014 8.5 0.0005
Time x Rubric Level 1 0.0 0.0 0.0
Time Squared x Rubric Level 4 -2.9 0.0187 -2.3 0.0526 -2.5 0.0368
Time Squared x Rubric Level 3 0.6 0.1177 0.7 0.0869 0.7 0.0911
Time Squared x Rubric Level 2 0.0 0.0 0.0
Time Squared x Rubric Level 1 0.0 0.0 0.0
Last score 0.8 0.0001 0.8 0.0001 0.7 0.0001
Least Square Means
Max Rubric Level 4 54.8 55.3 54.6
Max Rubric Level 3 55.1 55.3 54.8
Max Rubric Level 2 54.3 54.6 54.2
Max Rubric Level 1
Difference p (difference>0) Difference p (difference>0) Difference p (difference>0)
Difference Rubric Level 4 - Level 3 -0.3 0.7850 -0.1 0.9256 -0.2 0.8320
Difference Rubric Level 4 - Level 2 0.5 0.5676 0.7 0.4569 0.4 0.6128
Difference Rubric Level 3 - Level 2 0.8 0.0445 0.8 0.0489 0.6 0.0913
Number of Observations 4556 4556 4556

163Appendix
FIG.A-24
PFP Effect by Maximum Rubric Level—Elementary Schools—CSAP Writing NCE Scores Weighted Two-Stage Hierarchical Linear Model
Unadjusted Adjusted for School Factors Adjusted for School and Student Factors
� p(�=0) � p(�=0) � p(�=0)
Intercept 56.6 0.0001 54.9 0.0001 70.6 0.0001
Rubric Level 4 -18.4 0.0597 -17.2 0.0792 -10.6 0.2097
Rubric Level 3 -1.7 0.7539 -1.5 0.7853 -0.8 0.8726
Rubric Level 2 -5.9 0.2699 -4.9 0.3557 -4.3 0.3524
Rubric Level 1 0.0 0.0 0.0
Time -3.1 0.5122 -2.5 0.5949 -2.2 0.5830
Time Squared -0.6 0.1747 -0.7 0.0995 -0.4 0.2672
Time x Rubric Level 4 21.3 0.0231 19.7 0.0349 14.5 0.0723
Time x Rubric Level 3 0.2 0.9648 -0.005 0.9992 0.1 0.9765
Time x Rubric Level 2 5.0 0.2655 4.7 0.2987 3.6 0.3491
Time x Rubric Level 1 0.0 0.0 0.0
Time Squared x Rubric Level 4 -3.9 0.0421 -3.4 0.0695 -3.0 0.0677
Time Squared x Rubric Level 3 1.2 0.0812 1.3 0.0604 0.7 0.2256
Time Squared x Rubric Level 2 0.0 0.0 0.0
Time Squared x Rubric Level 1 0.0 0.0 0.0
Least Square Means
Max Rubric Level 4 52.2 52.9 52.4
Max Rubric Level 3 52.1 52.7 52.0
Max Rubric Level 2 51.6 52.3 51.9
Max Rubric Level 1
Difference p (difference>0) Difference p (difference>0) Difference p (difference>0)
Difference Rubric Level 4 - Level 3 0.1 0.9241 0.2 0.8667 0.4 0.7143
Difference Rubric Level 4 - Level 2 0.6 0.6769 0.6 0.6524 0.5 0.6633
Difference Rubric Level 3 - Level 2 0.5 0.4657 0.4 0.5261 0.1 0.8634
Number of Observations 5597 5597 5597

164 Catalyst for Change
FIG. A-25
PFP Effect by Maximum Rubric Level—Elementary Schools—CSAP Math NCE Scores Weighted Two-Stage Hierarchical Linear Model
Unadjusted Adjusted for School Factors Adjusted for School and Student Factors
� p(�=0) � p(�=0) � p(�=0)
Intercept 56.4 0.0001 53.4 0.0001 65.4 0.0001
Rubric Level 4 -2.4 0.8360 -3.8 0.7500 3.4 0.7418
Rubric Level 3 -5.5 0.4325 -7.2 0.3120 -4.8 0.4369
Rubric Level 2 0.2 0.9210 -0.4 0.8766 1.0 0.6205
Rubric Level 1 0.0 0.0 0.0
Time -0.9 0.8739 1.5 0.7797 2.4 0.6143
Time Squared -0.3 0.8242 -1.0 0.4827 -1.4 0.2727
Time x Rubric Level 4 7.0 0.6079 6.1 0.6511 -0.8 0.9433
Time x Rubric Level 3 5.6 0.5071 6.0 0.4812 4.8 0.5143
Time x Rubric Level 2 0.0 0.0 0.0
Time x Rubric Level 1 0.0 0.0 0.0
Time Squared x Rubric Level 4 -1.5 0.6519 -1.0 0.7726 0.7 0.8027
Time Squared x Rubric Level 3 -1.1 0.6018 -0.9 0.6611 -0.7 0.6995
Time Squared x Rubric Level 2 0.0 0.0 0.0
Time Squared x Rubric Level 1 0.0 0.0 0.0
Least Square Means
Max Rubric Level 4 57.7 58.4 56.5
Max Rubric Level 3 53.7 54.7 52.9
Max Rubric Level 2 53.4 54.0 52.5
Max Rubric Level 1
Difference p (difference>0) Difference p (difference>0) Difference p (difference>0)
Difference Rubric Level 4 - Level 3 4.0 0.0212 3.7 0.0326 3.6 0.0157
Difference Rubric Level 4 - Level 1 4.3 0.0222 4.4 0.0182 4.0 0.0118
Difference Rubric Level 2 - Level 1 0.3 0.8002 0.7 0.5322 0.4 0.6500
Number of Observations 2127 2127 2127

165Appendix
FIG. A-26
PFP Effect by Maximum Rubric Level—Middle Schools—ITBS Reading NCE Scores Weighted Two-Stage Hierarchical Linear Model
Unadjusted Adjusted for School Factors Adjusted for School and Student Factors
� p(�=0) � p(�=0) � p(�=0)
Intercept 16.1 0.1014 13.0 0.1830 16.8 0.9204
Rubric Level 4 -5.4 0.0872 -5.3 0.1044 -4.1 0.2104
Rubric Level 3 -2.5 0.3520 -2.3 0.3844 -2.4 0.3776
Rubric Level 2 -1.4 0.6007 -1.3 0.6326 -1.0 0.7011
Rubric Level 1 0.0 0.0 0.0
Time -0.6 0.2964 -1.1 0.1133 -0.8 0.9782
Time x Rubric Level 4 1.8 0.1920 1.8 0.2163 1.2 0.3844
Time x Rubric Level 3 -0.2 0.7988 -0.3 0.7058 -0.1 0.9253
Time x Rubric Level 2 0.0 0.0 0.0
Time x Rubric Level 1 0.0 0.0 0.0
Last score 0.6 0.0001 0.6 0.0001 0.6 0.0001
Least Square Means
Max Rubric Level 4 33.1 33.2 33.3
Max Rubric Level 3 33.6 33.6 33.4
Max Rubric Level 2 35.0 35.0 34.9
Max Rubric Level 1
Difference p (difference>0) Difference p (difference>0) Difference p (difference>0)
Difference Rubric Level 4 - Level 3 -0.5 0.5553 -0.4 0.6377 -0.1 0.9036
Difference Rubric Level 4 - Level 2 -1.8 0.0221 -1.8 0.0226 -1.6 0.0590
Difference Rubric Level 3 - Level 2 -1.4 0.0182 -1.5 0.0141 -1.5 0.0159
Number of Observations 1789 1789 1789

166 Catalyst for Change
FIG. A-27
PFP Effect by Maximum Rubric Level—Middle Schools—ITBS Language NCE ScoresWeighted Two-Stage Hierarchical Linear Model
Unadjusted Adjusted for School Factors Adjusted for School and Student Factors
� p(�=0) � p(�=0) � p(�=0)
Intercept 18.6 0.0995 -6.2 0.7948 22.8 0.0155
Rubric Level 4 -1.2 0.7376 -1.6 0.6658 0.4 0.9092
Rubric Level 3 -1.0 0.7421 -0.9 0.7655 0.3 0.9233
Rubric Level 2 1.0 0.7341 1.0 0.7381 1.8 0.5338
Rubric Level 1 0.0 0.0 0.0
Time -2.9 0.0001 -0.1 0.9615 3.3 0.0024
Time x Rubric Level 4 1.5 0.3513 1.8 0.2663 1.2 0.4502
Time x Rubric Level 3 0.7 0.4825 0.5 0.6012 0.8 0.3743
Time x Rubric Level 2 0.0 0.0 0.0
Time x Rubric Level 1 0.0 0.0 0.0
Last score 0.6 0.0001 0.6 0.0001 0.5 0.0001
Least Square Means
Max Rubric Level 4 40.3 40.0 42.2
Max Rubric Level 3 39.5 39.0 41.6
Max Rubric Level 2 40.6 40.3 42.1
Max Rubric Level 1
Difference p (difference>0) Difference p (difference>0) Difference p (difference>0)
Difference Rubric Level 4 - Level 3 0.8 0.3586 1.0 0.2894 0.6 0.5085
Difference Rubric Level 4 - Level 2 -0.4 0.7111 -0.3 0.7473 0.1 0.9309
Difference Rubric Level 3 - Level 2 -1.2 0.1039 -1.3 0.0802 -0.5 0.4907
Number of Observations 1433 1433 1433

167Appendix
FIG. A-28
PFP Effect by Maximum Rubric Level—Middle Schools—ITBS Math NCE Scores Weighted Two-Stage Hierarchical Linear Model
Unadjusted Adjusted for School Factors Adjusted for School and Student Factors
� p(�=0) � p(�=0) � p(�=0)
Intercept 19.2 0.0857 28.1 0.1027 33.9 0.0163
Rubric Level 4 6.4 0.1322 0.2 0.9574 2.7 0.5423
Rubric Level 3 -4.4 0.0834 -3.8 0.1253 -5.2 0.0396
Rubric Level 2 -2.5 0.3043 -2.0 0.4039 -2.6 0.2866
Rubric Level 1 0.0 0.0 0.0
Time 0.2 0.8291 -18.9 0.0001 -1.5 0.4251
Time x Rubric Level 4 -4.4 0.0515 1.5 0.5592 -1.9 0.4455
Time x Rubric Level 3 2.6 0.0580 3.4 0.0129 3.9 0.0054
Time x Rubric Level 2 0.0 0.0 0.0
Time x Rubric Level 1 0.0 0.0 0.0
Last score 0.5 0.0001 0.5 0.0001 0.5 0.0001
Least Square Means
Max Rubric Level 4 39.2 36.3 38.3
Max Rubric Level 3 35.1 34.3 35.9
Max Rubric Level 2 34.5 32.8 34.8
Max Rubric Level 1
Difference p (difference>0) Difference p (difference>0) Difference p (difference>0)
Difference Rubric Level 4 - Level 3 4.1 0.0242 1.8 0.3420 2.4 0.1918
Difference Rubric Level 4 - Level 2 4.7 0.0073 3.2 0.0714 3.5 0.0481
Difference Rubric Level 3 - Level 2 0.6 0.4907 1.4 0.1098 1.1 0.2273
Number of Observations 989 989 989

168 Catalyst for Change
FIG. A-29
PFP Effect by Maximum Rubric Level—Middle Schools—CSAP Reading NCE ScoresWeighted Two-Stage Hierarchical Linear Model
Unadjusted Adjusted for School Factors Adjusted for School and Student Factors
� p(�=0) � p(�=0) � p(�=0)
Intercept 5.9 0.2367 -5.5 0.3119 0.7 0.8655
Rubric Level 4 0.6 0.8153 1.3 0.6088 2.8 0.2535
Rubric Level 3 2.4 0.2217 2.6 0.1966 2.8 0.1474
Rubric Level 2 0.9 0.6580 1.1 0.5859 1.5 0.4435
Rubric Level 1 0.0 0.0 0.0
Time 2.5 0.0001 -0.2 0.6899 -0.5 0.2928
Time x Rubric Level 4 -0.1 0.8932 -0.5 0.6576 -0.8 0.4799
Time x Rubric Level 3 -1.8 0.0040 -1.7 0.0075 -1.2 0.0523
Time x Rubric Level 2 0.0 0.0 0.0
Time x Rubric Level 1 0.0 0.0 0.0
Last score 0.8 0.0001 0.8 0.0001 0.7 0.0001
Least Square Means
Max Rubric Level 4 43.6 43.8 44.0
Max Rubric Level 3 43.5 43.6 43.5
Max Rubric Level 2 44.1 44.2 43.6
Max Rubric Level 1
Difference p (difference>0) Difference p (difference>0) Difference p (difference>0)
Difference Rubric Level 4 - Level 3 0.1 0.8232 0.1 0.8225 0.5 0.4541
Difference Rubric Level 4 - Level 2 -0.5 0.4551 -0.4 0.5298 0.4 0.5668
Difference Rubric Level 3 - Level 2 -0.6 0.1749 -0.5 0.2371 -0.1 0.8186
Number of Observations 2238 2238 2238

169Appendix
FIG. A-30
PFP Effect by Maximum Rubric Level—Middle Schools—CSAP Writing NCE ScoresWeighted Two-Stage Hierarchical Linear Model
Unadjusted Adjusted for School Factors Adjusted for School and Student Factors
� p(�=0) � p(�=0) � p(�=0)
Intercept 41.2 0.0700 33.5 0.3486 44.8 0.0001
Rubric Level 4 -6.7 0.1914 -6.8 0.1840 6.2 0.1593
Rubric Level 3 2.2 0.6298 2.3 0.6234 8.1 0.0439
Rubric Level 2 1.0 0.8321 0.9 0.8427 3.9 0.3286
Rubric Level 1 0.0 0.0 0.0
Time 1.4 0.1184 2.4 0.527 1.1 0.3960
Time x Rubric Level 4 0.9 0.6198 1.0 0.5935 -2.3 0.1423
Time x Rubric Level 3 -2.6 0.0442 -2.7 0.387 -2.5 0.0233
Time x Rubric Level 2 0.0 0.0 0.0
Time x Rubric Level 1 0.0 0.0 0.0
Least Square Means
Max Rubric Level 4 37.8 37.8 42.8
Max Rubric Level 3 41.9 41.9 44.4
Max Rubric Level 2 44.2 44.2 43.7
Max Rubric Level 1
Difference p (difference>0) Difference p (difference>0) Difference p (difference>0)
Difference Rubric Level 4 - Level 3 -4.1 0.0001 -4.0 0.0001 -1.6 0.0622
Difference Rubric Level 4 - Level 1 -6.4 0.0001 -6.4 0.0001 -0.9 0.3082
Difference Rubric Level 3 - Level 2 -2.3 0.0056 -2.4 0.0047 -0.7 0.3389
Number of Observations 2263 2263 2263

170 Catalyst for Change
FIG. A-31
PFP Effect by Maximum Rubric Level—Middle Schools—CSAP Math NCE ScoresWeighted Two-Stage Hierarchical Linear Model
Unadjusted Adjusted for School Factors Adjusted for School and Student Factors
� p(�=0) � p(�=0) � p(�=0)
Intercept 42.9 0.0278 43.1 0.0217 55.4 0.0001
Rubric Level 4 3.4 0.2921 0.8 0.8256 5.2 0.1213
Rubric Level 3 -1.7 0.2268 -1.6 0.1937 -0.8 0.5471
Rubric Level 2 0.0 0.0 0.0
Time 2.3 0.0220 0.8 0.2481 0.02 0.9836
Time x Rubric Level 4 0.3 0.9071 2.3 0.2693 -0.3 0.8883
Time x Rubric Level 3 0.1 0.9272 0.3 0.7464 0.3 0.8306
Time x Rubric Level 2 0.0 0.0 0.0
Least Square Means
Max Rubric Level 4 48.6 47.8 53.1
Max Rubric Level 3 43.4 43.6 47.6
Max Rubric Level 2 44.9 44.9 48.1
Difference p (difference>0) Difference p (difference>0) Difference p (difference>0)
Difference Rubric Level 4 - Level 3 5.2 0.0031 4.2 0.0249 5.4 0.0012
Difference Rubric Level 4 - Level 2 3.7 0.0282 2.9 0.1024 4.9 0.0019
Difference Rubric Level 3 - Level 2 -1.5 0.1038 -1.4 0.1570 -0.5 0.5543
Number of Observations 1693 1693 1693
FIG. A-32
PFP Effect by Maximum Rubric Level—Manual High School—ITBS Reading NCE ScoreWeighted Least Squares Linear Regression Model
Unadjusted Adjusted for Student Factors
� p(�=0) � p(�=0)
Intercept 21.6 0.0001 29.3 0.0001
Rubric Level 4 -0.1 0.9819 -1.7 0.7443
Rubric Level 3 -4.9 0.3329 -5.5 0.2755
Rubric Level 2 -4.6 0.3709 -3.9 0.4503
Rubric Level 1 0.0 0.0
Time -5.4 0.0038 -5.7 0.0021
Time x Rubric Level 4 1.9 0.5025 2.2 0.4312
Time x Rubric Level 3 4.7 0.0626 4.7 0.0597
Time x Rubric Level 2 0.0 0.0
Time x Rubric Level 1 0.0 0.0
Last score 0.6 0.0001 0.5 0.0001
Least Square Means
Max Rubric Level 4 40.6 40.2
Max Rubric Level 3 37.2 37.6
Max Rubric Level 2 35.2 37.0
Difference p (difference>0) Difference p (difference>0)
Difference Rubric Level 4 - Level 3 3.5 0.0104 2.6 0.0536
Difference Rubric Level 4 - Level 2 5.4 0.0002 3.2 0.0277
Difference Rubric Level 3 - Level 2 1.9 0.1241 0.6 0.6341
Number of Observations 675 672
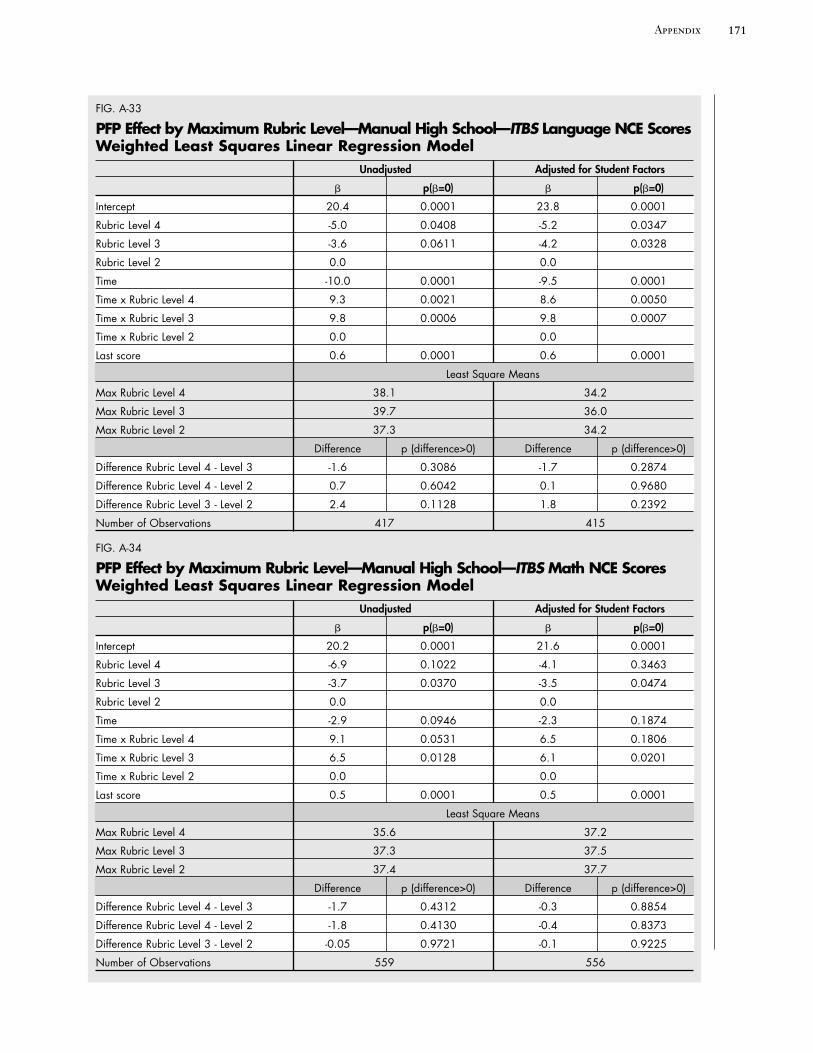
171Appendix
FIG. A-33
PFP Effect by Maximum Rubric Level—Manual High School—ITBS Language NCE ScoresWeighted Least Squares Linear Regression Model
Unadjusted Adjusted for Student Factors
� p(�=0) � p(�=0)
Intercept 20.4 0.0001 23.8 0.0001
Rubric Level 4 -5.0 0.0408 -5.2 0.0347
Rubric Level 3 -3.6 0.0611 -4.2 0.0328
Rubric Level 2 0.0 0.0
Time -10.0 0.0001 -9.5 0.0001
Time x Rubric Level 4 9.3 0.0021 8.6 0.0050
Time x Rubric Level 3 9.8 0.0006 9.8 0.0007
Time x Rubric Level 2 0.0 0.0
Last score 0.6 0.0001 0.6 0.0001
Least Square Means
Max Rubric Level 4 38.1 34.2
Max Rubric Level 3 39.7 36.0
Max Rubric Level 2 37.3 34.2
Difference p (difference>0) Difference p (difference>0)
Difference Rubric Level 4 - Level 3 -1.6 0.3086 -1.7 0.2874
Difference Rubric Level 4 - Level 2 0.7 0.6042 0.1 0.9680
Difference Rubric Level 3 - Level 2 2.4 0.1128 1.8 0.2392
Number of Observations 417 415
FIG. A-34
PFP Effect by Maximum Rubric Level—Manual High School—ITBS Math NCE ScoresWeighted Least Squares Linear Regression Model
Unadjusted Adjusted for Student Factors
� p(�=0) � p(�=0)
Intercept 20.2 0.0001 21.6 0.0001
Rubric Level 4 -6.9 0.1022 -4.1 0.3463
Rubric Level 3 -3.7 0.0370 -3.5 0.0474
Rubric Level 2 0.0 0.0
Time -2.9 0.0946 -2.3 0.1874
Time x Rubric Level 4 9.1 0.0531 6.5 0.1806
Time x Rubric Level 3 6.5 0.0128 6.1 0.0201
Time x Rubric Level 2 0.0 0.0
Last score 0.5 0.0001 0.5 0.0001
Least Square Means
Max Rubric Level 4 35.6 37.2
Max Rubric Level 3 37.3 37.5
Max Rubric Level 2 37.4 37.7
Difference p (difference>0) Difference p (difference>0)
Difference Rubric Level 4 - Level 3 -1.7 0.4312 -0.3 0.8854
Difference Rubric Level 4 - Level 2 -1.8 0.4130 -0.4 0.8373
Difference Rubric Level 3 - Level 2 -0.05 0.9721 -0.1 0.9225
Number of Observations 559 556

172 Catalyst for Change
FIG. A-35
PFP Effect by Maximum Rubric Level—Manual High School—CSAP Reading NCE ScoresWeighted Least Squares Linear Regression Model
Unadjusted Adjusted for Student Factors
� p(�=0) � p(�=0)
Intercept 8.6 0.0001 10.7 0.0001
Rubric Level 4 3.2 0.0381 2.3 0.1288
Rubric Level 3 1.8 0.1006 1.2 0.2686
Rubric Level 2 0.0 0.0
Time 3.2 0.0066 3.4 0.0034
Time x Rubric Level 4 -2.0 0.2926 -1.8 0.3387
Time x Rubric Level 3 -2.4 0.1400 -1.9 0.2556
Time x Rubric Level 2 0.0 0.0
Last score 0.8 0.0001 0.7 0.0001
Least Square Means
Max Rubric Level 4 42.7 43.2
Max Rubric Level 3 41.2 42.1
Max Rubric Level 2 40.5 41.8
Difference p (difference>0) Difference p (difference>0)
Difference Rubric Level 4 - Level 3 1.6 0.1048 1.1 0.2455
Difference Rubric Level 4 - Level 2 2.2 0.0239 1.4 0.1420
Difference Rubric Level 3 - Level 2 0.6 0.4492 0.3 0.7069
Number of Observations 688 685
FIG. A-36
PFP Effect by Maximum Rubric Level—Manual High School—CSAP Writing NCE ScoresWeighted Least Squares Linear Regression Model
Unadjusted Adjusted for Student Factors
� p(�=0) � p(�=0)
Intercept 5.5 0.1216 7.5 0.0661
Rubric Level 4 12.8 0.0961 11.2 0.1391
Rubric Level 3 0.7 0.9023 1.8 0.7469
Rubric Level 2 0.0 0.0
Time 4.7 0.1845 6.3 0.0700
Time x Rubric Level 4 -9.8 0.2085 -8.7 0.2598
Time x Rubric Level 3 -2.8 0.6286 -3.9 0.5043
Time x Rubric Level 2 0.0 0.0
Last score 0.7 0.0001 0.6 0.0001
Least Square Means
Max Rubric Level 4 42.0 38.6
Max Rubric Level 3 36.6 33.9
Max Rubric Level 2 38.6 35.8
Difference p (difference>0) Difference p (difference>0)
Difference Rubric Level 4 - Level 3 5.4 0.0002 4.7 0.0009
Difference Rubric Level 4 - Level 2 3.3 0.0049 2.8 0.0166
Difference Rubric Level 3 - Level 2 -2.0 0.0987 -1.9 0.1192
Number of Observations 334 331

173Appendix
FIG. A-37
PFP Effect by Maximum Rubric Level—Manual High School—CSAP Math NCE ScoresWeighted Least Squares Linear Regression Model
Unadjusted Adjusted for Student Factors
� p(�=0) � p(�=0)
Intercept 15.9 0.0001 17.7 0.0001
Rubric Level 4 -7.9 0.0154 -5.2 0.1233
Rubric Level 3 1.2 0.4143 1.6 0.2912
Rubric Level 2 0.0 0.0
Time -3.4 0.0097 -2.7 0.0450
Time x Rubric Level 4 7.3 0.0407 4.8 0.1893
Time x Rubric Level 3 1.3 0.5159 0.3 0.8658
Time x Rubric Level 2 0.0 0.0
Last score 0.7 0.0001 0.7 0.0001
Least Square Means
Max Rubric Level 4 37.8 33.8
Max Rubric Level 3 43.0 37.7
Max Rubric Level 2 41.0 35.9
Difference p (difference>0) Difference p (difference>0)
Difference Rubric Level 4 - Level 3 -5.2 0.0005 -3.9 0.0125
Difference Rubric Level 4 - Level 2 -3.2 0.0282 -2.1 0.1616
Difference Rubric Level 3 - Level 2 2.0 0.0391 1.8 0.0656
Number of Observations 493 491
FIG. A-38
PFP Effect by Maximum Rubric Level—Jefferson High School—ITBS Reading NCE ScoresWeighted Least Squares Linear Regression Model
Unadjusted Adjusted for Student Factors
� p(�=0) � p(�=0)
Intercept 15.3 0.0001 19.4 0.0001
Rubric Level 4 -6.8 0.0093 -6.4 0.0149
Rubric Level 3 -2.6 0.2383 -2.1 0.3285
Rubric Level 2 -5.1 0.0203 -4.8 0.0281
Rubric Level 1 0.0 0.0
Time -0.3 0.9174 -0.4 0.8902
Time x Rubric Level 4 3.1 0.3229 3.0 0.3338
Time x Rubric Level 3 -2.1 0.4352 -2.1 0.4452
Time x Rubric Level 2 0.0 0.0
Time x Rubric Level 1 0.0 0.0
Last score 0.8 0.0001 0.7 0.0001
Least Square Means
Max Rubric Level 4 54.7 55.7
Max Rubric Level 3 56.3 57.4
Max Rubric Level 2 54.9 55.7
Difference p (difference>0) Difference p (difference>0)
Difference Rubric Level 4 - Level 3 -1.6 0.1160 -1.7 0.0956
Difference Rubric Level 4 - Level 2 -0.2 0.9217 -0.1 0.9685
Difference Rubric Level 3 - Level 2 1.4 0.2908 1.6 0.2352
Number of Observations 1136 1136

174 Catalyst for Change
FIG. A-39
PFP Effect by Maximum Rubric Level—Jefferson High School—ITBS Math NCE ScoresWeighted Least Squares Linear Regression Model
Unadjusted Adjusted for Student Factors
� p(�=0) � p(�=0)
Intercept 11.1 0.0001 16.2 0.0001
Rubric Level 4 -9.4 0.0787 -5.9 0.2754
Rubric Level 3 0.8 0.9312 4.5 0.6190
Rubric Level 2 0.0 0.0
Time 2.1 0.2033 1.9 0.2428
Time x Rubric Level 4 8.1 0.1439 5.0 0.3724
Time x Rubric Level 3 -4.4 0.6324 -7.8 0.3929
Time x Rubric Level 2 0.0 0.0
Last score 0.8 0.0001 0.7 0.0001
Least Square Means
Max Rubric Level 4 52.5 54.3
Max Rubric Level 3 53.9 55.7
Max Rubric Level 2 56.2 56.7
Difference p (difference>0) Difference p (difference>0)
Difference Rubric Level 4 - Level 3 -1.4 0.6722 -1.4 0.6649
Difference Rubric Level 4 - Level 2 -3.7 0.0612 -2.4 0.2298
Difference Rubric Level 3 - Level 2 -2.3 0.4383 -1.0 0.7389
Number of Observations 807 807
FIG. A-40
PFP Effect by Maximum Rubric Level—Jefferson High School—CSAP Reading NCE ScoresWeighted Least Squares Linear Regression Model
Unadjusted Adjusted for Student Factors
� p(�=0) � p(�=0)
Intercept 8.3 0.0001 13.6 0.0001
Rubric Level 4 2.0 0.1580 2.3 0.1050
Rubric Level 3 2.1 0.0136 2.1 0.0171
Rubric Level 2 0.0 0.0
Time 3.4 0.0834 3.4 0.0772
Time x Rubric Level 4 -2.9 0.2234 -3.2 0.1758
Time x Rubric Level 3 -5.0 0.0203 -4.8 0.0238
Time x Rubric Level 2 0.0 0.0
Last score 0.8 0.0001 0.7 0.0001
Least Square Means
Max Rubric Level 4 59.5 57.8
Max Rubric Level 3 58.6 56.9
Max Rubric Level 2 59.0 57.2
Difference p (difference>0) Difference p (difference>0)
Difference Rubric Level 4 - Level 3 0.9 0.2727 1.0 0.2126
Difference Rubric Level 4 - Level 2 0.5 0.6561 0.7 0.5698
Difference Rubric Level 3 - Level 2 -0.3 0.7462 -0.3 0.7687
Number of Observations 920 920

175Appendix
FIG. A-41
PFP Effect by Maximum Rubric Level—Jefferson High School—CSAP Writing NCE ScoresWeighted Least Squares Linear Regression Model
Unadjusted Adjusted for Student Factors
� p(�=0) � p(�=0)
Intercept 19.2 0.0001 25.7 0.0001
Rubric Level 4 -8.0 0.4732 -4.0 0.7222
Rubric Level 3 -6.4 0.2608 -5.8 0.3057
Rubric Level 2 0.0 0.0
Time -7.3 0.1418 -7.1 0.1556
Time x Rubric Level 4 10.7 0.3505 6.5 0.5653
Time x Rubric Level 3 6.2 0.3124 5.7 0.3522
Time x Rubric Level 2 0.0 0.0
Last score 0.8 0.0001 0.7 0.0001
Least Square Means
Max Rubric Level 4 60.2 58.2
Max Rubric Level 3 57.5 55.5
Max Rubric Level 2 57.9 55.8
Difference p (difference>0) Difference p (difference>0)
Difference Rubric Level 4 - Rubric Level 3 2.7 0.0091 2.7 0.0093
Difference Rubric Level 4 - Rubric Level 2 2.3 0.3023 2.4 0.2864
Difference Rubric Level 3 - Rubric Level 2 -0.4 0.8661 -0.3 0.8995
Number of Observations 471 471
FIG. A-42
PFP Effect by Maximum Rubric Level—Jefferson High School—CSAP Math NCE ScoresWeighted Least Squares Regression Model
Unadjusted Adjusted for Student Factors
� p(�=0) � p(�=0)
Intercept 7.3 0.0001 9.9 0.0001
Rubric Level 4 0.1 0.9624 1.2 0.6894
Rubric Level 3 -10.5 0.2133 -5.7 0.5037
Rubric Level 2 0.0 0.0
Time -2.2 0.0527 -2.3 0.0460
Time x Rubric Level 4 1.1 0.7092 0.4 0.9104
Time x Rubric Level 3 10.2 0.2320 5.6 0.5137
Time x Rubric Level 2 0.0 0.0
Last score 0.9 0.0001 0.8 0.0001
Least Square Means
Max Rubric Level 4 60.4 60.8
Max Rubric Level 3 55.4 57.3
Max Rubric Level 2 59.5 59.4
Difference p (difference>0) Difference p (difference>0)
Difference Rubric Level 4 - Level 3 4.9 0.1373 3.6 0.2849
Difference Rubric Level 4 - Level 2 0.9 0.5088 1.4 0.2888
Difference Rubric Level 3 - Level 2 -4.1 0.2042 -2.2 0.5066
Number of Observations 706 706

176 Catalyst for Change
FIG. A-43
PFP Effect by Total Objectives Met—Elementary Schools—ITBS Reading NCE ScoresWeighted Two-Stage Hierarchical Linear Model
Unadjusted Adjusted for School Factors Adjusted for School and Student Factors
� p(�=0) � p(�=0) � p(�=0)
Intercept 11.7 0.0001 11.7 0.0001 20.6 0.0010
Objectives Met 2 4.1 0.0037 3.8 0.0054 4.0 0.0028
Objectives Met 1 2.2 0.1377 2.2 0.1449 1.9 0.1887
Objectives Met 0 0.0 0.0 0.0
Time 2.2 0.3579 3.0 0.2007 3.8 0.0998
Time Squared -0.3 0.7579 -0.5 0.5369 -0.7 0.3484
Time x Objectives Met 2 -1.8 0.4667 -2.0 0.3979 -2.6 0.2640
Time x Objectives Met 1 -0.6 0.8184 -0.9 0.7439 -1.0 0.6934
Time x Objectives Met 0 0.0 0.0 0.0
Time Squared x Objectives Met 2 0.01 0.9887 0.2 0.8532 0.3 0.6863
Time Squared x Objectives Met 1 -0.6 0.5293 -0.5 0.6110 -0.4 0.6759
Time Squared x Objectives Met 0 0.0 0.0 0.0
Last score 0.7 0.0001 0.7 0.0001 0.6 0.0001
Least Square Means
Objectives Met 2 49.1 49.6 49.5
Objectives Met 1 47.0 47.6 47.4
Objectives Met 0 47.5 48.1 48.1
Difference p (difference>0) Difference p (difference>0) Difference p (difference>0)
Difference Met 2 - Met 1 2.1 0.0001 2.0 0.0001 2.1 0.0001
Difference Met 2 - Met 0 1.6 0.0457 1.5 0.0699 1.4 0.0783
Difference Met 1 - Met 0 -0.4 0.6175 -0.5 0.5701 -0.7 0.4321
Number of Observations 8608 8608 8608

177Appendix
FIG. A-44
PFP Effect by Total Objectives Met—Elementary Schools—ITBS Language NCE ScoresWeighted Two-Stage Hierarchical Linear Model
Unadjusted Adjusted for School Factors Adjusted for School and Student Factors
� p(�=0) � p(�=0) � p(�=0)
Intercept 14.7 0.0001 14.8 0.0001 23.8 0.0001
Objectives Met 2 4.9 0.0042 4.6 0.0076 4.9 0.0037
Objectives Met 1 1.9 0.2932 1.7 0.3480 1.6 0.3660
Objectives Met 0 0.0 0.0 0.0
Time 1.8 0.5456 2.5 0.4164 3.2 0.2955
Time Squared -0.5 0.6353 -0.2 0.8290 -0.4 0.7097
Time x Objectives Met 2 -4.5 0.1426 -3.2 0.2967 -3.6 0.2401
Time x Objectives Met 1 -0.7 0.8254 0.9 0.7886 1.1 0.7251
Time x Objectives Met 0 0.0 0.0 0.0
Time Squared x Objectives Met 2 1.3 0.2163 0.6 0.5642 0.7 0.5299
Time Squared x Objectives Met 1 0.0 0.9998 -0.8 0.4670 -0.9 0.4049
Time Squared x Objectives Met 0 0.0 0.0 0.0
Last score 0.6 0.0001 0.6 0.0001 0.5 0.0001
Least Square Means
Objectives Met 2 43.4 44.8 45.5
Objectives Met 1 41.5 43.0 43.6
Objectives Met 0 40.5 42.6 43.2
Difference p (difference>0) Difference p (difference>0) Difference p (difference>0)
Difference Met 2 - Met 1 1.9 0.0011 1.8 0.0022 1.9 0.0012
Difference Met 2 - Met 0 2.9 0.0056 2.2 0.0352 2.2 0.0319
Difference Met 1 - Met 0 1.0 0.3816 0.4 0.7298 0.3 0.7734
Number of Observations 5412 5412 5412

178 Catalyst for Change
FIG. A-45
PFP Effect by Total Objectives Met—Elementary Schools—ITBS Math NCE ScoresWeighted Two-Stage Hierarchical Linear Model
Unadjusted Adjusted for School Factors Adjusted for School and Student Factors
� p(�=0) � p(�=0) � p(�=0)
Intercept 17.5 0.0001 16.1 0.0001 23.0 0.0001
Objectives Met 2 2.6 0.1204 2.6 0.1174 2.7 0.0977
Objectives Met 1 -1.8 0.2922 -1.8 0.2931 -2.2 0.2081
Objectives Met 0 0.0 0.0 0.0
Time 0.9 0.7487 1.0 0.7175 0.6 0.8260
Time Squared 0.1 0.9201 0.3 0.7745 0.3 0.7527
Time x Objectives Met 2 -3.0 0.2998 -2.1 0.4686 -1.7 0.5384
Time x Objectives Met 1 2.8 0.3703 3.4 0.2789 4.5 0.1391
Time x Objectives Met 0 0.0 0.0 0.0
Time Squared x Objectives Met 2 0.4 0.6536 0.03 0.9750 -0.02 0.9817
Time Squared x Objectives Met 1 -1.8 0.104 -2.0 0.0700 -2.3 0.0353
Time Squared x Objectives Met 0 0.0 0.0 0.0
Last score 0.6 0.0001 0.6 0.0001 0.5 0.0001
Least Square Means
Objectives Met 2 46.6 47.4 47.0
Objectives Met 1 43.1 44.1 43.7
Objectives Met 0 47.0 47.8 47.0
Difference p (difference>0) Difference p (difference>0) Difference p (difference>0)
Difference Met 2 - Met 1 3.5 0.0001 3.3 0.0001 3.3 0.0001
Difference Met 2 - Met 0 -0.4 0.6854 -0.5 0.6352 -0.04 0.9670
Difference Met 1 - Met 0 -3.9 0.0003 -3.8 0.0006 -3.3 0.0022
Number of Observations 6870 6870 6870

179Appendix
FIG. A-46
PFP Effect by Total Objectives Met—Elementary Schools—CSAP Reading NCE ScoresWeighted Two-Stage Hierarchical Linear Model
Unadjusted Adjusted for School Factors Adjusted for School and Student Factors
� p(�=0) � p(�=0) � p(�=0)
Intercept 13.6 0.0001 14.0 0.0001 23.2 0.0001
Objectives Met 2 0.6 0.6992 0.5 0.7343 0.5 0.7067
Objectives Met 1 -1.0 0.6027 -1.0 0.6074 -1.1 0.5546
Objectives Met 0 0.0 0.0 0.0
Time 0.1 0.9573 0.5 0.8028 0.7 0.7433
Time Squared -1.1 0.1395 -1.2 0.0988 -1.2 0.0964
Time x Objectives Met 2 -2.8 0.2192 -3.0 0.1771 -2.9 0.1869
Time x Objectives Met 1 -1.8 0.5161 -2.0 0.4727 -1.7 0.5198
Time x Objectives Met 0 0.0 0.0 0.0
Time Squared x Objectives Met 2 1.7 0.0195 1.8 0.0138 1.7 0.0212
Time Squared x Objectives Met 1 1.2 0.168 1.2 0.1528 1.1 0.2170
Time Squared x Objectives Met 0 0.0 0.0 0.0
Last score 0.8 0.0001 0.8 0.0001 0.7 0.0001
Least Square Means
Objectives Met 2 54.9 55.2 54.8
Objectives Met 1 53.0 53.3 52.7
Objectives Met 0 52.3 52.7 52.6
Difference p (difference>0) Difference p (difference>0) Difference p (difference>0)
Difference Met 2 - Met 1 2.0 0.0001 1.9 0.0001 2.1 0.0001
Difference Met 2 - Met 0 2.7 0.0003 2.5 0.0007 2.2 0.0028
Difference Met 1 - Met 0 0.7 0.3935 0.6 0.4860 0.1 0.8954
Number of Observations 4556 4556 4556

180 Catalyst for Change
FIG. A-47
PFP Effect by Total Objectives Met—Elementary Schools—CSAP Writing NCE ScoresWeighted Two-Stage Hierarchical Linear Model
Unadjusted Adjusted for School Factors Adjusted for School and Student Factors
� p(�=0) � p(�=0) � p(�=0)
Intercept 46.4 0.0001 45.8 0.0001 62.4 0.0001
Objectives Met 2 5.8 0.0169 5.7 0.0196 5.8 0.0069
Objectives Met 1 7.6 0.0181 7.4 0.0214 5.4 0.0537
Objectives Met 0 0.0 0.0 0.0
Time 12.1 0.0007 12.2 0.0007 11.0 0.0004
Time Squared -4.0 0.0005 -4.0 0.0005 -3.3 0.0012
Time x Objectives Met 2 -12.4 0.0008 -12.5 0.0007 -10.6 0.0009
Time x Objectives Met 1 -10.9 0.0145 -10.5 0.0183 -7.1 0.0687
Time x Objectives Met 0 0.0 0.0 0.0
Time Squared x Objectives Met 2 4.1 0.0006 4.2 0.0005 3.1 0.0027
Time Squared x Objectives Met 1 3.2 0.0215 3.0 0.0308 1.6 0.1788
Time Squared x Objectives Met 0 0.0 0.0 0.0
Least Square Means
Objectives Met 2 52.0 52.5 52.1
Objectives Met 1 52.5 52.8 51.5
Objectives Met 0 50.6 51.3 52.0
Difference p (difference>0) Difference p (difference>0) Difference p (difference>0)
Difference Met 2 - Met 1 -0.5 0.5678 -0.3 0.7692 0.5 0.4719
Difference Met 2 - Met 0 1.4 0.2948 1.3 0.3334 0.1 0.9282
Difference Met 1 - Met 0 1.9 0.2039 1.5 0.3039 -0.4 0.7314
Number of Observations 5609 5609 5609

181Appendix
FIG. A-48
PFP Effect by Total Objectives Met—Elementary Schools—CSAP Math NCE ScoresWeighted Two-Stage Hierarchical Linear Model
Unadjusted Adjusted for School Factors Adjusted for School and Student Factors
� p(�=0) � p(�=0) � p(�=0)
Intercept 69.6 0.0059 62.0 0.0115 74.5 0.0015
Objectives Met 2 -16.9 0.4110 -12.8 0.5423 -12.6 0.4890
Objectives Met 1 -10.1 0.6414 -7.4 0.7382 -9.2 0.6303
Objectives Met 0 0.0 0.0 0.0
Time -11.6 0.5786 -6.2 0.7693 -5.1 0.7835
Time Squared 0.1 0.9835 -1.3 0.8154 -1.5 0.7415
Time x Objectives Met 2 14.9 0.485 10.4 0.6343 10.2 0.5879
Time x Objectives Met 1 6.9 0.7615 4.8 0.8347 6.6 0.7416
Time x Objectives Met 0 0.0 0.0 0.0
Time Squared x Objectives Met 2 -1.0 0.8575 0.3 0.9554 0.1 0.9767
Time Squared x Objectives Met 1 0.1 0.9796 0.6 0.9248 0.1 0.9805
Time Squared x Objectives Met 0 0.0 0.0 0.0
Least Square Means
Objectives Met 2 55.2 55.6 54.0
Objectives Met 1 51.3 51.2 50.1
Objectives Met 0 46.9 46.4 45.5
Difference p (difference>0) Difference p (difference>0) Difference p (difference>0)
Difference Met 2 - Met 1 3.9 0.0004 4.4 0.0001 3.9 0.0001
Difference Met 2 - Met 0 8.3 0.0088 9.3 0.0042 8.4 0.0028
Difference Met 1 - Met 0 4.4 0.1835 4.8 0.1511 4.6 0.1195
Number of Observations 2117 2117 2117

182 Catalyst for Change
A-49
PFP Effect by Total Objectives Met—Middle Schools—ITBS Reading NCE ScoresWeighted Two-Stage Hierarchical Linear Model
Unadjusted Adjusted for School Factors Adjusted for School and Student Factors
� p(�=0) � p(�=0) � p(�=0)
Intercept 12.2 0.1460 11.9 0.1495 15.7 0.1295
Objectives Met 2 0.9 0.7559 1.0 0.7190 0.7 0.8124
Objectives Met 1 0.4 0.9128 0.7 0.8383 0.1 0.9643
Objectives Met 0 0.0 0.0 0.0
Time 0.8 0.7162 0.8 0.7255 0.4 0.8646
Time x Objectives Met 2 -1.6 0.4894 -1.8 0.4261 -1.4 0.5362
Time x Objectives Met 1 -2.4 0.3516 -2.8 0.2704 -2.4 0.3386
Time x Objectives Met 0 0.0 0.0 0.0
Last score 0.6 0.0001 0.6 0.0001 0.6 0.0001
Least Square Means
Objectives Met 2 33.7 33.7 33.9
Objectives Met 1 32.2 32.1 32.1
Objectives Met 0 34.7 34.9 35.0
Difference p (difference>0) Difference p (difference>0) Difference p (difference>0)
Difference Met 2 - Met 1 1.5 0.0411 1.6 0.0309 1.8 0.0148
Difference Met 2 - Met 0 -1.1 0.2892 -1.2 0.2253 -1.1 0.2885
Difference Met 1 - Met 0 -2.6 0.0271 -2.8 0.0164 -2.9 0.0142
Number of Observations 1800 1800 1800
FIG. A-50
PFP Effect by Total Objectives Met—Middle Schools—ITBS Language NCE ScoresWeighted Two-Stage Hierarchical Linear Model
Unadjusted Adjusted for School Factors Adjusted for School and Student Factors
� p(�=0) � p(�=0) � p(�=0)
Intercept 11.7 0.1978 11.9 0.1967 21.2 0.1253
Objectives Met 2 6.1 0.0975 6.0 0.1064 2.8 0.4473
Objectives Met 1 3.8 0.3451 3.6 0.3811 0.1 0.9716
Objectives Met 0 0.0 0.0 0.0
Time -1.2 0.6548 -1.3 0.6427 -3.3 0.2267
Time x Objectives Met 2 -1.7 0.5422 -1.6 0.5754 0.3 0.9059
Time x Objectives Met 1 1.1 0.7308 1.3 0.6789 3.1 0.3226
Time x Objectives Met 0 0.0 0.0 0.0
Last score 0.6 0.0001 0.6 0.0001 0.5 0.0001
Least Square Means
Objectives Met 2 39.2 39.1 40.7
Objectives Met 1 40.2 40.2 41.4
Objectives Met 0 35.1 35.1 37.6
Difference p (difference>0) Difference p (difference>0) Difference p (difference>0)
Difference Met 2 - Met 1 -1.1 0.1995 -1.1 0.1921 -0.7 0.3945
Difference Met 2 - Met 0 4.0 0.0020 4.1 0.0019 3.2 0.0139
Difference Met 1 - Met 0 5.1 0.0005 5.2 0.0004 3.9 0.0075
Number of Observations 1453 1453 1453

183Appendix
FIG. A-51
PFP Effect by Total Objectives Met—Middle Schools—ITBS Math NCE ScoresWeighted Two-Stage Hierarchical Linear Model
Unadjusted Adjusted for School Factors Adjusted for School and Student Factors
� p(�=0) � p(�=0) � p(�=0)
Intercept 8.6 0.4783 18.3 0.2720 24.1 0.2142
Objectives Met 2 5.4 0.5051 -6.7 0.4157 -7.2 0.3771
Objectives Met 1 10.6 0.1966 -2.8 0.7433 -4.0 0.6324
Objectives Met 0 0.0 0.0 0.0
Time 2.0 0.6750 -6.0 0.2202 -6.2 0.1988
Time x Objectives Met 2 -0.5 0.9225 6.4 0.1928 6.4 0.1851
Time x Objectives Met 1 -4.4 0.3645 3.2 0.5185 3.9 0.4284
Time x Objectives Met 0 0.0 0.0 0.0
Last score 0.5 0.0001 0.5 0.0001 0.5 0.0001
Least Square Means
Objectives Met 2 34.5 34.3 35.0
Objectives Met 1 34.4 34.1 35.0
Objectives Met 0 29.7 32.5 33.7
Difference p (difference>0) Difference p (difference>0) Difference p (difference>0)
Difference Met 2 - Met 1 0.1 0.9228 0.2 0.8318 0.1 0.9494
Difference Met 2 - Met 0 4.7 0.0813 1.8 0.5160 1.3 0.6278
Difference Met 1 - Met 0 4.6 0.1043 1.6 0.5856 1.3 0.6590
Number of Observations 1011 1011 1011
FIG. A-52
PFP Effect by Total Objectives Met—Middle Schools—CSAP Reading NCE ScoresWeighted Two-Stage Hierarchical Linear Model
Unadjusted Adjusted for School Factors Adjusted for School and Student Factors
� p(�=0) � p(�=0) � p(�=0)
Intercept 8.1 0.1902 7.8 0.1942 14.6 0.1153
Objectives Met 2 -0.4 0.8442 -0.3 0.8789 -1.0 0.6564
Objectives Met 1 -4.8 0.0490 -4.5 0.0661 -4.6 0.0573
Objectives Met 0 0.0 0.0 0.0
Time 0.7 0.6842 0.7 0.6866 0.1 0.9297
Time x Objectives Met 2 0.6 0.7087 0.5 0.7952 1.0 0.5754
Time x Objectives Met 1 4.2 0.0284 3.8 0.0502 3.9 0.0427
Time x Objectives Met 0 0.0 0.0 0.0
Last score 0.8 0.0001 0.8 0.0001 0.7 0.0001
Least Square Means
Objectives Met 2 43.6 43.6 43.4
Objectives Met 1 43.6 43.5 43.3
Objectives Met 0 43.2 43.4 43.2
Difference p (difference>0) Difference p (difference>0) Difference p (difference>0)
Difference Met 2 - Met 1 0.004 0.9948 0.1 0.9155 0.1 0.9184
Difference Met 2 - Met 0 0.4 0.6358 0.2 0.7761 0.2 0.7711
Difference Met 1 - Met 0 0.4 0.6820 0.2 0.8542 0.2 0.8479
Number of Observations 2223 2223 2223

184 Catalyst for Change
FIG. A-53
PFP Effect by Total Objectives Met—Middle Schools—CSAP Writing NCE ScoresWeighted Two-Stage Hierarchical Linear Model
Unadjusted Adjusted for School Factors Adjusted for School and Student Factors
� p(�=0) � p(�=0) � p(�=0)
Intercept 15.4 0.1329 15.4 0.1329 27.3 0.0811
Objectives Met 2 -2.4 0.4525 -2.4 0.4550 -1.8 0.5649
Objectives Met 1 5.3 0.2214 5.2 0.2253 4.8 0.2466
Objectives Met 0 0.0 0.0 0.0
Time 0.6 0.7880 0.6 0.7844 0.2 0.9309
Time x Objectives Met 2 1.0 0.6626 1.0 0.6576 1.2 0.5994
Time x Objectives Met 1 -3.4 0.2419 -3.3 0.2553 -2.6 0.3435
Time x Objectives Met 0 0.0 0.0 0.0
Last score 0.7 0.0001 0.7 0.0001 0.6 0.0001
Least Square Means
Objectives Met 2 43.9 43.9 45.1
Objectives Met 1 44.7 44.7 45.6
Objectives Met 0 44.7 44.7 45.1
Difference p (difference>0) Difference p (difference>0) Difference p (difference>0)
Difference Met 2 - Met 1 -0.7 0.4460 -0.7 0.4398 -0.5 0.5755
Difference Met 2 - Met 0 -0.8 0.5570 -0.8 0.5862 0.1 0.9483
Difference Met 1 - Met 0 -0.1 0.9626 -0.02 0.9912 0.6 0.7002
Number of Observations 1325 1325 1325
FIG. A-54
PFP Effect by Total Objectives Met—Middle Schools—CSAP Math NCE ScoresWeighted Two-Stage Hierarchical Linear Model
Unadjusted Adjusted for School Factors Adjusted for School and Student Factors
� p(�=0) � p(�=0) � p(�=0)
Intercept 2.9 0.7182 4.0 0.6373 8.8 0.3992
Objectives Met 2 0.9 0.8783 0.3 0.9666 1.1 0.8542
Objectives Met 1 -13.6 0.1565 -14.7 0.1294 -15.4 0.1087
Objectives Met 0 0.0 0.0 0.0
Time 4.6 0.1641 3.5 0.3126 3.2 0.3511
Time x Objectives Met 2 0.5 0.8903 0.9 0.7872 0.9 0.7931
Time x Objectives Met 1 8.1 0.1068 8.9 0.0832 10.1 0.0462
Time x Objectives Met 0 0.0 0.0 0.0
Last score 0.7 0.0001 0.7 0.0001 0.7 0.0001
Least Square Means
Objectives Met 2 45.9 45.9 46.8
Objectives Met 1 44.8 44.9 46.5
Objectives Met 0 44.1 44.0 44.1
Difference p (difference>0) Difference p (difference>0) Difference p (difference>0)
Difference Met 2 - Met 1 1.1 0.3969 1.0 0.4362 0.3 0.7901
Difference Met 2 - Met 0 1.8 0.2078 1.9 0.1809 2.7 0.0573
Difference Met 1 - Met 0 0.7 0.7198 0.9 0.6408 2.3 0.2109
Number of Observations 950 950 950

185Appendix
FIG. A-55
PFP Effect by Total Objectives Met—Manual High School—ITBS Reading NCE ScoresWeighted Least Squares Linear Regression Model
Unadjusted Adjusted for Student Factors
� p(�=0) � p(�=0)
Intercept 9.1 0.0004 15.4 0.0001
Objectives Met 2 7.6 0.0019 7.8 0.0012
Objectives Met 1 2.2 0.4595 1.5 0.5975
Objectives Met 0 0.0 0.0
Time 5.4 0.0991 4.4 0.1681
Time x Objectives Met 2 -9.5 0.0064 -8.7 0.1140
Time x Objectives Met 1 -3.4 0.4448 -3.0 0.5051
Time x Objectives Met 0 0.0 0.0
Last score 0.6 0.0001 0.5 0.0001
Least Square Means
Objectives Met 2 36.8 37.0
Objectives Met 1 34.2 33.3
Objectives Met 0 33.6 33.1
Difference p (difference>0) Difference p (difference>0)
Difference Met 2 - Met 1 2.6 0.1073 3.7 0.0208
Difference Met 2 - Met 0 3.2 0.0697 3.8 0.0259
Difference Met 1 - Met 0 0.6 0.7885 0.2 0.9352
Number of Observations 692 689
FIG. A-56
PFP Effect by Total Objectives Met—Manual High School—ITBS Language NCE ScoresWeighted Least Squares Linear Regression Model
Unadjusted Adjusted for Student Factors
� p(�=0) � p(�=0)
Intercept 19.7 0.0015 23.4 0.0013
Objectives Met 2 -4.9 0.4250 -3.1 0.6110
Objectives Met 1 3.7 0.3393 4.0 0.2983
Objectives Met 0 0.0 0.0
Time -8.4 0.1331 -7.4 0.1877
Time x Objectives Met 2 5.0 0.3798 3.9 0.4923
Time x Objectives Met 1 0.0 0.0
Time x Objectives Met 0 0.0 0.0
Last score 0.7 0.0001 0.6 0.0001
Least Square Means
Objectives Met 2 36.6 32.2
Objectives Met 1 42.1 37.0
Objectives Met 0
Difference p (difference>0) Difference p (difference>0)
Difference Met 2 - Met 1 -5.5 0.0415 -4.7 0.0782
Difference Met 2 - Met 0
Difference Met 1 - Met 0
Number of Observations 430 428
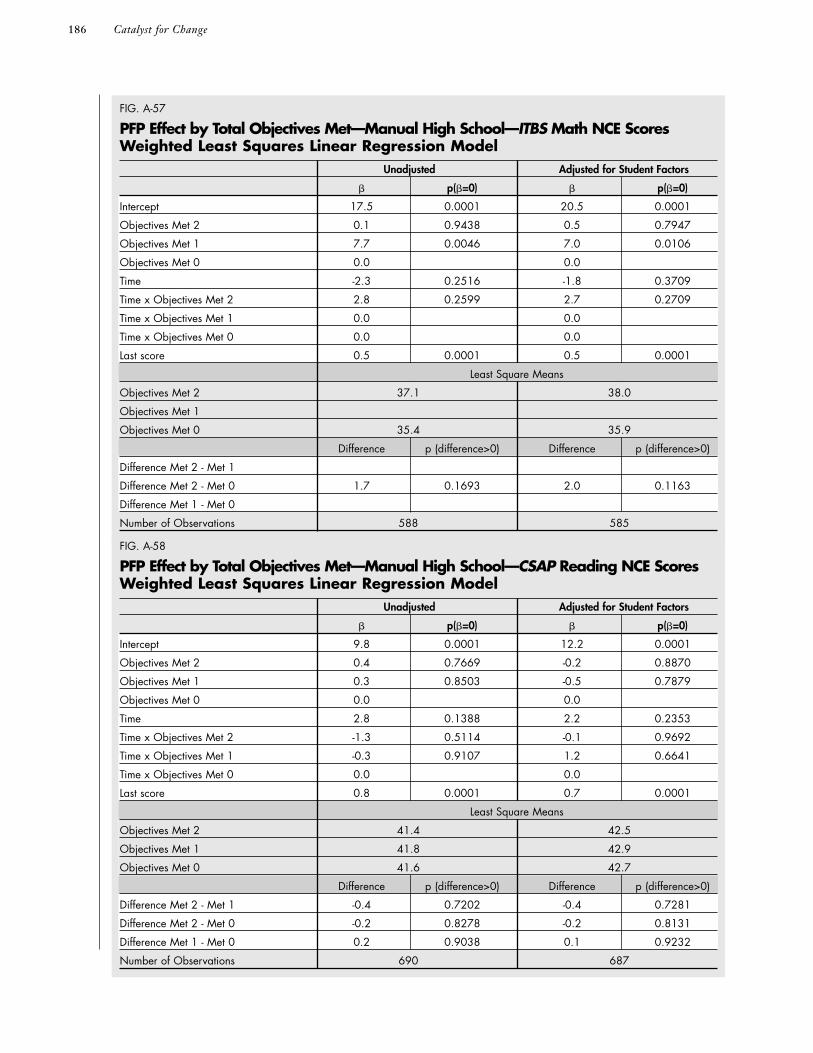
186 Catalyst for Change
FIG. A-57
PFP Effect by Total Objectives Met—Manual High School—ITBS Math NCE ScoresWeighted Least Squares Linear Regression Model
Unadjusted Adjusted for Student Factors
� p(�=0) � p(�=0)
Intercept 17.5 0.0001 20.5 0.0001
Objectives Met 2 0.1 0.9438 0.5 0.7947
Objectives Met 1 7.7 0.0046 7.0 0.0106
Objectives Met 0 0.0 0.0
Time -2.3 0.2516 -1.8 0.3709
Time x Objectives Met 2 2.8 0.2599 2.7 0.2709
Time x Objectives Met 1 0.0 0.0
Time x Objectives Met 0 0.0 0.0
Last score 0.5 0.0001 0.5 0.0001
Least Square Means
Objectives Met 2 37.1 38.0
Objectives Met 1
Objectives Met 0 35.4 35.9
Difference p (difference>0) Difference p (difference>0)
Difference Met 2 - Met 1
Difference Met 2 - Met 0 1.7 0.1693 2.0 0.1163
Difference Met 1 - Met 0
Number of Observations 588 585
FIG. A-58
PFP Effect by Total Objectives Met—Manual High School—CSAP Reading NCE ScoresWeighted Least Squares Linear Regression Model
Unadjusted Adjusted for Student Factors
� p(�=0) � p(�=0)
Intercept 9.8 0.0001 12.2 0.0001
Objectives Met 2 0.4 0.7669 -0.2 0.8870
Objectives Met 1 0.3 0.8503 -0.5 0.7879
Objectives Met 0 0.0 0.0
Time 2.8 0.1388 2.2 0.2353
Time x Objectives Met 2 -1.3 0.5114 -0.1 0.9692
Time x Objectives Met 1 -0.3 0.9107 1.2 0.6641
Time x Objectives Met 0 0.0 0.0
Last score 0.8 0.0001 0.7 0.0001
Least Square Means
Objectives Met 2 41.4 42.5
Objectives Met 1 41.8 42.9
Objectives Met 0 41.6 42.7
Difference p (difference>0) Difference p (difference>0)
Difference Met 2 - Met 1 -0.4 0.7202 -0.4 0.7281
Difference Met 2 - Met 0 -0.2 0.8278 -0.2 0.8131
Difference Met 1 - Met 0 0.2 0.9038 0.1 0.9232
Number of Observations 690 687

187Appendix
FIG. A-59
PFP Effect by Total Objectives Met—Manual High School—CSAP Writing NCE ScoresWeighted Least Squares Linear Regression Model
Unadjusted Adjusted for Student Factors
� p(�=0) � p(�=0)
Intercept 13.7 0.0577 13.9 0.0563
Objectives Met 2 -8.0 0.2969 -4.0 0.5972
Objectives Met 1 0.02 0.9940 -0.3 0.8834
Objectives Met 0 0.0 0.0
Time -5.1 0.4615 -0.4 0.9578
Time x Objectives Met 2 9.6 0.2031 6.0 0.4195
Time x Objectives Met 1 0.0 0.0
Time x Objectives Met 0 0.0 0.0
Last score 0.7 0.0001 0.6 0.0001
Least Square Means
Objectives Met 2 39.4 36.8
Objectives Met 1 38.1 34.7
Objectives Met 0
Difference p (difference>0) Difference p (difference>0)
Difference Met 2 - Met 1 1.3 0.4848 2.1 0.2540
Difference Met 2 - Met 0
Difference Met 1 - Met 0
Number of Observations 336 333
FIG. A-60
PFP Effect by Total Objectives Met—Manual High School—CSAP Math NCE ScoresWeighted Least Squares Linear Regression Model
Unadjusted Adjusted for Student Factors
� p(�=0) � p(�=0)
Intercept 15.7 0.0001 17.9 0.0001
Objectives Met 2 0.4 0.7901 1.2 0.4171
Objectives Met 1 1.1 0.6658 1.0 0.6789
Objectives Met 0 0.0 0.0
Time -3.0 0.0240 -2.8 0.0417
Time x Objectives Met 2 0.9 0.6240 1.0 0.5906
Time x Objectives Met 1 0.0 0.0
Time x Objectives Met 0 0.0 0.0
Last score 0.7 0.0001 0.6 0.0001
Least Square Means
Objectives Met 2 42.1 37.4
Objectives Met 1
Objectives Met 0 41.1 35.6
Difference p (difference>0) Difference p (difference>0)
Difference Met 2 - Met 1
Difference Met 2 - Met 0 1.0 0.2778 1.8 0.0585
Difference Met 1 - Met 0
Number of Observations 512 510

188 Catalyst for Change
FIG. A-62
PFP Effect by Total Objectives Met—Jefferson High School—ITBS Math NCE ScoresWeighted Least Squares Linear Regression Model
Unadjusted Adjusted for Student Factors
� p(�=0) � p(�=0)
Intercept 8.4 0.0001 13.5 0.0001
Objectives Met 2 1.4 0.4533 1.6 0.3701
Objectives Met 1 0.0 0.0
Objectives Met 0
Time -0.04 0.9754 -0.1 0.9248
Last score 0.8 0.0001 0.7 0.0001
Least Square Means
Objectives Met 2 54.6 55.7
Objectives Met 1 53.2 54.1
Objectives Met 0
Difference p (difference>0) Difference p (difference>0)
Difference Met 2 - Met 1 1.4 0.4533 1.6 0.3701
Difference Met 2 - Met 0
Difference Met 1 - Met 0
Number of Observations 809 809
FIG. A-61
PFP Effect by Total Objectives Met—Jefferson High School—ITBS Reading NCE ScoresWeighted Least Squares Linear Regression Model
Unadjusted Adjusted for Student Factors
� p(�=0) � p(�=0)
Intercept 5.9 0.0032 10.3 0.0001
Objectives Met 2 5.4 0.0033 5.4 0.0027
Objectives Met 1 0.0 0.0
Objectives Met 0
Time -1.2 0.1007 -1.2 0.0820
Last score 0.8 0.0001 0.8 0.0001
Least Square Means
Objectives Met 2 56.0 57.1
Objectives Met 1 50.6 51.7
Objectives Met 0
Difference p (difference>0) Difference p (difference>0)
Difference Met 2 - Met 1 5.4 0.0033 5.4 0.0027
Difference Met 2 - Met 0
Difference Met 1 - Met 0
Number of Observations 1137 1137

189Appendix
FIG. A-64
PFP Effect by Total Objectives Met—Jefferson High School—CSAP Math NCE ScoresWeighted Least Squares Linear Regression Model
Unadjusted Adjusted for Student Factors
� p(�=0) � p(�=0)
Intercept 6.2 0.0001 8.8 0.0001
Objectives Met 2 1.6 0.1486 1.7 0.1249
Objectives Met 1 0.0 0.0
Objectives Met 0
Time -2.1 0.0039 -2.1 0.0049
Last score 0.9 0.0001 0.8 0.0001
Least Square Means
Objectives Met 2 60.1 60.2
Objectives Met 1 58.5 58.5
Objectives Met 0
Difference p (difference>0) Difference p (difference>0)
Difference Met 2 - Met 1 1.6 0.1486 1.7 0.1249
Difference Met 2 - Met 0
Difference Met 1 - Met 0
Number of Observations 704 704
FIG. A-63
PFP Effect by Total Objectives Met—Jefferson High School—CSAP Reading NCE ScoresWeighted Least Squares Linear Regression Model
Unadjusted Adjusted for Student Factors
� p(�=0) � p(�=0)
Intercept 7.7 0.0001 12.8 0.0001
Objectives Met 2 1.1 0.4206 1.4 0.2837
Objectives Met 1 0.0 0.0
Objectives Met 0
Time 0.3 0.6477 0.3 0.6029
Last score 0.8 0.0001 0.8 0.0001
Least Square Means
Objectives Met 2 58.9 57.0
Objectives Met 1 57.8 55.6
Objectives Met 0
Difference p (difference>0) Difference p (difference>0)
Difference Met 2 - Met 1 1.1 0.4206 1.4 0.2837
Difference Met 2 - Met 0
Difference Met 1 - Met 0
Number of Observations 917 917

190 Catalyst for Change
Notes

ABOUT CTAC:
The Community Training and Assistance Center
is a national not-for-profit organization with a
demonstrated record of success in urban communities.
It focuses on developing leadership, planning and
managerial expertise within community-based
organizations, school systems, collaborative partner-
ships, state and municipal governments, and health
and human service agencies. Since 1979, CTAC has
provided assistance to hundreds of community-based
organizations, coalitions and public institutions in the
United States and several other countries.
CTAC’s staff is comprised of nationally recognized
executives, educators, policy makers and organizers
who have extensive experience working with city,
county and state agencies, educational institutions,
federal legislative bodies, not-for-profit organizations,
philanthropic institutions and the private sector.
© Community Training and Assistance Center
Boston, Massachusetts
January 2004
All rights reserved

January 2004
COMMUNITY TRAINING AND ASSISTANCE CENTER
Catalyst for ChangePay for Performance in DenverFinal Report
30 WINTER STREET • BOSTON, MA 02108TEL: 617.423.1444 • E-MAIL: [email protected]
www.ctacusa.com
COMMUNITY TRAINING AND ASSISTANCE CENTER


