Page 1
www.elsevier.com/locate/cattod
Catalysis Today 125 (2007) 111–119
Catalytic dehydration of bioethanol to ethylene over
TiO2/g-Al2O3 catalysts in microchannel reactors
Guangwen Chen *, Shulian Li, Fengjun Jiao, Quan Yuan
Dalian Institute of Chemical Physics, Chinese Academy of Sciences, 457 Zhongshan Road, Dalian 116023, China
Available online 21 March 2007
Abstract
Ethylene is essential material for the petrochemical industry. Ethylene production via catalytic dehydration of ethanol over TiO2/g-Al2O3
catalysts in multi-microchannel reactors is reported in this paper. The physicochemical properties of these catalysts are characterized by X-ray
diffraction (XRD) and FT-IR spectrum. The effects of operation parameters, such as ethanol concentration, reaction temperature and liquid hourly
space velocity, have been investigated experimentally. The reaction results indicate that the catalysts doped with TiO2 have high ethanol conversion
of 99.96% and ethylene selectivity of 99.4%. Ethylene yield of 26 g/(gcat h) can be achieved, which provides very favorable foundation for the
process intensification and miniaturization of the ethylene production process using bioethanol.
# 2007 Elsevier B.V. All rights reserved.
Keywords: Ethanol dehydration; Ethylene; Ti/g-Al2O3 catalyst; Microchannel; Microstructured reactor; Microreactor; Miniaturization; Process intensification
1. Introduction
Ethylene is crucial material for the petrochemical industry,
which is derived mainly from steam-cracking of petroleum or
natural gas feedstocks. Due to the high production cost and high
energy consumption, the way of ethanol catalytic dehydration
into ethylene is commercially applied only in a few countries,
such as Brazil and India. Nowadays, with the shortage of
natural resource and energy, and also with the skyrocketing
prices of crude oil, catalytic dehydration of ethanol (especially
bioethanol) to ethylene has become a more and more
competitive and promising route, and therefore has been
drawing much attention.
For catalytic reactions, development of an effective catalyst
is the foundational and critical step. Many catalysts have been
studied for ethylene production via ethanol dehydration
process. These catalysts are mainly pure or doped alumina
[1–4]; the rest are zeolite [5], titania–silica [6], magnesium
oxides [7], manganese oxides [8,9], cobalt oxides [10],
chromium oxide [11], zirconium phosphite [12], silver salt
of tungstophosphoric acid [13], etc. Dopants for alumina based
catalysts that have been studied are mostly transition metals.
* Corresponding author. Tel.: +86 411 84379031; fax: +86 411 84691570.
E-mail address: [email protected] (G. Chen).
0920-5861/$ – see front matter # 2007 Elsevier B.V. All rights reserved.
doi:10.1016/j.cattod.2007.01.071
Phillips Oil Co. [1,2] reported the application of g-Al2O3
catalyst treated with KOH and ZnO/Al2O3 catalyst for the
dehydration of saturated alcohol to produce the corresponding
olefin. Syndol catalyst based on MgO–Al2O3/SiO2 developed
by Halcon SD has been applied commercially [3]. El-Katatny
et al. [14] developed FeOx/g-Al2O3 catalyst, but ethanol
conversion and ethylene selectivity were only 60% and 68% at
temperature of 250 8C, respectively. Doheim et al. [15]
developed Na2O-doped Mn2O3/Al2O3 catalyst, and as high
as 97% ethanol conversion could be achieved at 300 8C and a
low space velocity. The reactors used in industry are usually the
tube-array fixed bed reactors with low liquid hourly space
velocity (0.3–0.6 h�1), low ethylene yield, and relatively high
reaction temperature (350–450 8C), resulting in high energy
consumption and low utilization of equipment capacity.
Two reactions can occur in parallel during catalytic
dehydration of ethanol:
C2H5OH ¼ C2H4þH2O þ 44:9 kJ=mol (1)
2C2H5OH ¼ C2H5OC2H5þH2O � 25:1 kJ=mol (2)
The main reaction and the side reaction are endothermic and
exothermic, respectively. Low temperatures favor the side
reaction, so how to enhance the reactor performance and how to
keep the isothermal operation are key issues of this process to
achieve high efficiencies.
Page 2
G. Chen et al. / Catalysis Today 125 (2007) 111–119112
With the great progresses achieved in the new area of
microreactor technologies [16–18], microreactors have been
widely applied in the field of heterogeneous catalytic reactions,
including catalytic hydrogenations/dehydrogenations [19],
ammonia oxidation [20], hydrogen combustion [21], fuel
reforming [22–24], selective oxidation of hydrocarbons [25–
27], etc. Microchannel reactors usually refer to miniaturized
reaction systems fabricated by methods of microtechnology
and precision engineering; their characteristic dimensions of
the internal structures range from dozen micrometers to sub-
millimeters. When applied in chemical reactions, microreactors
possess many fundamental advantages and can bring many
benefits that cannot be achieved in traditional reactors. These
advantages include decreased physical sizes, increased surface-
to-volume ratios, excellent mass and heat transfer capabilities,
better process safety, high yields, and facility for easily scaling
up and production on site, etc. The application of microreaction
technology can improve the efficiency of systems and diminish
their volumes and weights.
In order to fulfill the process intensification of ethanol
catalytic dehydration to ethylene, and thus to enhance the
economic benefit and competence of this process over the
petroleum steam-cracking processes, both the catalysts with high
activities and novel reactors need to be developed. Three main
ways were applied for catalyst immobilization in microchannel,
the one is that the reactors or microchannels themselves were
made of active materials, the two others are wall-coating
technique and catalysts packed into channels in the form of
powder, small pellets or structured strips [28]. In this work, we
aim at investigating the modification effects of TiO2-doped on
alumina catalysts packed in microreactors. The catalysts
modified are compared with the undoped one in reaction
performance. After choosing an appropriate catalyst and optimal
reaction conditions, higher yield of ethylene can be obtained.
2. Experimental
2.1. Microreactor design
The configuration of the microchannel reactor used in the
experiments is shown in Fig. 1. A stainless steel chip of the
microreactor is made by microprecision-machining method.
Thirty microchannels per chip are separated by 500 mm fins; its
width, depth and length are 1000 mm, 1250 mm and 30 mm,
respectively. The entrance and exit areas are triangular shaped
Fig. 1. Microchannel reactor configuration. W, width of total channels
44.5 mm; wc, width of single channel 1.0 mm; wf , width of fin 0.5 mm; h,
depth of channel 1.25 mm; H, thickness of chip 2 mm; L, length of channel
30 mm.
with the inlets and outlets on opposite sides of the channels
array. Catalyst particles with the size of 40–60 mesh are packed
within the 30 parallel channels. Quartz wool is set at each end of
the catalysts to keep them from moving with the stream flow. A
graphite sheet covers the plate to seal the channels. The total
volume of the channels packed with catalyst is about 1.15 mL.
Four grooves are made across in the back of the plate, where
a thermocouple can be inserted and moved smoothly to control
or measure the temperature of different regions of the reaction
plate. The plate is firmly sandwiched between two stainless
steel housings, which integrate four columnar heaters, a
thermocouple, the inlet and the outlet. The heaters are inserted
into both the top and bottom plates to keep the channels of the
reaction plate at a certain temperature. Stainless bolts are used
to hold all the parts.
2.2. Experimental set-up
The reaction of ethanol catalytic dehydration to ethylene is
carried out in a microchannel reactor at the atmospheric
pressure. Through a micro liquid pump with precision of
0.001 mL/min, the mixture of ethanol and water with different
compositions is pumped into a vaporizer kept at 200 8C and
conveys into the microreactor. The reaction temperature inside
the microreactor is controlled at the range of 300–500 8C, the
liquid hourly space velocity (LHSV) based on volume of
ethanol and water mixture is kept at 26–234 h�1, and the weight
concentration of ethanol is kept at 12–100 wt%. The products
are condensed via a cold trap with a mixture of ice and water;
both the gas and the liquid phase products are analyzed by a GC
(GC-960, Shanghai Haixin GC Co.) using 406-organic-carrier
column, H2 as carrier gas and TCD detector at an oven
temperature of 120 8C.
2.3. Gas analysis and calculation
Gas phase products consist of a large amount of ethylene
(E), a small amount of diethyl ether (DEE) and ethanol (EtOH),
and a trace amount of ethane, propane, propylene, iso-butane,
normal-butane and iso-pentane as well. In liquid phase, a large
amount is water and the rest is ethanol and DEE. In order to
eliminate the errors caused by the GC analysis, the data of each
reaction condition are obtained by repeating the measurement
two or three times.
In this paper, the liquid hourly space velocity is defined as
the ratio of the hourly feed volumetric flow rate of ethanol and
water mixture to the catalyst volume (1.15 mL). The ethanol
conversion (XMeOH), the ethylene selectivity (SE) and the
diethyl ether selectivity (SDEE) are defined as the following:
XEtOH ¼nEtOH;0 � nEtOH;1
nEtOH;0� 100 (3)
SE ¼nE;1P
ni;1� 100 (4)
SDEE ¼2nDEE;1P
ni;1� 100 (5)
Page 3
G. Chen et al. / Catalysis Today 125 (2007) 111–119 113
where nEtOH,0 and nEtOH,1 are defined as the molar flow rate
(mmol/min) of ethanol in feed and in products, respectively;
nE,1, nDEE,1, andP
ni,1 are defined as the molar flow rate of
ethylene, diethyl ether and total products, respectively.
2.4. Catalyst preparation
The procedure to prepare the TiO2/g-Al2O3 catalysts is
described as the following steps. Firstly, 30 g g-Al2O3 powder
with BET specific surface areas of 200 m2/g are diluted and
mixed well with a small quantity of 0.5 mol/L Na2CO3 solution
in a three-necked rounded-bottomed flask. Then, 0.19 mol/L
Ti(SO4)2 aqueous solution and 0.5 mol/L Na2CO3 solution are
added simultaneously to the flask, and agitate well with a
magnetic stirrer. Keep the pH of the solution at 7–8, and then
the material is washed to eliminate SO42� via a centrifugal
machine, followed by dried at 110 8C for 8 h and calcined at
500 8C for 4 h. Finally, the TiO2/g-Al2O3 catalysts with the size
of 30–50 mesh are obtained after forming, crushing and
sieving.
2.5. Catalyst characterization
The catalyst powders are examined by X-ray diffraction
(XRD) for the phase identification. The determination of the
crystallinity is performed on an X’pert PRO diffractometer
(PANalytical Inc.) equipped with Cu Ka radiation with an
accelerating voltage of 40 kV and current of 40 mA. The
patterns are recorded over the 2u angle ranging from 108 to 708at a scan rate of 48/min.
The acidity and its distribution are analyzed by NH3
adsorption and NH3-TPD. 0.1 g catalyst sample is heated for
2 h at 450 8C under helium with flow rate of 40 mL/min, and
then at 100 8C for impulse NH3 adsorption. When saturated
adsorption is achieved, the system is swept by He for 15 min.
Then, temperature is programmed to increase to 400 8C under
the heating up rate of 15 8C/min.
Surface acid types of catalysts are investigated by pyridine
FT-IR. The adsorbed state of pyridine is measured using
EQUINOX55 FT-IR (Bruker Instrument Corporation). IR cell
is connected to the high-vacuum system, and the temperature of
the cell is controlled by a temperature programmer. The dried
catalyst powder for measurement is well ground and pressed
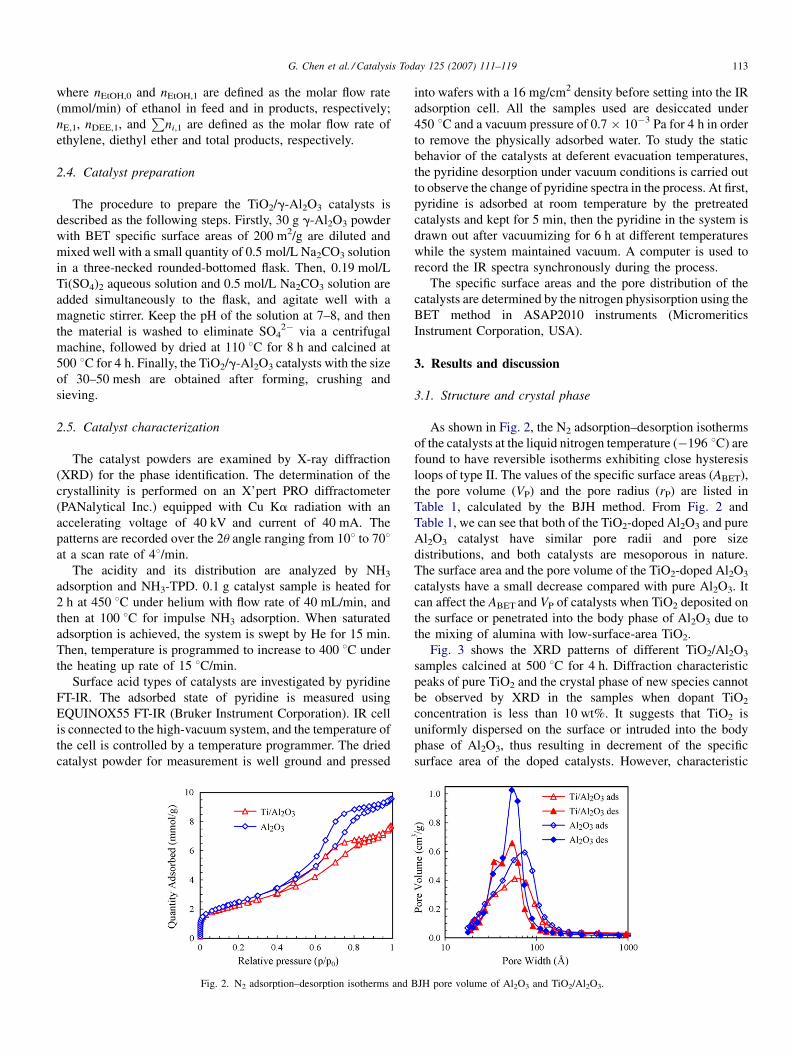
Fig. 2. N2 adsorption–desorption isotherms and
into wafers with a 16 mg/cm2 density before setting into the IR
adsorption cell. All the samples used are desiccated under
450 8C and a vacuum pressure of 0.7 � 10�3 Pa for 4 h in order
to remove the physically adsorbed water. To study the static
behavior of the catalysts at deferent evacuation temperatures,
the pyridine desorption under vacuum conditions is carried out
to observe the change of pyridine spectra in the process. At first,
pyridine is adsorbed at room temperature by the pretreated
catalysts and kept for 5 min, then the pyridine in the system is
drawn out after vacuumizing for 6 h at different temperatures
while the system maintained vacuum. A computer is used to
record the IR spectra synchronously during the process.
The specific surface areas and the pore distribution of the
catalysts are determined by the nitrogen physisorption using the
BET method in ASAP2010 instruments (Micromeritics
Instrument Corporation, USA).
3. Results and discussion
3.1. Structure and crystal phase
As shown in Fig. 2, the N2 adsorption–desorption isotherms
of the catalysts at the liquid nitrogen temperature (�196 8C) are
found to have reversible isotherms exhibiting close hysteresis
loops of type II. The values of the specific surface areas (ABET),
the pore volume (VP) and the pore radius (rP) are listed in
Table 1, calculated by the BJH method. From Fig. 2 and
Table 1, we can see that both of the TiO2-doped Al2O3 and pure
Al2O3 catalyst have similar pore radii and pore size
distributions, and both catalysts are mesoporous in nature.
The surface area and the pore volume of the TiO2-doped Al2O3
catalysts have a small decrease compared with pure Al2O3. It
can affect the ABET and VP of catalysts when TiO2 deposited on
the surface or penetrated into the body phase of Al2O3 due to
the mixing of alumina with low-surface-area TiO2.
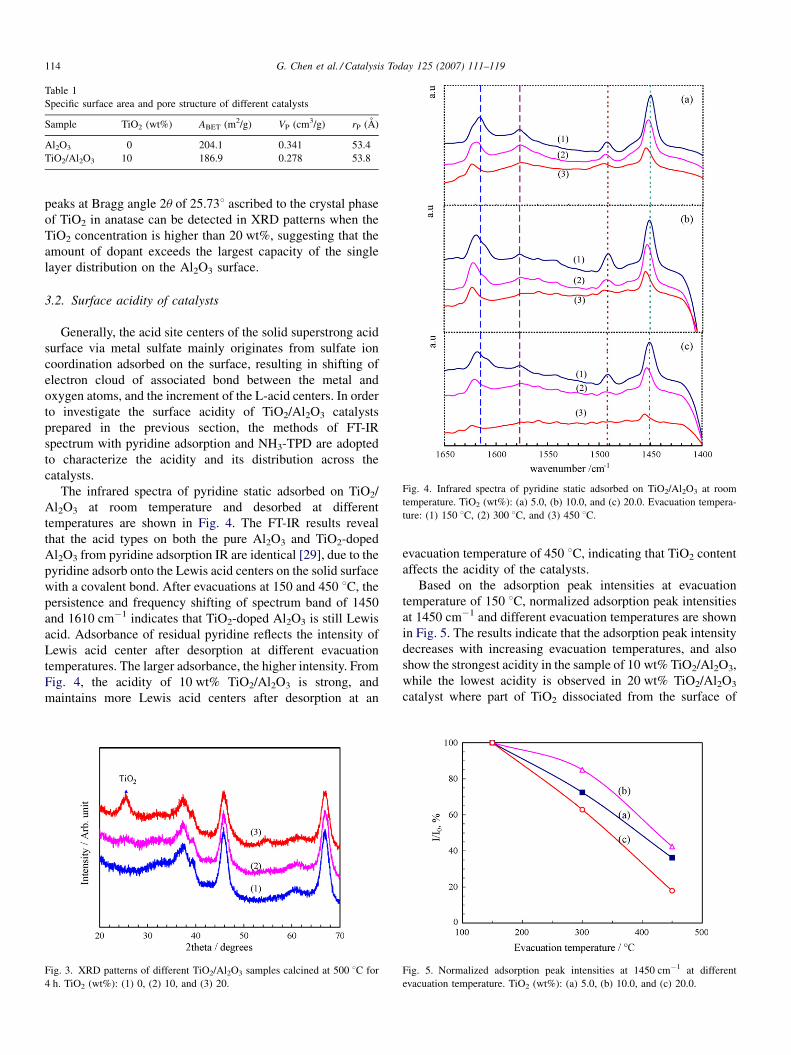
Fig. 3 shows the XRD patterns of different TiO2/Al2O3
samples calcined at 500 8C for 4 h. Diffraction characteristic
peaks of pure TiO2 and the crystal phase of new species cannot
be observed by XRD in the samples when dopant TiO2
concentration is less than 10 wt%. It suggests that TiO2 is
uniformly dispersed on the surface or intruded into the body
phase of Al2O3, thus resulting in decrement of the specific
surface area of the doped catalysts. However, characteristic
BJH pore volume of Al2O3 and TiO2/Al2O3.
Page 4
Fig. 4. Infrared spectra of pyridine static adsorbed on TiO2/Al2O3 at room
temperature. TiO2 (wt%): (a) 5.0, (b) 10.0, and (c) 20.0. Evacuation tempera-
ture: (1) 150 8C, (2) 300 8C, and (3) 450 8C.
Table 1
Specific surface area and pore structure of different catalysts
Sample TiO2 (wt%) ABET (m2/g) VP (cm3/g) rP (A)
Al2O3 0 204.1 0.341 53.4
TiO2/Al2O3 10 186.9 0.278 53.8
G. Chen et al. / Catalysis Today 125 (2007) 111–119114
peaks at Bragg angle 2u of 25.738 ascribed to the crystal phase
of TiO2 in anatase can be detected in XRD patterns when the
TiO2 concentration is higher than 20 wt%, suggesting that the
amount of dopant exceeds the largest capacity of the single
layer distribution on the Al2O3 surface.
3.2. Surface acidity of catalysts
Generally, the acid site centers of the solid superstrong acid
surface via metal sulfate mainly originates from sulfate ion
coordination adsorbed on the surface, resulting in shifting of
electron cloud of associated bond between the metal and
oxygen atoms, and the increment of the L-acid centers. In order
to investigate the surface acidity of TiO2/Al2O3 catalysts
prepared in the previous section, the methods of FT-IR
spectrum with pyridine adsorption and NH3-TPD are adopted
to characterize the acidity and its distribution across the
catalysts.
The infrared spectra of pyridine static adsorbed on TiO2/
Al2O3 at room temperature and desorbed at different
temperatures are shown in Fig. 4. The FT-IR results reveal
that the acid types on both the pure Al2O3 and TiO2-doped
Al2O3 from pyridine adsorption IR are identical [29], due to the
pyridine adsorb onto the Lewis acid centers on the solid surface
with a covalent bond. After evacuations at 150 and 450 8C, the
persistence and frequency shifting of spectrum band of 1450
and 1610 cm�1 indicates that TiO2-doped Al2O3 is still Lewis
acid. Adsorbance of residual pyridine reflects the intensity of
Lewis acid center after desorption at different evacuation
temperatures. The larger adsorbance, the higher intensity. From
Fig. 4, the acidity of 10 wt% TiO2/Al2O3 is strong, and
maintains more Lewis acid centers after desorption at an
Fig. 3. XRD patterns of different TiO2/Al2O3 samples calcined at 500 8C for
4 h. TiO2 (wt%): (1) 0, (2) 10, and (3) 20.
evacuation temperature of 450 8C, indicating that TiO2 content
affects the acidity of the catalysts.
Based on the adsorption peak intensities at evacuation
temperature of 150 8C, normalized adsorption peak intensities
at 1450 cm�1 and different evacuation temperatures are shown
in Fig. 5. The results indicate that the adsorption peak intensity
decreases with increasing evacuation temperatures, and also
show the strongest acidity in the sample of 10 wt% TiO2/Al2O3,
while the lowest acidity is observed in 20 wt% TiO2/Al2O3
catalyst where part of TiO2 dissociated from the surface of
Fig. 5. Normalized adsorption peak intensities at 1450 cm�1 at different
evacuation temperature. TiO2 (wt%): (a) 5.0, (b) 10.0, and (c) 20.0.
Page 5
Fig. 6. TPD spectra of ammonia adsorbed on Al2O3 and TiO2/Al2O3: (1) Al2O3,
(2) 10% TiO2/Al2O3, and (3) 20% TiO2/Al2O3.
G. Chen et al. / Catalysis Today 125 (2007) 111–119 115
Al2O3 and formed pure crystal phase as also indicated in Fig. 3.
The Lewis acidity sites in TiO2 interact with pyridine to form
coordinative complex compounds with poor stabilities since
there are only weak acidity centers of Hammett H0 > 3.3 in
TiO2 [30]. Therefore, the adsorption peaks of 1492 and
1577 cm�1 almost disappear, while the peak intensities of 1455
and 1625 cm�1 are much weaker than those of 10 wt% TiO2/
Al2O3. This phenomenon also validate in the results of NH3-
TPD shown in Fig. 6.
The dispersed and overlapped desorption spectra of pure
Al2O3 can be clearly observed in Fig. 6, showing that the
distribution of surface acidity intensities is nonuniform, and
that there exists a desorption peak at the temperature of 200 8Cin pure Al2O3. However, the desorption peak at temperatures
below 200 8C has not appeared in TiO2-doped Al2O3 catalysts
(Fig. 6(2) and (3)). The highest temperatures (Tm) of desorption
peaks in 10 and 20 wt% TiO2/Al2O3 are about 260 and 300 8C,
respectively. From a qualitative viewpoint, Berteau and Delmon
[9] proposed a classification: Tm from 20 to 200 8C is
corresponding to the weak acid sites; Tm between 200 and
400 8C is corresponding to moderate acid sites; Tm higher than
400 8C is associated with strong acid sites. According to this
classification, the desorption peak at 200 8C in pure Al2O3 can
be ascribed to weak acid sites, and the acid in TiO2/Al2O3 can
be regarded as moderate acid centers. The catalysts with weak
acid centers and moderate acid centers have high activities for
the isomerization of paraffins [31]. The catalysts with moderate
Fig. 7. Effect of reaction temperature on ethanol conversion and selectivities of ethyl
Reaction condition: LHSV = 52 h�1; Feed with 100% C2H5OH for pure g-Al2O3,
acid centers have relatively high activities for catalytic
dehydration of alcohol, while weak acid centers have no
activities [9].
3.3. Catalyst activity test
3.3.1. Effect of reaction temperature
As we know, the product distribution of methanol catalytic
dehydration depends on reaction temperatures strongly. High
reaction temperatures are propitious to the ethylene formation
via intra-molecular dehydrations, while low temperatures to
diethyl ether via inter-molecular dehydration. At low tempera-
tures, not only the catalyst activity is poor, but also the
selectivity of ethylene is low due to a large number of ethanol
converted to diethyl ether (Fig. 7). Arai et al. [32] proposed that
at low reaction temperatures, the formation of ethyl ether was
much easier with increased ethoxyl on the surface of alumina,
while the formation of ethylene was controlled by both the
concentrations of ethoxyl and hydroxyl on the surface.
However, the formation of ethylene is independent of these
surface concentrations at high reaction temperatures.
The effects of reaction temperatures on the conversion of
ethanol and the selectivities of ethylene and diethyl ether over
the catalysts are shown in Fig. 7. The results indicate that the
conversion of ethanol and the selectivity of ethylene increase
quickly with temperature rising, but the selectivity of diethyl
ether is contrary. For g-Al2O3, the conversion of ethanol is
higher than 90% as the reaction temperature is higher than
460 8C. However, the reaction temperature is lowered by 50 8Cat the same conversion for Ti/g-Al2O3, and the ethanol
conversion is nearly 100% at 460 8C. The selectivity of
ethylene is as high as 98.7% in 10 wt% Ti/g-Al2O3 which is
much higher than that of pure alumina. Both the ethanol
conversion and the ethylene selectivity in 10 wt% Ti/g-Al2O3
are superior to that of 20 wt% Ti/g-Al2O3 to certain extents.
3.3.2. Effect of space velocity
The conversion of ethanol and the selectivities of ethylene
and diethyl ether over 10 wt% TiO2/g-Al2O3 catalysts are
plotted in Fig. 8 as a function of space velocity in the
microchannel reactor. The LHSVs in the microreactor vary
from 26 to 234 h�1. The ethanol concentration in the feed is
ene and of diethyl ether over three different catalysts filled in microchannel chip.
93.8 wt% C2H5OH for TiO2 doped g-Al2O3.
Page 6
Fig. 8. Ethanol conversion and ethylene and diethyl ether selectivity vs. LHSV and Tr over 10 wt% Ti/g-Al2O3 catalyst (93.8 wt% ethanol in feed).
G. Chen et al. / Catalysis Today 125 (2007) 111–119116
93.8 wt%. The liquid hourly space velocities in the traditional
fixed bed reactor are as low as 0.2–0.4 h�1 due to the heat
transfer and intrinsic reaction rate limitations. Heat and mass
transfer is enhanced remarkably with its inherent small
dimensions of microreactor, whereas the process is controlled
by the reaction rate due to its slow intrinsic reaction rate of
ethanol catalytic dehydration to ethylene. High reaction
temperatures are needed to enhance the reaction rate at high
LHSVs, and finally to achieve the process intensification and
process miniaturization purposes.
The results in Fig. 8(1) indicate that the ethanol conversion
and the ethylene selectivity decreased with rising spacevelocities
but the selectivity of diethyl ether behaved in the opposite way.
The conversion of ethanol is higher than 98% and the selectivity
of ethylene is not less than 97%, SDEE < 1% at the LHSV of
Table 2
Comparison between the microreactor and traditional fixed bed reactor
Reactor Catalyst Tr (8C) WH
SD Co. Fixed bed Syndol 318–450 0.2
This work Micoreactor Ti/g-Al2O3 360–500 2
a LHSV.
156 h�1 and the reaction temperature of 500 8C. Fig. 8(2) and (3)
shows that the minimum reaction temperatures are 440, 460 and
480 8C corresponding to the LHSVs of 26, 52 and 104 h�1 with
the ethanol conversion above 99%, respectively. Under the
LHSVof 104 h�1, the ethanol conversions are as high as 92% and
96% at the reaction temperatures of 460 and 480 8C, respectively,
corresponding to the yields of ethylene of 66.6 and 72.7 gC2H4/
(gcat h). It can be inferred from the results that the microreactor
can intensify mass transfer to realize the miniaturization of the
bioethanol-to-ethylene process.
Table 2 lists the comparison results between the micro-
reactor and the traditional fixed bed reactor. From this table we
can find that for the process of ethanol-to-ethylene, the ethylene
yield in the microreaction system is 1–2 orders of magnitude
higher than that of the traditional fixed bed reactor.
SV (h�1) XEtOH (mol%) SE (mol%) YE (g/(gcat h))
3–1.17 97–99 94.5–98.9 0.22–0.67
6–104a 95–99.96 96–99.34 15–72.7
Page 7
Fig. 9. Effect of feed composition; 10 wt% Ti/g-Al2O3 catalyst, LHSV = 39 h�1, and p = 110–134 kPa.
G. Chen et al. / Catalysis Today 125 (2007) 111–119 117
3.3.3. Effect of ethanol concentration on conversion and
selectivity
The concentration of bioethanol from fermentation synthesis
is about 10 wt%, which contains large amount of water. In order
to simplify the condensation process of bioethanol, it is
necessary to develop processing techniques with flexibilities, in
other words, to take the effect of water in ethanol solution on
conversions and selectivities into account. The effects of the
ethanol concentration on the ethanol conversion and the
ethylene selectivity over 10 wt% Ti/g-Al2O3 catalyst are shown
in Fig. 9 and Table 3.
In Fig. 9, at a given space velocity and a reaction
temperature, the conversion of ethanol decreases with the
decreasing concentration of ethanol in the feed, especially
when the temperatures are lower than 380 8C. The selectivity of
ethylene increases with decreasing ethanol concentration,
while the selectivity of ethyl ether is on the contrary. This may
be because L-acid shifts to B-acid more easily on g-Al2O3 due
to increased water concentration that leads to decreased
Table 3
Gaseous phase products under different ethanol concentrations of feed (T = 440 8C
EtOH
(wt%)
Qgas
(mL/min)
Composition in gaseous phase (mol%)
C2H6 C2H4 C3
12 47 0.40 99.55 0.05
30 103 0.25 99.6 0.13
50 170 0.19 99.5 0.24
70 227 0.24 99.15 0.40
93.8 281 0.23 99.0 0.41
alumina basicity and dehydration activities at the one hand. At
the other hand, competitive adsorption of water and ethanol on
the active sites of the catalyst surface as proposed in reference
[4]. But if the reaction temperatures are higher than 420 8C, the
effects of water concentration in feed on the conversion and the
selectivity would be weak. At the reaction temperature of
440 8C, the ethanol conversion, the ethylene selectivity and the
ethylene yield are higher than 99.7%, 98.6% and 98.3%,
respectively. The results listed in Table 3 indicate that the
ethylene concentrations in gaseous phase are higher than
99 mol%. Additionally, the selectivities of C3 and C4 also
decrease quickly with decreasing ethanol concentrations. From
the process and system engineering view, the energy saving
should be taken into account, there exists an optimal ethanol
concentration of 30–50 wt% in feed.
3.3.4. Effect of calcination temperature
The ethanol catalytic dehydration on alumina is through
Lewis acid and base pairs, where aluminum with empty orbit
and LHSV = 52 h�1)
XEtOH
(mol%)
SE
(mol%)
YE
(g/(gcat h))C4 DEE
0 0 99.7 99.2 4.4
0.01 0 99.9 99.3 9.8
0.04 0 99.8 99.2 16.0
0.12 0.01 99.7 98.8 21.2
0.23 0.02 99.7 98.6 26.1
Page 8
Fig. 10. The effect of calcination temperature; 93.8 wt% ethanol in feed,
LHSV = 52 h�1, Tr = 420 8C, and p = 110–130 kPa.
Fig. 11. The life-time of 10 wt% Ti/g-Al2O3 catalyst. Reaction temperature:
410–450 8C, LHSV = 26 h�1, and ethanol concentration: 93.8 wt%.
G. Chen et al. / Catalysis Today 125 (2007) 111–119118
can act as an acid. The acid quantities and strengths on the
surface have direct influence on the reaction stability: large
amount of B-acid on surface can deactivate catalyst very
quickly due to the adsorption of ethylene that can form
polymers, and strong B-acid makes it difficult to control
reaction temperatures at the early stage of the reaction process.
Alumina only has Lewis acid sites, and the high calcination
temperature leads to low concentrations of surface hydroxyl
that affects the reaction through the carbon cation mechanism
[33], so as to decrease catalyst activities. Fig. 10 shows the
relationship of the conversion and the selectivity versus the
calcination temperature of Ti/g-Al2O3 catalysts prepared in
different ways. The optimal calcination temperature are in the
ranges of 400–500 8C.
3.3.5. Catalyst stability
Fig. 11 shows that the life-time testing curve at LHSV of
26 h�1 and 93.8 wt% ethanol solution. The catalyst deactivates
gradually, so the reaction temperature would be increased
stepwise to maintain the ethanol conversion above 98%. In the
first 400 h of the catalyst stability test, the conversion of ethanol
is higher than 98% when reaction temperatures range from 410
to 430 8C. After 400 h, the catalyst deactivates very quickly,
which illuminates that it is necessary to improve the stability of
catalysts when the space velocity is 1–2 orders of magnitude
higher than a conventional fixed bed reactor.
4. Conclusions
Highly active and relatively stable TiO2/g-Al2O3 catalysts are
successfully incorporated into the microchannel plates in order to
investigate the feasibility of intensification and miniaturization
on the process of bioethanol-to-ethylene. Due to the small
characteristic dimensions of the microchannel reactor, the effect
of heat and mass transport is increased remarkably, and the trade-
off scheme between the reaction temperature and the space
velocity must be taken into consideration for the slow reactions.
The experimental results demonstrate that the catalysts doped
with 10 wt% TiO2 have high ethanol conversions, ethylene
selectivities and yields. The ethanol conversion of 99.96%,
ethylene selectivity of 99.4% and ethylene yield of 26 g/(gcat h)
can be achieved. There exist optimal ethanol concentrations of
30–50 wt% and optimal calcination temperatures of 400–
500 8C. The miniaturization of the bioethanol-to-ethylene
process can be achieved with a microchannel reactor.
Acknowledgements
We gratefully acknowledge the financial supports for this
project from National Natural Science Foundation of China and
China National Petroleum Corporation (nos. 20176057 and
20490208), 863 project (2006AA020101) and KIP program of
Chinese Academy of Sciences (KSCX2-YW-G-003).
References
[1] Y.L. Wu, S.J. Marwil, US Patent 4,234,752 (1980).
[2] T.K. Shioyama, US Patent 4,260,845 (1981).
[3] N.K. Kochar, R. Merims, A.S. Padia, CEP 77 (6) (1981) 66–70.
[4] S. Golay, R. Doepper, A. Renken, Chem. Eng. Sci. 54 (1999) 4469–4474.
[5] R.L. van Mao, T.M. Nguyen, G.P. Mclaughlin, Appl. Catal. 48 (1989)
265–277.
[6] X. Gao, I.E. Wachs, Catal. Today 51 (1999) 233–254.
[7] J.I. Di Cosimo, V.K. Dıez, M. Xu, E. Iglesia, C.R. Apesteguıai, J. Catal.
178 (2) (1998) 499–510.
[8] T. Zaki, J. Colloid Interf. Sci. 284 (2005) 606–613.
[9] P. Berteau, B. Delmon, Catal. Today 5 (1989) 121–137.
[10] G.A. El-Shobaky, M.M. Doheim, A.M. Ghozza, H.A. El-Boohy, Mater.
Lett. 57 (2002) 525–531.
[11] B.M. Abu-Zied, A.M. El-Awad, J. Mol. Catal. A 176 (2001) 227–246.
[12] B. Wan, S. Cheng, R.G. Anthony, A. Clearfield, J. Chem. Soc., Faraday
Trans. 87 (9) (1991) 1419–1424.
[13] J. Haber, K. Pamin, L. Matachowski, B. Napruszewska, J. Poltowicz, J.
Catal. 207 (2002) 296–306.
[14] E.A. El-Katatny, S.A. Halawy, M.A. Mohamed, M.I. Zaki, Appl. Catal. A
199 (2000) 83–92.
[15] M.M. Doheim, S.A. Hanafy, G.A. EI-Shobaky, Mater. Lett. 55 (2002)
304–311.
[16] K. Jahnisch, V. Hessel, H. Lowe, M. Baerns, Angew. Chem. Int. Ed. 43
(2004) 406.
[17] G. Kolb, V. Hessel, Chem. Eng. J. 98 (1–2) (2004) 1–38.
[18] G.W. Chen, Q. Yuan, J. Chem. Ind. Eng. (Chin.) 54 (4) (2003) 427–439.
[19] J. Kobayashi, Y. Mori, K. Okamoto, R. Akiyama, M. Ueno, T. Kitamori, S.
Kobayashi, Science 304 (2004) 1305–1308.
Page 9
G. Chen et al. / Catalysis Today 125 (2007) 111–119 119
[20] E.V. Rebrov, M.H.J.M. de Croon, J.C. Schouten, Catal. Today 69 (2001)
183–192.
[21] B. Cao, G.W. Chen, Q. Yuan, J. Chem. Ind. Eng. (Chin.) 55 (1) (2004) 42–
47.
[22] J.D. Holladay, Y. Wang, E. Jones, Chem. Rev. 104 (2004) 4767–4790.
[23] G.W. Chen, Q. Yuan, H.Q. Li, S.L. Li, Chem. Eng. J. 101 (1–3) (2004)
101–106.
[24] S.L. Li, G.W. Chen, F.J. Jiao, H.Q. Li, Chin. J. Catal. 25 (12) (2004) 979–
982.
[25] H. Ge, G.W. Chen, Q. Yuan, H.Q. Li, Catal. Today 110 (2005) 171–178.
[26] H. Kestenbaum, A.L. de Oliveira, W. Schmidt, F. Schuth, W. Ehrfeld, K.
Gebauer, H. Lowe, T. Richter, D. Lebiedz, I. Untiedt, H. Zuchner, Ind.
Eng. Chem. Res. 41 (4) (2002) 710–719.
[27] R.M. Tiggelaar, P.W.H. Loeters, P. van Male, R.E. Oosterbroek, J.G.E.
Gardeniers, M.H.J.M. de Croon, J.C. Schouten, M.C. Elwenspoek, A. van
den Berg, Sens. Actuators A 112 (2004) 267–277.
[28] G.W. Chen, S.L. Li, Q. Yuan, Catal. Today 120 (2007) 63–70.
[29] M.R. Basila, T.R. Kantner, K.H. Rhee, J. Phys. Chem. 68 (1964) 3197–3203.
[30] K. Tanabe, Solid Acids and Bases – Their catalytic Properties, (in Chinese,
Translated by Junsheng Zhao, Jiayu Zhang), Chem. Ind. Press, Beijing,
1979.
[31] E. Rodenas, T. Yamaguchi, H. Hattori, K. Tanabe, J. Catal. 69 (1981) 434–
444.
[32] H. Arai, J. Take, Y. Saito, Y. Yoneda, J. Catal. 9 (1967) 146–153.
[33] V. Bosacek, V. Patzelova, C. Hybl, Z. Tvaruzkova, J. Catal. 36 (3) (1975)
371–378.