HAL Id: tel-01770411 https://tel.archives-ouvertes.fr/tel-01770411 Submitted on 19 Apr 2018 HAL is a multi-disciplinary open access archive for the deposit and dissemination of sci- entific research documents, whether they are pub- lished or not. The documents may come from teaching and research institutions in France or abroad, or from public or private research centers. L’archive ouverte pluridisciplinaire HAL, est destinée au dépôt et à la diffusion de documents scientifiques de niveau recherche, publiés ou non, émanant des établissements d’enseignement et de recherche français ou étrangers, des laboratoires publics ou privés. Catalytical reactions and environmental chemistry modifications as seen by synchrotron radiation NAP-XPS Anthony Boucly To cite this version: Anthony Boucly. Catalytical reactions and environmental chemistry modifications as seen by syn- chrotron radiation NAP-XPS. Analytical chemistry. Université Pierre et Marie Curie - Paris VI, 2017. English. NNT : 2017PA066237. tel-01770411
Transcript
HAL Id: tel-01770411https://tel.archives-ouvertes.fr/tel-01770411
Submitted on 19 Apr 2018
HAL is a multi-disciplinary open accessarchive for the deposit and dissemination of sci-entific research documents, whether they are pub-lished or not. The documents may come fromteaching and research institutions in France orabroad, or from public or private research centers.
L’archive ouverte pluridisciplinaire HAL, estdestinée au dépôt et à la diffusion de documentsscientifiques de niveau recherche, publiés ou non,émanant des établissements d’enseignement et derecherche français ou étrangers, des laboratoirespublics ou privés.
Catalytical reactions and environmental chemistrymodifications as seen by synchrotron radiation
NAP-XPSAnthony Boucly
To cite this version:Anthony Boucly. Catalytical reactions and environmental chemistry modifications as seen by syn-chrotron radiation NAP-XPS. Analytical chemistry. Université Pierre et Marie Curie - Paris VI,2017. English. �NNT : 2017PA066237�. �tel-01770411�
Yet we thought that combining the beneficial effect of biasing the sample and
putting a 1 mbar pressure of argon could further increased the discharge at the
sample surface This gas was chosen as it has the highest cross section of all the
neutral gas (N2, Ne…) at our working excitation energy with its 2p core level having
0.3 Mbarn68 at ℎ =750 eV while Ne has its maximum cross section for its 2s orbital
with a value of 0.02 Mbarn.68 For nitrogen the maximum cross section is for its 1 s
orbital with 0.155 Mbarn.68 Having a high cross section is important for our goal as it
directly determine the quantity of secondary electron produce in the gas phase.
Indeed the cross section describes the probability for an electron at a given orbital to
be ionized by a photon at a given energy. Thus the higher cross section means a
higher yield of electron emitted inside the gas phase. It was shown by Mueller et al.69
that being above or under the O 1s edge has an effect on the attenuation of the
incident photon beam with the beam being more attenuated above the O 1s edge
meaning a stronger creation of electrons from oxygen element in the gas phase.
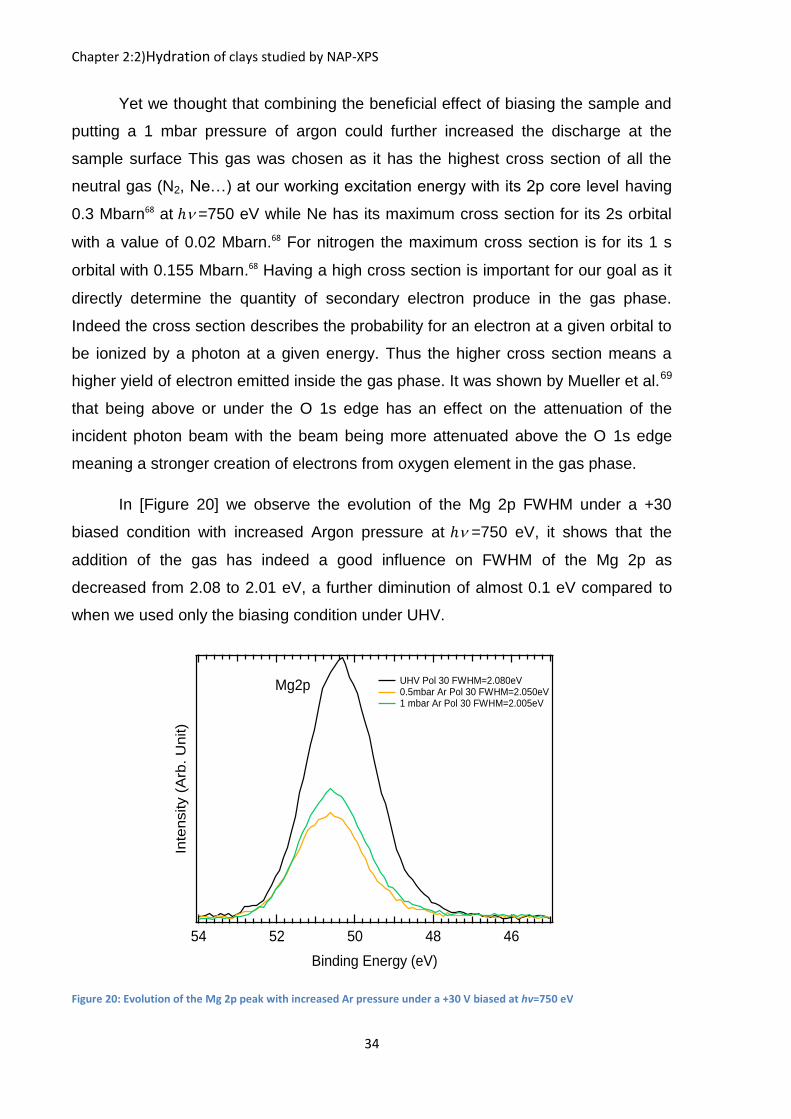
In [Figure 20] we observe the evolution of the Mg 2p FWHM under a +30
biased condition with increased Argon pressure at ℎ =750 eV, it shows that the
addition of the gas has indeed a good influence on FWHM of the Mg 2p as
decreased from 2.08 to 2.01 eV, a further diminution of almost 0.1 eV compared to
when we used only the biasing condition under UHV.
Figure 20: Evolution of the Mg 2p peak with increased Ar pressure under a +30 V biased at hv=750 eV
Inte
nsity (
Arb
. U
nit)
54 52 50 48 46
Binding Energy (eV)
UHV Pol 30 FWHM=2.080eV 0.5mbar Ar Pol 30 FWHM=2.050eV 1 mbar Ar Pol 30 FWHM=2.005eV
Mg2p
Chapter 2:2)Hydration of clays studied by NAP-XPS
35
Thus our recipe for diminishing charging effect which is applied on our
strontium sample is:
Use a +30 V biased on the sample
Insert 1 mbar of Argon
This is mostly done in order to obtain a good UHV spectrum, for the following
spectrum with increased water pressure no additional partial pressure of neutral gas
was added in order to read the absolute pressure value of water on the gauge. Yet
as seen the effect of biasing alone should be sufficient to obtain good charging effect
reduction at low water pressure.
2.c) Hydration of clays
In this part we will follow the hydration of hectorite and saponite clays starting
by the cesium counterion (the smallest enthalpy hydration) then clays with sodium as
a counterion (highest hydration enthalpy of monovalent cation) and we will finish with
the strontium counterion (Divalent cation) where we try to minimize the charging
effect.
2.c.1) Cs+ samples
We will start by analyzing the Cs 4d spectrum of the Cs+-hectorite sample
shown in [Figure 21]. On the left of the figure is display the Cs 4d core level aligned
with the reference peak Mg 2p display on the right at a fixed position of 50.4
eV±0.2eV.
Chapter 2:2)Hydration of clays studied by NAP-XPS
36
Figure 21: Evolution of the Cs 4d core level peak binding aligned with Mg 2p as a function of the pressure and relative humidity for the hectorite sample at hv=750 eV. Fitting lines are shown in red
The UHV and lower pressure spectrum are not shown due to strong charging
effect. The charging is sufficiently diminished at 1.2 mbar (RH=17%) and the
spectrum are exploitable. The Cs 4d is fitted with one doublet separated by 2.3 eV
and an intensity ratio of 2/3 between the 4d3/5 component (smallest on the left) and
the 4d5/2 component (the most intense one on right). The 5/2 component starts at a
position of 76.1 eV (at a distance of 25.7 eV from Mg 2p). For an easier positioning
of the peak, Mg 2p was fitted with a single Gaussian. From 17% to 67% relative
humidity there is no change in the spectrum except for the signal attenuation due to
the gas phase. It is only at a high relative humidity (83%) that we see an evolution in
the Cs 4d peak, as it shifts by 0.2 eV towards higher binding energy (no liquid water
droplets are yet formed). This indicates that in hectorite, cesium feels the presence
of water only when the condensation pressure is near. This is not surprising as
cesium has difficulty to form its first hydration sphere and most certainly forms an
inner sphere surface complex. When macroscopic droplets of water are formed at
the sample surface (relative humidity of 100 %) [Figure 22], the shift relative to Mg
2p still increases for a total shift of 0.35 eV. However if we keep increasing the water
pressure beyond RH=100% there is no other shift. Surface sensitive condition
(ℎ =400 eV, see appendix A.1) does not show a single shift but the signal of the
Inte
nsity (
Arb
. U
nits)
54 52 50 48
Binding Energy (eV)
82 80 78 76 74 72
m
hv=750 eV
1,2mbar RH=17%
2,4mbar RH=34%
3,6mbar RH=50%
4,8mbar RH=67%
6mbar RH=83%
7,2mbar RH=100%
8,4mbar
Evolution of hectorite Cs4d core level binding energy with increase water pressure
Cs 4d
Mg 2p
T=275 KShift:0.35eV
X2
Chapter 2:2)Hydration of clays studied by NAP-XPS
37
clay is lost quickly (RH=68%) due to the increased pressure and attenuation of the
signal.
Figure 22: Image of the Cs+
-hectorite sample at 7.2 mbar (RH=100%) with water beads up on its surface
The variation of the Si 2p peak with respect to Mg 2p as shown in [Figure 23]
is also worth studying as a function of relative humidity. The Si 2p peak is fitted with
a doublet separated by 0.6 eV and an intensity ratio of 1/2 between the Si 2p1/2
component and the Si 2p3/2 component. In fact, we observe the same relative shift in
binding energy as seen for the Cs 4d spectrum. This shift of 0.35 eV happens at the
same relative humidity (83%) as for Cs 4d. As silicon lies inside the tetrahedral
sheets which are at the surface of the sample, it indicates that both silicon and
cesium share the same evolution of their chemical environment. This may be the
indication of the formation of the inner-sphere surface complex.48
Figure 23: Evolution of the Si 2p core level peak binding energy as a function of the pressure and relative humidity for
the Cs+
-hectorite sample. Fitting lines are shown in red
Inte
nsity (
Arb
. U
nits)
108 106 104 102 100 98
Binding Energy (eV)
hv=750 eV
1,2mbar RH=17%
2,4mbar RH=33%
3,6mbar RH=50%
4,8mbar RH=67%
6mbar RH=83%
7,2mbar RH=100%
8,4mbar
Evolution of Si2p core level binding energy with increase water pressure
T=275 K
X5
X3
X1.5
Si 2p
Chapter 2:2)Hydration of clays studied by NAP-XPS
38
We will now consider the Cs+-saponite sample. In this sample, the Cs 4d
signal overlaps with the Al 2p peak (Al substitutes Si in the tetrahedral sheets [Figure
24]. Yet the Cs 4d3/2 component is still undisturbed allowing us to follow the shift of
the Cs 4d peaks. Like with the previous sample (Cs+-hectorite), the lower pressure
spectra are not available due to the strong differential charging effect and we
observe a shift of 0.3 eV towards higher binding energy. As well as for hectorite the
shift starts to occur only at high relative humidity (83%). This means that the
negative charge location in the lath (octahedral substitution for hectorite vs
tetrahedral substitution for saponite) does not have any remarkable impact on
cesium hydration. Also in surface sensitive condition (Appendix A.2) there does not
seem to be a shift but the signal is overall low.
Figure 24: Evolution of the Cs 4d core level peak binding energy as a function of the pressure and relative humidity for the saponite sample. Fitting lines are shown in red
Moreover we also observe the same shift on the Si 2p peaks [Figure 25] as for
hectorite. This suggests that cesium and silicon share the same environment, also in
saponite. For both clays, hydration occurs while cesium stays clung to the surface of
the clay forming an inner sphere surface complex.
Inte
nsity (
Arb
. U
nits)
54 52 50 48
Binding Energy (eV)
80 78 76 74 72
hv=750 eV
1,2mbar RH=17%
2,5mbar RH=35%
4,5mbar RH=63%
6mbar RH=83%
8mbar RH=100%
Mg 2p
Cs 4d3/2
Cs 4d5/2+Al 2p
Evolution of saponite Cs4d core level binding energy with increase water pressure
T=275 K
Shift:0.3eV
X1.5
X5
X5
X8
X1.5
X3
X4
X5
Chapter 2:2)Hydration of clays studied by NAP-XPS
39
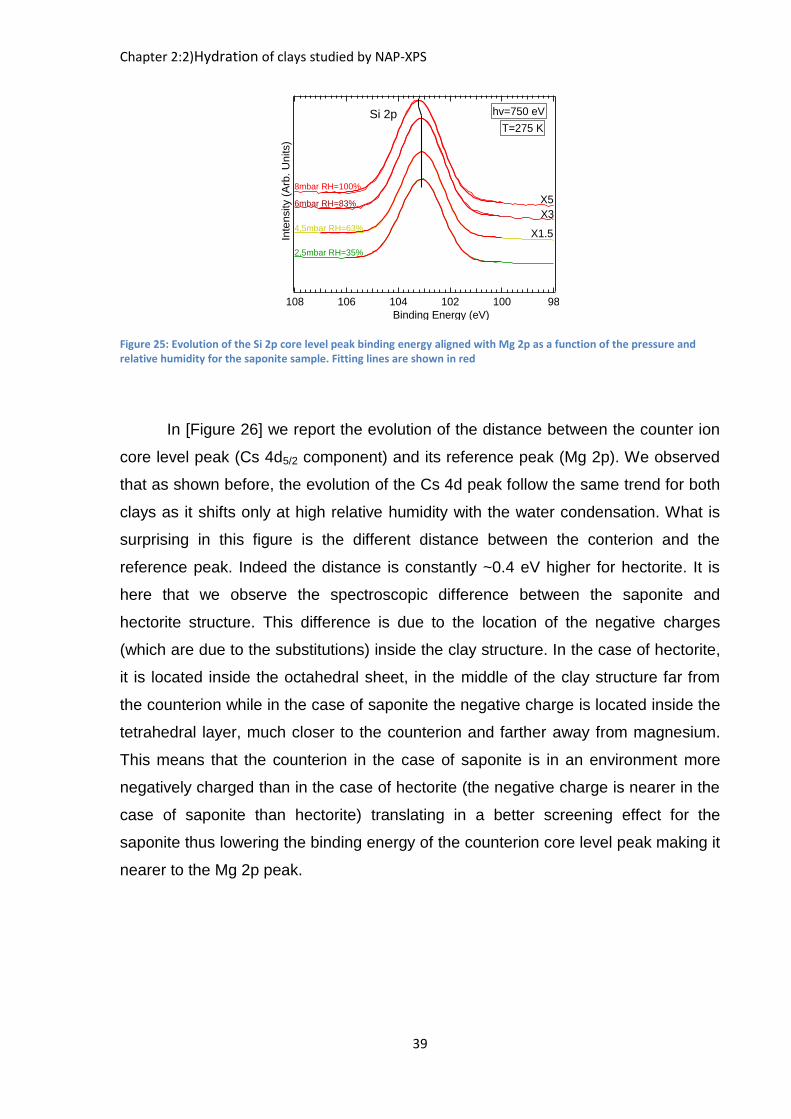
Figure 25: Evolution of the Si 2p core level peak binding energy aligned with Mg 2p as a function of the pressure and relative humidity for the saponite sample. Fitting lines are shown in red
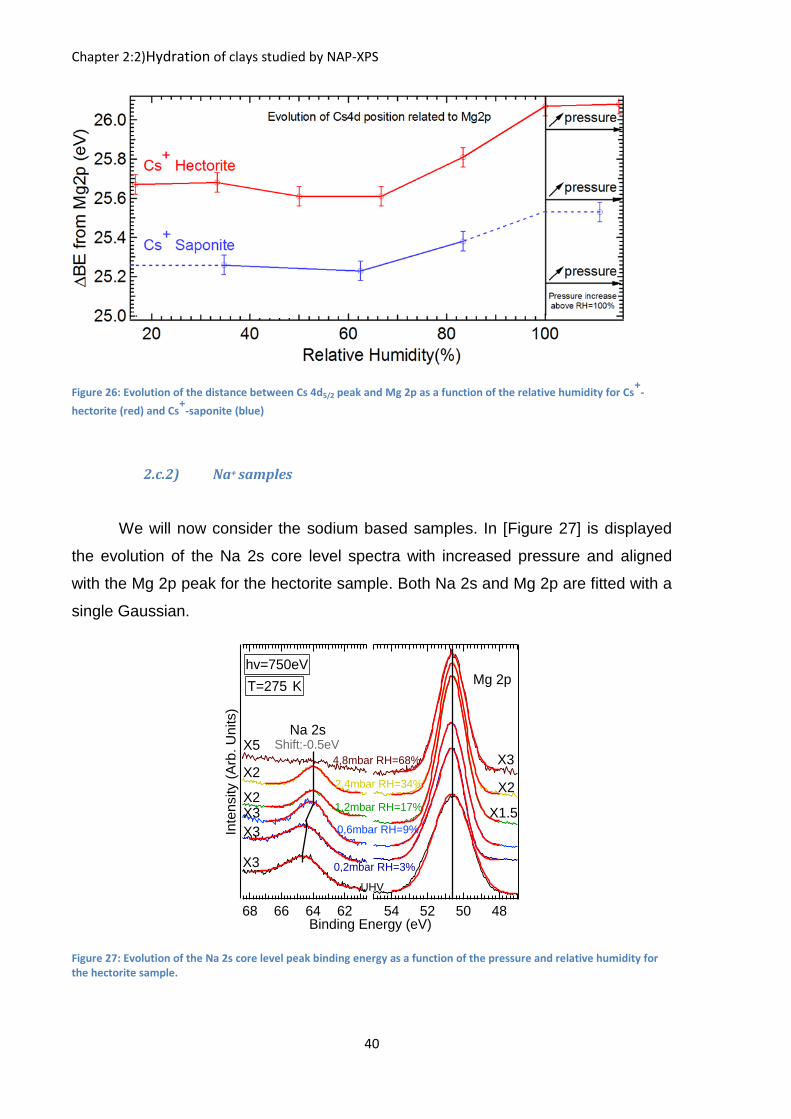
In [Figure 26] we report the evolution of the distance between the counter ion
core level peak (Cs 4d5/2 component) and its reference peak (Mg 2p). We observed
that as shown before, the evolution of the Cs 4d peak follow the same trend for both
clays as it shifts only at high relative humidity with the water condensation. What is
surprising in this figure is the different distance between the conterion and the
reference peak. Indeed the distance is constantly ~0.4 eV higher for hectorite. It is
here that we observe the spectroscopic difference between the saponite and
hectorite structure. This difference is due to the location of the negative charges
(which are due to the substitutions) inside the clay structure. In the case of hectorite,
it is located inside the octahedral sheet, in the middle of the clay structure far from
the counterion while in the case of saponite the negative charge is located inside the
tetrahedral layer, much closer to the counterion and farther away from magnesium.
This means that the counterion in the case of saponite is in an environment more
negatively charged than in the case of hectorite (the negative charge is nearer in the
case of saponite than hectorite) translating in a better screening effect for the
saponite thus lowering the binding energy of the counterion core level peak making it
nearer to the Mg 2p peak.
Inte
nsity (
Arb
. U
nits)
108 106 104 102 100 98
Binding Energy (eV)
hv=750 eV
1,2mbar RH=20%
2,5mbar RH=35%
4,5mbar RH=63%
6mbar RH=83%
8mbar RH=100%
Evolution of saponite Si2p core level binding energy with increase water pressure
T=275 K
X5
X3
X1.5
Si 2p
Chapter 2:2)Hydration of clays studied by NAP-XPS
40
Figure 26: Evolution of the distance between Cs 4d5/2 peak and Mg 2p as a function of the relative humidity for Cs+
-
hectorite (red) and Cs+
-saponite (blue)
2.c.2) Na+ samples
We will now consider the sodium based samples. In [Figure 27] is displayed
the evolution of the Na 2s core level spectra with increased pressure and aligned
with the Mg 2p peak for the hectorite sample. Both Na 2s and Mg 2p are fitted with a
single Gaussian.
Figure 27: Evolution of the Na 2s core level peak binding energy as a function of the pressure and relative humidity for the hectorite sample.
Inte
nsity (
Arb
. U
nits)
54 52 50 48Binding Energy (eV)
68 66 64 62
hv=750eVMg 2p
Na 2s
4,8mbar RH=68%
2,4mbar RH=34%
1,2mbar RH=17%
0,6mbar RH=9%
UHV
0,2mbar RH=3%
Evolution of the Hectorite Na2s core level binding energy with increase water pressure
T=275°K
Shift:-0.5eV
X3
X2
X1.5
X3
X3
X2
X5
X2X3
Chapter 2:2)Hydration of clays studied by NAP-XPS
41
The binding energy shift of this small Na+ counterion is notably different from
that observed in Cs+-hectorite. Indeed, the sodium shifts of 0.5 eV towards lower
binding energy at low relative humidity (between 0 and 17%). This shift occurs at the
pressure range where we expect sodium to form its first hydration sphere.52,53
Moreover it was shown by Winter et al70 that when an ion hydrates it should have its
core level peaks shift to lower binding energy. This shift is also visible on surface
sensitive conditions (Appendix A.3).
Interestingly the sodium signal disappears when a pressure of 4.8 mbar is
reached, corresponding to a relative humidity of 68 %. This disappearance of the
signal happens when we expect sodium to form its second hydration sphere. 52,53
With its second hydration sphere formed sodium is now more mobile than cesium.71
At the time of writing the reason why this happens is not fully understood. We can
propose various conjectures:
Being mobile we suspect that sodium migrate laterally out of the X-ray
spot zone due to the charging effect creating a repulsive electrical field
(the center of the irradiated zone is more positively charged than the
periphery). This can be called lateral charging effect. The potential drop
would be of a few hundreds of meV over the typical of the beam (0.1
mm). The associated electric field should be of the order of 10 V/cm. Is
it sufficient to drag the sodium ion out? We indeed observe with the
widening of the FWHM of Mg 2p (going from 1.65 eV at 2.4 mbar to
1.79 eV at 4.8 mbar) that the charging effect has increased (see Table
3). It should be noted that this increase might be a consequence of the
sodium disappearance as with the loss of a conductive species in the
sample makes it less conductive thus increasing the charging. It is
possible that even at those high gas pressures, the charging effect are
not fully mitigated and are sufficient to force a migration of sodium.
Chapter 2:2)Hydration of clays studied by NAP-XPS
42
Relative Humidity FWHM (eV)
0 (UHV) 2.4
3% 2
9% 1.78
17% 1.77
34% 1.65
68% 1.79
Table 3: Evolution of the Mg 2p FWHM with increased RH for the Na+-hectorite sample
The same effect but in depth. Due to the escape depth (~1 nm) of the
photoelectrons and Auger electrons generated by the spot and their
emission in the gas phase, the surface layer should be more charged
than the inner layers. The resulting electric field would of ~106 V/cm.
This is likely sufficient to drag the ions down to the bulk of the clay
deposit. Na 2s spectra measured at 1050 eV [Figure 28] show that the
species does not disappear at this depth. Moreover, the Mg 2p FWHM
is lower at this higher excitation energy (1.68 eV vs 1.79 eV for ℎ =750
eV) indicating that the charging effect is less important. Based on the
IMFP of MgO and SiO272 we can estimate that the increased probing
depth is around 6Å
Figure 28: Na 2s core level peak binding energy at hv=1050 eV for RH=68% and 100% for the hectorite sample
Inte
nsity (
Arb
. U
nits)
54 52 50 48d
68 66 64 62Binding Energy (eV)
RH=68%
RH=100%
Na 2s
Mg 2phv= 1050 eVT=275 K
Chapter 2:2)Hydration of clays studied by NAP-XPS
43
A radiolytic effect that leads to the formation of H+ (H3O+) and the
replacement of the sodium ions. As discussed at length in the
mineralization of pyridine section, we have averted radiolytic effects
that lead to the mineralization of an organic species, pyridine. Valence
holes and electrons are generated by the photoelectrons and Auger
electrons produced by the X-ray and travelling in the clay. Holes can
react with water to give H+ and the hydroxide radical. H+ would replace
Na+ if the latter is sufficiently mobile. (On the other hand, electrons can
react with water to give OH- and H radicals.) However, it seems that
the 2W hydration state is not the most favorable one to ensure the
breaking of the water molecule, when compared to the 1W one.73
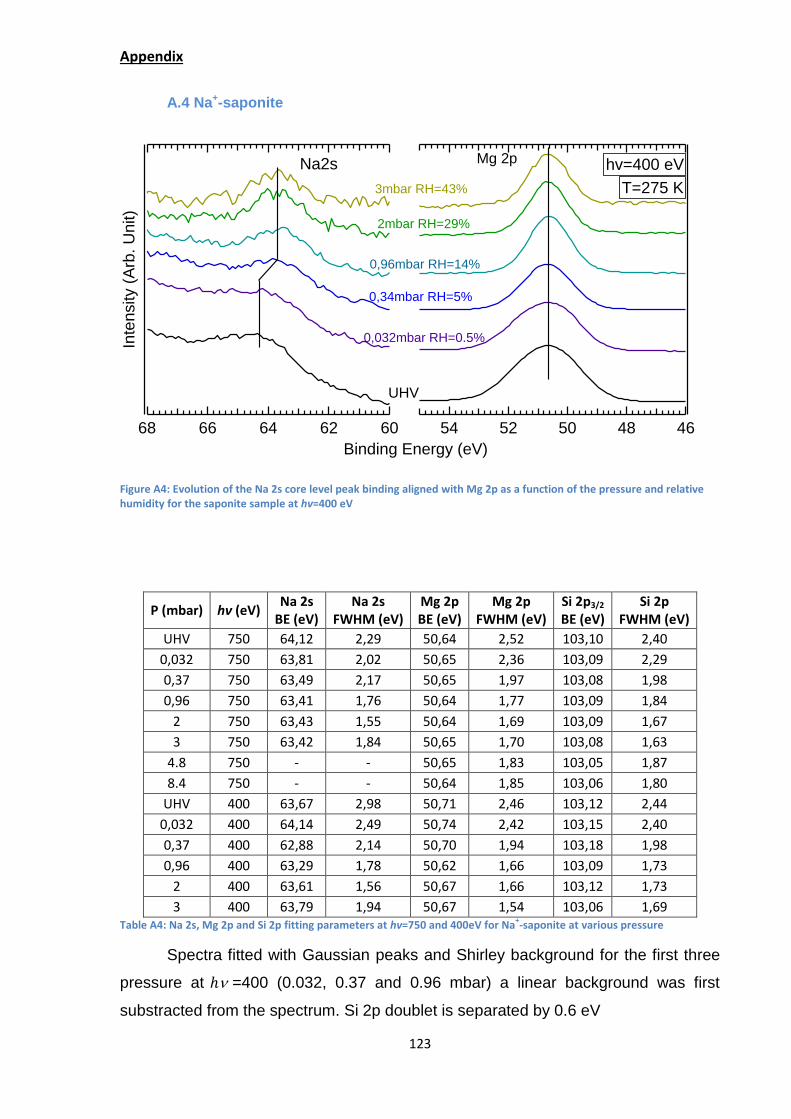
The behavior of the saponite sample is very similar to that of the hectorite for
the Na 2s core level [Figure 29]. We observe a shift of 0.7 eV towards lower binding
at a low relative humidity (0-14%) which is also visible in surface sensitive conditions
(Appendix A.4) and the loss of signal at 4.8 mbar (RH=68%). It confirms the data
obtained with hectorite. Here the shift and disappearance of signal also occurs when
sodium should form its first (shift) and second hydration sphere (lost signal).33,41,53
Figure 29: Evolution of the Na 2s core level peak binding energy as a function of the pressure and relative humidity for the saponite sample
Inte
nsity (
Arb
. U
nits)
54 52 50 48Binding Energy (eV)
68 66 64 62
UHV
0,032mbar
RH=0.5%
0,34mbar RH=5%
0,96mbar RH=14%
2mbar RH=29%
3mbar RH=43%
4,8mbarRH=68%
Na 2s
Evolution of saponite Na2s core level binding energy with increase water pressure
hv=750 eV
T=275°K
Shift:-0.7eV
X3
X3X3X3X3
X10
X50
Mg 2p
X14
X5
X3
X2
Chapter 2:2)Hydration of clays studied by NAP-XPS
44
Moreover when we consider the evolution of the Na/Mg intensity ratio [Figure
30] compared to the Si/Mg we noticed that the first one see an evolution at low
relative humidity until it stabilizes before the signal of the sodium is lost while the
Si/Mg ratio is stable throughout the experiment. The increase of the Na intensity
signal maybe link to the reduction of the charging effect inside the sample as the
pressure increases, making the sodium peak sharper and thus more easily
distinguished from the background signal resulting in an increase of the signal while
the Mg and Si peak being already intense do not show such an improvement. Here
the question is whether the signal attenuation due to the increasing gas pressure
and perhaps also water adsorption at the surface is sufficient to lose the Na signal
because it is not within the detection limit anymore. Here the answer is no, the ratio
Si/Mg does not change so Na/Mg should also not have changed. Moreover if we
consider the Na 2s intensity (by judging with the diminution of the Mg 2p intensity)
that it should have at higher RH, we would still get a signal ten times higher than the
one recorded at ℎ =1050 eV [Figure 28] which is still visible. Thus the
disappearance of the sodium signal cannot be explained by the signal being lost due
to the attenuation.
Figure 30:Evolution of the the Na/Mg ratio as a function of the relative humidity for Na+-hectorite (red) and Na+-saponite (blue)
Another question that arises is if the sodium reappears after pumping. In fact
the scan after pumping shows no sign of sodium being back but the signals of all the
structure components are low due to a strong carbon contamination and the shape
of the spectra is distorted by strong differential charging effect. The excess of carbon
0.14
0.12
0.10
0.08
0.06
0.04
0.02
0.00
Ratio N
a/M
g
100806040200Relative Humidity (%)
Signal Lost
Chapter 2:2)Hydration of clays studied by NAP-XPS
45
comes from chamber and are brought on top of the sample by the water; this creates
a strong layer of contamination when water is pump out that we have to go through
before probing the clay. The strong differential charging effect is due to having less
uniformed sample at the end of the experiment compared to starting condition. The
samples are prepared with a slow evaporation of the water droplets containing Clays
in order to allow a good organization of layered stacks. In our experiment when we
pump out, the water is desorbed quickly from the interlayer space leading to an
unorganized collapse of clays stack. Moreover we have found that the following
experiment have traces of clay contamination indicating that some clay layers are
torn away from the sample while pumping out. This is mostly visible in the form of a
silicon peak being present.
This time compared to the Cs+ based samples, the Si 2p does not follow the
counter ion CLS [Figure 31]. In the case of the Na+ based sample it does not shift at
all. This suggests that the sodium is being hydrated in the middle of the interlayer as
it is expected to do and does not stay clung at the clay surface.
Figure 31: Evolution of the Si 2p core level peak binding energy aligned with Mg 2p as a function of the pressure and relative humidity for the Na
+-saponite sample
When we look at the evolution of the distance between the counter ion core
level peak (Na 2s) and its reference peak (Mg 2p) in [Figure 32], we observe the
same different starting position between saponite and hectorite samples with
hectorite having a higher difference between the two peaks. Moreover the shift is
stronger in the case of the saponite. This might be related to the counterion being
Inte
nsity (
Arb
. U
nits)
108 106 104 102 100 98Binding Energy (eV)
UHV
0,032mbarRH=0.5%
0,34mbar RH=5%
0,96mbar RH=14%
2mbar RH=29%
3mbar RH=43%
4,8mbar RH=68%
Evolution of saponite Si2p core level binding energy with increase water pressure
hv=750 eV
T=275 K
X2
X3
X5
8,4mbar RH=100%
X20
Si 2p
Chapter 2:2)Hydration of clays studied by NAP-XPS
46
nearer to the negative charge in the case of saponite (and thus being more
electrostatically attracted) than in the case of hectorite. In the saponite, sodium
would see a more drastic environment change as it leaves the lath surface and goes
hydrated in the middle of the interlayer space.
Figure 32: Evolution of the distance between Na 2s peak and Mg 2p as a function of the relative humidity for Na+-
hectorite (red) and Na+-saponite (blue)
It is interesting that the sodium disappears long before the first droplet of liquid
water is formed at the sample surface [Figure 33].
Figure 33: Image of the sample when Na+
disappears from the XPS spectrum at RH=68 %
To sum up, the behavior of the sodium based element are much different than
those with cesium. We observe a shift to lower binding energy with the hydration of
sodium and the formation of its first hydration sphere in an outer shell complex in the
13.6
13.4
13.2
13.0
12.8
Dis
tance f
rom
Mg2p (
eV
)
50403020100RH(%)
Evolution of Na2s position related to Mg2p
Na Hectorite OH
Na Saponite OH
Chapter 2:2)Hydration of clays studied by NAP-XPS
47
middle of interlayer space and its disappearance certainly linked to a migration due
to charging effect still present inside the sample
2.c.3) Sr2+samples
With those last samples we have greatly improved the mitigation of the
charging effect that affects dramatically the core-level spectral shape in UHV by
applying a +30 V bias and by introducing a chemically neutral gas in the mbar range.
In this part the aim was to study a divalent cation, which is easily solvable yet
much bigger than sodium: strontium. Like with the precedent sample all peaks are
aligned with the Mg 2p peak. The strontium core level peak that was chosen to follow
by NAP-XPS is the Sr 3d peak. The peak is fitted with a Gaussian doublet separated
by 1.8 eV with a 2/3 ratio between the 3/2 and 5/2 component. In [Figure 34] is
displayed the evolution of Sr 3d binding at various RH for the saponite sample with
the UHV spectrum acquired under a pressure of 1 mbar of argon. All spectra have
been acquired under a +30 V biasing. We observe a single shift of 0.5 eV towards
lower binding energy between 2 and 15% of relative humidity. This shift certainly
indicates the formation of two water layer around cation. There are two possibilities
that can explain why there is a single shift. First it is possible that the sample was not
fully dehydrated and retains enough water for a partial first water and then when the
relative humidity is sufficiently high it forms its two water layer state. The second
possibility is that the saponite does not have a two-step hydration and forms
immediately its two hydration sphere. Moreover when we consider the behavior of
Ca2+-saponite (discussed previously) which has its two solvation sphere at RH=20%
and an unstable one water layer state below, it is possible that it is the same case for
the Sr2+-saponite and that it forms directly its two hydration sphere at low RH.
Chapter 2:2)Hydration of clays studied by NAP-XPS
48
Figure 34: Evolution of the Sr 3d core level peak binding energy as a function of the pressure and relative humidity for the saponite sample at hv=750 eV
Nevertheless that shift towards lower binding energy confirms the observation
made on the Na+ samples where a shift to lower binding energy indicates the
hydration of counterion. Yet here the counterion are still present on sample and does
not migrate like sodium while being hydrated showing the strong mobility of Na+
compared to the other counterion studied.
Concerning the Sr2+-hectorite sample unfortunately due to a misalignment of
the setup, the focal point is further away from the sample than in previous in
experiment limiting the max pressure at 3 mbar (RH=48%). The spectra acquired
under biased condition are shown in [Figure 35].
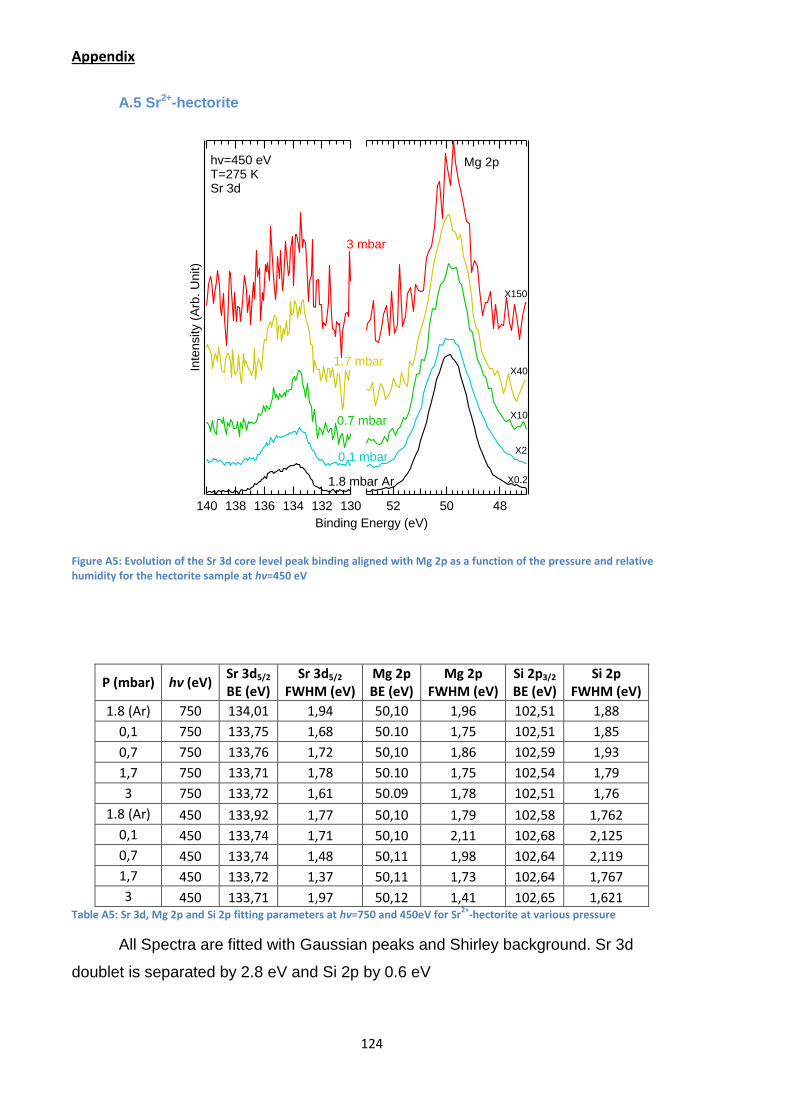
In this figure we observe a first shift of 0.3 eV towards lower binding energy as
soon as a water pressure is introduced. In surface sensitive conditions this shift is
also seen (Appendix A.5). As with the sodium sample this indicate the hydration of
the counterion where it certainly forms its first hydration sphere. A second small shift
of 0.15 eV seems to occurs at RH=48% indicating the formation of the second
hydration sphere as the Sr2+-hectorite should be in a two water layer state after
RH=43%.59 Yet the signal coming from the strontium (as well as the rest of the clay
element) is extremely low with a strong noise in background leading to a large
uncertainty about the width and position of the peaks.
Inte
nsity(A
rb. U
nit)
54 53 52 51 50 49 48 47140 138 136 134 132 130
Binding Energy (eV)
UHV
0.1 mbar RH=2%
0.7 mbar RH=15%
1.7 mbar RH=35%
3 mbar RH=63%
4.8mbar RH=100%
X5
X4
X8
X10
Mg2pSr3d
Chapter 2:2)Hydration of clays studied by NAP-XPS
49
Figure 35: Evolution of the Sr 3d core level peak binding energy as a function of the pressure and relative humidity for the hectorite sample
Concerning the Si 2p peak [Figure 36] the situation is similar than in the case
of sodium samples with no visible shift of the peak. Thus it is probable that the
strontium like the sodium forms an outer sphere surface complex and has no
interaction with the clay surface.
From this experiment we shown that the NAP-XPS is able to follow the
hydration of the counterions inside swelling clays and monitor the evolution of their
electronic environment. The hydration of sodium and strontium sample shows the
formation of the hydration sphere as a shift of the counterion core level to lower
binding energy. Moreover the loss of the sodium signal compared to the other
counterion shows its relatively high mobility. The case of cesium is more complex as
it never fully hydrates and forms an inner sphere complex with the clay surfaces
shown by a shift was towards higher binding energy showing of both cesium and
silicon.
Inte
nsity (
Arb
. U
nit)
52 50 48 Binding Energy (eV)
140 136 132
X80
X20
X6
X0.4
0.7 mbarRH=11%
1.7 mbarRH=27%
3 mbarRH=48%
hv=750 eVT=274 KSr 3d
UHV
hv=750 eVT=275 KSr 3d
Mg 2p
0.1 mbar RH=2%
Chapter 2:2)Hydration of clays studied by NAP-XPS
50
Figure 36: Evolution of the Si 2p core level peak binding energy aligned with Mg 2p as a function of the pressure and relative humidity for the saponite sample at hv=750 eV
2.c.4) Binding Energy Shift interpretation
As explained in chapter 1 the binding energy shift can be due to three factor,
Initial state, final state and changes in Fermi level position. As we do not have
observed changes in Fermi level position, this factor does not contribute to the
binding energy shift, leaving only to consider the initial and final state contribution.
The initial state factor is linked to the electrostatic potential felt by electron.
Our systems can be described as a stack of positive layer between negative charged
layers, and can be considered as a condenser. With the hydration of the cation, the
conductivity and the electrostatic fields of material change. Moreover with the
hydration, the swelling of clays occurs increasing the distance between the negative
layers which has also an impact on the electrostatic field. Simulation to quantify the
initial state felt by the cation between the dry and its hydrated states are being
carried out at the PHENIX Laboratory (UPMC).
Inte
nsity (
Arb
. U
nit)
106 104 102 100
Binding Energy (eV)
UHV
RH=2%
RH=15%
RH=35%
RH=63%
RH=100%
Si2p
Si2pSi 2p
Chapter 2:2)Hydration of clays studied by NAP-XPS
51
The final state here is linked to the modification of the relaxation energy when
the cation hydrates and is surrounded by water molecules which modify the
screening effect. We remind that the classical equation is:
ΔER= 1
4πε0(1-εr
-1)e2
2r0
The main change with the presence of an hydration sphere that is mobile
compared to the dried state were cation are in fixed position is that the
photoemission process is faster than the required time for the molecule in the
hydration sphere to reorganize themselves. For a neutral element, when a hole is
created, a new positive charge appears and the water molecule will reorient to
present their oxygen to the now positively charged element. Thus for the above
equation the optical relative permittivity should be used to take into account this
repositioning.70
Yet Winter et al showed that for cation, the water molecules are pre-oriented
allows to use the static relative permittivity although the photoionization process is
faster than the relaxation of the water dipole.70 This pre-orientation is due to the
cation already having a positive charge orienting the water molecule to present their
oxygen to the cation. Thus when a hole is created the water molecule doesn’t need
to reorient.
In the dry state the permittivity of the system is: εr=εclayε0 with εclay~5 (3-6 for
mica74 and 4 for silicon dioxide75 the tetrahedral component). After hydration the
permittivity become εr=εwaterε0 for one water layer. The static dielectric constant of
one water layer can be estimated to 10 by using the relation between dielectric
constant and basal spacing of 2:1 phyllosilicates.74 With εwater>εclay the dielectric
constant of the cation environment increases with the formation of the hydration
sphere and ΔER is positive thus the binding energy decreases.
This is why in the case of Na+ and Sr2+ samples (hectorite and saponite) the
hydration is visible as a shift to lower binding energy. Yet it does not explain the shift
to higher binding energy of the Cs+ samples. Cesium has the lowest charge density
of the cation and may not fully pre-orient the water molecule due to its diffuse charge.
Yet when a hole is created, its charge density increases reorienting the water
molecule. Thus using static the dielectric constant for cesium may not be relevant. If
Chapter 2:3)Insertion of Pyridine
52
we instead consider that optical permittivity of water is nearer to infinite frequency
(εwater~2)76 we have a slight decrease of the relaxation energy and thus an increase
of the binding energy.
It should be noted that those reflections on the relaxation energy are only a
part of the explication of the chemical shift as the initial state part still has to be
determined.
3) Insertion of Pyridine
The interaction of organic molecules with clay minerals is a far reaching topic
that intersects with catalysis,77–82 and environmental sciences in the broadest
sense.60,83–94 We are focusing here specifically on the insertion of pyridine into
strontium-exchanged synthetic hectorite, under controlled conditions of relative
humidity (RH), using near-ambient pressure x-ray photoelectron spectroscopy (NAP-
XPS). The choice of Sr2+ as a counter-ion is motivated by its high water hydration
energy that drives the swelling of this clay by insertion of water layers with increasing
relative humidity (RH). 95,51 strontium is also of particular interest because its isotope
(90Sr, a β- emitter) is a principal component of many radioactive wastes.96,97 Finally
let us emphasize that the great advantage of synthetic hectorite, with respect to its
natural analogs (like montmorillonite), is to impoverish the chemistry of the side
surfaces of its crystals because of the absence of aluminum and di- and trivalent iron
cations in its structure.
For its part, pyridine (C5H5N, see [Figure 37 (b)]. is a heterocyclic molecule
with a lone-pair bearing nitrogen atom that can make H bond with water molecule. It
is a weak base, widely used to probe the Lewis and Brønsted acidic sites of minerals
in general, 98–101 and clays in particular. 60,90,100,102–104 Much beyond its use as an
acidity probe, pyridine is a simple, prototypical chemical species, as because of its
nitrogen heteroatom, it presents similarities with common herbicides (e.g. pyridine
carboxylic acid herbicides), and with nucleobases. Therefore, the study of its
insertion in clays is relevant to such distant fields as environmental pollution.
We have monitored the chemistry of Sr2+-hectorite and its reactivity with in-
situ, real-time synchrotron radiation NAP-XPS. The clay sample was kept at 2°C and
exposed to a partial pressure of H2O (0.5 mbar), to which a partial pressure of
pyridine, from 0.1 to 0.5 mbar, was added. Therefore, with respect to other
techniques like NMR60 or infrared spectroscopy104 applied previously to
pyridine/water/clay systems, the sample environment of NAP-XPS allows the choice
of well-defined conditions of RH (7%) and organic vapor pressure, leading to an
immediate equilibrium in the material probed layers. 2,3,105–107 The analysis relies on
core-level binding energies of species both in the gas phase (water, pyridine and any
other gas present) and in the solid phase (clay, adsorbed pyridine, and any other
compound present).1 In particular the adsorption state of pyridine and its interaction
with water confined in the interlayer could be determined. The great advantage of
NAP-XPS with respect to other spectroscopic techniques is the gas/solid synoptic,
real-time view, of considerable importance in catalytic studies.1 This has enabled us
to determine the pyridine pressure conditions leading to the mineralization of pyridine,
that we interpreted as due to the radiolysis of water (more detail later),73,108–111
resulting from the synchrotron X-ray beam interaction with the oxide material.
Due to the low-conductivity of the material, differential charging under X-ray
irradiation affects the core-level binding energies.112 To eliminate this problem that
Chapter 2:3)Insertion of Pyridine
54
can lead to core-level shift misinterpretation, the sample is biased positively (+30 V),
to create a flood gun effect discharging the surface sample surface, as described in
more detail in the experimental section 113. Another valuable effect of biasing is the
elimination of the gas phase contribution114, which leaves no ambiguity as to the
attribution of the spectral components. All spectra are aligned with the Mg 2p peaks
fixed at a position of 50 eV in binding energy then with the O 1s peaks fixed at a
position of 532.35 eV when the signal of Mg 2p disappears due to the increased
pressure and adsorption of pyridine.
Photon energies of 450 eV, 750 eV and 1050 eV are used, to vary the probed
depth. The latter is typically three times the inelastic mean free path (IMFP) in the
solid of the first, which depends on the photoelectron kinetic energy (KE).72,115,116 The
clay lathes tend to show a preferential flat orientation on the gold substrate (less than
20° with respect to the substrate plane). Therefore, the relative contributions of the
outer surface and of the interlayer can be changed by varying the X-ray photon
energy, which is enabled by the tunability of synchrotron radiation. All fitting
parameters are given in Appendix B.2
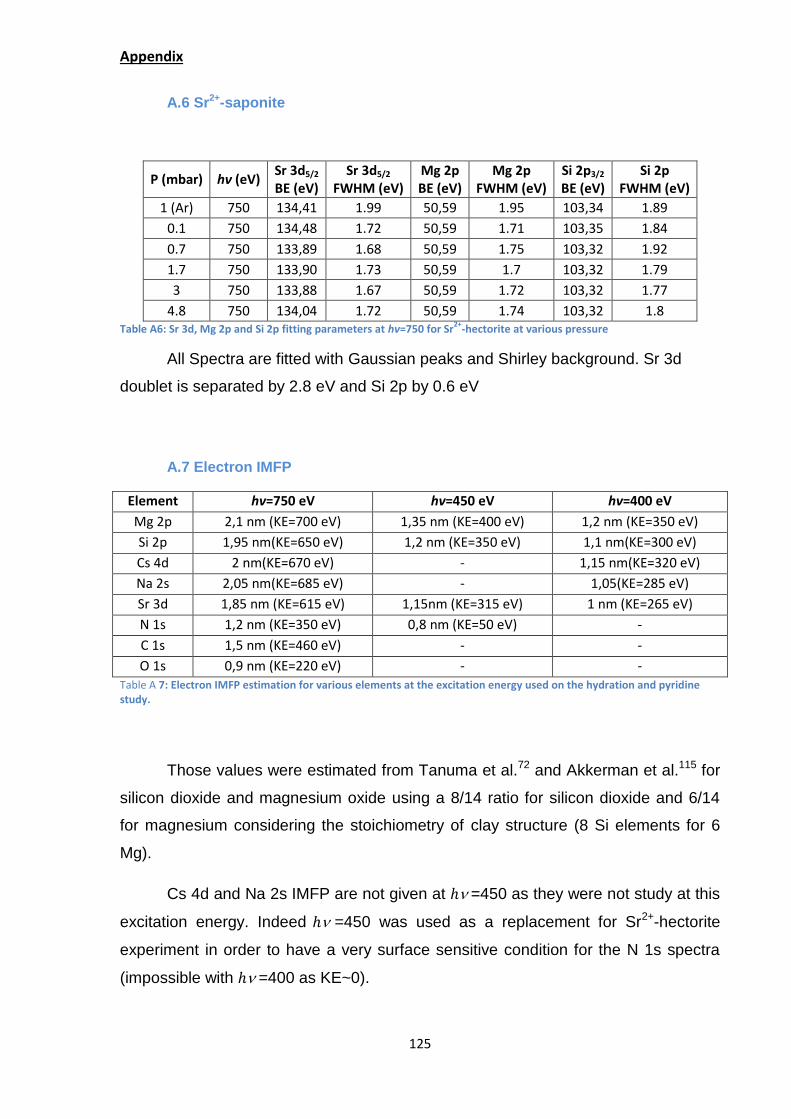
3.b) Hydration state of the Sr2+-hectorite
The Sr 3d and Mg 2p spectrum of the biased sample measured in ultra-high
vacuum (UHV) conditions at ℎ =450, 750 and 1050 eV, are shown in [Figure 38].
The depth profiling shows that while the Mg 2p FWHM is constant at 2 eV, the
FWHM of Sr 3d increases from 1.72 eV (surface sensitive conditions, IMFP of ~
1.2nm) 72,115 at ℎ =450 eV to 1.82 eV(IMFP ~1.9 nm at ℎ =750 eV) 72,115 and finally
to 2.04 eV (more bulk condition, IMFP of ~2.5 nm) 72,115 at ℎ =1050 when fitted with
a single doublet. Details of IMFP are shown in Appendix A.7. Vertical differential
charging is excluded as the FWHM of Mg 2p remains constant. The broadening of
the Sr 3d doublet is due to different chemical environments that cannot be resolved
experimentally. Surface Sr2+ are not exactly in the same chemical environment as
interlayer ones, because they are dehydrated, while the interlayer ones are still in
interaction with some water trapped inside the clay. The relaxation energy117 of
surface Sr2+ is also affected as it lies at the interface between an oxide (with an
infinite frequency dielectric constant for silicon dioxide of about ~4) 118 and the
Chapter 2:3)Insertion of Pyridine
55
vacuum. This is not surprising as in fact, strontium-exchanged hectorite, as well as
calcium-exchanged hectorite,60 are not fully dehydrated, even after a prolonged stay
in high vacuum at room temperature and one may have expected that the alkaline
earth ions sitting at the surface could be distinguished from those in the interlayer,
due to smaller relaxation energy for the former ones (in a dielectric response scheme,
the upper half space is the vacuum) and because more water could be retained in
the interlayer than at the surface.
Figure 38: Evolution of the FWHM of Mg 2p and Sr 3d with different excitation energy (450, 750 and 1050 eV) under UHV condition.
In [Figure 39] is shown the evolution of the Sr 3d and Mg 2p at ℎ =750 with
increased pressure of water and pyridine. The estimated72,115 IMFP (more on
Appendix A.7) for those orbital are ~1.9 nm for the Sr 3d photoelectrons of kinetic
energy (KE) ~615 eV and ~2.1 nm for Mg 2p (KE=700 eV). We recall that the
thickness of the phyllosilicate lath is 0.9 nm thick and that the basal plane spacing is
between 1.07 nm (zero inserted water, denoted 0W) and 1.29 nm (one inserted
water layer, denoted 1W). The Sr 3d spectrum is still fitted with a single 3d3/2/3d5/2
doublet separated by 1.8 eV, with the 3d5/2 component positioned at a BEFL of 133.95
eV. As mentioned previously, this fitting suggests a single chemical environment for
Inte
nsity (
arb
.un
it)
136eV 132a
54 52 50 48 46Binding energy (eV)
Biased by +30VSr 3dT=275 K UHV
Mg 2p
hv=450
hv=1050
hv=750
FHWM=2.04
FHWM=1.72
FHWM=1.82
FHWM=2.05
FHWM=2.03
FHWM=1.99
Chapter 2:3)Insertion of Pyridine
56
the strontium ion while there is different environment for the counterion inside the
interlayer and the one present at surface but the resolution is not sufficient to
distinguish between them.
Figure 39: Sr 3d and Mg 2p spectra measured at hν=750 eV with a sample bias of +30 V (the binding energies are corrected)
When the water pressure is raised to 0.5 mbar (RH=7%), the Sr 3d5/2Mg 2p
energy difference diminishes by ~0.3 eV, a shift with the same value was observed
during the study of the Sr2+-hectorite hydration previously in this chapter and we can
admit that a 1W state is also reached in the present case. Only for RH>40% does
Sr2+-hectorite swell to a two-water-layer hydration state (denoted 2W).119 The Sr 3d
chemical shift can also be here interpreted in terms of an initial state effect, i.e. a
change in the electrostatic energy due to swelling felt by the strontium atom, or by a
final-state effect, i.e. a change in the dielectric screening due to the hydration of Sr2+,
or to both effects.112
Inte
nsity
(Arb
. U
nit)
140 136 132Binding Energy (eV)
52 50 48
Sr 3dhv=750 eVT=275 K
Mg 2p
UHV
0.5 mbar water
0.5 mbar Water+0.1 Pyridine
x4
x0.5
Biased by +30V
FWHM: 1.99 eV
FWHM=1.66 eV
FWHM=1.62 eV
Chapter 2:3)Insertion of Pyridine
57
3.c) Adsorption/sorption of pyridine at 7% RH
When 0.1 mbar of pyridine is added to the water base pressure of 0.5 mbar
[Figure 39], the Sr 3d5/2 Mg 2p energy difference also diminish by 0.2 eV.
Consequently, the Sr2+ ion feels the presence of the pyridine molecule that sticks to
the clay external surface and penetrates in the interlayer. For the higher partial
pressures of pyridine (0.3 mbar and above), the Sr 3d signal becomes very weak,
almost non-measurable. This originates from two conjugated effects, the attenuation
of the photoemission signal (the IMFP of the photoelectrons in the gas phase is
inversely proportional to the pressure3), and the adsorption/sorption of pyridine. The
latter phenomenon is clearly demonstrated by the (unbiased) O 1s spectrum of
[Figure 40] which remains measurable up to a pyridine pressure of 0.5 mbar.
Figure 40: O 1s spectra of the unbiased, grounded sample measured at hν=750 eV. The grey component corresponds to the clay lattice oxygen and to confined water, while the blue one corresponds to gas phase water
The grey component corresponds to the clay lattice oxygen and to confined
water, while the blue one corresponds to gas phase water. In all cases, the sample is
kept at +2°C. The water pressure is 0.5 mbar (RH=7%). Pyridine gas is added
(partial pressures are indicated, from 0.1 to 0.5 mbar) while the water pressure is
kept constant. The UHV conditions correspond to a base pressure in the low 10-8
Inte
nsity
(Arb
. U
nit)
570 560 550 540 530 520
Binding Energy (eV)
X0.2
X0.5
X4
X6
X2
NOx(g)
H2O gas phase
0.5 mbar Water
0.5 mbar water+ 0.1 pyridine
0.5 mbar water+ 0.3 pyridine
0.5 mbar water+ 0.5 pyridine
After Pumping
UHV
hv=750 eVT=275 K
O 1s
Grounded
OBulkOH2O
=8.34
OBulkOH2O
=5.4
OBulkOH2O
=1.66
OBulkOH2O
=3.39
Chapter 2:3)Insertion of Pyridine
58
mbar range. After pumping down the gas mixture, a pressure of ~10-7 mbar is
recovered. All spectra are aligned with respect to the Mg 2p.
As the spectra are recorded under a constant water pressure, the solid
(phyllosilicate) intensity can be normalized by dividing it by the gas (water vapor) O
1s intensity. The solid/gas O 1s ratio, reported in this figure decreases regularly as
the pyridine pressure increases. This means that the phyllosilicate O 1s contribution
is damped by the adsorption of pyridine at the external surface of the layers and
within the layers. The swelling of the clay could be appreciable, as the basal plane
distance changes (e.g. in Ca2+-hectorite60) from 1.29 nm (1W) to 2.13 nm when
pyridine gets into the interlayer. This lattice expansion is comparable to the relatively
small IMFP of the O 1s photoelectrons, ~0.9 nm.72,115 at a kinetic energy of ~220 eV.
The N 1s spectra in measured at ℎ =750 eV [Figure 41(a,b)] and at ℎ = 450
eV in [Figure 41(c)] give clues both about the chemical state of adsorbed/sorbed
pyridine and its reactivity with the clay. In all cases, the sample is kept at +2°C. The
water pressure is 0.5 mbar (RH=7%). Pyridine gas is added (partial pressures are
indicated, from 0.1 to 0.5 mbar) while the water pressure is kept constant. After
pumping down the gas mixture, a pressure of 10-7 mbar is recovered. All spectra are
aligned with respect to the Mg 2p maximum at 50.00 eV and the O 1s maximum at
532.32 eV The IMFP in the clay is estimated to be ~1.3 nm for N 1s photoelectrons
of kinetic energy ~350 eV at ℎ =750 eV and 0.8 nm at ℎ =450 eV.
The signals relative to both the gas-phase and solid-phase species are
present in the unbiased spectrum of [Figure 41(a,c)]. In the biased spectra of [Figure
41(b)], the gas-phase contribution is practically eliminated, appearing as a small
background that increases to lower binding energies. By comparing panels (a) and
(b), one sees immediately that under a partial pyridine pressure of 0.1 mbar, the two
components at BEFL of 400.4 eV (golden component) and 405.35 eV (blue
component) pertain to the gas phase. This point will be addressed in detail later on.
Chapter 2:3)Insertion of Pyridine
59
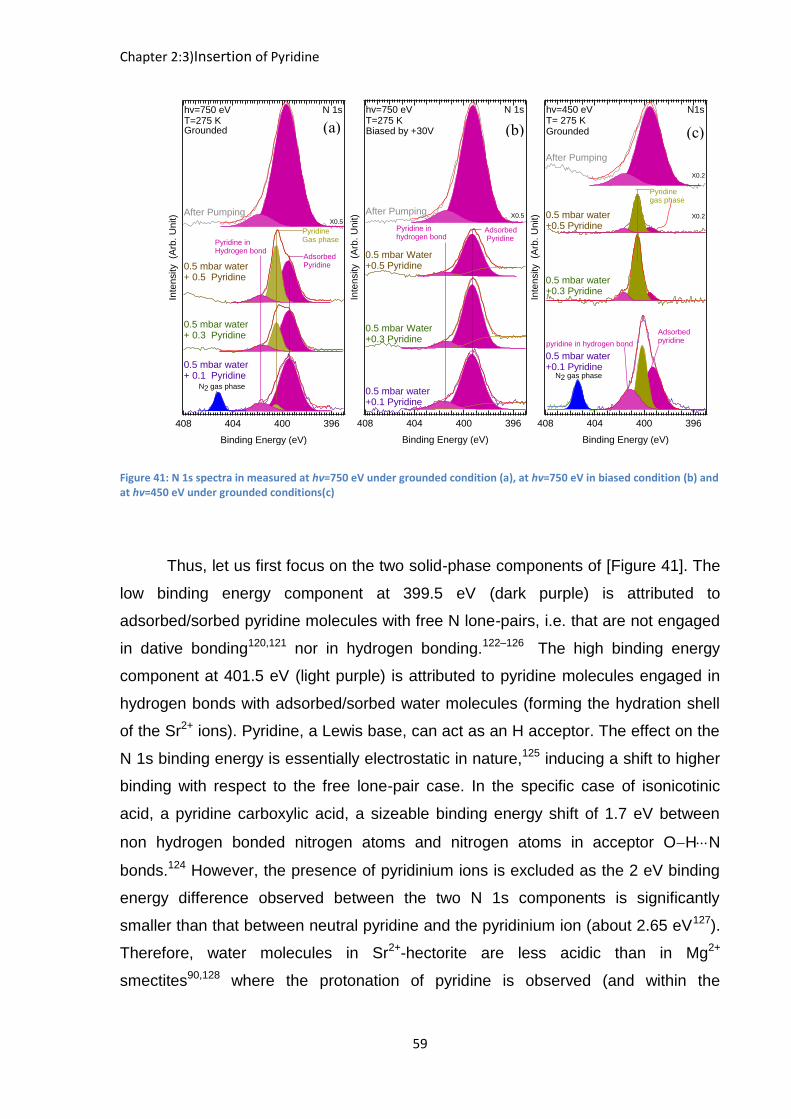
Figure 41: N 1s spectra in measured at hν=750 eV under grounded condition (a), at hv=750 eV in biased condition (b) and at hv=450 eV under grounded conditions(c)
Thus, let us first focus on the two solid-phase components of [Figure 41]. The
low binding energy component at 399.5 eV (dark purple) is attributed to
adsorbed/sorbed pyridine molecules with free N lone-pairs, i.e. that are not engaged
in dative bonding120,121 nor in hydrogen bonding.122–126 The high binding energy
component at 401.5 eV (light purple) is attributed to pyridine molecules engaged in
hydrogen bonds with adsorbed/sorbed water molecules (forming the hydration shell
of the Sr2+ ions). Pyridine, a Lewis base, can act as an H acceptor. The effect on the
N 1s binding energy is essentially electrostatic in nature,125 inducing a shift to higher
binding with respect to the free lone-pair case. In the specific case of isonicotinic
acid, a pyridine carboxylic acid, a sizeable binding energy shift of 1.7 eV between
non hydrogen bonded nitrogen atoms and nitrogen atoms in acceptor OHN
bonds.124 However, the presence of pyridinium ions is excluded as the 2 eV binding
energy difference observed between the two N 1s components is significantly
smaller than that between neutral pyridine and the pyridinium ion (about 2.65 eV127).
Therefore, water molecules in Sr2+-hectorite are less acidic than in Mg2+
smectites90,128 where the protonation of pyridine is observed (and within the
(b) (a) (c)
Inte
nsity
(Arb
. U
nit)
408 404 400 396
Binding Energy (eV)
UHV
0.5 mbar water+ 0.1 Pyridine
0.5 mbar water+ 0.3 Pyridine
0.5 mbar water+ 0.5 Pyridine
After PumpingX0.5
Pyridine Gas phase
AdsorbedPyridine
Pyridine in Hydrogen bond
N2 gas phase
N 1shv=750 eVT=275 KGrounded
Inte
nsity
(Arb
. U
nit)
408 404 400 396
Binding Energy (eV)
X0.5
0.5 mbar water+0.1 Pyridine
0.5 mbar Water+0.3 Pyridine
0.5 mbar Water+0.5 Pyridine
After Pumping
Pyridine in hydrogen bond
Adsorbed Pyridine
N 1shv=750 eVT=275 KBiased by +30V
Inte
nsity
(Arb
. U
nit)
408 404 400 396
Binding Energy (eV)
0.5 mbar water+0.1 Pyridine
0.5 mbar water+0.3 Pyridine
0.5 mbar water+0.5 Pyridine
After Pumping
X0.2
X0.2
N2 gas phase
Pyridine gas phase
Adsorbedpyridinepyridine in hydrogen bond
hv=450 eVT= 275 KGrounded
N1s
Chapter 2:3)Insertion of Pyridine
60
detection limit of NMR in Ca2+--hectorite60), because of the bigger size of the
strontium cation.
At ℎ =750 eV [Figure 41 (a,b)], the “H-bond” to “non H-bond” intensity ratio is
0.15 and does not change much during the experiment when the pyridine pressure is
raised to 0.3 mbar and then to 0.5 mbar. This ratio is notably different when the
spectra are recorded at ℎ =450 eV, see [Figure 41 (c)]. At this excitation energy the
IMFP in the clay is minimal, in the range of 0.8 nm,72,115,129 nearly a factor of two
smaller than at ℎ =750 eV, and practically equal to the phyllosilicate lath thickness.
Consequently, more surface sensitive conditions are reached. Note that the too
small kinetic energy prevents the application of the +30 V positive bias, and the
elimination of the gaseous pyridine component. Nevertheless, as long as the latter
one is not too intense (i.e. for pyridine partial pressure below 0.3 mbar), the “H-bond”
to “non H-bond” intensity ratio can be precisely obtained by curve fitting. At ℎ =450
eV and under a pyridine partial pressure of 0.1 mbar, this ratio is 0.47, compared to
0.16 at ℎ =750 eV. Consequently, in surface sensitive conditions, the spectral
weight of the H-bonded pyridine increases in a sizeable manner. This suggests that
the “non H-bonded” pyridine is preferentially found in the interlayer space, or in pores
deeper in the deposit.
Figure 42: The pyridine hydrated cation (1W) complex, according to Refs.14 and 16
2,1
3 n
m
Chapter 2:3)Insertion of Pyridine
61
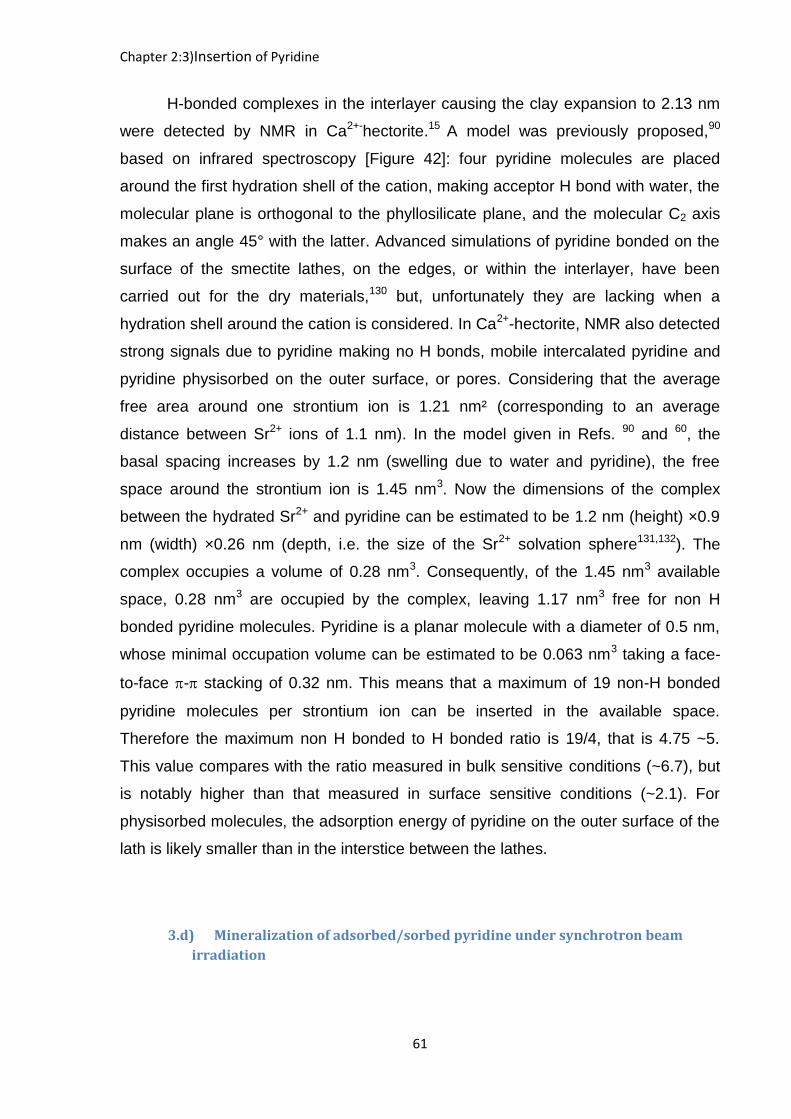
H-bonded complexes in the interlayer causing the clay expansion to 2.13 nm
were detected by NMR in Ca2+-hectorite.15 A model was previously proposed,90
based on infrared spectroscopy [Figure 42]: four pyridine molecules are placed
around the first hydration shell of the cation, making acceptor H bond with water, the
molecular plane is orthogonal to the phyllosilicate plane, and the molecular C2 axis
makes an angle 45° with the latter. Advanced simulations of pyridine bonded on the
surface of the smectite lathes, on the edges, or within the interlayer, have been
carried out for the dry materials,130 but, unfortunately they are lacking when a
hydration shell around the cation is considered. In Ca2+-hectorite, NMR also detected
strong signals due to pyridine making no H bonds, mobile intercalated pyridine and
pyridine physisorbed on the outer surface, or pores. Considering that the average
free area around one strontium ion is 1.21 nm² (corresponding to an average
distance between Sr2+ ions of 1.1 nm). In the model given in Refs. 90 and 60, the
basal spacing increases by 1.2 nm (swelling due to water and pyridine), the free
space around the strontium ion is 1.45 nm3. Now the dimensions of the complex
between the hydrated Sr2+ and pyridine can be estimated to be 1.2 nm (height) ×0.9
nm (width) ×0.26 nm (depth, i.e. the size of the Sr2+ solvation sphere131,132). The
complex occupies a volume of 0.28 nm3. Consequently, of the 1.45 nm3 available
space, 0.28 nm3 are occupied by the complex, leaving 1.17 nm3 free for non H
bonded pyridine molecules. Pyridine is a planar molecule with a diameter of 0.5 nm,
whose minimal occupation volume can be estimated to be 0.063 nm3 taking a face-
to-face - stacking of 0.32 nm. This means that a maximum of 19 non-H bonded
pyridine molecules per strontium ion can be inserted in the available space.
Therefore the maximum non H bonded to H bonded ratio is 19/4, that is 4.75 ~5.
This value compares with the ratio measured in bulk sensitive conditions (~6.7), but
is notably higher than that measured in surface sensitive conditions (~2.1). For
physisorbed molecules, the adsorption energy of pyridine on the outer surface of the
lath is likely smaller than in the interstice between the lathes.
3.d) Mineralization of adsorbed/sorbed pyridine under synchrotron beam
irradiation
Chapter 2:3)Insertion of Pyridine
62
We now consider the gas-phase components at BEFL of 400.4 eV (golden
component) and 405.35 eV (blue component) in the unbiased spectrum of [Figure 41
(a,c)]. The lower energy one (at 400.4 eV) is ascribed to pyridine in gas phase as it
increases with pyridine partial pressure. These two components arise from core-
ionized molecules present in gas volume in contact with the solid. The vacuum level
of the molecules is pinned to the vacuum level of the solid, and thus BEFL is simply
the difference between the gas phase ionization energy referenced to the vacuum
level (IEVL) and the solid work function, neglecting the contact potential difference
gradient between sample and analyzer. As the N 1s IEVL of pyridine 404.9 eV,133 the
other gas phase component seen at higher binding when the pyridine partial
pressure is 0.1 mbar, corresponds to an IEVL of 409.95 eV. This is precisely that of
dinitrogen (N2).133 Gaseous NO is also excluded. NO being a radical, should exhibit
a N 1s doublet at IEVL 410.1 and 411.5 eV(i.e. at BEFL 405.5eV and 406.9eV) and an
O 1s doublet at IEVL= 543.2 and 543.8 eV133 (i.e. at a BEFL of 538.6 and 539.2 eV) ,
observed neither in the N 1s window [Figure 41(a,c)] nor in the O 1s one [Figure 40].
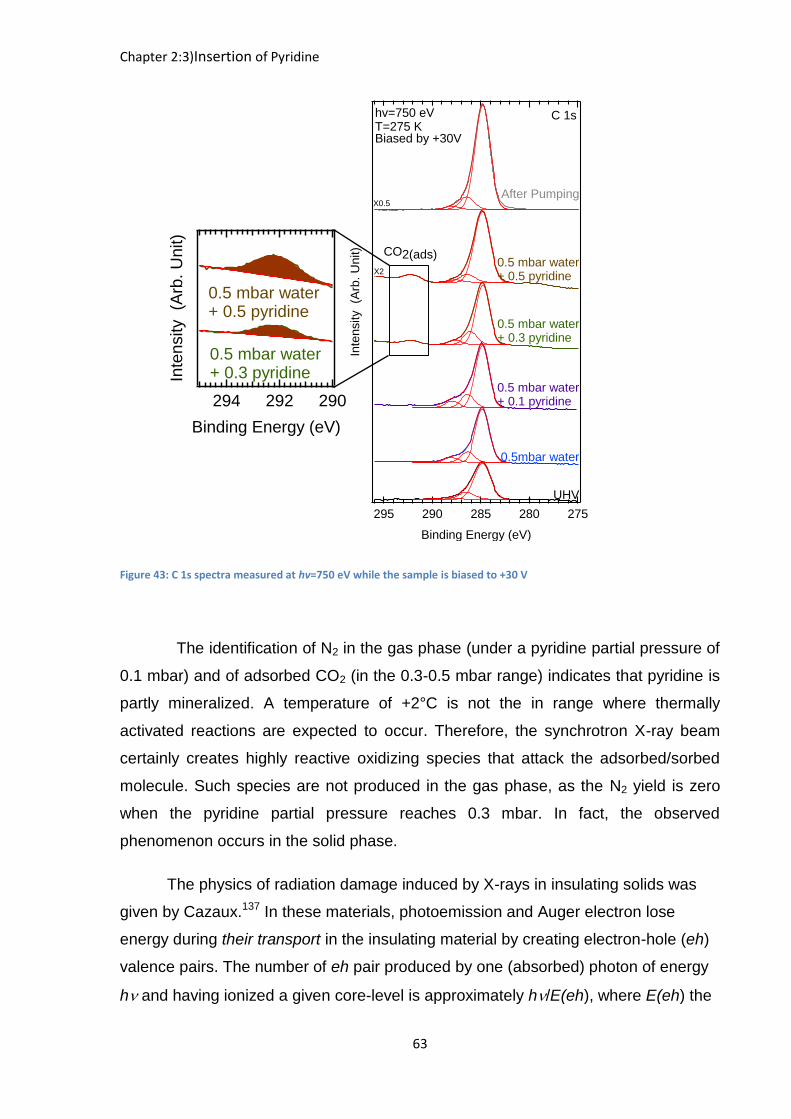
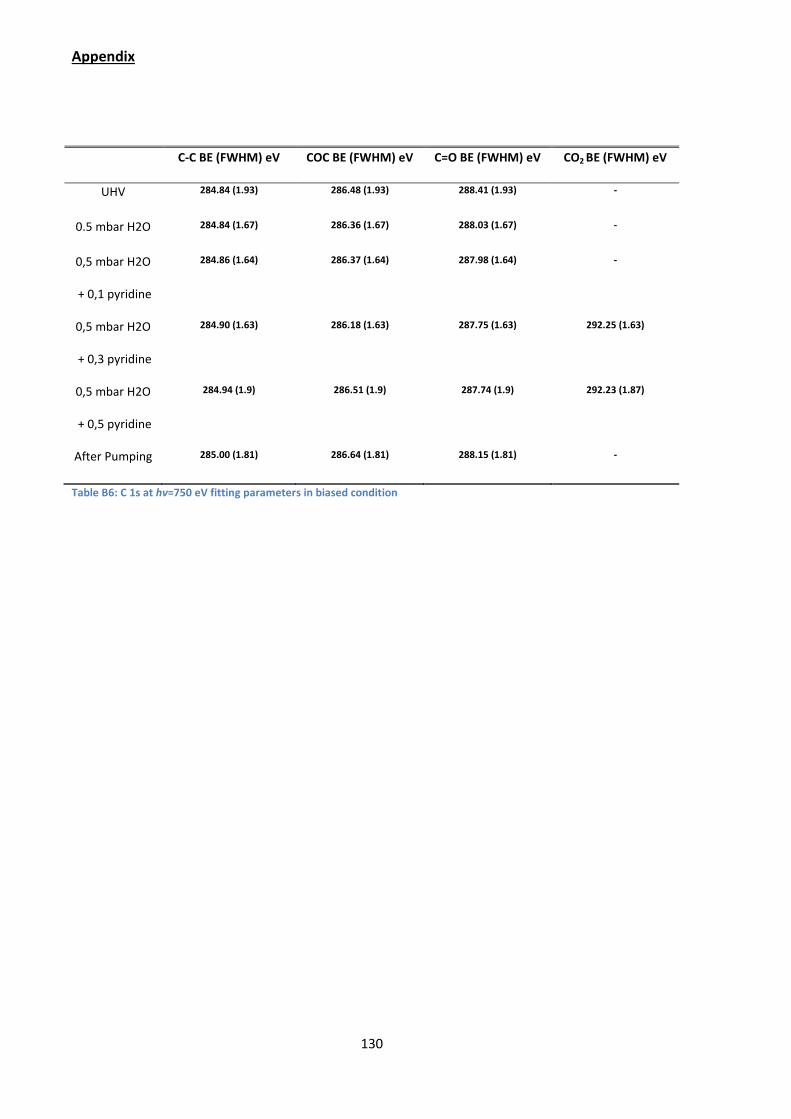
When the partial pressure of pyridine reaches 0.3 mbar, the production of gas
phase N2 stops. We can find an explanation for this effect considering the C 1s
spectra of [Figure 43]. Indeed, once the gaseous N2 signal disappears from the N 1s
energy window, a C 1s component at a BEFL of 292.15 eV starts to grow both in the
biased and grounded condition spectrum, showing it must be attributed to a solid
phase species. This BEFL is significantly higher than that of CO32- in SrCO3 (289.0-
289.6 eV) or of HCO3- (290 eV) in NaHCO3.
134 However it corresponds to the C 1s
BEFL of CO2 physisorbed on oxide surfaces (291.8 eV)135. The signal still increases
when the pyridine partial pressure reaches 0.5 mbar. However, when the gas
mixture is pumped down, the component disappears from the C 1s window, showing
that the species is weakly bonded, being only produced when the pyridine partial
pressure reaches 0.3 mbar. Note that the UV-induced complete degradation136 of
pyridine in aqueous solutions over TiO2 yielded ammonium and nitrate ions
(unobserved here), apart from CO2 (we do observe). Gaseous N2 maybe the result of
a further decomposition of NH4+ and NO3
-. If that is the case then the reaction of
decomposition should be extremely fast as no NH4+ and NO3- are observed, their
lifetime in the system must be low.
Chapter 2:3)Insertion of Pyridine
63
Figure 43: C 1s spectra measured at hv=750 eV while the sample is biased to +30 V
The identification of N2 in the gas phase (under a pyridine partial pressure of
0.1 mbar) and of adsorbed CO2 (in the 0.3-0.5 mbar range) indicates that pyridine is
partly mineralized. A temperature of +2°C is not the in range where thermally
activated reactions are expected to occur. Therefore, the synchrotron X-ray beam
certainly creates highly reactive oxidizing species that attack the adsorbed/sorbed
molecule. Such species are not produced in the gas phase, as the N2 yield is zero
when the pyridine partial pressure reaches 0.3 mbar. In fact, the observed
phenomenon occurs in the solid phase.
The physics of radiation damage induced by X-rays in insulating solids was
given by Cazaux.137 In these materials, photoemission and Auger electron lose
energy during their transport in the insulating material by creating electron-hole (eh)
valence pairs. The number of eh pair produced by one (absorbed) photon of energy
h and having ionized a given core-level is approximately h/E(eh), where E(eh) the
Inte
nsity (A
rb.
Unit)
294 292 290
Binding Energy (eV)
0.5 mbar water+ 0.3 pyridine
0.5 mbar water+ 0.5 pyridine
Inte
nsity
(Arb
. U
nit)
295 290 285 280 275
Binding Energy (eV)
X2
X0.5
CO2(ads)
0.5mbar water
0.5 mbar water+ 0.1 pyridine
0.5 mbar water+ 0.3 pyridine
0.5 mbar water+ 0.5 pyridine
After Pumping
UHV
C 1shv=750 eVT=275 KBiased by +30V
Chapter 2:3)Insertion of Pyridine
64
energy for creating a eh pair (E(eh) is two to three times the bandgap). The pair
generation factor per unit volume and per unit time 𝑔(𝑒ℎ)may also be expressed as a
function of Φ0the incident photon flux, and 𝜇 the linear absorption coefficient of the
specimen for the X-ray photons of interest as:
𝑔(𝑒ℎ) =ℎ Φ0𝜇
𝐸(𝑒ℎ) (in cm-3 s-1)
The mass absorption coefficient μ* in dry Sr2+-hectorite of composition
Sr0.4Mg5.2Li0.8Si8.0O20(OH)4 can be calculated from the mass absorption coefficients
of its atomic constituents (see Table 4.) Then the linear mass absorption knowing the
mass density of Sr2+- hectorite(~2.5 g/cm3) as μ=μ*×ρ
Element Atomic mass μ* at hν=750ev138 μ* at hν=450ev138
Si 28.09 3514 cm²/g 12950 cm²/g
Mg 24.31 1936 cm²/g 7655 cm²/g
Li 6.94 542 cm²/g 2544 cm²/g
Sr 87.62 6643 cm²/g 18288 cm²/g
O 15.999 9673 cm²/g 1778 cm²/g
H 1.008 17,6 cm²/g 95 cm²/g
Clay (unit cell) 779.74 6393 cm²/g 6689 cm²/g
μ - 15981 cm-1 16723 cm-1
Table 4: Mass adsorption coefficient and linear adsorption value for clay
At ℎ=750 eV (450 ev), Φ0= 4×10¹⁶ photon/s/cm2 (2×10¹⁶ photon/s/cm2). With
𝐸(𝑒ℎ) =17 eV (same as silica) and μ =15981 cm-1 (16723 cm-1), we find
g(eh) =2.8×1022 cm-3 s-1 (8.85×1021 cm-3 s-1). A typical N 1s spectrum is taken within
a time ti of 25 second, so 7×10²³ (2.2×10²³)eh pairs per unit volume are generated
during the acquisition.
In the specific case of clays, the presence of strong electric fields in the
lamellar structure may efficiently separate holes and electrons, and reduce their
recombination probability. However, as emphasized by Cazaux, not all experimental
data can be explained by transport and eh pair generation only. The Auger decay,
that leads to a change of the normal charge of a given atom (think of an O atom
excited above the K edge of 530 eV, that ends in a 2h valence state) may have
considerable implication in X-ray beam damage, as the normal charge cannot be
Chapter 2:3)Insertion of Pyridine
65
restored quickly (contrary to metals) because of the lack of a significant density of
conduction electrons. Bond rupture (covalent systems) or atom desorption (ionic
system) can be envisaged. For instance, the O KLL Auger decay in
adsorbed/inserted water molecules can lead to a H2O2+ species, that dissociates via
Coulomb explosion, or react with neutral water (an acid-base re-equilibration
reaction) to give H3O+ plus atomic O.139 Indeed water ice exposed to the synchrotron
white beam sees the appearance of O, HO2 and O2 species in the NEXAFS O 1s
spectrum, besides OH and H2O2.140
Considering now the specific case of oxide/water interfaces, there is an
abundant literature on water radiolysis under pulsed high energy electron
beams,73,109–111 (or under irradiation by other high energy particles, see 141 and
references therein). The wide interest for this topic stems from the fact that water
radiolysis leads to H2 production, with obvious safety issues. As discussed by
Cazaux, electrons of kinetic energy EKE and photons of energy ℎ =EKE ) are
equivalent for the number of electron hole pairs generated during the electron
transport. However a major difference is the dominant interaction : for incident X-rays
it is the excitation of core-electrons (followed by the Auger decay), while for incident
electrons it is the formation of valence eh pairs, without Auger decay (due to low
core-ionization cross-sections).137 Another difference between synchrotron X-ray
irradiation and electron pulse irradiation is the received dose. The radiation dose
received at the sample surface can be estimated with the following formula
D=Φ0h μ* ti , i.e. 7.68×10⁷ Gy for ℎ=750 eV and 2.41×10⁷ Gy for ℎ=450 eV.
Considering that we are working in the so-called top-up mode with 28 ps wide pulses
each separated by 2.84 ns (352 MHz),142 each pulse emits a radiation dose of
8.81×10⁻³ (2.76×10⁻³) Gy at ℎ =750 eV (450 eV). Let us now compare with the
pulsed electron irradiation experiments of Refs. 111 and 73. 10 MeV electron pulses of
10 ns duration at a repetition rate of 2 Hz are used. The dose per pulse is 30 Gy.
Typical doses received by the samples are 1.5×10³ Gy, four orders of magnitude
smaller than during our typical XPS scan of 25 s.
In any case, the lessons drawn from electron irradiation studies are worth
being exposed. In swelling clays (montmorillonite, saponite), water confinement has
Chapter 2:3)Insertion of Pyridine
66
a strong influence on the H2 radiolytic yield induced by electron irradiation, being
maximum for one water layer (1W) in the interlayer space, and diminishing when the
number of inserted water layers increase.73 The following explanation is offered in
Ref. 73. Valence electron and holes generated by irradiation migrate to the interlayer
space. Holes react with confined water to give H+ and HO,73 all the more easily
because in the 1W hydration state, the OH bond of water molecules, strongly
polarized by the counterion, is weakened. Electrons are hydrated (eaq), then
recombine to produce HO- species and H2 (hence the potential dangerousness of
irradiated water). They can also react with H+ to give H (that recombines to give H2).
The literature concerning pyridine radiolysis in bulk water indicates that 𝑒𝑎𝑞− is
efficiently scavenged by pyridine to give a pyridine radical anion,143,144 and that OH
radicals react by addition to the pyridine ring.143,145 In the case of our hydrated clay
exposed to soft X-rays, the observation of gaseous N2 and then of adsorbed/sorbed
CO2 suggests far more advanced reactions leading to mineralization. The reaction
pathways to N2 and CO2 are not documented in the current radiolysis literature on
pyridine,143,144,146 and thus it may be specific of the soft X-ray irradiation of pyridine in
hydrated clays, both because of the different irradiation doses and of the physical
nature of the system.
Let us first consider the steady-state production of N2 at a pyridine partial
pressure of 0.1 mbar. Pyridine dissociation to N2 needs the breaking of the aromatic
ring. As no NOx products are seen, we consider primarily the H radical. Both the
abstraction of a pyridine H atom by the H radical, and its addition to the ring can be
envisaged, but the latter is favored over the former, at least in the gas phase.147 In a
hydrogenolyse/denitrogenation scheme, the pyridine ring is first fully hydrogenated
by the H, forming a piperidine molecule. Hydrogenolysis leads to n-pentyl amine
(ring opening) and then C5 hydrocarbons (that could be hidden in the gas and solid
phase main peak of pyridine, see above) plus ammonia. N2 is observed instead in
the N 1s spectrum, which would imply that ammonia is radiolytically decomposed in
the clay to give N2 and H2.148,149 The source of H is the reaction of hydration water
with electrons according to :
e + (Sr2+)…OH2 HO¯ + H (1)
Chapter 2:3)Insertion of Pyridine
67
The electrostatic field (the phyllosilicate layer is negatively charged and the
cations are in the interlayer) should facilitate the injection of electrons in the
interlayer, and one could consider that the production of Hdominates that of HO
that is due to the reaction of a hole with water according to :
h + (Sr2+)…OH2 HO + H+ (2)
HO is a strongly oxidizing species. However, the more difficult injection of
holes in the interlayer and the eh recombination may explain why the inserted
species are not oxidized (HO can indeed add to pyridine) and why no NOx are seen
in the gas phase.
Now the very interesting point is that the steady-state N2 production stops
when the pyridine partial pressure is raised to 0.3 mbar. We interpret this pressure
effect as due to pyridine scavenging the electrons falling from the clay conduction
band into its LUMO to form a radical anion. The elimination of the electrons diminish
the recombination probability with the holes, thus more holes are available and
therefore the yield of HO radicals via reaction (2) increases. The latter ones can
now oxydize the sorbed CxHy carbon remaining from the denitrogenation reaction
discussed here above. Consequently, adsorbed CO2 appears in the C 1s spectrum,
its intensity increasing with pyridine pressure.
Finally, in the context of the questions raised by Cazaux,137 i.e. the respective
importance of photoelectron/ Auger electron transport (i.e. eh pair formation) and of
multiply ionized Auger final state in beam damage, we have observed that the
mineralization yield of pyridine depends on the irradiation conditions, photon flux and
photon energy. The intensity ratio 𝑔𝑎𝑠𝑒𝑜𝑢𝑠 𝑁2 𝑝𝑒𝑎𝑘
𝑔𝑎𝑠𝑒𝑜𝑢𝑠 𝑝𝑦𝑟𝑖𝑑𝑖𝑛𝑒 𝑝𝑒𝑎𝑘 is 1.57 at ℎ =750 eV and only
0.21 at ℎ =450 eV [Figure 41]. The ratio increases by a factor of 7.5, at ℎ =750 eV,
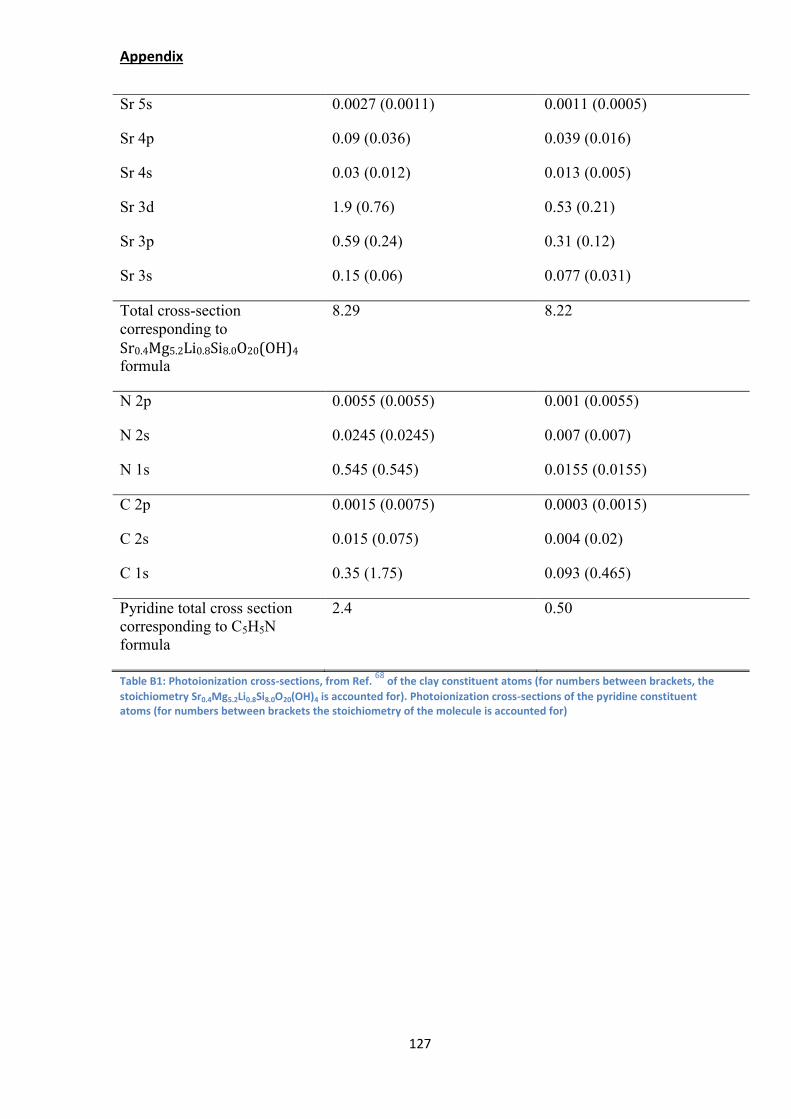
i.e. above the O K edge of 530 eV. When we calculate the overall ionization cross-
sections (see Appendix B.1) for the clay compound of formula
Sr0.4Mg5.2Li0.8Si8.0O20(OH)4 we found that is it practically the same at 450 eV (8.22
Mbarn) and 750 eV (8.29 (Mbarn). Between 450 eV and 750 eV, the number of
generated eh pairs being proportional to ℎ 137 should increase by a factor 1.7. As
the photon flux at ℎ =750 eV is twice that at ℎ =450 eV, the yield of eh pairs should
Chapter 2:4)Conclusion
68
increase by a factor of 3.4 from ℎ =450 eV to ℎ =750 eV, a value that compares
with the observed increase in the N2 yield by a factor 7.5. However, it is not excluded
that water dissociation from the doubly ionized Auger state should be taken into
consideration. Against the effectiveness of the Auger decay, one can consider that
the NAP conditions, where the material is practically discharged by negative species
coming from the gas phase, are not conducive to the formation of long timescale 2h
Auger decay species.
4) Conclusion
We have shown in this chapter the sensibility of the NAP-XPS to the changes
and evolution of the chemical environment of the counterion inside the clay interlayer.
Indeed we have shown drastic different behavior linked to the nature of the
counterion. With cesium based samples, a reaction to the presence of water is only
seen at high relative humidity when liquid water is about to form at the sample
surface. The reaction is under the form of a shift to higher binding energy for both Si
and Cs element linking to an outer-sphere surface complex. In contrary the sodium
based element shows a shift to the lower binding due to an augmentation of the
relaxation energy with the hydration of the counterion. Here there is no shift in the Si
element and the sodium is expected to form an inner-sphere surface complex during
hydration. When sodium is supposed to have formed its second hydration sphere, it
disappear from the spotting region probably due to an electrostatic repulsion caused
by residual charging effect within the sample and showing the mobility of the sodium
in confined space even before the first droplet of water is formed. With the strontium
samples we have a hydration behavior similar to sodium with shifts to lower binding
due the increased relaxation energy but compared to sodium, strontium is stays in
the spotting region even when macroscopic liquid water is formed at the sample
surface. The spectroscopic signature between the two structures used (saponite and
hectorite) is observable with a shorter distance between the counterion core level
and the referenced peak (Mg 2p) for saponite and a higher distance for hectorite.
Chapter 2:4)Conclusion
69
Moreover, NAP-XPS in the mbar range was used for the first time to study in
real time the adsorption/sorption pyridine in a smectite, Sr2+ hectorite, kept at a
constant relative humidity of 7% (1W hydration state). Within the range of used
photon energies, both the external surface of the lamellar material and the interlayer
where the cation sits were probed. XPS could distinguish pyridine molecules making
hydrogen bonds with water molecule forming the first coordination shell of the cation,
and molecules making no hydrogen bonds, i.e. adsorbed on the siloxane planes or
accumulating in mesopores. No pyridinium species were detected, an indication of
the weak acidity of water molecules forming the hydration shell of Sr2+.
Remarkably when we inserted pyridine in a prehydrated with one water layer
Sr2+-hectorite, we observed a steady-state catalytic reaction triggered by the
synchrotron soft X-ray probe. The synoptic view of the gas and solid phase, and the
biasing procedure we used to distinguish unambiguously the two contribution, lead to
the conclusion that pyridine is mineralized to (at least) two species, N2 that escapes
to gas phase, and CO2 that accumulates in the solid. N2 is detected until the pyridine
partial pressure overcomes a threshold, and we attribute this effect to the
scavenging of conduction electrons by the pyridine molecule, and hence the
quenching of H radical production leading to the hydrodenitrogenation of the
molecule.
As the soft X-ray irradiation of hydrated clays leads to formation of highly
active species that are able to decompose a molecule of prototypical of more
complexes substances (nucleobases, herbicides), the contribution of the present
work to soil sciences or pollution remediation of waste water is obvious. It may also
be relevant to the conservation of biomolecules in the smectite-rich150 soils of a
planet like Mars that receives more radiation than Earth,151 and whose atmosphere
and variable humidity152,153 could be simulated conveniently in NAP-XPS setups.
More generally, our work underlines the effects of synchrotron beam irradiation with
water confined in a wide band-gap material, and raises the question of the detailed
physics of water radiolysis in this systems.75 and whose atmosphere and variable
humidity could be simulated conveniently in NAP-XPS setups.
Chapter 3:1)Introduction
70
Chapter 3: Catalytic reaction on Nanoparticle
1) Introduction
The increase of the standard of living throughout the world has led to the
inevitable increase in global energy consumption. This trend is further amplified by
the growing of world population. Overall the energy consumption is expected to
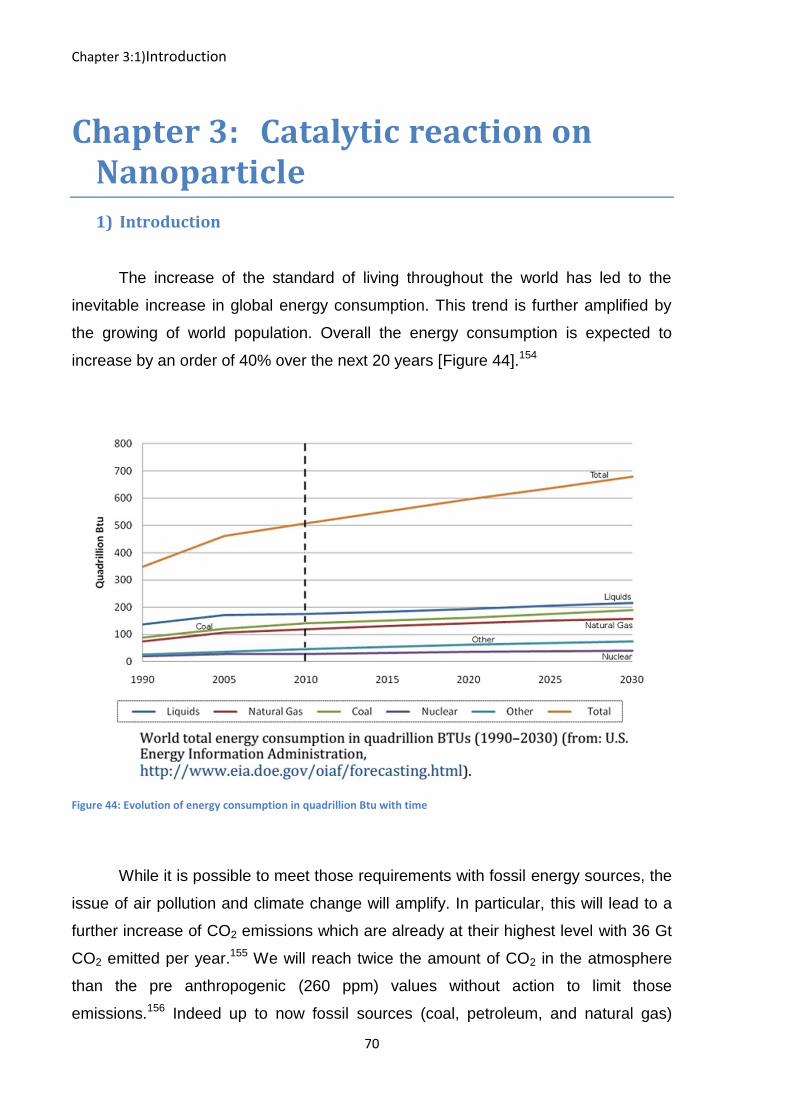
increase by an order of 40% over the next 20 years [Figure 44].154
Figure 44: Evolution of energy consumption in quadrillion Btu with time
While it is possible to meet those requirements with fossil energy sources, the
issue of air pollution and climate change will amplify. In particular, this will lead to a
further increase of CO2 emissions which are already at their highest level with 36 Gt
CO2 emitted per year.155 We will reach twice the amount of CO2 in the atmosphere
than the pre anthropogenic (260 ppm) values without action to limit those
emissions.156 Indeed up to now fossil sources (coal, petroleum, and natural gas)
Chapter 3:1)Introduction
71
have been the overwhelming dominant sources of energy, making them the heaviest
producer of CO2 gases [Figure 45].154
Figure 45: Evolution of CO2 emission in metric tons with time for different country
Strategies are now emerging in order to provide environmentally-friendly
sources of energy and limit the emission of CO2. The objective of those limitations is
to keep the increase of the global warming under 2°C at the end of the century. In
order to achieve this goal, new highly, efficient and reliable technologies to supply
the increasing energy consumption are needed.157–159
One of those technologies is the proton exchange membrane fuel cell
(PEMFC or PEM). Indeed this technology has a relatively low operating temperature
(80-100°C), a high energy density, a low emission of pollutants and particles as it
emits only waters.160,161
The main constituents of a fuel cell can be described as two electrodes
separated by an electrolyte (the proton exchange membrane) [Figure 46]. Those
electrodes have to be designed to facilitate three transport processes:
The transport of proton through the membrane
The transport and collection of electron from the collector
The transport of the reactant gases to and from the electrode (O2 for the
cathode and H2 for the anode)
Chapter 3:1)Introduction
72
Figure 46: Working principle of a fuel cell
The reaction that produces energy can be summarized as follow:
The hydrogen stream that arrives at the anode is separated into
electron and proton. This is the hydrogen oxidation reaction (HOR).
The newly created protons go to the anode through the porous
membrane while the electrons travel to the cathode through an external
circuit which creates the energy output of the fuel cell. The half-cell
reaction equation is:
H2→2H+ +2e-
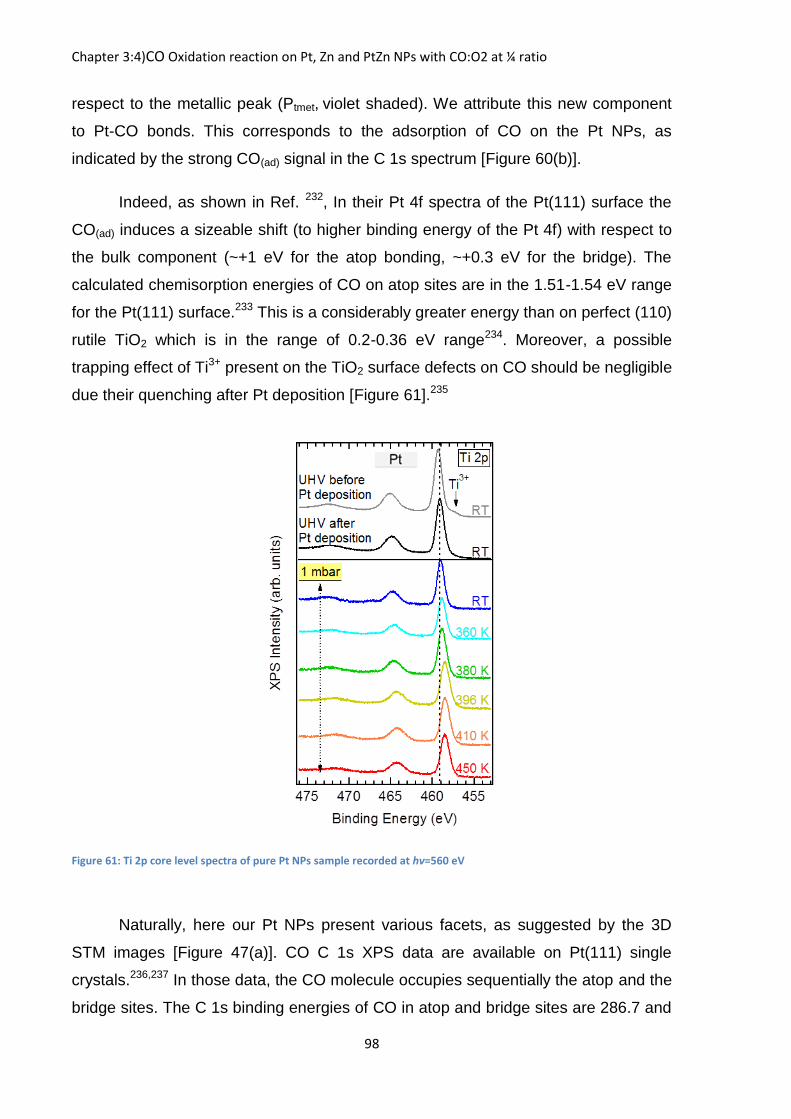
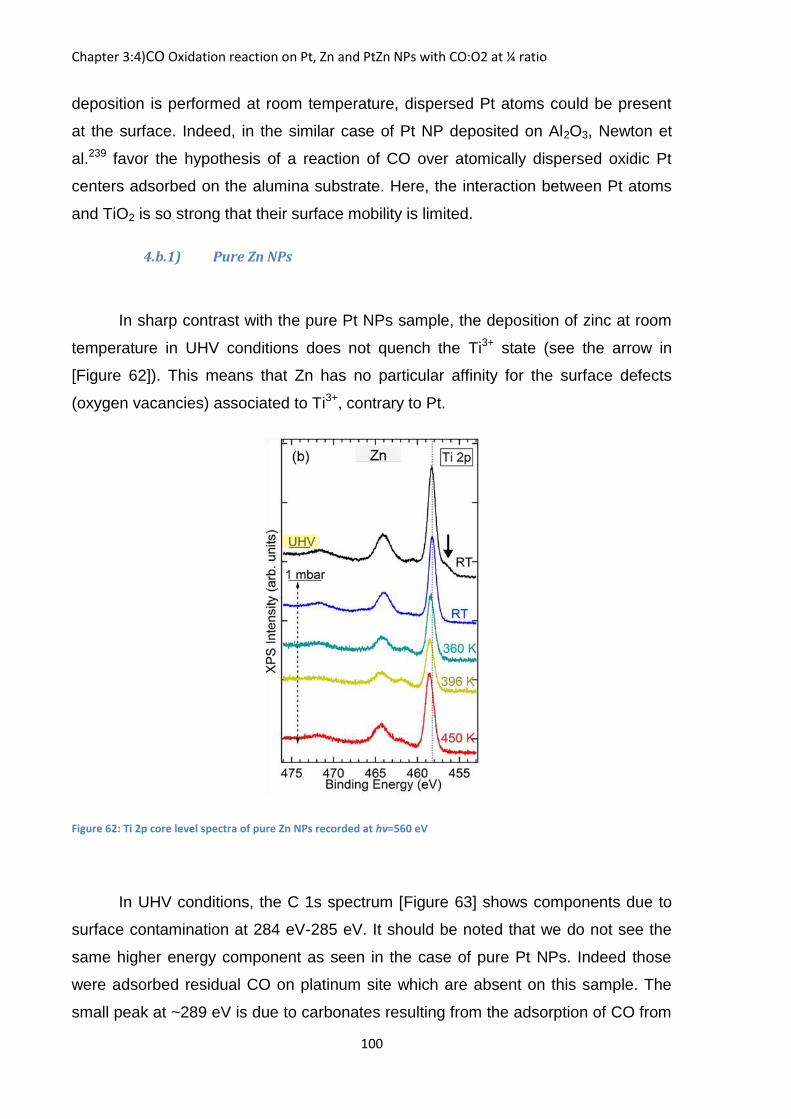
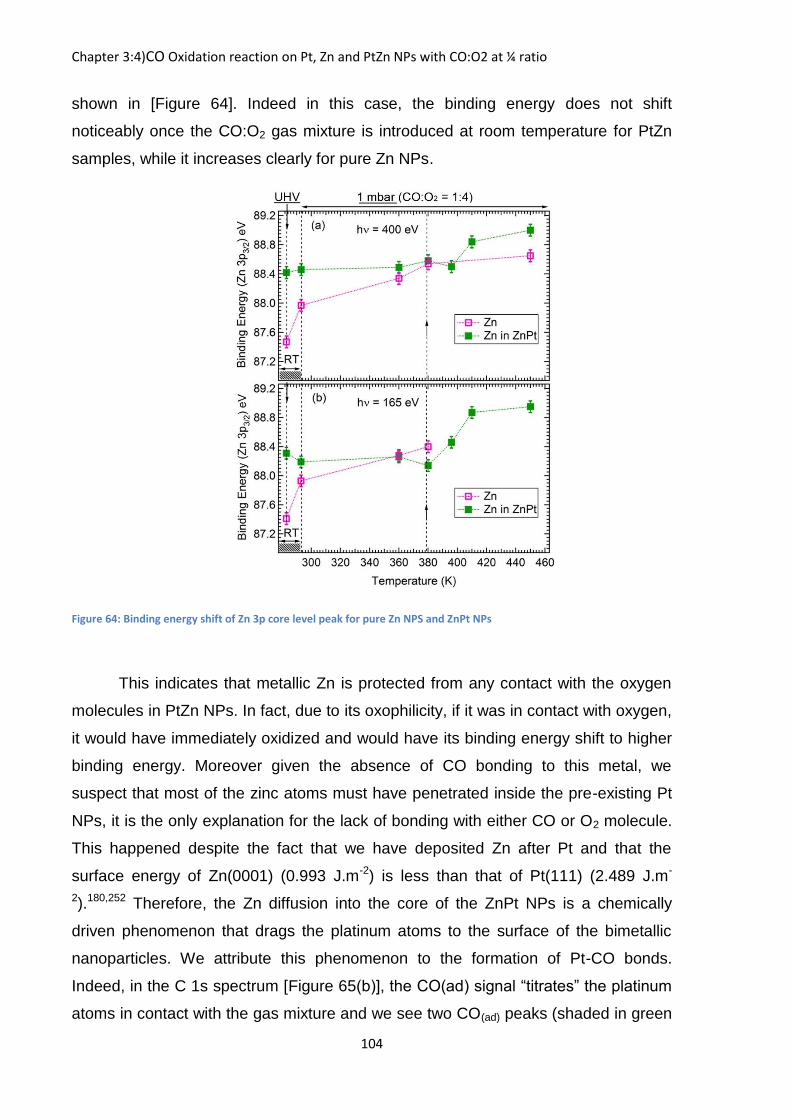
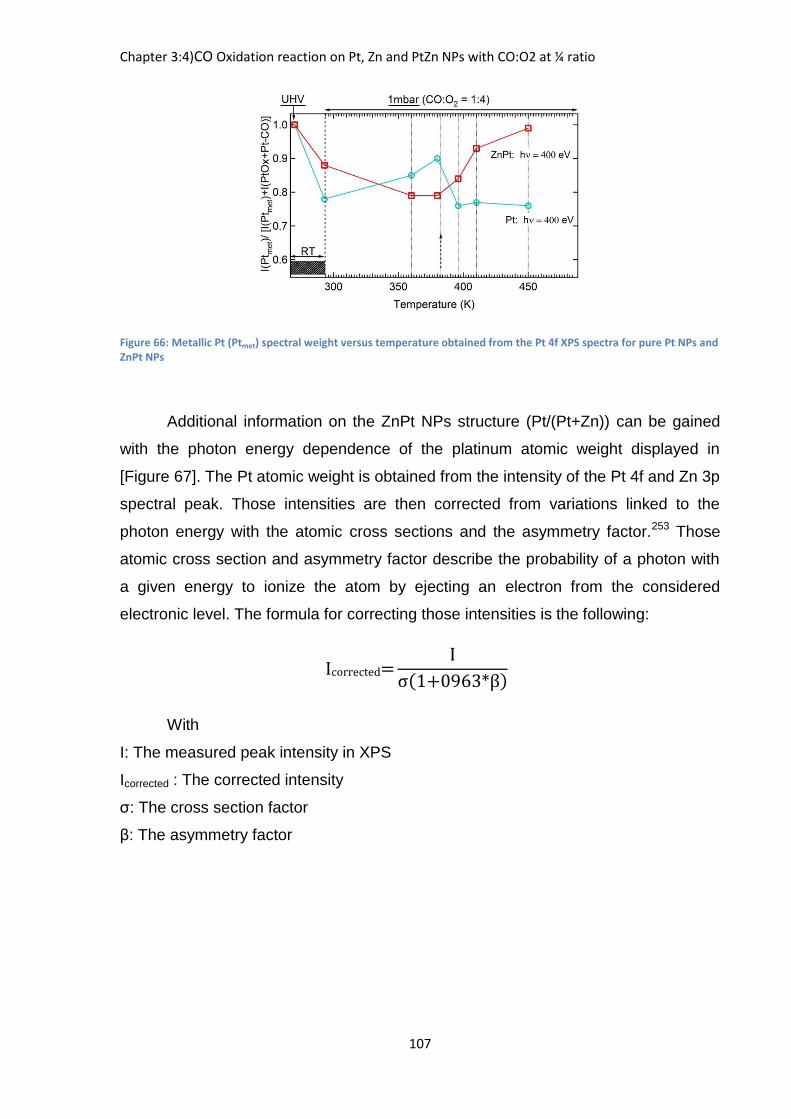
At the cathode, the oxygen molecules catalytically react with the
incoming protons and electrons from the anode and forms water. This
is the Oxygen Reduction Reaction (ORR). The half-cell reaction
equation of the cathode is
1
2O2+2H+ +2e-→H2O
The overall reaction of the PEMFC being:
H2+1
2O2 →H2O
Here we see that the main point of the fuel cell is to use abundant material like
O2 and H2 in order to produce energy while rejecting only water and unreacted gases.
Chapter 3:1)Introduction
73
One of the crucial points of that fuel cell is the nature of the catalyst being in
general platinum. In fact, the quest for environmentally friendly energy generation
solutions like fuel cell which emphasizes the role of Pt-based materials as major
catalysts has to be considered. 162–166 Indeed Platinum is one of the most prominent
transition metal catalysts used in heterogeneous catalysis thanks to its relevance in
a wide range of industrial applications.167–169 While Platinum shows excellent
catalytic performance, it also suffers from two issues: the CO poisoning creating a
rapid deactivation and from material dissolution.170,171 Indeed, when the CO strongly
adsorbed on the surface of the platinum, it blocks the active sites and prevents the
electro-oxidation reaction of H2 at the anode and the oxygen reduction reaction
(ORR) at the cathode of the fuel cell to take place. The contamination with CO
comes from the way H2 is produced; mainly from fossil fuels where CO is a
byproduct of the production and may not be fully eliminated.172 This susceptibility of
the platinum to the CO poisoning lies primarily on the slow kinetics of the ORR at the
cathode.162 Thus, in order to have an optimal operation of the cathode process there
needs to be a high number of available Pt active sites for the reaction. Strategies to
mitigate the CO poisoning of Pt active sites and thus improve the stability of catalysts
include the design of improved CO-tolerant catalysts with enhanced resilience
against decomposition.171,173
A way to make the fuel cell more cost effective was to use nanoparticles of
platinum thanks to their higher surface contact area. They exhibit higher catalytic
activity while using the same amount of metal than a more standard bulk electrode.
Yet issues mentioned before still apply to those nanoparticle(CO poisoning and
material dissolution). The conventional road to reach better efficiency by minimizing
those issues is to design Platinum based binary metal nanocatalysts.171,173–177 The
formation of a binary metal compound leads to a fundamental alteration in the
properties of the Pt-M (M = metal) catalysts.158,176–181 Especially changes in
electronic structure and Pt lattice (Pt-Pt bond distance) are key factors for increasing
the activity of Pt-based catalysts.181 Moreover, Pt stabilization against material loss
and rapid deactivation can be achieved by having synergetic effects due to the
presence of a second component in the catalyst.179 One example is Pt oxygen-
reduction fuel-cell electrocatalysts which when modified with Au clusters exhibit an
Chapter 3:1)Introduction
74
enhanced stability against dissolution. This stabilizing was attributed to high Pt
oxidation potential in the presence of Au.
Similarly, it was shown that in the Pt-based catalyst, the formation of a thin
transition metal-oxide layer on Pt promote the activation of O2, and keep unstable
the adsorption of CO on the active sites.182,183 These interfaces with confined
unsaturated sites present stronger resilience against CO poisoning and an increased
from the formation of a metal-oxide layer (shell) on Pt (core) represents an
interesting way to drastically reduce the Platinum loads in the catalysts while
maintaining their optimum efficiency as due to the Platinum being expensive, large
scale development of fuel cells remains hindered.184 Thus, Zinc which is an
abundant metal more affordable than platinum represents a good choice for the
creation of bi-metallic nanoparticles less expensive than pure platinum but with the
same catalytic activity. The incorporation of Zn on Pt has to be performed so that an
ultrathin ZnO layer is formed on metallic Pt. This is obtained when Pt-Zn NPs were
exposed to an oxidizing atmosphere. The formation of a ZnO layer on the shell
protects the metallic Pt. Pt/Zn has been shown to be an interesting catalytic system
as for example Pt-Zn catalysts demonstrated activities for methanol oxidation
comparable to pure Pt, which is relevant for fuel cells application but with excellent
poisoning tolerance.185 In addition, highly dispersed bimetallic Pt-Zn on carbon-
supported nanoparticle electrocatalysts have shown high performance activity for the
borohydride-hydrogen peroxide fuel cell, illustrating the advantages of Zinc
insertion.158 It should be noted that the first fuel cell that converts chemical energy to
electricity was invented by William Robert Grove. He was inspired by Christian
Schönbein’ research work and his fuel cell built in 1839 was made from Pt-Zn
material.186
It was shown that ultra-thin metal oxide films grown on Pt-group metals
supports exhibit large catalytic activity most notably for CO oxidation reaction.187
These inverse model catalysts, have contributed significantly to catch part of the
complexity of real-world catalysts systems and to better understand their reaction
mechanisms. Indeed, the metal/oxide interface, where important phenomena such
as charge transfer take place, are considered to be the prevailing catalytic sites. For
example, the increased reactivity on ultra-thin ZnO films supported on platinum
Chapter 3:1)Introduction
75
substrate was attributed to reactions occurring at the oxide/metal boundaries.188,189
The fact that superior CO oxidation reaction is seen on partially covered-Pt with ZnO
islands compared to the fully-covered surface one, at near-atmospheric pressures,
underlines that the interfacial oxide/metal is the most likely active sites.188,189 The
aforementioned studies emphasize the importance of ZnO/Pt systems for catalysis
applications and provide also suitable systems to elucidate the fundamental
processes that control the reactivity meta/oxide interfaces.
Thus, investigating these nanocatalysts under their working conditions of
pressures and temperatures is of prime importance in order to obtain a realistic
description of their catalytic activity associated properties.3,190 Due to their inherent
flexibility, nanocatalysts undergo significant structural and chemical changes under
reactive gases.191 This implies that their properties before and after the reaction may
differ noticeably. Moreover, dynamic and reversible processes occurring during the
reaction, such as element segregation but also surface restructuring and oxidation
states; make unpredictable the identification of the active structure/phase within
those catalysts.
Recently, a large set of in situ techniques has been used to overcome this
issue.192–197Therefore, the ability to monitor in situ the oxidation states of
nanocatalysts constituent, has provided valuable information on the understanding of
chemical and structural information. Besides, it has contributed to bridge the
pressure gap between the model catalysts investigated in UHV and those operating
under realistic conditions (high pressure exposures). In particular, Synchrotron
radiation Near Ambient Pressure Photoelectron Spectroscopy (NAP-XPS)198–200 is
especially suitable to monitor in situ the presence of the gas phase at high pressures
the evolution of oxidation states, active phase, elemental composition and catalytic
surface reactions.
These recent developments of in-situ techniques have brought about
remarkable achievements that helped better understand fundamental phenomena
that control surface catalyzed reactions.3,201,202 They also revived studies on close-
packed Pt single crystals (flat or stepped high Miller index) even though that not long
ago those systems were considered inadequate to reach a close representation of
real-world catalysts operating mechanisms and their related issues when
Chapter 3:1)Introduction
76
investigated in UHV conditions.181,203–207 Thus, the oxidation of Pt(111) at near
ambient O2 pressures (in the millibar range), differs from that under low oxygen
pressure (UHV). Indeed it has been shown to proceed via a PtO-like surface-oxide
phase emphasizing the effect of large chemisorbed O2 induced by the high O2
pressure coverage.205 Exposure of Pt(110) to elevated pressure of pure O2 induced
the formation of reconstructed nano-islands of PtO2-like surface oxide along with
chemisorbed oxygen. Both oxygen species were relieved by the CO gas phase.203
Moreover, the study at near ambient conditions of high Miller index Pt surfaces can
serve to link model-surface catalysts (single crystal) to supported nanoparticles that
are close to realistic catalysts.202,206,207
Thus, in order to move closer towards real-world catalysts, the study of the
chemical and structural evolution of surface catalysts under chemical reaction
condition on Pt-based nanoparticles, represents an appropriate approach in this
regard.190,208
The following described experiences are twofold. First we have studied the
oxidation of nanoparticles under pure oxygen exposure. Second we have carried out
the CO oxidation reaction as a well suited prototypal reaction behavior before
moving to the ones occurring in a real fuel cell reaction. Core level photoemission
measurements were performed using the synchrotron NAP-XPS in isobar condition
as a function of step-wise annealing temperature. The size and morphology of
nanoparticles were studied through Scanning Tunneling Microscopy (STM)
experiments.
The nanoparticle were fabricated by electron beam evaporation from a metal
source in UHV onto a rutile TiO2(110) single crystal substrate(length 10 mm × width
5 mm × thickness 0.5 mm) substrate. The TiO2(110) surface is prepared by cycles
(more than 20) of Ar+ sputtering (for 15 min) and annealing at 800 K (for 15 min).
The deposition was carried out while the surface was kept at room temperature. Pt is
deposited from a high purity Pt rod (diameter = 2 mm, purity = 99.5%), and Zn from
high purity Zn wires (diameter = 2 mm, purity = 99.5%) contained in a Mo crucible.
For the bimetallic nanoparticle, Pt is deposited first and Zn second with the objective
of having a Zn/Pt ratio close to one.
Chapter 3:2)Morphology study with STM
77
2) Morphology study with STM
The STM setup, comprises two connected chambers, one containing the
microscope (a variable temperature XA microscope from Omicron NanoTechnology)
and one the preparation tools, both with a base pressure better than 3×10-11 mbar.
STM imaging is carried out at room temperature. To prepare the tip, we follow the
standard procedure, i.e. the DC electrochemical etching of a W wire (of diameter
0.25 mm) in a 2M NaOH electrolyte. Then the tip is cleaned by flash heating, via
direct current annealing in the UHV system prior to its use. In the STM experiments,
the deposits are examined after deposition.
In [Figure 47(a)] we show that the pure Platinum nanoparticles (NPs) are
distributed homogenously on the support with a surface density of 7.8 x 10¹² NPs
/cm2. The free TiO2 area fraction left uncovered after Pt deposition is around 65 %.
The apparent average height of those nanoparticles is 0.50 ± 0.15 nm (note that the
(001) and (111) interplanar distances in cfc Pt are 0.192 nm and 0.226 nm,
respectively). The diameter of the NPs [Figure 47(d)] is 2.3 ± 0.7 nm. While we could
not identify in the images platinum atoms dispersed on the TiO2 surface, their
presence should be considered. Assuming a cap shape for the NPs, a rough
estimate of the surface density of Pt atoms is ~4 x 10¹⁴ /cm2.
The Zn NPs as shown in [Figure 47(b)] are also distributed homogeneously on
the support. The density of Zn NPs is 3.0 x 10¹² NPs/cm2. The TiO2 free area is
~84% of the surface. The average apparent height of the Zn NPs is 0.74 ± 0.14 nm
(the (0001) interplanar distance in hcp Zn is 0.247 nm). The diameter of the NPs is
2.1 ± 0.9 nm [Figure 47(e)]. Consequently the Zn NPs shape and density is similar to
that of the Pt NPs. Assuming a cap shape for the Zn NPs an estimate of the Zn atom
surface density is ~3 x 10¹⁴ /cm2, a value very close to the estimated amount of
platinum in the pure Pt NPs.
To form the ZnPt bimetallic NPs with an average stoichiometry close to 1:1,
we first deposit Pt, and then Zn in exactly the same conditions as for the pure
monometallic NPs. Pt is deposited first because it exhibits a stronger interaction with
TiO2(110) than Zn and can serve as seeds for the nucleation of Zn. The resulting
overall density of the bimetallic NPs [Figure 47(c)] is 10.8 x 10¹² NPs /cm2.
Chapter 3:2)Morphology study with STM
78
Compared with the pure Pt NPs, we observed an increase in NPs density by 38%.
This increase is relatively moderate, as it is much less than an expected double
value if pure Zn NPs stay apart from pure Pt NPs. Therefore the STM images show
that Zn atoms are attracted by the pre-existing Pt NPs and forms bimetallic NPs.
Naturally some pure Zn NPs may also appear on the surface and some pure Pt NPs
might still exist. Compared with pure platinum NPs the apparent average height of
ZnPt NPs has increased to 0.7±0.17 nm. Although heights do not only depend on the
physical shape but also on the electronic density, it may be a further indication that
Zn is added to the Pt mounds. The average diameter [Figure 47(f)] of the NPs
measured after Zn deposition is 2.6 ± 1.1 nm. The distribution width is broader than
that of the pure Pt NPs but similar to that of Zn NPs.
Figure 47: 3D empty states STM of pure pt(a), pure Zn(b), PtZn (c) and their histogram distribution of the nanoparticle diameter (d,e,f) respectively
d)
e)
f)
Chapter 3:3)Pure oxidation on pure Pt and PtZn NPs
79
With those STM experiment we are confident that we can produce bimetallic
NPs and observe their evolution in situ with the NAP XPS.
3) Pure oxidation on pure Pt and PtZn NPs
One of the main issues with studying catalyst under synchrotron radiation is
the beam damage. Beam damage can alterate the nature of the catalysts such as
molecular dissociation of oxidation. The beam damage is also more important when
experiments are carried out beyond the ionization value of the oxygen 1S orbital.
Thus in order to minimize those damages we have changed the spotting region each
time we changed the excitation energy of the beam photon. Moreover for excitation
energy higher than the ionization potential of the O 1s orbital, we have detuned the
undulator in order to reduce the photon flux.
3.a) Metallic Peak
The oxidation of Pt and ZnPt samples under 1 mbar of pure oxygen was
monitored via in situ NAP-XPS investigations. The evolution of Pt 4f spectra of pure
Pt and bimetallic PtZn NPs, which gives the information on the oxidation state of
platinum, (the catalyst) was followed in UHV and under an oxygen pressure of 1
mbar as a function of the temperature from RT up to 475 K. In order to monitor the
evolution of oxidation states and elemental composition on the surface of NPs and
inside the bulk, two photon energies, 400 eV and 165 eV, were used. Thus, at a low
photon energy of 165 eV, more sensitive to the topmost surface layer of the NPs, the
IMFP of photoelectrons is about 0.42 nm for the Pt 4f core level and 0.45 nm for Zn
3p,72 which compared with the size of our NPs (between 2 and 2.5 nm) doesn’t
allows us to completely probe of NPs giving mostly surface information. In contrary,
photons with a high energy of 400 eV, the IMFP will be about 0.64 and 0.78nm for Pt
4f and Zn 3p core level peak respectively.72 As 75% of the signal comes within 3λ, at
this higher excitation energy we will be able to probe completely our NPs.
3.a.1) On pure Pt Nanoparticle
Chapter 3:3)Pure oxidation on pure Pt and PtZn NPs
80
The investigation of the oxidation of pure Pt NPs on reduced TiO2(110)
through the Pt 4f core-level under an oxygen pressure at 1 mbar of O2 and at
different temperature are shown in [Figure 48]. Prior to the exposure, we have first
measured in UHV at room temperature the Pt 4f core-level region of the Pt NPs as
deposited.
Figure 48: Core level Pt 4f of pure Pt NPs on TiO2(110)-(1x1) under 1 mbar of O2 gas at different temperature taken at hv=400 eV (a) and 165 eV(b)
Chapter 3:3)Pure oxidation on pure Pt and PtZn NPs
81
The XPS measurements in UHV conditions of the Pt 4f region shows one
single peak at a binding energy (BE) of 71.3 eV [Figure 48] and its spin orbit
component at a binding energy of 74.6 eV. Those peaks were fitted with a Doniach-
Sunjic function for the metallic component and the separation between the two spin
orbits was always fixed with a distance of 3.3eV and the intensity ratio between the
two spin orbits is 3/4. This value of the Pt 4f7/2 peak, indicates that the Pt NPs as
prepared are in a metallic state (Pt0) although the BEs commonly reported for the
bulk metallic Pt are found at 71.0 eV - 71.2 eV.203,206,209,210
The slightly higher BE (+ 0.1 eV - + 0.3 eV) measured in UHV for these small
Pt NPs may come from both an initial and a final state effect.211 First, when metallic
nanoclusters are deposited on an n-type semiconducting clean surface, such as in
our reduced TiO2(110), a shift in the BE may occur due to an upward band bending
effect.212,213 Indeed on clean TiO2, the surface is filled by electrons coming from the
bulk inducing a negative charge at the surface which creates an upward band
bending. This original band bending is further aggravated by the deposition of Pt as it
increases the negative charge at the surface.212,213
Figure 49: (a) Band-bending diagram of TiO2(110) surface and (b) core level spectra of Ti 2p at three states different states: clean (reduced), after Pt deposition and after subsequent exposure to 1 mbar of O2
Chapter 3:3)Pure oxidation on pure Pt and PtZn NPs
82
Moreover this band bending can be further aggravated with the introduction of
oxygen. Indeed, as shown in the above STM section, there are still TiO2(110)
surface free of nanoparticles after Pt deposition which contains oxygen vacancies.
Since the surface was not fully covered, oxygen vacancies were still present at the
TiO2 surface, so that the interactions with O2 may occur leading to their suppression.
Thus, the absence of O2 vacancies together with the increase of the O2 molecular
adsorption will led to an increase of the band bending.214 Those successive
evolutions of the band bending are schematized in [Figure 49(a)]. A better way to
follow that band bending evolution is to follow the Ti 2p core level peak [Figure 49(b)].
Indeed we observed in those spectra the diminution of the Ti3+ state and a shift of
the Ti4+ (main peak) of 0.2 eV to lower binding energy when Pt is deposited The
filling of Ti3+ is completed with the introduction of O2 leading to the suppression of the
oxygen vacancies and another shift of 0.1 eV of the Ti4+ peak to lower binding
energy is observed.
In contrast to the Ti 2p peak, the Pt 4f7/2 metallic peak has a core level shift of
0.7 eV towards higher binding energy (opposite direction of Ti 2p) with the
introduction of the O2 gas [Figure 48]. This shift is not linked to the TiO2 band
bending change due to the O2 introduction, this shift is related to the chemical
modification of the nanoparticle. This is illustrated by the apparition of an additional
component at 72 eV with a core level shift of + 0.7 eV with respect to the BE of Pt
4f7/2 metallic peak. This new component was fitted with a Voight function; the
distance between the two spin orbits was fixed at 3.3 eV and used an intensity ratio
of ¾.
This additional peak is attributed to Pt surface oxide which formed due to the
presence of chemisorbed O2. The presence of this additional component at a higher
binding energy is consistent with results reported in the literature on the Pt surface-
oxide small clusters on stepped single crystals206 and on Pt atoms bound to
chemisorbed O2.203 This spontaneous formation of Pt surface oxide on the NPs at
room temperature (RT) after exposure to 1 mbar of O2 can be attributed to their
small size (average apparent height 5 Å on STM measurement). Coordinately
unsaturated Pt atoms are highly reactive and inherently present on the surface of
these small NPs. They can be readily oxidized by O2 at high dosing pressure even at
RT. The coexistence of both a Pt surface oxide component and a metallic Pt one
Chapter 3:3)Pure oxidation on pure Pt and PtZn NPs
83
suggests the possible formation of a thin oxide shell around the metallic core of the
Pt NPs. However, there is no other peak at higher binding energies for our Pt NPs.
This implies that the presence of bulk Pt oxides can be excluded since the
corresponding Pt 4f7/2 BEs were usually reported at CLS shift of + 1.3 eV with
respect to the metallic component and typically above 72.8 eV in binding
energy.203,209,215,216 The large cohesive energy in 5 d transition metals (5.84 eV for
Pt)217 hinders the formation of bulk oxide but it does not impact the formation of
surface oxide. With an increasing temperature up to 475 K under O2 and under a
pressure of 1 mbar, no noticeable change was seen in the BE of the Pt surface oxide
component located at 72.0 eV.
As the temperature increases during the experiment we observed a drastic
attenuation of the Pt 4f spectra at 475 K [Figure 48(a)]. It is certain that a desorption
of platinum at this rather low annealing temperature can be ruled out due to the high
melting temperature of platinum and the fact that thin oxide films formed on their
metal surface analogues are thermodynamically very stable.218 Indeed, Pt oxide
clusters on the surface has been shown to be stable up to 1250 K.216 Therefore, the
strong decrease in the Pt signal, which was seen to amplify rapidly above 400 K
under O2, has to be attributed to the encapsulation of Pt NPs by TiOx (0≲x≲
2compounds. Although, that phenomenon occurs at a much higher temperatures
(above 670 K) in UHV conditions, it takes place at much lower temperatures under
high O2 atmosphere due to the reaction of the O2 with the reduced TiO2(110)
surface.214 The encapsulation effect is very consistent with the fact that at 475 K, the
Pt signal was still visible with the measurements performed at photon energy ℎ =
400 eV [Figure 48(a)] while it was almost negligible for those acquired at ℎ = 165 eV
[Figure 48(b)]. Indeed, photon energy of 400 eV allows a deeper probing than at 165
eV. Platinum is buried in the TiO2 and only an excitation energy of 400 eV can reach
the buried element. The photon energy at 165 eV corresponds to a photoelectron
kinetic energy of just ~ 93.7 eV and it only allows the access to the topmost surface
which is depleted by Pt with an inelastic mean free path of 4.15 Å.72
3.a.2) On ZnPt nanoparticle
The results on ZnPt NPs exhibit important differences compared to those
obtained on pure Pt NPs. Indeed, the core level spectrum measured in UHV
Chapter 3:3)Pure oxidation on pure Pt and PtZn NPs
84
conditions on the Pt 4f region [Figure 50] was convoluted with two components
corresponding to BEs at 71.6 eV and 72.2 eV, indicating a major effect associated
with Zn contribution. The first component at 71.6 eV (blue shaded) is attributed to the
metallic Pt 4f7/2 contribution. The second component located at 72.2 eV (green
shaded) which was not seen in pure Pt results is associated with Pt 4f7/2 in the Pt-Zn
alloy phase.219
Chapter 3:3)Pure oxidation on pure Pt and PtZn NPs
85
Figure 50: Core level Pt 4f of PtZn NPs on TiO2(110)-(1x1) under 1 mbar of O2 gas at different temperature taken at hv=400 eV (a) and 165 eV(b)
The coexistence of these two contributions indicates the formation of a Pt-Zn
interface in the PtZn NPs. The extra CLS of + 0.3 eV observed in the Pt 4f7/2 for the
metallic component in PtZn NPs with respect to the Pt 4f7/2 measured for pure Pt
NPs, indicates the presence of an additional band bending effect as a result of Zinc
deposition. We have seen from the STM image that there is a significant increase in
the density of NPs after the deposition of Zn on the Pt NPs /TiO2(110) surface. Thus,
more metallic NPs were in contact with the reduced TiO2(110) surface leading to an
extra bend bending compared with the case of pure Pt NPs. This effect is consistent
with the absence of a core level shift after the exposure to 1 mbar of O2 [Figure 50].
Indeed, the presence of Zn resulted in less exposed reduced TiO2(110)
surface that can interact with O2. However, the band bending is completely
suppressed with the thermal treatment since at 475 K a CLS of – 0.4 eV was
measured as the metallic Pt 4f7/2 was stable at 71.2 eV. The presence of a third
component at 72.6 eV, with a CLS of + 1.2 eV with respect to the metallic one, after
exposure to O2 is attributed to Pt surface oxide. The large CLS of + 1.2 eV measured
for this component in PtZn with respect to the value (+ 0.7 eV) seen in the case of
pure Pt NPs, is associated with a different bounding environment for Pt atoms. This
is due to the presence of the neighboring ZnO interface. The Pt-Zn alloy and the Pt
surface oxide components were present in the Pt 4f spectra up to 440 K.
While there is no detectable Pt 4f signal on pure Pt NPs samples at 440 K
when measured with 165 eV photon energy, it is still present in PtZn NPs sample in
the same conditions [Figure 50(b)]. Therefore, the presence of Zn contributes to the
stabilization of Pt and help at reducing the encapsulation effect by TiOx species.
Chapter 3:3)Pure oxidation on pure Pt and PtZn NPs
86
Figure 51: Evolution of the platinum metallicity of both Pt and PtZn NPs through the experiment
In [Figure 51] we show the evolution of Platinum metallic component, as
measured from the integral intensity of the photoemission core level spectra shown
in [Figure 48] and [Figure 50], with respect to the Pt surface oxide contribution. While
the ratio (Ptmet /(Ptmet + PtOx)) evolution shows almost the same values for both
400 eV and 165 eV in the case of pure Pt NPs and gave the same proportion of
oxide and metallic part at both energy, it exhibits substantial differences in the case
of PtZn NPs. Indeed in the case of ZnPt nanoparticle, the bulk sensitive condition
(ℎ = 400 eV) shows a higher degree of metallicity in the nanoparticle than in surface
sensitive condition (ℎ =165 eV). This can be explained by the reduced platinum
surfaces exposed to oxygen due to the presence of a Zn layer on top of it. In addition
the Zinc stronger affinity to O2 makes it more susceptible to oxidize before platinum
and thus acts as a sacrificial element.
Those XPS measurement in the metallic peak have shown the beneficial
effect of adding zinc to platinum: it limits the platinum oxidation and reduces the
platinum susceptibility to encapsulation.
3.b) C 1s and O 1s Peak
We will now discuss the C 1s and O 1s spectra for both samples. In pure
oxidation conditions, it is the O 1s that will provide most valuable information on the
1.0
0.8
0.6
0.4
0.2
0.0
Pt m
et/ (
Pt m
et+
PtO
x)
450400350300
Temperature (K)
293
1mBar O2 UHV
Pt NPs: 400 eV Pt NPs: 165 eV PtZn NPs: 400 eV PtZn NPs: 165 eV
Chapter 3:3)Pure oxidation on pure Pt and PtZn NPs
87
oxidation states of the surfaces. The C 1s will provide mainly the information on the
residual carbon in the UHV chamber.
3.b.1) On pure Pt Nanoparticles
First we will discuss the C 1s spectra [Figure 52] recorded for the pure Pt NPs
sample. In this spectrum, we observe in the UHV condition the presence of an initial
carbon contamination. It is composed of two peaks, a first one located at a binding of
284.8 eV (attributed to C-C liaison) and a second one at a higher binding energy of
286.6 eV.220 This second component is ascribed to C-O-C liaison.
The introduction of the O2 gas leads to an Initial shift of the carbon
contamination and its oxidization. In addition, new peaks situated at 289 eV and at
290 eV have appeared (noted Carb*). This binding energy region corresponds to the
area where carbonate and carboxyl species were commonly reported.220 Moreover
we observe a core level shift of 0.3 eV at higher energy for both the C-C and C-O-C
component. This shift may be linked to the band bending as they follow the trend
observed with the Pt 4f peaks.
Figure 52: C 1s core level spectra under 1 mbar of O2 at different temperature for pure Pt NPs
XP
S Inte
nsity (
arb
. units)
292 290 288 286 284 282
Binding Energy (eV)
UHV293 K
293 K
370 K
475 K
C 1s
h = 400 eV
O2: 1mbarCarb*
C(gr)
Chapter 3:3)Pure oxidation on pure Pt and PtZn NPs
88
With the heating treatment we observe the gradual disappearance of the
carbon species due to desorption. A binding energy downward shift of the peaks
which follows the same trend as Pt 4f is also observed.
At high temperature (475 K) all carbon and platinum signals have disappeared.
The Pt 4f vanishing is due to the encapsulation by TiOx species. Indeed at this
temperature in surface sensitive condition (ℎ =165) there no more signal from the
Platinum. The platinum seems to be the adsorption site of the carbon species.
We will now consider the O1s spectra [Figure 53]
Figure 53: O 1s core level spectra under 1 mbar of O2 at different temperature for pure Pt NPs
Here, in UHV condition we just observe a peak at 530.25 eV corresponding to
the the oxygen coming from the substrate: TiO2.221,222 When O2 is introduced, we
see the apparition of the appearance of the two characteristic peaks of the gas
phase (O2(g)) at a binding energy comprised between 540 and 538 eV, a carbonate
component at 532.3 eV and a shift of the O 1s in the TiO2 associated to the evolution
of the band bending as discussed earlier. The O2(g) signal is made of two
XP
S Inte
nsity (
arb
. units)
542 540 538 536 534 532 530 528
Binding Energy (eV)
O 1s
h = 635 eV
293 K
293 K
370 K
475 K
UHV
O2: 1mbarO2(g)
Chapter 3:3)Pure oxidation on pure Pt and PtZn NPs
89
components. The main one at lower binding energy is a quartet state (4). The
smaller one shifted by ~1 eV to higher binding energy is a doublet state (2).223
The O2(g) signal does not exhibit clear vibrational progressions, due to vibrational
spacing of only ~0.18 eV (4) and ~0.13 eV (2). The leading component of the 4
peak is the adiabatic peak.223
With the increased temperature we see a gradual diminution of the
carbonates up to their almost total desorption at 475K. We also see a shift of the
oxygen gas phase that is linked to the variation of the sample’s surface work function.
Indeed with the desorption of adsorbed species, its value has certainly changed
leading to a shift of the gas phase.
3.b.2) On PtZn Nanoparticles
We will now discuss the evolution seen in the ZnPt NPs sample starting with
the C1s spectra [Figure 54].
Figure 54: C 1s core level spectra under 1 mbar of O2 gas at different temperature for ZnPt NPs
XP
S Inte
nsity (
arb
. units)
292 290 288 286 284 282
Binding Energy (eV)
C 1s
h = 400 eV
293 K
293 K
370 K
400 K
440 K
475 K
O2: 1mbar
UHVCarb*
C(gr)
Chapter 3:3)Pure oxidation on pure Pt and PtZn NPs
90
First in UHV condition we observe the presence of an initial carbon
contamination with an aliphatic and a C-O-C component (grey shaded). Those are
also observed in the case of pure Pt Nps. Yet here there is also a few adsorbed
carbonate species (orange component) present. In this case considering that we
have zinc which stabilizes carbonate; this component is more susceptible to be some
carbonate rather than carboxyl even though the latter one can be an intermediate
leading to carbonate with a short lifetime.
When the O2 gas is introduced, there is a strong increase of the carbonate
signal and a decrease of the carbon contamination. With increasing temperature we
observe a desorption of all species but compared with the pure Pt case here we still
see the presence of the carbonate species at the highest temperature (475 K). This
is due to the presence of zinc in the bimetallic NPs. The carbonate species
associated to zinc will further discussed in the next part in presence of CO gas.
Figure 55: O 1s core level spectra under 1 mbar of O2 gas at different temperature for ZnPt NPs
XP
S I
nte
nsity (
arb
. u
nits)
542 540 538 536 534 532 530 528
Binding Energy (eV)
293 K
293 K
370 K
400 K
440 K
475 K
UHV
O2: 1mbar
O 1s
h = 635 eV
O2(g)
O(TiO2)
Carb*
OH
Chapter 3:4)CO Oxidation reaction on Pt, Zn and PtZn NPs with CO:O2 at ¼ ratio
91
For the O 1s spectra [Figure 55] in UHV condition there is the presence of the
oxygen from the substrate TiO2 but we also observe a shoulder at higher energy
(cyan component). This shoulder is linked to OH species bonded with titanium from
dissociation of residual water molecules.
When O2 is introduced, we see the appearance of the gas phase (O2(g)) with a
binding energy comprised between 540 and 538 eV, a carbonate component at 532
eV and we observe a shift of the O 1s in then TiO2 component linked to the band
bending. With increasing temperature we see the diminution of the carbonate
component due to partial desorption but it is still present even at 475 K. This
confirms the observation mentioned in the C 1s spectra.
As with the pure Pt NPs there is a shift of the gas phase due to the variation of
the sample’s surface work function resulting from the desorption of species from the
surface.
4) CO Oxidation reaction on Pt, Zn and PtZn NPs with CO:O2 at ¼ ratio
The CO oxidation reaction (2CO + O2 2CO2) on pure Pt, pure Zn and ZnPt
NPs samples was monitored in situ through the evolution of both C 1s and O 1s
core-level spectra. The C 1s and O 1s core level spectra give information on CO, O2
and produced CO2 in the gas phase. In addition, they provid information on adsorbed
species such as CO and carbonates. The total pressure of the CO:O2 mixture (partial
pressure ratio of 1:4) was set to 1 mbar. The system was then heated with a button
heater from room temperature (293 K) to 450 K in a step-wise manner. The oxidation
state of the NPs were monitored through the Pt 4f core level peak for NPs having
platinum and through the Zn 3p core level for NPs containing Zinc.
4.a) C 1s and O 1s spectrum
Let us first consider the C 1s [Figure 56] core-level spectra. Those spectra are
recorded at a photon energy ℎ = 400 eV for the three different NPs (pure Pt
nanoparticles (a), pure Zn nanoparticles (b) and bimetallic ZnPt nanoparticles (c)) as
a function of the annealing temperature. The UHV spectrum was recorded at room
temperature (293 K) on the samples as prepared before introducing gases. All the
other spectra were recorded in isobaric conditions under a pressure of 1 mbar with a
Chapter 3:4)CO Oxidation reaction on Pt, Zn and PtZn NPs with CO:O2 at ¼ ratio
92
CO:O2 ratio of 1:4 (oxygen rich mixture). The component noted CO(g) is associated
with the CO in gas phase. COad corresponds to adsorbed CO species. CO2(g) is the
CO2 produced by the reaction in gas phase. Carb* corresponds to diverse
carbonates species adsorbed on the sample surface. In the C 1s spectrum [Figure
56], C(gr) is ascribed to the graphitic carbon coming from the initial carbon
contamination at 284.6 eV.224 This contamination is observed for all three samples
and will be strongly reduced with the increased temperature and oxidative conditions.
Ultimately it will be eliminated at the higher temperature for the Pt and Znpt sample
while a small amount will still be observable for Zn NPs. Three other components are
seen at higher binding energy (285.9 eV, 286.7 eV and 287.3 eV). The component at
286.7 can be attributed to a COC contamination.220 The cyan structure at the highest
binding energy (left) is the K 2p3/2 component of a potassium impurity commonly
seen in TiO2(110).225,226 The K 2p3/2 should be visible at a binding energy of 296 eV
not visible due to a short energy window. The possibility of it being a carbon based
component is to be excluded due to the fact that this peak stays stable thought all
the experiment for fall three samples while all the other carbon based component
change. Thus it can be used as a yardstick to compare signal intensities. The
binding energies (measured from the substrate Fermi level) of the gaseous species
CO and O2, (noted CO(g) and O2(g), respectively), and of the reaction product CO2
(noted CO2(g)) are found at significantly higher binding energy values than the
adsorbed surface species like adsorbed CO (noted CO(ad)) or carbonates (noted
Carb*). Indeed, in the C 1s spectra the peaks above 290 eV are related to the gas
phase, for the O 1s spectra it’s the peak above 534 eV which are related to the gas
phase.3,227–229
Chapter 3:4)CO Oxidation reaction on Pt, Zn and PtZn NPs with CO:O2 at ¼ ratio
93
Figure 56: C 1s core level spectra under 1 mbar of CO-O2 gas mixture (1:4 ratio) at different temperature for pure Pt NPs (a), Pure Zn NPs (b) and ZnPt NPs (c)
This ability to distinguish the gas phase and solid phases makes the NAP-
XPS particularly suited for the monitoring of this reaction product. For example, it
allows an immediate identification of the activation temperature of CO oxidation.1,3
The CO(g) core-level spectrum is visible at a binding energy of about 291 eV.229 The
produced CO2(g), appears in the C 1s spectra [Figure 56] at a higher energy than
CO(g) in the energy range 292.1 eV to 292.7 eV.227–229 The overall energy resolution
(~200 meV) available during the experiment is sufficient to make the vibrational fine
structure of the CO(g) C 1s peak observable[Figure 57]. Indeed the peak was fitted
with three components equally separated by ~300 meV and with a full half width
maximum of 0.3 eV in accordance with the literature.230
Chapter 3:4)CO Oxidation reaction on Pt, Zn and PtZn NPs with CO:O2 at ¼ ratio
94
Figure 57: CO gas phase (CO(g)) in C 1s spectrum measured at hv=400 eV fitted with a vibrational progression
In the O 1s spectra [Figure 58] recorded at ℎ =635 eV under the same
condition as the C 1s spectra, the CO2 gas phase appears as an unstructured peak
in the 535 eV - 536 eV range at lower binding energy than both O2(g) and CO(g). The
O2(g) peak is found in the 537 eV to 539 eV binding energy range, and the CO(g) peak
is visible as a small shoulder to the right of the O2(g) peak. It should be noted that the
gas phase binding energies shift with temperature, phase binding energies depend
on the work function of the sample surface.2,36,231
Chapter 3:4)CO Oxidation reaction on Pt, Zn and PtZn NPs with CO:O2 at ¼ ratio
95
Figure 58: O 1s core level spectra under 1 mbar of CO-O2 gas mixture (1:4 ratio) at different temperature for pure Pt NPs (a), Pure Zn NPs (b) and ZnPt NPs (c)
The onset of CO oxidation reaction is characterized by the appearance of the
CO2(g) peak in the C 1s and O 1s spectrum windows. For the pure Pt NPs and ZnPt
NPs samples the product CO2(g) is detected at ~380 K, with the reactants (CO(g) and
O2(g)) still visible. The pure Zn NPs sample also demonstrates the ability to activate
the CO oxidation reaction. Yet on this sample the onset of CO2(g) production is seen
at higher temperature of 396 K. In all samples, the activation of CO oxidation
coincides with a significant decrease in the intensities of CO(g) peak. At the next
heating step, the CO(g) peak is no longer detected (better seen in the C 1s window, in
[Figure 56]). The temperature at which the CO(g) signal disappears is indicative of the
renowned mass transport phenomena in the vicinity of the reactive surface. This
illustrates also the high catalytic activity of these samples, i.e; high concentration of
Chapter 3:4)CO Oxidation reaction on Pt, Zn and PtZn NPs with CO:O2 at ¼ ratio
96
the produced CO2 gas phase. The temperature of the mass transport limit was
detected at 396 K for both the pure Pt and ZnPt NPs samples, and at 450 K for the
pure Zn NPs sample. Owing to this high catalytic activity CO molecule arriving “in the
vicinity of the surface” are quickly transformed into CO2, depleting the gas layers
close to the active surface from CO molecules. This phenomenon of mass transport
limitation was also observed by Blomberg and coworkers229 in their NAP-XPS study
of CO oxidation on a single crystal of Pd(100).
The CO oxidation activity was monitored via the monitoring of the CO2(g)
signal evolution as a function of the temperature. Thus, since the O2(g) peak is
always present throughout the experiment in the O 1s spectrum [Figure 58] and a
signal of CO2(g) is also visible when the CO oxidation starts, we can plot the ratio
ICO2(g)
IO2(g)
against the heating temperatures [Figure 59], with ICO2(g)and IO2(g)
respectively
the intensities of the CO2(g) and O2(g) peak in the O 1s spectra window. It shows, that
the CO2(g) yield of the pure Pt NPs and ZnPt samples are very similar (reaction onset
at 380 K, maximum CO2 yield at 396 K). In contrast, the pure Zn NPs sample is less
efficient than the surface with Pt-containing catalysts at all temperatures, up to 450 K.
Figure 59: Evolution of CO2/O2 gas phase ratio as a function of temperature
Now that we have described the gas phase spectra and the temperature
conditions that lead to CO oxidation, we can turn our attention to the correlative
changes in the “solid-state” core-levels.
Chapter 3:4)CO Oxidation reaction on Pt, Zn and PtZn NPs with CO:O2 at ¼ ratio
97
4.b) Metallic peak
First we shall consider the pure Pt and pure Zn NPs cases. Then we shall
discuss the behavior of the bimetallic NPs. Indeed this more complex bimetallic
system will be discussed against the information gathered on the “pure” NPs
systems.
4.b.1) Pure Pt NPs
The Pt 4f spectra [Figure 60(a)] were measured at ℎ =400 eV.
Figure 60: Pt 4f core level spectrum (a) and the C 1s core level spectrum (b) recorded at hv=400 eV for the pure Pt NPs
In the UHV conditions at room temperature (prior to exposure to the gas
mixture) the peak is metallic (Ptmet) similar to the one seen in the pure oxidation part.
However when the CO:O2 mixture is introduced at room temperature (293 K), a new
component appears at a higher binding energy (+0.9 eV, orange-shaded) with
Chapter 3:4)CO Oxidation reaction on Pt, Zn and PtZn NPs with CO:O2 at ¼ ratio
98
respect to the metallic peak (Ptmet, violet shaded). We attribute this new component
to Pt-CO bonds. This corresponds to the adsorption of CO on the Pt NPs, as
indicated by the strong CO(ad) signal in the C 1s spectrum [Figure 60(b)].
Indeed, as shown in Ref. 232, In their Pt 4f spectra of the Pt(111) surface the
CO(ad) induces a sizeable shift (to higher binding energy of the Pt 4f) with respect to
the bulk component (~+1 eV for the atop bonding, ~+0.3 eV for the bridge). The
calculated chemisorption energies of CO on atop sites are in the 1.51-1.54 eV range
for the Pt(111) surface.233 This is a considerably greater energy than on perfect (110)
rutile TiO2 which is in the range of 0.2-0.36 eV range234. Moreover, a possible
trapping effect of Ti3+ present on the TiO2 surface defects on CO should be negligible
due their quenching after Pt deposition [Figure 61].235
Figure 61: Ti 2p core level spectra of pure Pt NPs sample recorded at hv=560 eV
Naturally, here our Pt NPs present various facets, as suggested by the 3D
STM images [Figure 47(a)]. CO C 1s XPS data are available on Pt(111) single
crystals.236,237 In those data, the CO molecule occupies sequentially the atop and the
bridge sites. The C 1s binding energies of CO in atop and bridge sites are 286.7 and
Chapter 3:4)CO Oxidation reaction on Pt, Zn and PtZn NPs with CO:O2 at ¼ ratio
99
286.0 eV, respectively.238 Assuming that (111) Pt facets dominate, then the
introduction of the gas mixture leads to the preferential occupation of atop positions
by CO, with minority occupation of the bridge sites. Yet other sites must be
envisaged due to the nanometer size of our Pt NPs, CO could adsorb on steps
where under-coordinated Pt atoms are present. With this consideration the
component at 287.6 eV was attributed to CO bonded to the under-coordinated Pt
atoms. For their part, the O 1s binding energies of CO of bridge, atop and under-
coordinated Pt sites are reported at 531.1, 532.7 and 533.1 eV, respectively.202 Yet
they are overshadowed by the intense TiO2 component and surface carbonates as
these components fall in within the same binding energy range, see [Figure 58(a)].
At 380 K, the CO(ad) signal in the Pt 4f spectrum tends to decrease, but the C
1s binding energies (and relative intensities) of the two main CO(ad) components
(attributed to atop sites and under-coordinated Pt sites) do not change. The spectral
weight of Ptmet also increases in correlation with the decrease of the CO(ad) signal.
However when the CO oxidation reaches its maximum [Figure 59] at 396 K, the
CO(ad) and CO(g) signal vanishes completely [Figure 60(b)]. As the reaction between
CO and O2 takes place on the surface, the CO has a very short residence time on
the surface as it is immediately oxidized into CO2(g). The CO(ad) signal of adsorbed
CO on platinum disappears from the O 1s window [Figure 58 (a)] as atomic
oxygen.232
Both C 1s [Figure 60(b)] and O 1s [[Figure 58](a)] spectra also show the
surprising presence of carbonate species on the pure Pt NP sample when the gas
mixture is introduced at room temperature. The main carbonate component is found
at a binding energy of ~289 eV.227,228 The carbonate signal diminishes when
temperature increases, and almost completely vanishes at 380 K while a sizeable
CO(ad) signal remains. The two phenomena are certainly uncorrelated. Indeed we
see here that with platinum there is a strong CO adsorption but weak carbonate
while in the case of Zn NPs (more in next part) we have a strong carbonate
adsorption but without a CO adsorption. The formation of carbonates could follow
this reaction: PtIVO2+COPtCO3. However, the PtIV (PtO2) component which is
expected to have a binding energy shift of +3.7 eV from the main metallic Pt 4f, was
not detected in our samples. Thus, another hypothesis must be envisaged. Since Pt
Chapter 3:4)CO Oxidation reaction on Pt, Zn and PtZn NPs with CO:O2 at ¼ ratio
100
deposition is performed at room temperature, dispersed Pt atoms could be present
at the surface. Indeed, in the similar case of Pt NP deposited on Al2O3, Newton et
al.239 favor the hypothesis of a reaction of CO over atomically dispersed oxidic Pt
centers adsorbed on the alumina substrate. Here, the interaction between Pt atoms
and TiO2 is so strong that their surface mobility is limited.
4.b.1) Pure Zn NPs
In sharp contrast with the pure Pt NPs sample, the deposition of zinc at room
temperature in UHV conditions does not quench the Ti3+ state (see the arrow in
[Figure 62]). This means that Zn has no particular affinity for the surface defects
(oxygen vacancies) associated to Ti3+, contrary to Pt.
Figure 62: Ti 2p core level spectra of pure Zn NPs recorded at hv=560 eV
In UHV conditions, the C 1s spectrum [Figure 63] shows components due to
surface contamination at 284 eV-285 eV. It should be noted that we do not see the
same higher energy component as seen in the case of pure Pt NPs. Indeed those
were adsorbed residual CO on platinum site which are absent on this sample. The
small peak at ~289 eV is due to carbonates resulting from the adsorption of CO from
Chapter 3:4)CO Oxidation reaction on Pt, Zn and PtZn NPs with CO:O2 at ¼ ratio
101
the residual and its oxidation on the surface. Its counterpart in the O 1s spectrum
[Figure 58(b)] (about +1.8 eV from the main O 1s in TiO2 peak) is also very weak
under UHV.
Figure 63: C 1s core level spectra of pure Zn NPs recorded at hv=400 eV
At room temperature, the presence of O2 in the CO:O2 gas mixture leads to
the filling of the oxygen vacancies, thus the Ti3+ component disappears in the Ti 2p
spectrum [Figure 62]. While CO is not adsorbed on metallic zinc,240 O2 reacts with
metallic Zn. It has been reported that Zn reacted readily with oxygenalready under
10-7 mbar at room temperature.241 Here, we do find evidence of oxidation in our Zn
3p spectra measured at photon energies of 165 and 400 eV through the widening of
the FHWM. In [Figure 64], we plot the corresponding changes in the binding energy
(Zn 3p3/2).
Therefore, following the introduction of the gas mixture at room temperature,
the Zn 3p binding energy increases by 0.5-0.6 eV. This is the characteristic binding
Chapter 3:4)CO Oxidation reaction on Pt, Zn and PtZn NPs with CO:O2 at ¼ ratio
102
energy shift from metallic Zn to ZnO.242 Moreover the increase of the FWHM of 0.4
eV is another indication of the zinc oxidation. In metallic Zn (ZnO oxide) the inelastic
mean free path λ is 0.447 nm (0.483 nm) at ℎ =165 eV and 0.775 nm (0.868 nm) at
ℎ =400 eV, to be compared with the average height 0.74 nm 0.14 nm of the
metallic Zn NPs. This indicates that at 400 eV the zinc oxidation states of zinc on
whole NPs were seen while at 165 eV it was mostly the surface contribution that was
monitored. Importantly, we find no signal related to CO(ad) in [Figure 63]. This is not
much of a surprise as DFT calculations show that CO interacts weakly with the ZnO
surfaces.243
The broad C 1s peak (between 288.5 and 289.0 eV) ascribed to carbonates
grows substantially at room temperature. It is made of two components separated by
~1 eV. While the component at 288.5 eV in binding energy is the most intense at low
temperatures, the one at higher binding (289 eV) becomes preponderant at 450 K. It
suggests that there exist two different bonding configurations for CO2 on oxidized
zinc, with different chemisorption energies. C. Wöll has given a review244 of the
chemistry and physics of zinc oxide surfaces which gives the binding energies of CO
and CO2 adsorbed on O-ZnO and ZnO(1010) leading to “CO3” surface compounds.
Moreover, in other literature work, there are indications that CO can be oxidized on
the ZnO surfaces. Indeed four decades ago, Esser and coworkers245 have observed
the thermal desorption of CO and CO2 after CO exposure to stoichiometric ZnO
powders at 300 K. They also noted that the coadsorption of O2 on ZnO increased the
production of CO2. More recently, infra-red spectroscopy246 demonstrated that there
are carbonates irreversibly adsorbed on the surface of finely divided oxidized ZnO
powders at 300 K. The formation of those carbonates was also enhanced by the
addition of O2.
In [Figure 59] we show that the CO2(g) yield increases from 396 K to 450 K. At
this high temperature, the CO(g) signal [Figure 63] disappears (we have reached the
mass transport limitation regime). In this pure Zn NPs sample we reach the mass
transport regime at a higher temperature (450 K) compared with that of pure Pt NPs
(396 K) as discussed previously. Moreover contrary to the pure Pt NPs sample, the
carbonate signal is still present for pure Zn NPs, which appear as a single peak at
~290 eV in the C 1s spectrum and as a shoulder at +1.8 eV to the left of the main
Chapter 3:4)CO Oxidation reaction on Pt, Zn and PtZn NPs with CO:O2 at ¼ ratio
103
peak in the O 1s spectrum [Figure 58(b)]. The fact that the carbonate signal in the C
1s spectrum [Figure 63] does not vanish when CO oxidation conditions are met
suggests that CO2 is strongly bonded to the oxidized zinc compound. This
hypothesis is supported by other works where, a high resolution electron energy loss
spectroscopy (HREELS) study,247 supported by DFT calculations, did show that a
tridentate CO3δ− species is formed on the Zn (1010) face (the most stable and non-
polar surface face) of ZnO). Moreover, recent DFT calculations248 indicate that the
chemisorption energy for CO2 on the same face (ZnO(1010)) is significant ( 0.83 eV),
but is small on the polar faces (in the 0.06-0.09 eV range).
The in-situ NAP-XPS study shows that CO is oxidized into CO2 even at room
temperature on the oxidized zinc surface when exposed to the CO:O2 gas mixture
and is then readily bonded as a carbonate. The evolution into CO2(g) is only possible
when the temperature is raised and the energy given to the system is sufficient to
desorb bonded CO2. This mechanism is believed to proceed when a steady-state
regime is reached: CO2 molecules were continuously formed on the ZnO and desorb
afterward. Our oxidized Zn NPs behave in a way very similar to prismatic ZnO(1010)
surface (the major orientation found in ZnO powders). Indeed, Esser et al.245 found
that the stationary regime of CO oxidation starts at 400 K and is maximum at ~530 K
in a CO:O2 (1:1) mixture, under a pressure of 1.610-5 mbar. The type of reaction
mechanism is possibly a the Mars–van Krevelen one.249 In this mechanism, a
surface oxygen atom oxidizes the CO molecule, leaving an oxygen vacancy at the
surface, which is then replenished by reaction with an O2 molecule from the gas
phase. However, a detailed mechanistic description is still missing. The only
available parameter is the calculated oxygen vacancy formation energy, often used
as a descriptor of the catalytic activity, which is 3.3 eV for the ZnO(1010) face.250
Similarly, the CO2 strongly bonded carbonate on ZnO is not discussed in the
literature, while it is observed on similar systems, for instance in the case of CO
oxidation by Au/ZnO catalysts.251
4.b.2) ZnPt NPs
The ZnPt has substantial difference in behavior compared with the pure Zn
NPs, in particular the evolution of the binding energy of the Zn 3p in both samples as
Chapter 3:4)CO Oxidation reaction on Pt, Zn and PtZn NPs with CO:O2 at ¼ ratio
104
shown in [Figure 64]. Indeed in this case, the binding energy does not shift
noticeably once the CO:O2 gas mixture is introduced at room temperature for PtZn
samples, while it increases clearly for pure Zn NPs.
Figure 64: Binding energy shift of Zn 3p core level peak for pure Zn NPS and ZnPt NPs
This indicates that metallic Zn is protected from any contact with the oxygen
molecules in PtZn NPs. In fact, due to its oxophilicity, if it was in contact with oxygen,
it would have immediately oxidized and would have its binding energy shift to higher
binding energy. Moreover given the absence of CO bonding to this metal, we
suspect that most of the zinc atoms must have penetrated inside the pre-existing Pt
NPs, it is the only explanation for the lack of bonding with either CO or O2 molecule.
This happened despite the fact that we have deposited Zn after Pt and that the
surface energy of Zn(0001) (0.993 J.m-2) is less than that of Pt(111) (2.489 J.m-
2).180,252 Therefore, the Zn diffusion into the core of the ZnPt NPs is a chemically
driven phenomenon that drags the platinum atoms to the surface of the bimetallic
nanoparticles. We attribute this phenomenon to the formation of Pt-CO bonds.
Indeed, in the C 1s spectrum [Figure 65(b)], the CO(ad) signal “titrates” the platinum
atoms in contact with the gas mixture and we see two CO(ad) peaks (shaded in green
Chapter 3:4)CO Oxidation reaction on Pt, Zn and PtZn NPs with CO:O2 at ¼ ratio
105
color) at 286.3 eV and 287.2 eV at room temperature. Using the K 2p3/2 peak (in
cyan, a TiO2 contamination) as a reference, both their intensities are smaller than in
the case of the pure Pt NPs sample under the same conditions. When we look at the
pure Zn NPs under the same conditions, we remarked that the CO(ad) signal is
absent. This is a further confirmation that CO(ad) is bonded to platinum and its
evolution is identical on both pure Pt and ZnPt NPs: CO(ad) is present as soon as the
gas mixture is introduced. It was still present at the onset of the oxidation reaction
(380 K), but disappeared at 396 K together with at the vanishing of CO(g) signal at
the oxidation reaction regime.
Figure 65: Pt 4f core level spectrum (a) and the C 1s core level spectrum (b) recorded at hv=400 eV for the ZnPt NPs
The Zn 3p binding energy in ZnPt NPs was constant until both CO(g) and
CO(ad) signal disappear, then it increased suddenly, by 0.5-0.6 eV. This is the same
shift as for pure Zn NPs when the gas was introduced. This indicates that when the
Chapter 3:4)CO Oxidation reaction on Pt, Zn and PtZn NPs with CO:O2 at ¼ ratio
106
CO, previously bonded to Pt has left the NPs surface, Zn get oxidized into ZnO. This
change corresponds to the onset of the CO oxidation reaction regime. The Pt 4f
spectra [Figure 65 (a)] provide interesting information on the chemical bonding. They
are fitted with three components: The main metallic (Ptmet) component which is
violet-shaded, a smaller green-shaded at +0.5 eV from the main peak attributed to
Zinc and an orange shaded one corresponding to CO-Pt contribution at + 1.0 eV
from the main peak.
The metallic Pt (Ptmet) spectral weight [Figure 66] also gives interesting
information on the chemical environment of the NPs. This spectral weight is obtained
by dividing the intensity of the platinum metallic peak (Ptmet) by all the component of
the Pt 4f peak (Ptmet, PtOx, Pt-CO). It gives information on the metallicity of the peak.
Indeed it shows that the Ptmet spectral weight decreases due to the adsorption of CO
in a temperature window comprised between room temperature and 380 K. At 396 K,
when the CO(ad) signal disappears and Zn is oxidized into ZnO, Ptmet starts to
increase again until it reaches 100% (Platinum is fully metallic) at 450 K. This can be
explained by Zn segregating at the surface of the NP and forming an oxidized layer
compound. This strongly suggests that in oxidative conditions, a ZnO shell (with
adsorbed carbonates at the surface) is formed over a metallic Pt core. Therefore, for
the highest temperatures of the experience, zinc plays the role we expected it to
have in ZnPt NPs: it forms a sacrificial oxide layer that protects platinum form being
oxidized.
When comparing with the spectral weight of Ptmet from the pure Pt NPs we
see that the behavior is different. Indeed, we observe that it decreases from 100% to
80% with the introduction of the gas mixture. This value is less important (less
metallic) than with the ZnPt NPs as there are more accessible Pt sites in the case of
the pure NPs to CO molecule. As the temperature increases, the CO(ad) signal
decreases and Ptmet increases. When the CO(ad) signal disappears from the C 1s
window as atomic oxygen, then Ptmet decreases again due to oxidation and reaches
its lower value, nearly 70%,a value far lower than in the case of the bimetallic NPs
indicating the beneficial effect of adding Zinc to Platinum.
Chapter 3:4)CO Oxidation reaction on Pt, Zn and PtZn NPs with CO:O2 at ¼ ratio
107
Figure 66: Metallic Pt (Ptmet) spectral weight versus temperature obtained from the Pt 4f XPS spectra for pure Pt NPs and ZnPt NPs
Additional information on the ZnPt NPs structure (Pt/(Pt+Zn)) can be gained
with the photon energy dependence of the platinum atomic weight displayed in
[Figure 67]. The Pt atomic weight is obtained from the intensity of the Pt 4f and Zn 3p
spectral peak. Those intensities are then corrected from variations linked to the
photon energy with the atomic cross sections and the asymmetry factor.253 Those
atomic cross section and asymmetry factor describe the probability of a photon with
a given energy to ionize the atom by ejecting an electron from the considered
electronic level. The formula for correcting those intensities is the following:
Icorrected=I
σ(1+0963*β)
With
I: The measured peak intensity in XPS
Icorrected : The corrected intensity
σ: The cross section factor
β: The asymmetry factor
Chapter 3:4)CO Oxidation reaction on Pt, Zn and PtZn NPs with CO:O2 at ¼ ratio
108
Figure 67: Pt 4f and Zn 3p binding energy window of ZnPt NPs samples measured at hv = 400 eV (a) and Pt atomic weight (Pt/(Pt+Zn))ratio (b)
The Pt/(Pt+Zn) atomic weight after a drop after the gas introduction, remains
stable then systematically decreases when the temperature increases. In particular,
the decrease above 380 K indicates the Pt surface depletion This is fully coherent
with the idea of an outer ZnO shell with carbonates adsorbed at its surface and a
metallic Pt core and are coherent with the analysis of the Pt 4f and Zn 3p core-level
binding energies [Figure 64, Figure 65, Figure 66]. This segregation phenomenon of
Zn as an oxide can easily be explained by thermochemical effects, as mentioned
previously. Indeed Pt enrichment was observed by Sode et al.254 on an
electrochemically prepared PtZn alloy after extended exposure to CO while a Zn
enrichment was observed with the same alloy in under exposure to O2. Therefore,
the phenomena observed in our samples, is a chemically-driven phase separation
Chapter 3:4)CO Oxidation reaction on Pt, Zn and PtZn NPs with CO:O2 at ¼ ratio
109
leading to the segregation, that has be distinguished from a segregation process that
is only due to surface energy considerations.
4.b.3) Assessing the Nanoparticles activity
The surface behavior of the three studied NPs is summarized in a scheme
[Figure 68]. The behavior in the case of pure Pt NPs is in a way similar to the
crystalline surfaces of bulk platinum (or bulk palladium)229 exposed to a CO:O2
mixture. First the Pt NPs surfaces are poisoned by CO then, when the temperature
increases and reaches the critical value of 380 K where the CO oxidation reaction
starts, CO is consumed by the reaction and transformed in CO2. The, the oxygen is
able to reach the surface of NPs which leads to platinum surface oxidation. When
the mass transport limit is attained, all previous CO adsorbed sites are replaced by
atomic oxygen fully oxidizing the surface platinum. The formation of PtO leads to
TiOx encapsulation.
Figure 68: Comparison of chemical changes in pure Pt, pure Zn and ZnPt NPs
Chapter 3:4)CO Oxidation reaction on Pt, Zn and PtZn NPs with CO:O2 at ¼ ratio
110
Compared with pure Pt NPs, the pure Zn NPs sample exhibits a very different
behavior. Indeed in this case, CO does not bond to metallic Zn: there is no adsorbed
CO. In fact, Zn is immediately oxidized into ZnO when the CO:O2 gas mixture is
introduced at room temperature. The Zinc oxide provides O species to oxidize the
CO molecules (in a Mars van Krevelen scheme), and the newly created CO2
molecule remains bounded with ZnO as a carbonate. At a critical temperature, a
steady-state regime is reached. In this regime, carbonates are continuously both
destroyed when CO2 desorb and formed again on the Zinc oxide surface following
the Mars van Krevelen scheme. This observation of an appreciable catalytic activity
for the pure Zn NPs at 450 K raises the important question of which crystallographic
faces are exposed to the gas mixture when the catalytic activity of ZnO is observed.
The observation of carbonates is only possible if non-polar faces like ZnO(1010) and
(1120) are in contact with the gas mixture. Indeed the calculated chemisorption
energies of CO2 are large (0.83 and 0.79 eV respectively).248 In contrary, on the ZnO
polar faces, the calculated chemisorption energy for CO2 is very low (<0.1 eV).248
Moreover, the absence of CO oxidation activity on a continuous film of ZnO
exhibiting only a polar surface to the gas mixture was indeed noticed by Martynova
et al..188 This phenomenon illustrates the important aspect of ZnO in the form of
nanoparticles.
The case of the ZnPt bimetallic NPs, a more complex behavior was noticed.
While Pt is deposited first and Zinc after, the bimetallic NPs are Pt-terminated at
room temperature. Thus CO can poison the NP by bonding to platinum. At a critical
temperature (380 K) when the reaction starts and CO2 is produced, Zn moves to the
external surface where it forms an oxide, while Pt goes to the core where it remains
metallic. Then in oxidative conditions where CO2 production is maximum and the
adsorbed CO disappeared, we have the NPs composed of a ZnO outer layer and a
platinum core. As in the case of pure Zn NPs due to the ZnO shell, carbonates are
observed and they likely play a role in CO oxidation. Yet the role of platinum that
remains metallic (in contrast with the pure Pt NP sample that is oxygen-covered)
remains to be fully elucidated. We observed that the onset of CO oxidation occurs at
380 K, a temperature similar to pure Pt NP and lower than that of pure Zn NP case
(396 K). Therefore, the presence of platinum is clearly beneficial if one considers the
onset of the CO oxidation reaction. Indeed the metallic platinum core can provide
Chapter 3:4)CO Oxidation reaction on Pt, Zn and PtZn NPs with CO:O2 at ¼ ratio
111
electrons to the ZnO shell in a “Cabrera-Mott picture” facilitating the dissociation of
O2 molecules. Moreover, we may also consider the fact that Pt doping decreases the
oxygen vacancy formation energy at prismatic ZnO surfaces.250 This means that
more atomic oxygen could be provided to oxidize CO in a Mars van Krevelen
scheme.
Ideally, the Pt 4f and Zn 3p spectral intensities when normalized with respect
to the photon flux received at the sample surface and at a given photon energy,
should give crucial information on the interaction with the rutile TiO2 substrate like
wetting/dewetting, sintering and encapsulation process by the substrate. But this
process is suitable when done in UHV experiment. However, here in NAP-XPS
conditions, a sample current proportional to the photon flux cannot be measured,
due to the charged species (ions and electrons) produced in the gas phase by the
beam. Thus, we have chosen to normalize the Pt 4f and Zn 3p core-level intensities
by dividing them by that of Ti 3p, a substrate peak. For this comparison, two photon
energies are used: ℎ =165 eV (surface sensitive conditions) and ℎ =400 eV (more
bulk sensitive conditions). Those normalized intensity evolution are showed in
[Figure 69]
We start first with the Pt 4f intensity for the pure Pt NPs. In this case, the
intensity decreases when CO oxidation starts. Here, platinum becomes oxidized as a
result of CO desorption and the presence of oxidizing environment (oxygen rich). As
discussed above, the formation of Pt surface oxide enhances the encapsulation by
TiOx. At 450 K, the Pt 4f intensity is very small at ℎ =165 eV, almost non visible,
although it remains measurable at ℎ = 400 eV. The encapsulation of Pt NPs by
TiOx is a very well documented phenomenon (for more information see reference
235,255,256). It is generally attributed to the surface energy of the metallic platinum
clusters (2.489 J.m-2 for Pt(111)) being higher than that of non-stoichiometric titania
in order to minimize the surface energy.
For the pure Zn NPs case, the normalized Zn 3p intensity remains rather
constant with the increasing temperature until 396 K where its intensity strat to
increase. This increased intensity can be attributed to the destruction of the
carbonate species adsorbed at the Zinc surface. This carbonates destruction
corresponds to the apparition of CO2 in the gas-phase. This diminution of the surface
Chapter 3:4)CO Oxidation reaction on Pt, Zn and PtZn NPs with CO:O2 at ¼ ratio
112
adsorbed species (the top layer of the systems) leaves more Zn surface visible. In
any case, it is clear that the pure Zn NPs are not encapsulated by TiOx. The
experimental surface energy of ZnO, averaged over the existing faces, is relatively
high (2.55 ± 0.23 J.m-2), see Ref.257 and references therein. However calculations
show that while the (0001)-Zn terminated surface has a high surface energy (~2.4
J.m-2), the (0001)-O terminated surface has a rather low surface energy (~0.96 J.m-
2).107 as well as the (1010) and (1120) surfaces (0.839 J.m-2 and 0.872 J. m-2,
respectively).258 Those (1010) and (1120) surfaces are the ones that are more likely
to be available here as it is on those surface that the observed absorbed carbonate
are present and stable. Thus we have an overall ZnO surface with a low surface
energy making it less prone to the encapsulation by TiO2 than platinum.
In the ZnPt NPs case, we observe that the Pt 4f intensity has the same
behavior than in the pure Pt NPs case: it is quite stable until the start of the CO
oxidation reaction at 380K where it decreases in the same way as for the pure Pt
NPs. However here, the Zn 3p signal behaves in stark contrast with the pure Zn NP
sample case. Indeed, here it decreases also from 380 K, at the same temperature
where Platinum signal also diminishes. The fact that zinc shares the fate of platinum
is surprising. Indeed we have shown previously that as soon as the CO oxidation
reaction starts, Zn elements are driven at surface creating a core platinum with a
ZnO shell NPs. Moreover we have seen that the oxidized pure Zn NPs are not
encapsulated by the support and could expect that oxidized zinc would protect Pt
from encapsulation. Taking into account only surface energy considerations, one
could argue that the ZnO surface of ZnPt NPs has a much higher surface energy
than that of oxidized pure Zn NPs (for instance surface doping by Pt atoms could
increases the surface energy and favor the encapsulation by TiOx). Nevertheless,
the ZnPt NPs seem to be less prone to encapsulation than the pure Pt ones. Indeed,
at the highest working temperature, 450 K, the normalized Pt signal (ℎ =400 eV) is
greater for bimetallic NPs, and non-measurable for pure Pt NPs.
Chapter 3:5)Conclusion
113
Figure 69: Evolution of the ratio of integrated intensities of the XPS peaks of Pt 4f, Zn 3p (Ipeak) with respect to that of the Ti 3p
5) Conclusion
We have shown with STM measurements that the growth of small Pt NPs with
large densities was achieved due to their strong bonding with the reduced TiO2(110)
substrate. The large density of Pt cluster is an important effect since these NPs were
used as seed nucleation sites for the Zinc deposition. This deposition strategy
promotes the formation of bimetallic ZnPt NPs while the formation of pure Pt and
pure Zn nanoclusters was limited.
NAP-XPS measurements show the formation of stable Pt surface oxide at
room temperature for both pure Pt and ZnPt NPs after the exposure to a partial
pressure of 1 mbar of O2. In addition, the Pt 4f spectra show the presence of a Pt-Zn
alloy phase which forms readily at room temperature in ZnPt NPs. While a drastic
TiOx encapsulation took place for pure Pt NPs after annealing at 440 K under 1 mbar
of O2, a better resilience towards this effect was noticed for ZnPt NPs. The C 1s and
O 1s spectrum show the formation and stabilization of carbonate in the case of the
ZnPt NPs.
Chapter 3:5)Conclusion
114
In the study of the CO oxidation reaction we have examined whether this
inverse oxide/metal catalyst films system can be transposed to the case of
nanometer-size bimetallic ZnPt nanoparticles (with a Zn/Pt ratio close to 1). To gain
a comprehensive understanding of the phenomena occurring at the atomic scale, a
study of the CO oxidation catalytic activity of pure Pt and pure Zn nanoparticles in
addition to the ZnPt NPs system deposited on TiO2 was conducted.
All three type of samples (Pure Pt, Pure Zn and ZnPt NPs) were submitted to
the same experimental conditions of gas composition (CO:O2 gas mixture with a 1:4
pressure ratio), pressure (1 mbar) and temperature (293 K – 450 K range), while the
surface reactivity was monitored using NAP-XPS. The NAP-XPS enables the
collection of photoelectrons from both the gas and solid phases. With this we could
relate the gas phase composition (reactants and compound), with the chemical state
of the surface such as adsorbed molecular species (CO, carbonates), but also the
oxidation state of the metals, and their depth distribution, using the tunability of the
synchrotron excitation source (with surface or bulk sensitive condition).
Working in isobaric conditions, we have determined the temperatures at which
the CO oxidation starts in all three samples. We observed that CO oxidation reaction
is so effective that the CO gas signal disappears, at temperatures of 396 K for the
pure Pt and the ZnPt nanoparticles, and at 450 K for the pure Zn nanoparticles. We
have reached the mass transport limitation regime. NAP-XPS shows that there is a
CO poisoning of the pure Pt NPs at room temperature until CO oxidation starts. At
this moment it is replaced by atomic oxygen as the temperature is raised.
The behavior of the pure Zn NPs is in stark contrast with pure Pt NPs. They
are oxidized when the gas mixture is introduced at room temperature and
carbonates are readily formed on their surface. Then when the critical temperature is
reached, a gaseous CO2 production and a steady-regime are achieved with the
constant carbonate formation and CO2 desorption. This unexpected efficiency of Zn
nanoparticles emphasizes the role of non-polar ZnO orientations in CO oxidation
reaction as they favor the formation of carbonate. Moreover Zn NPs are not
encapsulated by TiO2.
In the case of ZnPt NPs, the Pt-terminated nanoparticles are poisoned by
adsorbed CO below the CO oxidation onset temperature. When oxidative conditions
Chapter 3:5)Conclusion
115
are reached, Zn is segregated to the surface forming an oxide layer (covered with
carbonates), while the core of Pt remains metallic. Pure Pt and bimetallic ZnPt
nanoparticles show similar behaviors in the oxidative regime as both are prone to be
encapsulated by the support. Yet the addition of zinc makes the phenomenon more
difficult. Pure Pt and bimetallic ZnPt also show a very similar activity towards the CO
oxidation reaction, as deduced from the gas phase photoemission intensity of the
product and reactants. The strong synergetic effect brought by ZnO/Pt boundaries
that Martynova et al.188 have reported at 450 K is not clearly observed here. This
may be simply a consequence of the mass transport limitation regime that we have
reached thus preventing the control of the CO partial pressure that occurs at a lower
temperature in the present case. This can be also due to the interaction of the
bimetallic NP with the rutile substrate.
Here we can see the tremendous complexity of the chemistry of supported
bimetallic nanoparticles, which is highlighted by NAP-XPS in great detail. It makes
the transposition of the observations made for much simpler single crystal systems
to the NPs not particularly straightforward. Yet the present work raises new
interesting questions about the reactivity of zinc oxide and zinc oxide / platinum
interfaces that NAP-XPS is able to tackle in a very relevant way using the
“reductionist” approach of single crystal surface studies.
Conclusion and Perspectives
116
Conclusion and Perspectives
During my PhD, I had the opportunity to conduct my research studies using
NAP-XPS as the main investigating experimental technique. This instrument
represents a powerful tool for the chemical surface analysis as it offers a synoptical
view of the whole reacting system, gaseous reactants and products, on the one hand,
the reactive solid surface, on the other hand. This specificity was used in two
different kinds of experiments, one dedicated to environmental chemistry and the
other one to heterogeneous catalysis (supported metallic nanoparticles). In this
regard, although the overlap between the gas phase and the solid phase
components is generally limited, the application of a positive voltage to the sample
was decisive to remove any ambiguity regarding the assignment of signals. By the
same token, the positive biasing (eventually associated to the presence of a neutral,
unreactive gas with a pressure in the mbar range) was proved to be highly beneficial
to strongly mitigate charging effects in poorly conducting materials like clays. This
simple “trick”, which we thought of, compensates the impossibility of using flood guns
in NAP conditions.
My first research study, the hydration of swelling clays, illustrates the ability of
the NAP XPS to follow the evolution of the chemical environment around a
counterion in two types of smectite clays (hectorite and saponite), as a function of
the relative humidity. In particular, I have shown that different behaviors are
observed depending on the counterion nature. Indeed, with sodium and strontium
counterions the hydration process occurs and is revealed by a clear chemical shift of
their core level binding energies (Na 2s, Sr 3d) to lower values. These shifts point to
the formation of their hydration spheres, and to a correlated increase of the
relaxation energy. Moreover, I have observed the migration of the sodium counterion
outside the analyzed region. This outdiffusion was tentatively attributed to a water-
driven enhanced ionic mobility, associated to a drift under an electric field resulting
from a small residual (a few hundreds of meV) charging effect. In stark contrast, in
the case of the cesium counterion, a slight chemical shift of the binding energy Cs 4d
Conclusion and Perspectives
117
towards higher energies was measured at the onset of water condensation,
indicating a decrease of the relaxation energy.
Thanks to the aforementioned gas/solid synoptical view, we have made the
first NAP-XPS observation of the soft X-ray radiolytical mineralization of pyridine
inserted in hydrated Sr2+-hectorite. The major observation was that the N2 yield stops
when a given pyridine partial pressure threshold is overcome. We have tentatively
proposed a model in which the hydrodenitrogenation of pyridine stops when X-ray
irradiation induced valence electrons (that trigger the production of H radicals from
water) are scavenged by pyridine itself.
In the second research topic dedicated to the catalytic properties of metallic
nanoparticles, we have first shown the beneficial effect of adding zinc to platinum
nanoparticles (NPs) as they limit the oxidation of the platinum. This process was
based on a chemically-driven effect for which Zn gets oxidized preferentially in the
presence of Pt in order to form a stable ZnO (shell) Pt (core) NP. Moreover, the
presence of Zn prevents the problematic encapsulation of the catalysts by the
support. To investigate possible synergetic effects reported for ZnO epitaxied on
Pt(111) single crystals,188 CO oxidation reaction was investigated in in situ conditions
on pure metallic Zn and Pt NPs and in their bimetallic counterparts ZnPt. As NAP-
XPS allows the collection of photoelectrons from both the gas and solid phase, I
have been able to relate the gas phase composition (reactants and compound), with
the chemical state of the surface, i.e. adsorbed molecular species (CO, carbonates),
the oxidation state of the metals, and their depth distribution, using the tunability of
the synchrotron excitation source. Working in isobaric conditions, I have determined
the temperatures at which the CO oxidation starts. In all cases CO oxidation is so
effective that the CO gas signal disappears from the gas phase (mass transport
limitation regime), at temperatures of 396 K for the pure Pt and the ZnPt
nanoparticles, and at 450 K for the pure Zn NPs. Thus we have also demonstrated
that pure zinc NPs are also catalytically active for the CO-oxidation reaction and are
able to form CO2 through a steady state reaction, even if it occurs at a somewhat
higher onset temperature. The tremendous complexity of the chemistry of supported
bimetallic nanoparticles, highlighted by NAP-XPS, makes that the transposition of
the observations made for much simpler single crystal systems is anything but
straightforward. On the other hand, we believe that the present work raises new
Conclusion and Perspectives
118
interesting questions about the reactivity of zinc oxide and zinc oxide / platinum
interfaces that NAP-XPS is able to tackle in a very relevant way using the
“reductionist” approach of single crystal surface studies.
The present PhD work has generated a lot of interrogations and opened new
perspectives. Among the new issues, the question of the electronic structure of the
solid/aqueous solution interface is of prime importance. It was motivated by a
previous NAP-XPS study of alkali halide solutions where the question of the
gold/solution interface was raised. With NAP-XPS, it would be interesting to study
the energy alignment of electrochemical solution.36 As the Fermi level in the solution
and the redox potential are one and the same thing,259,260 the level should align at
thermodynamic equilibrium. Therefore it is crucial to study solutions with well-defined
redox couples and their energy level alignments. A comparison between NAP-XPS
investigations and liquid jets experiments is technically and fundamentally of prime
importance. Indeed, liquid jets present several advantages over the NAP-XPS: (i)
easy control of solute concentration, where the liquid surface is less prone to
contamination, (ii) and a better control of beam damage as the material is constantly
regenerated. On the other hand, one can raise the question of thermodynamic
equilibrium between the flowing liquid and some electrode (Fermi level equilibration),
on the one hand, and of thermodynamic equilibrium at the surface of liquid jets when
the base pressure in the chamber is around 10-5 mbar. All these points make the
comparison between the two techniques extremely interesting, leaving aside the
prejudices about the superiority of one technique over the other. At the time of
writing, this XPS analysis of metal/solution interfaces has not yet been carried out,
because of delays in the allocation of beam-time. In any case, experiments, that I am
going to take part in, are scheduled in the 2nd semester of 2017 at Pléiades beamline,
SOLEIL.
Second, the study of the hydration of clays and of the chemical reactions that
could be sustained in them opens new opportunities in space science. Considering
the pressure range of NAP-XPS (1-10 mbar), this technique could be used to
simulate the atmosphere of planets like Mars or the study of the chemical reactivity
of silicate particles in warmed interstellar clouds261,262 can be easily managed. In this
regard, preliminary experiments were realized at SOLEIL by Rudolf’s group
(Groningen). The study of photocatalytic process in hydrated clays should be also
Conclusion and Perspectives
119
pursued. In fact, the relevance with radioactive waste storage is obvious, and the
search for efficient organic molecules inhibitors of H2 production should be an
interesting and potentially fundable research theme. Coming back to the application
of synchrotron radiation XPS in water-containing systems studied in (near) ambient
pressure conditions, water radiolysis by the beam raises serious issues more
especially when cells25,263 containing aqueous solutions are used (the famous H2
bubbling issue264,265). Clearly more beam-time and more instrumentation research
should be devoted to find ways to mitigate beam damage.
Third, the study of CO oxidation over ZnOPt NPs was a transposition of a
previous surface science study using the classic reductionist methodology of single
crystals and epitaxied layers, as developed by Freund’s group in the Fritz Haber
Institute of Berlin. Strangely, no XPS, and above all, no NAP-XPS study was made
on this catalytic system where the Zn/Pt synergy was seemingly observed. Shifting
away from the desire of bridging the so-called “material gap”, as we did before by
using NPs that are closer to real catalysts, the group will study the reactivity of ZnO
overlayers on Pt(111) with NAP-XPS in the 2nd semester of 2017 (the beam-time
was finally allocated). I am also strongly motivated to participate to this measurement
in SOLEIL, the last one of my PhD thesis experience.
Appendix
120
Appendix
A. Hydration of swelling clay A.1 Cs+-hectorite
Figure A1: Evolution of the Cs 4d core level peak binding aligned with Mg 2p as a function of the pressure and relative humidity for the hectorite sample at hv=400 eV
P (mbar) hν (eV) Cs 4d5/2 BE (eV)
Cs 4d5/2 FWHM (eV)
Mg 2p BE (eV)
Mg 2p FWHM (eV)
Si 2p3/2 BE (eV)
Si 2p FWHM (eV)
1.2 750 76,31 1,75 50,64 1,88 103,34 1,82
2.4 750 76,31 1,55 50,64 1,72 103,37 1,66
3.6 750 76,25 1,56 50,64 1,69 103,38 1,67
4.8 750 76,25 1,55 50,64 1,75 103,36 1,71
6 750 76,45 1,55 50,64 1,91 103,47 1,75
7.2 750 76,71 1,56 50,64 1,90 103,63 1,80
8,4 750 76,72 1,60 50,64 1,92 103,59 1,84
1,2 400 76,30 1,87 50,63 1,88
2,4 400 76,32 1,436 50,61 1,61
3,6 400 76,21 1,42 50,58 1,59 Table A1: Cs 4d, Mg 2p and Si 2p fitting parameters at hv=750 and 400eV for Cs
+-hectorite at various pressure
All Spectra are fitted with Gaussian peaks and Shirley background. Cs 4d
doublet is separated by 2.3 eV and Si 2p by 0.6 eV
Inte
nsity (
Arb
. U
nit)
82 80 78 76 74 72 54 53 52 51 50 49 48 47
Binding Energy (eV)
Mg 2p
Cs 4d
hv=400 eV
T=275 K
1,2mbar RH=17%
2,4mbar RH=34%
3,6mbar RH=50%
4,8mbar RH=67%
Appendix
121
A.2 Cs+-saponite
Figure A2: Evolution of the Cs 4d core level peak binding aligned with Mg 2p as a function of the pressure and relative humidity for the saponite sample at hv=400 eV
P (mbar) hν (eV) Cs 4d5/2 BE (eV)
Cs 4d5/2 FWHM (eV)
Al 2p3/2 BE (eV)
Mg 2p BE (eV)
Mg 2p FWHM (eV)
Si 2p3/2 BE (eV)
Si 2p FWHM (eV)
2.5 750 75,75 1,58 74.42 50,49 1,74 102,91 1,76
4.5 750 75,70 1,57 74.37 50,47 1,75 102,89 1,73
6 750 75,81 1,55 74.61 50,43 1,88 102,86 1,90
8 750 76,00 1,62 74.8 50,43 1,93 103,03 1,91
2.5 400 75,80 1,53 74.48 50,71 1,62 - -
4.5 400 75,54 1,98 74.42 50,60 1,69 - -
6 400 75,96 1,49 74.48 50,61 1,66 - - Table A2: Cs 4d, Mg 2p and Si 2p fitting parameters at hv=750 and 400eV for Cs
+-saponite at various pressure
All Spectra are fitted with Gaussian peaks and Shirley background. Cs 4d
doublet is separated by 2.3 eV and Si 2p by 0.6 eV. The Al 2p peak is fitted with a
doublet separated by 0.4 eV
Inte
nsity (
Arb
. U
nit)
80 78 76 74 72 7053 52 51 50 49 48
Binding Energy (eV)
Cs 4d5/2
and Al 2p
Mg 2p
2,5mbar RH=35%
4,5mbar RH=63%
6mbar RH=83%Cs 4d3/2
hv=400 eV
T=275 K
Appendix
122
A.3 Na+-hectorite
Figure A3: Evolution of the Na 2s core level peak binding aligned with Mg 2p as a function of the pressure and relative humidity for the hecorite sample at hv=400 eV
P (mbar)
hν (eV)
Na 2s BE (eV)
Na 2s FWHM (eV)
Mg 2p BE (eV)
Mg 2p FWHM (eV)
UHV 750 64,37 2,47 50,63 2,45
0,2 750 64,17 2,65 50,58 1,55
0,6 750 63,88 2,16 50,64 1,78
1,2 750 63,89 1,90 50,63 1,77
2,4 750 63,87 1,86 50,63 1,65
4.8 750 - - 50,64 1,79
6.7 750 - - 50,63 1,62
0.2 400 64,28 2,43 50.66 1.83
0,6 400 63,80 2,07 50.68 1.82
1.2 400 63,82 1,77 50,61 1,63
2.4 400 63,76 1,71 50,64 1,55 Table A3: Na 2s and Mg 2p fitting parameters at hv=750 and 400eV for Na
+-hectorite at various pressure
Spectra fitted with Gaussian peaks and Shirley background, for the first two
pressure at ℎ =400 (0.2 and 0.6 mbar) a linear background was first substracted
from the spectrum. Si element was not monitored during this experiment.
Inte
nsity (
Arb
. U
nit)
66 64 62 60 52 50 48Binding Energy (eV)
Mg 2p
Na 2s
hv=400eV
T=275 K
0,2mbar RH=3%
1,2mbar RH=17%
2,4mbar RH=34%
0,6mbar RH=9%
Appendix
123
A.4 Na+-saponite
Figure A4: Evolution of the Na 2s core level peak binding aligned with Mg 2p as a function of the pressure and relative humidity for the saponite sample at hv=400 eV
P (mbar) hν (eV) Na 2s
BE (eV) Na 2s
FWHM (eV) Mg 2p BE (eV)
Mg 2p FWHM (eV)
Si 2p3/2 BE (eV)
Si 2p FWHM (eV)
UHV 750 64,12 2,29 50,64 2,52 103,10 2,40
0,032 750 63,81 2,02 50,65 2,36 103,09 2,29
0,37 750 63,49 2,17 50,65 1,97 103,08 1,98
0,96 750 63,41 1,76 50,64 1,77 103,09 1,84
2 750 63,43 1,55 50,64 1,69 103,09 1,67
3 750 63,42 1,84 50,65 1,70 103,08 1,63
4.8 750 - - 50,65 1,83 103,05 1,87
8.4 750 - - 50,64 1,85 103,06 1,80
UHV 400 63,67 2,98 50,71 2,46 103,12 2,44
0,032 400 64,14 2,49 50,74 2,42 103,15 2,40
0,37 400 62,88 2,14 50,70 1,94 103,18 1,98
0,96 400 63,29 1,78 50,62 1,66 103,09 1,73
2 400 63,61 1,56 50,67 1,66 103,12 1,73
3 400 63,79 1,94 50,67 1,54 103,06 1,69 Table A4: Na 2s, Mg 2p and Si 2p fitting parameters at hv=750 and 400eV for Na
+-saponite at various pressure
Spectra fitted with Gaussian peaks and Shirley background for the first three
pressure at ℎ =400 (0.032, 0.37 and 0.96 mbar) a linear background was first
substracted from the spectrum. Si 2p doublet is separated by 0.6 eV
Inte
nsity (
Arb
. U
nit)
68 66 64 62 60 54 52 50 48 46
Binding Energy (eV)
Mg 2pNa2s
UHV
0,032mbar RH=0.5%
0,34mbar RH=5%
2mbar RH=29%
3mbar RH=43%
0,96mbar RH=14%
hv=400 eV
T=275 K
Appendix
124
A.5 Sr2+-hectorite
Figure A5: Evolution of the Sr 3d core level peak binding aligned with Mg 2p as a function of the pressure and relative humidity for the hectorite sample at hv=450 eV
P (mbar) hν (eV) Sr 3d5/2 BE (eV)
Sr 3d5/2 FWHM (eV)
Mg 2p BE (eV)
Mg 2p FWHM (eV)
Si 2p3/2 BE (eV)
Si 2p FWHM (eV)
1.8 (Ar) 750 134,01 1,94 50,10 1,96 102,51 1,88
0,1 750 133,75 1,68 50.10 1,75 102,51 1,85
0,7 750 133,76 1,72 50,10 1,86 102,59 1,93
1,7 750 133,71 1,78 50.10 1,75 102,54 1,79
3 750 133,72 1,61 50.09 1,78 102,51 1,76
1.8 (Ar) 450 133,92 1,77 50,10 1,79 102,58 1,762
0,1 450 133,74 1,71 50,10 2,11 102,68 2,125
0,7 450 133,74 1,48 50,11 1,98 102,64 2,119
1,7 450 133,72 1,37 50,11 1,73 102,64 1,767
3 450 133,71 1,97 50,12 1,41 102,65 1,621 Table A5: Sr 3d, Mg 2p and Si 2p fitting parameters at hv=750 and 450eV for Sr
2+-hectorite at various pressure
All Spectra are fitted with Gaussian peaks and Shirley background. Sr 3d
doublet is separated by 2.8 eV and Si 2p by 0.6 eV
Inte
nsity (
Arb
. U
nit)
140 138 136 134 132 130 52 50 48
Binding Energy (eV)
X0.2
X2
X10
X40
X150
1.8 mbar Ar
0.1 mbar
0.7 mbar
1.7 mbar
3 mbar
Mg 2phv=450 eVT=275 KSr 3d
Appendix
125
A.6 Sr2+-saponite
P (mbar) hν (eV) Sr 3d5/2 BE (eV)
Sr 3d5/2 FWHM (eV)
Mg 2p BE (eV)
Mg 2p FWHM (eV)
Si 2p3/2 BE (eV)
Si 2p FWHM (eV)
1 (Ar) 750 134,41 1.99 50,59 1.95 103,34 1.89
0.1 750 134,48 1.72 50,59 1.71 103,35 1.84
0.7 750 133,89 1.68 50,59 1.75 103,32 1.92
1.7 750 133,90 1.73 50,59 1.7 103,32 1.79
3 750 133,88 1.67 50,59 1.72 103,32 1.77
4.8 750 134,04 1.72 50,59 1.74 103,32 1.8 Table A6: Sr 3d, Mg 2p and Si 2p fitting parameters at hv=750 for Sr
2+-hectorite at various pressure
All Spectra are fitted with Gaussian peaks and Shirley background. Sr 3d
doublet is separated by 2.8 eV and Si 2p by 0.6 eV
Sr 3d 1,85 nm (KE=615 eV) 1,15nm (KE=315 eV) 1 nm (KE=265 eV)
N 1s 1,2 nm (KE=350 eV) 0,8 nm (KE=50 eV) -
C 1s 1,5 nm (KE=460 eV) - -
O 1s 0,9 nm (KE=220 eV) - - Table A 7: Electron IMFP estimation for various elements at the excitation energy used on the hydration and pyridine study.
Those values were estimated from Tanuma et al.72 and Akkerman et al.115 for
silicon dioxide and magnesium oxide using a 8/14 ratio for silicon dioxide and 6/14
for magnesium considering the stoichiometry of clay structure (8 Si elements for 6
Mg).
Cs 4d and Na 2s IMFP are not given at ℎ =450 as they were not study at this
excitation energy. Indeed ℎ =450 was used as a replacement for Sr2+-hectorite
experiment in order to have a very surface sensitive condition for the N 1s spectra
(impossible with ℎ =400 as KE~0).
Appendix
126
B. Insertion and mineralization of Pyridine
B.1 Ionization cross sections at h=450 and h=750 eV
In order to discuss the eh pair generation by the soft X-ray beam, we first calculate
the total cross sections corresponding to the Sr0.4Mg5.2Li0.8Si8.0O20(OH)4 formula at
ℎ =450 eV and ℎ =750 eV, see Table S1. Note that both are very close. At ℎ =750
eV, the O 1s core-level is ionized with a high cross-section, but the metal atom
contribution is less than at ℎ =450 eV. We give also the total cross-sections for the
pyridine molecule. As at ℎ =750 eV the energy distances from the C and N K edges
are greater than at 450 eV, the total cross-section is smaller.
Orbital Cross-sections in Mbarn at
hv=450 eV (cross section for a
unit cell)
Cross-sections in Mbarn at
hv=750 eV (cross section for a
unit cell)
O 2p
O 2s
O 1s
0.015 (0.36)
0.036 (0.864)
-
0.0028 (0.067)
0.015 (0.36)
0.24 (5.76)
Si 3s
Si 3p
Si 2p
Si 2s
0.013 (0.10)
0.006 (0.048)
0.4 (3.2)
0.14 (1.1)
0.0047 (0.038)
0.0015 (0.012)
0.093 (0.744)
0.055 (0.44)
Mg 3s
Mg 2p
Mg 2s
0.005 (0.026)
0.18 (0.94)
0.1 (0.52)
0.0018 (0.01)
0.041 (0.21)
0.036 (0.19)
Li 2s
Li 1s
0.0004 (0.0003)
0.03 (0.024)
8 10-5
(6 10-5
)
0.006 (0.005)
Appendix
127
Sr 5s
Sr 4p
Sr 4s
Sr 3d
Sr 3p
Sr 3s
0.0027 (0.0011)
0.09 (0.036)
0.03 (0.012)
1.9 (0.76)
0.59 (0.24)
0.15 (0.06)
0.0011 (0.0005)
0.039 (0.016)
0.013 (0.005)
0.53 (0.21)
0.31 (0.12)
0.077 (0.031)
Total cross-section
corresponding to
Sr0.4Mg5.2Li0.8Si8.0O20(OH)4 formula
8.29 8.22
N 2p
N 2s
N 1s
0.0055 (0.0055)
0.0245 (0.0245)
0.545 (0.545)
0.001 (0.0055)
0.007 (0.007)
0.0155 (0.0155)
C 2p
C 2s
C 1s
0.0015 (0.0075)
0.015 (0.075)
0.35 (1.75)
0.0003 (0.0015)
0.004 (0.02)
0.093 (0.465)
Pyridine total cross section
corresponding to C5H5N
formula
2.4 0.50
Table B1: Photoionization cross-sections, from Ref. 68
of the clay constituent atoms (for numbers between brackets, the
stoichiometry Sr0.4Mg5.2Li0.8Si8.0O20(OH)4 is accounted for). Photoionization cross-sections of the pyridine constituent atoms (for numbers between brackets the stoichiometry of the molecule is accounted for)
Appendix
128
B.2Fitting parameters
Table B2: Sr 3d and Mg 2p fitting parameters under grounded and biased condition at hv=750 eV
hv=750 Grounded hv=750 biased (+30V)
O Bulk BE (FWHM) H2O Gas Phase BE (FWHM) O Bulk BE (FWHM)