54
Catching Up and Falling Behind: Lessons from 20 th -Century Growth Nicholas Crafts 3 rd Development Lecture in Honour of Angus Maddison, OECD, July 1, 2014

Catching Up and Falling Behind:
Lessons from 20th-Century Growth
Nicholas Crafts 3rd Development Lecture in Honour of Angus Maddison,
OECD, July 1, 2014

Angus Maddison’s Legacy
• Evaluating performance in economic growth requires long-run international and inter-temporal comparisons of productivity
• Angus transformed this discourse by allowing the notions of catching-up, falling behind, and forging ahead to be quantified
• The huge debt that we owe him will be obvious as this lecture proceeds … in the style of a fellow ‘chiffrephile’

Modern Economic Growth
• Post industrial revolution era
• Driven by technological progress that has substantial impact on productivity growth
• Need appropriate institutions and policies to take advantage of the opportunity
• Penalty for getting it wrong gets much bigger; income divergence is not new but increases dramatically

Real GDP/Person ($1990GK)
1870 1913 1950 1973 2010
Asian Tigers 394 603 1010 3631 23313
China 530 552 448 838 8032
India 533 673 619 853 3372
Africa 648 908 889 1387 2034
W. Europe 2006 3488 4517 11346 20889
USA 2445 5301 9561 16689 30491
Source: The Maddison Project (2013)

Real GDP/Person Growth (% per year)
West Rest World
1500-1820 0.14 0.02 0.05
1820-1870 1.06 0.06 0.54
1870-1913 1.54 0.73 1.30
1913-1950 1.14 0.67 0.87
1950-1973 3.73 2.82 2.92
1973-2007 1.98 2.48 1.81
Source: Maddison (2010)
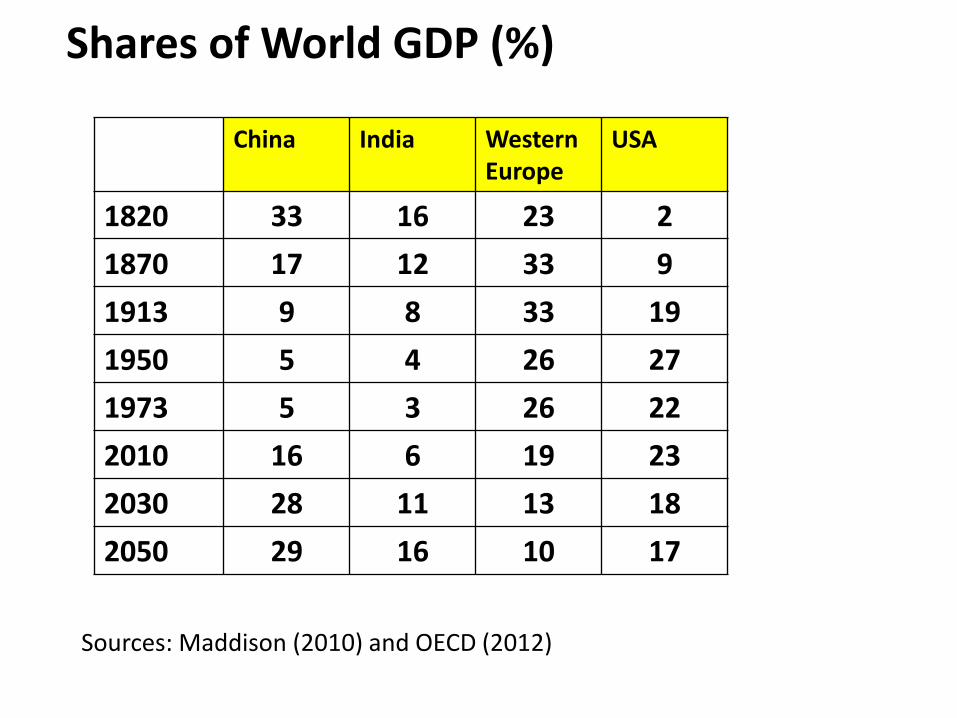
Shares of World GDP (%)
China India Western Europe
USA
1820 33 16 23 2
1870 17 12 33 9
1913 9 8 33 19
1950 5 4 26 27
1973 5 3 26 22
2010 16 6 19 23
2030 28 11 13 18
2050 29 16 10 17
Sources: Maddison (2010) and OECD (2012)
Divergence Big Time
• 20th century growth unprecedented; GDP gap
much greater than ever before
• Clearly not unconditional β-convergence so
the pure neoclassical prediction does not work
• Conditional β-convergence may be a viable
hypothesis – but what are the key conditions?

The Solow Model in a Globalized
World
• Y/L = A(K/L)a
• Diminishing returns to capital accumulation
• Technology universal
• Factors mobile, K/L equalized across countries
• Beta and sigma convergence

20th vs. 21st Century
• “The restoration of inter-society
income equality will be one of the
major economic events of the century
to come” (Lucas, 2000)
• So divergence will be superseded by
convergence and normal (neoclassical)
service will be resumed

Lucas’s Underlying Argument
• Obstacles to growth removed through imitation of good policies, institutions
• In a globalized world, capital mobility and financial liberalization relax the savings constraint
• Speed of catch-up growth will increase markedly and K/L and TFP gaps will be rapidly reduced
Why Might Lucas/Solow Be
Wrong?
• TFP is not the same across all countries because either efficiency or technology is not universal
• Obstacles to factor mobility
• Geography, institutions or economic policies differ persistently
• Sustaining catch-up growth may need continual reform; ‘too difficult’ so catch-up incomplete

The North/Acemoglu View
• Institutions which affect investment and innovation are the underlying determinants of economic performance
• Institutions are formal and informal constraints that structure behaviour
• Property rights are the key to high incomes today and thus to divergence over time
• Institutions are persistent

Rule of Law Scores (-2.5 to +2.5) Kaufmann et al. (2013)
1996 2012 1996 2012
Brazil -0.33 -0.11 Netherlands 1.65 1.84
China -0.43 -0.49 Nigeria -1.26 -1.18
India 0.26 -0.10 Singapore 1.28 1.77
Russia -0.87 -0.82 USA 1.45 1.60

Early vs. Later Stages of Development
• Gerschenkron: institutional design and role of government different in conditions of ‘backwardness’
• ‘Substitutes for prerequisites (‘developmental state’); initially, optimal boundaries of firm wider and coordination problems more serious
• Implies institutional diversity (cf. China)
• May imply difficult transition as development progresses

Institutions and Growth
• Important but surely not all that matters
• Institutional quality may not be well measured but growth regressions do not suggest it dominates recent differences in performance
• Policy plays a part and so too does geography
Divergence Big Time
• Persistent and widening income gaps characterize modern economic growth era
• Institutional/policy failures matter much more when growth opportunities increase BUT there is a strong spatial correlation of development outcomes
• Does this mean that geography undermines the mainstream assumption of a ‘level playing field’ for development ?
New Economic Geography:
Key Ideas
• Agglomeration Benefits
• Market Potential
• Trade Costs
• Globalization may imply divergence

Transport Costs and the
Location of Economic Activity
• Very High or Very Low: everything dispersed
• Intermediate: centralization of industry based
on location in larger market with increasing
returns and external economies of scale
• So New Economic Geography says that, even
with perfect institutions everywhere, integration
of markets may lead to divergence
Globalization and the Inequality of
Nations (Krugman & Venables, 1995)
• Manufacturing goods are subject to increasing returns and are used both as final and as intermediate goods
• As trade costs fall, self-reinforcing advantage of larger market leads to country-specific external economies of scale and lower costs for manufacturing in core relative to periphery
• Eventually, if trade costs fall enough and/or wages in the core rise enough, manufacturing returns to (parts of) the periphery. NB: unconditional convergence only in manufacturing (Rodrik, 2013)
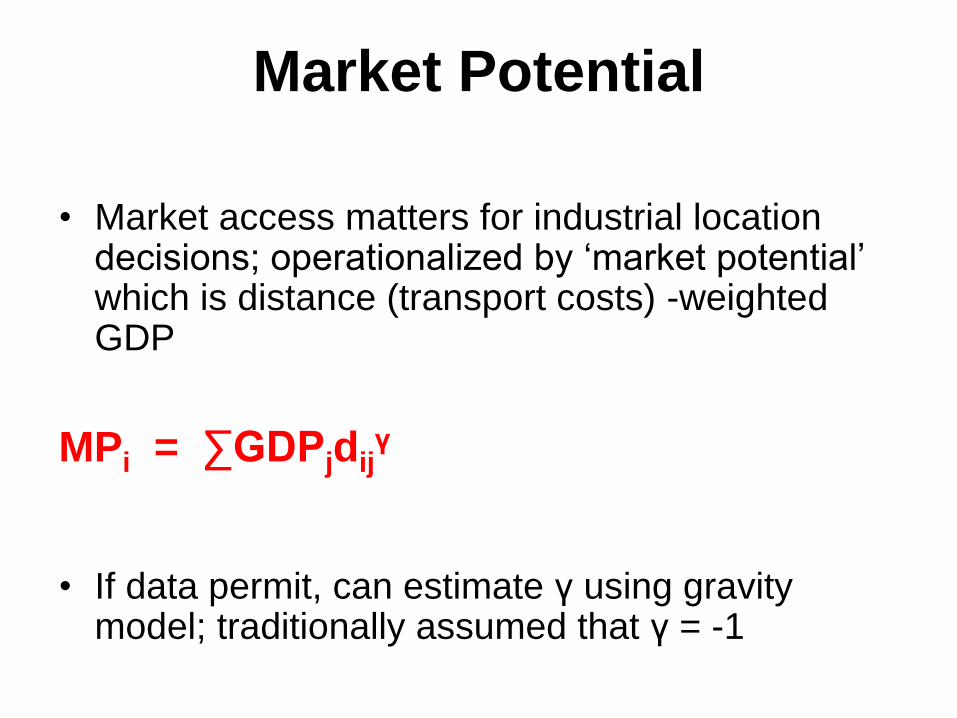
Market Potential
• Market access matters for industrial location decisions; operationalized by ‘market potential’ which is distance (transport costs) -weighted GDP
MPi = ∑GDPjdijγ
• If data permit, can estimate γ using gravity model; traditionally assumed that γ = -1

Late 20th Century Empirics (Redding & Venables, 2004)
• There is a high correlation between location and income so, following Acemoglu’s strategy, this also might explain divergence big time
• Market potential elasticity around 0.3
• Location effects largely robust to including institutional quality
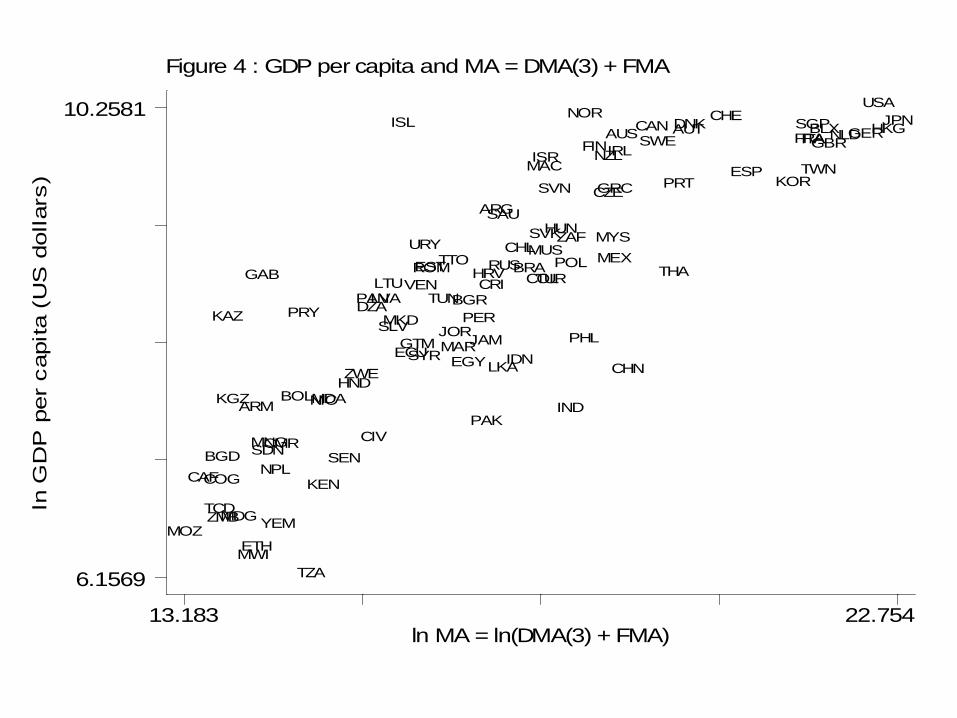
Figure 4 : GDP per capita and MA = DMA(3) + FMA
ln G
DP
per
capita (
US
dollars
)
ln MA = ln(DMA(3) + FMA)13.183 22.754
6.1569
10.2581
ARG
ARM
AUS AUT
BGD
BGR
BLX
BOL
BRA
CAF
CANCHE
CHL
CHN
CIVCMR
COG
COLCRI
CZE
GERDNK
DZA
ECUEGY
ESP
EST
ETH
FINFRA
GAB
GBR
GRC
GTM
HKG
HND
HRV
HUN
IDN
IND
IRL
ISL
ISR
ITA
JAMJOR
JPN
KAZ
KEN
KGZ
KOR
LKA
LTULVA
MAC
MAR
MDA
MDG
MEX
MKD
MNG
MOZ
MUS
MWI
MYS
NIC
NLD
NOR
NPL
NZL
PAK
PAN
PER
PHL
POL
PRT
PRY
ROM RUS
SAU
SDNSEN
SGP
SLV
SVK
SVN
SWE
SYR
TCD
THATTO
TUN
TUR
TWN
TZA
URY
USA
VEN
YEM
ZAF
ZMB
ZWE

A Prediction
If Zimbabwe were re-located to
Hungary, real GDP per person
would rise by 80 per cent
Redding & Venables (2004)

Changes in 19th-Century
Economic Geography
• Industrialization and de-industrialization in
globalizing world
• Concentration of world manufacturing
production and, even more so, exports
• Changes in location influenced by transport
costs; manufacturing cities proliferated in
Europe and North America; mass
production and mass distribution

Source: Harley (1988)
Real Cost of Ocean Shipping (1910=100)
0
50
100
150
200
250
300
350
1750 1830 1870 1910

Shares of World Industrial Production (%)
China India Western Europe
USA
1750 33 24 23 0.1
1830 30 18 34 2
1880 12 3 61 15
1913 4 1 57 32
1953 2 2 26 45
2010 15 2 24 25
Sources: Bairoch (1982) and UNIDO (2012)
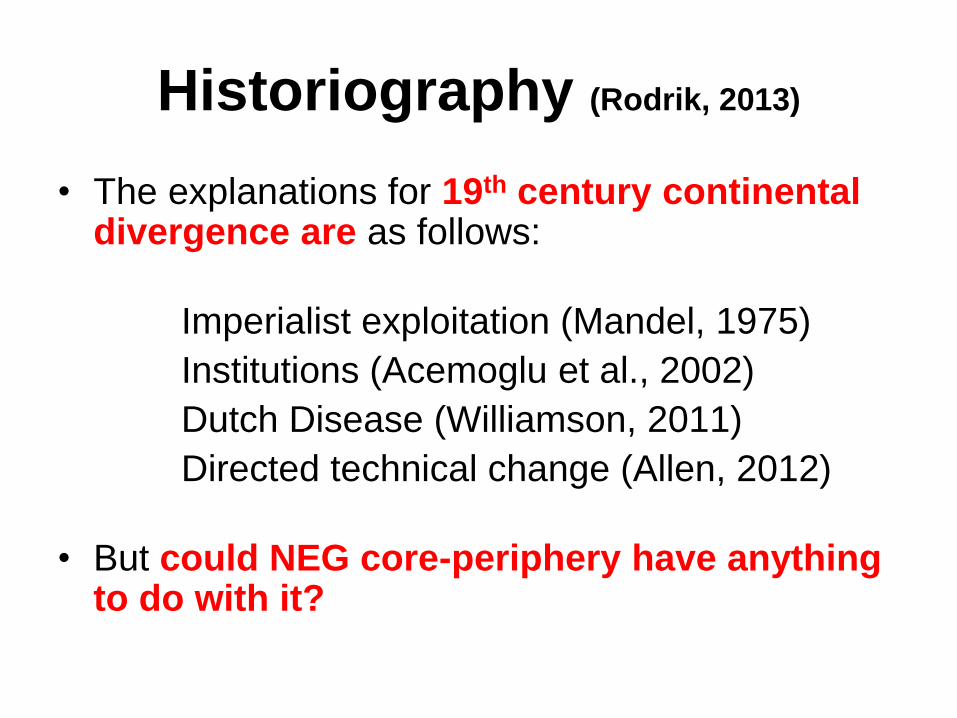
Historiography (Rodrik, 2013)
• The explanations for 19th century continental divergence are as follows:
Imperialist exploitation (Mandel, 1975)
Institutions (Acemoglu et al., 2002)
Dutch Disease (Williamson, 2011)
Directed technical change (Allen, 2012)
• But could NEG core-periphery have anything to do with it?

Market Access Then and Now (Redding & Venables, 2002; Liu & Meissner, 2013)
1910 1995
USA 100 North America 100
UK 88 Western Europe 92
India 31 South Asia 40
Indonesia 13 Latin America 35
Argentina 7 Africa 34

Market Potential and GDP
100 Years Ago • Has similar impact on real GDP/person to late
20th century with elasticity of about 0.3 in whole world countries sample (Liu & Meissner, 2013) or in European regions sample (Caruana-Galizia, 2013)
• Core Europe has much greater market potential than peripheral Asia (and Southern Europe) by the late 19th century
• Liu & Meissner’s estimates suggest the following quote may not be entirely accurate

A Quotation
“No deus ex machina translates
endowments into political
outcomes. If that were so,
Argentina would be as rich as the
United States”
North et al. (2000)
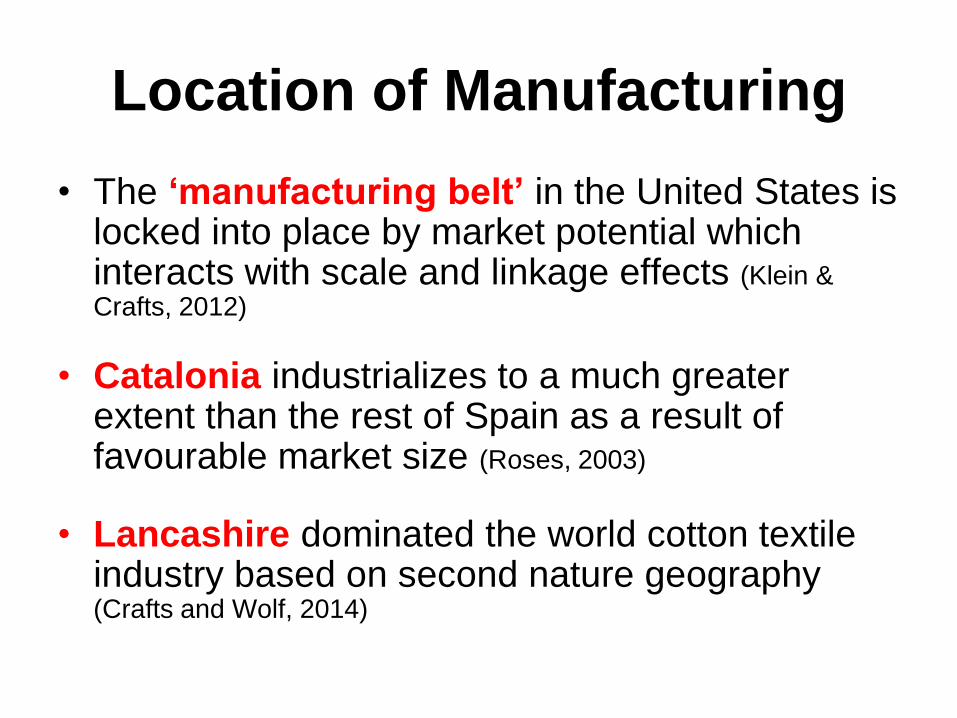
Location of Manufacturing
• The ‘manufacturing belt’ in the United States is locked into place by market potential which interacts with scale and linkage effects (Klein & Crafts, 2012)
• Catalonia industrializes to a much greater extent than the rest of Spain as a result of favourable market size (Roses, 2003)
• Lancashire dominated the world cotton textile industry based on second nature geography (Crafts and Wolf, 2014)

Incomplete Catch-Up
• Historical experience is that even quite successful catch-up may stall well short of complete convergence
• Type of growth changes at different stages of development
• Far-from-frontier and close-to-frontier countries need different institutions and policies (Aghion & Howitt, 2006)
• Continual reform required but this is difficult
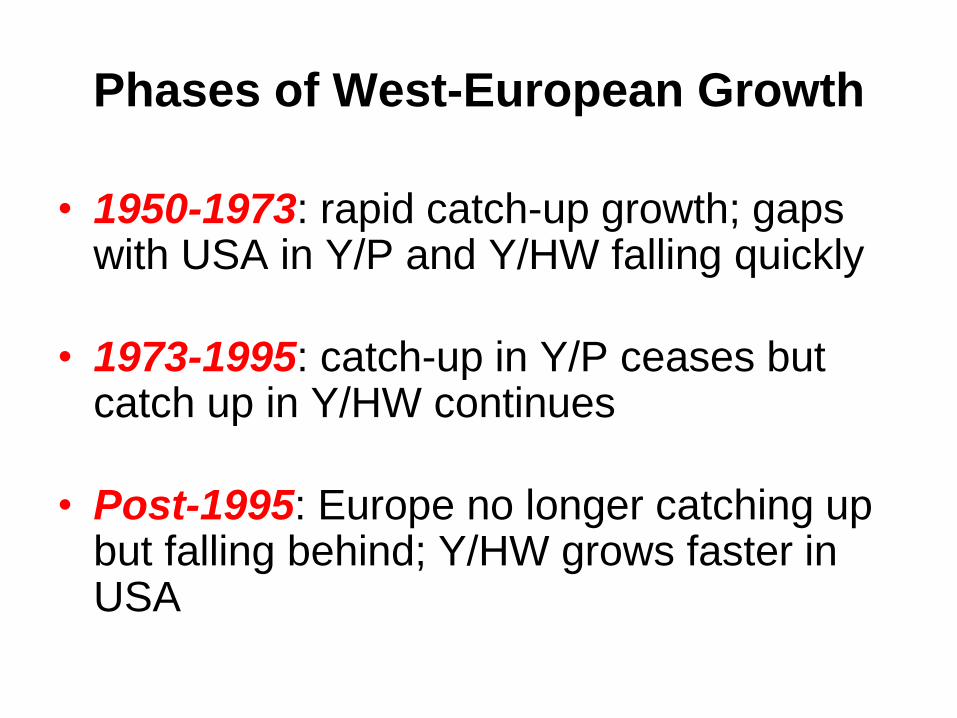
Phases of West-European Growth
• 1950-1973: rapid catch-up growth; gaps with USA in Y/P and Y/HW falling quickly
• 1973-1995: catch-up in Y/P ceases but catch up in Y/HW continues
• Post-1995: Europe no longer catching up but falling behind; Y/HW grows faster in USA

Late 20th Century Europe
• Now ‘close-to-frontier’ not ‘far-from-frontier’
• Adverse implications of ‘post-war settlements’
• Failed to make necessary reforms after the
end of the ‘golden-age’
• Struggled to exploit the ICT opportunity
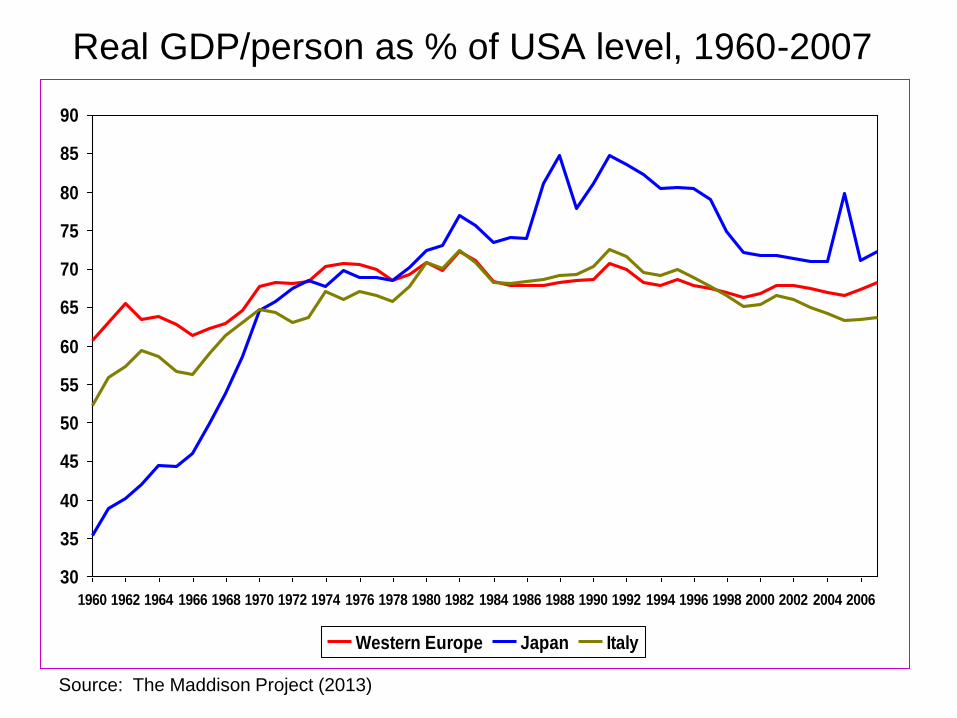
Source: The Maddison Project (2013)
Real GDP/person as % of USA level, 1960-2007
30
35
40
45
50
55
60
65
70
75
80
85
90
1960 1962 1964 1966 1968 1970 1972 1974 1976 1978 1980 1982 1984 1986 1988 1990 1992 1994 1996 1998 2000 2002 2004 2006
Western Europe Japan Italy

UK Relative Economic Decline
in the Golden Age
• The UK growth failure in 1950-73 was about 0.75 pp
per year; UK was overtaken by European rivals (Crafts &
Toniolo, 2008)
• Supply-side policy was badly designed and undermined
incentives to invest and to innovate
• Policy was seriously constrained by accepting the ‘trade
union veto’ in seeking to maintain full employment
• Weak competition sustained bad management and low-
effort bargains

Levels and Rates of Growth of Real
GDP/Person 1950-1973 ($1990GK and % per year)
0
1
2
3
4
5
6
7
Sw
itze
rlan
d
De
nm
ark
UK
Sw
ed
en
Ne
thrla
nd
s
Be
lgiu
m
No
rwa
y
Fra
nc
e
W. G
erm
an
y
Fin
lan
d
Au
stria
Italy
Irela
nd
Sp
ain
Po
rtug
al
Gre
ec
e

Real GDP/Person (UK = 100 in each year)
USA
West Germany
France
1870 76.6 58.8
1913 107.8 70.8
1950 137.7 61.7 74.7
1964 133.5 101.3 92.2
1979 142.7 115.9 111.1
1997 133.7 100.9 95.4
2007 124.9 88.9 86.8
Sources: The Conference Board (2014) and West Germany in 2007 calculated from Statistiches Bundesamt Deutschland.

An Early Start Hypothesis
• The real penalties of Britain’s ‘early start’ were felt after
World War II
• The key transmission mechanism was the persistence
of institutions together with the policy framework
resulting from the severe interwar problems to which the
early start exposed Britain
• Retreat from competition interacted with corporate
governance and industrial relations legacies to
undermine productivity performance (Crafts, 2012)
• It took roughly 50 years to deal with this problem
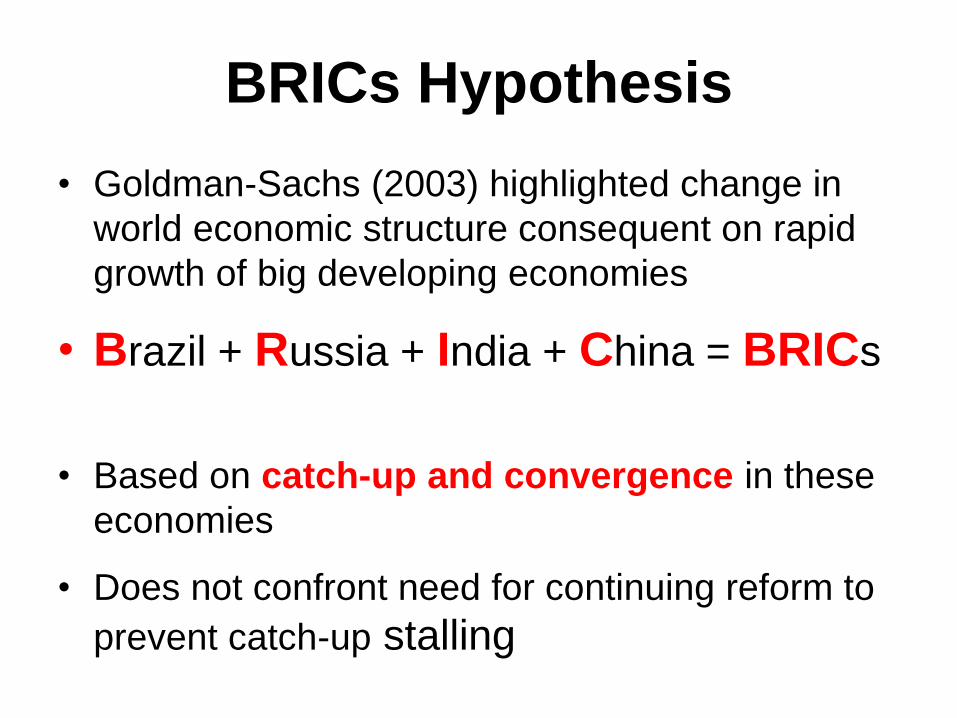
BRICs Hypothesis
• Goldman-Sachs (2003) highlighted change in
world economic structure consequent on rapid
growth of big developing economies
• Brazil + Russia + India + China = BRICs
• Based on catch-up and convergence in these
economies
• Does not confront need for continuing reform to
prevent catch-up stalling

The BRICs Model
• Conventional and mechanistic
Y = AK0.35L0.65
ΔA/A = 1.3 + 1.5[log(Y/PUS) – log(Y/PBRIC)]
• Capital stock growth keeps pace with effective labour supply growth and Y/L growth at about 1.5 times TFP growth: TFP growth slows down gradually as catch-up proceeds
• Takes membership (or not) of the catch-up growth club as a given

Back to 1974
• It would be nice to believe that this model worked well in the past
• Starting in 1974, its predictions of future shares of world GDP would have been way off:
it would have assumed continuing Japanese and European catch-up of USA
it would have had no way to predict the rise of China and India

OECD (2012) Projections
• Chinese growth will slow down as scope for
catch-up diminishes and labour force falls
• Normal catch-up trajectory entails China = 55%
American Y/P in 2050 and Chinese share of
world GDP stable at about 28% post 2030
• This might be too optimistic on China if future
reforms are problematic
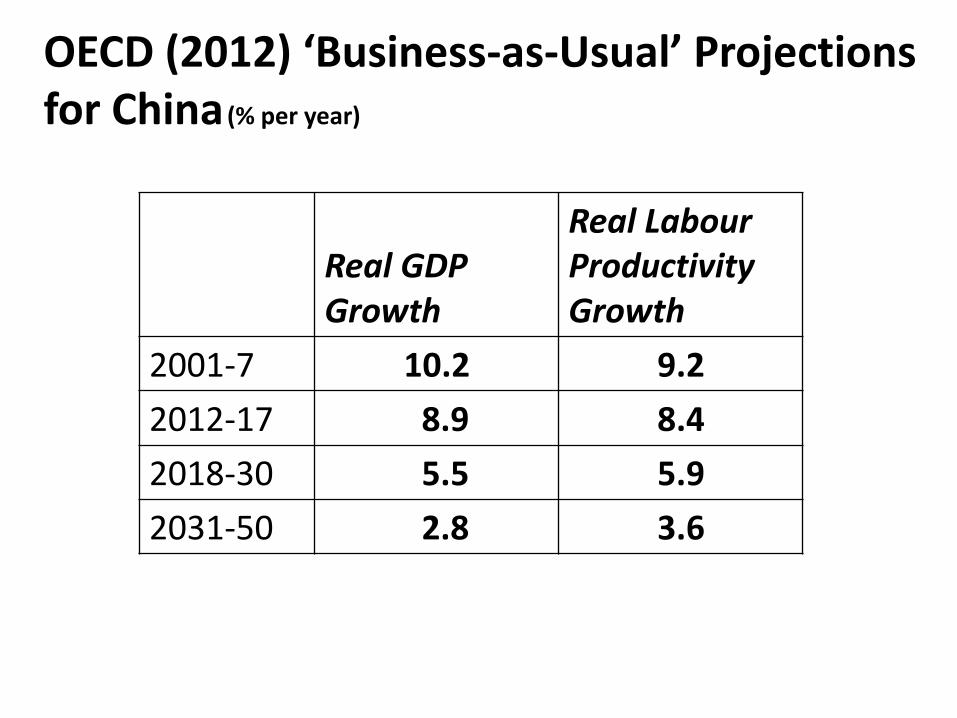
OECD (2012) ‘Business-as-Usual’ Projections for China (% per year)
Real GDP Growth
Real Labour Productivity Growth
2001-7 10.2 9.2
2012-17 8.9 8.4
2018-30 5.5 5.9
2031-50 2.8 3.6
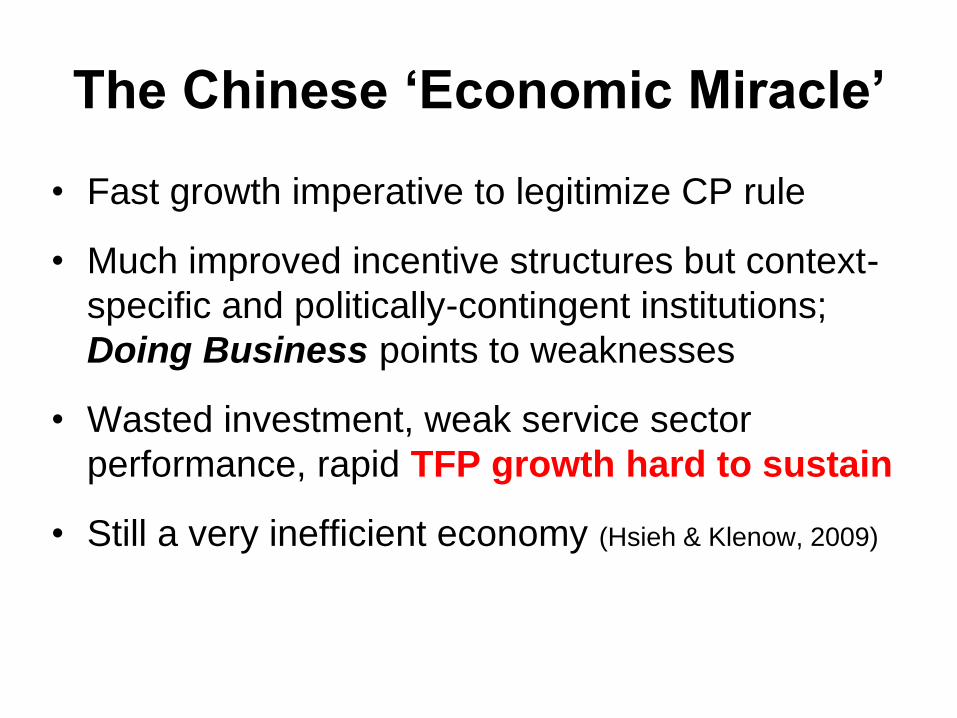
The Chinese ‘Economic Miracle’
• Fast growth imperative to legitimize CP rule
• Much improved incentive structures but context-
specific and politically-contingent institutions;
Doing Business points to weaknesses
• Wasted investment, weak service sector
performance, rapid TFP growth hard to sustain
• Still a very inefficient economy (Hsieh & Klenow, 2009)

The RDA Model of Growth (Xu, 2011)
• China like M-form firm with internal labour market; central government gives strong incentives for local officials to promote growth
• Incentives high-powered with single-task, effective yardstick competition, and CP in power
• Faster (slower) growth substantially raises probability of promotion (termination) for officials
• Explains rapid growth despite ‘bad institutions’ but will need to be replaced

Africa’s Growth Tragedy
• For 25 years from the 1970s income levels in Africa stagnated
• Neither economic policy nor institutions were conducive to joining the catch-up growth club
• Africa has not been favoured by geography
• But stronger growth recently … means an African Tiger is unleashed?
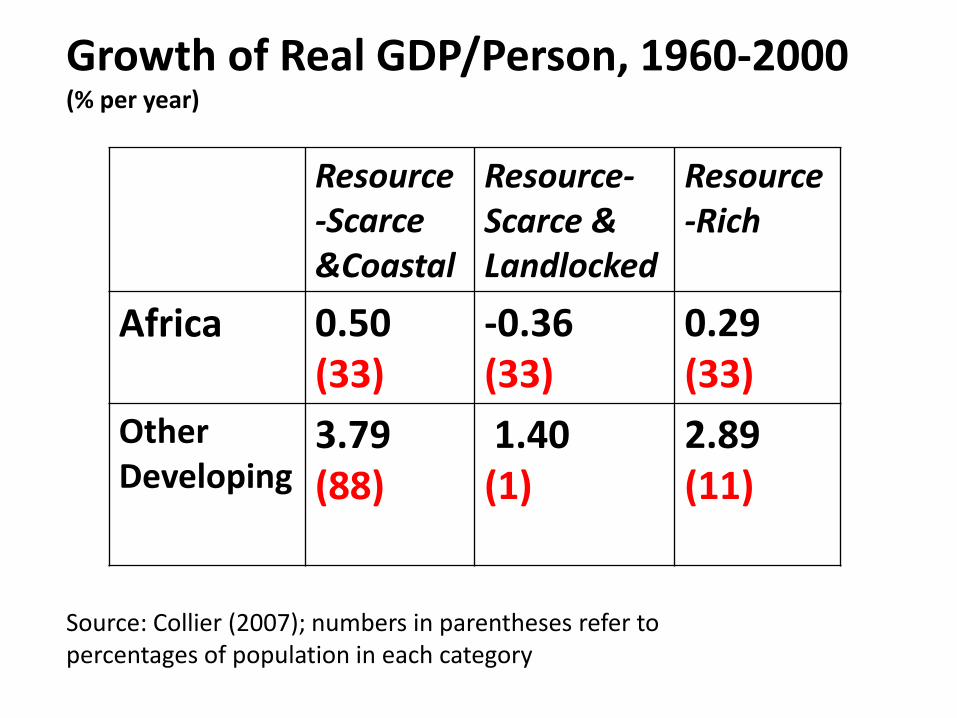
Growth of Real GDP/Person, 1960-2000
(% per year)
Resource-Scarce &Coastal
Resource-Scarce &
Landlocked
Resource-Rich
Africa 0.50 (33)
-0.36 (33)
0.29 (33)
Other Developing
3.79 (88)
1.40 (1)
2.89 (11)
Source: Collier (2007); numbers in parentheses refer to percentages of population in each category

African Tigers?
• The recent growth spurt is based on very strong demand growth for primary exports driven especially by Chinese demand
• Whether this leads to sustained catch up growth is doubtful:
Productivity growth still quite weak
No industrialization surge
Weak institutions, moderate CPIA scores, and geographic handicaps have not gone away
Sub-Saharan Africa: Reality Check
• 1997-2012: Y/L growth = 2.1%, TFP growth = 0.8%
• Manufacturing = 10% GDP in 2010
• Market access relatively low; is globalization really Africa’s long-term friend?
• Doing Business and Governance Matters scores generally still quite low
• None of Acemoglu, Krugman or Rodrik would see this as highly promising

What Does OECD Project for Post-
Crisis Europe?
• Crisis affects output levels but not trend growth rate
• Basically, it is pre-crisis ‘business as usual’
• Catch-up growth resumes and slow convergence towards ‘best-practice’ supply-side policy continues

OECD Real GDP/Person Potential Growth Projections (% per year)
2000-2007 2008-13 2014-30
Euro Area 1.1 0.5 1.5
France 1.1 0.7 1.8
Germany 1.2 1.4 1.3
Netherlands 1.5 0.6 1.8
UK 2.1 0.3 2.0
Greece 2.6 -1.2 2.1
Ireland 3.5 0.8 1.4
Italy 0.7 -0.6 1.2
Portugal 1.2 0.2 1.3
Spain 1.8 -0.2 1.1
Source: OECD, Economic Outlook (2014)
A More Sceptical View
• Medium-term effect of the crisis is likely to be
negative (Crafts, 2013)
• The aftermath of the 1930s crisis is not
encouraging nor is the rise of populism;
‘desirable reforms’ less likely?
• High debt to GDP ratios and lower levels of
European economic integration are an
unfortunate legacy
Lessons
• Catch-up is nearly always incomplete; the BRICs and Europe will face big reform challenges to address this problem
• Geography matters and this remains a big problem for Africa
• It is still not a neoclassical world of beta and sigma convergence


