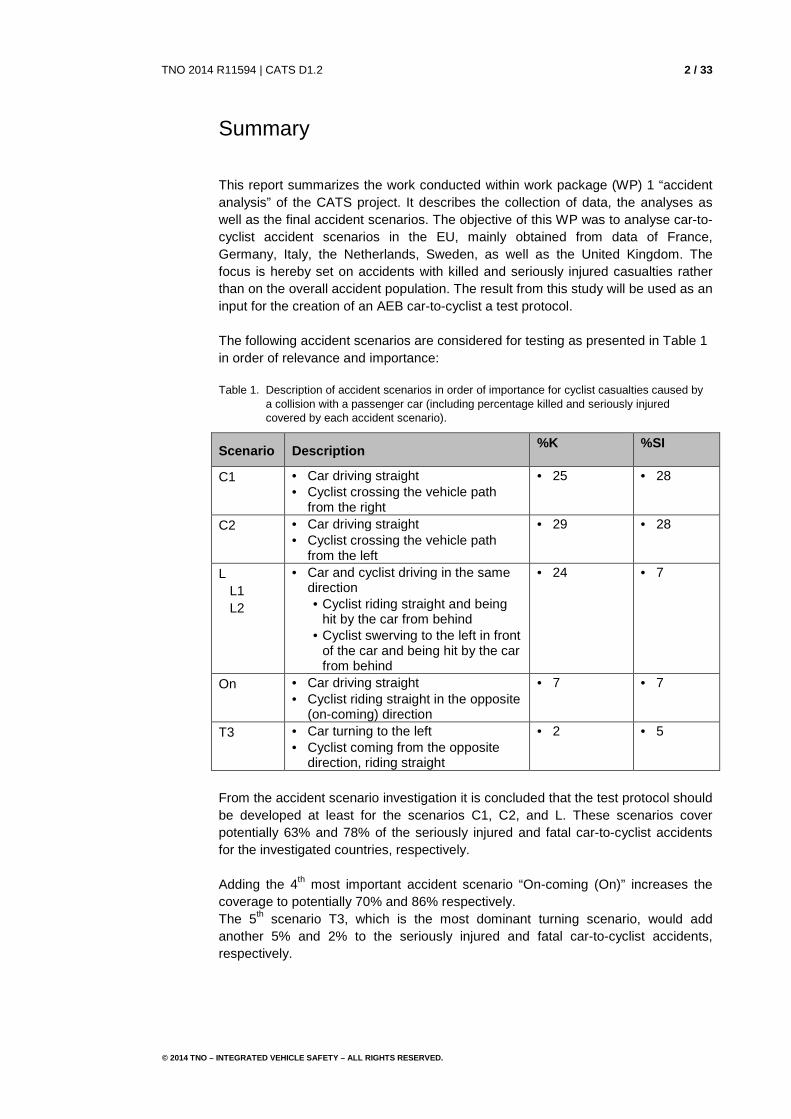
This report summarizes the work conducted within work package (WP) 1 “accident analysis” of the CATS project. It describes the collection of data, the analyses as well as the final accident scenarios. The objective of this WP was to analyse car-to-cyclist accident scenarios in the EU, mainly obtained from data of France, Germany, Italy, the Netherlands, Sweden, as well as the United Kingdom. The focus is hereby set on accidents with killed and seriously injured casualties rather than on the overall accident population. The result from this study will be used as an input for the creation of an AEB car-to-cyclist a test protocol. The following accident scenarios are considered for testing as presented in Table 1 in order of relevance and importance:
Table 1. Description of accident scenarios in order of importance for cyclist casualties caused by a collision with a passenger car (including percentage killed and seriously injured covered by each accident scenario).
Scenario Description %K %SI
C1 • Car driving straight • Cyclist crossing the vehicle path
from the right
• 25 • 28
C2 • Car driving straight • Cyclist crossing the vehicle path
from the left
• 29 • 28
L L1 L2
• Car and cyclist driving in the same direction • Cyclist riding straight and being
hit by the car from behind • Cyclist swerving to the left in front
of the car and being hit by the car from behind
• 24 • 7
On • Car driving straight • Cyclist riding straight in the opposite
(on-coming) direction
• 7 • 7
T3 • Car turning to the left • Cyclist coming from the opposite
direction, riding straight
• 2 • 5
From the accident scenario investigation it is concluded that the test protocol should be developed at least for the scenarios C1, C2, and L. These scenarios cover potentially 63% and 78% of the seriously injured and fatal car-to-cyclist accidents for the investigated countries, respectively. Adding the 4th most important accident scenario “On-coming (On)” increases the coverage to potentially 70% and 86% respectively. The 5th scenario T3, which is the most dominant turning scenario, would add another 5% and 2% to the seriously injured and fatal car-to-cyclist accidents, respectively.
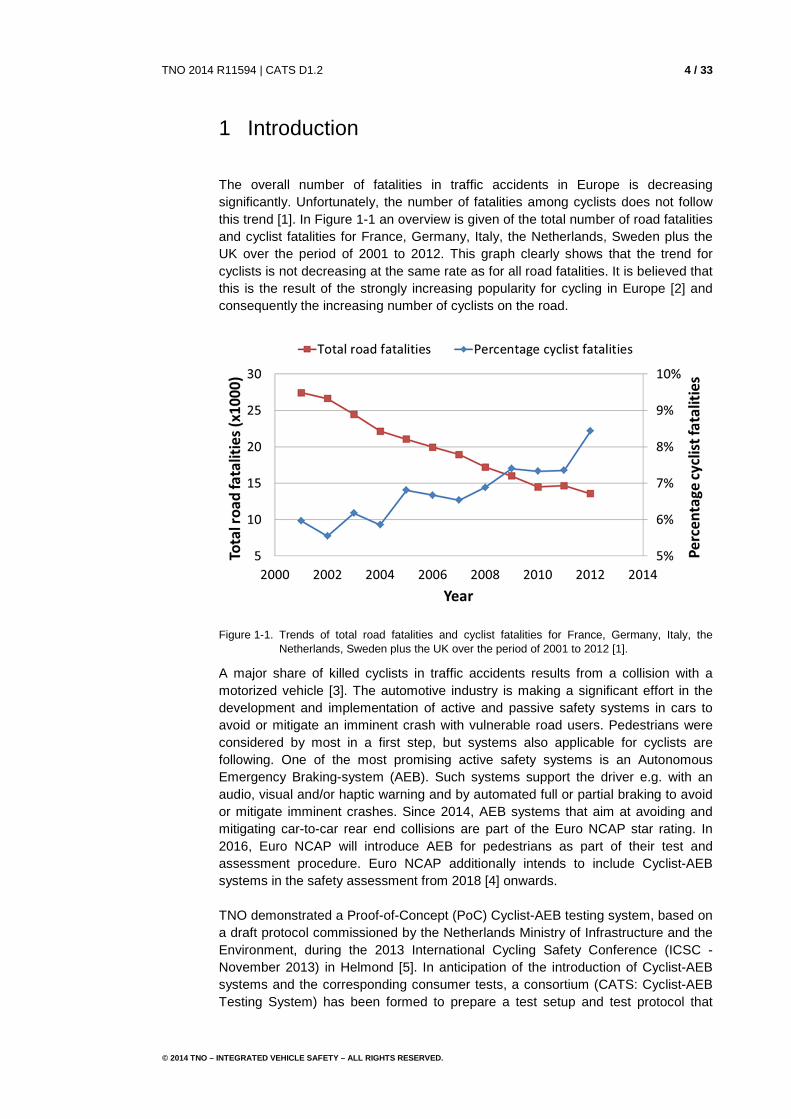
The overall number of fatalities in traffic accidents in Europe is decreasing significantly. Unfortunately, the number of fatalities among cyclists does not follow this trend [1]. In Figure 1-1 an overview is given of the total number of road fatalities and cyclist fatalities for France, Germany, Italy, the Netherlands, Sweden plus the UK over the period of 2001 to 2012. This graph clearly shows that the trend for cyclists is not decreasing at the same rate as for all road fatalities. It is believed that this is the result of the strongly increasing popularity for cycling in Europe [2] and consequently the increasing number of cyclists on the road.
Figure 1-1. Trends of total road fatalities and cyclist fatalities for France, Germany, Italy, the Netherlands, Sweden plus the UK over the period of 2001 to 2012 [1].
A major share of killed cyclists in traffic accidents results from a collision with a motorized vehicle [3]. The automotive industry is making a significant effort in the development and implementation of active and passive safety systems in cars to avoid or mitigate an imminent crash with vulnerable road users. Pedestrians were considered by most in a first step, but systems also applicable for cyclists are following. One of the most promising active safety systems is an Autonomous Emergency Braking-system (AEB). Such systems support the driver e.g. with an audio, visual and/or haptic warning and by automated full or partial braking to avoid or mitigate imminent crashes. Since 2014, AEB systems that aim at avoiding and mitigating car-to-car rear end collisions are part of the Euro NCAP star rating. In 2016, Euro NCAP will introduce AEB for pedestrians as part of their test and assessment procedure. Euro NCAP additionally intends to include Cyclist-AEB systems in the safety assessment from 2018 [4] onwards. TNO demonstrated a Proof-of-Concept (PoC) Cyclist-AEB testing system, based on a draft protocol commissioned by the Netherlands Ministry of Infrastructure and the Environment, during the 2013 International Cycling Safety Conference (ICSC - November 2013) in Helmond [5]. In anticipation of the introduction of Cyclist-AEB systems and the corresponding consumer tests, a consortium (CATS: Cyclist-AEB Testing System) has been formed to prepare a test setup and test protocol that
covers the most relevant accident scenarios for Cyclist-AEB systems and to develop the test tools necessary for such tests. This report summarizes the work conducted within work package WP1 “accident analysis” of this project. It describes the final accident scenarios as well as the statistical background. The objective of this WP is to analyse car-to-cyclist accident scenarios in the EU mainly obtained from data of Belgium, France, Germany, Italy, the Netherlands, Spain, Sweden, as well as the United Kingdom. The focus is hereby set on accidents with killed and seriously injured casualties rather than on the overall accident population.
The test protocol to be developed within the CATS consortium shall address car-to-cyclist accidents which have led to serious or fatal injuries to the cyclist and could potentially be prevented by an AEB system on a car. This chapter outlines the process of defining, selecting and prioritizing possible cyclist-to car accident scenarios.
2.1 Data sources
The accidents reflected should be relevant and representative for not only one country, but ideally for the overall EU28. Therefore, data from different countries needs to be considered. Unfortunately, not for all EU28 countries appropriate data is available. Therefore, data has been collected from Belgium, France, Germany, Italy, the Netherlands, Spain, Sweden and the United Kingdom. For this specific protocol not all seriously injured and fatal cyclist accidents are relevant. Though presenting an important share amongst the seriously injured cyclist accidents, for example single sided cyclist accidents cannot be addressed by any safety system on a car. Therefore, only accidents involving a collision between one bicycle and one M1 vehicle (passenger car) were selected. A bicycle is defined as a legal bicycle, which will include e-bikes, but not motorized 2 wheelers such as mopeds, scooters or speed pedelecs. In the following, results are presented for fatalities (or killed K) as well as for seriously injured (MAIS2+, indicated as SI) excluding fatalities. An overview of the different data sources including the number of fatal and seriously injured casualties and the time frame selected for analysis is presented in Table 2. A short description of each data source is given here: Belgium: Data are considered from a study performed by the Institut Belge
pour la securite Routiere on 424 accidents registered by the authorities in the Brussels area between 1998 and 2000 [6]. Since only a small share of the data considered accidents with seriously injured or fatal cyclists, this data is unfortunately not useable. Moreover, the period for these data makes it difficult to compare the data with other databases.
France: Data are considered from LAB (Laboratoire d'Accidentologie et de
Biomécanique) that use a database created for the French project called “VOIESUR” [7].The objective of this database is to have an intermediary level of detail between national data and in-depth data collection. The codification has been done from French police reports. About 8.500 accident cases were coded by a specialist during 1,5 years. The databases distinguishes between fatalities, seriously injured (hospitalized for at least 24h) and slightly injured (received medical care but not admitted to hospital for more than 24h).
Germany: Three data sources for Germany have been studied: GIDAS, the German In-Depth Accident Study, is cooperation
between BASt and the Automotive Research Association (FAT). Approximately 2,000 accidents involving personal injury are recorded in the area of Dresden and Hannover annually. From GIDAS, data were used for fatalities (check-box: killed within 30
days after the accident) and seriously injured coded as AIS2+, excl. fatalities (according to the abbreviated injury scale [8]).
GIDAS-based PCM [9]: By simulating the pre-crash scenario, additional and standardized data to describe the pre-crash- sequence of an accident in a very high detail is generated and documented in the GIDAS-based Pre-Crash-Matrix (PCM). The PCM contains major relevant data to reproduce the pre-crash-sequence of traffic accidents from the GIDAS database until 5 seconds before the first collision.
German national accident data comprising a five years period from 2008 to 2012 from the official German national accident statistics enriched by data from BASt .
Italy: Fiat Group Automobiles enforces accident data collection from
2011. The in-depth accident database is an FIAT internal database [10] with the following information: accident circumstances, vehicle and injury severity (killed, injured, not injured; each injury is coded according to AIS [8]). For the CATS activities, a distinction is made between fatalities (killed) and injured (MAIS2+, excl. fatalities). Data are collected in cooperation with several Italian Universities and the police.
Netherlands: BRON Netherlands national road crash register; police registered
numbers of casualties, drivers and crashes [11]. Serious road injuries are reported to be casualties who have been seriously injured in a traffic crash in the Netherlands. This means that they have been admitted to a (Dutch) hospital with injury of a minimum AIS value of 2 for which they received treatment. The seriously injured numbers are exclusive of the number of fatalities (defined as killed due to the accident, within 30 days after the accident happened).
Spain: Mafre, a spanish insurrance company, performed a study towards
cyclist safety using data from the government department that is responsible for the Spanish transport network (Dirección General de Tráfico, DGT) [12]. This study contains about 2400 fatal en seriously injured car-to-cyclist accidents. However the data is not specific enough to analyze the accident scenarios and is therefore not useable in this study.
Sweden: Data are used from the Swedish Transport Administration fatal
database (STA) and the Swedish Traffic Accident Data Acquisition (STRADA) [12]. STRADA is a national information system collecting data of injuries and accidents in the entire road transport system. STRADA is based on information from the police as well as the hospitals. The hospital records consist of ICD diagnoses and AIS coded injuries. Car-to-cyclists cases resulting AIS2+ were selected from STRADA. Furthermore the Volvo Cars has its own internal database where information on crashes is collected in cooperation with insurance company If - where all new Volvo cars are insured. The dataset cover crashes all over Sweden 2005-2012 with recent Volvo Car models, in total 252 collisions. 62 of these were recorded in STRADA Hospital and 54 in STRADA Police.
United Kingdom: The STATS19 Road Accident dataset is used for the UK as
analysed for the AsPeCSS project [14]. The police definition of serious injury covers casualties admitted to hospital, as well as
those with specific types of injury (for example fractures or severe cuts). Severity of injury is known to be prone to misclassification in STATS19 due to the difficulties of such assessment by non-experts at the scene of the accident. Comparisons with death registration statistics show that very few, if any road accident fatalities are not reported to the police.
This concludes in useable data with different levels of reliability from 6 countries: France, Germany, Italy, The Netherlands, Sweden and the United Kingdom. For Germany the GIDAS-based PCM database is chosen as representative, however a sensitivity study will follow in the next chapter between all available data sources. For Sweden the complete STA/STRADA data source is chosen as representative.
Table 2. Overview of the available accident databases to make a selection of relevant accident scenarios
# Country Source
Killed Seriously injured
Period Definition
n Definition
n
1 France
LAB [7] Fatal 72 Severely injured
620 2011
2 Germany
GIDAS based PCM [9]
Fatal 11 AIS2+ 360 1999-2012
3 Italy
Fiat internal [10]
Fatal 23 AIS2+ 17 2003-2014
4 Netherlands
BRON [11] Fatal 902 Seriously injured
10854 2000-2013
5 Sweden STA/STRADA [12]
Fatal 104 AIS2+ 435 2005-2014 K 2010-2014 SI
6 UK
STATS19 [14] Fatal 116 Seriously injured
2699 2008-2010
The following limitations should be noted: • Some of the sources contain in-depth data, where others contain higher level
data only. Therefore, not for all sources the same level of detail is available. • The time periods for the selected data vary. Limiting the data to a common
timeframe would have reduced the data significantly and was therefore not done. When looking at all different GIDAS studies performed over several different time frames (section 3.1), it can be seen that accident scenarios do not seem to change with time. It is therefore assumed that there is no evolution on the car-to-cyclist accidents scenarios in the period from 2000-2013 and that using different time frames is allowed.
• Some of the data is based on police recorded records. Policemen are not necessarily experts in crash reconstruction and data is sometimes witness-based, thus data may contain subjective information.
• Not all databases use the same definitions for “killed” and “seriously injured”. A casualty might be listed under “killed” for one data source only when the victim died on the site of the accident where another database would list the casualty under “killed” also if the victim would have died no later than 30 days after the accident occurred. The same holds for “seriously injured”, though for most
databases a severe injury for this study could be defined as an accident with MAIS 2+ injuries.
• The number of fatalities is low for some sources and must be regarded with care when trying to draw statistically relevant conclusions.
• It can be seen that, due to various reasons, the ration between killed and seriously injured are not the same between the different data sources. The 2 groups should therefore be examined separately.
For Germany, five useable datasets were received for analysis from different partners using different data queries: three based on GIDAS[15], one using the GIDAS-based Pre-Crash-Matrix (PCM) [16] and one dataset referring to DESTATIS [17] (German national statistics). These five datasets are compared in a sensitivity study reported in section 3.1 to check if they would all show the same trends. To avoid confusion and present a consistent study, only the GIDAS based PCM dataset is selected for inclusion in the following analysis as it provides the most details on the relevant accident parameters. For consistency, the dataset from the UK (STATS19) has been translated towards EU main land right-hand driving, to be able to make a direct comparison with the accident scenarios in the other countries.
2.2 CATS accident scenarios
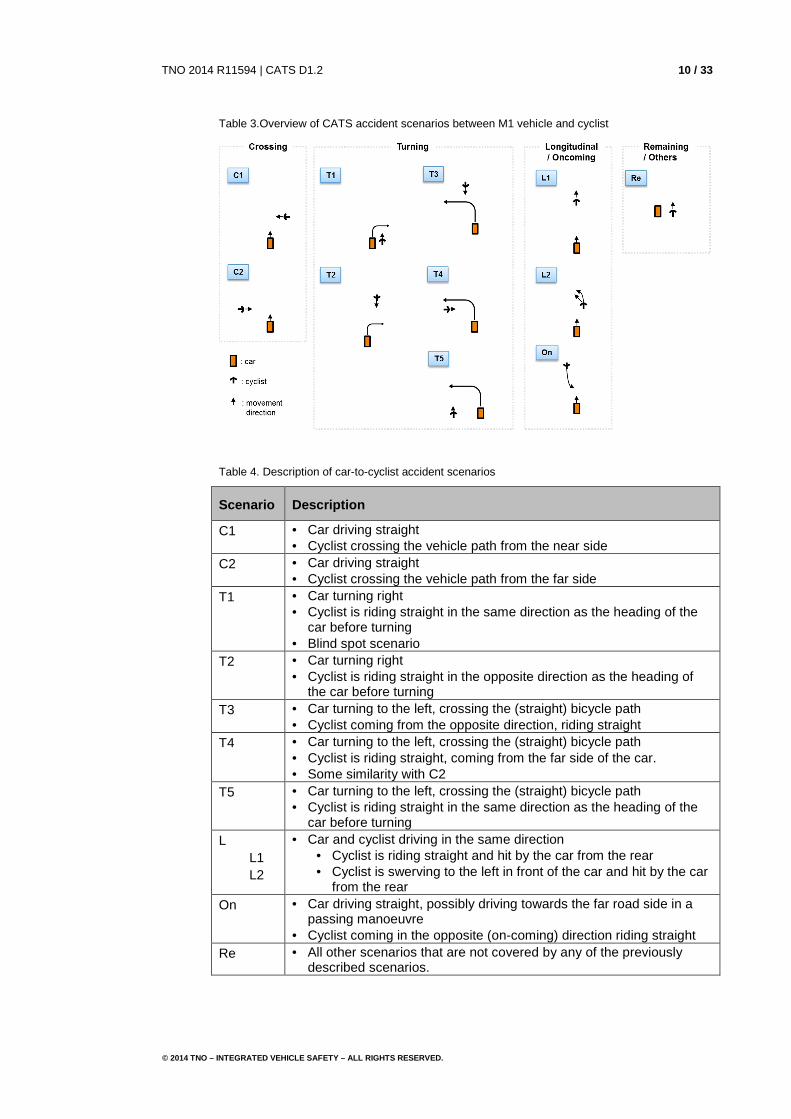
Though initially included in the accident scenario classification, the road layout is removed for the selection of accident types shown in Table 3. Each accident scenario is defined by the combination of the orientation of the bicycle with respect to the car and the driving manoeuvre and direction of both the car and the bicycle. Road layout parameters may be included in the definition of the protocol at a later stage. All accidents that could not be assigned to any of the 10 accident scenarios are allocated to the group Remaining (Re). For all accident scenarios shown in Table 3 (and explained in Table 4), the following boundary conditions hold: • Definitions are based on EU main land traffic directions and position on road. • The bicycle can be located either on the road or a bicycle lane. • Crossing is not limited to intersections.
Table 3.Overview of CATS accident scenarios between M1 vehicle and cyclist
Table 4. Description of car-to-cyclist accident scenarios
Scenario Description
C1 • Car driving straight • Cyclist crossing the vehicle path from the near side
C2 • Car driving straight • Cyclist crossing the vehicle path from the far side
T1 • Car turning right • Cyclist is riding straight in the same direction as the heading of the
car before turning • Blind spot scenario
T2 • Car turning right • Cyclist is riding straight in the opposite direction as the heading of
the car before turning T3 • Car turning to the left, crossing the (straight) bicycle path
• Cyclist coming from the opposite direction, riding straight T4 • Car turning to the left, crossing the (straight) bicycle path
• Cyclist is riding straight, coming from the far side of the car. • Some similarity with C2
T5 • Car turning to the left, crossing the (straight) bicycle path • Cyclist is riding straight in the same direction as the heading of the
car before turning L L1 L2
• Car and cyclist driving in the same direction • Cyclist is riding straight and hit by the car from the rear • Cyclist is swerving to the left in front of the car and hit by the car
from the rear On • Car driving straight, possibly driving towards the far road side in a
passing manoeuvre • Cyclist coming in the opposite (on-coming) direction riding straight
Re • All other scenarios that are not covered by any of the previously described scenarios.
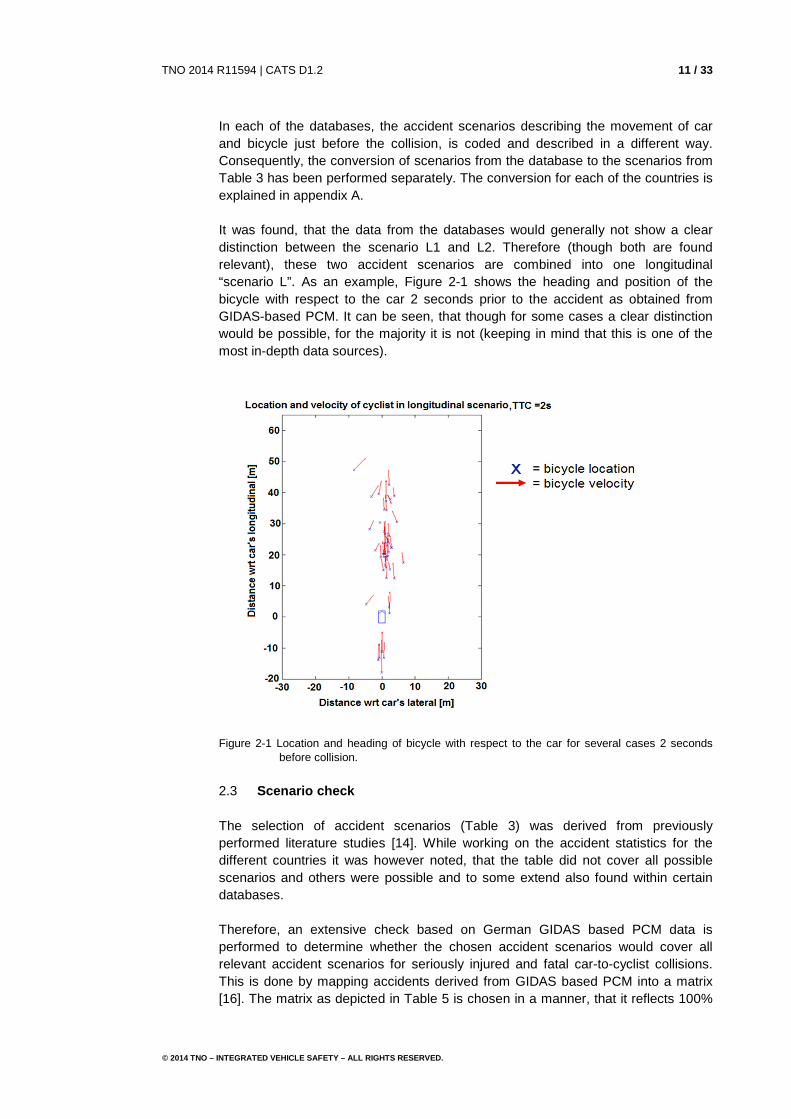
In each of the databases, the accident scenarios describing the movement of car and bicycle just before the collision, is coded and described in a different way. Consequently, the conversion of scenarios from the database to the scenarios from Table 3 has been performed separately. The conversion for each of the countries is explained in appendix A. It was found, that the data from the databases would generally not show a clear distinction between the scenario L1 and L2. Therefore (though both are found relevant), these two accident scenarios are combined into one longitudinal “scenario L”. As an example, Figure 2-1 shows the heading and position of the bicycle with respect to the car 2 seconds prior to the accident as obtained from GIDAS-based PCM. It can be seen, that though for some cases a clear distinction would be possible, for the majority it is not (keeping in mind that this is one of the most in-depth data sources).
Figure 2-1 Location and heading of bicycle with respect to the car for several cases 2 seconds before collision.
2.3 Scenario check
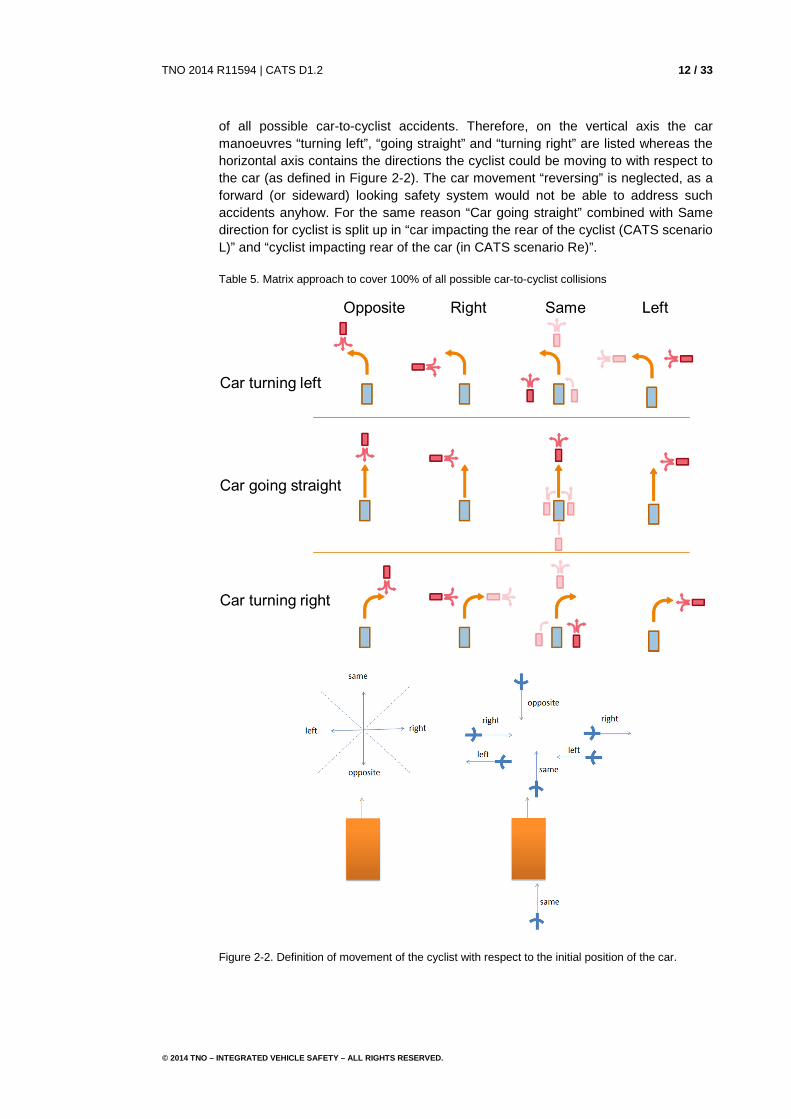
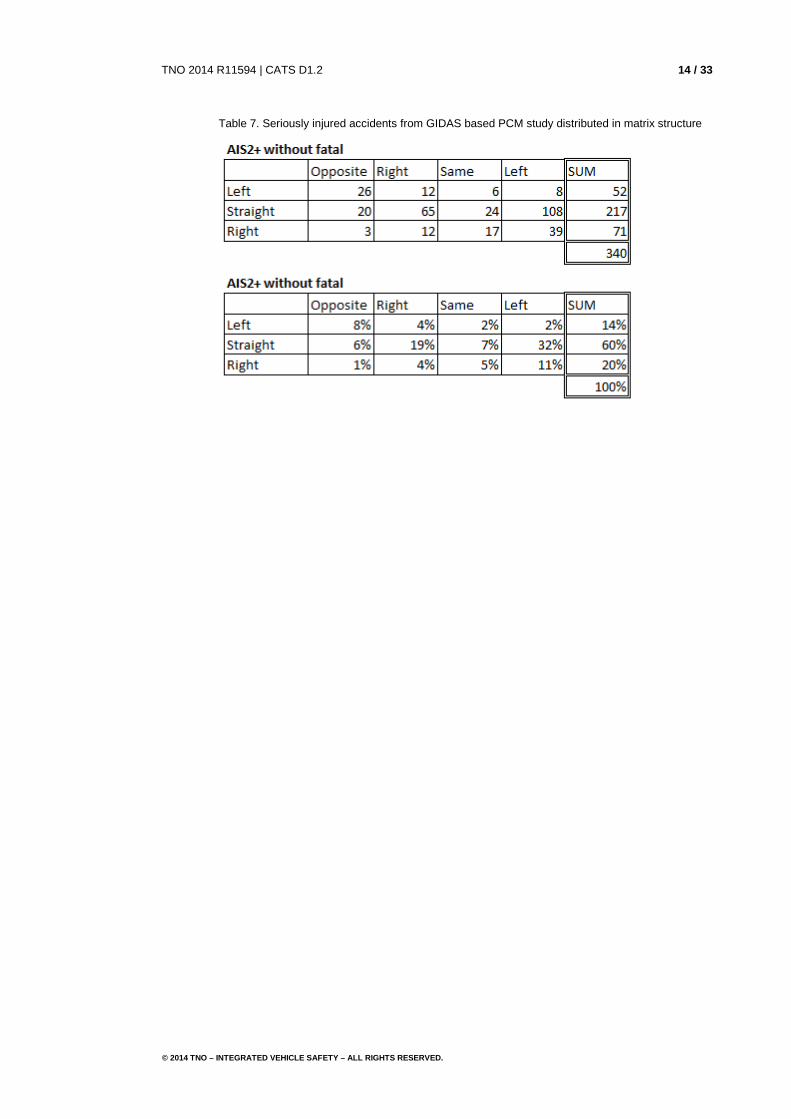
The selection of accident scenarios (Table 3) was derived from previously performed literature studies [14]. While working on the accident statistics for the different countries it was however noted, that the table did not cover all possible scenarios and others were possible and to some extend also found within certain databases. Therefore, an extensive check based on German GIDAS based PCM data is performed to determine whether the chosen accident scenarios would cover all relevant accident scenarios for seriously injured and fatal car-to-cyclist collisions. This is done by mapping accidents derived from GIDAS based PCM into a matrix [16]. The matrix as depicted in Table 5 is chosen in a manner, that it reflects 100%
of all possible car-to-cyclist accidents. Therefore, on the vertical axis the car manoeuvres “turning left”, “going straight” and “turning right” are listed whereas the horizontal axis contains the directions the cyclist could be moving to with respect to the car (as defined in Figure 2-2). The car movement “reversing” is neglected, as a forward (or sideward) looking safety system would not be able to address such accidents anyhow. For the same reason “Car going straight” combined with Same direction for cyclist is split up in “car impacting the rear of the cyclist (CATS scenario L)” and “cyclist impacting rear of the car (in CATS scenario Re)”.
Table 5. Matrix approach to cover 100% of all possible car-to-cyclist collisions
Figure 2-2. Definition of movement of the cyclist with respect to the initial position of the car.
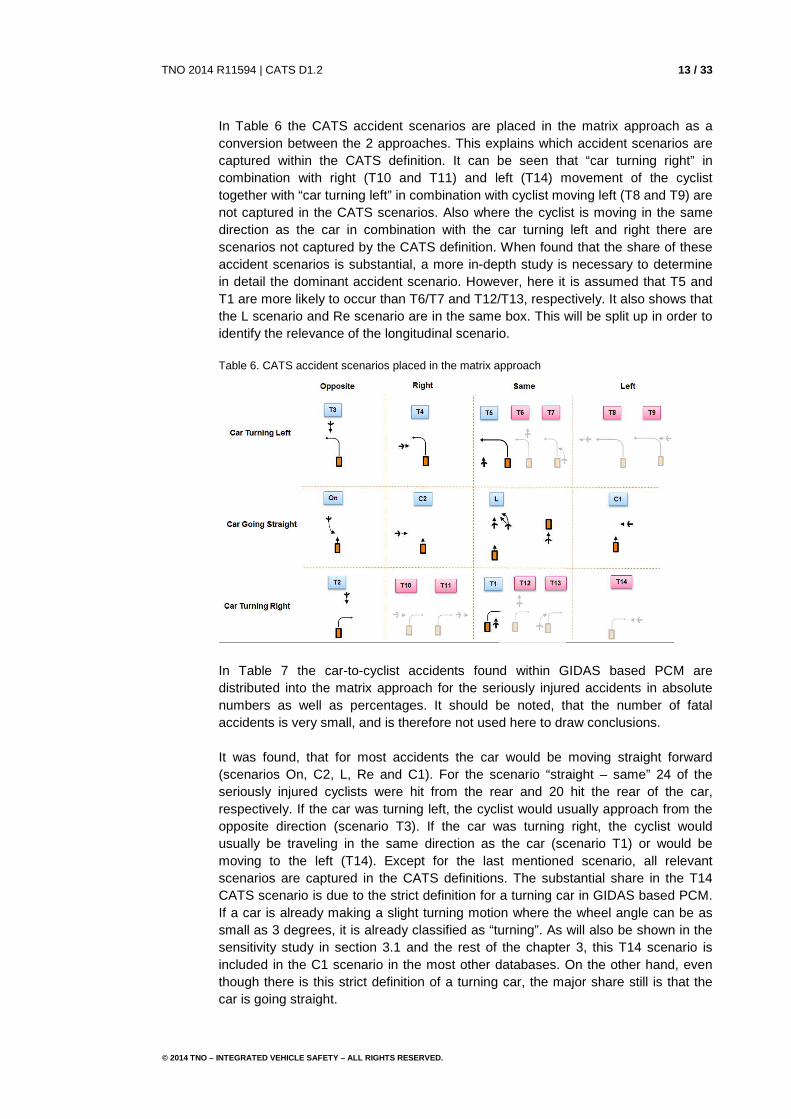
In Table 6 the CATS accident scenarios are placed in the matrix approach as a conversion between the 2 approaches. This explains which accident scenarios are captured within the CATS definition. It can be seen that “car turning right” in combination with right (T10 and T11) and left (T14) movement of the cyclist together with “car turning left” in combination with cyclist moving left (T8 and T9) are not captured in the CATS scenarios. Also where the cyclist is moving in the same direction as the car in combination with the car turning left and right there are scenarios not captured by the CATS definition. When found that the share of these accident scenarios is substantial, a more in-depth study is necessary to determine in detail the dominant accident scenario. However, here it is assumed that T5 and T1 are more likely to occur than T6/T7 and T12/T13, respectively. It also shows that the L scenario and Re scenario are in the same box. This will be split up in order to identify the relevance of the longitudinal scenario.
Table 6. CATS accident scenarios placed in the matrix approach
In Table 7 the car-to-cyclist accidents found within GIDAS based PCM are distributed into the matrix approach for the seriously injured accidents in absolute numbers as well as percentages. It should be noted, that the number of fatal accidents is very small, and is therefore not used here to draw conclusions. It was found, that for most accidents the car would be moving straight forward (scenarios On, C2, L, Re and C1). For the scenario “straight – same” 24 of the seriously injured cyclists were hit from the rear and 20 hit the rear of the car, respectively. If the car was turning left, the cyclist would usually approach from the opposite direction (scenario T3). If the car was turning right, the cyclist would usually be traveling in the same direction as the car (scenario T1) or would be moving to the left (T14). Except for the last mentioned scenario, all relevant scenarios are captured in the CATS definitions. The substantial share in the T14 CATS scenario is due to the strict definition for a turning car in GIDAS based PCM. If a car is already making a slight turning motion where the wheel angle can be as small as 3 degrees, it is already classified as “turning”. As will also be shown in the sensitivity study in section 3.1 and the rest of the chapter 3, this T14 scenario is included in the C1 scenario in the most other databases. On the other hand, even though there is this strict definition of a turning car, the major share still is that the car is going straight.
This chapter outlines the results of the collected accident data in combination with the CATS accident scenarios as described in the previous chapter. First the German sensitivity study will be shown followed by the all countries in the next section.
3.1 Sensitivity study on German data
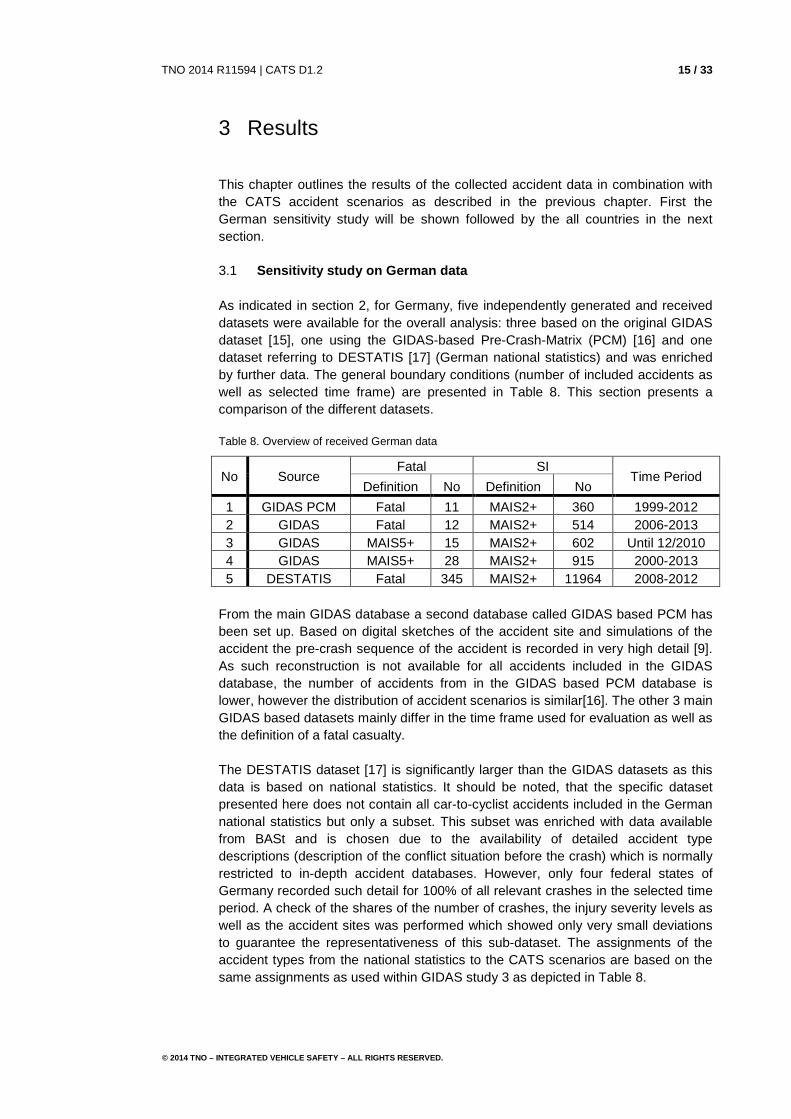
As indicated in section 2, for Germany, five independently generated and received datasets were available for the overall analysis: three based on the original GIDAS dataset [15], one using the GIDAS-based Pre-Crash-Matrix (PCM) [16] and one dataset referring to DESTATIS [17] (German national statistics) and was enriched by further data. The general boundary conditions (number of included accidents as well as selected time frame) are presented in Table 8. This section presents a comparison of the different datasets.
From the main GIDAS database a second database called GIDAS based PCM has been set up. Based on digital sketches of the accident site and simulations of the accident the pre-crash sequence of the accident is recorded in very high detail [9]. As such reconstruction is not available for all accidents included in the GIDAS database, the number of accidents from in the GIDAS based PCM database is lower, however the distribution of accident scenarios is similar[16]. The other 3 main GIDAS based datasets mainly differ in the time frame used for evaluation as well as the definition of a fatal casualty. The DESTATIS dataset [17] is significantly larger than the GIDAS datasets as this data is based on national statistics. It should be noted, that the specific dataset presented here does not contain all car-to-cyclist accidents included in the German national statistics but only a subset. This subset was enriched with data available from BASt and is chosen due to the availability of detailed accident type descriptions (description of the conflict situation before the crash) which is normally restricted to in-depth accident databases. However, only four federal states of Germany recorded such detail for 100% of all relevant crashes in the selected time period. A check of the shares of the number of crashes, the injury severity levels as well as the accident sites was performed which showed only very small deviations to guarantee the representativeness of this sub-dataset. The assignments of the accident types from the national statistics to the CATS scenarios are based on the same assignments as used within GIDAS study 3 as depicted in Table 8.
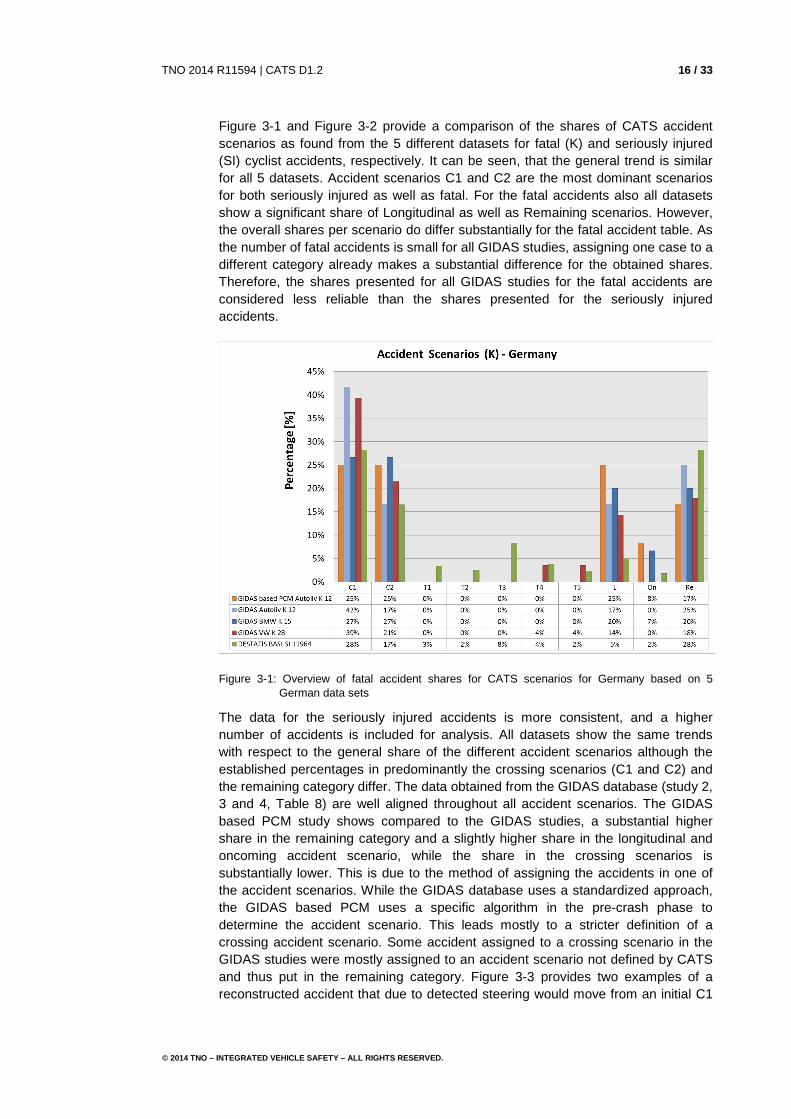
Figure 3-1 and Figure 3-2 provide a comparison of the shares of CATS accident scenarios as found from the 5 different datasets for fatal (K) and seriously injured (SI) cyclist accidents, respectively. It can be seen, that the general trend is similar for all 5 datasets. Accident scenarios C1 and C2 are the most dominant scenarios for both seriously injured as well as fatal. For the fatal accidents also all datasets show a significant share of Longitudinal as well as Remaining scenarios. However, the overall shares per scenario do differ substantially for the fatal accident table. As the number of fatal accidents is small for all GIDAS studies, assigning one case to a different category already makes a substantial difference for the obtained shares. Therefore, the shares presented for all GIDAS studies for the fatal accidents are considered less reliable than the shares presented for the seriously injured accidents.
Figure 3-1: Overview of fatal accident shares for CATS scenarios for Germany based on 5 German data sets
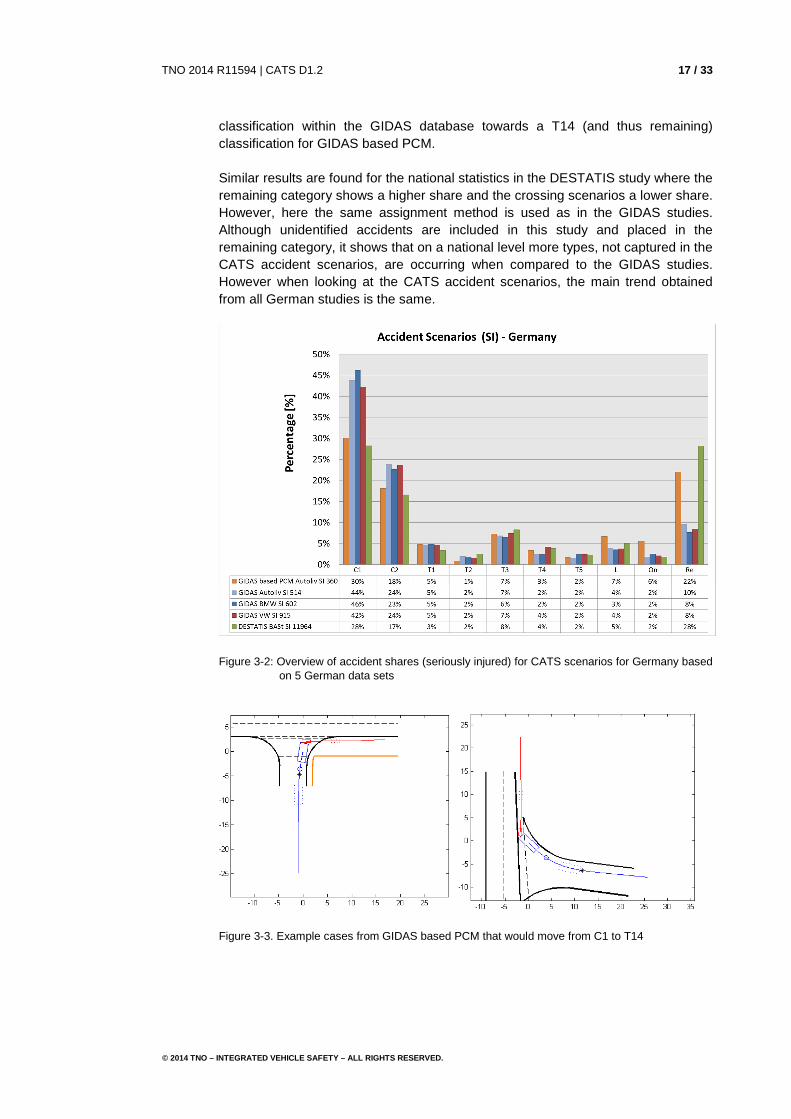
The data for the seriously injured accidents is more consistent, and a higher number of accidents is included for analysis. All datasets show the same trends with respect to the general share of the different accident scenarios although the established percentages in predominantly the crossing scenarios (C1 and C2) and the remaining category differ. The data obtained from the GIDAS database (study 2, 3 and 4, Table 8) are well aligned throughout all accident scenarios. The GIDAS based PCM study shows compared to the GIDAS studies, a substantial higher share in the remaining category and a slightly higher share in the longitudinal and oncoming accident scenario, while the share in the crossing scenarios is substantially lower. This is due to the method of assigning the accidents in one of the accident scenarios. While the GIDAS database uses a standardized approach, the GIDAS based PCM uses a specific algorithm in the pre-crash phase to determine the accident scenario. This leads mostly to a stricter definition of a crossing accident scenario. Some accident assigned to a crossing scenario in the GIDAS studies were mostly assigned to an accident scenario not defined by CATS and thus put in the remaining category. Figure 3-3 provides two examples of a reconstructed accident that due to detected steering would move from an initial C1
classification within the GIDAS database towards a T14 (and thus remaining) classification for GIDAS based PCM. Similar results are found for the national statistics in the DESTATIS study where the remaining category shows a higher share and the crossing scenarios a lower share. However, here the same assignment method is used as in the GIDAS studies. Although unidentified accidents are included in this study and placed in the remaining category, it shows that on a national level more types, not captured in the CATS accident scenarios, are occurring when compared to the GIDAS studies. However when looking at the CATS accident scenarios, the main trend obtained from all German studies is the same.
Figure 3-2: Overview of accident shares (seriously injured) for CATS scenarios for Germany based on 5 German data sets
Figure 3-3. Example cases from GIDAS based PCM that would move from C1 to T14
Although the method behind the classification in the GIDAS-based PCM and DESTATIS studies are different, it can be concluded based on the CATS accident scenario definition, that the GIDAS-based PCM data is much closer to the enriched German national statistics. Additionally, more detailed information that will be needed for the test scenario definition within work package 2, is available from GIDAS-based PCM compared to the DESTATIS data. Therefore, GIDAS-based PCM data is used in the following as dataset representative for Germany when comparing different EU countries.
3.2 Compiled results
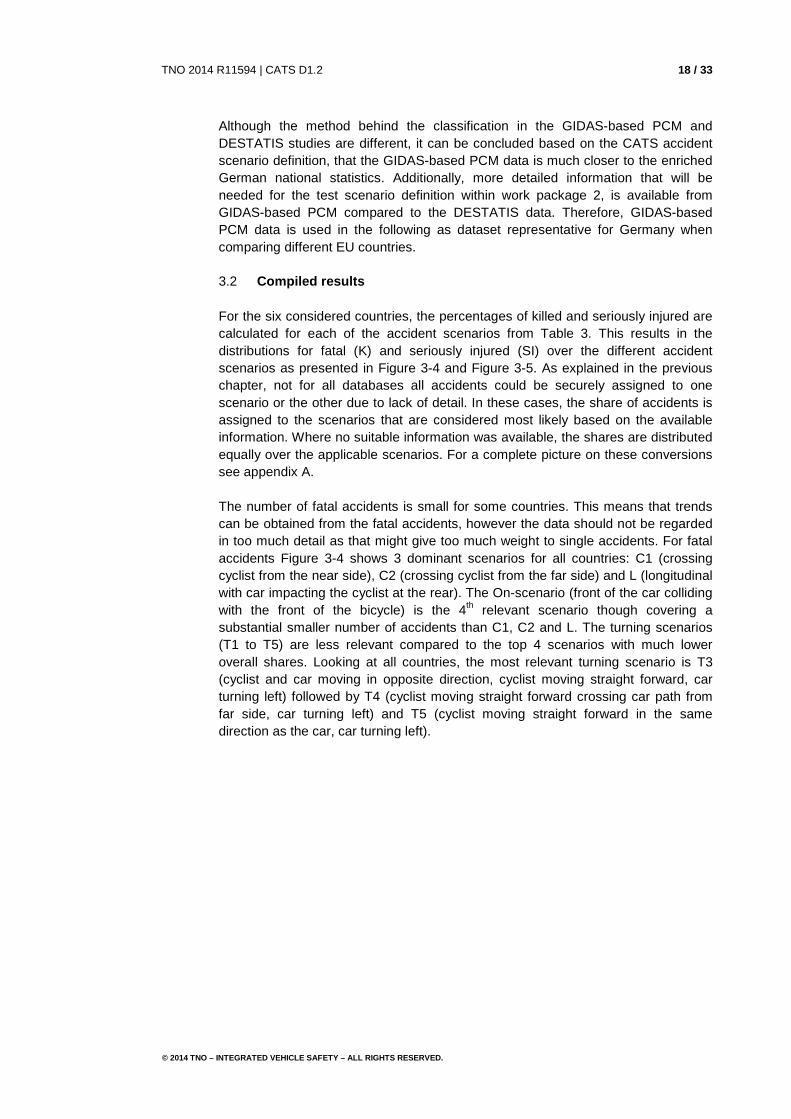
For the six considered countries, the percentages of killed and seriously injured are calculated for each of the accident scenarios from Table 3. This results in the distributions for fatal (K) and seriously injured (SI) over the different accident scenarios as presented in Figure 3-4 and Figure 3-5. As explained in the previous chapter, not for all databases all accidents could be securely assigned to one scenario or the other due to lack of detail. In these cases, the share of accidents is assigned to the scenarios that are considered most likely based on the available information. Where no suitable information was available, the shares are distributed equally over the applicable scenarios. For a complete picture on these conversions see appendix A. The number of fatal accidents is small for some countries. This means that trends can be obtained from the fatal accidents, however the data should not be regarded in too much detail as that might give too much weight to single accidents. For fatal accidents Figure 3-4 shows 3 dominant scenarios for all countries: C1 (crossing cyclist from the near side), C2 (crossing cyclist from the far side) and L (longitudinal with car impacting the cyclist at the rear). The On-scenario (front of the car colliding with the front of the bicycle) is the 4th relevant scenario though covering a substantial smaller number of accidents than C1, C2 and L. The turning scenarios (T1 to T5) are less relevant compared to the top 4 scenarios with much lower overall shares. Looking at all countries, the most relevant turning scenario is T3 (cyclist and car moving in opposite direction, cyclist moving straight forward, car turning left) followed by T4 (cyclist moving straight forward crossing car path from far side, car turning left) and T5 (cyclist moving straight forward in the same direction as the car, car turning left).
Figure 3-4. Distribution of fatally injured over the 9 main accident scenarios that are distinguished for 6 EU countries.
The top-3 of accident scenarios for fatalities hardly deviate between countries. Only for Italy and France On is more frequent than C2. For all other countries C1, C2 and L form the most important accident scenarios, though not always necessarily in that order. For France, Italy as well as the UK a considerable higher fraction of fatalities is found for the longitudinal scenario L, compared to the crossing scenarios C1 and C2. It should be noted though, that the data from France only cover a period of one year and hence the number of fatalities is relatively small. Although the time period for Italy is larger, the number of fatalities included in this dataset is even smaller. The share of L accidents is smallest (also in comparison to C1 and C2) for the Netherlands. Covering 14 years and over 900 fatalities in total, this is expected to be significant. A possible explanation could be in the wide application of separated bike lanes, especially along rural roads in the Netherlands. Herewith the cyclists and motorized vehicles are physically separated, which leads to less possible points of contact in longitudinal traffic and hence in less chances for a longitudinal accident with both vehicles traveling into the same direction to happen. In general, due to the high speed difference on rural roads, an L-type collision will more easily result in fatal injuries for the cyclist. This not only leads to a small percentage for L in the Netherlands, but also to relatively higher values for C1 and C2. Another interesting finding is that in the Netherlands the C2 scenario (bicycle crossing from far side) scores higher than the C1 scenario (bicycle crossing from near-side). This is furthermore only found for Sweden, though to a lesser extent. This can be explained by the fact that the parameters describing the accident scenario in the Dutch BRON database are rather limited and do not allow distinguishing between the movement of the cyclist and the car. Hence, for many crossing scenarios in BRON, no distinction is made between near side or far side scenarios. Consequently, 50% of those crossing scenarios were allocated to C1 and the other 50% to C2. Other scenarios are clearly indicated as far side, making the fraction of C2 larger than the share of C1.
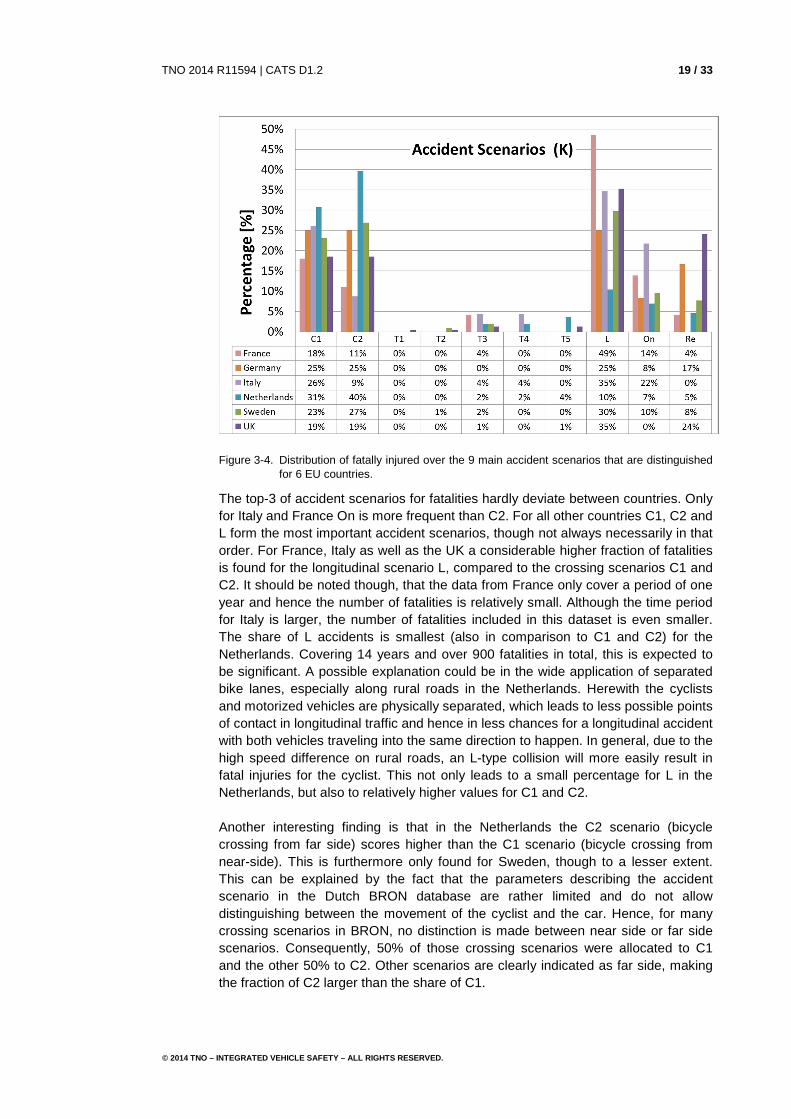
Figure 3-5. Distribution of seriously injured over the 9 main accident scenarios that are distinguished for 6 EU countries.
The distribution for accidents leading to seriously injured cyclists deviates slightly from that for fatalities. Most clearly seen is the strong decrease in the percentage allocated to the L scenario Only for Italy this scenario is still of major importance. Although still present amongst the dominant accidents, it cannot easily be distinguished from On, except for Italy and the UK. It should be noted however that the number of cases that were included from Italy in this study is very limited (only 17 seriously injured). For the UK, information is based on what was provided for the AsPeCSS project [14]. From this report, the number of On accidents could not be distinguished. However, there is a significant number of cyclists in the UK that is being hit from the front and the share of “other accidents” in the Re group is high. It therefore stands to reason, that at least part of the accidents classified as Re should be assigned to the On accident scenario. For selection and prioritization of car-to-cyclist accident scenarios to be translated towards test scenarios, information as shown in Figure 3-4 and Figure 3-5 is not well suited, as it provides individual country scores per scenario. It is desired to provide a single percentage per accident scenario. This is done by averaging all data sources with equal weighting first.
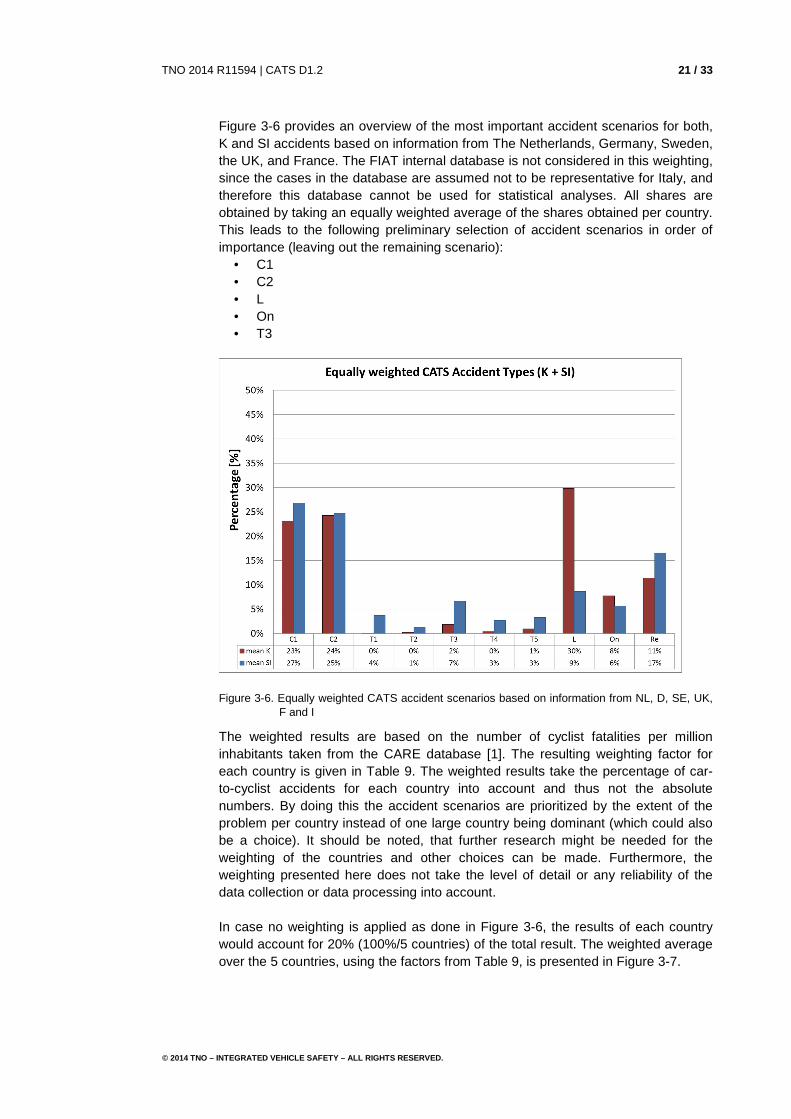
Figure 3-6 provides an overview of the most important accident scenarios for both, K and SI accidents based on information from The Netherlands, Germany, Sweden, the UK, and France. The FIAT internal database is not considered in this weighting, since the cases in the database are assumed not to be representative for Italy, and therefore this database cannot be used for statistical analyses. All shares are obtained by taking an equally weighted average of the shares obtained per country. This leads to the following preliminary selection of accident scenarios in order of importance (leaving out the remaining scenario):
• C1 • C2 • L • On • T3
Figure 3-6. Equally weighted CATS accident scenarios based on information from NL, D, SE, UK, F and I
The weighted results are based on the number of cyclist fatalities per million inhabitants taken from the CARE database [1]. The resulting weighting factor for each country is given in Table 9. The weighted results take the percentage of car-to-cyclist accidents for each country into account and thus not the absolute numbers. By doing this the accident scenarios are prioritized by the extent of the problem per country instead of one large country being dominant (which could also be a choice). It should be noted, that further research might be needed for the weighting of the countries and other choices can be made. Furthermore, the weighting presented here does not take the level of detail or any reliability of the data collection or data processing into account. In case no weighting is applied as done in Figure 3-6, the results of each country would account for 20% (100%/5 countries) of the total result. The weighted average over the 5 countries, using the factors from Table 9, is presented in Figure 3-7.
Table 9. Weighting factors based on the ratio of cyclist fatalities and the total number of country inhabitants in 2001-2010
Country
# fatalities per
million inhabitants
# cyclist fatalities per
million inhabitants
Weighting factor [%]
Equally weighted
France 62 2,8 11% 20% Germany 45 6,0 26% 20% Netherlands 32 9,2 38% 20% Sweden 28 3,6 15% 20% UK 30 2,3 10% 20% Italy 68 5,4 -
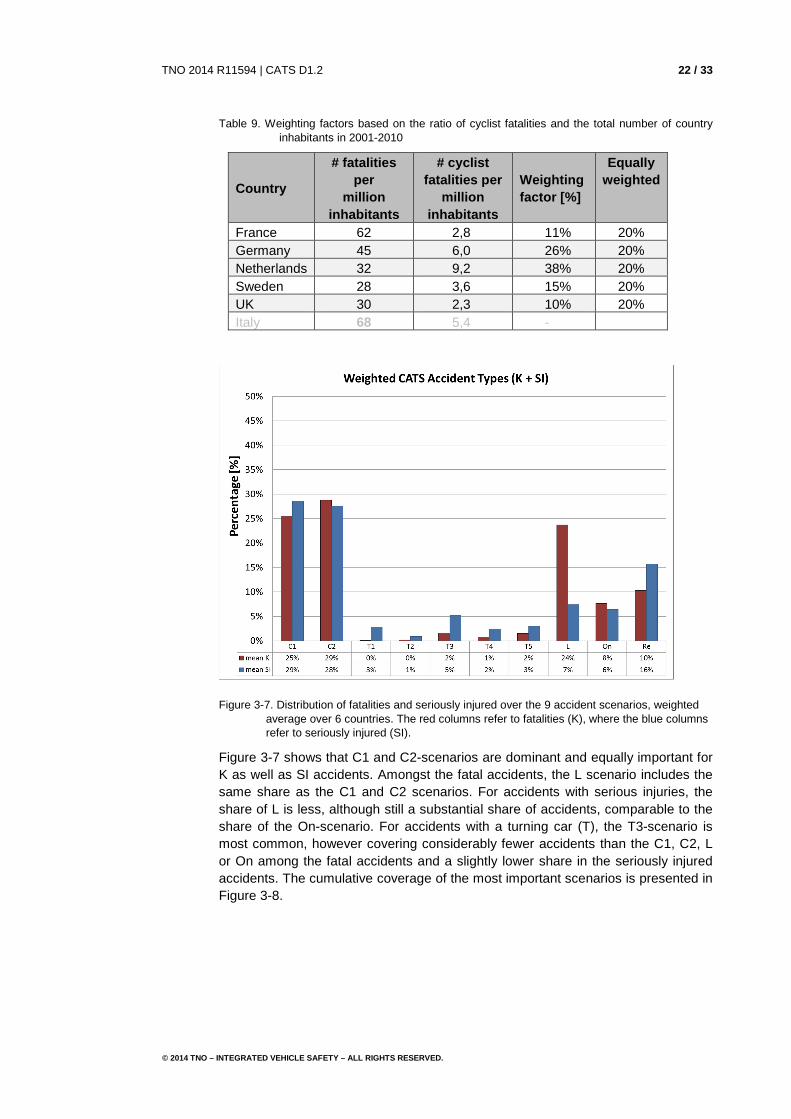
Figure 3-7. Distribution of fatalities and seriously injured over the 9 accident scenarios, weighted average over 6 countries. The red columns refer to fatalities (K), where the blue columns refer to seriously injured (SI).
Figure 3-7 shows that C1 and C2-scenarios are dominant and equally important for K as well as SI accidents. Amongst the fatal accidents, the L scenario includes the same share as the C1 and C2 scenarios. For accidents with serious injuries, the share of L is less, although still a substantial share of accidents, comparable to the share of the On-scenario. For accidents with a turning car (T), the T3-scenario is most common, however covering considerably fewer accidents than the C1, C2, L or On among the fatal accidents and a slightly lower share in the seriously injured accidents. The cumulative coverage of the most important scenarios is presented in Figure 3-8.
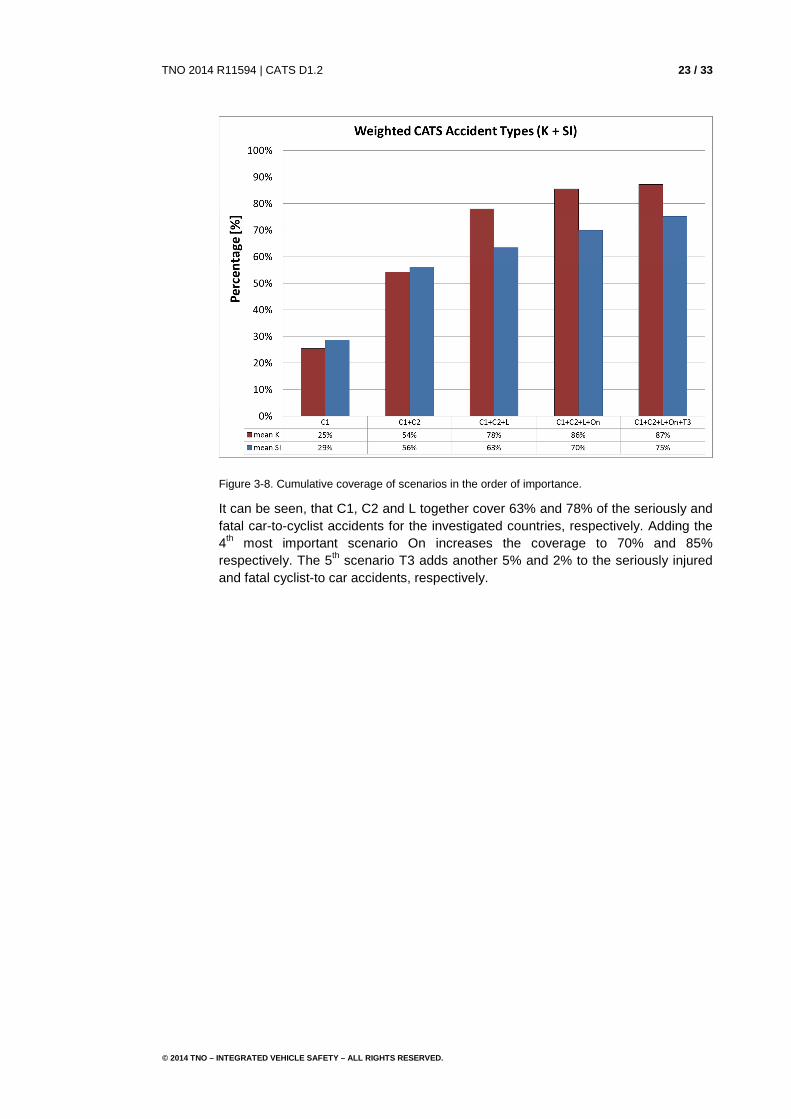
Figure 3-8. Cumulative coverage of scenarios in the order of importance.
It can be seen, that C1, C2 and L together cover 63% and 78% of the seriously and fatal car-to-cyclist accidents for the investigated countries, respectively. Adding the 4th most important scenario On increases the coverage to 70% and 85% respectively. The 5th scenario T3 adds another 5% and 2% to the seriously injured and fatal cyclist-to car accidents, respectively.
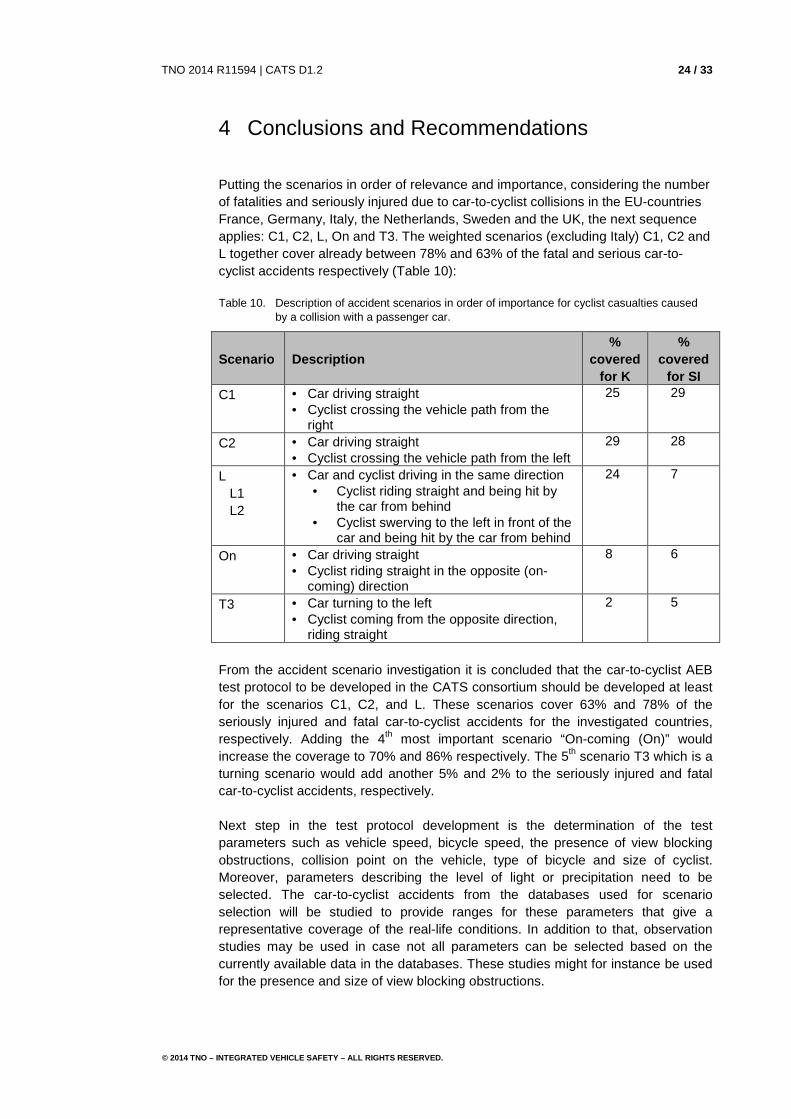
Putting the scenarios in order of relevance and importance, considering the number of fatalities and seriously injured due to car-to-cyclist collisions in the EU-countries France, Germany, Italy, the Netherlands, Sweden and the UK, the next sequence applies: C1, C2, L, On and T3. The weighted scenarios (excluding Italy) C1, C2 and L together cover already between 78% and 63% of the fatal and serious car-to-cyclist accidents respectively (Table 10):
Table 10. Description of accident scenarios in order of importance for cyclist casualties caused by a collision with a passenger car.
Scenario Description %
covered for K
% covered
for SI C1 • Car driving straight
• Cyclist crossing the vehicle path from the right
25 29
C2 • Car driving straight • Cyclist crossing the vehicle path from the left
29 28
L L1 L2
• Car and cyclist driving in the same direction • Cyclist riding straight and being hit by
the car from behind • Cyclist swerving to the left in front of the
car and being hit by the car from behind
24 7
On • Car driving straight • Cyclist riding straight in the opposite (on-
coming) direction
8 6
T3 • Car turning to the left • Cyclist coming from the opposite direction,
riding straight
2 5
From the accident scenario investigation it is concluded that the car-to-cyclist AEB test protocol to be developed in the CATS consortium should be developed at least for the scenarios C1, C2, and L. These scenarios cover 63% and 78% of the seriously injured and fatal car-to-cyclist accidents for the investigated countries, respectively. Adding the 4th most important scenario “On-coming (On)” would increase the coverage to 70% and 86% respectively. The 5th scenario T3 which is a turning scenario would add another 5% and 2% to the seriously injured and fatal car-to-cyclist accidents, respectively. Next step in the test protocol development is the determination of the test parameters such as vehicle speed, bicycle speed, the presence of view blocking obstructions, collision point on the vehicle, type of bicycle and size of cyclist. Moreover, parameters describing the level of light or precipitation need to be selected. The car-to-cyclist accidents from the databases used for scenario selection will be studied to provide ranges for these parameters that give a representative coverage of the real-life conditions. In addition to that, observation studies may be used in case not all parameters can be selected based on the currently available data in the databases. These studies might for instance be used for the presence and size of view blocking obstructions.
[1] CARE community road accident database that comprises detailed data on individual accidents as collected by the EU Member States: http://ec.europa.eu/transport/road_safety/specialist/statistics/index_en.htm
[2] European Parliament, The promotion of cycling – note 2010, DG for Internal Policies, Policy Department B: Structural and Cohesion Policies, EU, April 2010
[3] European Commission, Road Safety Vademecum – road safety trends, statistics and challenges in the EU 2010-2013, DG for Mobility and Transport Unit C.4 – Road Safety, EU, March 2014.
[4] Euro NCAP. 2020 ROADMAP. 2014; Available from: http://www.euroncap.com/technical/technicalpapers.aspx
[5] http://icsc2013.blogspot.nl [6] Populer, M., Dupriez, B., Vertriest, M., Accidents de cyclistes en contexte
urbain ; Trois années (1998-2000) d’accidents corporels de cyclistes sur les voiries régionales de la Région de Bruxelles-Capitale, Ministère de la Région de Bruxelles-Capitale and Institut Belge pour la Securiete Routiere, 2003
[7] Léopold, F., Lesire, P., Chauvel, C., Phan, V., VOIESUR: French research project on global road safety, focus on child safety specificities, Protection of Children in Cars - 10th International Conference, Munich, Germany, December 2012
[8] AAAM International Injury Scaling Committee (IISC), Abbreviated Injury Scale, Association for the Advancement of Automotive Medicine, AAAM, P.O. Box 4176 Barrington, IL 60011, USA, 2005
[9] Schubert, A., Erbsmehl, C., Hannawald, L., Standardized pre-crash-scenarios in digital format on the basis of the VUFO simulation, Proceedings of the 5th International Conference on ESAR 2012, September 2013
[10] Caviasso, G., Amici, A., Becchio, E., Cornacchia, G., Vehicle Safety Sustainability: Global approach, lectures at AirBag2012, 11th International Symposium & Exhibition on Sophisticated Car Occupant Safety Systems, Karlsruhe, December 2012
[11] BRON: Netherlands national road crash register; police registered numbers of casualties, drivers and crashes: www.swov.nl
[12] Fundación MAPFRE Estudio Fundación MAPFRE-Ciclistas: Cascos y lesiones en la cabeza Fecha de publicación: November 2013.
[13] Fredriksson, R., Fredriksson, K., Strandroth, J., Pre-crash motion and conditions of bicar-to-cyclist crashes in Sweden, International Cycling Safety Conference, Göteborg, November 2014
[14] Rodarius, C., Kwakkernaat, M., Edwards, M, Benefit estimate based on previous studies for pre-crash bicyclist systems and recommendations for necessary changes to pedestrian test and assessment protocol, ASPECSS deliverable D1.5, SST.2011.RTD-1 GA No. 285106, June 2014
[15] GIDAS, the German In-Depth Accident Study (GIDAS), cooperation between BASt and the Automotive Research Association (FAT). Approximately 2,000 accidents involving personal injury are recorded in the area of Dresden and Hannover annually.
[16] Ranjbar, A., Active safety for car-to-bicyclist accidents, Master Thesis, Chalmers University of Technology, December 2014
[17] Study performed by BASt, M. Wisch, using DESTATIS (Statistisches Bundesamt, database of police registered road traffic accidents) enriched by data from BASt, 9 october 2014
[18] Reurings, M., Vlakveld, W., Twisk, D., Dijkstra, A., Wijnen, W., Van fietsongeval naar maatregelen: kennis en hiaten - inventarisatie ten behoeve van nationale onderzoeksagenda fietsveiligheid, SWOV report R-2012-8, Leidschendam, 2012
[19] Wisch, M., Seiniger, P., Pastor, C., Edwards, M., Visvikis, C., Reeves, C. TRL, Scenarios and weighting factors for pre‐crash assessment of integrated pedestrian safety systems, ASPECSS deliverable D1.1, SST.2011.RTD-1 GA No. 285106, February 2013
LAB France provided the data according to the scenarios Table 3. Although a distinction was made in e.g. C1 for a regular intersection and C1 for a roundabout, in the total results such distinction is no longer made. The used table and its results in the CATS accident scenarios can be seen below.
Table 11. Data received from LAB on the accident scenario of car-to-cyclist accidents in 2011
A.2 Germany
In the GIDAS database, the scenarios are coded with a 3-digit code. In a conversion table the different scenarios are related to the CATS scenarios in Table 3. This conversion table can be seen in Table 12. The same approach is chosen for the enriched DESTATIS data. For the GIDAS based PCM data, the accidents are sorted based on trajectories of both, the car as well as the cyclist. As further explained in section 3.1, this could for some cases lead to a different classification of the accident compared to the UTYP classification form GIDAS.
Table 12. Conversion table between the GIDAS (and DESTATIS) 3-digit coding and the CATS scenarios.
A.3 Italy
Each of the 40 cases in the FIAT internal database was studied separately. From a description of the movement of cyclist and car, one of the CATS scenarios was selected. The table below shows the conversion from this description to the CATS scenarios (where in most of the cases a GIDAS 3-digit code was chosen as an intermediate step).
Table 13. Conversion table between the descriptive accidents and the CATS scenarios
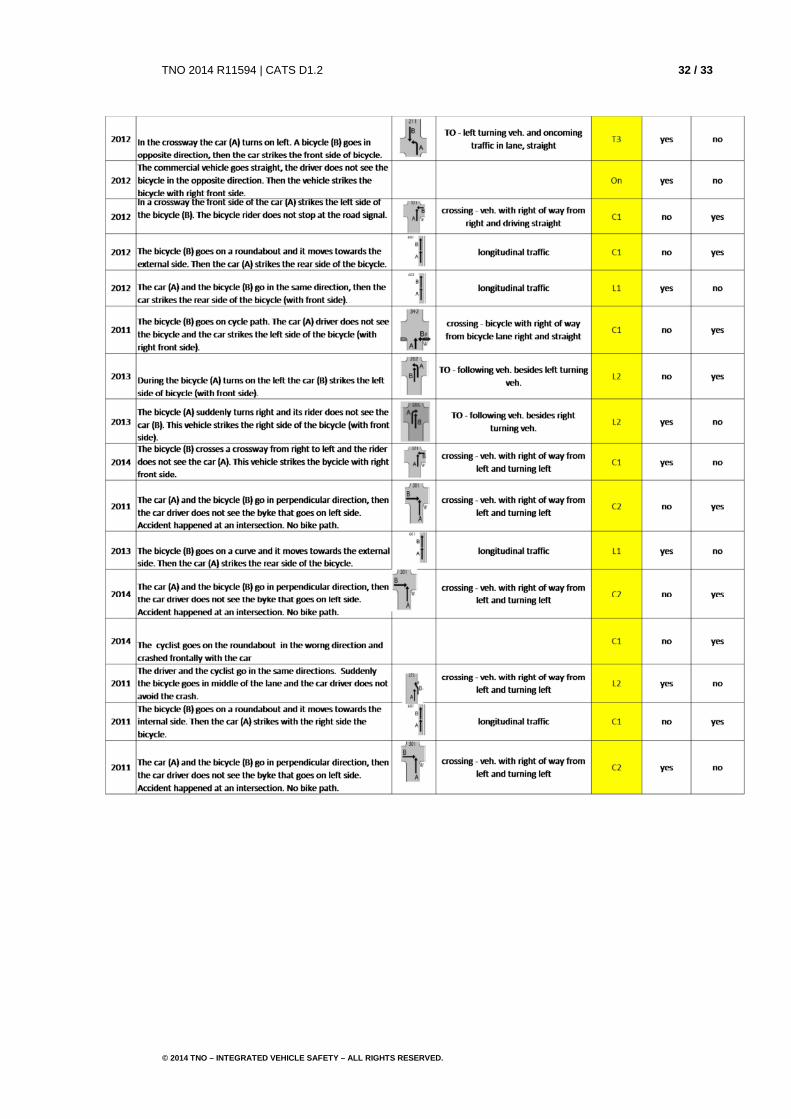
In the BRON database, each case is related to a manoeuvre. By selecting car-to-cyclist fatalities (and similar for seriously injured), the number of cases per manoeuvre is given, and the resulting list is sorted upon the percentage of cases covered by the manoeuvre. Only those manoeuvres are considered that at least cover 2% of the cases. In the tables below the conversion is given for fatalities and seriously injured for these most relevant manoeuvres. When an impact is defined this is assumed to be on the cyclist.
Table 14. Conversion table between the descriptive accidents and the CATS scenarios for fatal accidents
Manoeuvre # fatalities CATS scenarios Distribution proposed
Side impact on crossing 327 C1/C2 evenly Other side impact 190 C1/C2 evenly Left side impact with turn to the left 92 C1/L2/T3/T4/T5 evenly Right side impact with crossing vehicle 85 C2 Rear end collision without turning 75 L1/L2 evenly Frontal without lane change 63 On Right side impact with turn to the left 29 C2/T5 evenly Parked vehicle hit at the front 20 Re Grazing 21 Re
Table 15. Conversion table between the descriptive accidents and the CATS scenarios for seriously injured accidents
Manoeuvre # fatalities CATS scenarios Distribution proposed
Side impact on crossing 3568 C1/C2 evenly Other side impact 2852 C1/C2 evenly Frontal without lane change 989 On Left side impact with turn to the left 846 C1/L2/T3/T4/T5 evenly Right side impact with crossing vehicle 644 C2 Not of the road 418 Re Rear end collision without turning 414 L1 / L2 evenly Parked vehicle hit at the front 413 Re Other with parked vehicle 363 Re Right side impact with turn to the left 348 C2/T5 evenly
A.5 Sweden
Data are used the study of Fredriksson et al which uses data from the Swedish Transport Administration fatal database STA and the Swedish Traffic Accident Data Acquisition STRADA [12]. A.6 United Kingdom
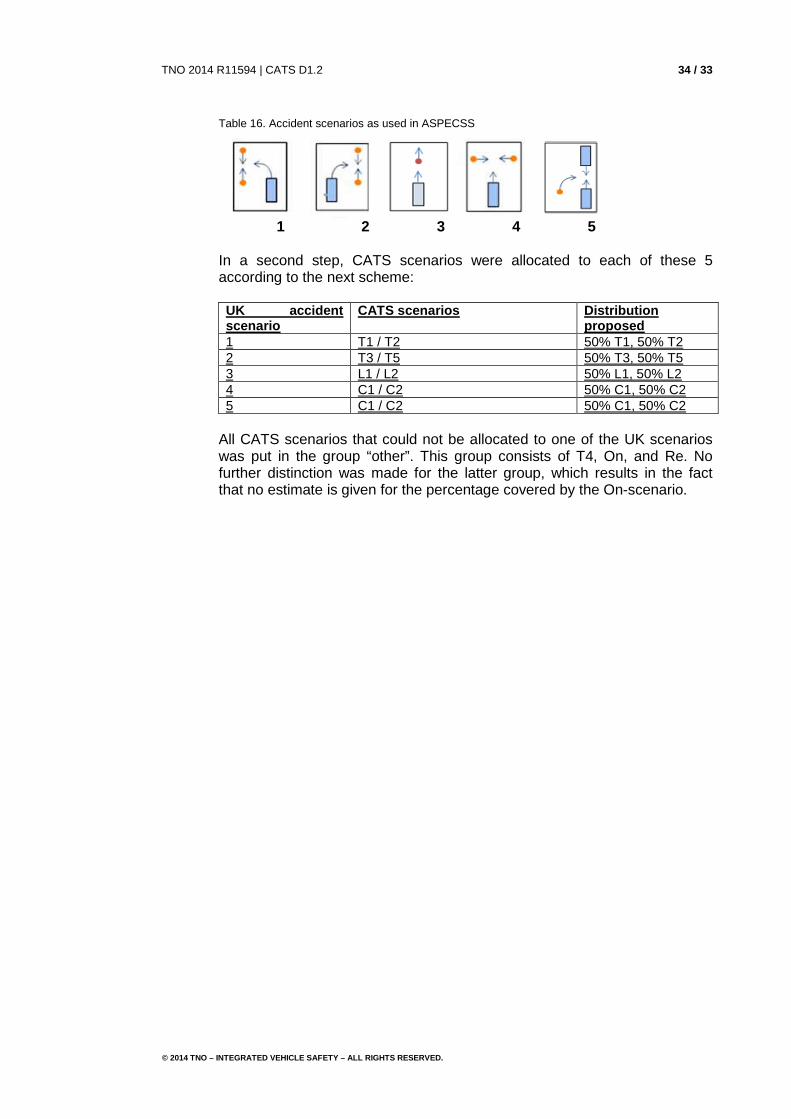
Data from the UK were distinguished in 5 accident scenarios according to [14]:
All CATS scenarios that could not be allocated to one of the UK scenarios was put in the group “other”. This group consists of T4, On, and Re. No further distinction was made for the latter group, which results in the fact that no estimate is given for the percentage covered by the On-scenario.