23
CAUCASUS INSURANCE MARKET AIIF 2012 Chingiz Mekhtiyev 1
| Date post: | 02-Jan-2016 |
| Category: |
Documents |
| Upload: | ada-jennings |
| View: | 213 times |
| Download: | 0 times |
1
CAUCASUS INSURANCE MARKET
AIIF 2012
Chingiz Mekhtiyev

2
CAUCASUS REGION

3
General InformationAzerbaijan Georgia Armenia
Independence 18 October 1991 31 March 1991 21 September 1991
Official Language: Azerbaijanian Georgian Armenian
Area 86.6 ths. sq. km. 69.7 ths. sq. km. 29.7 ths. sq. km.
Population 9,2 million 4,5 million 3,3 million
Capital Baku Tbilisi Yerevan
Currency Manat Lari Dram
Source: The State Statistical Committee of the Republic of Azerbaijan, National Statistics Office of Georgia, Statistical Service of Republic of Armenia

4
Macroeconomic figures (in USD)
Source: Azerbaijan Export and Import Promotion Foundation, www.indexmundi.com, World Bank, Central banks of respective countries
2011 Azerbaijan Georgia Armenia
GDP 63.4 bln 14.4 bln 10.2 bln
GDP per capita 7,003 3,215 3,022
Inflation (as of 2010) 5.1 % 5.7 % 6.9 %
Unemployment rate 7.6 % 15.1 % 6.2 %
Poverty level 5.4 % 9.2 % 35.8% (2010 statistics)
Average monthly salary
460 412 299

5
GDP in South Coucasus (bln USD)
2005 2006 2007 2008 2009 2010 20110.0
10.0
20.0
30.0
40.0
50.0
60.0
70.0
13.2
21.0
33.1
48.944.3
52.9
63.4
6.4 7.810.2
12.8 10.8 11.614.4
4.9 6.49.2
11.78.6 9.4 10.2
Azerbaijan Georgia Armenia
The State Statistical Committee of the Republic of Azerbaijan, World Bank

6
GDP Share in South Caucasus (%)
2005 2006 2007 2008 2009 2010 2011 -
10.0
20.0
30.0
40.0
50.0
60.0
70.0
80.0
53.9 59.7
63.0 66.6
69.5 71.6 72.0
26.1 22.2
19.4 17.4 17.0 15.7 16.4 20.0 18.2 17.5 15.9
13.5 12.7 11.6
Azerbaijan Georgia Armenia
The State Statistical Committee of the Republic of Azerbaijan, World Bank

7
GDP per Capita (in USD)
2006 2007 2008 2009 2010 20110
1000
2000
3000
4000
5000
6000
7000
8000
-40.00%
-20.00%
0.00%
20.00%
40.00%
60.00%
80.00%
2471
3841
56034874
5631
7003
17642315
2921
24552623
3215
2,267
3,2053,592
2,5582,953
3,022
Azerbaijan Georgia ArmeniaAzerbaijan dynamics Georgia dynamics Armenia dynamics
The State Statistical Committee of the Republic of Azerbaijan, World Bank

8
Country ratings
Azerbaijan Georgia Armenia
Rating BBB- B+ BB-
Outlook Positive Stable Stable
Azerbaijan Georgia Armenia
Rating BBB- BB- Not rated
Outlook Positive Stable -
Fitch Rating
Standard&Poors Rating
Moody’s Investors Service
Azerbaijan Georgia Armenia
Rating Baa3 Ba3 Ba2
Outlook Stable Stable Negative

9
Country ratings
Rating Azerbaijan Georgia Armenia
World 55 88 92
CIS countries 1 5 6
WEF Global Competitiveness Report 2011
Rating Azerbaijan Georgia Armenia
UNDP Human Development report
67 74 76
Human Development Report 2010
10
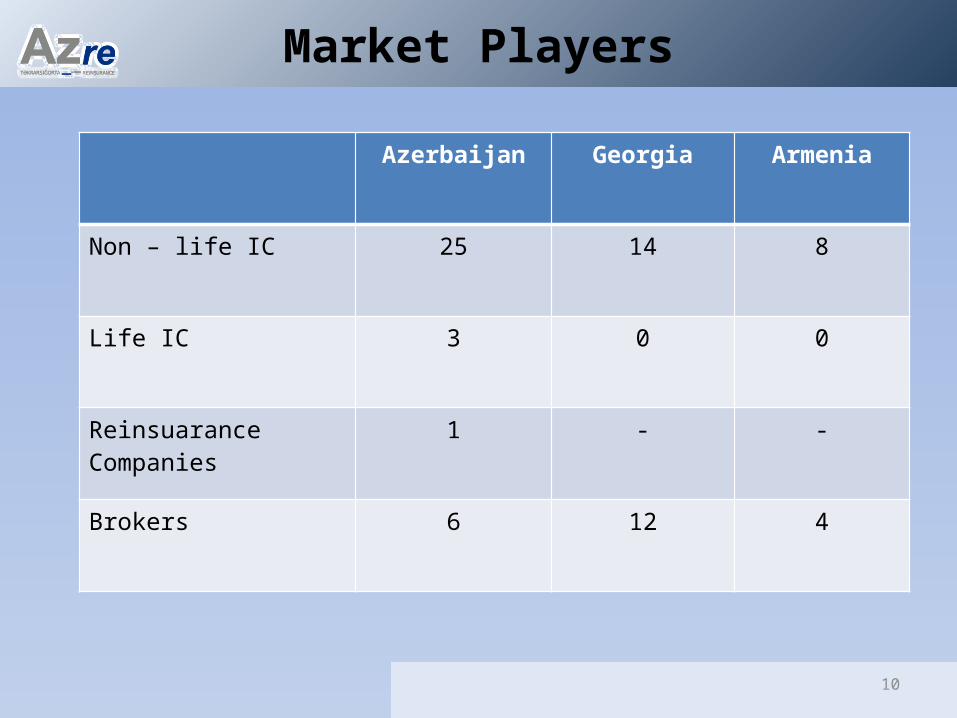
Market Players
Azerbaijan Georgia Armenia
Non – life IC 25 14 8
Life IC 3 0 0
Reinsuarance Companies 1 - -
Brokers 6 12 4

11
2008 2009 2010 20110.00
100.00
200.00
300.00
400.00
500.00
600.00
700.00
316.44340.99
427.61
581.90
150.2196.6
254.6300.1
81.64
Azerbaijan Georgia Armenia
Total Assets of Insurance companies (mln. USD)
Source: Ministry of Finance of Azerbaijan Republic, National Bank of Georgia, Central bank of Armenia

12
2008 2009 2010 20110.00
50.00
100.00
150.00
200.00
250.00
300.00
350.00
103.24133.25
187.71
321.84
18.8 24.8 25.841.9 30.94
Azerbaijan Georgia Armenia
72%
Paid-up capital (mln USD)
62%
Source: Ministry of Finance of Azerbaijan Republic, National Bank of Georgia, Central bank of Armenia
13
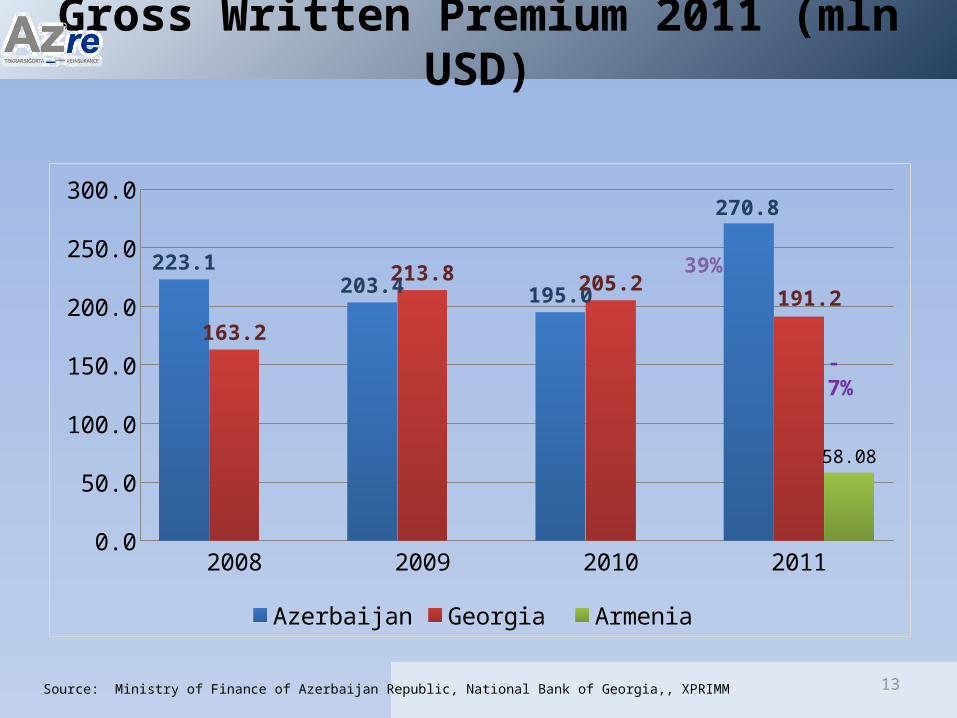
Gross Written Premium 2011 (mln USD)
2008 2009 2010 20110.0
50.0
100.0
150.0
200.0
250.0
300.0
223.1203.4 195.0
270.8
163.2
213.8 205.2191.2
58.08
Azerbaijan Georgia Armenia
39%
- 7%
Source: Ministry of Finance of Azerbaijan Republic, National Bank of Georgia,, XPRIMM
14
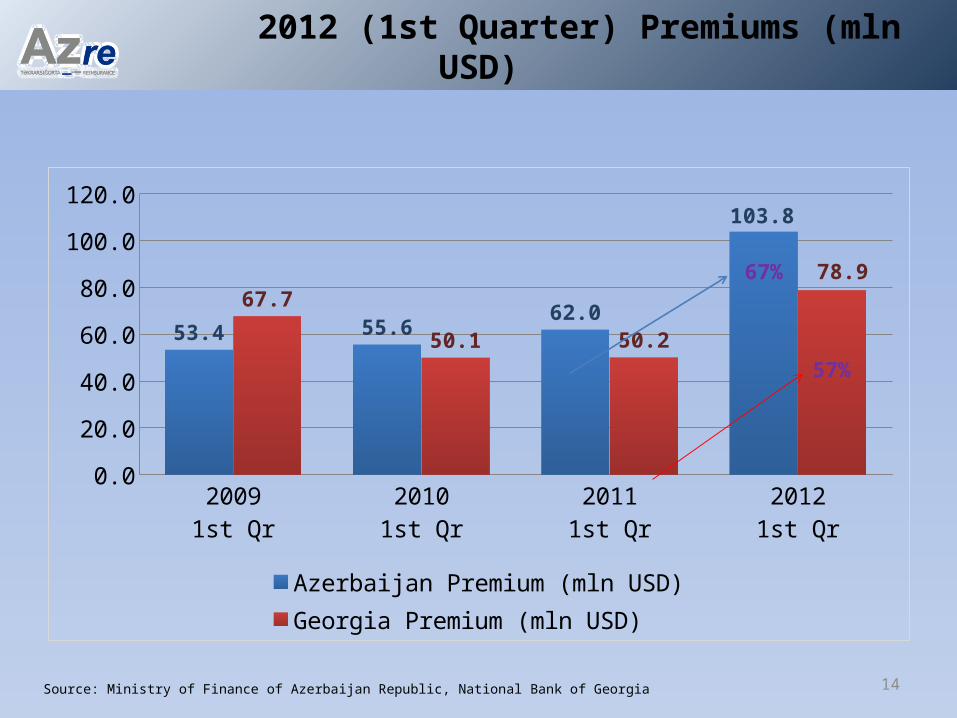
2012 (1st Quarter) Premiums (mln USD)
20091st Qr
20101st Qr
20111st Qr
20121st Qr
0.0
20.0
40.0
60.0
80.0
100.0
120.0
53.4 55.662.0
103.8
67.7
50.1 50.2
78.9
Azerbaijan Premium (mln USD) Georgia Premium (mln USD)
Source: Ministry of Finance of Azerbaijan Republic, National Bank of Georgia
67%
57%

15
Azerbaijan Georgia Armenia0
5
10
15
20
25
30
35
40
45
0.00%
0.20%
0.40%
0.60%
0.80%
1.00%
1.20%
1.40%
29.32
42.49
18.150.43%
1.33%
0.57%
GWP per Capita (USD)
GWP / GDP %
GWP per capita and GWP to GDP

16
GWP in Caucasus 2011 (mln USD)
52%37%
11%
Azerbaijan
Georgia
Armenia
Azer
baija
n
Geo
rgia
Arm
enia
0.0
50.0
100.0
150.0
200.0
250.0
300.0
89%
95%
100%
11%
5%
LifeNon-Life

17
Loss ratio (2011)
Medical
Motor Casco
Personal Accident
Property
Liability
0% 20% 40% 60% 80% 100% 120%
96%
50%
32%
29%
13%
87%
47%
16%
6%
2%
70%
63%
9%
9%
19%
Armenia
Georgia
Azerbaijan
Source: XPRIMM, Ministry of Finance of Azerbaijan Republic

18
GWP Structure(2011)
66.44%9.61%
6.84%
6.64%
ArmeniaMTPL (com-ry)
Property
Motor Hull
Health
CARGO
GTPL
Financial risks
Travel
Accidents
Other
21.1%
17.2%
24.4%
14.0%
6.0%
6.6%
7.3%
3.4%
Motor insurancePersonal (medical + PA)Compulsory insurancesProperty insuranceCargoLiability Aviation hullOthers
Azerbaijan
62.46%
12.42%
8.65%
5.10%
GeorgiaHealthPropertyMotor HullLifeAviation*SuretyshipGTPLMTPLCARGOTravelAccidentsOther
Source: XPRIMM, Ministry of Finance of Azerbaijan Republic

19
Summary
GDP 72% Azerbaijan
Assets 60% Azerbaijan
Capital 82% Azerbaijan
GWP 52% Azerbaijan

20
Weaknesses
• Very young market
• Bad history of former USSR insurance system
• Narrow spectrum of services
• Lack of modern sales technology
• Lack of sophisticated IT platforms
• Lack of corporate governance
• Territory geographically is prone to CAT risks / Lack of CAT cover
• Price sensitive market
• Low self retention (capacity) of Insurers
• Political instability in the region
21
Strength
• New market with big growth opportunity
• Well educated professionals speaking at least 3 languages
• Big energy and infrastructure projects
• Adoption of compulsory insurance laws
• Tax discounts for life insurance
• No VAT applied for insurance services
• Good loss ratio
• Gradual increase of capitalization
• Update of legislative acts
22
Challenges and Opportunities
• Low market penetration
• Huge growth potential
• Investment in Internet sales
• Investment in information recourses
• Investment in skilful management
• Investment in core systems
• Development of predictive modeling and advance analytics
• Anticipate regulatory changes
• Working on reshaping products and services and distribution channels

23
THANK YOU !!!


