Causes and Consequences of EarningsManipulation: An Analysis of Firms Subject to
Enforcement Actions by the SEC*
PATRICIA M. DECHOW University of Pennsylvania
RICHARD G. SLOAN University of Pennsylvania
AMY P. SWEENEY Harvard University
Abstract. This study investigates firms subject to accounting enforcement actions by theSecurities and Exchange Commission for alleged violations of Generally AcceptedAccounting Principles. We investigate: (i) the extent to which the alleged earningsmanipulations can be explained by extant eamings management hypotheses; (ii) the rela-tion between eamings manipulations and weaknesses in firms' internal govemance struc-tures? and (iii) the capital market consequences experienced by firms when the allegedeamings manipulations are made public. We find that an important motivation for eam-ings manipulation is the desire to attract external financing at low cost. We show that thismotivation remains significant after controlling for contracting motives proposed in theacademic literature. We also find that firms manipulating eamings are: (i) more likely tohave boards of directors dominated by management; (ii) more likely to have a ChiefExecutive Officer who simultaneously serves as Chairman of the Board; (iii) more likelyto have a Chief Executive Officer who is also the firm's founder, (iv) less likely to havean audit committee; and (v) less likely to have an outside blockholder. Finally, we docu-ment that firms manipulating eamings experience significant increases in their costs ofcapital when the manipulations are made public.
Resume. Les auteurs analysent les entreprises assujetties aux mesures d'ex6cution prisespar la Securities and Exchange Commission dans les cas de pr6somption de transgressiondes principes comptables g^neralement reconnus. Us s'interessent aux aspects suivants dela question: i) la mesure dans laquelle les pr^somptions de manipulations des beneficespeuvent etre expliquees par les hypotheses existantes de gestion des b6n6fices; ii) la
• Accepted by John Wild. This paper was presented at the 1995 CAR Conference, generouslysupported by Alberta's Chartered Accountants through the Accounting EducationFoundation of Alberta, the Canadian Institute of Chartered Accountants, the Ernst &Young Foundation, the CGA Canada Research Foundation, the Peat Marwick ThomeEducational Foundation, the Society of Management Accountants of Canada, and theUniversity of Alberta. We thank Jim Jiambalvo and two anonymous referees for their sugges-tions. We also thank workshop participants at University of British Columbia, ColumbiaUniversity, the Financial Decision and Control Conference at the Harvard Business School,Hong-Kong Institute of Science and Technology, University of Maryland, Ohio State,University of Pennsylvania, University of Washington, Seattle, University of Wisconsin -Madison, Southern Methodist University, Vanderbilt University, the American AccountingAssociation Meetings and the tenth annual Contemporary Accounting Research Conference forvaluable comments. Any enx)is are our own We gratefully acknowledge funding by theDivision of Research, Harvard Business School and a Faculty Research Grant from the •University of Pennsylvania. We thank Brian Ear for diligent research assistance, I/B/E/SIntemational Inc. for analyst forecast data and Paul Asquith and Lisa Meulbroek for providingus with short interest data.
relation entre les manipulations de benefices et les faiblesses des structures de regieinteme des entreprises; et iii) la reaction du marche financier k l'endroit des entrepdsesau sujet desquelles les pr^somptions de manipulation des bendfices sont renduespubliques. Les auteurs constatent qu'un incitatif majeur k la manipulation des b^n f̂icesest le d6sir d'obtenir du financement exteme k moindre cout. Ils demontrent que cet inci-tatif demeure important meme aprfes le controle des motifs contractuels que mettent del'avant les travaux theoriques. Ils constatent egalement que les entreprises qui manipulentles benefices sont: i) davantage susceptibles d'avoir des conseils d'administrationdomin6s par la direction; ii) davantage susceptibles d'avoir un chef de Ia direction quijoue simultan6ment le role de president du conseii; iii) davantage susceptibles d'avoir unchef de la direction qui est 6galement le fondateur de l'entrepdse; iv) moins susceptiblesd'avoir un comit6 de verification; et v) moins susceptibles d'avoir un bloc de titresdetenus par un actionnaire exterieur. Enfln, les auteurs t̂ablissent le fait que le cout ducapital, pour les entreprises qui manipulent les benefices, enregistre des hausses apprdcia-bles lorsque ces manipulations sont rendues publiques.
This study investigates the motives for, and consequences of, eamings manipu-lation in a sample of firms subject to accounting enforcement actions by theSecurities and Exchange Commission (SEC).' These firms are alleged to haveviolated generally accepted accounting principles (GAAP) by overstating theirreported eamings. We examine the ability of several previously suggested moti-vations for earnings manipulation to explain the behavior of this sample. Wealso test whether the incidence of earnings manipulation in this sample is sys-tematically related to weaknesses in the firms' governance structures. Finally,we document the capital market consequences experienced by these firms afterallegations of eamings manipulation are made.
Our research relies on the assumption that the SEC has (on average) correct-ly identified firms that intentionally overstate reported earnings. We believe thisassumption is reasonable, since the SEC goes to great lengths to establish thatearnings are manipulated knowingly and intentionally before taking an enforce-ment action.^ Moreover, we verify that the firm-years investigated by the SECdisplay managed earnings using constructs developed in the academic literature.For example, these firms employ more income-increasing accounting proce-dures, have higher total accruals, and have higher estimated discretionary accru-als. In fact, because our sample is subject to SEC enforcement actions, it isalmost certainly biased toward the inclusion of the more obvious and spectacularcases of eamings manipulation. While this increases the power of our tests, italso potentially limits the generalizability of our results to more subtle cases ofearnings manipulation, such as earnings management within the bounds ofGAAP. Nevertheless, the sample provides a unique opportunity to assess boththe relative importance of various hypotheses for earnings manipulation and thetrade-offs involved in the earnings manipulation decision. Our results also pro-vide testable implications for future research investigating more subtle cases ofeamings management.
Our empirical analysis indicates that one important motivation for earningsmanipulation is the desire to attract external financing at low cost. While thismotivation for earnings manipulation is regularly cited by practitioners and in
Causes and Consequences of Eamings Manipulation 3
the financial press, it has received relatively little attention in the academic liter-ature. We find that this motivation is important even after controlling for con-tracting motives frequently discussed and tested in the academic literature.
Our analysis of governance structures indicates that the likelihood of earn-ings manipulation is systematically related to weaknesses in the oversight ofmanagement. For example, we find that our sample of earnings manipulators areless likely to have an audit committee, more likely to have a company founderas CEO, more likely to have a CEO who also serves as the Chairman of theBoard, more likely to have a board of directors dominated by insiders, and lesslikely to have an external blockholder monitoring management.
Finally, we find that the capital market imposes substantial costs on firmsrevealed to be eamings manipulators. Consistent with Feroz, Park and Pastena(1991), we find an average stock price drop of approximately nine percent at theinitial announcement of the alleged earnings manipulation. We also find thatidentification as an earnings manipulator is associated with an increase in thebid-ask spread, a drop in analyst following, an increase in short interest, and anincrease in the dispersion of analysts' earnings forecasts. These findings are con-sistent with investors revising downward their beliefs about both the firms'future economic prospects and the credibility of the firms' financial disclosures.Thus, our results suggest that while unidentified eamings manipulators enjoylower costs of capital, identification as an earnings manipulator is associatedwith substantial increases in the cost of capital.
The remainder of the paper is organized as follows. The next section moti-vates our empirical analysis. The third section discusses the SEC sample anddescribes our research design. The empirical results are presented in the fourthsection. In the final section, we discuss our conclusions and implications forfuture research.
Motivation and hypothesesThis section develops the framework for our empirical analysis. First, we identi-fy the motivations for earnings manipulation that have received widespreadattention in the extant academic research and the practitioner oriented literature.Second, we identify characteristics associated with weak govemance structures,with particular emphasis on the oversight of fmancial disclosure decisions.Finally, we generate predictions conceming the costs and consequences experi-enced by firms revealed to be earnings manipulators.
Motivations for eamings manipulationThere is a large body of academic literature examining motivations for eamingsmanagement. While there is no clear consensus in the literature on a definitionof eamings management, the term is generally restricted to reporting practicesthat are within the bounds of GAAP.' This study examines eamings manipula-tion, which we define to be both within and outside the bounds of GAAP. Sinceearnings manipulation outside of GAAP entails potential legal costs that can beavoided through earnings manipulation within GAAP, we expect that firms
4 Contemporary Accounting Research
resorting to manipulation outside of GAAP will also be managing eamings with-in GAAP. Thus, the academic literature on motivations for earnings manage-ment provides a potential source of motivations for eamings manipulation.
A vast number of motivations for earnings management have been proposedin the academic literature. Since it is not feasible to consider all proposed moti-vations, we confine our analysis to those that have been most extensively exam-ined. Academic research has focused on various contracting theories of eamingsmanipulation, of which the 'bonus hypothesis' and the 'debt hypothesis' havereceived the most support (see. Watts and Zimmerman 1990). For example,Christie (1990) reexamines this research and concludes that variables relating tomanagerial compensation and debt contracts achieve the highest overall statisti-cal significance in explaining accounting procedural choice. Thus, we examinethe ability of the bonus hypothesis and the debt hypothesis to explain eamingsmanipul3tion in the SEC sample.
In contrast to academic researchers, practitioners emphasize the role ofaccounting information in investment and lending decisions by stockholders andcreditors as a major motivation for earnings manipulation. For example, Kelloggand Kellogg (1991) state that the first two reasons for fraud, misrepresentation,and manipulation in financial statements are:
1. To encourage investors to buy an interest in a company's stock as owners, or inbonds as creditors; and
2. To increase the value of the stock of present shareholders of the company.Similarly, the National Association of Certified Fraud Examiners (1993)
states that the first reason why financial statement manipulation is committed is"to encourage investment through the sale of stock."
Thus, practitioners argue that influencing investor perceptions of firm valueprovides a primary motivation for earnings manipulation. Management andexisting shareholders benefit from manipulating investors' perceptions of firmvalue if they can raise additional financing on more favorable terms or sell theirstockholdings for a higher price. Recent empirical evidence is mixed (Aharony,Lin, and Loeb 1993; Friedlan 1995; Teoh, Wong, and Rao 1994; and Rangan1995). We therefore consider external financing and insider sales of stock asadditional motivations for earnings manipulation.
Intemal govemance structuresInternal governance processes are established to maintain the credibility offirms' financial statements and safeguard against such behavior as earningsmanipulation. The sample of firms investigated in this study provides a uniqueopportunity to investigate whether firms that manipulate reported eamings aremore likely to have weak governance stmctures. In this section we identify char-acteristics of weak govemance structures suggested by the academic and practi-tioner literatures. These lead to predictions conceming the characteristics of thegovemance structures that facilitate eamings manipulation in the SEC sample.
Jensen (1993) argues that boards of directors are ineffectual monitors whenthe board is too large, when the board's equity ownership is small, and when the
Causes and Consequences of Eamings Manipulation 5
CEO is also the Chairman of the Board. In addition, CEOs who are the companyfounders are likely to have greater influence over their firms' operations and beless accountable to the board of directors. A variety of studies also suggest thatthe composition of the board of directors determines its effectiveness. In particu-lar, boards composed largely of outsiders are more effective than boards withfew seats taken by outsiders (see, for example, Brickley and James 1987;Weisbach 1988; and Rosenstein and Wyatt 1990). Further, according to Jensen(1993) and Holthausen and Larcker (1993), an outside blockholder on the boardof directors plays a significant monitoring role. In support of this prediction,DeFond and Jiambalvo (1991) find that outside blockholders are less prevalentin 41 firms with accounting errors." In addition, DeFond and Jiambalvo find thatfirms with accounting errors are less likely to have audit committees.Practitioners, likewise suggest that audit committees play an important role inthe oversight of the financial reporting process:
In a corporate-govemance approach to financial reporting, audit committees areinvolved in oversight of the entire financial reporting process. Throughout the yearthey learn and inquire about significant matters affecting financial reporting—accounting principles, accounting estimates, information systems, intemal controls,and risks and uncertainties are some examples. (Audit Committees - A Pivotal Role,Deloitte & Touche LLP, 1994, p. 7).
Finally, the independence and quality of the outside auditor will affect thelikelihood that earnings manipulation is detected and precluded from the finan-cial statements. DeAngeio (1981) suggests that auditor independence is correlat-ed with firm size, while Palmrose (1988) suggests that the 'Big Eight' (now 'BigSix') audit firms are less frequently sued than other audit firms because they pro-vide higher quality audits. Thus, we hypothesize that the use of a Big Six auditorwill mitigate eamings manipulation.'
In summary, we predict that firms in the SEC sample are (i) more likely tohave large boards of directors that are dominated by insiders; (ii) less likely tohave outside directors with significant equity holdings; (iii) less likely to have anaudit committee; (iv) less likely to have an extemal blockholder; (v) more likelyto have a company founder as CEO; (vi) more likely to have a CEO who dou-bles as Chairman of the Board; and (vii) less likely to have a 'Big Six' auditor.
Consequences of revealed eamings manipulationOur sample consists of firms identified by the SEC as eamings manipulators.Once the eamings manipulation is detected, we expect these firms' costs of capi-tal to increase because investors revise downward (i) their estimates of firmvalue; and (ii) their beliefs conceming the credibility of the firms' financialreporting system and the reputation of management."*
When the eamings overstatements are made public, investors will estimatethe extent to which firm value has been overstated, and the stock price willdecline accordingly. Lower firm value implies that more of the firm must be'given away' to raise a fixed amount of capital. Thus, a lower share price direct-ly affects the cost of capital. Further, since the extent of manipulation is unlikelyto be known, there is greater uncertainty about firm value among investors.
6 Contemporary Accounting Research
Thus, informed traders have greater opportunities to profit at the market makers'expense.' This in turn, will cause market makers to widen bid-ask spreads inorder to compensate for the increased risk of losing to informed traders. Theresultant increase in the bid-ask spread raises the cost of capital (see, Amihudand Mendelson 1986).
We investigate whether there is more uncertainty and dispersion ininvestors' beliefs about firm value after earnings manipulations are made publicby examining whether there are increases in (i) short interests and (ii) the disper-sion of analysts' forecasts of earnings. Short sellers are more likely to beinformed traders who are benefiting at the market makers expense (see, Asquithand Meulbroek 1993). Moreover, less agreement among analysts about futureeamings is consistent with greater dispersion of beliefs about firm value.
To investigate whether the cost of capital increases for these firms, weexamine whether (i) stock prices decline, (ii) bid-ask spreads increase, and (iii)analyst following declines. We investigate analyst following because Merton(1987, 490) argues that the degree of "investor recognition" affects the cost ofcapital when all investors do not hold the market portfolio. Analyst following islikely to be correlated with the degree of investor recognition and the qualityand quantity of information available about the firm (e.g., Lang and Lundholm1993). Thus, demonstrating that the number of analysts following the SEC firmsdeclines, is consistent with these firms facing higher costs of capital.
Sample and variable definitionsThis section is composed of three subsections. The first section discusses theprocess leading to the publication of an SEC Accounting and AuditingEnforcement Release (AAER). The second section describes the sample compo-sition and summarizes the AAERs' allegations of earnings overstatements.Finally, the third section develops empirical proxies for the motivational andgovernance constructs.
Process leading to the publication of an AAERThe SEC takes enforcement actions against firms that it identifies as having vio-lated the financial reporting requirements of the Securities Exchange Act of 1934.Since April 1982, the SEC has published details of its enforcement actions in aseries of Accounting and Auditing Enforcement Releases.' Pincus, Holder, andMock (1988) report that the SEC obtains enforcement leads from several sources:(i) reviews of 1933 and 1934 Securities Acts filings; (ii) the market surveillanceprograms of the American and New York Stock Exchanges and the NationalAssociation of Securities Dealers; and (iii) public complaints, tips, referrals fromother law enforcement agencies, and the financial press. SEC staff from theDivision of Corporation Finance examine financial statements and otherSecurities Acts filings for violations of routine screening criteria and for suspi-cious subjective factors. If a case warrants further scrutiny, the agency initiates aninformal investigation and invites persons with relevant information to cooperateby providing documents and testimony. If the informal investigation reveals
Causes and Consequences of Eamings Manipulation 7
strong evidence of securities law violations, then the SEC may pursue a formalinvestigation. If the SEC informs the target of the formal investigation, then the1934 Act Release No. 5092 requires the firm to disclose this to shareholders.
Feroz et al. (1991) point out that since the SEC has more targets than it canpractically pursue, and since formal investigations are both costly and highlyvisible, the SEC ranks targets according to the probability of success. For exam-ple, the agency will not pursue cases where unforeseen circumstances result inunderstated loan loss provisions. The agency only pursues cases where it candemonstrate that management knew or should have known through better inter-nal controls, that the loan loss provisions were understated at the time the finan-cial statements were issued. Thus, it is reasonable to assume that firms facingenforcement actions by the SEC knowingly and intentionally engaged in eam-ings manipulation.
Sample selection and descriptionIn order to identify firms that manipulated eamings, we restrict our analysis toAAERs where actions are brought against firms pursuant to Section 13(a) of theSecurities Exchange Act of 1934. This section requires issuers whose securitiesare registered with the SEC, to file reports (including the quarterly financialstatements on form 10-Q and the annual financial statements on form 10-K) asrequired by the SEC's rules and regulations. The financial statements containedin these filings are required to comply with Regulation S-X, which in turnrequires conformity with GAAP.
The sample-selection procedure used to obtain firms for our empirical testsis summarized in Table 1. We begin with a total sample of 436 AAERs issuedbetween April 1982 and December 1992. We eliminate 165 AAERs whereactions are taken against auditors for violations of auditing standards rather thanviolations of GAAP (actions pursuant of section 2(e) rather than section 13 (a) ofthe Securities Act). The sample size is reduced by a further 70, reflecting caseswhere the SEC released multiple AAERs in connection with a specific instanceof alleged eamings manipulation. Another 76 releases (primarily smaller banks
TABLE ISample selection of 92 firms subject to enforcement actions by the SEC between 1982
and 1992 _ ^
Accounting and Auditing Enforcement Releasesissued between 1982 and 1992 436
less releases involving violation of auditing standards; 165
less multiple releases involving the same firms; 70
less firms not listed on COMPUSTAT; 76
less IPO firms; 29
less firms with no defined manipulation period 4
Final Sample 92
8 Contemporary Accounting Research
and financial institutions) are eliminated because they are not available onCOMPUSTAT. We also exclude 29 cases involving initial public offerings (IPOs).These cases involve misrepresentations in the prospectus of the IPO (rather thanform 10-Q or 10-K). We exclude IPOs because much of the data we need for ourempirical tests is unavailable.' Four flrms are eliminated because the manipula-tion period is not disclosed in the AAER. This results in a final sample of 92firms.
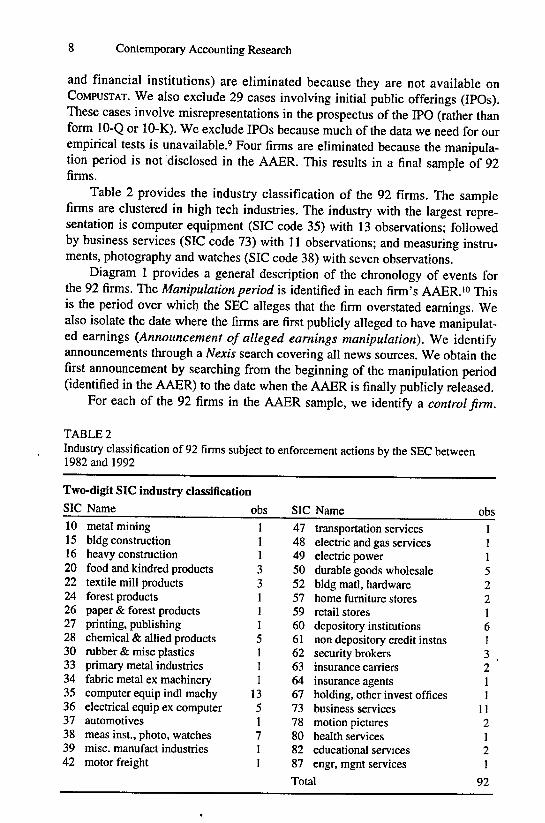
Table 2 provides the industry classification of the 92 firms. The samplefirms are clustered in high tech industries. The industry with the largest repre-sentation is computer equipment (SIC code 35) with 13 observations; followedby business services (SIC code 73) with 11 observations; and measuring instru-ments, photography and watches (SIC code 38) with seven observations.
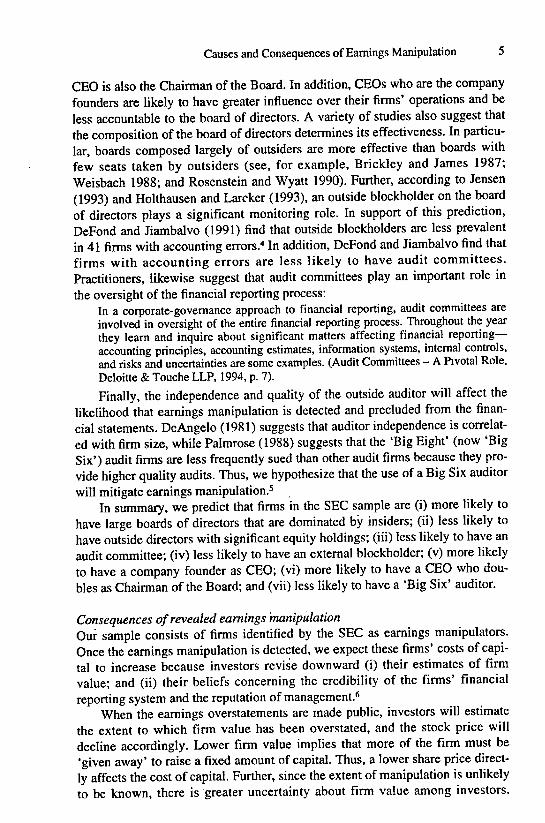
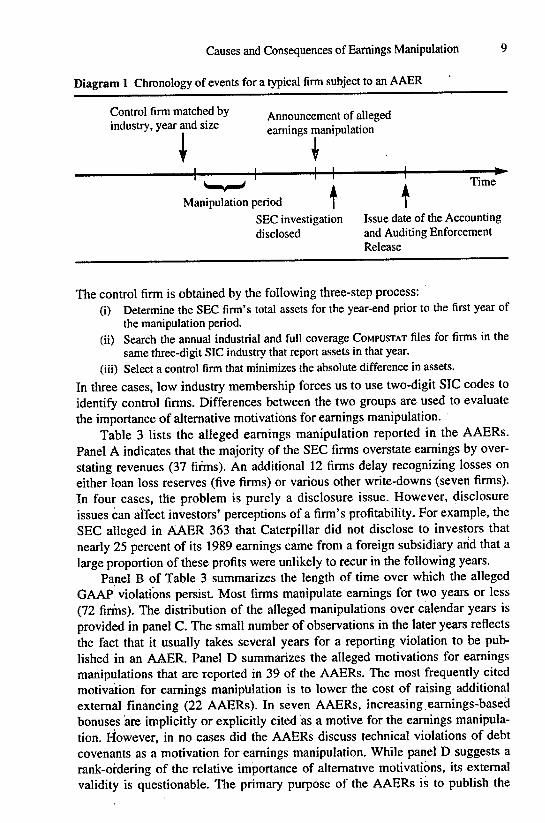
Diagram 1 provides a general description of the chronology of events forthe 92 firms. The Manipulation period is identified in each firm's AAER.'" Thisis the period over which the SEC alleges that the firm overstated earnings. Wealso isolate the date where the firms are first publicly alleged to have manipulat-ed earnings (Announcement of alleged eamings manipulation). We identifyannouncements through a Nexis search covering all news sources. We obtain thefirst announcement by searching from the beginning of the manipulation period(identified in the AAER) to the date when the AAER is finally publicly released.
For each of the 92 firms in the AAER sample, we identify a control firm.
TABLE 2Industry classification of 92 firms subject to enforcement actions by the SEC between1982 and 1992
Two-digit SIC industry classification
SIC Name
10 metal mining15 bldg construction16 heavy construction20 food and kindred products22 textile mill products24 forest products26 paper & forest products27 printing, publishing28 chemical & allied products30 rubber & misc plastics33 primary metal industries34 fabric metal ex machinery35 computer equip indl machy36 electrical equip ex computer37 automotives38 meas inst., photo, watches39 misc. manufact industries42 motor freight
obs111331115111
13517I1
SIC474849505257596061626364677378808287
. Nametransportation serviceselectric and gas serviceselectric powerdurable goods wholesalebldg matl, hardwarehome furniture storesretail storesdepository institutionsnon depository credit instnssecurity brokersinsurance carriersinsurance agentsholding, other invest officesbusiness servicesmotion pictureshealth serviceseducational servicesengr, mgnt services
Total
oh1115221613211
112121
92
Causes and Consequences of Eamings Manipulation
Diagram 1 Chronology of events for a typical firm subject to an AAER
Control firm matched by Announcement of alleged
industry, year and size ^^.^^^ manipulation
\
1 1Manipulation period | |
SEC investigation Issue date of the Accountingdisclosed and Auditing Enforcement
Release
The control firm is obtained by the following three-step process:(i) Determine the SEC firm's total assets for the year-end prior to the first year of
the manipulation period.(ii) Search the annual industrial and full coverage COMPUSTAT files for firms in the
same three-digit SIC industry that report assets in that year.(iii) Select a control firm that minimizes the absolute difference in assets.
In three cases, low industry membership forces us to use two-digit SIC codes toidentify control firms. Differences between the two groups are used to evaluatethe importance of altemative motivations for eamings manipulation.
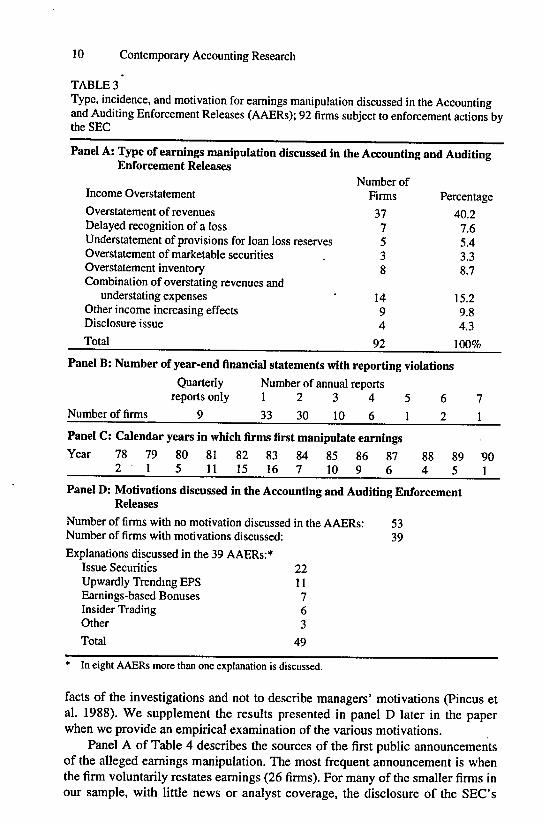
Table 3 lists the alleged earnings manipulation reported in the AAERs.Panel A indicates that the majority of the SEC firms overstate eamings by over-stating revenues (37 firms). An additional 12 firms delay recognizing losses oneither loan loss reserves (five firms) or various other write-downs (seven firms).In four cases, the problem is purely a disclosure issue. However, disclosureissues can affect investors' perceptions of a firm's profitability. For example, theSEC alleged in AAER 363 that Caterpillar did not disclose to investors thatnearly 25 percent of its 1989 earnings came firom a foreign subsidiary arid that alarge proportion of these profits were unlikely to recur in the following years.
Panel B of Table 3 summarizes the length of time over which the allegedGAAP violations persist. Most firms manipulate eamings for two years or less(72 firriis). The distribution of the alleged manipulations over calendar years isprovided in panel C. The small number of observations in the later years reflectsthe fact that it usually takes several years for a reporting violation to be pub-lished in an AAER. Panel D summarizes the alleged motivations for earningsmanipulations that are reported in 39 of the AAERs. The most frequently citedmotivation for eamings manipulation is to lower the cost of raising additionalextemal financing (22 AAERs). In seven AAERs, increasing earnings-basedbonuses are implicitly or explicitly cited as a motive for the eamings manipula-tion. However, in no cases did the AAERs discuss technical violations of debtcovenants as a motivation for eamings manipulation. While panel D suggests arank-ordering of the relative importance of altemative motivations, its extemalvalidity is questionable. The primary purpose of the AAERs is to publish the
10 Contemporary Accounting Research
TABLE 3Type, incidence, and motivation for eamings manipulation discussed in the Accountingand Auditing Enforcement Releases (AAERs); 92 firms subject to enforcement actions bythe SEC
Panel A: Type of earnings manipulation discussed in the Accounting and AuditingEnforcement Releases
Income Overstatement
Overstatement of revenuesDelayed recognition of a loss
Number ofFirms
377
Understatement of provisions for loan loss reserves 5Overstatement of marketable securitiesOverstatement inventoryCombination of overstating revenues and
understating expensesOther income increasing effectsDisclosure issue
Total
38
1494
92
Percentage
40.27.65.43.38.7
15.29.84.3
100%
Panel B: Number of year-end financial statements with reporting violations
Quarterly Number of annual reportsreports only 1 2 3 4 5 6 7
Number of firms 9 33 30 10 6 1 2 1
Panel C: Calendar years in which firms first manipulate earnings
Panel D: Motivations discussed in the Accounting and Auditing EnforcementReleases
Number of firms with no motivation discussed in the AAERs: 53Number of firms with motivations discussed: 39
Explanations discussed in the 39 AAERs:*Issue Securities 22Upwardly Trendmg EPS 11Earnings-based Bonuses 7Insider Trading 6Other 3
Total 49
* In eight AAERs more than one explanation is discussed.
facts of the investigations and not to describe managers' motivations (Pincus etal. 1988). We supplement the results presented in panel D later in the paperwhen we provide an empirical examination of the various motivations.
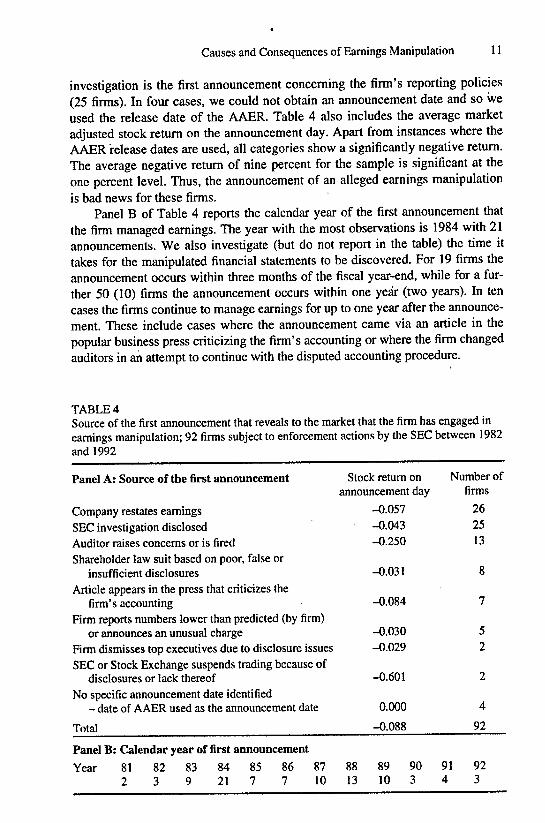
Panel A of Table 4 describes the sources of the first public announcementsof the alleged eamings manipulation. The most frequent announcement is whenthe firm voluntarily restates eamings (26 firms). For many of the smaller firms inour sample, with little news or analyst coverage, the disclosure of the SEC's
Causes and Consequences of Eamings Manipulation 11
investigation is the first announcement conceming the firm's reporting policies(25 firms). In four cases, we could not obtain an announcement date and so weused the release date of the AAER. Table 4 also includes the average marketadjusted stock retum on the announcement day. Apart from instances where theAAER release dates are used, all categories show a significantly negative retum.The average negative retum of nine percent for the sample is significant at theone percent level. Thus, the announcement of an alleged earnings manipulationis bad news for these firms.
Panel B of Table 4 reports the calendar year of the first announcement thatthe firm managed eamings. The year with the most observations is 1984 with 21announcements. We also investigate (but do not report in the table) the time ittakes for the manipulated financial statements to be discovered. For 19 firms theannouncement occurs within three months of the fiscal year-end, while for a fur-ther 50 (10) firms the announcement occurs within one year (two years). In tencases the firms continue to manage eamings for up to one year after the announce-ment. These include cases where the announcement came via an article in thepopular business press criticizing the firm's accounting or where the firm changedauditors in an attempt to continue with the disputed accounting procedure.
TABLE4Source of the first announcement that reveals to the market that the firm has engaged ineamings manipulation; 92 firms subject to enforcement actions by the SEC between 1982and 1992
Panel A: Source of the first announcement Stock retum on Number ofannouncement day firms
Company restates eamings -0.057 26SEC investigation disclosed -0.043 25Auditor raises concems or is fired -0.250 13Shareholder law suit based on poor, false or
insufficient disclosures -0.031 8Article appears in the press that criticizes the
or armounces an unusual charge -0.030 5Firm dismisses top executives due to disclosure issues -0.029 2SEC or Stock Exchange suspends trading because of
disclosures or lack thereof -0.601 2No specific announcement date identified
- date of AAER used as the announcement date 0.000 4Total -0.088 92Panel B: Calendar year of first announcementYear 81 82 83 84 85 86 87 88 89 90 91 92
2 3 9 21 7 7 10 13 10 3 4 3
12 Contemporary Accounting Research
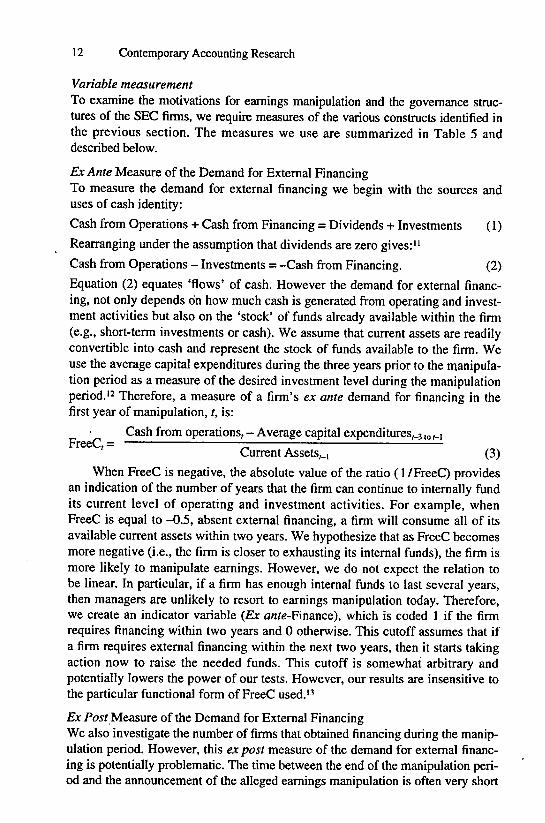
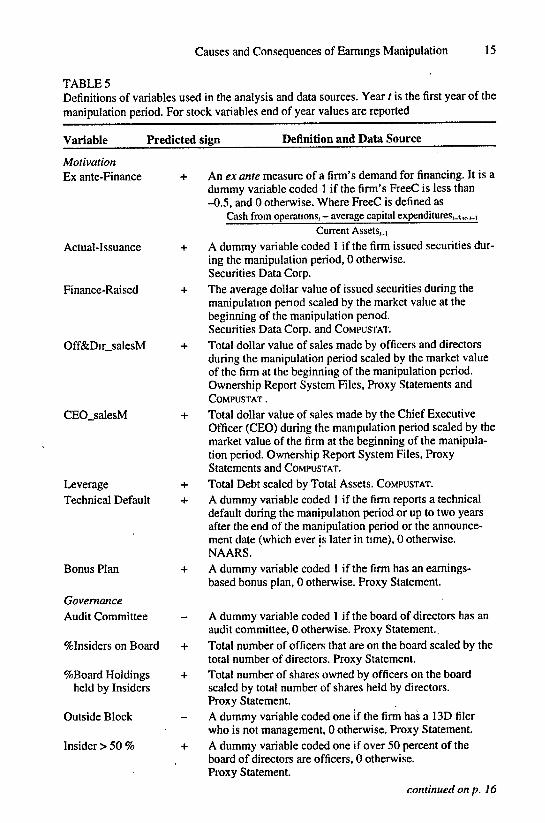
Variable measurementTo examine the motivations for eamings manipulation and the govemance struc-tures of the SEC firms, we require measures of the various constructs identified inthe previous section. The measures we use are summarized in Table 5 anddescribed below.
Ex Ante Measure of the Demand for Bxtemal FinancingTo measure the demand for extemal financing we begin with the sources and
uses of cash identity:
Cash from Operations + Cash from Financing = Dividends + Investments (1)
Rearranging under the assumption that dividends are zero gives:"
Cash from Operations - Investments = -Cash from Financing. (2)Equation (2) equates 'flows' of cash. However the demand for external financ-ing, not only depends on how much cash is generated from operating and invest-ment activities but also on the 'stock' of funds already available within the firm(e.g., short-term investments or cash). We assume that current assets are readilyconvertible into cash and represent the stock of funds available to the firm. Weuse the average capital expenditures during the three years prior to the manipula-tion period as a measure of the desired investment level during the manipulationperiod.'2 Therefore, a measure of a firm's ex ante demand for financing in thefirst year of manipulation, t, is:
Cash from operations, - Average capital expenditures,., ,„,_,FreeC, =
Current Assets,., (3)When FreeC is negative, the absolute value of the ratio (1 /FreeC) provides
an indication of the number of years that the firm can continue to intemally fundits current level of operating and investment activities. For example, whenFreeC is equal to -0.5, absent external financing, a firm will consume all of itsavailable current assets within two years. We hypothesize that as FreeC becomesmore negative (i.e., the firm is closer to exhausting its internal funds), the firm ismore likely to manipulate eamings. However, we do not expect the relation tobe linear. In particular, if a firm has enough intemal funds to last several years,then managers are unlikely to resort to earnings manipulation today. Therefore,we create an indicator variable {Ex a«fe-Finance), which is coded 1 if the firmrequires financing within two years and 0 otherwise. This cutoff assumes that ifa firm requires extemal financing within the next two years, then it starts takingaction now to raise the needed funds. This cutoff is somewhat arbitrary andpotentially lowers the power of our tests. However, our results are insensitive tothe particular functional form of FreeC used.'^
Ex Post Measure of the Demand for Extemal FinancingWe also investigate the number of firms that obtained financing during the manip-ulation period. However, this ex post measure of the demand for extemal financ-ing is potentially problematic. The time between the end of the manipulation peri-od and the announcement of the alleged eamings manipulation is often very short
Causes and Consequences of Earnings Manipulation 13
(i.e., for 69 firms it is less than one year). Therefore, the discovery of the allegedearnings overstatement can lead to the cancellation of the planned extemal financ-ing."* Thus, our ex post measure is potentially biased against finding a demand forextemal financing. Altematively, if the SEC pays special attention to the financialstatements of firms registering securities, then the measure may be biased theopposite way. The variable, Actual-Issuances, is coded 1 if the firm issues securi-ties during the manipulation period, and 0 otherwise. We also investigate the dol-lar value of the securities issued during the manipulation period (Finance-Raised).
Insider Trading ActivityTo determine the extent of insider trading in the sample we use the NationalArchives and Records Administration Ownership Report System (ORS) filesfrom January, 1975 to March, 1991. These files are obtained from the SEC andprovide records of security transactions and holdings by people with insiderrelations that file SEC Forms 3, 4, and 5. These files list whether the insider is adirector and/or an officer of the firm. They also list the date and type of trans-action. We focus on sales made during the manipulation period. For each firmlisted on the file, we cumulate the value of all sales made by officers and direc-tors during the manipulation period. We then scale the value of insider sales bythe market value of the firm at the beginning of the manipulation period(Off&Dir_salesM). This indicates the percent of firm value sold by insiders. TheORS files do not distinguish between inside and outside directors. Outside direc-tors are less likely to sell their holding due to insider knowledge. Consequently,Off«&Dir_salesM is likely to be a noisy measure of insider trading. We therefore,also obtain the name of the Chief Executive Officer (CEO) from the proxy state-ments and create a second variable (CEO_salesM). This variable indicates thetotal value of sales made by the CEO during the manipulation period scaled bythe market value of the firm at the beginning of the manipulation period.
The Bonus and Debt MotivationsTo measure the extent to which eamings-based bonus plans motivate managersto manipulate eamings, we ascertain whether an eamings-based bonus plan is inexistence during the manipulation period. The variable (Eamings Plan) is coded1 if the firm had an eamings-based plan, 0 otherwise. The existence of an eam-ings-based bonus plan can provide management with incentives to eitherincrease or reduce earnings (see, Healy 1985). Since the firms in the SEC sam-ple are alleged to have been overstating eamings, we assume that if they areresponding to an eamings-based bonus plan, then that plan must have been pro-viding incentives to increase earnings. In this respect, it is useful to note thatobtaining further details conceming the bonus plans (i.e., magnitude of nondis-cretionary eamings relative to the upper and lower bounds specified in the plan)will not necessarily increase the power of our tests. Since we start with a samplewhere earnings are allegedly manipulated upward, it must be the case that eam-ings are between the upper and lower bounds of the plan if eamings are beingmanaged in response to the plan. Furthermore, as a practical matter very few ofour sample firms provide bonus plan parameters in their proxy statements.
14 Contemporary Accounting Research
We use two approaches to determine whether closeness to debt covenantsmotivates the earnings manipulation in the SEC firms. The first measure isleverage (total debt to total assets). This measure is frequently employed inthe extant literature as a proxy for closeness to covenants and is associatedwith the existence and tightness of covenants (see Duke and Hunt 1990; andPress and Weintrop 1990). However, the use of leverage suffers from twoshortcomings. First, it is a noisy measure of closeness to covenants, since opti-mal leverage ratios and the corresponding ratios used in debt covenants arelikely to vary as a function of firm characteristics such as the investmentopportunity set (e.g.. Smith and Watts 1992). Second, leverage ratios are posi-tively related to the demand for external equity financing. In particular, Oplerand Titman (1994) show that firms that have high leverage ratios due to largeaccumulated losses are more likely to issue equity. As a result, leverage ratiosare also likely to proxy for the demand for external financing motivation.Thus, leverage ratios may explain earnings manipulation even in the absenceof binding debt covenants.
In an attempt to circumvent the above problems, we also directly investigatecovenant violations. This approach takes advantage of the fact that the earningsmanipulation in our sample is identified by the SEC and typically reversed bythe time the AAERs are published. Thus, we expect that if eamings are manipu-lated to avoid debt covenant violations, then reversals of the eamings manipula-tions will result in debt covenant violations. Technical violations of accounting-based debt covenants are identified using a keyword search on the NationalAutomated Accounting Research System (NAARS) as in Sweeney (1994).''Annual reports for 27 firms not covered on NAARs are obtained from the BakerLibrary at Harvard University and manually searched. For each SEC firm, wesearch for technical violations from the beginning of the manipulation perioduntil two years after the end of manipulation period or the announcement date(which ever date is later in time). We investigate the entire manipulation periodsince firms in violation of debt covenants continue to have incentives to boosteamings to resolve the default (Sweeney 1994). We go out beyond the manipu-lation period because we want to capture cases where restatements cause techni-cal violations. Each control firm is investigated over the identical period as itsmatched SEC firm. If a greater proportion of the SEC firms violate debtcovenants during and after the manipulation period, then these firms potentiallymanage eamings to loosen or avoid debt covenant constraints.
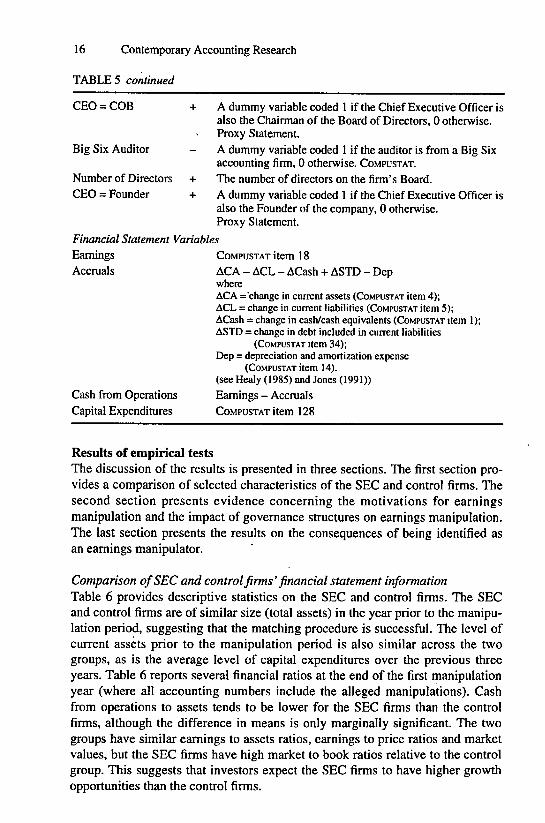
Measures of Governance StructureWe obtain information concerning firms' govemance structures from proxystatements and annual reports. We use the proxy statement in the year prior tothe first year of the manipulation period. To investigate the govemance hypothe-ses, we collect data on the following variables: Audit Committee, %Insiders onBoard, %Board Holdings held by Insiders, Outside Block, CEO = COB, CEO =Founder, Number of Directors, and Big Six Auditor. These variables aredescribed in detail in Table 5.
Causes and Consequences of Eammgs Manipulation 15
TABLE 5Definitions of variables used in the analysis and data sources. Year t is the first year of themanipulation period. For stock variables end of year values arc reported
Variable Predicted sign Definition and Data Source
MotivationEx ante-Finance
Actual-Issuance
Finance-Raised
Off&Dir salesM
CEO_salesM
LeverageTechnical Default
Bonus Plan
GovemanceAudit Committee
%Insiders on Board
%Board Holdingsheld by Insiders
Outside Block
Insider > 50%
+ An ex ante measure of a firm's demand for financing. It is adummy variable coded 1 if the firm's FreeC is less than-0.5, and 0 otherwise. Where FreeC is defined as
Cash from operations, - average capital expenditures,_^,o,.|
Current Assets,.,
+ A dummy variable coded I if the firm issued securities dur-ing the manipulation period, 0 otherwise.Securities Data Corp.
+ The average dollar value of issued securities during themanipulation penod scaled by the market value at thebeginning of the manipulation penod.Securities Data Corp. and COMPUSTAT.
+ Total dollar value of sales made by officers and directorsduring the manipulation period scaled by the market valueof the firm at the beginning of the manipulation period.Ownership Report System Files, Proxy Statements andCOMPUSTAT .
+ Total dollar value of sales made by the Chief ExecutiveOfficer (CEO) during the manipulation period scaled by themarket value of the firm at the beginning of the manipula-tion period. Ownership Report System Files, ProxyStatements and COMPUSTAT.
+ Total Debt scaled by Total Assets. COMPUSTAT.+ A dummy variable coded 1 if the firm reports a technical
default during the manipulation period or up to two yearsafter the end of the manipulation period or the announce-ment date (which ever js later in time), 0 otherwise.NAARS.
+ A dummy variable coded 1 if the firm has an earnings-based bonus plan, 0 otherwise. Proxy Statement.
- A dummy variable coded 1 if the board of directors has anaudit committee, 0 otherwise. Proxy Statement.
+ Total number of officers that are on the board scaled by thetotal number of directors. Proxy Statement.
+ Total number of shares owned by officers on the boardscaled by total number of shares held by directors.Proxy Statement.A dummy variable coded one if the firm has a 13D filerwho is not management, 0 otherwise. Proxy Statement.
+ A dummy variable coded one if over 50 percent of theboard of directors are officers, 0 otherwise.Proxy Statement.
continued on p. 16
16 Contemporary Accounting Research
TABLE 5 continued
CEO = COB + A dummy variable coded 1 if the Chief Executive Officer isalso the Chairman of the Board of Directors, 0 otherwise.Proxy Statement.
Big Six Auditor - A dummy variable coded 1 if the auditor is from a Big Sixaccounting firm, 0 otherwise. COMPUSTAT.
Number of Directors + The number of directors on the firm's Board.CEO = Founder + A dummy variable coded 1 if the Chief Executive Officer is
also the Founder of the company, 0 otherwise.Proxy Statement.
Accruals ACA - ACL - ACash + ASTD - DepwhereACA = change in cuiTent assets (COMPUSTAT item 4);ACL = change in current liabilities (COMPUSTAT item 5);ACash = change in cash/cash equivalents (COMPUSTAT item 1);ASTD = change in debt included in current liabilities
(COMPUSTAT item 34);Dep = depreciation and amortization expense
(COMPUSTAT item 14).(see Healy (1985) and Jones (1991))
Cash from Operations Eamings - AccrualsCapital Expenditures COMPUSTAT item 128
Results of empirical testsThe discussion of the results is presented in three sections. The first section pro-vides a comparison of selected characteristics of the SEC and control firms. Thesecond section presents evidence concerning the motivations for earningsmanipulation and the impact of governance structures on earnings manipulation.The last section presents the results on the consequences of being identified asan eamings manipulator.
Comparison of SEC and control firms' financial statement informationTable 6 provides descriptive statistics on the SEC and control firms. The SECand control firms are of similar size (total assets) in the year prior to the manipu-lation period, suggesting that the matching procedure is successful. The level ofcurrent assets prior to the manipulation period is also similar across the twogroups, as is the average level of capital expenditures over the previous threeyears. Table 6 reports several financial ratios at the end of the first manipulationyear (where all accounting numbers include the alleged manipulations). Cashfrom operations to assets tends to be lower for the SEC firms than the controlfirms, although the difference in means is only marginally significant. The twogroups have similar eamings to assets ratios, eamings to price ratios and marketvalues, but the SEC firms have high market to book ratios relative to the controlgroup. This suggests that investors expect the SEC firms to have higher growthopportunities than the control firms.
Causes and Consequences of Eamings Manipulation 17
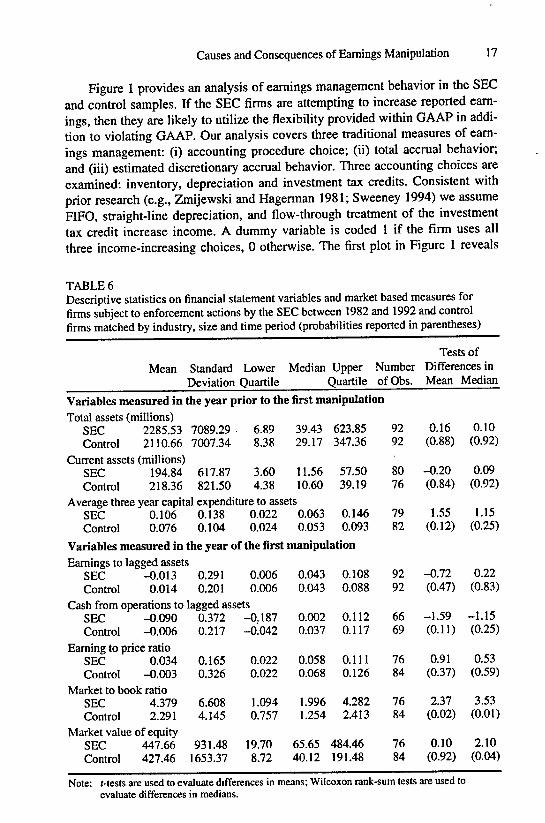
Figure 1 provides an analysis of eamings management behavior in the SECand control samples. If the SEC firms are attempting to increase reported eam-ings, then they are likely to utilize the flexibility provided within GAAP in addi-tion to violating GAAP. Our analysis covers three traditional measures of eam-ings management: (i) accounting procedure choice; (ii) total accrual behavior;and (iii) estimated discretionary accrual behavior. Three accounting choices areexamined: inventory, depreciation and investment tax credits. Consistent withprior research (e.g., Zmijewski and Hagerman 1981; Sweeney 1994) we assumeFIFO, straight-line depreciation, and flow-through treatment of the investmenttax credit increase income. A dummy variable is coded 1 if the firm uses allthree income-increasing choices, 0 otherwise. The first plot in Figure 1 reveals
TABLE 6Descriptive statistics on financial statement variables and market based measures forfirms subject to enforcement actions by the SEC between 1982 and 1992 and controlfirms matched by industry, size and time period (probabilities reported in parentheses)
Mean Standard Lower Median Upper NumberDeviation Quartile Quartile of Obs.
Tests ofDifferences inMean Median
Variables measured in the year prior to the first manipulationTotal assets (millions)
SECControl
2285.532110.66
Current assets (millions)SECControl
194.84218.36
7089.297007.34
617.87821.50
6.898.38
3.604.38
39.4329.17
11.5610.60
Average three year capital expenditure to assetsSECControl
0.1060.076
0.1380.104
0.0220.024
0.0630.053
623.85347.36
57.5039.19
0.1460.093
Variables measured in the year of the first manipulationEamings to lagged assets
SECControl
-^.0130.014
0.2910.201
0.0060.006
Cash from operations to lagged assetsSECControl
-0.090-0.006
Eaming to price ratioSECControl
0.034-0.003
Market to book ratioSECControl
4.3792.291
Market value of equitySECControl
447.66427.46
0.3720.217
0.1650.326
6.6084.145
931.481653.37
-0.187-0.042
0.0220.022
1.0940.757
19.708.72
0.0430.043
0.0020.037
0.0580.068
1.9961.254
65.6540.12
0.1080.088
0.1120.117
0.1110.126
4.2822.413
484.46191.48
9292
8076
7982
9292
6669
7684
7684
7684
0.16(0.88)
-0.20(0.84)
1.55(0.12)
-0.72(0.47)
-1.59(0.11)
0.91(0.37)
2.37(0.02)
0.10(0.92)
0.10(0.92)
0.09(0.92)
1.15(0.25)
0.22(0.83)
-1.15(0.25)
0.53(0.59)
3.53(0.01)
2.10(0.04)
Note: /-tests are used to evaluate differences in means; Wilcoxon rank-sum tests are used toevaluate differences in medians.
18 Contemporary Accounting Research
Figure 1 The proportion of firms using income-increasing accounting procedures (thecombined choice of FIFO, straight-line depreciation, and the flow-through method forinvestment tax credits), median total accruals, and median discretionary accruals bothscaled by lagged assets, surrounding the first year that the firm engaged in eamingsmanipulation. A comparison of 66 firms subject to enforcement actions by the SEChetween 1982 and 1992 to 69 control firms matched by industry, size, and time period.
Causes and Consequences of Eamings Manipulation 19
that the proportion of SEC firms using all three income-increasing proceduralchoices gradually increases as the manipulation year approaches. The differencebetween the control and SEC firms' combined use of income-increasing proce-dures in the first year of manipulation is significant at the five percent level. Thisis consistent with the managers of the SEC firms using their discretion withinGAAP to increase reported income.""
The second and third plots in Figure 1 illustrate the behavior of total accru-als and estimated discretionary accruals respectively. Estimated discretionaryaccruals are measured via the modified Jones (1991) Model, following the pro-cedure described in Dechow, Sloan, and Sweeney (1995). The two plots tell aconsistent story. Accruals gradually increase as the alleged year of eamingsmanipulation approaches, and then experience a sharp decline. The difference inaccruals between the SEC and control firms is statistically significant in the firstyear of manipulation. The increase in accruals is consistent with earnings manip-ulation. The subsequent accrual reduction is consistent with the reversal of prioraccrual overstatements. This evidence provides extemal validity that the SEChas identified a sample of firms attempting to overstate eamings.
Motivations and govemance structuresTable 7 provides tests of differences in means and medians for the motivationvariables. Panel A covers the continuous variables and panel B covers the dis-crete variables. The means, medians, standard deviations and upper and lowerquartiles are provided for the continuous variables. Tests for both difference inmeans (f-tests) and difference in medians (Wilcoxon rank-sum tests) are conduct-ed. In panel B the proportion of each sample with the particular characteristic isindicated. Chi-square statistics are calculated to test whether there is a systematicrelation between the existence of the characteristic and sample membership."
Table 7 indicates that all three proxies for the demand for extemal financingare significantly different across the two samples. In panel B, Ex ante-Financeindicates that 39 percent of the SEC firms require extemal funding within thenext two years, while only 16 percent of the control firms are in such a position.The percent of SEC firms that actually issue securities during the manipulationperiod is 36 percent, while only 20 percent of the control group issue new secu-rities (Actual-Issuances). Chi-square statistics indicate that our proxies for exante and ex post demand for financing are systematically related to sample mem-bership (/7-values are less than five percent). In addition, the Wilcoxon test indi-cates that the dollar value of securities issued by the SEC firms is greater thanthe dollar value of securities issued for the control firms (Finance-Raised inpanel A, p-value = 0.03). Although the difference in means is also in the predict-ed direction, it is not significant. These results are consistent with managers ofthe SEC firms manipulating eamings to lower the cost of external financing.
Panel A of Table 7 also presents evidence on the extent of insider sales dur-ing the manipulation period. The results suggest that relative to officers anddirectors of the control firms, officers and directors of the SEC firms are not sell-ing a significantly greater proportion of their firm (Off&Dir_salesM). While 27
20 Contemporary Accounting Research
CEOs of the SEC firms sell stock during the manipulation period, the relativevalue of their sales, (CEO_salesM) does not differ from that of the 17 CEOs ofthe control firms selling stock. Potential explanations for the weak results arethat (i) insiders failed to file their sales with the SEC or are discreet in their sales(e.g., sold through a third party); or (ii) insiders did not manage earnings tomanipulate investors' perceptions with the intention of selling their holdings. Itis also important to note that insiders are typically required to sign 'lock-up'agreements in connection with public equity offerings. These agreements pre-vent managers from selling their holdings for up to one year after the offering.Table 7 indicates that 36 (20) percent of the SEC (control) firms are likely tohave 'lock-up' agreements at some point during the manipulation period.
TABLE 7Statistics on motivation variables for firms subject to enforcement actions by the SECbetween 1982 and 1992 and the control firms matched by industry, size and time period(probabilities reported in parentheses)
Panel A: Continuous variables
Pred
SignFinance-Raised
SEC +Control
Off&Dir salesMSEC +Control
CEO salesMSEC +Control
LeverageSEC +Control
Mean
0.190.11
0.0390.020
0.0090.004
0.290.19
Panel 6: Discrete variables
Ex ante-Finance
Actual-Issuances
Technical Default
Earnings Plan
PredSign
+
+
+
+
Std Lower
Dev Quartile
0.42 0.000.29 0.00
0.128 0.000.067 0.00
0.025 0.000.125 0.00
0.22 0.140.18 0.029
SECSample
0.390
0.359
0.196
0.372
Median Upper
Quartile
0.000.00
0.0010.000
0.000.00
0.260.16
ControlSample
0.162
0.196
0.098
0.422
0.260.00
0.0180.005
0.0030.000
0.370.28
Tests ofDifferences in
Mean
1.50(0.14)
1.05(0.29)
1.60(0.11)
3.44(0.01)
Median
2.24(0.03)
1.80(0.07)
1.19(0.24)
3.53(0.01)
Chi-Square Statistic(probability)
9.72(0.00)6.10
(0.01)3.51
(0.06)0.46
(0 50)
Note' /-tests are used to evaluate differences in means, Wilcoxon rank-sum tests are used toevaluate differences in medians. The number of observations for Ex ante-Finance is 66 (69);Eamings Plan is 86 (90); Off&Dir_saIesM is 70 (71); and CEO-SalesM is 70 (71) for theSEC firms (control firms). For other variables both groups have 92 observations.
Causes and Consequences of Eamings Manipulation 21
The existence of an earnings-based bonus plan does not differ significantlyacross the SEC and the control samples. In both samples approximately 40 per-cent of the firms have earnings-based compensation plans. The use of earnings-based plans in both groups is low relative to an average cross-section of firms(e.g., Sibson and Company 1989 indicate that 93 percent of firms in generalindustry have annual incentive plans). The firms examined are predominantlyfrom high growth industries (e.g., computer software and hardware). Smith andWatts (1992) .suggest that firms in high growth industries are more likely toemploy stock-based rather than eamings-based incentive plans. We find that94.2 percent of the SEC firms, versus only 80 percent of the control firms havestock-based compensation (not reported in the table). These proportions are sig-nificantly different at the one percent level. This is consistent with the SEC firmsplacing a relatively greater weight on stock price-based incentives versus eam-ings-based incentives in compensating management, but provides no support forthe bontis hypothesis.
Table 7 indicates that the SEC firms are more highly levered than the con-trol group. The median leverage for the SEC firms is 26 percent, which is signif-icantly greater than the median leverage for the control firms of 16 percent. Theresults in panel B indicate that 18 SEC firms (19.6 percent) have technical viola-tions of debt covenants. The corresponding level of defaults for the controlgroup is 9.8 percent. This difference is significant at the six percent level. Thus,although none of the AAERs mention avoidance of debt covenants as a motiva-tion for eamings manipulation, our evidence is consistent with the existence ofsuch a motivation.
Analysis of the govemance variables is provided in Table 8. Results providestrong evidence that the SEC firms have weak govemance structures. Startingwith panel A, while the SEC and control samples have on average, the same sizeboards (nine members), the SEC sample has a significantly greater proportion ofinsiders on the Board of Directors relative to the control sample (53 percent ver-sus 40 percent). Further, insiders on the SEC firms' boards hold a significantlygreater proportion of total board stockholdings (90 percent versus 77 percent).
The results in panel B indicate that relative to the control firms, the SECfirms are less likely to have audit committees (58 percent versus 76 percent) andare less likely to have outside blockholders (42 percent versus 57 percent).Further, 54 percent (34 percent) of the SEC (control) firms' insiders have amajority of the board seats (Insiders > 50 percent). Moreover, we find that theCEO appears to have more power over the board in the SEC sample. The CEOis also the Chairman of the Board in 86 percent of the SEC firms versus 74 per-cent of the control firms. The CEO is also the original founder of the company in49 percent of the SEC firms versus only 30 percent of the control firms. Finally,there is no significant difference between the SEC and control firms' use of aBig Six auditor.
The results in Table 7 suggest that the two most important motives forexplaining mangers' decisions to manipulate eamings are: the need for extemalfinancing and the closeness to debt covenant constraints. Insider trading and
22 Contemporary Accounting Research
TABLE 8Statistics on governance variables for firms subject to enforcement actions by the SECbetween 1982 and 1992 and the control firms matched by industry, size and time period(probabilities in parentheses)
Panel A: Continuous variables
PredSign
%Insiders on BoardSEC +Control
Mean
0.530.40
%Board Holdings held by InsidersSEC +Control
Number of DirectorsSEC • +Control
0.900.77
9.08.6
Panel B: Discrete variables
Audit Committee
Outside Block
Insider > 50%
CEO = COB
Founder = CEO
Big Six Auditor
PredSign
_
_
+
+
+
_
StdDev
0.210.20
0.180.27
5.74.5
LowerQuartile
0.330.25
0.910.68
5.06.0
SECSample
0.581
0.424
0.544
0.859
0.488
0.587
Median UpperQuartile
0.540.38
0.960.86
7.07.0
ControlSample
0.756
0.565
0.337
0.744
0.300
0.630
0.670.50
1.000.98
11.010.0
Tests ofDifferences in.Mean Median
4.18 4.01(0.01) (0.01)
3.75 3.72(0.01) (0.01)
0.50 0.33(0.62) (0.74)
Chi-Square Statistic(probability)
6.03(0.01)3.67
(0.06)7.96
(0.01)3.57
(0.06)6.54
(0.01)0.37
(0.55)
Note: f-tests are used to evaluate differences in means, Wilcoxon rank-sum tests are used to evalu-ate differences in medians. The number of observations with proxy statement information is86 for the SEC firms and 90 for the control firms.
honus-based motivations appear less important. Table 8 suggests that a firm'sgovernance structure also plays a role in the decision to manipulate eamings.Firms with weak govemance structures are more likely to manipulate eamings.In Table 9 we investigate whether there is an interactive relation hetween gover-nance-related variables and the need for extemal financing or the closeness todebt covenant constraints. That is, when managers have both the incentive andthe opportunity to overstate earnings, are they more likely to engage in eamingsmanipulation? We apply factor analysis to the governance variables to obtainsummary measures of the effectiveness of firms' governance structures. 'Weadopt this approach because the govemance variables are highly correlated and
Causes and Consequences of Eamings Manipulation 23
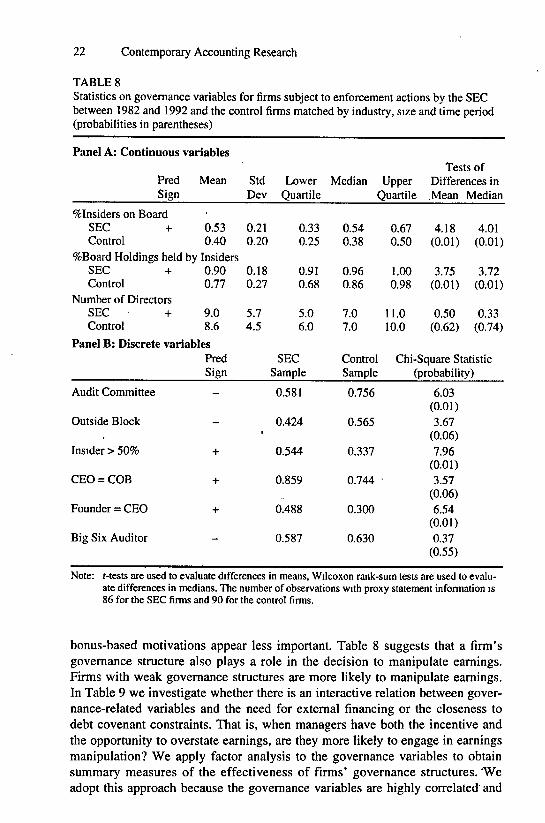
appear to be measuring similar underlying constructs. The results from the factoranalysis indicate that there are two underlying factors. The first we name "LowOversight of Management" which is negatively correlated with AuditCommittee and positively correlated with %Insider on Board, %Board Holdingsheld by Insiders, and CEO = Founder. The second we call "Power of CEO overBoard" which is positively correlated with CEO = COB and negatively cor-related with Outside Block.'*
Table 9 provides the results of three logit regressions. To reduce the numberof regressions reported we focus on Actual-Issuance and Technical Default asmeasures for need for financing and closeness to covenants. Similar results arereported when Ex anrc-Finance and Leverage are used. The table reports mar-ginal changes in the probability of a firm being subject to enforcement actions
TABLE 9Logistic regressions investigating the motivation for eamings manipulation and the inter-active effects of govemance variables. A comparison of 90 firms subject to enforcementactions by the SEC between 1982 and 1992 to 85 control firms matched by industry, size,and time period.
Variable Predsign
Panel A
Intercept ?
Actual-Issuances +
Actual-Issuance xLow Oversight of Mgt. +
Actual-Issuance x Powerof CEO Over Board +
Log-LikelihoodRestricted (Slopes=0) Log-L.-2 X (Log-Likelihood ratio)Significance Level
Panel B
Intercept , ?
Default +
Default X Low Oversightof Management +
Default X Power of CEOOver Board +
Log-LikelihoodRestricted (Slopes=0) Log-L.-2 X (Log-Likelihood ratio)Significance Level
DeltaProb.* Coefficient
-0.07 0.29
0.26 1.03
0.22 0.88
0.07 0.27
-114.88-121.23
12.710.005
-0.04 -0.17
0.20 0.82
0.47 1.89
0.16 0.63
-114.52-121.23
13.420.004
Std. Error ofCoefficient
0.18
0.41
0.41
0.40
0.16
0.56
0.88
0.73
r-ratio
-1.60
2.54
2.14
0.67
-1.06
1.46
2.15
0.86
Prob.
0.11
0.01
0.03
0.50
0.29
0.14
0.03
0.39
continued on p. 24
24 Contemporary Accounting Research
TABLE 9 continued
Panel CIntercept ?Actual-Issuance +Default +Actual-Issuance x
Low Oversight of Mgt. +Default X Low Oversight
of Management +Actual-Issuance x Power
of CEO Over Board +Default X Power of
CEO Over Board +Log-LikelihoodRestncted (Slopes=0) Log-L.-2 X (Log-Likelihood ratio)Significance Level
-0.11 -0.450.28 1.100.22 0.86
0.16 0.64
0.43 1.71
0.04 0.17
0.16 0.64-109.27-121.23
23.920.005
0.200.430.58
0.43
0.89
0.47
0.80
-2.2962.5681.476
1.47
1.92
0.37
0.80
0.020.010.14
0.14
0.06
0.71
' 0.43
The marginal effects of the regressot^ on the probabilities are calculated as follows:
WhemY = dichotomous dependent vanable equal to 1 for firms subject to enforcement actions
by the SEC, 0 for control firms;X, = i"" independent variable;X = vector of mdependent variables;A = logistic cumulative distribution function; and
z = vector of coefficient estimates. .§21 is calculated at the means cf the regressors.dx,
by the SEC implied by the logit coefficient estimates, resulting from a unitchange in the explanatory variables. These marginal sensitivities, labeled "DeltaProb." are economically equivalent to coefficient estimates from ordinary leastsquares estimation (see Greene 1993). Panel A of Table 9 interacts Actual-Issuance with the two governance variables, while panel B interacts TechnicalDefault with the two governance variables. Panel C includes both motivationvariables and their interactions with the governance variables. Since similarfindings are reported across all three panels, only Panel C will be discussed. Theresults indicate that independently both Actual Issuance and Technical Defaulthave explanatory power, (significant at the 1 percent and 14 percent level,respectively). The interaction terms (Actual Issuance x Low Oversight ofManagement) and (Technical-Default x Low Oversight of Management) are sig-nificant at the 14 percent and 6 percent levels respectively. This suggests thatlow managerial oversight is an important catalyst for eamings manipulation. Theinteractive variables including Power of CEO over Board are not significant,suggesting that this governance construct is a less important catalyst.
Causes and Consequences of Eamings Manipulation 25
ConsequencesThis section investigates the consequences realized by firms when the stockmarket discovers that they have manipulated eamings. We first present evidenceon the disparity of beliefs among investors concerning firm value, followed byevidence on changes in the firms' costs of capital.
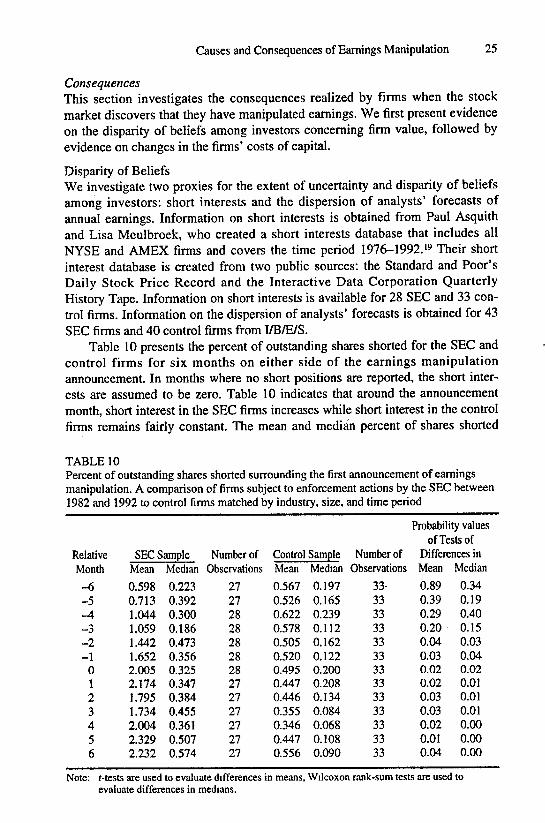
Disparity of BeliefsWe investigate two proxies for the extent of uncertainty and disparity of beliefsamong investors: short interests and the dispersion of analysts' forecasts ofannual earnings. Information on short interests is obtained from Paul Asquithand Lisa Meulbroek, who created a short interests database that includes allNYSE and AMEX firms and covers the time period 1976-1992.'9 Their shortinterest database is created from two public sources: the Standard and Poor'sDaily Stock Price Record and the Interactive Data Corporation QuarterlyHistory Tape. Information on short interests is available for 28 SEC and 33 con-trol firms. Information on the dispersion of analysts' forecasts is obtained for 43SEC firms and 40 control firms from I/B/E/S.
Table 10 presents the percent of outstanding shares shorted for the SEC andcontrol firms for six months on either side of the earnings manipulationannouncement. In months where no short positions are reported, the short inter-ests are assumed to be zero. Table 10 indicates that around the announcementmonth, short interest in the SEC firms increases while short interest in the controlfirms remains fairly constant. The mean and median percent of shares shorted
TABLE 10Percent of outstanding shares shorted surrounding the first announcement of earningsmanipulation. A comparison cf firms subject to enforcement actions by the SEC between1982 and 1992 to control firms matched by industry, size, and time period
Note: Mests are used to evaluate differences in means, Wilcoxon rank-sum tests are used toevaluate differences in medians.
26 Contemporary Accounting Research
differs significantly (at the five percent level) across the two samples in months-2 to +6. These results suggest that the disparity of beliefs conceming the valueof SEC firms increases at the time of and following the announcements of thealleged earnings manipulation. The fact that short interests start increasing twomonths before the first public announcement of the eamings manipulation is con-sistent with short sellers preempting this announcement and gaining from theprice decline. This finding is consistent with Asquith and Meulbroek's (1993) evi-dence that short-sellers are sophisticated investors able to outperform the market.
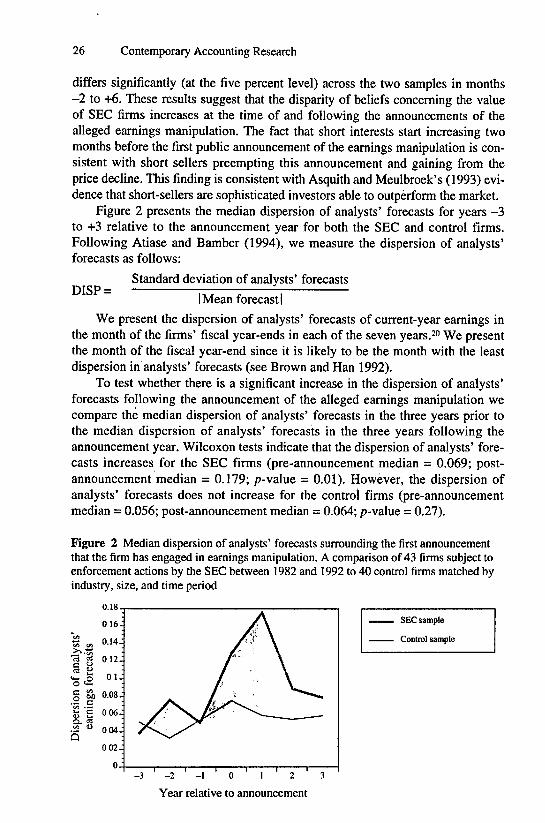
Figure 2 presents the median dispersion of analysts' forecasts for years -3to +3 relative to the announcement year for both the SEC and control firms.Following Atiase and Bamber (1994), we measure the dispersion of analysts'forecasts as follows:
DISP =Standard deviation of analysts' forecasts
I Mean forecast I
We present the dispersion of analysts' forecasts of current-year eamings inthe month of the firms' fiscal year-ends in each of the seven years.^" We presentthe month of the fiscal year-end since it is likely to be the month with the leastdispersion in analysts' forecasts (see Brown and Han 1992).
To test whether there is a significant increase in the dispersion of analysts'forecasts following the announcement of the alleged eamings manipulation wecompare the median dispersion of analysts' forecasts in the three years prior tothe median dispersion of analysts' forecasts in the three years following theannouncement year. Wilcoxon tests indicate that the dispersion of analysts' fore-casts increases for the SEC firms (pre-announcement median = 0.069; post-announcement median = 0.179; p-value = 0.01). However, the dispersion ofanalysts' forecasts does not increase for the control firms (pre-announcementmedian = 0.056; post-announcement median = 0.064; p-value = 0.27).
Figure 2 Median dispersion of analysts' forecasts surrounding the first announcementthat the firm has engaged in eamings manipulation. A comparison of 43 firms subject toenforcement actions by the SEC between 1982 and 1992 to 40 control firms matched byindustry, size, and time period
0.18SEC sample
Control sample
- 2 - 1 0 1 2 3
Year relative to announcement
Causes and Consequences of Eamings Manipulation 27
Increases in short interests and in the dispersion of analysts' forecasts suggestthat the disparity of beliefs among investors increases following the initialannouncement of the alleged eamings manipulation. This is indirect evidence thatthe SEC firms face higher costs of capital (see, Kim and Verrecchia 1994; Baimanand Verrecchia 1993). Below, we provide more direct evidence that allegations ofeamings manipulation are associated with increases in the cost of capital.
Cost of CapitalWe employ three measures to investigate whether cost of capital increases forSEC firms following the announcements of their alleged earnings manipulation.We investigate whether (i) stock prices decline; (ii) bid-ask spreads increase;and (iii) number of analysts following the firms decline. Each of these are dis-cussed below.
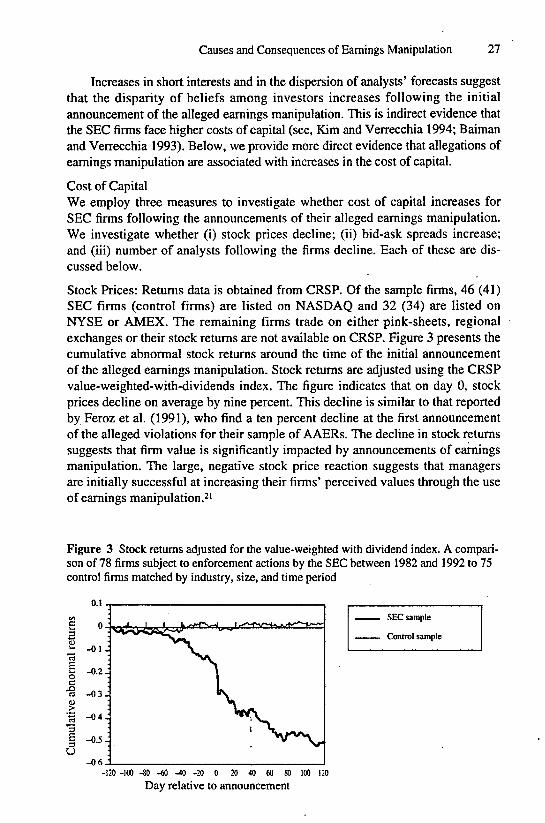
Stock Prices: Retums data is obtained from CRSP. Of the sample firms, 46 (41)SEC firms (control firms) are listed on NASDAQ and 32 (34) are listed onNYSE or AMEX. The remaining firms trade on either pink-sheets, regionalexchanges or their stock retums are not available on CRSP. Figure 3 presents thecumulative abnormal stock returns around the time of the initial announcementof the alleged eamings manipulation. Stock retums are adjusted using the CRSPvalue-weighted-with-dividends index. The figure indicates that on day 0, stockprices decline on average by nine percent. This decline is similar to that reportedby Feroz et al. (1991), who find a ten percent decline at the first announcementof the alleged violations for their sample of AAERs. The decline in stock retumssuggests that firm value is significantly impacted by announcements of eamingsmanipulation. The large, negative stock price reaction suggests that managersare initially successful at increasing their firms' perceived values through the useof eamings manipulation.^'
Figure 3 Stock returns adjusted for the value-weighted with dividend index. A compari-son of 78 firms subject to enforcement actions by the SEC hetween 1982 and 1992 to 75control firms matched by industry, size, and time period
Bid-ask Spreads: We obtain bid-ask spread data for 32 firms listed on theNASDAQ National Market (NNM) system directly from the CRSP tapes. Wealso obtain bid-ask spread data for a further twelve NASDAQ firms (not listedon NNM) for forty days surrounding the announcement directly from theNASDAQ Historical Research Group. We did not collect bid-ask spread data forNYSE and AMEX firms. Previous research on the determinants of bid-askspreads (e.g., Benston and Hagerman 1974; Cowan, Carter, Dark, and Singh1992; Jegadeesh and Subrahmanyam 1983) indicates that both price and volumeare important in explaining the magnitude of bid-ask spreads. In addition.Cowan et al. (1992) also indicate that the number of market makers is importantin explaining bid-ask spreads. Therefore, in order to determine if bid-ask spreadsare relatively larger after the announcement it is necessary to control for thesedeterminants of the spread.
We adopt the following procedure to obtain a predicted bid-ask spread forour firms (this procedure is similar to that adopted by Cowan et al. 1992).(i) For each year (1983 to 1992) we obtain all NNM firms with at least 200
trading days;(ii) For each firm that qualifies, we calculate the average (over at least 200 trad-
ing days), bid-ask spread; bid price, volume, and number of market makers;(iii) Perform the following regression for each year:
where for firm /:Bid^ask spread, = log of the average ^^ ~ '
(bid-I-ask)/2Volume, = log of the average number of shares traded.Price, = log of the average bid price,Mkt makers, = log of the average number of market makers.From each regression we obtain the predicted values of CXQ. PI, P2, and pvYearly regression are performed since the intercept from these regressionsvaries considerably from year to year. The other coefficients, however,exhibited little variation across time.22 The number of firms in these regres-sions ranged from 176 in 1983 to a high of 2092 in 1987. The median num-ber of firms is 1627 in 1986. The explanatory power (adjusted R^) is 66 per-cent in 1983 but in all other years (1984 to 1992) is over 83 percent,
(iv) The estimated values of the coefficients in the calendar year correspondingto the announcement year are used in the following equation to calculatepredicted bid-ask spreads for each firm i on day t relative to the announce-ment date:
The residual bid-ask spread is then calculated as the actual bid-ask spreadfor firm / on day / minus the predicted bid-ask spread for firm / on day /.
Causes and Consequences of Eamings Manipulation 29
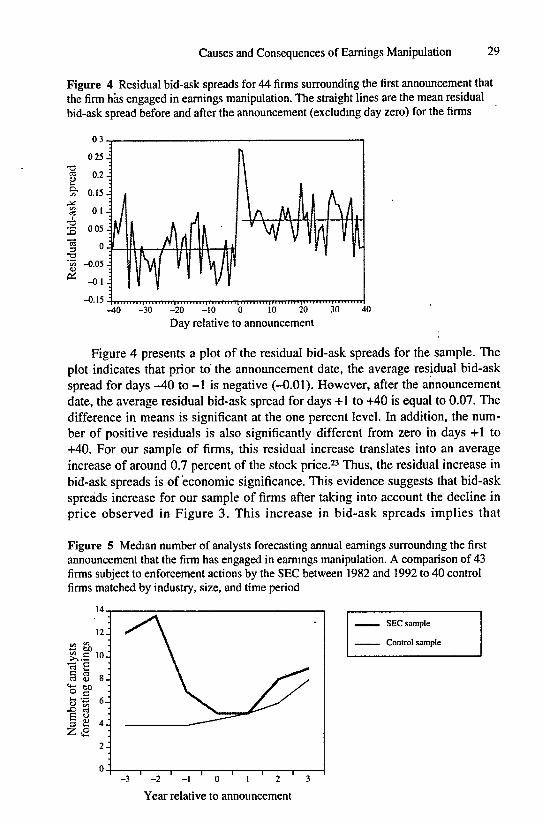
Figure 4 Residual bid-ask spreads for 44 firms surrounding the first announcement thatthe firm has engaged in eamings manipulation. The straight lines are the mean residualbid-ask spread before and after the announcement (excluding day zero) for the firms
-0.15-40 -30 -20 -10
Day relative to announcement
Figure 4 presents a plot of the residual bid-ask spreads for the sample. Theplot indicates that prior to the announcement date, the average residual bid-askspread for days -40 to -1 is negative (-^.01). However, after the announcementdate, the average residual bid-ask spread for days -f-l to +40 is equal to 0.07. Thedifference in means is significant at the one percent level. In addition, the num-ber of positive residuals is also significantly different from zero in days +1 to+40. For our sample of firms, this residual increase translates into an averageincrease of around 0.7 percent of the stock price.̂ -̂ Thus, the residual increase inbid-ask spreads is of economic significance. This evidence suggests that bid-askspreads increase for our sample of firms after taking into account the decline inprice observed in Figure 3. This increase in bid-ask spreads implies that
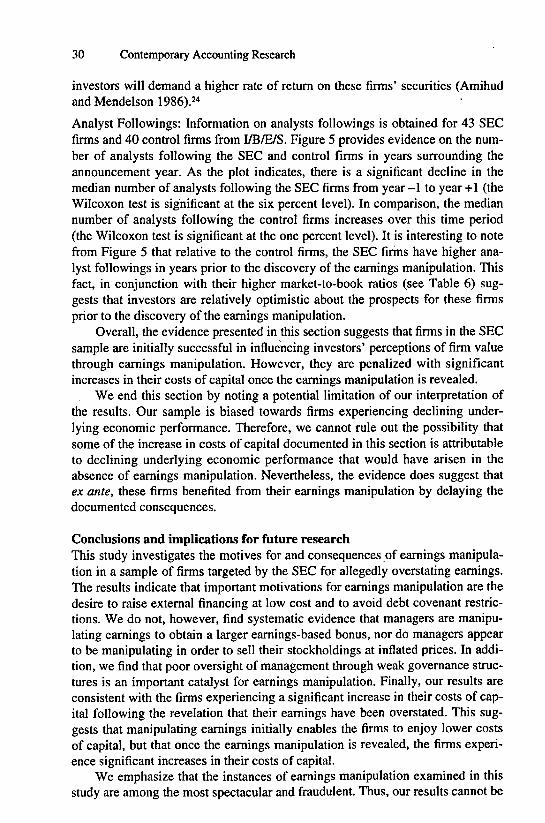
Figure 5 Median number of analysts forecasting annual eamings surrounding the firstannouncement that the firm has engaged in earnings manipulation. A comparison of 43firms subject to enforcement actions by the SEC between 1982 and 1992 to 40 controlfirms matched by industry, size, and time period
SEC sample
Control sample
- 3 - 2 - 1 0 1 2 3
Year relative to announcement
30 Contemporary Accounting Research
investors will demand a higher rate of retum on these firms' securities (Amihudand Mendelson 1986).2''
Analyst Followings: Information on analysts followings is obtained for 43 SECfirms and 40 control firms from I/B/E/S. Eigure 5 provides evidence on the num-ber of analysts following the SEC and control firms in years surrounding theannouncement year. As the plot indicates, there is a significant decline in themedian number of analysts following the SEC firms from year -1 to year +1 (theWilcoxon test is significant at the six percent level). In comparison, the mediannumber of analysts following the control firms increases over this time period(the Wilcoxon test is significant at the one percent level). It is interesting to notefrom Eigure 5 that relative to the control firms, the SEC firms have higher ana-lyst followings in years prior to the discovery of the eamings manipulation. Thisfact, in conjunction with their higher market-to-book ratios (see Table 6) sug-gests that investors are relatively optimistic about the prospects for these firmsprior to the discovery of the eamings manipulation.
Overall, the evidence presented in this section suggests that firms in the SECsample are initially successful in influencing investors' perceptions of firm valuethrough eamings manipulation. However, they are penalized with significantincreases in their costs of capital once the eamings manipulation is revealed.
We end this section by noting a potential limitation of our interpretation ofthe results. Our sample is biased towards firms experiencing declining under-lying economic performance. Therefore, we cannot rule out the possibility thatsome of the increase in costs of capital documented in this section is attributableto declining underlying economic performance that would have arisen in theabsence of eamings manipulation. Nevertheless, the evidence does suggest thatex ante, these firms benefited from their earnings manipulation by delaying thedocumented consequences.
Conclusions and implications for future researchThis study investigates the motives for and consequences of eamings manipula-tion in a sample of firms targeted by the SEC for allegedly overstating eamings.The results indicate that important motivations for earnings manipulation are thedesire to raise extemal financing at low cost and to avoid debt covenant restric-tions. We do not, however, find systematic evidence that managers are manipu-lating eamings to obtain a larger earnings-based bonus, nor do managers appearto be manipulating in order to sell their stockholdings at inflated prices. In addi-tion, we find that poor oversight of management through weak govemance struc-tures is an important catalyst for eamings manipulation. Einally, our results areconsistent with the firms experiencing a significant increase in their costs of cap-ital following the revelation that their eamings have been overstated. This sug-gests that manipulating eamings initially enables the firms to enjoy lower costsof capital, but that once the earnings manipulation is revealed, the firms experi-ence significant increases in their costs of capital.
We emphasize that the instances of eamings manipulation examined in thisstudy are among the most spectacular and fraudulent. Thus, our results cannot be
Causes and Consequences of Eamings Manipulation 31
readily generalized to more subtle cases of eamings management. Nevertheless,we conclude that the desire to raise extemal financing at low cost represents aneconomically significant motivation for earnings manipulation that has receivedrelatively little attention in previous academic research.
One potential avenue for future research is to understand the factors man-agers trade-off in deciding whether (and by how much) to manage earningswhen raising external financing. We recognize that not all firms raising extemalfinancing manage eamings to the same extent as the firms in the SEC sample.We also identify govemance structure as one important determinant of eamingsmanipulation. However, it is likely that other countervailing forces reduce incen-tives for eamings manipulation. For example, firms expecting to retum to thecapital markets frequently in the future may benefit from developing a reputa-tion for high quality financial disclosures, negating the incentive to manageeamings in the short term.
It is also possible that the relation between eamings manipulation and thedecision to raise external financing is linked to some well known puzzles in cor-porate finance. For example, it is well established that equity issues coincidewith periods of temporarily high earnings performance (Brous 1992; Loughranand Ritter 1994; Rangan 1995; and Teoh, Welch, and Wong 1995) and thatstock price performance is abnormally low in the three years following equityissues (Ritter 1991; Loughran and Ritter 1995; and Spiess and Affieck-Graves1995). These regularities may be attributable to systematic eamings manipula-tion around the time of the issues. We think these possibilities are worthy offuture research.
Finally, our results have implications for research into firms' disclosurepolicies. Existing research argues that there are long-term benefits to buildingreputations for providing reliable and timely disclosures (Lev 1992; Healy andPalepu 1993; Lang and Lundholm 1993; Botosan 1995; Frankel, McNichols,and Wilson 1995; and Healy, Palepu and Sweeney 1995). Yet the sample offirms investigated in this study chose to risk (and ultimately lose) these benefitsfor the prospect of short-term gain. Thus, our study highlights the trade-offs thatare made in choosing a firm's disclosure policy. Related issues that are >vorthyof future research include: what factors influence the disclosure policy decisionbetween long-term reputation building and short-term earnings manipulation? dofirms take actions after their reporting policies are criticized to improve orsalvage their reputations (e.g., firing management)? and are these actions suc-cessful in reducing the firms' costs of capital? By better understanding the deter-minants of disclosure policy, investors, analysts, and other parties evaluatingfirms' accounting information will be more prepared to anticipate earningsmanipulations.
Endnotes1 See Feroz, Park, and Pastena (1991) for a detailed description of the Accounting and
Auditing Enforcement Releases issued by the SEC.2 See Pincus, Holder, and Mock (1988) and Section 3.1.
32 Contemporary Accounting Research
3 See Schipper (1989) for a definition of eamings management and a commentary oneamings management research.
4 DeFond and Jiambalvo (1991) report that the SEC subsequently took enforcementaction against seven of the 41 firms.
5 Previous research has also used the Big Six as an indicator of audit quality (e.g.,DeFond and Jiambalvo 1993; Feltham, Hughes and Simunic 1991).
6 For example. The Wall Street Journal (June 10, 1987), states: 'The settlement (ofthe SEC enforcement action) has no effect on the financial condition of FirstChicago, but undermines the credibility of its chairman and chief executive officer,Barry Sullivan, who vehemently insisted in 1984 that a huge batch of loans had allgone sour at once. The SEC contended that the loans went bad over a period of timeand that loss provisions should have been taken earlier" [italics added].
7 Kim and Verrecchia (1994) argue that less precise disclosures provides greateropportunity for experts to process public mformation into private information, whichin tum increases information asymmetry among market participants and therebydecreases liquidity. Thus, the consequence of less precise disclosures is greaterinformation asymmetry between the firm and investors as well as greater disparity ofbeliefs among investors. It is the disparity of beliefs among investors that leads to aless liquid market for the security.
8 Feroz et al. (1991) provide a detailed description of the SEC's enforcement program,the AAERs issued by the SEC, and the effects of these releases on managers, audi-tors, and firms' financial statements.
9 In many of the AAERs relating to IPO firms, the SEC directly alleges that earningsare inflated in order to issue securities at higher prices. Thus, the exclusion of IPOfirms reduces the power of our tests investigating the demand for financingmotivation.
10 While the SEC (1989, p.8) categorizes all AAERs as financial reporting violationcases, it pursues differing actions depending on the severity of the violation. TheSEC pursues injunctive actions under the fraud provisions of the Securities Act of1934 when it charges an intentional material misstatement (69 firms). The agencypursues administrative proceedings under the 1964 amendments when the registrantfailed to comply with the reporting provisions of the 1934 Act (19 firms). The SECissues an Exchange Act Release when injunctive actions or administrative proceed-ings are not pursued, but public criticism of the registrant's accounting is warranted(4 firms).
11 Few of either the SEC or the control sample firms pay dividends (i.e., the mediandividend payment is zero in both samples). Assuming dividends are an additionalrequired use of cash does not change the tenor of the results.
12 We do not use capital expenditures in the manipulation period since managers mayreclassify expenses as capital expenditures in order to delay their recognition inincome. If a firm has less than three years of data, we average over the shorter peri-od. In addition, investment expenditures are also calculated as capital expenditureplus increases in investments less sales of property, plant and equipment and sale ofinvestments. The tenor of the results does not change using this altemativedefinition.
13 We scaled FreeC by total assets and total tangible assets and the results are similar.We recognize that a firm cannot continue to exist without current assets. Thus, byassuming a firm can convert all their current assets to cash we are potentially under-stating the need for financing.
14 Analysis of the individual cases in our sample confirms the existence of this prob-lem. For example, Chronar Corporation included its financial statements for 1983 in
Causes and Consequences of Eamings Manipulation 33
a registration statement filed in 1984 in conjunction with a planned public offering.The registration statement never became effective as a result of intervening actionsby the SEC (see AAER 78, n2).
15 The Emerging Issues Task Force release 86-30 (1986) specifies that covenant viola-tions must be disclosed in footnotes to firms' annual reports if a "violation hasoccurred or would have occurred absent a loan modification." The keywords used tosearch the annual reports include 'violation', 'default', 'covenant', 'noncompliance',and 'waiver'.
16 We are grateful to Jim Jiambalvo for suggesting we investigate firms' accountingprocedural choice.
17 The results reported do not use a matched-paired design, the sample size is reducedand the power of the test are lower when we only include matched pairs. However,the tenor of the results does not change.
18 The cumulative variation explained by the two factors is 55 percent, with approxi-mately 36 percent being explained by "Low Oversight of Management." We stan-dardize each variable and estimate a standardize scoring coefficient that is then mul-tiplied by the corresponding standardize variables and summed to obtain a score for"Low Oversight of Management" and for "Power of CEO over Board" for each firm.Cronbach's alpha on "Low Oversight of Management" is 0.684 and for "Power ofCEO over Board" is 0.25 for the standardized variables. This suggests that the fac-tors hold together well for "Low Oversight of Management" but not for "Power ofCEO."
19 We thank Paul Asquith and Lisa Meulbroek for providing access to their database.See Asquith and Meulbroek (1993) for a complete description of the short interestdatabase and the data collection process used to create this database.
20 The tenor of the results is unchanged if analysts' forecasts made either six months orthree months prior to the fiscal year end are used rather than those made in themonth of the fiscal year end.
21 An alternative explanation is that the announcement increased the probability ofshareholder litigation and that this in tum caused the stock price decline. We foundthat 35 SEC firms (and eight control firms) had threats of shareholder lawsuits with-in three years of the announcement. However, this alternative explanation is unlikelyto fully explain the nine percent stock price decline. Romano (1991) documents thatclass action suits produce only around a 3.5 percent decline in stock prices.
22 The intercept (Oo) ranged from -0.123 in 1983 to 0.573 in 1986 and had a pooledvalue (when all years were included in the regression of 0.065. P, ranged in valuefrom -0.172 in 1986 to -0.115 in 1992 and had a pooled value of-0.128. P2 rangedfrom -0.520 in 1991 to -^.732 m 1983 and had a pooled value of-0.583. P3 rangedfrom -0.204 in 1983 to -0,495 in 1988 and had a pooled value of -0.378.
23 The median (average) firm in the sample faced a relative bid-ask spread of 2.9 (4.4)percent prior to day zero. After day zero the relative bid-ask spread increases to 4.8(6.5) percent. The amount of the spread that is predictable is 3.4 (5.6), so of thechange, approximately 1.3 (1.8) percent is attributable to the change in price, vol-ume and the number of market makers with the remaining increase of 0.6 (0.3) per-cent being the residual. Hence an investor purchasing $100 of stock in the median(average) firm after the announcement date is now paying 60 (30) cents more inround-trip transaction costs that cannot be attributed to the change in price, volumeor the number of market makers.
24 Lee, Mucklow and Ready (1993) find that for NYSE intraday data, bid-ask spreadswiden and depths fall in response to abnormally high trading volume. They suggestthis is consistent with specialists using volume to infer the presence of informedtraders. Consistent with Lee et al,, we find that on the announcement day, both
34 Contemporary Accounting Research
volume and spreads increase, suggesting the presence of informed traders. The nega-tive cross-sectional relation between volume and spreads documented by our model,indicates that firms with higher volume are more liquid and hence have lowerspreads. Thus our model controls for the general relation between spreads and vol-ume. As we are interested in the effect of asymmetric information, we do not controlfor a change in the proportion of informed traders (or the positive time-series rela-tion between volume and spreads documented by Lee et al.).
ReferencesAharony, J., C. Lin, and M. P. Loeb. Initial Public Offerings, Accounting Choices, and
Eamings Management. Contemporary Accounting Research (Fall 1993), 61-81.Amihud, Y., and H. Mendelson. Asset Pricing and the Bid-Ask Spread. Journal of
Financial Economics 17 (1986), 223-249.
Asqtiith, P., and L. Meulbroek. An Empirical Investigation of Short Interests. Workingpaper. Harvard University (1993).
Eamings Announcements: The Incremental Role of Predisclosure InformationAsymmetry. Joumal of Accounting and Economics 17 (May 1994), 281-308.
Baiman, S., aiid R. Verrecchia. Eamings and Price-based Compensation Contracts in thePresence of Discretionary Trading. Working paper. University of Pennsylvania(1993).
Benston, G. J., and R. L. Hagerman. Determinants of Bid-asked Spreads in the Over-the-counter Market. Joumal of Financial Economics 1 (1974), 353-364.
Botosan, C. The Impact of Annual Report Disclosure Level on Investor Base and theCost of Capital. Working paper. University of Washington, St. Louis (1995).
and Ownership Structure: The Case of Banking. Joumal of Law & Economics 30(April 1987), 161-180.
Brown, L. D., and J. C. Y. Han. The Impact of Annual Eamings Announcements onConvergence of Beliefs. Accounting Review 67 (October 1992), 862-875.
Brous, P. A. Common Stock Offerings and Earnings Expectations: A Test of the Releaseof Unfavorable Information. Journal of Finance 47 (September 1992), 1517-1536.
Christie, A. A. Aggregation of Test Statistics: An Evaluation of the Evidence onContracting and Size Hypotheses. Joumal of Accounting and Economics 12(January 1990), 15-36.
Cowan, A. R., R. B. Carter, F. H. Dark, and A. K. Singh. Explaining the NYSE ListingChoices of NASDAQ Firms. Financial Management 21 (Winter 1992), 73-86.
DeAngeio, L. H. Auditor Size and Audit Quality. Joumal vf Accounting and Economics.(December 1981), 183-199.
Dechow P. M., R. Sloan, and A. P. Sweeney. Detecting Eamings Management.The Accounting Review 70 (April 1995), 193-225.
DeFond, M. L., and J. Jiambalvo. Incidence and Circumstances of Accounting Errors.Accounting Review 66 (July 1991), 643-655.. Factors Related to Auditor-client Disagreements over Income-IncreasingAccounting Methods. Contemporary Accounting Research (Spring 1993), 415-431.
Duke, J., and H. Hunt III. An Empirical Examination of Debt Covenant Restrictions andAccounting-related Debt Proxies Joumal of Accounting and Economics 12 (January1990,45-63.
Causes and Consequences of Eamings Manipulation 35
Feltham, G. A., J. S. Hughes, and D. A. Simunic. Empirical Assessment of the Impact ofAuditor Quality on the Valuation of New Issues. Journal of Accounting andEconomics 14 (December 1991), 41-53.
Feroz, E. H., K. Park, and V. S. Pastena. The Financial and Market Effects of the SEC'sAccounting £ind Auditing Enforcement Releases. Joumal of Accounting Research 29(Supplement 1991), 107-142.
Frankel, R. M., M. F. McNichols, and G. P. Wilson. Discretionary Disclosure andExternal Financing. The Accounting Review (January 1995), 135-150.
Friedlan, J. M. Accounting Choices of Issuers of Initial Public Offenngs. ContemporaryAccounting Research, (Summer 1994), 1-31.
Greene, W. H. Econometric Analysis. Macmillan Publishing Company, 1993.Healy, P. The Effects of Bonus Schemes on Accounting Decisions. Joumal of
Accounting and Economics 7 (April 1985), 85-107., and K. Palepu. The Effect of Firms' Financial Disclosure Strategies on StockPrices. Accounting Horizons 1 (March 1993), 1-11., K. Palepu and A. P. Sweeney. Do Firms Benefit from Expanded VoluntaryDisclosure. Working paper. Harvard University (1995).
Holthausen, R., and D. Larcker. Board of Directors, Ownership Structure and CEOCompensation. Working paper. University of Penn.sylvania (1993).
Jegadeesh, N., and A. Subrahmanyam. Liquidity Effects of the Introduction of the S&P500 Index Futures Contract on the Underlying Stocks. Journal of Business 66 (April1983), 171-187.
Jensen, M. The Modem Industrial Revolution, Exist, and the Failure of Internal ControlSystems, Journal of Finance. (July 1993), 831-880.
Jones, J. Earnings Management During Import Relief Investigations. Joumal ofAccounting Research 29 (Autumn 1991), 193-228.
Kellogg, I., and L. B. Kellogg. Fraud. Window Dressing, and Negligence in FinancialStatements. Commercial Law Series, McGraw-Hill, 1991.
Kim, O., and R. E. Verrecchia. Market Liquidity and Volume around EarningsAnnouncements. Journal of Accounting and Economics 17 (1994), 41-67.
Lang, M., and R. Lundholm. Cross-Sectional Determinants of Analysts Ratings ofCorporate Disclosures. Journal of Accounting Research 31 (Autumn 1993),246-271.
Lee, C. M. C , B. Mucklow, and M. J. Ready. Spreads, Depths, and the Impact ofEamings Information: An Intraday Analysis. Tlie Review of Financial Studies 6(1993), 345-374.
Lev, B. Information Disclosure Strategy. California Management Review, 34, 4 (Summer1992), 9-33.
Loughran, T., and J. R. Ritter. The Operating Performance of Firms ConductingSeasoned Equity Offerings. Working paper. University of Illinois, Urbana-Champaign. (1994).. The New Issues Puzzle. Joumal of Finance. (1995).
Opler, T., and S. Titman. The Debt-Equity choices: An Analysis of Issuing Firms.Working paper. Ohio State University. (1994).
Merton, R. C. A Simple Model of Capital Market Equilibrium with IncompleteInformation. The Joumal of Finance. (July 1987), 483-510.
National Association of Certified Fraud Examiners, Cooking the Books: What EveryAccountant Should Know about Fraud. NASBA, New York, NY. (1993).
36 Contemporary Accounting Research
Palmrose, Z. Analysis of Auditor Litigation and Audit Service Quality. AccountingReview 63 (January 1988), 55-73.
Pincus, K., W. H. Holder, and T.J. Mock. Reducing the Incidence of Fraudulent FinancialReporting: The Role of the Securities and Exchange Commission. Los Angeles:SEC and Financial Reporting Institute of the University of Southern Califomia(1988),
Press, E,, and J. Weintrop. Accounting-based Constraints in Public and Private DebtAgreements: Their Association with Leverage and Impact on Accounting ChoiceJoumal of Accounting and Economics 12 (January 1990), 65-95.
Rangan, S. Eamings Around Seasoned Equity Offerings: Are They Overstated? Workingpaper. University of Pennsylvania, (1995).
Ritter, J. R. The Long-Run Performance of Initial Public Offerings, Joumal of Finance.46 (March 1991), 3-27.
Romano, R. The Shareholder Suit: Litigation without Foundation? Journai of Law,Economics, & Organization 1 (1991), 55-87.
Rosenstein, S,, and J, G. Wyatt, Outside Directors, Board Independence, and ShareholderWealth, Joumal of Financial Economics 26 (August 1990), 175-191.
Schipper, K. Commentary on eamings management. Accounting Horizons 3 (1989),91-102.
Securities and Exchange Commission. Fifty-first Annual Report bf the SEC PrintingOffice (1989),
Smith, C , and R. Watts. The Investment Opportunity Set and Corporate FinancingDividend and Compensation Policies, Journal of Financial Economics 32 (1992),263-92.
Spiess, D. K., and J. Affieck-Graves. Under-Performance in Long Run Stock RetumsFollowing Seasoned Equity Offerings. Joumal of Financial Economics(forthcoming 1995).
Sweeney, A. P. Debt-covenant Violations and Managers' Accounting Responses. Joumalof Accounting and Economics 17 (May 1994), 281-308.
Teoh, S. H,, T. J. Wong, and G. R. Rao, Incentives and Opportunities for EamingsManagement in Initial Public Offerings, Working paper. University of Michigan,Ann Arbor, (1994)., I. Welch, and T. J. Wong, Eamings Management and the Post-IssueUnderperformance of Seasoned Equity Offerings, Working paper. University ofMichigan, Ann Arbor, (1995).
Watts, R., and J. Zimmerman. Positive Accounting Theory: A Ten Year Perspective.Accounting Review 65 (January 1990), 131-156
Weisbach, M. S. Outside Directors and CEO Tumover. Joumai of Financial Economics(January/March 1988), 431-460,
Zmijewski, M., and R. Hagerman. An Income Strategy Approach to the Positive Theoryof Accounting Standard Setting/Choice. Journal of Accounting and Economics 3(August 1981), 129-149.