Page 1
International Journal on Theoretical and Applied Research in Mechanical Engineering (IJTARME)
_______________________________________________________________________________________________
_______________________________________________________________________________________________
ISSN (Print): 2319-3182, Volume -4, Issue-1, 2015
47
Cavitation Detection in Hydraulic Machines: A Review
1Nihar Thakkar,
2Sanket Chaudhari,
3Chirag Sonvane,
4S V Jain,
5R N Patel,
6V M Bhojawala
1,2,3,4,5,6Institute of Technology, Nirma University, S G Highway, Opp. SGVP, Ahmedabad-382481
Email: [email protected] ,
[email protected] ,
[email protected] ,
[email protected] ,
[email protected] ,
[email protected]
Abstract—Cavitation is the formation of vapour cavities in
a liquid in the low pressure regions of hydraulic machines.
The effects of cavitation are hydraulic viz. low efficiency
due to flow instability and mechanical viz. surface damage,
noise and vibration. Collapsing voids that implode near a
metal surface cause cyclic stress and results in surface
fatigue. Turbines and pumps show declined performance
after few years of operation, as they get severely damaged
due to erosive wear on account of cavitation. In this paper,
different techniques used by several researchers for
cavitation detection like measurement of pressure,
vibration and sound; visual inspection as well as numerical
simulations are presented which may be useful in practical
conditions to minimize the effects of cavitation.
Index Terms—Cavitation, detection, pressure, vibration
I. INTRODUCTION
Whenever the pressure in any turbine part (exit) or pump
part (entry) drops below the vapour pressure, the liquid
boils and large number of small vapour bubbles are
formed. These bubbles, mainly formed on account of low
pressure, are carried by the stream to higher pressure
zones where the vapour condenses and the bubbles
suddenly collapse. This results in the formation of a
cavity and the surrounding liquid rushes to fill it. The
streams of liquid coming from all directions collide at the
center of cavity giving riseto a very high local pressure
[1]. Different stages of cavitation damage and pit
formation are shown in Fig. 1.
II. EFFECTS OF CAVITATION
The effects of cavitation are hydraulic (low efficiency
due to flow instability) and mechanical (surface damage,
noise and vibration). In addition, it may also lead to
surface erosion [2]. It is difficult to avoid cavitation in
hydro turbines but certainly it can be reduced to an
economically acceptable level [3]. The pitting on runner
blades due to cavitation is shown in Fig. 2.
Fig. 1. Stages of pit formation due to cavitation
Fig. 2. Pitting at runner blades due to cavitation
There is a trend to operate the turbines in conditions far
from BEP and cavitation phenomena are more prone to
occur at off design operating conditions. The
combination of both promotes cavitation problems.
Monitoring systems for cavitation detection serve to
avoid harmful situations seem to be the best solution [4].
III. THOMA CAVITATION NUMBER
Prof. D. Thoma suggested a dimensionless number,
called as Thoma‟s cavitation factor „σ‟ [5]. Typical sigma
curve is shown in Fig. 3. It can be seen that as σ
decreases, initially there is no effect on the efficiency.
With further decrease in σ, efficiency first increases then
decreases sharply. Accordingly, critical value of sigma
(σcr) is defined and it is recommended to run the machines
(pump/turbines) above σcr for cavitation free operation.
σ =Hb − Hs
H=
Hatm − Hv − Hs
H (1)
Where, Hbis barometric pressure head in m of water, Hs is
suction pressure at the outlet of reaction turbine, H - net
head on the turbine.
Fig. 3. Cavitation number v/s efficiency
Page 2
International Journal on Theoretical and Applied Research in Mechanical Engineering (IJTARME)
_______________________________________________________________________________________________
_______________________________________________________________________________________________
ISSN (Print): 2319-3182, Volume -4, Issue-1, 2015
48
IV. TYPES OF CAVITATION
Different types of cavitation usually found in different
machines based on their operating conditions are
mentioned here.
A. Travelling Bubbles
Bubbles usually appear around a body from micron-sized
nuclei in low pressure regions of the flow as shown in
Fig. 4. Travelling with the flow, they implode when they
find an adverse pressure gradient. These bubbles are
strongly influenced by the air content of the liquid.
Nevertheless, their erosive power is considered to be
relatively weak [6].
B. Attach Cavities
Cavitation can take the form of macro-cavities that
develops and gets attached on a solid wall placed in the
flow as shown in Fig. 5. Sheet cavitation, is characterized
by thin stable cavities with smooth and transparent
interfaces. At their rear part, the cavity closure presents a
slight and weak pulsation due to the shedding of small
cavitation vortices so that it represents a low risk of
erosion. The attach cavities further disintegrate in either
two forms i.e. cloud cavitation wherein small vapour
bubbles are formed or in ring vortices [6].
C. Vortex Cavitation
Flow regions with concentrated vorticity can develop
cavitation in their central cores due to the low pressures
generated. If the tips of these vapour filled vortices are in
contact with a solid surface they become potentially
erosive since the final collapse of the whole cavity takes
place on them. A typical example of this type of
cavitation can develop if Von Karman vortex-shedding as
shown inFig. 6 occurs at the trailing edge of a hydrofoil
[6].
Fig. 4. Bubble cavitation
Fig. 5. Attach sheet cavitation
Fig. 6.Von-Karman vortex shedding
V. DETECTION TECHNIQUES
There are different techniques for cavitation detection in
hydraulic machines viz. pressure measurement, visual
inspection, vibration measurement, noise analysis,
computational fluid dynamics (CFD) approach etc. These
techniques are used by many researchers for the
cavitation detection in hydraulic machines.
A. Pressure Measurement
The pressure measurement is a technique to determine the
cavitation. When the cavity or bubbles enter the high
pressure zone, they collapse and induce vibration as well
as pressure pulsations. Vibration measurement may not
give conclusive results due to dynamic behavior of
machinery hence for detailed analysis and for verification
pressure measurement technique should be adopted.
Another technique is to carry out the sigma (σ) test i.e. to
study the effects of variation in σ on efficiency. The σ
can be varied by varying the head (H) acting on the
machine.
Escaleret al.[6]carried out experiments on Francis turbine
for pressure measurement with the amplitude
demodulation. Fig. 7,shows the pressure pulsation
against frequency for bubble type cavitation and
no-cavitation flow. As it can be seen that whenever the
pressure waves are generated due to cavitation, high
peaks are obtained in the frequency band.
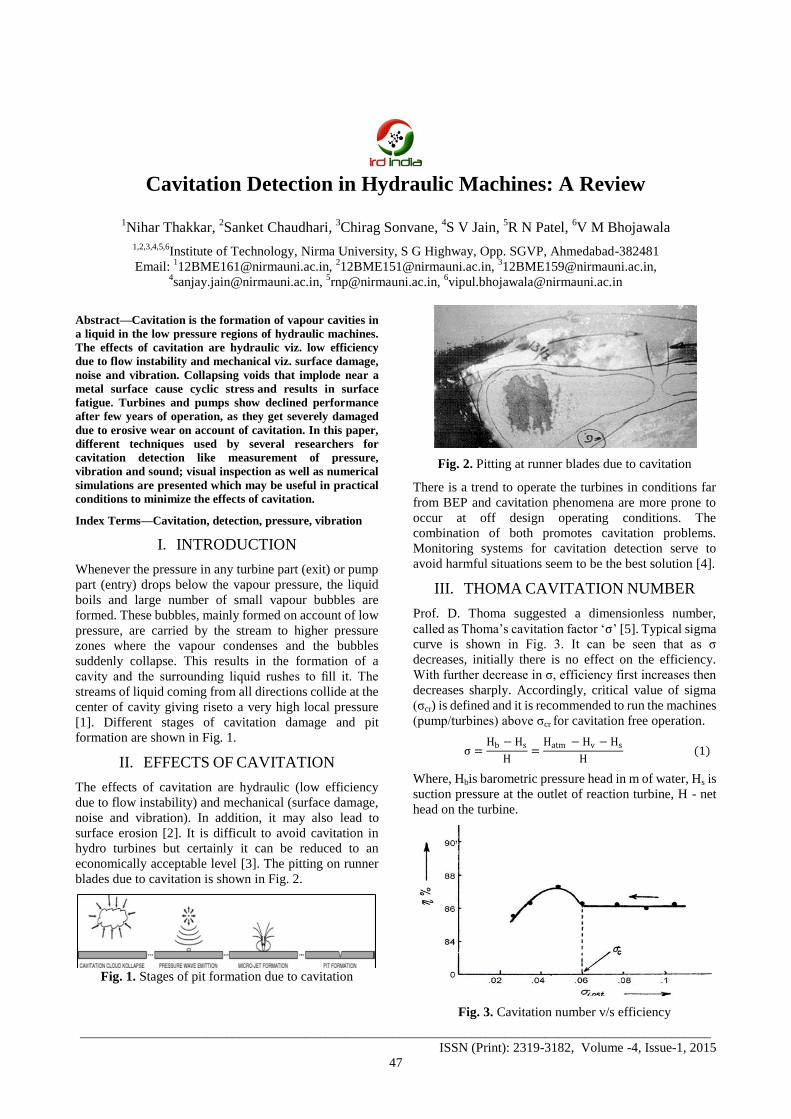
The variation in draft tube pressure at different operating
conditions is shown in Fig. 8. Cavitation is detected in
much lower frequency range as seen in figure. Whenever
bubble type cavitation occurs the peak values are
obtained compared to non-cavitation flow.
Fig. 7.Peak pressure values measured
Page 3
International Journal on Theoretical and Applied Research in Mechanical Engineering (IJTARME)
_______________________________________________________________________________________________
_______________________________________________________________________________________________
ISSN (Print): 2319-3182, Volume -4, Issue-1, 2015
49
Fig. 8.Draft tube pressure at different condition
Schiavello and Visser [7] carried out experimental
investigations on cavitation on pumps and discussed
various net positive suction head required criteria, net
positive suction head available margins and impeller life
expectancy and plotted the same. They also determined
various models to deal with cavitation. Fig 9 shows
various cavitation modes. NPSH curve is shown which is
responsible for significant erosion damage throughout the
whole range of operation. A curve for NPSHR at 3
percent head drop is shown which describes key
cavitation aspects, effects and location.
B. Visual Inspection
Many investigators have provided transparent window in
different parts of the machine to visualize the cavitation.
A small transparent glass window can be fitted near the
drfat tube entry for flow visualization. The use of high
speed frame capturing cameras as well as stroboscopic
light is useful in such studies. Some researchers also
suggest the use of glass draft tube to visualize the draft
tube swirl phenomena as well as the travelling bubble
type cavitation.
Fig. 9.Curves defining cavitation
Grekula and Bark [8] studied the cavitation in Kaplan
turbine with high speed filming, video filming and visual
observations with stroboscopic light. Mainly two types of
cavitation in Kaplan turbine was found by them viz.
travelling bubble and attached cavities. The attach
cavities further shredded into either cloud bubble
cavitation or vortices cavitation. The main reason of
shredding was the Re-Entrant jet as shown in Fig 10 and
its penetrating length. If the penetrating length was small
then it would result in vortex shedding and if the
penetrating length of Re-entrant jet was large it would
result in cloud cavitation. Generally the attach type
cavities was found at the blade leading edge as shown in
Fig 11. This was due to mismatched angle of attack
causing a flow separation close to leading edge.
Travelling bubble and sheet type cavitation was found by
them at blade root as shown in Fig 12. This was mainly
due to reduction in pressure caused due to shape of body
because of fillet as well as mixing of two boundary layers
which causes flow separation and resulted in to low
pressure areas. At the blade tip the cavitating vortices
were formed mainly due to tip clearance flow and
scraping of the boundary layer as shown in Fig 13.
Fig. 10.Re-entrant Jet
Fig. 11.Attach cavity at leading edge
Fig. 12.Cavitation at blade root
Fig. 13.Cavitation at blade tip
Page 4
International Journal on Theoretical and Applied Research in Mechanical Engineering (IJTARME)
_______________________________________________________________________________________________
_______________________________________________________________________________________________
ISSN (Print): 2319-3182, Volume -4, Issue-1, 2015
50
Avellan [9] carried out experiments on centrifugal pumps
and Francis turbine with an observation window to
visualize the cavitation. It was found that in case of
pumps the cavity development depends on the discharge
coefficient according to the relative flow velocity and
incident angle at impeller inlet. At rated discharge
travelling bubble cavitation occurred on suction side of
blades while minimum pressure was observed at impeller
throat. For a lower discharge value, leading edge
cavitation occurred as shown in Fig 14. For a lower value
of σ, cavitation vortices were found runner inlet. Draft
tube swirl observed in Francis turbine using a glass draft
tube as shown in Fig 15.
Siroket al.[10] presented cavitational structures
quantification with aid of computer-aided visualization
method on the model of the Kaplan turbine as shown in
Fig 16.The machine at selected integral turbine
parameters, topological cavitational structures on the
draft side of rotor blade was analyzed by them. High
speed filming along with the stroboscopic light was used
to observe the cavitation phenomena in Kaplan turbine
model.
Fig. 14.Leading edge cavitation at inlet of pump
Fig. 15.Draft tube swirl
Fig. 16.Computer aided visualization
Fig. 17.Cavitation erosion of a runner
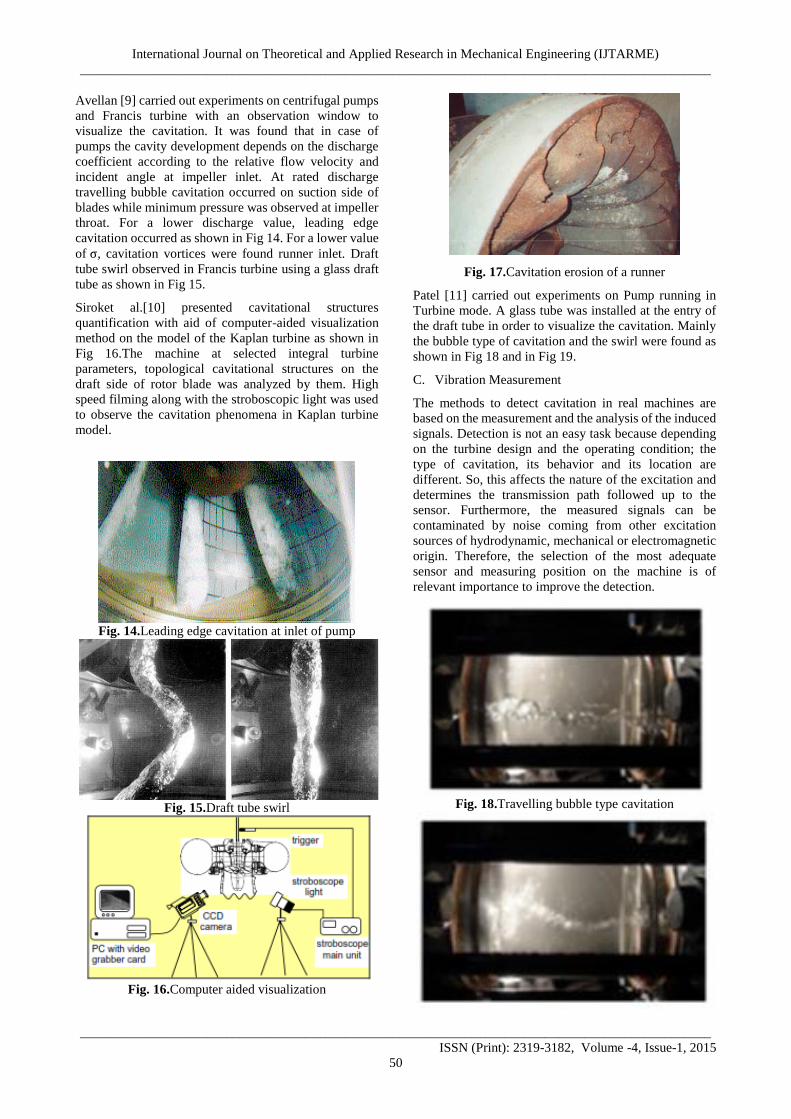
Patel [11] carried out experiments on Pump running in
Turbine mode. A glass tube was installed at the entry of
the draft tube in order to visualize the cavitation. Mainly
the bubble type of cavitation and the swirl were found as
shown in Fig 18 and in Fig 19.
C. Vibration Measurement
The methods to detect cavitation in real machines are
based on the measurement and the analysis of the induced
signals. Detection is not an easy task because depending
on the turbine design and the operating condition; the
type of cavitation, its behavior and its location are
different. So, this affects the nature of the excitation and
determines the transmission path followed up to the
sensor. Furthermore, the measured signals can be
contaminated by noise coming from other excitation
sources of hydrodynamic, mechanical or electromagnetic
origin. Therefore, the selection of the most adequate
sensor and measuring position on the machine is of
relevant importance to improve the detection.
Fig. 18.Travelling bubble type cavitation
Page 5
International Journal on Theoretical and Applied Research in Mechanical Engineering (IJTARME)
_______________________________________________________________________________________________
_______________________________________________________________________________________________
ISSN (Print): 2319-3182, Volume -4, Issue-1, 2015
51
Fig. 19.Vortex rope cavitation
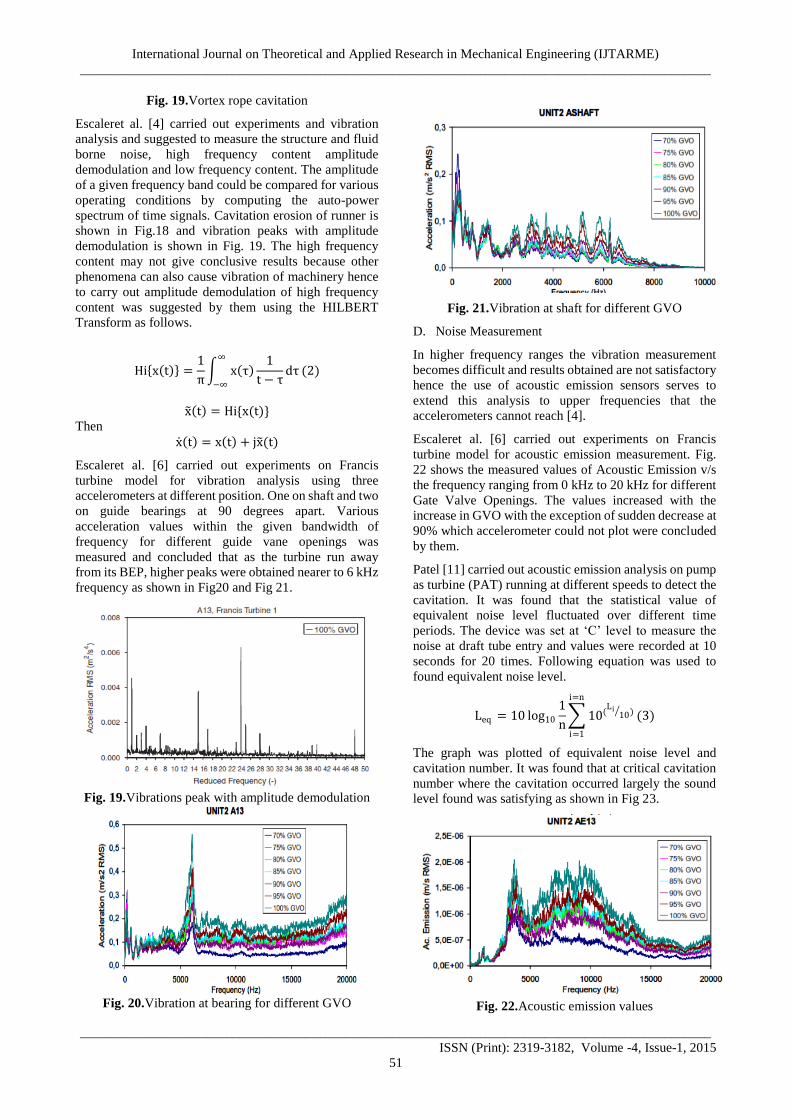
Escaleret al. [4] carried out experiments and vibration
analysis and suggested to measure the structure and fluid
borne noise, high frequency content amplitude
demodulation and low frequency content. The amplitude
of a given frequency band could be compared for various
operating conditions by computing the auto-power
spectrum of time signals. Cavitation erosion of runner is
shown in Fig.18 and vibration peaks with amplitude
demodulation is shown in Fig. 19. The high frequency
content may not give conclusive results because other
phenomena can also cause vibration of machinery hence
to carry out amplitude demodulation of high frequency
content was suggested by them using the HILBERT
Transform as follows.
Hi x t =1
π x τ
1
t − τdτ
∞
−∞
(2)
x t = Hi{x(t)}
Then
x t = x t + jx (t)
Escaleret al. [6] carried out experiments on Francis
turbine model for vibration analysis using three
accelerometers at different position. One on shaft and two
on guide bearings at 90 degrees apart. Various
acceleration values within the given bandwidth of
frequency for different guide vane openings was
measured and concluded that as the turbine run away
from its BEP, higher peaks were obtained nearer to 6 kHz
frequency as shown in Fig20 and Fig 21.
Fig. 19.Vibrations peak with amplitude demodulation
Fig. 20.Vibration at bearing for different GVO
Fig. 21.Vibration at shaft for different GVO
D. Noise Measurement
In higher frequency ranges the vibration measurement
becomes difficult and results obtained are not satisfactory
hence the use of acoustic emission sensors serves to
extend this analysis to upper frequencies that the
accelerometers cannot reach [4].
Escaleret al. [6] carried out experiments on Francis
turbine model for acoustic emission measurement. Fig.
22 shows the measured values of Acoustic Emission v/s
the frequency ranging from 0 kHz to 20 kHz for different
Gate Valve Openings. The values increased with the
increase in GVO with the exception of sudden decrease at
90% which accelerometer could not plot were concluded
by them.
Patel [11] carried out acoustic emission analysis on pump
as turbine (PAT) running at different speeds to detect the
cavitation. It was found that the statistical value of
equivalent noise level fluctuated over different time
periods. The device was set at „C‟ level to measure the
noise at draft tube entry and values were recorded at 10
seconds for 20 times. Following equation was used to
found equivalent noise level.
Leq = 10 log10
1
n 10(
Li10 )
i=n
i=1
(3)
The graph was plotted of equivalent noise level and
cavitation number. It was found that at critical cavitation
number where the cavitation occurred largely the sound
level found was satisfying as shown in Fig 23.
Fig. 22.Acoustic emission values
Page 6
International Journal on Theoretical and Applied Research in Mechanical Engineering (IJTARME)
_______________________________________________________________________________________________
_______________________________________________________________________________________________
ISSN (Print): 2319-3182, Volume -4, Issue-1, 2015
52
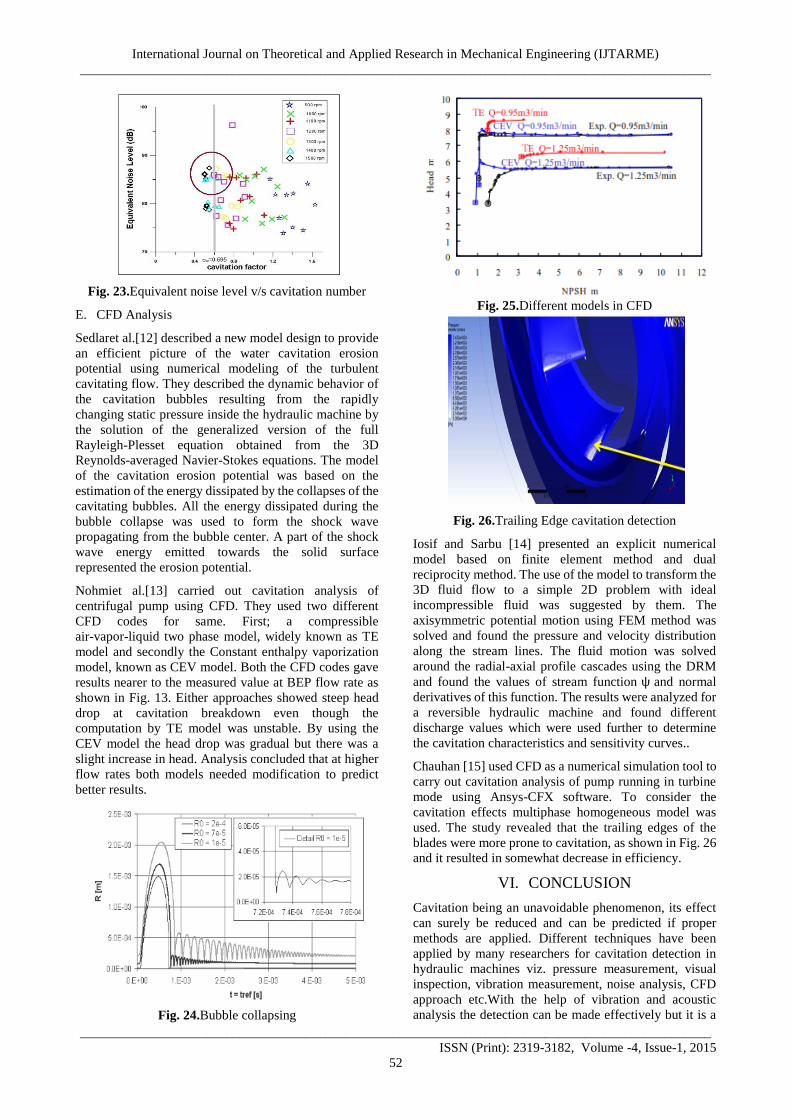
Fig. 23.Equivalent noise level v/s cavitation number
E. CFD Analysis
Sedlaret al.[12] described a new model design to provide
an efficient picture of the water cavitation erosion
potential using numerical modeling of the turbulent
cavitating flow. They described the dynamic behavior of
the cavitation bubbles resulting from the rapidly
changing static pressure inside the hydraulic machine by
the solution of the generalized version of the full
Rayleigh-Plesset equation obtained from the 3D
Reynolds-averaged Navier-Stokes equations. The model
of the cavitation erosion potential was based on the
estimation of the energy dissipated by the collapses of the
cavitating bubbles. All the energy dissipated during the
bubble collapse was used to form the shock wave
propagating from the bubble center. A part of the shock
wave energy emitted towards the solid surface
represented the erosion potential.
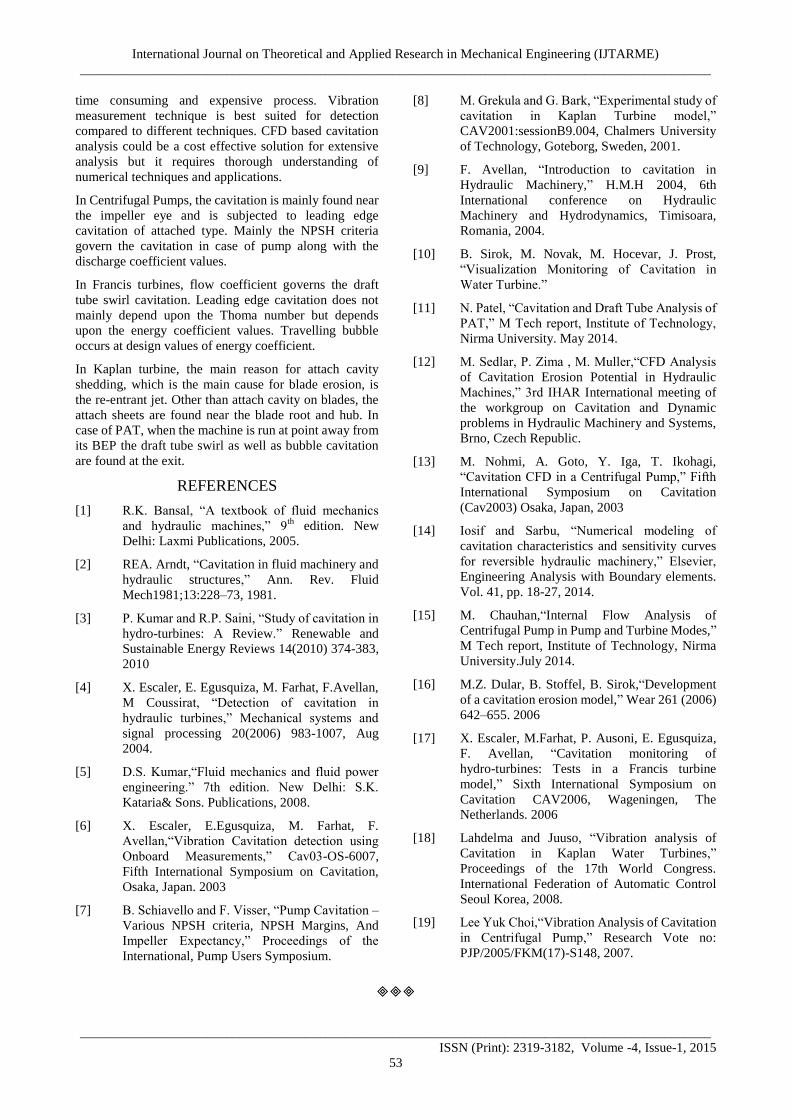
Nohmiet al.[13] carried out cavitation analysis of
centrifugal pump using CFD. They used two different
CFD codes for same. First; a compressible
air-vapor-liquid two phase model, widely known as TE
model and secondly the Constant enthalpy vaporization
model, known as CEV model. Both the CFD codes gave
results nearer to the measured value at BEP flow rate as
shown in Fig. 13. Either approaches showed steep head
drop at cavitation breakdown even though the
computation by TE model was unstable. By using the
CEV model the head drop was gradual but there was a
slight increase in head. Analysis concluded that at higher
flow rates both models needed modification to predict
better results.
Fig. 24.Bubble collapsing
Fig. 25.Different models in CFD
Fig. 26.Trailing Edge cavitation detection
Iosif and Sarbu [14] presented an explicit numerical
model based on finite element method and dual
reciprocity method. The use of the model to transform the
3D fluid flow to a simple 2D problem with ideal
incompressible fluid was suggested by them. The
axisymmetric potential motion using FEM method was
solved and found the pressure and velocity distribution
along the stream lines. The fluid motion was solved
around the radial-axial profile cascades using the DRM
and found the values of stream function ψ and normal
derivatives of this function. The results were analyzed for
a reversible hydraulic machine and found different
discharge values which were used further to determine
the cavitation characteristics and sensitivity curves..
Chauhan [15] used CFD as a numerical simulation tool to
carry out cavitation analysis of pump running in turbine
mode using Ansys-CFX software. To consider the
cavitation effects multiphase homogeneous model was
used. The study revealed that the trailing edges of the
blades were more prone to cavitation, as shown in Fig. 26
and it resulted in somewhat decrease in efficiency.
VI. CONCLUSION
Cavitation being an unavoidable phenomenon, its effect
can surely be reduced and can be predicted if proper
methods are applied. Different techniques have been
applied by many researchers for cavitation detection in
hydraulic machines viz. pressure measurement, visual
inspection, vibration measurement, noise analysis, CFD
approach etc.With the help of vibration and acoustic
analysis the detection can be made effectively but it is a
Page 7
International Journal on Theoretical and Applied Research in Mechanical Engineering (IJTARME)
_______________________________________________________________________________________________
_______________________________________________________________________________________________
ISSN (Print): 2319-3182, Volume -4, Issue-1, 2015
53
time consuming and expensive process. Vibration
measurement technique is best suited for detection
compared to different techniques. CFD based cavitation
analysis could be a cost effective solution for extensive
analysis but it requires thorough understanding of
numerical techniques and applications.
In Centrifugal Pumps, the cavitation is mainly found near
the impeller eye and is subjected to leading edge
cavitation of attached type. Mainly the NPSH criteria
govern the cavitation in case of pump along with the
discharge coefficient values.
In Francis turbines, flow coefficient governs the draft
tube swirl cavitation. Leading edge cavitation does not
mainly depend upon the Thoma number but depends
upon the energy coefficient values. Travelling bubble
occurs at design values of energy coefficient.
In Kaplan turbine, the main reason for attach cavity
shedding, which is the main cause for blade erosion, is
the re-entrant jet. Other than attach cavity on blades, the
attach sheets are found near the blade root and hub. In
case of PAT, when the machine is run at point away from
its BEP the draft tube swirl as well as bubble cavitation
are found at the exit.
REFERENCES
[1] R.K. Bansal, “A textbook of fluid mechanics
and hydraulic machines,” 9th
edition. New
Delhi: Laxmi Publications, 2005.
[2] REA. Arndt, “Cavitation in fluid machinery and
hydraulic structures,” Ann. Rev. Fluid
Mech1981;13:228–73, 1981.
[3] P. Kumar and R.P. Saini, “Study of cavitation in
hydro-turbines: A Review.” Renewable and
Sustainable Energy Reviews 14(2010) 374-383,
2010
[4] X. Escaler, E. Egusquiza, M. Farhat, F.Avellan,
M Coussirat, “Detection of cavitation in
hydraulic turbines,” Mechanical systems and
signal processing 20(2006) 983-1007, Aug
2004.
[5] D.S. Kumar,“Fluid mechanics and fluid power
engineering.” 7th edition. New Delhi: S.K.
Kataria& Sons. Publications, 2008.
[6] X. Escaler, E.Egusquiza, M. Farhat, F.
Avellan,“Vibration Cavitation detection using
Onboard Measurements,” Cav03-OS-6007,
Fifth International Symposium on Cavitation,
Osaka, Japan. 2003
[7] B. Schiavello and F. Visser, “Pump Cavitation –
Various NPSH criteria, NPSH Margins, And
Impeller Expectancy,” Proceedings of the
International, Pump Users Symposium.
[8] M. Grekula and G. Bark, “Experimental study of
cavitation in Kaplan Turbine model,”
CAV2001:sessionB9.004, Chalmers University
of Technology, Goteborg, Sweden, 2001.
[9] F. Avellan, “Introduction to cavitation in
Hydraulic Machinery,” H.M.H 2004, 6th
International conference on Hydraulic
Machinery and Hydrodynamics, Timisoara,
Romania, 2004.
[10] B. Sirok, M. Novak, M. Hocevar, J. Prost,
“Visualization Monitoring of Cavitation in
Water Turbine.”
[11] N. Patel, “Cavitation and Draft Tube Analysis of
PAT,” M Tech report, Institute of Technology,
Nirma University. May 2014.
[12] M. Sedlar, P. Zima , M. Muller,“CFD Analysis
of Cavitation Erosion Potential in Hydraulic
Machines,” 3rd IHAR International meeting of
the workgroup on Cavitation and Dynamic
problems in Hydraulic Machinery and Systems,
Brno, Czech Republic.
[13] M. Nohmi, A. Goto, Y. Iga, T. Ikohagi,
“Cavitation CFD in a Centrifugal Pump,” Fifth
International Symposium on Cavitation
(Cav2003) Osaka, Japan, 2003
[14] Iosif and Sarbu, “Numerical modeling of
cavitation characteristics and sensitivity curves
for reversible hydraulic machinery,” Elsevier,
Engineering Analysis with Boundary elements.
Vol. 41, pp. 18-27, 2014.
[15] M. Chauhan,“Internal Flow Analysis of
Centrifugal Pump in Pump and Turbine Modes,”
M Tech report, Institute of Technology, Nirma
University.July 2014.
[16] M.Z. Dular, B. Stoffel, B. Sirok,“Development
of a cavitation erosion model,” Wear 261 (2006)
642–655. 2006
[17] X. Escaler, M.Farhat, P. Ausoni, E. Egusquiza,
F. Avellan, “Cavitation monitoring of
hydro-turbines: Tests in a Francis turbine
model,” Sixth International Symposium on
Cavitation CAV2006, Wageningen, The
Netherlands. 2006
[18] Lahdelma and Juuso, “Vibration analysis of
Cavitation in Kaplan Water Turbines,”
Proceedings of the 17th World Congress.
International Federation of Automatic Control
Seoul Korea, 2008.
[19] Lee Yuk Choi,“Vibration Analysis of Cavitation
in Centrifugal Pump,” Research Vote no:
PJP/2005/FKM(17)-S148, 2007.