CGIAR Consortium Board Twenty-Sixth meeting CB26-04 Montpellier, France, 20-21 June 2016 CB26-04 For Information Briefing on 2015 CGIAR Research Portfolio Report Purpose: This presentation speaks to the key outcomes and topics that will form the basis for finalization of the 2015 CRP Portfolio Report currently under preparation by the Consortium Office. Board members are asked to consider the material and provide input on key messaging during the planned board session. This document can be shared by CB participants with Centers for input in advance of Board deliberations. Document Category Standard Document
Transcript
CGIAR Consortium Board Twenty-Sixth meeting CB26-04 Montpellier, France, 20-21 June 2016
CB26-04
For Information
Briefing on 2015 CGIAR Research Portfolio Report
Purpose: This presentation speaks to the key outcomes and topics that will form the basis for finalization of the 2015 CRP Portfolio Report currently under preparation by the Consortium Office. Board members are asked to consider the material and provide input on key messaging during the planned board session.
This document can be shared by CB participants with Centers for input in advance of Board deliberations.
Document Category Standard Document
CRP performance monitoring
CCEE
MonitoringEvaluation
CRP Life Cycle
Pro
port
ion
of
rese
arc
h p
ortf
olio
Impact Assessment
CONSORTIUM OFFICE
IEA
IAU
CRP Annual Reports 2012-15
A. KEY MESSAGES (1 ½ page)
B. IMPACT PATHWAY AND INTERMEDIATE DEVELOPMENT OUTCOMES (IDOS) (1/4 page)
C. PROGRESS ALONG THE IMPACT PATHWAY
The CRP should complete Table 1, in Annex 1 and provide a narrative (C.1 to C.3), referring to those indicators from the table in Annex 1 that are relevant to the CRP
C.1 Progress towards outputs ( 2 pages)
C.2 Progress towards the achievement of research outcomes and IDOs ( 2 pages)
C.3 Progress towards Impact (1/4 page)
D. GENDER RESEARCH ACHIEVEMENTS (1 page)
E. PARTNERSHIPS BUILDING ACHIEVEMENTS (1 page)
F. CAPACITY BUILDING (1/2 page)
G. RISK MANAGEMENT (less than 1/2 page)
H. LESSONS LEARNED (1 page)
I. CRP FINANCIAL REPORT (L series, 9 Excel files)
CRP Annual Reports 2012-15
• KNOWLEDGE, TOOLS, DATA (12)
• CAPACITY ENHANCEMENT AND INNOVATION PLATFORMS (5)
• TECHNOLOGIES/PRACTICES IN VARIOUS STAGES OF
DEVELOPMENT (10)
• POLICIES IN VARIOUS STAGES OF DEVELOPMENT (5)
• OUTCOMES ON THE GROUND (2)
34 indicators in Table 1 / Annex 1
Type 1 CRPs: GRiSP, MAIZE and WHEAT
Powerful breeding pipeline (2 FPs) and use of pre-breeding + modern technologies to speed up and step up the breeding of improved varieties of the three cereals
• High throughput genomic characterization (eg old-Mexican wheat landraces)
• Key genes/QTLs identification and characterization (wheat ‘magic’ Lr67 involved in multiple disease resistance, QHIR for doubled haploids induction rate in maize
• Germplasm rescue and genomic characterization (30,000 wheat accessions from ICARDA’s Syrian genebank to new Morocco & Lebanon genebanks (W1 funded)
• Precision phenotyping platform (3 new PWPPs in Tunisia, Uruguay, Sudan)
• Etc...
Publications: GRiSP with 289 ISI papers, more than 10% with impact factor up to 5 (e.g. Nature family); MAIZE 83 papers w/ IF (from 108) and WHEAT with 167 papers
International standards for agronomic practices (eg rice cultivation with quantitative performance indicators)
New improved varieties released: GRiSP (70), MAIZE (64) and WHEAT (73)
Progress along the IP (outputs) / CRP AR 2015
Thinking out of the box... MAIZE AR 2014-15
Type 1 CRPs: GRiSP, MAIZE and WHEAT
Established partnerships building achievements w/ strategic partners for upstream and downstream R4D activities (JIRCAS/BNI consortium in wheat, MAGNET w/ WUR, IWYP ) and w/ other CRPs (Partnership for Economic Policy w/ PIM & MAIZE in Kenya, GENNOVATE on gender norms & Ag innovation -11 CRPs, etc...)
Strategic use of W1-2 funding
• new resistances against emerging diseases in maize such as the Tar Spot Complex (TSC) or the maize streak virus (Msv1), or extend the MLN program
• key partnerships for climate decision tool for maize (eg Nutrient Expert) or remote sensing support for yield estimation and harvesting decision (e.g. unmanned aerial vehicles).
• WHEAT to increase socioeconomics capacity; unlock genetic diversity; identify and characterize disease resistance genes; study trajectories and trade-offs for sustainable intensification; study gender in wheat-based cropping systems
=> Well-balanced R4D pipeline from discovery to scaling
Progress along the IP (outcomes) / CRP AR 2015
Type 1 CRPs: GRiSP, MAIZE and WHEAT
Intermediate users:
• MAIZE: W1-2 funding, five MLN-tolerant hybrids were released during 2013-2015 in Kenya, Tanzania, and Uganda; national partners multiplying seed.
• WHEAT: partnership with the Ethiopian Institute of Agricultural Research (EIAR) to develop, release, multiply, and spread seed of improved, disease resistant wheat varieties: 80t of Kingbird seed available for farm demonstrations and scaling up (col w/ Kenya Agricultural & Livestock Research Organization, KALRO); SARD-SC project funded by (AfDB), mobilizing a fast-track seed multiplication program that has distributed 58t of improved seed to 1,600 Nigerian farmers.
• GRiSP: breeding lines and improved varieties up taken by researchers and breeders in Africa, South America and South Asia through the Hybrid Rice Development Consortium (4920 lines)
Hybrid Rice Development Consortium (HRDC)
End of ADB
project
HRDC Formed
38 members
HRDC w/ 68 public & private members
Kindly provided by Dr. Achim Dobermann (IRRI)
4920 lines in 2015
Progress along the IP (outcomes) / CRP AR 2015
Type 1 CRPs: GRiSP, MAIZE and WHEAT
End users
• GRiSP: 183,000t of seed distributed by partners to farmers in South Asia. An estimated surface of 5,75 million hectares potentially covered with improved rice coming from different key projects = Green Super Rice 2,1m Ha, STRASA 3,05m Ha, CSISA 0,65m Ha
• MAIZE: DTMA varieties (30 new in 2015) w/ 4 varieties occupied >100,000 ha, 27 varieties each occupying >10,000 ha, and 19 varieties each occupying >5,000 ha. An estimated 2.3 million hectares were planted to these varieties in target countries during 2015, benefiting 5.7 million households.
Seed production in 2015 (50,000t?)
# of NARS involved in seed production (13?)
# of stakeholders adopting the new varieties: cooperatives, regional , national, SMEs, larger international companies (118?)
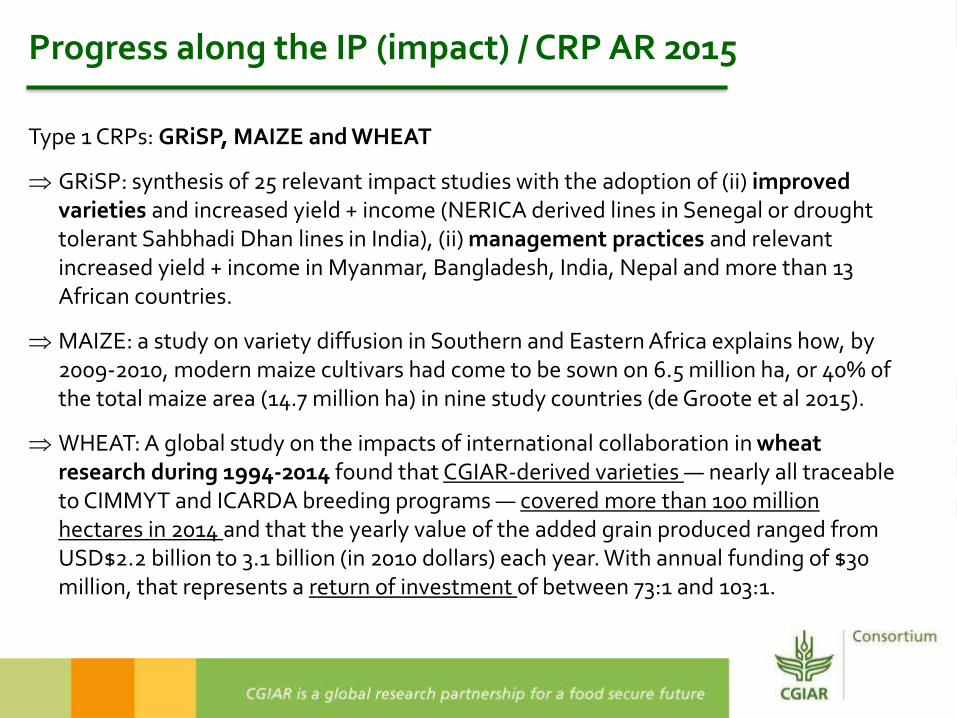
GRiSP: synthesis of 25 relevant impact studies with the adoption of (ii) improved varieties and increased yield + income (NERICA derived lines in Senegal or drought tolerant Sahbhadi Dhan lines in India), (ii) management practices and relevant increased yield + income in Myanmar, Bangladesh, India, Nepal and more than 13 African countries.
MAIZE: a study on variety diffusion in Southern and Eastern Africa explains how, by 2009-2010, modern maize cultivars had come to be sown on 6.5 million ha, or 40% of the total maize area (14.7 million ha) in nine study countries (de Groote et al 2015).
WHEAT: A global study on the impacts of international collaboration in wheat research during 1994-2014 found that CGIAR-derived varieties — nearly all traceable to CIMMYT and ICARDA breeding programs — covered more than 100 million hectares in 2014 and that the yearly value of the added grain produced ranged from USD$2.2 billion to 3.1 billion (in 2010 dollars) each year. With annual funding of $30 million, that represents a return of investment of between 73:1 and 103:1.
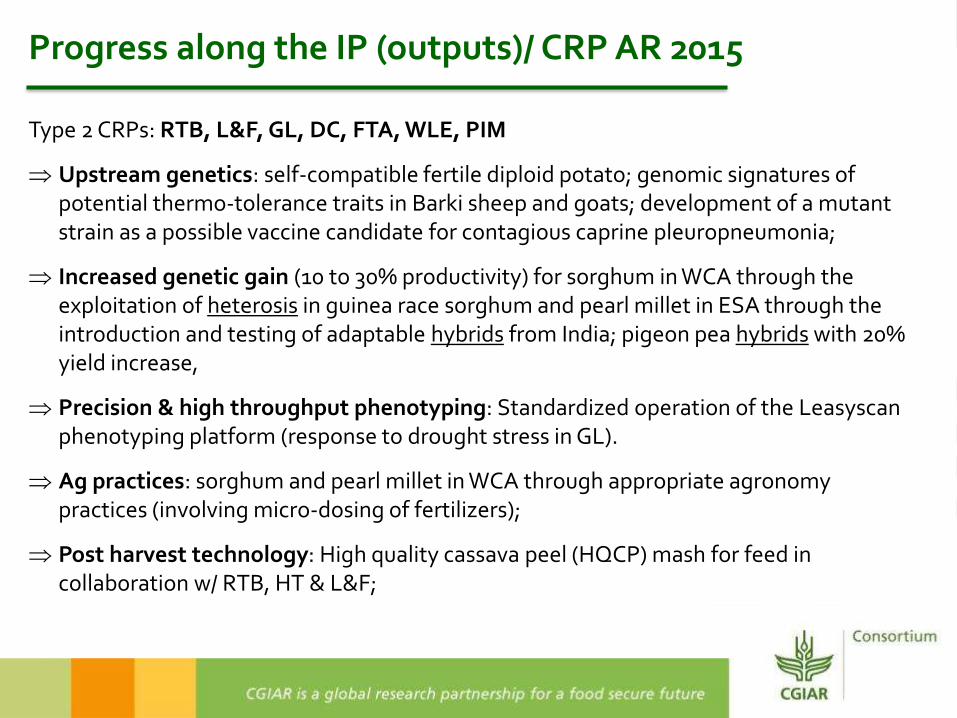
Type 2 CRPs: RTB, L&F, GL, DC, FTA, WLE, PIM
Upstream genetics: self-compatible fertile diploid potato; genomic signatures of potential thermo-tolerance traits in Barki sheep and goats; development of a mutant strain as a possible vaccine candidate for contagious caprine pleuropneumonia;
Increased genetic gain (10 to 30% productivity) for sorghum in WCA through the exploitation of heterosis in guinea race sorghum and pearl millet in ESA through the introduction and testing of adaptable hybrids from India; pigeon pea hybrids with 20% yield increase,
Precision & high throughput phenotyping: Standardized operation of the Leasyscanphenotyping platform (response to drought stress in GL).
Ag practices: sorghum and pearl millet in WCA through appropriate agronomy practices (involving micro-dosing of fertilizers);
Post harvest technology: High quality cassava peel (HQCP) mash for feed in collaboration w/ RTB, HT & L&F;
Progress along the IP (outputs)/ CRP AR 2015
Type 2 CRPs: RTB, L&F, GL, DC, FTA, WLE, PIM
Strategic use of W1 fund: decentralization plan of ICARDA (>900K€), barley programs have been implemented successfully; the satellite and shuttle breeding stations at Terbol in Lebanon, Marchouch and Allal Tazi in Morocco, Sanliurfa & Ankara in Turkey
Key publications: (1) FTA paper downloaded 2,969 times on “Strengthening the resiliency of dryland forest-based livelihoods in Ethiopia and South Sudan...”; (2) PIM book “Economics of land degradation and improvement – A global assessment for sustainable development” downloaded 38,000 times, and contributed to the debate on land degradation, including the process around the 15th SDG; (3)
Tools: (1) MESH is a model available on the WLE’s website that depicts different levels of ecosystem services under different land use scenarios at the landscape scale; (2) PIM’s “Tenure box” framework for examining property rights (in terms of both the rights-holder and the bundles of rights that they hold) presented at the World Bank Conference on Land and Poverty; (3) RBM database to monitor FTA progress allows to capture through a simple traffic light the overall achievements and impacts of the CRP
Progress along the IP (outputs)/ CRP AR 2015
Type 2 CRPs: RTB, L&F, GL, DC, FTA, WLE, PIM
Intermediate users:
• Strategy for genetic improvement of small-ruminants in low-input systems based on community based best practices prioritized by the Ethiopian govt. as a component of the Second Growth and Transformation plan.
• A total of 353 sets of international barely nurseries were distributed by DC upon Terbol and Sanliurfa, to 54 collaborators across 33 countries
• In barley, 21.6t of breeder seed, 30.7t of pre-basic seed and 48.2t of basic seed were produced by EIAR and RARIs in Ethiopia. In Morocco, 11t of breeder seed and 23.2 t of pre-basic seed were produced. In Iran, 7.9t of breeder seed, 77.9t of pre-basic and 438.3t of basic seed was produced by DARI.
• In India, a total of 1309 lines of winter barley were multiplied to produce 11.2 t of seed for international nurseries.
• Under the post-rainy sorghum 'Seed Consortium' established by ICRISAT and its partners, 1000 t seed of improved varieties were sold by Maharashtra State Seeds Corporation, meeting the needs of 100,000 farmers.
Progress along the IP (outcomes)/ CRP AR 2015
Breeding pipeline & seed delivery (International Conference on Pulses, Morocco)
Seed production
Seed Quality Control
Pathogen detection
Germination, vigor
testing
Seed lots homogeneity
Packaging
Logistic for seed storage
Logistic for distribution
Services post-delivery
Genetic Diversity
Seed System
Variety Improvement
Trait Discovery
=> Implementers /
developers /
technicians
Urgent need for sustainable Seed Systems
=> Different models
VBSE: Village Based Seed Enterprise; egcowpea, chickpea in India
Seed consortium including farmers cooperatives, NGOs, CGIAR, NARS, development agencies
Innovation Platforms
Agribusiness Village Resource Centers
=> Funding support ?
Type 2 CRPs: RTB, L&F, GL, DC, FTA, WLE, PIM.
In Bangladesh, 59 hatcheries now multiply and disseminate improved tilapia, and 78 semi-automated feed mills are producing more than 500t of feed to small farmers (AAS).
GL: (1) deployment in India and Africa of 705 t of pigeon pea hybrid seed was produced in 2015 to cover 150,000 ha (or 270,000 ha please clarify as requested above).; (2) deployment of bean seeds for 181,806 ha based on 6 African countries data.
RTB: (1) Achieving impacts on woman and child health by combining orange-fleshed sweet potato (OFSP) promotion with health services (“Mama SASHA”); (2) the three-generation (3G) potato seed multiplication strategy in Kenya, Rwanda, and Uganda where more than 15,000 smallholder gained knowledge and skills on potato production technologies and best practices, and saw average yields increase by 20%.
Progress along the IP (outcomes)/ CRP AR 2015
Type 2 CRPs: RTB, L&F, GL, DC, FTA, WLE, PIM.
FTA : (1) FTA has followed up to implement the Indonesian National Carbon Accounting System which was launched at the Global Landscape Forum in Paris; (2) World Vision, REST and Caritas implemented dryland development encompassing over a hundred thousand households in Ethiopia and Kenya thanks to FTA.
WLE: (1) In Ethiopia rehabilitating degraded landscapes in highlands is a local priority. WLE has been working within the Yewol watershed, providing integrated watershed management options that have reached an estimated 15,000 beneficiaries; (2) development of a solar water pump system for small scale farmers in India, which they introduced along with the possibility for farmers to sell to the local utility company their surplus solar energy
PIM: (1) Work on improving value-chains: 5Capitals (a tool for assessing the poverty impacts of value chain development produced by ICRAF and Bioversity International) and (2) LINK (a guide on inclusive business models involving smallholders developed by CIAT) are being used are NOGs, ministries and Unilever to improve smallholder value chains.
Progress along the IP (outcomes)/ CRP AR 2015
Type 2 CRPs: RTB, L&F, GL, DC, FTA, WLE, PIM
An impact assessment of the fish value chain in Egypt, the IEIDAS project (L&F), provided insights into changes in yields and profits of fish farmers as a result of training in best practices and adoption of the Abbassa strain of tilapia.
GL improving nutrition security of the rural population in Bangladesh thanks to the scale out of novel lentil cultivars with improved yields.
An FTA impact assessment in conjunction with a contribution analysis reported last year estimated that sustainable forest management conserved around 1.3 million metric tons of carbon in its first five years of implementation in Cameroon.
IFPRI’s analysis (PIM) of land-use change associated with the biofuel policies of the European Union resulted in reduction of the biofuel mandate to 7% from the prior level of 10%. The reform will reduce CO2 emission by 13 million tons by 2020 due to avoided land-use change in developing countries, with an estimated 800,000 hectares of cropland saved annually from conversion to biofuel production.
Progress along the IP (impact)/ CRP AR 2015
Type 3 CRPs: DS, AAS, HT, CCAFS , A4NH
New methods, databases, tools, models, manuals, maps:
• Global Nutrition Report 2015 (A4NH);
• CCAFS contributed to the WB-IFAD-FAO Gender Sourcebook Module on Gender and CSA.
• Synthetic OA paper on case studies on the multi-stakeholder Innovation Platforms for 3 countries; Rwanda, DRC, Burundi (HT);
• 12 ISI publications and tools and methods focussed on improving human nutrition through the use of small fish in diets (AAS);
• Gender Guidelines for Biophysical Researchers; six studies on gender-responsive extension services in India and in West and Eastern Africa (DS).
• Cases studies, e.g. “Understanding farm trajectories and development pathways: Two decades of change in southern Mali” (DS)
Progress along the IP (outputs)/ CRP AR 2015
Type 3 CRPs: DS, AAS, HT, CCAFS , A4NH
Linkages with national and international institutions and programs:
• European Parliament (Economics of Land Degradation), UNCCD, COP (DS).
• HT in Rwanda, the Cyumba IP, set up by the Rwanda Agricultural Board with support from FARA, has mobilized 1,322 members with a total of 670 ha dedicated to wheat production and Phembe Wheat milling factory
Global conferences: Integrated Systems Research for SI in Smallholder Agriculture gathering 120 multi-disciplinary participants on system research (HT)
Value chain framework and tools by A4NH informing new research: East Africa for beans and amaranth; grains, tubers, vegetables, dairy and fish in Bangladesh, Indonesia, Laos, Nicaragua and Rwanda.
Progress along the IP (outputs)/ CRP AR 2015
Type 3 CRPs: DS, AAS, HT, CCAFS , A4NH
In Nicaragua, over 700 households in the research sites have implemented novel practices and technologies as a result of the HT projects on decision-making tools, soil fertility, and coffee certification, leading to increased sustainable production and higher income through better market access.
Program implementers (BRAC & HKI) use A4NH evidence in program development
AAS improved practices on 105,000 ha of aquaculture and improved horticulture in southern Bangladesh. Total program outcome may be larger as not measured in Cambodia, Solomon Islands or Zambia (indicator #33).
CCAFS scaling climate-smart dairy practices in Kenya among 600,000 farmers, members of six producers’ organizations.
Through multiple crop and statistical models CCAFS has produced new index insurance protecting a million Maharashtra farmers from extreme rainfall applied by several insurance companies and Maharashtra state Dept of Ag.
CCAFS and partner splayed a major role in the success of COP21
Progress along the IP (outcomes)/ CRP AR 2015
Type 3 CRPs: DS, AAS, HT, CCAFS , A4NH
Biofortified A4NH crops delivered through partners to almost 2 million households
HT toolkit for observation and decision-making in cacao and coffee agroforestry systems is currently being applied by local development organizations and cooperatives to improve system management, as well as organizational learning and improved targeting of interventions by local organizations
Around 550,000 farmers who applied improved AAS aquaculture technologies in Bangladesh (around one fifth of whom, 121,000, are women). This stems from substantial legacy research and bilateral funding in this country and builds on the major impact of the program reported in 2014
Climate-Smart Villages (CSVs) model established by CCAFS in 20 countries is now being scaled out by partners, with two states in India planning for 1000 villages, and international NGO partners now using the model in Nepal and West Africa.
CCAFS impact in India (0.5M Has) under laser land levelling benefits or Senegal with new seasonal climate forecasts reaching 7M HHs
Progress along the IP (impacts)/ CRP AR 2015
CRP Portfolio Report 2014
?
2015
Lessons learned CRP AR 2015
ToC as a proactive learning process facilitating (1) a clear understanding and dynamic use of program’s ToC for increased alignment w/ flagships and projects; (2) efficient implementation of RBM (CCAFS, RTB, HT, MAIZE, WHEAT, WLE, etc.)
Need to increase interdisciplinary and holistic approaches (GRiSP) / Cross-CRP collaborations?
Need to promote institutional capacity development (GRiSP) / CapDev ?
Need to enhance CGIAR institutional capacity in agribusiness approaches in value chains (L&F) / scouting disruptive technologies (GS, Reverse Breeding, free marker GMO, predictive model, ...), Ag business opportunities ?
Need to improved M&E capacity for the overall program (L&F; AAS) and a software system for planning and reporting (GL) / MELCoP
Invitation to other Centers of excellence to lead or co-lead new areas (A4NH)
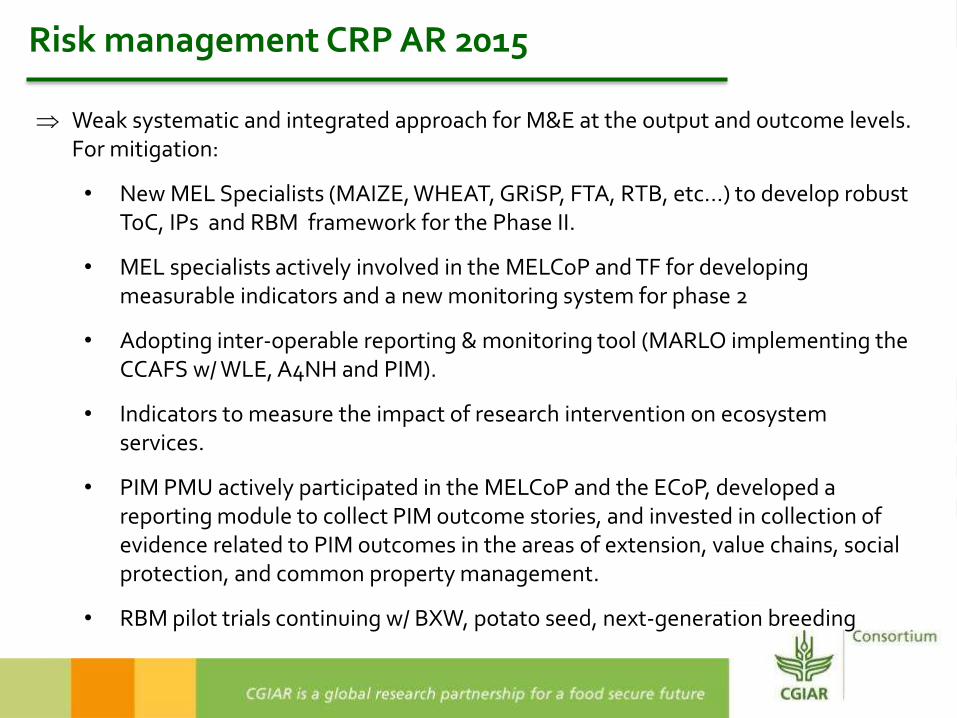
Risk management CRP AR 2015
Weak systematic and integrated approach for M&E at the output and outcome levels. For mitigation:
• New MEL Specialists (MAIZE, WHEAT, GRiSP, FTA, RTB, etc...) to develop robust ToC, IPs and RBM framework for the Phase II.
• MEL specialists actively involved in the MELCoP and TF for developing measurable indicators and a new monitoring system for phase 2
• Adopting inter-operable reporting & monitoring tool (MARLO implementing the CCAFS w/ WLE, A4NH and PIM).
• Indicators to measure the impact of research intervention on ecosystem services.
• PIM PMU actively participated in the MELCoP and the ECoP, developed a reporting module to collect PIM outcome stories, and invested in collection of evidence related to PIM outcomes in the areas of extension, value chains, social protection, and common property management.
Tracking impact and establishing indicators and targets for results (PIM): publication on best practice methods in impact assessment of policy-oriented research.
Low priority setting : congruence analysis for RTB crops to determine the expected impact that investment into the principle research options for each crop would generate in terms of the key variables of adopted area, economic benefits (internal rate of return, net present value), poverty reduction, and number of beneficiaries reached
Financial risk:
(1) ensuring a steady pipeline of bilateral resource mobilization to avoid fluctuating budgets (GL, DC);
(2) W1-2 prioritization revising the 2015 outputs in line with the budget cuts (HT);
(3) introducing a performance element to the more strategic allocation of W1-2 funds for FTA;
(4) Avoiding spreading resources too thinly at a time when the program was facing cuts and closure, AAS research focusing preferentially on hubs in Bangladesh, Zambia and Solomon Islands
CRP Portfolio Report 2014 to 2015
?
2015
4th review CRP Annual Reports (2012-15)
• quality reporting
• + structured CRPs (internal reorganization)
• realistic & dynamic ToC overtime (from Extension Proposals to draft-, pre- and full proposals)
• visibility on progress towards Impact Pathways
• visibility on lessons learned, risks & mitigation
• visibility at the portfolio level: harmonized structure (FPs, CoAs); stability in template format
• 2015: increased progress towards all 4 SLOs
Indicator #9 Number of publications in ISI journals produced by CRP
Increased number of ISI publications from 2014 to 2015 (+10%)
A classification based on ISI impact index (eg GRiSP10% with impact factor up to 5 / Nature family papers for CCAFs, GRiSP)
Web-link to the complete list of papers
Present a summary on the CRP research staff contributing (numbers, grades, gender; see FTA AR)
2014 2015
GRiSP 218 289
FTA 328 281
WHEAT 107 167
A4NH 137 147
WLE 150 141
PIM 98 129
CCAFS 114 119
RTB 92 103
DS 72 83
MAIZE 64 83
GL 108 82
L&F 48 70
DC 47 49
HT 44 36
AAS 49 32
TOTAL 1676 1811
Indicator #9 Number of publications in ISI journals produced by CRP
Funding acknowledgement (W1-2, W3, bilateral) is suitable with the aim of mapping the publications to CRPs’ contribution
Quality of Science (from CRP Performance Assessment; MELCoP)
Dimensions in QoS (from IEA workshop on evaluating QoS)
34 indicators of the Annual Report (Table 1 / Annex 1)
TECHNOLOGIES/PRACTICES IN VARIOUS STAGES OF DEVELOPMENT
18. Number of technologies/NRM practices under research in the CRP (Phase I)
=> Novel genes, promoters or QTLs with known major effect(s) on specific traits, molecular markers, breeding or lines with improved traits (NILs, RILs, transgenic, …), DHLs, animal lines with specific traits
23. Number of technologies /NRM practices field tested (phase II)
=> Superior genotypes, breeds, lines, crosses or hybrids with improved traits, transgenic lines, improved variety for which certification is being sought
27. Number of technologies /NRM practices released by public and private sector partners globally (phase III)
=> Improved varieties, cultivar, lines or breeds with various desirable traits, management practices, ready to be dessiminated
TECHNOLOGIES / PRACTICES IN VARIOUS STAGES OF DEVELOPMENT
18. Number of technologies/NRM practices under research in the CRP (Phase I)
23. Number of technologies /NRM practices field tested (phase II)
27. Number of technologies /NRM practices released by public and private sector partners globally (phase III)
0
50000
100000
150000
200000
250000
300000
350000
#18 #23 #27
2015 #18 #23 #27
WHEAT 322569 3599 73
GRiSP 100000 7500 86
MAIZE 47736 2855 170
RTB 60 60 49
DC 2500 700 8
GL 53 60 57
L&F 27 17 4
Only 2 outcome-based indicators (Table 1 / Annex 1)
OUTCOMES ON THE GROUND
33. Number of hectares under improved technologies or management practices as a result of CRP research
34. Number of farmers and others who have applied new technologies or management practices as a result of CRP research
Number of hectares under improved technologies or management practices as a result of CRP research
From CGIAR Research Programs (CRP) Annual Reports 2013, 2014 and 2015
CRPs #33 (Number of hectares...) (a)
2013 2014 2015
A4NH 242,133 7,408 (?) 11,290 (?)
AAS 242,133 135,000 105,450
CCAFS 121,000 185,000 587,000
Dryland Cereals 80,000 297,800 165,000
Dryland Systems 4,000,000 7,525,065 7,157,631
FTA 196,500,000 65,000,000 > 3,000,000
Grain Legumes 253,224 4,763,000 451,806
GRiSP 4,763,000 4,770,000 4,770,000
HumidTropics 12,000 430,000 450,000
Livestock & Fish 331,070 632,229 23,648
MAIZE 417,000 2,305,462 7,785,185
PIM - - -
RTB 398,000 430,000 430,000
WHEAT 1,650,000 4,845,000 7,000,000
WLE 15,471,050 2,096,240 2,499,035
Total 224,480,610 93,422,204 34,436,045
Number of farmers and others who have applied new technologies or management practices...
From CGIAR Research Programs (CRP) Annual Reports 2013, 2014 and 2015
CRPs #34 (Number of farmers reached...)
2013 2014 2015
A4NH 645,075 1,089,139 1,936,245
AAS 584,853 500,000 553,000
CCAFS 2,000,000 3,900,000 3,869,000
Dryland Cereals 70,000 377,000 140,000
Dryland Systems 4,000,000 (?) 469,348 492,654
FTA 870,000 2,000,000 2,250 (?)
Grain Legumes 1,717,249 2,451,917 1,932,309
GRiSP 7,741,000 7,741,000 7,774,000
HumidTropics 94,466 91,000 92,000
Livestock & Fish 24,000 488,355 31,854
MAIZE 1,100,000 4,089,000 18,407,175
PIM - - -
RTB 1,180,000 1,180,000 1,720,000
WHEAT 2,802,000 10,310,000 7,000,000
WLE 35,000 205,946 125,045
Total 22,863,643 34,892,705 44,075,532
Result question 1: how has the program contributed to increase in food production?Indicators directly related to target:• The amount of food produced in metric tons• The number of farmers (m/f) or households with increased food production and labour productivity
Result question 2: how has the program contributed to sustainable use of land, water and/or energy?Indicators directly related to target:• The number of farmers (m/f) with increased output per unit natural resource input (including water efficiency)• The amount of land (in hectares) more sustainably managed• The number of farmers (m/f) that is less vulnerable to (climate) stresses and shocksIndicators related to enabling factors (not exhaustive):• The number of farmers (m/f) with access to climate- and environment-smart technologies• The amount of land (in hectares) under integrated landscape management arrangements• The number of farmers (m/f) that base their production systems on long term (climate/environmental) change
scenarios
Result question 3: how has the program contributed to availability of nutritious food?Indicators directly related to target:• (Decrease in) the number of people (m/f) suffering from chronic hunger; and/or the number of people (m/f)
that suffered from hunger for a shorter period of time (months a year with a food shortage) • Decrease in the number of malnourished children under the age of 5 (wasting and/or stunting); and/or the
number of people (m/f) that has improved dietary diversity (increase in the number out of the 12 food groups that has been consumed)
• Decrease in number of people (m/f) that are vulnerable to food crises, i.e. potentially depend on food assistance
A recent example of a W2 donor’s expectations for reporting
Result question 3 (2nd part) : how has the program contributed to availability of nutritious food?Indicators related to enabling factors (not exhaustive):• The amount of food qualitatively improved and made accessible• The number of malnourished children (m/f) reached with nutritious food• The number of malnourished people (m/f) reached with food assistance
Result question 4: how has the program contributed to inclusive business activity and trade?Indicators directly related to target:• Increase in employment in number of jobs (m/f) created in the agriculture and food sector• Number of people (m/f) or households with an increased income in the agriculture and food sectorIndicators related to enabling factors (not exhaustive):• The degree of participation of women in programs (functioning as an indicator of access of women to means of production) and/or farmers’ associations • The number of farmers (m/f) that obtained land tenure security• The number of farmers (m/f) with increased access to knowledge, inputs, finance and/or markets
Result question 5: how has the program contributed to increase in international investment and trade?Indicators directly related to target:• Private (co-)investment realized in the agriculture and food sector
A recent example of a W2 donor’s expectations for reporting
Inputs to the Task Force on Indicators (Ahmed Kablan / USAID)31st May 2016
USAID need to report on the Feed the Future indicators to get funding approved by their Congress.
Opportunities:
• Handbook was written pre-SDGs and need to be aligned and updated accordingly.
• Feed the Future Phase 1 is coming to an end and there is a possibility to up-date the set of indicators.
• Policy indicators have been broken down to stage 1-5, changed definition
• They want to revisit the set of indicators in a couple of years => Phased approach to develop the new set of indicators;
• They would welcome suggestions of good indicators on Science & Technology, Innovation and Partnership (STIP indicators) and research outputs, reliability from the lab to the field
• Linking them to our open data and access working group to see our protocol for data collection and sharing