35
Jeff Cioletti Brian Lechner Craft by the Numbers
| Date post: | 18-Jan-2017 |
| Category: |
Small Business & Entrepreneurship |
| Upload: | craftbev |
| View: | 69 times |
| Download: | 2 times |

Jeff Cioletti
Brian Lechner
Craft by the Numbers
Nielsen Measures WhatPeople Watch and Buy
What - Where - When - Why - Who
Now available! AvailableOct. 5, 2016!
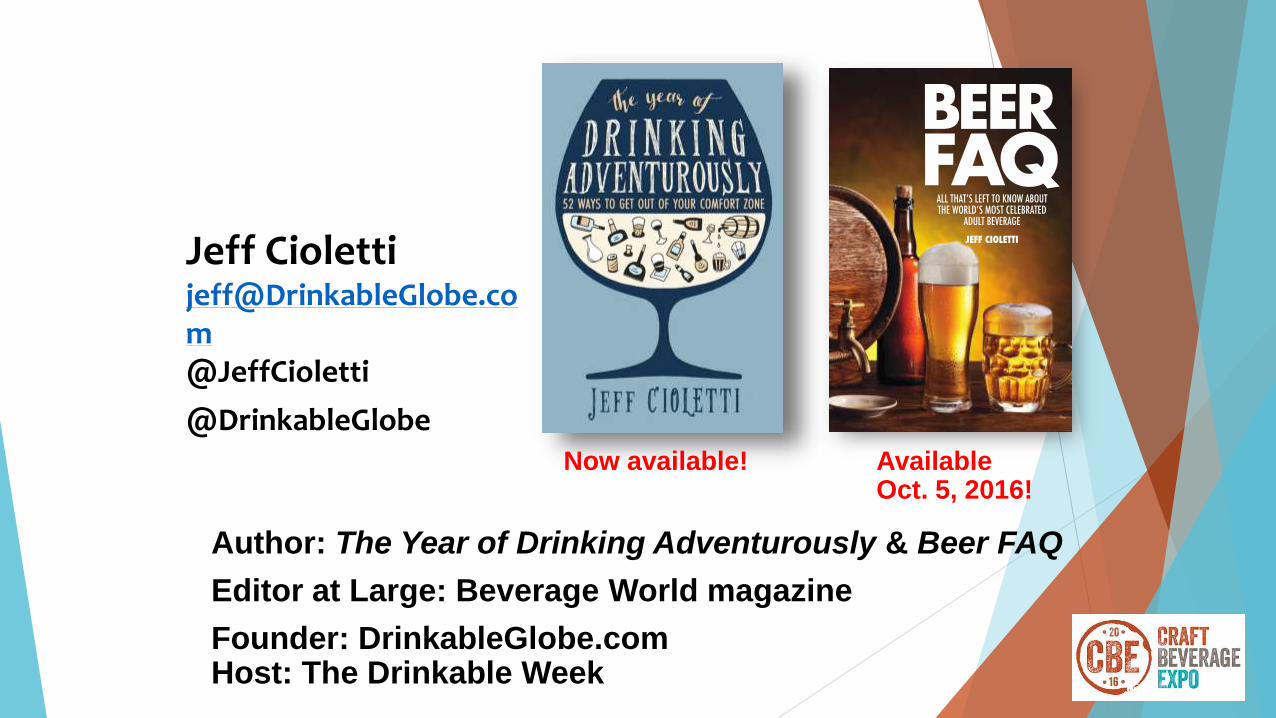
Author: The Year of Drinking Adventurously & Beer FAQ
Editor at Large: Beverage World magazine
Founder: DrinkableGlobe.comHost: The Drinkable Week
Jeff [email protected]@JeffCioletti
@DrinkableGlobe
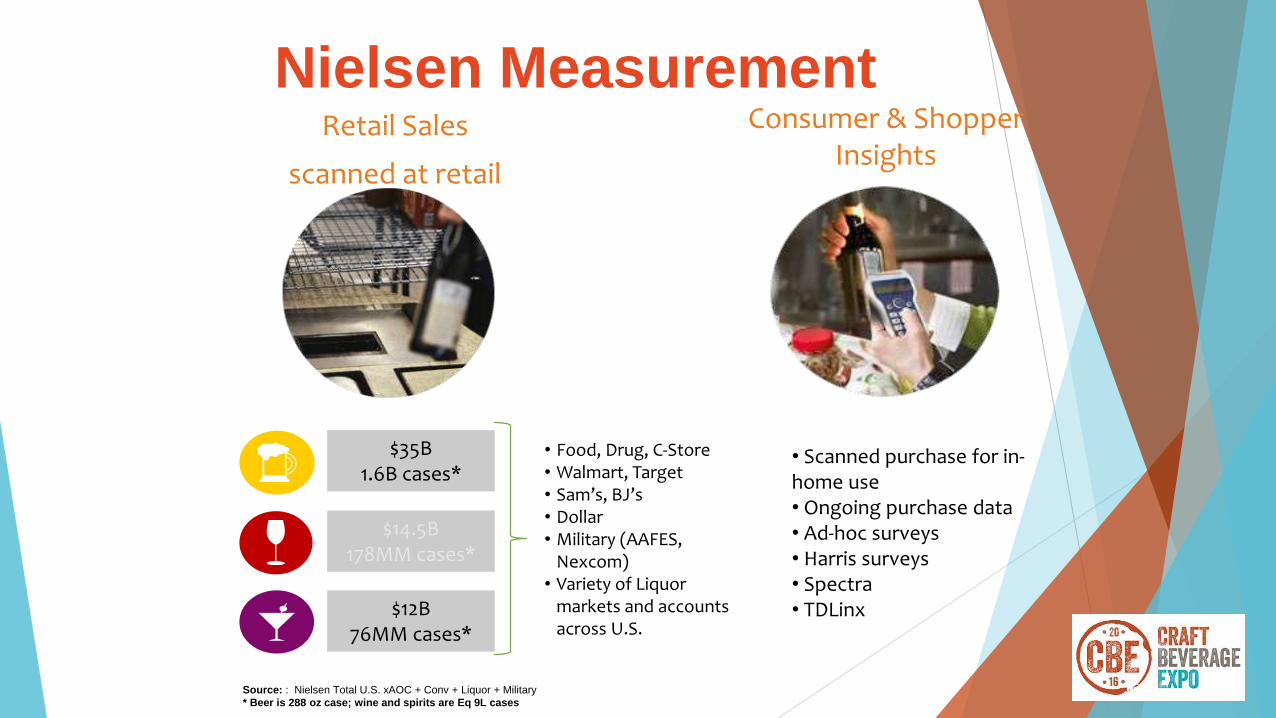
Nielsen MeasurementRetail Sales
scanned at retail
Consumer & ShopperInsights
$35B1.6B cases*
$14.5B178MM cases*
$12B76MM cases*
• Food, Drug, C-Store• Walmart, Target• Sam’s, BJ’s• Dollar• Military (AAFES,
Nexcom)• Variety of Liquor
markets and accounts across U.S.
• Scanned purchase for in-home use• Ongoing purchase data• Ad-hoc surveys• Harris surveys• Spectra• TDLinx
Source: : Nielsen Total U.S. xAOC + Conv + Liquor + Military
* Beer is 288 oz case; wine and spirits are Eq 9L cases

Deeper Dive into…
Craft – what does it mean?
Craft Beer
Craft Spirits
Wine
0%
10%
20%
30%
40%
50%
60%
70%
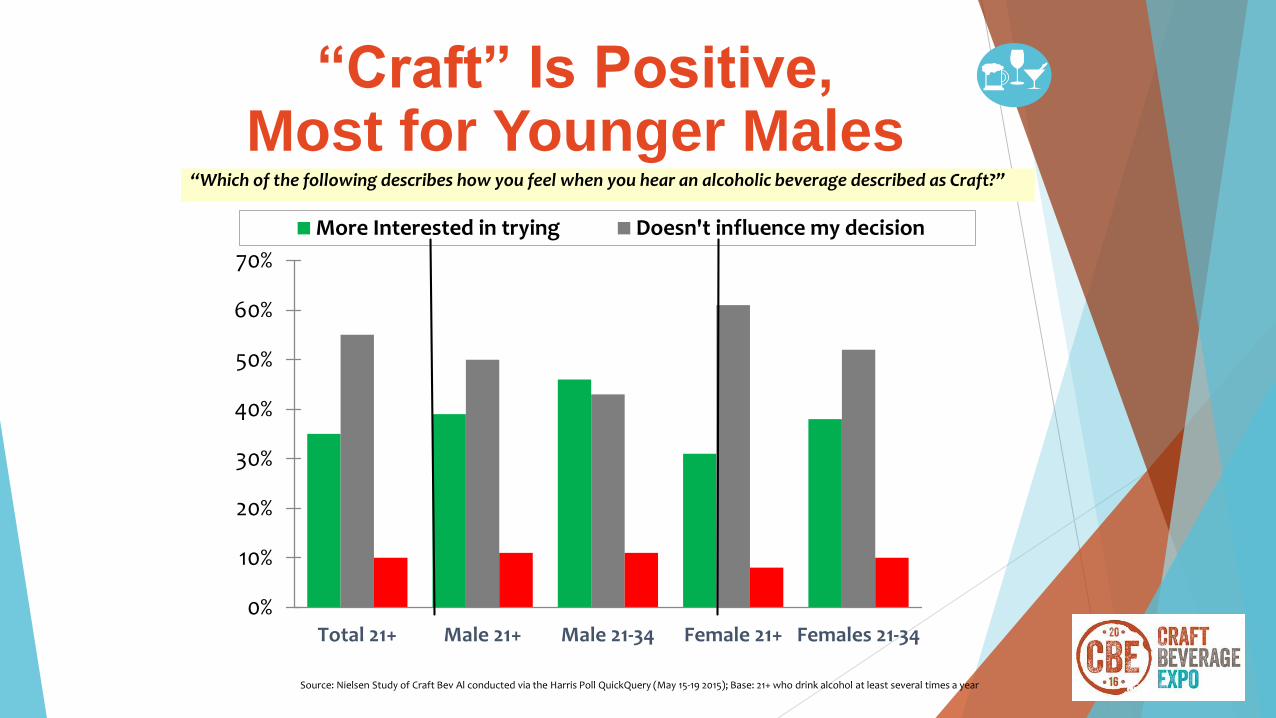
Total 21+ Male 21+ Male 21-34 Female 21+ Females 21-34
More Interested in trying Doesn't influence my decision
Source: Nielsen Study of Craft Bev Al conducted via the Harris Poll QuickQuery (May 15-19 2015); Base: 21+ who drink alcohol at least several times a year
“Which of the following describes how you feel when you hear an alcoholic beverage described as Craft?”
“Craft” Is Positive, Most for Younger Males
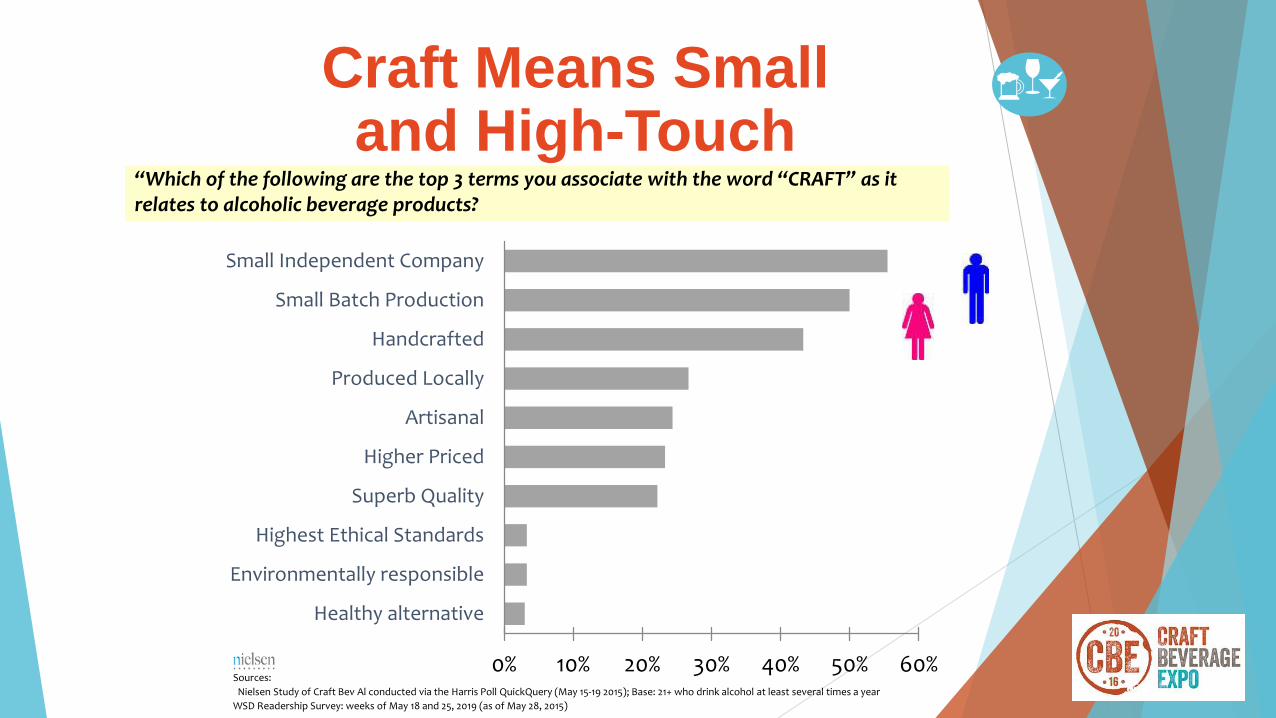
0% 10% 20% 30% 40% 50% 60%
Healthy alternative
Environmentally responsible
Highest Ethical Standards
Superb Quality
Higher Priced
Artisanal
Produced Locally
Handcrafted
Small Batch Production
Small Independent Company
Sources:
Nielsen Study of Craft Bev Al conducted via the Harris Poll QuickQuery (May 15-19 2015); Base: 21+ who drink alcohol at least several times a year
WSD Readership Survey: weeks of May 18 and 25, 2019 (as of May 28, 2015)
“Which of the following are the top 3 terms you associate with the word “CRAFT” as it relates to alcoholic beverage products?
Craft Means Small and High-Touch

Craft Beer and Cider

ValueShare
VolumeShare
SegmentsValue % Chg vs
YAVolume
% Chg vs YAAvg EQ Price
100 100 Total Beer + FMB + Cider 3.6 0.9 $22.69
39.2 43.7 Domestic Premium -0.2 -0.9 $20.34
17.2 13.4 Import 10.2 8.5 $29.16
15.4 22.3 Below Premium -2.2 -3.5 $15.74
12.3 7.9 Craft w/o Hard Soda 10.2 8.5 $35.49
6.5 4.6 FMBs w/o Hard Soda 4.3 3.9 $32.03
5.9 5.1 Domestic Super Premium 5.2 4.4 $26.36
1.4 0.9 Cider 10.8 7.8 $35.96
0.5 0.3 Hard Soda 8,714.0 7,316.9 $43.43
1.4 1.8 Malt Liquor -2.7 -5.3 $18.03
0.3 0.3 Near Beer 2.5 -0.5 $21.52
>5.0%&<10.0% >10.0% <-5.0%Source: xAOC + Liq Plus + Conv + Military, TTL Beer +FMB + Ciders, 52 WE 01/02/2016
Lots of industry debate about whether to include Hard Soda in Craft Beer or not
Craft Growing, Also Slowing
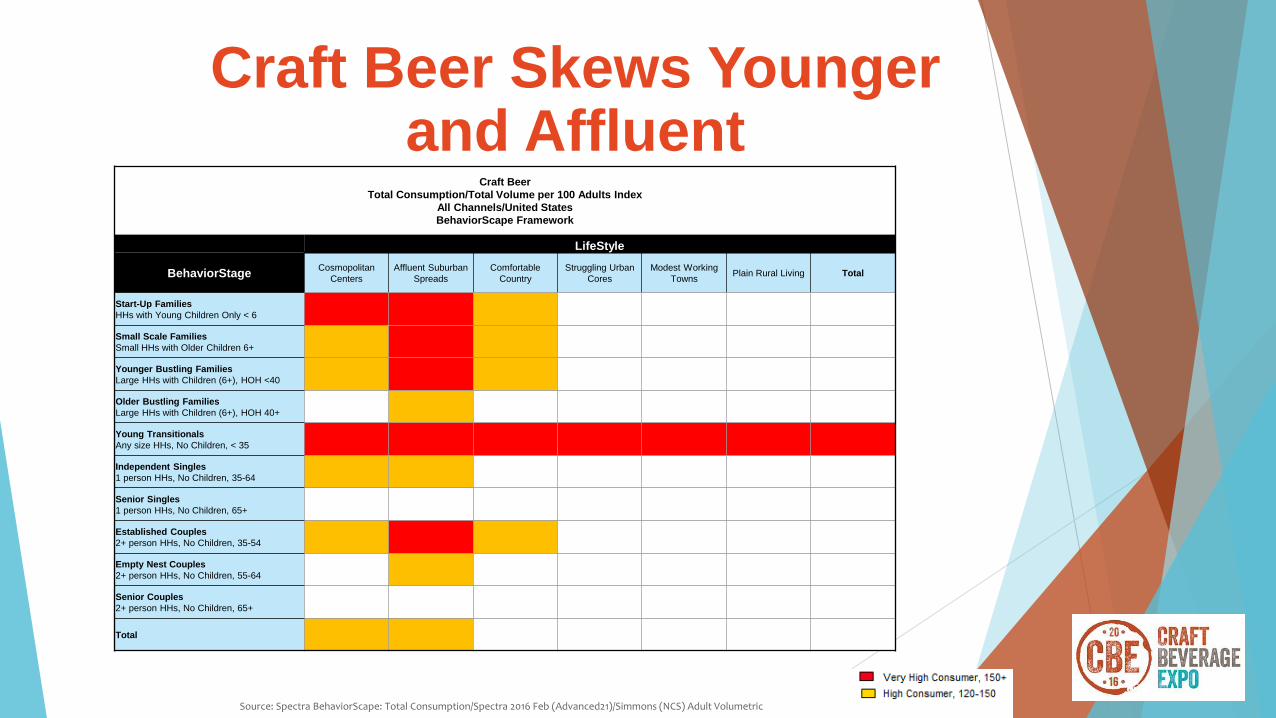
Craft Beer
Total Consumption/Total Volume per 100 Adults Index
All Channels/United States
BehaviorScape Framework
LifeStyle
BehaviorStageCosmopolitan
Centers
Affluent Suburban
Spreads
Comfortable
Country
Struggling Urban
Cores
Modest Working
TownsPlain Rural Living Total
Start-Up Families
HHs with Young Children Only < 6
Small Scale Families
Small HHs with Older Children 6+
Younger Bustling Families
Large HHs with Children (6+), HOH <40
Older Bustling Families
Large HHs with Children (6+), HOH 40+
Young Transitionals
Any size HHs, No Children, < 35
Independent Singles
1 person HHs, No Children, 35-64
Senior Singles
1 person HHs, No Children, 65+
Established Couples
2+ person HHs, No Children, 35-54
Empty Nest Couples
2+ person HHs, No Children, 55-64
Senior Couples
2+ person HHs, No Children, 65+
Total
Source: Spectra BehaviorScape: Total Consumption/Spectra 2016 Feb (Advanced21)/Simmons (NCS) Adult Volumetric
Craft Beer Skews Youngerand Affluent

Source: xAOC + Liq Plus + Conv + Military, TTL Craft/ Microbrew, 52 WE 01/02/2016
ValueShare
VolumeShare
SegmentsValue %
Chg vs YAVolume
% Chg vs YAAvg EQ Price
100 100 Craft/Microbrew 14.7 10.5 $35.86
19.4 19.6 Seasonal 2.3 -0.3 $35.39
17.3 16.5 India Pale Ale 38.6 36.0 $37.55
9.9 11.2 Witbier/Belgian Wheat/White 6.8 4.7 $31.66
9.3 10.1 Assorted 4.9 3.0 $33.03
6.0 6.4 American Pale Ale 2.2 -0.4 $33.89
4.4 3.7 Imperial/Double/Triple IPA 24.0 23.6 $43.22
3.8 4.3 Amber Lager -12.2 -14.5 $31.13
3.5 3.6 American Amber/Red Ale 1.1 -0.2 $34.37
3.0 3.0 American Wheat -0.6 -4.2 $34.88
1.9 2.2 Bock /German Bock 4.3 2.8 $31.80
>5.0%&<10.0% >10.0% <-5.0%
Growth Across StylesMixed

Bomber Share of Bottles; Pack Sizes Share of Cans, Pack Sizes shown are greater than or equal to 1.0 shareSource: xAOC + Liq Plus + Conv + Military, TTL Craft/ Microbrew, 52 WE 01/02/2016
ValueShare
VolumeShare
SegmentsValue % Chg vs
YAVolume
% Chg vs YAAvg EQ Price
100 100 Craft Beer 14.7 10.5 $35.86
87.1 86.4 Bottles 10.8 6.8 $36.14
7.6 3.7 Bomber (Glass 22oz+) 6.3 2.9 $73.29
12.5 13.2 Cans 52.2 43.4 $34.04
42.1 37.9 6PK 97.8 84.4 $37.83
30.4 34.9 12PK 25.1 20.9 $29.68
12.6 12.0 4PK 18.0 14.7 $35.89
10.1 8.4 1PK 42.9 39.0 $40.59
3.1 3.8 15PK 263.5 263.0 $27.37
1.0 2.1 24PK 21.6 11.0 $16.28
>5.0%&<10.0% >10.0% <-5.0%
Cans Outperforming Bottles
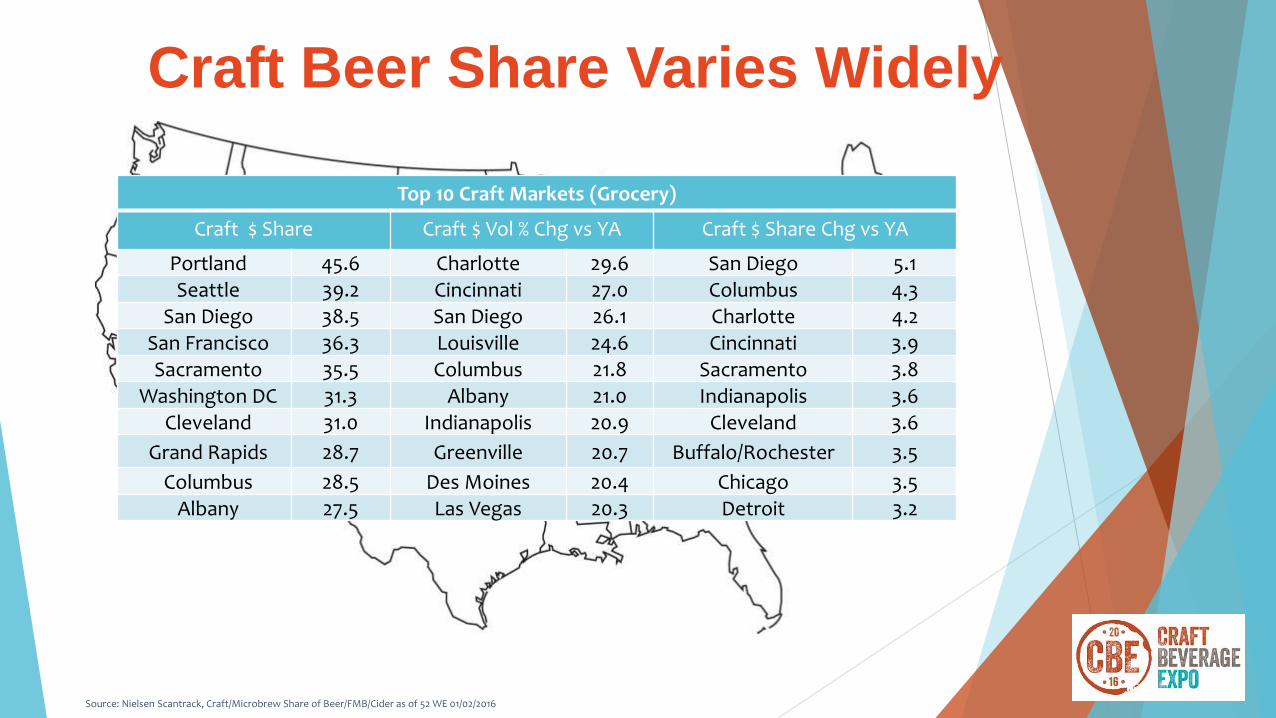
Top 10 Craft Markets (Grocery)
Craft $ Share Craft $ Vol % Chg vs YA Craft $ Share Chg vs YA
Portland 45.6 Charlotte 29.6 San Diego 5.1
Seattle 39.2 Cincinnati 27.0 Columbus 4.3San Diego 38.5 San Diego 26.1 Charlotte 4.2
San Francisco 36.3 Louisville 24.6 Cincinnati 3.9Sacramento 35.5 Columbus 21.8 Sacramento 3.8
Washington DC 31.3 Albany 21.0 Indianapolis 3.6Cleveland 31.0 Indianapolis 20.9 Cleveland 3.6
Grand Rapids 28.7 Greenville 20.7 Buffalo/Rochester 3.5
Columbus 28.5 Des Moines 20.4 Chicago 3.5Albany 27.5 Las Vegas 20.3 Detroit 3.2
Source: Nielsen Scantrack, Craft/Microbrew Share of Beer/FMB/Cider as of 52 WE 01/02/2016
Craft Beer Share Varies Widely

Map represents top 5 Craft Brands in market, if other than top 6 National Brands*
*Top 6 National Brands: Sam Adams, Blue Moon, Sierra Nevada, New Belgium, Leinenkugel’s, Shock Top
Local, Local, Local

Cider Dollar & Dollar % Chg vs. YAG
-20.0
-10.0
0.0
10.0
20.0
30.0
40.0
50.0
60.0
0
2,000,000
4,000,000
6,000,000
8,000,000
10,000,000
12,000,000
14,000,000
16,000,000
Dollars Dollars % Chg YA
Source: xAOC + Liq Plus + Conv + Military, TTL Cider, 52 WE 01/02/2016
Cider Growth Sliding
Source: xAOC + Liq Plus + Conv + Military, TTL Cider, 52 WE 01/02/2016
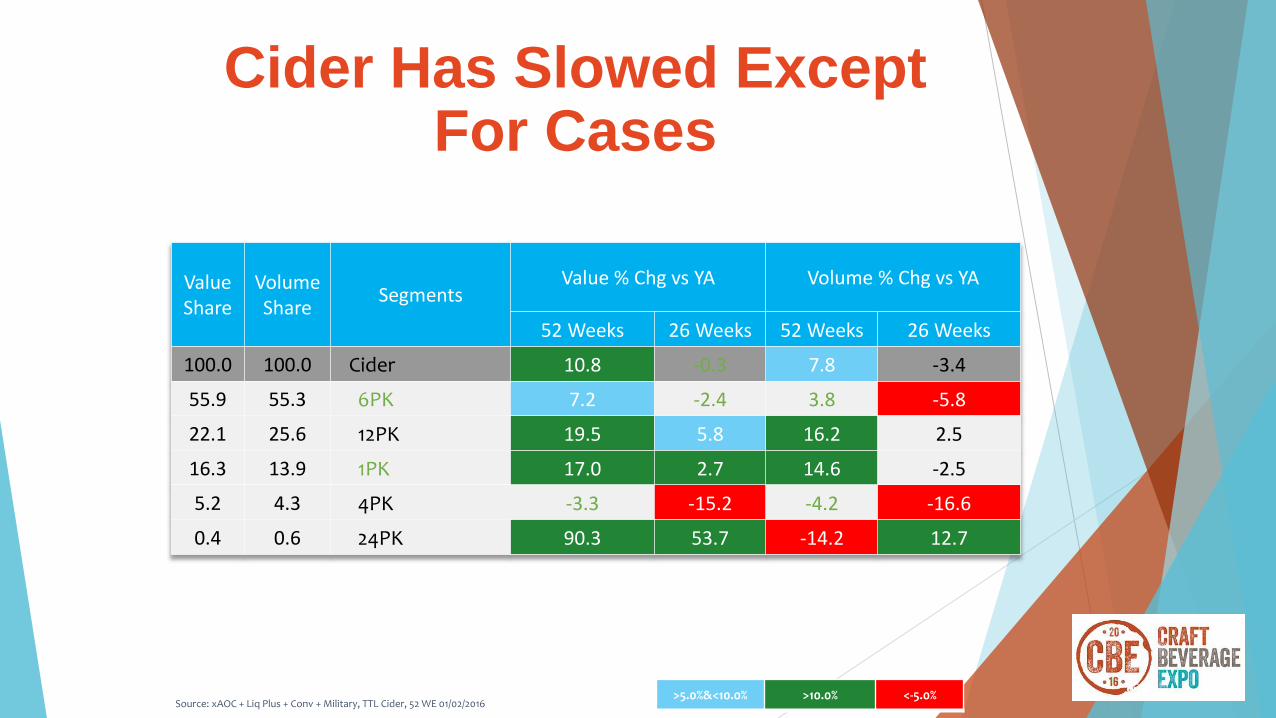
ValueShare
VolumeShare
SegmentsValue % Chg vs YA Volume % Chg vs YA
52 Weeks 26 Weeks 52 Weeks 26 Weeks
100.0 100.0 Cider 10.8 -0.3 7.8 -3.4
55.9 55.3 6PK 7.2 -2.4 3.8 -5.8
22.1 25.6 12PK 19.5 5.8 16.2 2.5
16.3 13.9 1PK 17.0 2.7 14.6 -2.5
5.2 4.3 4PK -3.3 -15.2 -4.2 -16.6
0.4 0.6 24PK 90.3 53.7 -14.2 12.7
>5.0%&<10.0% >10.0% <-5.0%
Cider Has Slowed ExceptFor Cases

Spirits
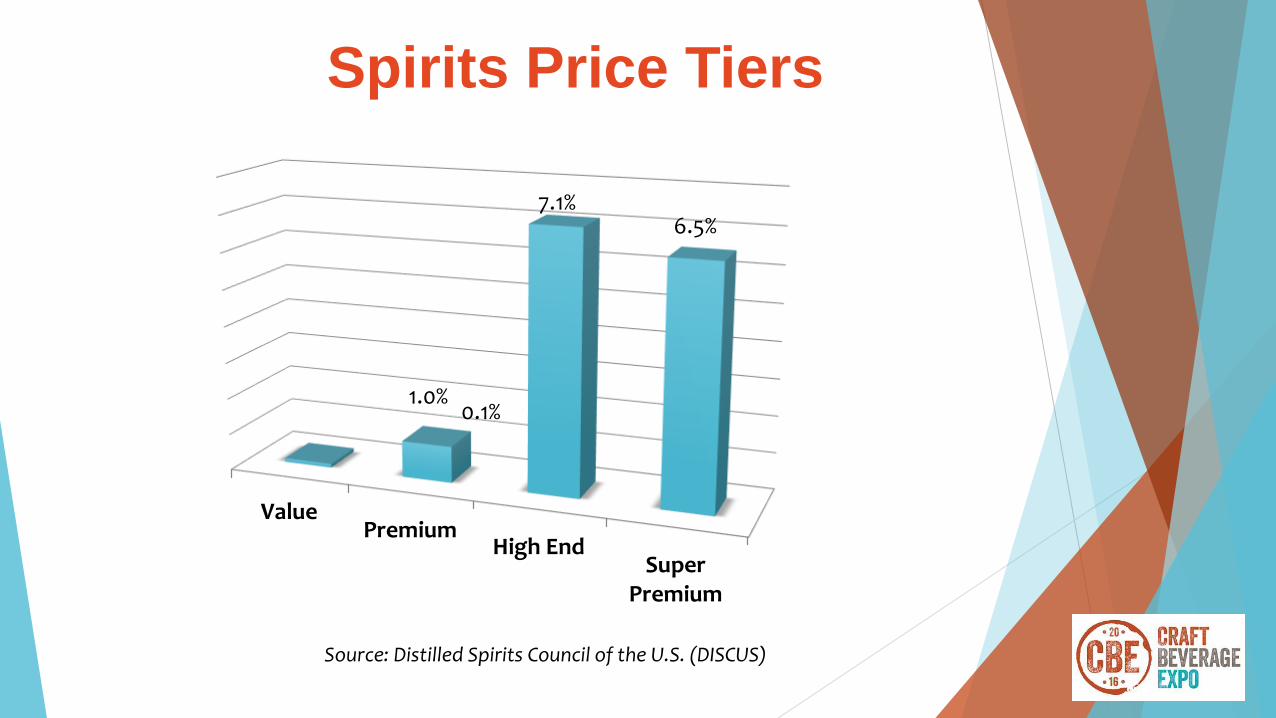
ValuePremium
High EndSuper
Premium
1.0%
7.1%6.5%
0.1%
Source: Distilled Spirits Council of the U.S. (DISCUS)
Spirits Price Tiers

Source: Distilled Spirits Council of the U.S. (DISCUS)
Share of total volume (9-Liter Case Equivalents)
Value
Premium
High End
Super-premium
75.1M
77.0M35.8%
41.1M20.5%
18.9M8.8%
Spirits Price Tiers

Source: Distilled Spirits Council of the U.S. (DISCUS)
Share of U.S. Spirits Supplier Gross Revenue
Value
Premium
High End
Super-premium
$4B
$7.6B31.7%
$7.5B31.0%
$5B20.6%
Spirits Price Tiers
Source: Distilled Spirits Council of the U.S. (DISCUS)
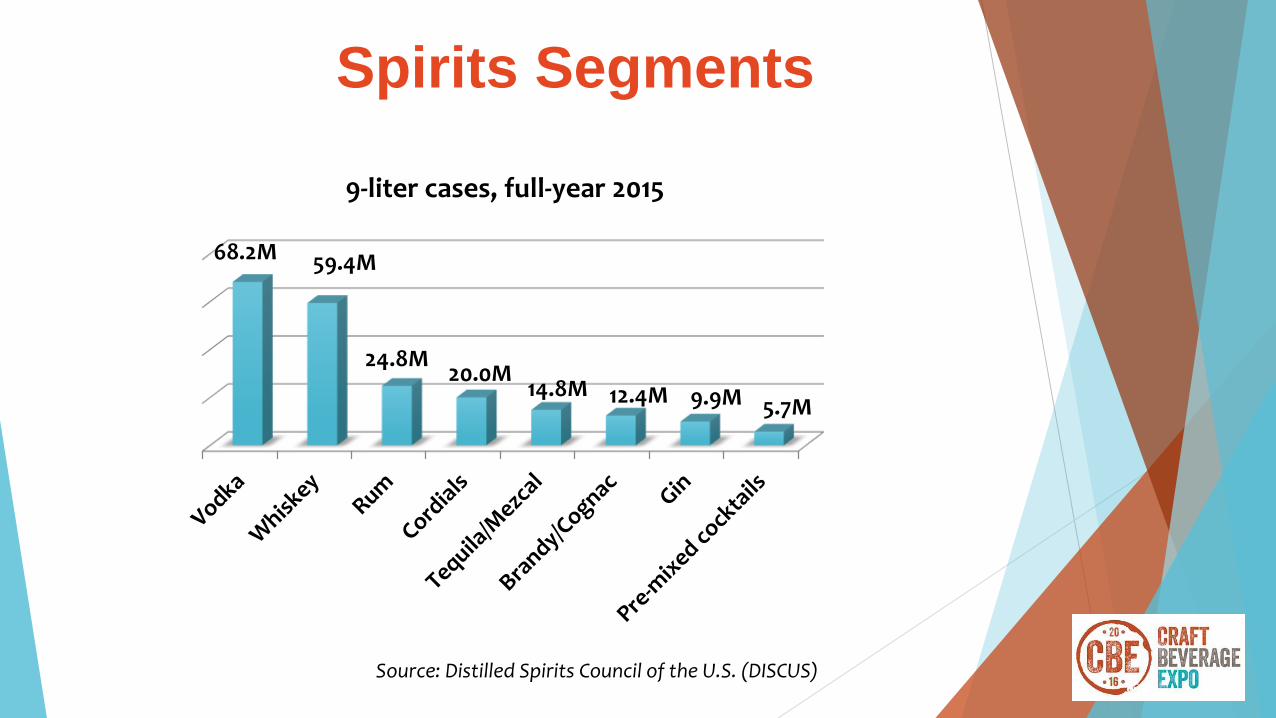
9-liter cases, full-year 2015
59.4M
24.8M20.0M
14.8M 12.4M
68.2M
9.9M 5.7M
Spirits Segments
Source: Distilled Spirits Council of the U.S. (DISCUS)
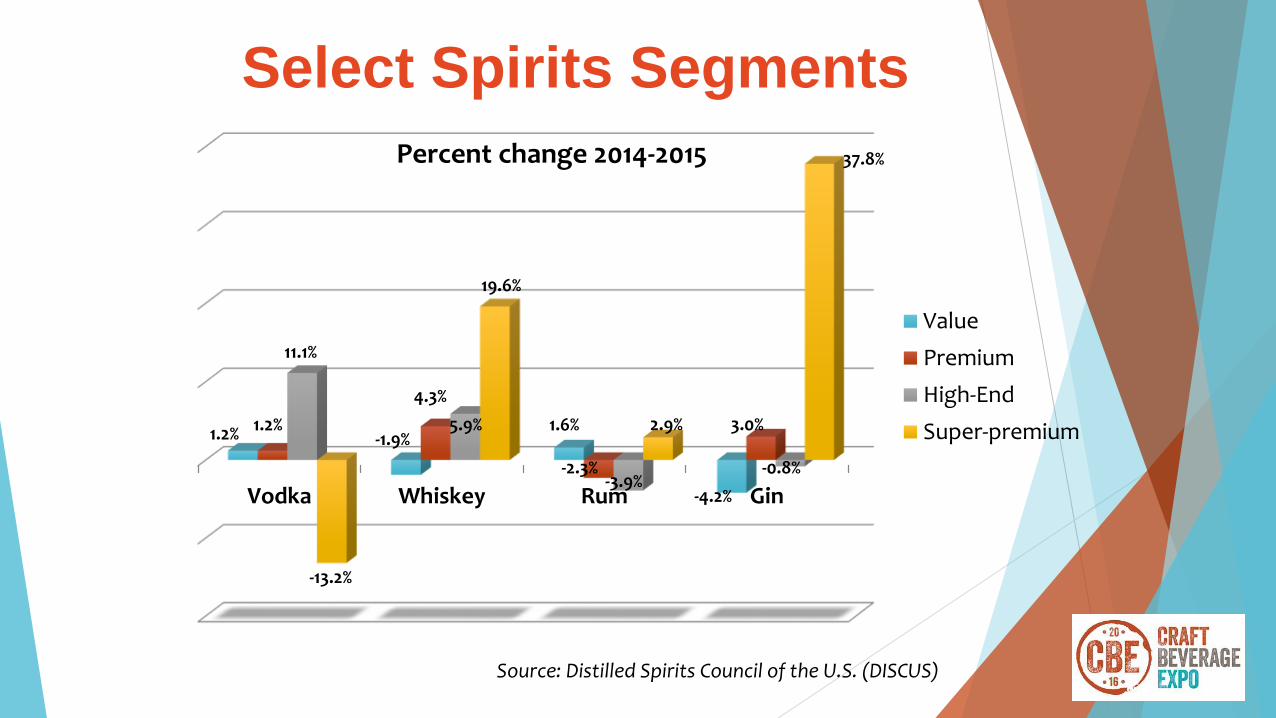
Vodka Whiskey Rum Gin
Value
Premium
High-End
Super-premium1.2% 1.2%
11.1%
-13.2%
-1.9%
4.3%
5.9%
19.6%
1.6%
-2.3%-3.9%
2.9%
-4.2%
3.0%
-0.8%
37.8%Percent change 2014-2015
Select Spirits Segments

Source: Distilled Spirits Council of the U.S. (DISCUS)
9L Cases17.4M 16.7M
7.5M
3.2M
9.5M
2.2M 2.1M671K 767K
Whisk(e)y Segments
Source: Distilled Spirits Council of the U.S. (DISCUS)
-5
0
5
10
15
20
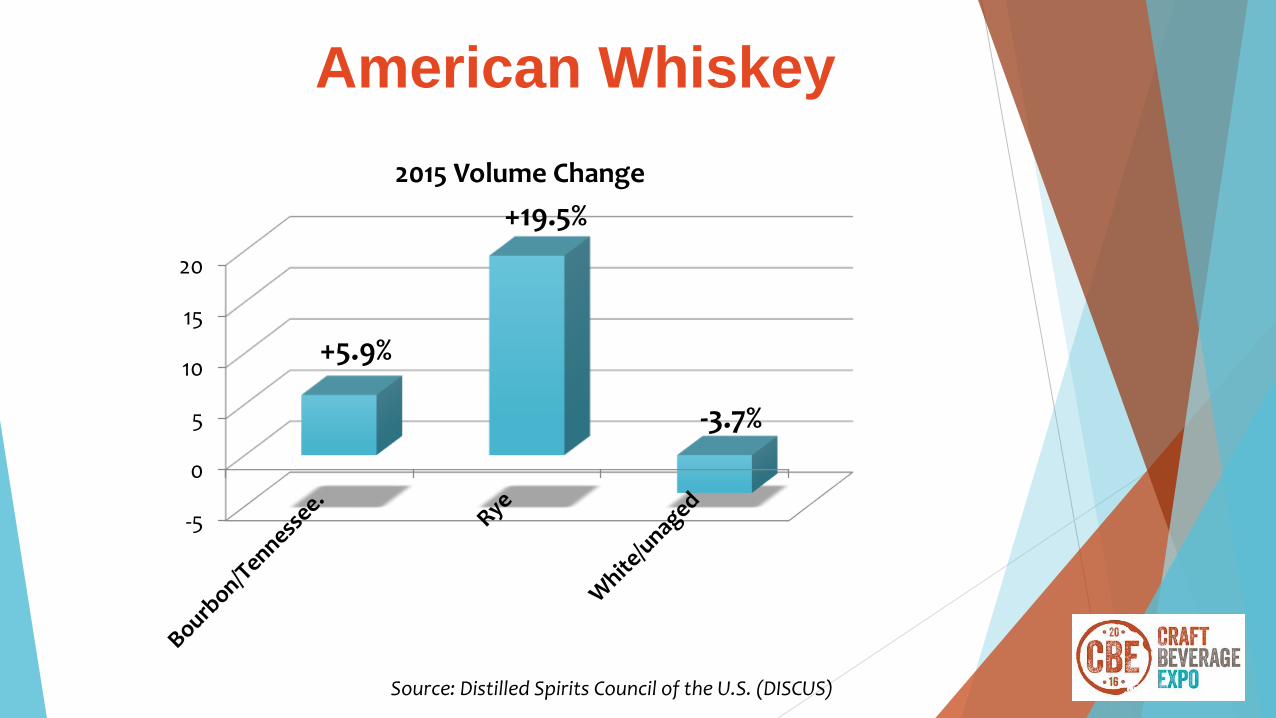
2015 Volume Change
+5.9%
+19.5%
-3.7%
American Whiskey

Source: Distilled Spirits Council of the U.S. (DISCUS)
Super-premium Bourbon, Rye, Tenn. whiskey volume: +25.2%
Premiumization

Which of the following types of SPIRITS, if any, have you, or anyone in your household, purchased in the past 12 months? Please be thinking about purchases at a retail store or a public establishment.
31%
13%
2%
Mainstream Spirits only Mainstream Spirits ANDCraft Spirits
Craft Spirits only
% of HH LDA 21+
15%
Source: Nielsen Craft Spirits Omnibus Survey
15% Claim Craft Spirits Purchase

Source: Spectra BehaviorScape: Total Consumption/Spectra (HH 21+)/Homescan Product Library
Mainstream Spirits Profile

Source: Spectra BehaviorScape: Total Consumption/Spectra (HH 21+)/Homescan Product Library
Craft Spirits Profile

Which of the following types of SPIRITS, if any, have you, or anyone in your household, purchased in the past 12 months? Please be thinking about purchases at a retail store or a public establishment.
26%
4%1%
30%
9%
1%
32%
15%
2%
27%
16%
2%
Mainstream Spirits only Mainstream Spirits ANDCraft Spirits
Craft Spirits only
Greatest Generation Boomers Gen X Millennials
Source: Nielsen Craft Spirits Omnibus Survey
Total Mainstream & CraftAnd Craft Only = 15%
INDEXMillennials 120Gen X 113Boomers 66Greatest Gen 33
Craft Spirits Attracts YoungerConsumers Too

What are the primary reasons you or others in your household purchase CRAFT SPIRITS? Please select all that apply.
Reason for buying Craft Spirits % of HH Female Male
It’s a treat for special occasions either at my home, or when bringing it to others’ homes 37% 101 86
I like to try Spirits products that are new/new to me 34% 98 108
I like that they are locally produced products 30% 98 115
I like to buy them because they are unique -- something that I just can’t get from other Spirits 27% 95 134
It’s a treat for special occasions when out at a restaurant, bar, nightclub, etc. 27% 103 75
I like to buy them because they taste better than other Spirit brands 24% 97 133
I like to buy them when entertaining others 23% 100 85
Source: Nielsen Craft Spirits Omnibus Survey Index to Total HH
Top Reasons for Purchase
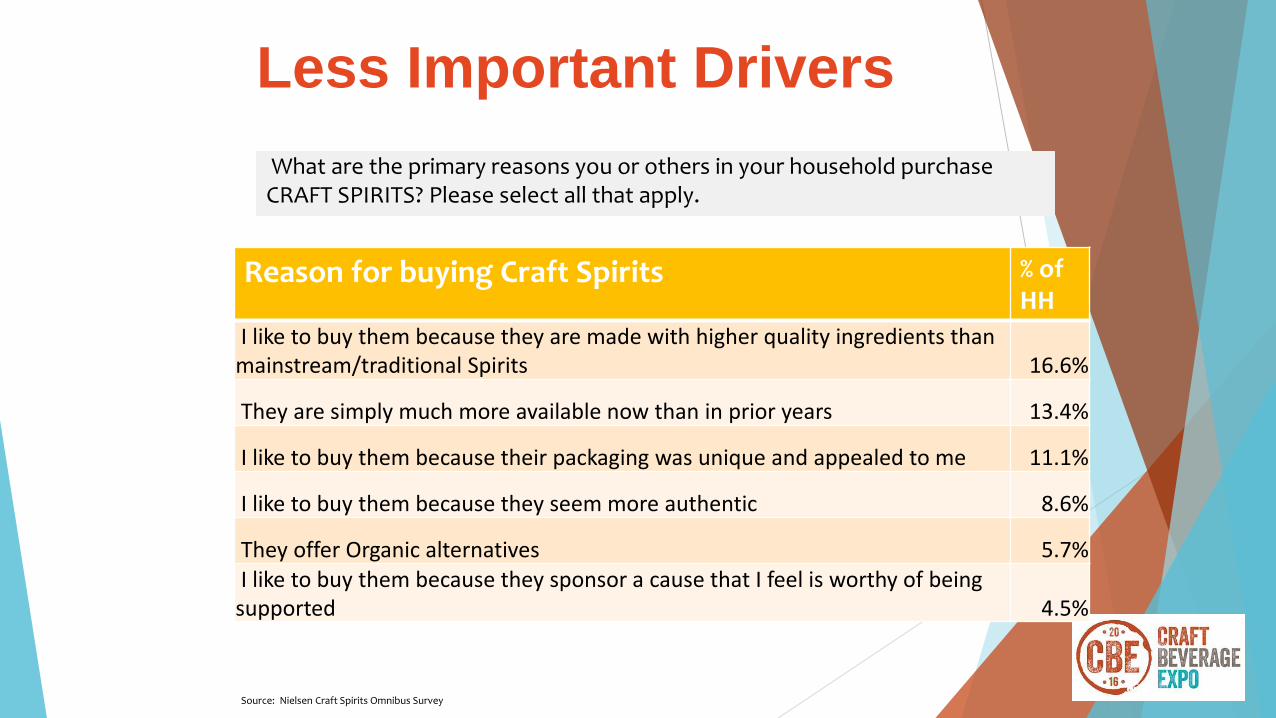
What are the primary reasons you or others in your household purchase CRAFT SPIRITS? Please select all that apply.
Reason for buying Craft Spirits % of HH
I like to buy them because they are made with higher quality ingredients than mainstream/traditional Spirits 16.6%
They are simply much more available now than in prior years 13.4%
I like to buy them because their packaging was unique and appealed to me 11.1%
I like to buy them because they seem more authentic 8.6%
They offer Organic alternatives 5.7%I like to buy them because they sponsor a cause that I feel is worthy of being
supported 4.5%
Source: Nielsen Craft Spirits Omnibus Survey
Less Important Drivers

Wine

Sales Share
Price Tiers
Value % Chg Volume % Chg Price
Value Volume Latest 52 Weeks
Latest 26 Weeks
Latest 52 Weeks
Latest 26 Weeks
Average 750mL Price
Average
750mL Price
Change
% Chg vs YA
100 100 Total Table Wine 5.1 5.4 1.8 2.0 $6.90 $0.22 3.3
6.0 17.4 $0.00-$2.99 -2.2 -2.4 -5.1 -4.8 $2.39 $0.07 3.0
31.1 43.7 $3.00-$5.99 0.9 1.5 0.8 1.1 $4.90 $0.00 0.1
7.0 7.0 $6.00-$7.99 -4.4 -3.4 -4.0 -3.1 $6.92 -$0.03 -0.4
17.4 13.2 $8.00-$9.99 5.6 5.1 5.4 4.4 $9.10 $0.02 0.2
24.0 13.9 $10.99-$14.99 11.5 11.5 11.3 11.1 $11.91 $0.03 0.2
7.7 3.1 $15.00-$19.99 15.2 13.3 14.4 13.0 $17.20 $0.13 0.8
6.6 1.6 $20.00+ 10.0 10.6 9.4 11.5 $28.35 $0.15 0.5
Table Wine – Price Tiers
>5.0%&<10.0% >10.0% <-5.0%
Source: AOD-xAOC + Liq Plus + Conv + Military, Total Wine 52 WE 01/02/2016
For Most Consumers Wine = Craft, esp At High End

OFF PREMISE only Household purchasing…
% of Wine buyerspurchasing….
2015Change vs 2012
Wine exclusively: down 2 percentage points
Beer 69% +1.1
• Craft Beer 34% +7.4
Ciders 10% +5.6
Spirits 49% +2.4
• Whiskey 23% +4.2
Source: Nielsen Homescan Premium (2015 is 52 weeks through 11/28/2015)
Wine $ from Wine buyers….
Wine exclusive Wine and Spirits
Wine and Beer Wine, Beer, Spirits
Wine Buyers Graze

Beer/Cider
o Local, local, local
o Younger, higher income, male
o Cider – uneven results to date
Spirits
o Craft small but growing – uniqueness and specialness big drivers
o Appealing to younger drinkers; purchasing differences by gender
Wine
o Increased fracturing and growth in premium tiers
o Lots more overlap with Beer/Cider and Spirits compared to a few years ago
Summary


