CCGPS 7 th Grade Math Content Standards Unpacked Page 1 of 55 Bibb County School System May 2012 CCGPS 7 th Grade Math Content Standards Unpacked This document is an instructional support tool. It is adapted from documents created by the Partnership for Assessment of Readiness for College and Careers (PARCC), the Ohio Department of Education, the Arizona Department of Education, and the North Carolina Department of Public Instruction for the Common Core State Standards in Mathematics. Highlighted standards are transition standards for Georgia's implementation of CCGPS in 2012-2013. The highlighted standards are included in the curriculum for two grade levels during the initial year of CCGPS implementation to ensure that students do not have gaps in their knowledge base. In 2013-2014 and subsequent years, the highlighted standards will not be taught at this grade level because students will already have addressed these standards the previous year. What is the purpose of this document? To increase student achievement by ensuring educators understand specifically what the new standards mean a student must know, understand and be able to do. What is in the document? Descriptions of what each standard means a student will know, understand, and be able to do. The “unpacking” of the standards done in this document is an effort to answer a simple question “What does this standard mean that a student must know and be able to do?” and to ensure the description is helpful, specific and comprehensive for educators. How do I send feedback? The explanations and examples in this document are intended to be helpful and specific. As this document is used, however, teachers and educators will find ways in which the unpacking can be improved and made more useful. Please send feedback to [email protected]. Your input will be used to refine the unpacking of the standards. Just want the standards alone? You can find the CCGPS standards for your grade band at www.georgiastandards.org.
Transcript
CCGPS 7th Grade Math Content Standards Unpacked Page 1 of 55 Bibb County School System May 2012
CCGPS 7th Grade Math Content Standards Unpacked
This document is an instructional support tool. It is adapted from
documents created by the Partnership for Assessment of Readiness for
College and Careers (PARCC), the Ohio Department of Education, the
Arizona Department of Education, and the North Carolina Department
of Public Instruction for the Common Core State Standards in
Mathematics.
Highlighted standards are transition standards for Georgia's
implementation of CCGPS in 2012-2013. The highlighted standards
are included in the curriculum for two grade levels during the initial
year of CCGPS implementation to ensure that students do not have
gaps in their knowledge base. In 2013-2014 and subsequent years, the
highlighted standards will not be taught at this grade level because
students will already have addressed these standards the previous year.
What is the purpose of this document? To increase student
achievement by ensuring educators understand specifically what the
new standards mean a student must know, understand and be able to
do.
What is in the document? Descriptions of what each standard means
a student will know, understand, and be able to do. The “unpacking”
of the standards done in this document is an effort to answer a simple
question “What does this standard mean that a student must know and
be able to do?” and to ensure the description is helpful, specific and
comprehensive for educators.
How do I send feedback? The explanations and examples in this
document are intended to be helpful and specific. As this document is
used, however, teachers and educators will find ways in which the
unpacking can be improved and made more useful. Please send
CCGPS 7th Grade Math Content Standards Unpacked Page 2 of 55 Bibb County School System May 2012
Grade 7
Grade 7 Overview
Ratios and Proportional Relationships (RP)
Analyze proportional relationships and use them to solve real-world and mathematical problems.
The Number System (NS)
Apply and extend previous understandings of operations with fractions to add, subtract, multiply, and divide rational numbers.
Expressions and Equations (EE)
Use properties of operations to generate equivalent expressions.
Solve real-life and mathematical problems using numerical and algebraic expressions and equations.
Geometry (G)
Draw, construct and describe geometrical figures and describe the relationships between them.
Solve real-life and mathematical problems involving angle measure, area, surface area, and volume.
Statistics and Probability (SP)
Use random sampling to draw inferences about a population.
Draw informal comparative inferences about two populations.
Investigate chance processes and develop, use, and evaluate probability models.
Key Major Cluster Supporting Cluster Additional Cluster
Mathematical Practices (MP) 1. Make sense of problems and persevere in solving them. 2. Reason abstractly and quantitatively. 3. Construct viable arguments and critique the reasoning of
others. 4. Model with mathematics. 5. Use appropriate tools strategically. 6. Attend to precision. 7. Look for and make use of structure. 8. Look for and express regularity in repeated reasoning.
Critical Areas
1. Developing understanding of and applying proportional relationships.
2. Developing understanding of operations with rational numbers and working with expressions and linear equations.
3. Solving problems involving scale drawings and informal geometric constructions, and working with two- and three-dimensional shapes to solve problems involving area, surface area, and volume.
4. Drawing inferences about populations based on samples.
Examples of Linking Supporting Clusters to the Major Work of the Grade
Use random sampling to draw inferences about a population: The standards in this cluster represent opportunities to apply percentages and proportional reasoning. To make inferences about a population, one needs to apply such reasoning to the sample and the entire population.
Investigate chance processes and develop, use and evaluate probability models: Probability models draw on proportional reasoning and should be connected to the major work in those standards.
CCGPS 7th Grade Math Content Standards Unpacked Page 3 of 55 Bibb County School System May 2012
Key Advances from Grade 6 to Grade 7 Fluency Expectations/Culminating Standards
In grade 6, students learned about negative numbers and the kinds of quantities they can be used to represent; they also learned about absolute value and ordering of rational numbers, including in real-world contexts. In grade 7, students will add, subtract, multiply and divide within the system of rational numbers.
Students grow in their ability to analyze proportional relationships. They decide whether two quantities are in a proportional relationship (7.RP.2a); they work with percents, including simple interest, percent increase and decrease, tax, markups and markdowns, gratuities and commission, and percent error (7.RP.3); they analyze proportional relationships and solve problems involving unit rates associated with ratios of fractions (e.g., if a person walks 1/2 mile in each 1/4 hour, the unit rate is the complex fraction ½ / ¼ miles per hour or 2 miles per hour) (7.RP.1); and they analyze proportional relationships in geometric figures (7.G.1).
Students solve a variety of problems involving angle measure, area, surface area and volume (7.G.4–6).
7.EE.3 Students solve multistep problems posed with positive and negative rational numbers in any form (whole numbers, fractions and decimals), using tools strategically. This work is the culmination of many progressions of learning in arithmetic, problem solving and mathematical practices.
7.EE.4 In solving word problems leading to one-variable equations of the form px + q = r and p(x + q) = r, students solve the equations fluently. This will require fluency with rational number arithmetic (7.NS.1–3), as well as fluency to some extent with applying properties operations to rewrite linear expressions with rational coefficients (7.EE.1).
7.NS.1–2 Adding, subtracting, multiplying and dividing rational numbers is the culmination of numerical work with the four basic operations. The number system will continue to develop in grade 8, expanding to become the real numbers by the introduction of irrational numbers, and will develop further in high school, expanding to become the complex numbers with the introduction of imaginary numbers. Because there are no specific standards for rational number arithmetic in later grades and because so much other work in grade 7 depends on rational number arithmetic (see below), fluency with rational number arithmetic should be the goal in grade 7.
Examples of Major Within-Grade Dependencies Examples of Opportunities for In-Depth Focus
Meeting standard 7.EE.3 in its entirety will involve using rational number arithmetic (7.NS.1–3) and percents (7.RP.3). Work leading to meeting this standard could be organized as a recurring activity that tracks the students’ ongoing acquisition of new skills in rational number arithmetic and percents.
Because rational number arithmetic (7.NS.1–3) underlies the problem solving detailed in 7.EE.3 as well as the solution of linear expressions and equations (7.EE.1–2, 4), this work should likely begin at or near the start of the year.
The work leading to meeting standards 7.EE.1–4 could be divided into two phases, one centered on addition and subtraction (e.g., solving x + q = r) in relation to rational number addition and subtraction (7.NS.1) and another centered on multiplication and division (e.g., solving px + q = r and p(x + q) = r) in relation to rational number multiplication and division (7.NS.2).
7.RP.2 Students in grade 7 grow in their ability to recognize, represent and analyze proportional relationships in various ways, including by using tables, graphs and equations.
7.NS.3 When students work toward meeting this standard (which is closely connected to 7.NS.1 and 7.NS.2), they consolidate their skill and understanding of addition, subtraction, multiplication and division of rational numbers.
7.EE.3 This is a major capstone standard for arithmetic and its applications.
7.EE.4 Work toward meeting this standard builds on the work that led to meeting 6.EE.7 and prepares students for the work that will lead to meeting 8.EE.7.
7.G.6 Work toward meeting this standard draws together grades 3–6 work with geometric measurement.
CCGPS 7th Grade Math Content Standards Unpacked Page 4 of 55 Bibb County School System May 2012
Examples of Opportunities for Connections among Standards, Clusters, or Domains
Examples of Opportunities for Connecting Mathematical Content and Mathematical Practices
Students use proportional reasoning when they analyze scale drawings (7.G.1).
Students use proportional reasoning and percentages when they extrapolate from random samples and use probability (7.SP.6, 8).
Mathematical practices should be evident throughout mathematics instruction and connected to all of the content areas highlighted above, as well as all other content areas addressed at this grade level. Mathematical tasks (short, long, scaffolded and unscaffolded) are an important opportunity to connect content and practices. Some brief examples of how the content of this grade might be connected to the practices follow.
When students compare arithmetic and algebraic solutions to the same problem (7.EE.4a), they are identifying correspondences between different approaches (MP.1).
Solving an equation such as 4 = 8(x – 1/2) requires students to see and make use of structure (MP.7), temporarily viewing x – 1/2 as a single entity.
When students notice when given geometric conditions determine a unique triangle, more than one triangle or no triangle (7.G.2), they have an opportunity to construct viable arguments and critique the reasoning of others (MP.3). Such problems also present opportunities for using appropriate tools strategically (MP.5).
Proportional relationships present opportunities for modeling (MP.4). For example, the number of people who live in an apartment building might be taken as proportional to the number of stories in the building for modeling purposes.
CCGPS 7th Grade Math Content Standards Unpacked Page 5 of 55 Bibb County School System May 2012
Standards for Mathematical Practices The Common Core Standards for Mathematical Practice are expected to be integrated into every mathematics lesson for all students
Grades K – 12. Below are a few examples of how these Practices may be integrated into tasks that students complete.
Mathematical Practices Explanations and Examples 1. Make sense of
problems and persevere in solving them.
In grade 7, students solve problems involving ratios and rates and discuss how they solved them. Students solve real world problems through the application of algebraic and geometric concepts. Students seek the meaning of a problem and look for efficient ways to represent and solve it. They may check their thinking by asking themselves, “What is the most efficient way to solve the problem?”, “Does this make sense?”, and “Can I solve the problem in a different way?”.
2. Reason abstractly and quantitatively.
In grade 7, students represent a wide variety of real world contexts through the use of real numbers and variables in mathematical expressions, equations, and inequalities. Students contextualize to understand the meaning of the number or variable as related to the problem and decontextualize to manipulate symbolic representations by applying properties of operations.
3. Construct viable arguments and critique the reasoning of others.
In grade 7, students construct arguments using verbal or written explanations accompanied by expressions, equations, inequalities, models, and graphs, tables, and other data displays (i.e. box plots, dot plots, histograms, etc.). They further refine their mathematical communication skills through mathematical discussions in which they critically evaluate their own thinking and the thinking of other students. They pose questions like “How did you get that?”, “Why is that true?” “Does that always work?”. They explain their thinking to others and respond to others’ thinking.
4. Model with mathematics.
In grade 7, students model problem situations symbolically, graphically, tabularly, and contextually. Students form expressions, equations, or inequalities from real world contexts and connect symbolic and graphical representations. Students explore covariance and represent two quantities simultaneously. They use measures of center and variability and data displays (i.e. box plots and histograms) to draw inferences, make comparisons and formulate predictions. Students use experiments or simulations to generate data sets and create probability models. Students need many opportunities to connect and explain the connections between the different representations. They should be able to use all of these representations as appropriate to a problem context.
5. Use appropriate tools strategically.
Students consider available tools (including estimation and technology) when solving a mathematical problem and decide when certain tools might be helpful. For instance, students in grade 7 may decide to represent similar data sets using dot plots with the same scale to visually compare the center and variability of the data. Students might use physical objects or applets to generate probability data and use graphing calculators or spreadsheets to manage and represent data in different forms.
6. Attend to precision. In grade 7, students continue to refine their mathematical communication skills by using clear and precise language in their discussions with others and in their own reasoning. Students define variables, specify units of measure, and label axes accurately. Students use appropriate terminology when referring to rates, ratios, probability models, geometric figures, data displays, and components of expressions, equations or inequalities.
7. Look for and make use of structure.
Students routinely seek patterns or structures to model and solve problems. For instance, students recognize patterns that exist in ratio tables making connections between the constant of proportionality in a table with the slope of a graph. Students apply properties to generate equivalent expressions (i.e. 6 + 2x = 2 (3 + x) by distributive property) and solve equations (i.e. 2c + 3 = 15, 2c = 12 by subtraction property of equality; c=6 by division property of equality). Students compose and decompose two- and three-dimensional figures to solve real world problems involving scale drawings, surface area, and volume. Students examine tree diagrams or systematic lists to determine the sample space for compound events and verify that they have listed all possibilities.
8. Look for and express regularity in repeated reasoning.
In grade 7, students use repeated reasoning to understand algorithms and make generalizations about patterns. During multiple opportunities to solve and model problems, they may notice that a/b ÷ c/d = ad/bc and construct other examples and models that confirm their generalization. They extend their thinking to include complex fractions and rational numbers. Students formally begin to make connections between covariance, rates, and representations showing the relationships between quantities. They create, explain, evaluate, and modify probability models to describe simple and compound events.
CCGPS 7th Grade Math Content Standards Unpacked Page 6 of 55 Bibb County School System May 2012
Standards for Mathematical Content
In Grade 7, instructional time should focus on four critical areas: (1) developing understanding of and applying proportional relationships; (2) developing understanding of operations with rational numbers and working with expressions and linear equations; (3) solving problems involving scale drawings and informal geometric constructions, and working with two- and three-dimensional shapes to solve problems involving area, surface area, and volume; and (4) drawing inferences about populations based on samples. (1) Students extend their understanding of ratios and develop understanding of proportionality to solve single- and multi-step problems. Students use their understanding of ratios and proportionality to solve a wide variety of percent problems, including those involving discounts, interest, taxes, tips, and percent increase or decrease. Students solve problems about scale drawings by relating corresponding lengths between the objects or by using the fact that relationships of lengths within an object are preserved in similar objects. Students graph proportional relationships and understand the unit rate informally as a measure of the steepness of the related line, called the slope. They distinguish proportional relationships from other relationships. (2) Students develop a unified understanding of number, recognizing fractions, decimals (that have a finite or a repeating decimal representation), and percents as different representations of rational numbers. Students extend addition, subtraction, multiplication, and division to all rational numbers, maintaining the properties of operations and the relationships between addition and subtraction, and multiplication and division. By applying these properties, and by viewing negative numbers in terms of everyday contexts (e.g., amounts owed or temperatures below zero), students explain and interpret the rules for adding, subtracting, multiplying, and dividing with negative numbers. They use the arithmetic of rational numbers as they formulate expressions and equations in one variable and use these equations to solve problems. (3) Students continue their work with area from Grade 6, solving problems involving the area and circumference of a circle and surface area of three-dimensional objects. In preparation for work on congruence and similarity in Grade 8 they reason about relationships among two-dimensional figures using scale drawings and informal geometric constructions, and they gain familiarity with the relationships between angles formed by intersecting lines. Students work with three-dimensional figures, relating them to two-dimensional figures by examining cross-sections. They solve real-world and mathematical problems involving area, surface area, and volume of two- and three-dimensional objects composed of triangles, quadrilaterals, polygons, cubes and right prisms. (4) Students build on their previous work with single data distributions to compare two data distributions and address questions about differences between populations. They begin informal work with random sampling to generate data sets and learn about the importance of representative samples for drawing inferences.
CCGPS 7th Grade Math Content Standards Unpacked Page 7 of 55 Bibb County School System May 2012
Document Contents for Grade 7
Ratios and Proportional Relationships CC.7.RP
Analyze proportional relationships and use them to solve real-world and
mathematical problems.
o Instructional Strategies
o Instructional Resources/Tools
o Common Misconceptions
o Connections
Critical Areas of Focus
Other Grade Levels
o What students will know and be able to do
The Number System CC.7.NS
Apply and extend previous understandings of operations with fractions to add,
subtract, multiply, and divide rational numbers.
o Instructional Strategies
o Instructional Resources/Tools
o Common Misconceptions
o Connections
Critical Areas of Focus
Other Grade Levels
o What students will know and be able to do
Expressions and Equations CC.7.EE
Use properties of operations to generate equivalent expressions.
o Instructional Strategies
o Instructional Resources/Tools
o Common Misconceptions
o Connections
Critical Areas of Focus
Other Grade Levels
o What students will know and be able to do
Solve real-life and mathematical problems using numerical and algebraic
expressions and equations.
o Instructional Strategies
o Instructional Resources/Tools
o Common Misconceptions
o Connections
Critical Areas of Focus
Other Grade Levels
o What students will know and be able to do
Geometry CC.7.G
Draw, construct, and describe geometrical figures and describe the relationship
between them.
o Instructional Strategies
o Instructional Resources/Tools
o Common Misconceptions
o Connections
Critical Areas of Focus
Other Grade Levels
o What students will know and be able to do
Solve real-life and mathematical problems involving angle measure, area, surface
area, and volume.
o Instructional Strategies
o Instructional Resources/Tools
o Common Misconceptions
o Connections
Critical Areas of Focus
Other Grade Levels
o What students will know and be able to do
Statistics and Probability CC.7.SP
Use random sampling to draw inferences about a population.
o Instructional Strategies
o Instructional Resources/Tools
o Common Misconceptions
o Connections
Critical Areas of Focus
Other Grade Levels
o What students will know and be able to do
Draw informal comparative inferences about two populations.
o Instructional Strategies
o Instructional Resources/Tools
o Common Misconceptions
o Connections
Critical Areas of Focus
Other Grade Levels
o What students will know and be able to do
Investigate chance processes and develop, use, and evaluate probability models. o Instructional Strategies
o Instructional Resources/Tools
o Common Misconceptions
o Connections
Critical Areas of Focus
Other Grade Levels
o What students will know and be able to do
CCGPS 7th Grade Math Content Standards Unpacked Page 8 of 55 Bibb County School System May 2012
Ratios and Proportional Relationships CC.7.RP CCGPS Cluster: Analyze proportional relationships and use them to solve real-world and mathematical problems.
Instructional Strategies
Building from the development of rate and unit concepts in 6th grade,
applications now need to focus on solving unit-rate problems with more
sophisticated numbers: fractions per fractions.
Proportional relationships are further developed through the analysis of graphs,
tables, equations and diagrams. Ratio tables serve a valuable purpose in the
solution of proportional problems. This is the time to push for a deep
understanding of what a representation of a proportional relationship looks like
and what the characteristics are: a straight line through the origin on a graph, a
“rule” that applies for all ordered pairs, an equivalent ratio or an expression
that describes the situation, etc. This is not the time for students to learn to
cross multiply to solve problems.
Because percents have been introduced as rates in Grade 6, the work with
percents should continue to follow the thinking involved with rates and
proportions. Solutions to problems can be found by using the same strategies
for solving rates, such as looking for equivalent ratios or based upon
understandings of decimals. Previously, percents have focused on “out of 100”;
now percents above 100 are encountered.
Providing opportunities to solve problems based within contexts that are
relevant to seventh graders will connect meaning to rates, ratios and
proportions. Examples include: researching newspaper ads and constructing
their own question(s), keeping a log of prices (particularly sales) and
determining savings by purchasing items on sale, timing students as they walk
a lap on the track and figuring their rates, creating open-ended problem
scenarios with and without numbers to give students the opportunity to
demonstrate conceptual understanding, inviting students to create a similar
problem to a given problem and explain their reasoning.
Instructional Resources/Tools Common Misconceptions
Play money - act out a problem with play money
Advertisements in newspapers
Unlimited manipulatives or tools (don’t restrict the tools to one or two;
give students many options)
Connections – Critical Areas of Focus Connections to Other Grade Levels
This cluster is connected to the first Critical Area of Focus for 7th grade,
Developing understanding of and applying proportional relationships, and
the second CCSSM Critical Area of Focus for 7th grade, Developing
understanding of operations with rational numbers and working with
expressions and linear equations.
This cluster grows out of Ratio and Proportional Relationships (6th grade) and
the Number System (6th grade), and relates to Expressions and Equations (7
th
grade).
Cross curricular connections: economics, personal finance, reading strategies
Standards Mathematical Practices
What students
should know
What students
should do
Prerequisites Examples/Explanations
7.RP.1 Compute unit rates associated with ratios of fractions, including ratios of lengths, areas and
7.MP.2. Reason abstractly and quantitatively. 7.MP.6. Attend
unit rates ratios fractions length area
compute
ratio proportional relationships operations with
Students continue to work with unit rates from 6th
grade; however, the comparison now includes fractions
compared to fractions. For example, if 2
1gallon of paint
CCGPS 7th Grade Math Content Standards Unpacked Page 9 of 55 Bibb County School System May 2012
other quantities measured in like or different units. For example, if a person walks ½ mile in each ¼ hour, compute the unit rate as the complex fraction ½/¼ miles per hour, equivalently 2 miles per hour. DOK 1
to precision. quantities like units different units
fractions units of measurement
covers 6
1of a wall, then the amount of paint needed for
the entire wall can be computed by 2
1gal /
6
1wall. This
calculation gives 3 gallons. This standard requires only the use of ratios as fractions. Fractions may be proper or improper.
7.RP.2 Recognize and represent proportional relationships between quantities.
a. Decide whether two quantities are in a proportional relationship, e.g., by testing for equivalent ratios in a table or graphing on a coordinate plane and observing whether the graph is a straight line through the origin.
DOK 1
7.MP.1. Make sense of problems and persevere in solving them. 7.MP.2. Reason abstractly and quantitatively. 7.MP.3. Construct viable arguments and critique the reasoning of others. 7.MP.4. Model with mathematics. 7.MP.5. Use appropriate tools strategically. 7.MP.6. Attend to precision. 7.MP.7. Look for and make use of structure.
ratio proportional relationships operations with fractions graphing points and lines
Students’ understanding of the multiplicative reasoning used with proportions continues from 6
th grade. Students
determine if two quantities are in a proportional relationship from a table. For example, the table below gives the price for different number of books. Do the numbers in the table represent a proportional relationship? Students can examine the numbers to see that 1 book at 3 dollars is equivalent to 4 books for 12 dollars since both sides of the tables can be multiplied by 4. However, the 7 and 18 are not proportional since 1 book times 7 and 3 dollars times 7 will not give 7 books for 18 dollars. Seven books for $18 is not proportional to the other amounts in the table; therefore, there is not a constant of proportionality.
Students graph relationships to determine if two quantities are in a proportional relationship and interpret the ordered pairs. If the amounts from the table above are graphed (number of books, price), the pairs (1, 3), (3, 9), and (4, 12) will form a straight line through the origin (0 books cost 0 dollars), indicating that these pairs are in a proportional relationship. The ordered pair (4, 12) means that 4 books cost $12. However, the ordered pair (7, 18) would not be on the line, indicating that it is not proportional to the other pairs. The ordered pair (1, 3) indicates that 1 book is $3, which
Return to Contents
CCGPS 7th Grade Math Content Standards Unpacked Page 10 of 55 Bibb County School System May 2012
7.MP.8. Look for and express regularity in repeated reasoning.
is the unit rate. The y-coordinate when x = 1 will be the unit rate.
b. Identify the constant of proportionality (unit rate) in tables, graphs, equations, diagrams, and verbal descriptions of proportional relationships.
DOK 1
7.MP.1. Make sense of problems and persevere in solving them. 7.MP.2. Reason abstractly and quantitatively. 7.MP.3. Construct viable arguments and critique the reasoning of others. 7.MP.4. Model with mathematics. 7.MP.5. Use appropriate tools strategically. 7.MP.6. Attend to precision. 7.MP.7. Look for and make use of structure. 7.MP.8. Look for and express regularity in repeated reasoning.
constant of proportionality unit rate tables graphs equations diagrams verbal descriptions proportional relationships
identify
understanding of proportionality unit rates solving equations evaluating expressions finding patterns
The constant of proportionality is the unit rate. Students identify this amount from tables (see example above), graphs, equations and verbal descriptions of proportional relationships. The graph below represents the price of the bananas at one store. What is the constant of proportionality? From the graph, it can be determined that 4 pounds of bananas is $1.00; therefore, 1 pound of bananas is $0.25, which is the constant of proportionality for the graph. Note: Any point on the graph will yield this constant of proportionality.
The cost of bananas at another store can be determined by the equation: P = $0.35n, where P is the price and n is the number of pounds. What is the constant of proportionality (unit rate)? Students write equations from context and identify the coefficient as the unit rate which is also the constant of proportionality.
Note: This standard focuses on the representations of proportions. Solving proportions is addressed in CC.7.SP.3.
CCGPS 7th Grade Math Content Standards Unpacked Page 11 of 55 Bibb County School System May 2012
c. Represent proportional relationships by equations. For example, if total cost t is proportional to the number n of items purchased at a constant price p, the relationship between the total cost and the number of items can be expressed as t = pn.
DOK 2
7.MP.1. Make sense of problems and persevere in solving them. 7.MP.2. Reason abstractly and quantitatively. 7.MP.3. Construct viable arguments and critique the reasoning of others. 7.MP.4. Model with mathematics. 7.MP.5. Use appropriate tools strategically. 7.MP.6. Attend to precision. 7.MP.7. Look for and make use of structure. 7.MP.8. Look for and express regularity in repeated reasoning.
proportional relationships equations
represent
understanding of constant of proportionality writing an equation
Example:
The graph below represents the cost of gum packs as a unit rate of $2 dollars for every pack of gum. The unit rate is represented as $2/pack. Represent the relationship using a table and an equation.
Equation: d = 2g, where d is the cost in dollars and g is the packs of gum
A common error is to reverse the position of the variables when writing equations. Students may find it useful to use variables specifically related to the quantities rather than using x and y. Constructing verbal models can also be helpful. A student might describe the situation as “the number of packs of gum times the cost for each pack is the total cost in dollars”. They can use this verbal model to construct the equation. Students can check their equation by substituting values and comparing their results to the table. The checking process helps student revise and recheck their model as necessary. The number of packs of gum times the cost for each pack is the total cost (g x 2 = d).
Number of Packs of Gum (g)
Cost in Dollars (d)
0 0
1 2
2 4
3 6
4 8
d. Explain what a point (x, y) on the graph of a proportional relationship means in terms of the situation, with special attention to the points (0, 0) and (1, r) where r
7.MP.1. Make sense of problems and persevere in solving them. 7.MP.2. Reason abstractly and quantitatively.
point graph proportional relationship situation unit rate
explain
plotting points solutions of equations understanding proportional relationships
CCGPS 7th Grade Math Content Standards Unpacked Page 12 of 55 Bibb County School System May 2012
is the unit rate. DOK 2
7.MP.3. Construct viable arguments and critique the reasoning of others. 7.MP.4. Model with mathematics. 7.MP.5. Use appropriate tools strategically. 7.MP.6. Attend to precision. 7.MP.7. Look for and make use of structure. 7.MP.8. Look for and express regularity in repeated reasoning.
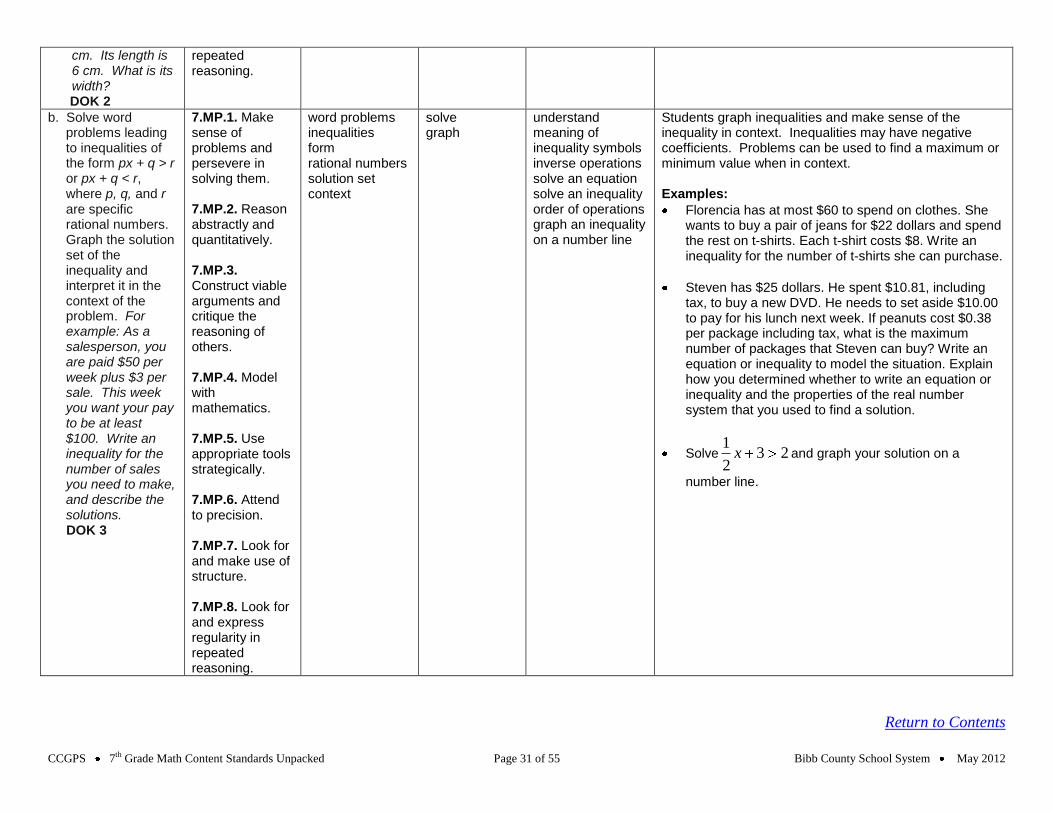
7.RP.3 Use proportional relationships to solve multistep ratio and percent problems. Examples: simple interest, tax, markups and markdowns, gratuities and commissions, fees, percent increase and decrease, percent error. DOK 2
7.MP.1. Make sense of problems and persevere in solving them. 7.MP.2. Reason abstractly and quantitatively. 7.MP.3. Construct viable arguments and critique the reasoning of others.
proportional relationships multistep ratio percent
use solve
solve proportions solve equations operations with percents, decimals, and fractions
In 6th grade, students used ratio tables and unit rates to
solve problems. Students expand their understanding of proportional reasoning to solve problems that are easier to solve with cross-multiplication. Students understand the mathematical foundation for cross-multiplication. Students should be able to explain or show their work using a representation (numbers, words, pictures, physical objects, or equations) and verify that their answer is reasonable. Models help students to identify the parts of the problem and how the values are related.
For example, a recipe calls for ¾ teaspoon of butter for every 2 cups of milk. If you increase the recipe to use 3 cups of milk, how many teaspoons of butter are needed?
Using these numbers to find the unit rate may not be the most efficient method. Students can set up the following proportion to show the relationship between butter and
CCGPS 7th Grade Math Content Standards Unpacked Page 13 of 55 Bibb County School System May 2012
7.MP.4. Model with mathematics. 7.MP.5. Use appropriate tools strategically. 7.MP.6. Attend to precision. 7.MP.7. Look for and make use of structure. 7.MP.8. Look for and express regularity in repeated reasoning.
milk.
3=
2
4
3
x
The use of proportional relationships is also extended to solve percent problems involving tax, markups and markdowns simple interest (I = prt, where I = interest, p = principal, r = rate, and t = time), gratuities and commissions, fees, percent increase and decrease, and percent error.
Examples:
Games Unlimited buys video games for $10. The store increases the price 300%? What is the price of the video game?
Using proportional reasoning, if $10 is 100% then what amount would be 300%? Since 300% is 3 times 100%, $30 would be $10 times 3. Thirty dollars represents the amount of increase from $10 so the new price of the video game would be $40.
Gas prices are projected to increase 124% by April 2015. A gallon of gas currently costs $4.17. What is the projected cost of a gallon of gas for April 2015?
A student might say: “The original cost of a gallon of gas is $4.17. An increase of 100% means that the cost will double. I will also need to add another 24% to figure out the final projected cost of a gallon of gas. Since 25% of $4.17 is about $1.04, the projected cost of a gallon of gas should be around $9.40.”
$4.17 + 4.17 + (0.24 4.17) = 2.24 x 4.17
A sweater is marked down 33%. Its original price was
$37.50. What is the price of the sweater before sales tax?
Return to Contents
100%
$4.17
100%
$4.17
24%
?
CCGPS 7th Grade Math Content Standards Unpacked Page 14 of 55 Bibb County School System May 2012
The discount is 33% times 37.50. The sale price of the sweater is the original price minus the discount or 67% of the original price of the sweater, or Sale Price = 0.67 x Original Price.
A shirt is on sale for 40% off. The sale price is $12. What was the original price? What was the amount of the discount?
Finding the percent error is the process of expressing the size of the error (or deviation) between two measurements. To calculate the percent error, students determine the absolute deviation (positive difference) between an actual measurement and the accepted value and then divide by the accepted value. Multiplying by 100 will give the percent error.
Return to Contents
37.50 Original Price of Sweater
33% of 37.50
Discount
67% of 37.50 Sale price of sweater
Discount 40% of original price
Sale Price - $12 60% of original price
Original Price (p)
0.60p = 12
CCGPS 7th Grade Math Content Standards Unpacked Page 15 of 55 Bibb County School System May 2012
The Number System Transition Standards for 2012-2013 CC.6.NS CCGPS Cluster: Compute fluently with multi-digit numbers and find common factors and multiples.
CCGPS What does this standard mean that a student will know and be able to do?
CC.6.NS.5 Understand that positive
and negative numbers are used together
to describe quantities having opposite
directions or values (e.g., temperature
above/below zero, elevation
above/below sea level, credits/debits,
positive/negative electric charge); use
positive and negative numbers to
represent quantities in real-world
contexts, explaining the meaning of 0 in
each situation.
Students use rational numbers (fractions, decimals, and integers) to represent real-world contexts and understand
the meaning of 0 in each situation. For example, 25 feet below sea level can be represented as –25; 25 feet above
sea level can be represented as +25. In this scenario, zero would represent sea level.
CC.6.NS.6 Understand a rational
number as a point on the number line.
Extend number line diagrams and
coordinate axes familiar from previous
grades to represent points on the line
and in the plane with negative number
coordinates.
a. Recognize opposite signs of numbers
as indicating locations on opposite
sides of 0 on the number line;
recognize that the opposite of the
opposite of a number is the number
itself, e.g., – (–3) = 3, and that 0 is its
own opposite.
In elementary school, students worked with positive fractions, decimals and whole numbers on the number line. In 6th
grade, students extend the number line to represent all rational numbers and recognize that number lines may be either
horizontal or vertical (i.e., thermometer). Students recognize that a number and its opposite are equidistance from zero
(reflections about the zero). The opposite sign (–) shifts the number to the opposite side of 0. For example, – 4 could
be read as “the opposite of 4” which would be negative 4. The following example, – (–6.4), would be read as “the
opposite of the opposite of 6.4” which would be 6.4. Zero is its own opposite.
b. Understand signs of numbers in
ordered pairs as indicating locations
in quadrants of the coordinate plane;
recognize that when two ordered
pairs differ only by signs, the
locations of the points are related by
reflections across one or both axes.
Students worked with Quadrant I in elementary school. As the x-axis and y-axis are extending to include negatives,
students begin to with the Cartesian Coordinate system. Students recognize the point where the x-axis and y-axis
intersect as the origin. Students identify the four quadrants and are able to identify the quadrant for an ordered pair
based on the signs of the coordinates. For example, students recognize that in Quadrant II, the signs of all ordered pairs
would be (–, +).
Students understand the relationship between two ordered pairs differing only by signs as reflections across one or both
axes. For example, in the ordered pairs (–2, 4) and (–2, –4), the y-coordinates differ only by signs, which represents a
reflection across the x-axis. A change is the x-coordinates from (–2, 4) to (2, 4), represents a reflection across the y-
axis. When the signs of both coordinates change, [(2, –4) changes to (-2, 4)], the ordered pair has been reflected across
both axes.
CCGPS 7th Grade Math Content Standards Unpacked Page 16 of 55 Bibb County School System May 2012
c. Find and position integers and other
rational numbers on a horizontal or
vertical number line diagram; find
and position pairs of integers and
other rational numbers on a
coordinate plane.
Students are able to plot all rational numbers on a number line (either vertical or horizontal) or identify the values of
given points on a number line. For example, students are able to identify where the following numbers would be on a
number line: –4.5, 2, 3.2, –5
33 , 0.2, –2,
2
11.
6.NS.7 Understand ordering and
absolute value of rational numbers.
a. Interpret statements of inequality as
statements about the relative position
of two numbers on a number line.
For example, interpret –3 > –7 as a
statement that –3 is located to the
right of –7 on a number line oriented
from left to right.
Students identify the absolute value of a number as the distance from zero but understand that although the value of –7
is less than –3, the absolute value (distance) of –7 is greater than the absolute value (distance) of –3. Students use
inequalities to express the relationship between two rational numbers, understanding that the value of numbers is
smaller moving to the left on a number line. For example, –4 ½ < –2 because –4 ½ is located to the left of –2 on the
number line.
b. Write, interpret, and explain
statements of order for rational
numbers in real-world contexts. For
example, write –3oC > –7oC to
express the fact that –3oC is warmer
than –7oC.
Students write statements using < or > to compare rational number in context. However, explanations should reference
the context rather than “less than” or “greater than”. For example, the balance in Sue’s checkbook was –12.55. The
balance in John’s checkbook was –10.45. Since –12.55 < –10.45, Sue owes more than John. The interpretation could
also be “John owes less than Sue”.
c. Understand the absolute value of a
rational number as its distance from
0 on the number line; interpret
absolute as magnitude for a positive
or negative quantity in a real-world
situation. For example, for an
account balance of –30 dollars, write
|–30| = 30 to describe the size of the
debt in dollars.
Students understand absolute value as the distance from zero and recognize the symbols | | as representing absolute
value. For example, | –7 | can be interpreted as the distance –7 is from 0 which would be 7. Likewise | 7 | can be
interpreted as the distance 7 is from 0 which would also be 7. In real-world contexts, the absolute value can be used to
describe size or magnitude. For example, for an ocean depth of –900 feet, write | –900| = 900 to describe the distance
below sea level.
d. Distinguish comparisons of absolute
value from statements about order.
For example, recognize that an
account balance less than –30
dollars represents a debt greater
than 30 dollars.
When working with positive numbers, the absolute value (distance from zero) of the number and the value of the
number is the same; therefore, ordering is not problematic. However, negative numbers have a distinction that students
need to understand. As the negative number increases (moves to the left on a number line), the value of the number
decreases. For example, –24 is less than –14 because –24 is located to the left of –14 on the number line. However,
absolute value is the distance from zero. In terms of absolute value (or distance) the absolute value of –24 is greater
than –14. For negative numbers, as the absolute value increases, the value of the number decreases.
CC.6.NS.8 Solve real-world and
mathematical problems by graphing
points in all four quadrants of the
Students find the distance between points whose ordered pairs have the same x-coordinate (vertical) or same y-
coordinate (horizontal). For example, the distance between (–5, 2) and (–9, 2) would be 4 units. This would be a
horizontal line since the y-coordinates are the same. In this scenario, both coordinates are in the same quadrant. The
CCGPS 7th Grade Math Content Standards Unpacked Page 17 of 55 Bibb County School System May 2012
coordinate plane. Include use of
coordinates and absolute value to find
distances between points with the same
first coordinate or the same second
coordinate.
distance can be found by using a number line to find the distance between –5 and –9. Students could also recognize that
–5 is 5 units from 0 (absolute value) and that –9 is 9 units from 0 (absolute value). Since both of these are in the same
quadrant, the distance can be found by finding the difference between 9 and 5. (| 9 | – | 5 |).
Coordinates could also be in two quadrants. For example, the distance between (3, –5) and (3, 7) would be 12 units.
This would be a vertical line since the x-coordinates are the same. The distance can be found by using a number line to
count from –5 to 7 or by recognizing that the distance (absolute value) from –5 to 0 is 5 units and the distance (absolute
value) from 0 to 7 is 7 units so the total distance would be 5 + 7 or 12 units.
Return to Contents
CCGPS 7th Grade Math Content Standards Unpacked Page 18 of 55 Bibb County School System May 2012
The Number System CC.7.NS CCGPS Cluster: Apply and extend previous understandings of operations with fractions to add, subtract, multiply, and divide rational
numbers.
Instructional Strategies
This cluster builds upon the understandings of rational numbers in Grade 6:
quantities can be shown using + or – as having opposite directions or
values,
points on a number line show distance and direction,
opposite signs of numbers indicate locations on opposite sides of 0 on
the number line,
the opposite of an opposite is the number itself,
the absolute value of a rational number is its distance from 0 on the
number line,
the absolute value is the magnitude for a positive or negative quantity,
and
locating and comparing locations on a coordinate grid by using
negative and positive numbers.
Learning now moves to exploring and ultimately formalizing rules for
operations (addition, subtraction, multiplication and division) with integers are
combined. Number lines present a visual image for students to explore and
record addition and subtraction results. Two-color counters or colored chips
can be used as a physical and kinesthetic model for adding and subtracting
integers. With one color designated to represent positives and a second color
for negatives, addition/subtraction can be represented by placing the
appropriate numbers of chips for the addends and their signs on a board. Using
the notion of opposites, the board is simplified by removing pairs of opposite
colored chips. The answer is the total of the remaining chips with the sign
representing the appropriate color. Repeated opportunities over time will allow
students to compare the results of adding and subtracting pairs of numbers,
leading to the generalization of the rules. Fractional rational numbers and
whole numbers should be used in computations and explorations. Students
should be able to give contextual examples of integer operations, write and
solve equations for real-world problems and explain how the properties of
operations apply. Real-world situations could include: profit/loss, money,
weight, sea level, debit/credit, football yardage, etc.
Using what students already know about positive and negative whole numbers
and multiplication with its relationship to division, students should generalize
rules for multiplying and dividing rational numbers. Multiply or divide the
same as for positive numbers, then designate the sign according to the number
of negative factors. Students should analyze and solve problems leading to the
generalization of the rules for operations with integers.
For example, beginning with known facts, students predict the answers for
related facts, keeping in mind that the properties of operations apply (See
Tables 1, 2 and 3 below).
Using the language of “the opposite of” helps some students understand the
multiplication of negatively signed numbers ( -4 x -4 = 16, the opposite of 4
groups of -4). Discussion about the tables should address the patterns in the
products, the role of the signs in the products and commutativity of
multiplication. Then students should be asked to answer these questions and
prove their responses.
Is it always true that multiplying a negative factor by a positive factor
results in a negative product?
Does a positive factor times a positive factor always result in a positive
product?
What is the sign of the product of two negative factors?
When three factors are multiplied, how is the sign of the product
determined?
How is the numerical value of the product of any two numbers found?
Students can use number lines with arrows and hops, groups of colored chips
or logic to explain their reasoning. When using number lines, establishing
which factor will represent the length, number and direction of the hops will
CCGPS 7th Grade Math Content Standards Unpacked Page 19 of 55 Bibb County School System May 2012
facilitate understanding. Through discussion, generalization of the rules for
multiplying integers would result.
Division of integers is best understood by relating division to multiplication
and applying the rules. In time, students will transfer the rules to division
situations. (Note: In 2b, this algebraic language (–(p/q) = (–p)/q = p/(–q)) is
written for the teacher’s information, not as an expectation for students.)
Ultimately, students should solve other mathematical and real-world problems
requiring the application of these rules with fractions and decimals.
In 7th grade, the awareness of rational and irrational numbers is initiated by
observing the result of changing fractions to decimals. Students should be
provided with families of fractions, such as, sevenths, ninths, thirds, etc. to
convert to decimals using long division. The equivalents can be grouped and
named (terminating or repeating). Students should begin to see why these patterns
occur. Knowing the formal vocabulary rational and irrational is not expected.
Instructional Resources/Tools Common Misconceptions
Two-color counters
Calculators
National Library of Virtual Manipulatives
o Circle 3 http://nlvm.usu.edu/en/nav/frames_asid_187_g_3_t_1.html
A puzzle involving adding positive real numbers to sum to three.
A puzzle involving adding positive and negative integers to sum to
21.
Connections – Critical Areas of Focus Connections to Other Grade Levels
This cluster is connected to the second Critical Area of Focus for 7th grade,
Developing understanding of operations with rational numbers and
working with expressions and linear equations.
Standards Mathematical Practices
What students
should know
What students
should do
Prerequisites Examples/Explanations
7.NS.1 Apply and extend previous understandings of addition and subtraction to add and subtract rational numbers; represent addition and subtraction on a horizontal or vertical number line diagram.
CCGPS 7th Grade Math Content Standards Unpacked Page 20 of 55 Bibb County School System May 2012
a. Describe situations in which opposite quantities combine to make 0. For example, a hydrogen atom has 0 charge because its two constituents are oppositely charged.
DOK 1
7.MP.2. Reason abstractly and quantitatively. 7.MP.4. Model with mathematics. 7.MP.7. Look for and make use of structure.
situations opposite quantities combine
describe
positive and negative numbers
Visual representations may be helpful as students begin this work; they become less necessary as students become more fluent with the operations.
b. Understand p + q as the number located a distance |q| from p, in the positive or negative direction depending on whether q is positive or negative. Show that a number and its opposite have a sum of 0 (are additive inverses). Interpret sums of rational numbers by describing real-world contexts.
DOK 2
7.MP.2. Reason abstractly and quantitatively. 7.MP.4. Model with mathematics. 7.MP.7. Look for and make use of structure.
number distance positive negative direction opposite sum additive inverse rational numbers real-world contexts
understand show interpret describe
absolute value number lines adding numbers
Students add and subtract rational numbers using a number line. For example, to add –5 + 7, students would find –5 on the number line and move 7 in a positive direction (to the right). The stopping point of 2 is the sum of this expression. Students also add negative fractions and decimals and interpret solutions in given contexts. -3 and 3 are shown to be opposites on the number line because they are equal distance from zero and therefore have the same absolute value and the sum of the number and it’s opposite is zero.
c. Understand subtraction of rational numbers as adding the additive inverse, p – q = p + (–q). Show that the distance between two rational numbers on the number line is the absolute value of their difference,
7.MP.2. Reason abstractly and quantitatively. 7.MP.4. Model with mathematics. 7.MP.7. Look for and make use of structure.
subtraction rational numbers additive inverse distance number line absolute value difference principle real-world contexts
understand show apply
operations with whole numbers number lines absolute value inverse operations
Example:
Use a number line to illustrate: o p - q o p + (- q) o Is this equation true p – q = p + (-q)
CCGPS 7th Grade Math Content Standards Unpacked Page 21 of 55 Bibb County School System May 2012
and apply this principle in real-world contexts.
DOK 2
d. Apply properties of operations as strategies to add and subtract rational numbers.
DOK 1
7.MP.2. Reason abstractly and quantitatively. 7.MP.4. Model with mathematics. 7.MP.7. Look for and make use of structure.
properties of operations strategies rational numbers
apply add subtract
operations with whole numbers number lines inverse operations
You have $4 and you need to pay a friend $3. What will you have after paying your friend?
4 + (-3) = 1 or (-3) + 4 = 1
7.NS.2 Apply and extend previous understandings of multiplication and division and of fractions to multiply and divide rational numbers. a. Understand that
multiplication is extended from fractions to rational numbers by requiring that operations continue to satisfy the properties of operations, particularly the distributive property, leading to products such as (–1)(–1) = 1 and the rules for multiplying signed numbers. Interpret products of rational numbers by
7.MP.2. Reason abstractly and quantitatively. 7.MP.4. Model with mathematics. 7.MP.7. Look for and make use of structure.
multiplication fractions rational numbers operations properties of operations distributive property products rules signed numbers real-world contexts
understand interpret describe
operations with fractions order of operations number lines distributive property
Multiplication and division of integers is an extension of multiplication and division of whole numbers.
Equation Number Line Model
Context
2 x 3 = 6
Selling two packages of apples at $3.00 per pack
2 x -3 = -6
Spending 3 dollars each on 2 packages of apples
-2 x 3 = -6
Owing 2 dollars to each of your three friends
-2 x -3 = 6
Forgiving 3 debts of $2.00 each
CCGPS 7th Grade Math Content Standards Unpacked Page 22 of 55 Bibb County School System May 2012
describing real-world contexts.
DOK 2
b. Understand that integers can be divided, provided that the divisor is not zero, and every quotient of integers (with non-zero divisor) is a rational number. If p and q are integers, then –(p/q) = (–p)/q = p/(–q). Interpret quotients of rational numbers by describing real-world contexts.
DOK 2
7.MP.2. Reason abstractly and quantitatively. 7.MP.4. Model with mathematics. 7.MP.7. Look for and make use of structure.
integers divisor zero quotient non-zero divisor rational number real-world contexts
understand interpret
division Students recognize that when division of rational numbers is represented with a fraction bar, each number can have a negative sign.
c. Apply properties of operations as strategies to multiply and divide rational numbers.
DOK 1
7.MP.2. Reason abstractly and quantitatively. 7.MP.4. Model with mathematics. 7.MP.7. Look for and make use of structure.
properties of operations strategies rational numbers
apply multiply divide
multiplication and division
d. Convert a rational number to a decimal using long division; know that the decimal form of a rational number terminates in 0s or eventually repeats.
DOK 1
7.MP.2. Reason abstractly and quantitatively. 7.MP.4. Model with mathematics. 7.MP.7. Look for and make use of structure.
rational number decimal long division decimal form terminate repeat
convert know
division decimals
Using long division from elementary school, students understand the difference between terminating and repeating decimals. This understanding is foundational for work with rational and irrational numbers in 8
th grade.
For example, identify which fractions will terminate (the denominator of the fraction in reduced form only has factors of 2 and/or 5).
CCGPS 7th Grade Math Content Standards Unpacked Page 23 of 55 Bibb County School System May 2012
7.NS.3 Solve real-world and mathematical problems involving the four operations with rational numbers.
1
DOK 2
7.MP.1. Make sense of problems and persevere in solving them. 7.MP.2. Reason abstractly and quantitatively. 7.MP.5. Use appropriate tools strategically. 7.MP.6. Attend to precision. 7.MP.7. Look for and make use of structure. 7.MP.8. Look for and express regularity in repeated reasoning.
real-world mathematical problems four operations rational numbers
solve operations with numbers order of operations
Students use order of operations from 6th grade to write
and solve problem with all rational numbers.
Return to Contents
1 Computations with rational numbers extend the rules for manipulating fractions to complex fractions.
CCGPS 7th Grade Math Content Standards Unpacked Page 24 of 55 Bibb County School System May 2012
Expressions and Equations Transition Standards for 2012-2013 CC.6.EE CCGPS Cluster: Apply and extend previous understanding of arithmetic to algebraic expressions.
CCGPS What does this standard mean that a student will know and be able to do?
CC.6.EE.3 Apply the properties of
operations to generate equivalent
expressions. For example, apply the
distributive property to the expression
3(2 + x) to produce the equivalent
expression 6 + 3x; apply the distributive
property to the expression 24x + 18y to
produce the equivalent expression
6(4x + 3y); apply properties of
operations to y + y + y to produce the
equivalent expression 3y.
Students use the distributive property to write equivalent expressions. For example,
area models from elementary can be used to illustrate the distributive property with
variables. Given that the width is 4.5 units and the length can be represented by
x + 2, the area of the flowers below can be expressed as 4.5(x + 3) or 4.5x + 13.5.
When given an expression representing area, students need to find the factors. For
example, the expression 10x + 15 can represent the area of the figure at the right.
Students find the greatest common factor (5) to represent the width and then use the
distributive property to find the length (2x + 3). The factors (dimensions) of this figure
would be 5(2x + 3).
CC.6.EE.4 Identify when two
expressions are equivalent (i.e., when
the two expressions name the same
number regardless of which value is
substituted into them). For example, the
expressions y + y + y and 3y are
equivalent because they name the same
number regardless of which number y
stands for.
Students demonstrate an understanding of like terms as quantities being added or subtracted with the same variables and
exponents. For example, 3x + 4x are like terms and can be combined as 7x; however, 3x + 4x2 are not.
This concept can be illustrated by substituting in a value for x. For example, 9x – 3x = 6x, not 6. Choosing a value for
x, such as 2, can prove non-equivalence.
9(2) – 3(2) = 6(2)
18 – 6 = 12
12 = 12
however 9(2) – 3(2) ? 6
18– 6 ? 6
12 ≠ 6
Expressions and Equations Transition Standards for 2012-2013 CC.6.EE CCGPS Cluster: Reason about and solve one-variable equations and inequalities.
CCGPS What does this standard mean that a student will know and be able to do?
CC.6.EE.6 Use variables to represent
numbers and write expressions when
solving a real-world or mathematical
problem; understand that a variable can
represent an unknown number, or,
depending on the purpose at hand, any
number in a specified set.
Students write expressions to represent various real-world situations. For example, the expression a + 3 could represent
Susan’s age in three years, when a represents her present age. The expression 2n represents the number of wheels on
any number of bicycles. Other contexts could include age (Johnny’s age in 3 years if a represents his current age) and
money (value of any number of quarters)
Given a contextual situation, students define variables and write an expression to represent the situation. For example,
the skating rink charges $100 to reserve the place and then $5 per person. Write an expression to represent the cost for
any number of people.
Let n = the number of people.
Then an expression for the cost for any number of people is 100 + 5n.
CCGPS 7th Grade Math Content Standards Unpacked Page 25 of 55 Bibb County School System May 2012
CC.6.EE.8 Write an inequality of the
form x > c or x < c to represent a
constraint or condition in a real-world or
mathematical problem. Recognize that
inequalities of the form x > c or x < c
have infinitely many solutions;
represent solutions of such inequalities
on number line diagrams.
Many real-world situations are represented by inequalities. Students write an inequality and represent solutions on a
number line for various contextual situations.
For example, the class must raise at least $80 to go on the field trip. If m represents money, then the relationship can be
expressed by the inequality m ≥ $80. Students recognize that possible values can include too many decimal values to
name. Therefore, the values are represented on a number line by shading.
A number line diagram is drawn with an open circle when an inequality contains a < or > symbol to show solutions that
are less than or greater than the number but not equal to the number. The circle is shaded, as in the example above,
when the number is to be included. Students recognize that possible values can include fractions and decimals, which
are represented on the number line by shading. Shading is extended through the arrow on a number line to show that an
inequality has an infinite number of solutions.
Return to Contents
CCGPS 7th Grade Math Content Standards Unpacked Page 26 of 55 Bibb County School System May 2012
Expressions and Equations CC.7.EE CCGPS Cluster: Use properties of operations to generate equivalent expressions.
Instructional Strategies
Have students build on their understanding of order of operations and use the
properties of operations to rewrite equivalent numerical expressions that were
developed in Grade 6. Students continue to use properties that were initially
used with whole numbers and now develop the understanding that properties
hold for integers, rational and real numbers.
Provide opportunities to build upon this experience of writing expressions
using variables to represent situations and use the properties of operations to
generate equivalent expressions. These expressions may look different and use
different numbers, but the values of the expressions are the same.
Provide opportunities for students to experience expressions for amounts of
increase and decrease. In Standard 2, the expression is rewritten and the
variable has a different coefficient. In context, the coefficient aids in the
understanding of the situation. Another example is this situation which
represents a 10% decrease: b - 0.10b = 1.00b - 0.10b which equals 0.90b or
90% of the amount.
One method that students can use to become convinced that expressions are
equivalent is by substituting a numerical value for the variable and evaluating
the expression. For example 5(3 + 2x) is equal to 5 3 + 5 2x. Let x = 6 and
substitute 6 for x in both equations.
5(3 + 2 6)
5(3 + 12)
5 (15)
75
5 3 + 5 2 6
15 + 60
75
Provide opportunities for students to use and understand the properties of
operations. These include: the commutative, associative, identity, and inverse
properties of addition and of multiplication, and the zero property of
multiplication. Another method students can use to become convinced that
expressions are equivalent is to justify each step of simplification of an
expression with an operation property.
Instructional Resources/Tools Common Misconceptions
CCGPS 7th Grade Math Content Standards Unpacked Page 27 of 55 Bibb County School System May 2012
Standards Mathematical Practices
What students
should know
What students
should do
Prerequisites Examples/Explanations
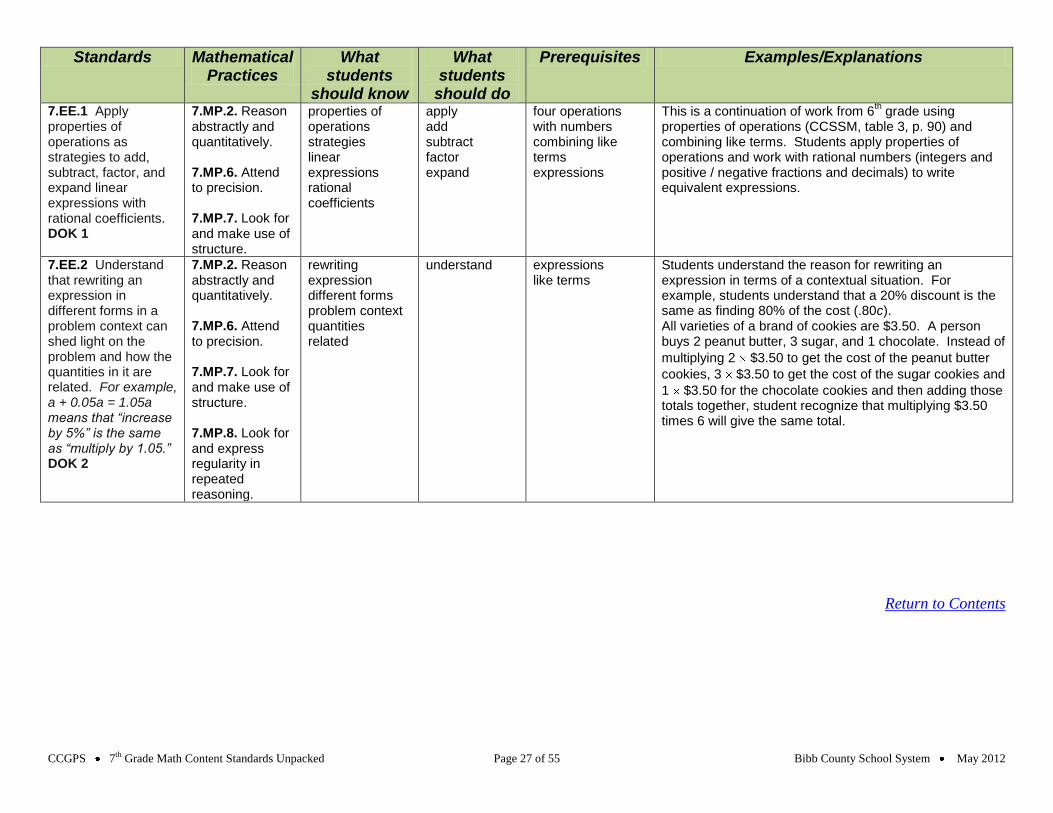
7.EE.1 Apply properties of operations as strategies to add, subtract, factor, and expand linear expressions with rational coefficients. DOK 1
7.MP.2. Reason abstractly and quantitatively. 7.MP.6. Attend to precision. 7.MP.7. Look for and make use of structure.
properties of operations strategies linear expressions rational coefficients
apply add subtract factor expand
four operations with numbers combining like terms expressions
This is a continuation of work from 6th grade using
properties of operations (CCSSM, table 3, p. 90) and combining like terms. Students apply properties of operations and work with rational numbers (integers and positive / negative fractions and decimals) to write equivalent expressions.
7.EE.2 Understand that rewriting an expression in different forms in a problem context can shed light on the problem and how the quantities in it are related. For example, a + 0.05a = 1.05a means that “increase by 5%” is the same as “multiply by 1.05.” DOK 2
7.MP.2. Reason abstractly and quantitatively. 7.MP.6. Attend to precision. 7.MP.7. Look for and make use of structure. 7.MP.8. Look for and express regularity in repeated reasoning.
rewriting expression different forms problem context quantities related
understand
expressions like terms
Students understand the reason for rewriting an expression in terms of a contextual situation. For example, students understand that a 20% discount is the same as finding 80% of the cost (.80c). All varieties of a brand of cookies are $3.50. A person buys 2 peanut butter, 3 sugar, and 1 chocolate. Instead of
multiplying 2 $3.50 to get the cost of the peanut butter
cookies, 3 $3.50 to get the cost of the sugar cookies and
1 $3.50 for the chocolate cookies and then adding those totals together, student recognize that multiplying $3.50 times 6 will give the same total.
Return to Contents
CCGPS 7th Grade Math Content Standards Unpacked Page 28 of 55 Bibb County School System May 2012
Expressions and Equations CC.7.EE CCGPS Cluster: Solve real-life and mathematical problems using numerical and algebraic expressions and equaitons.
Instructional Strategies
To assist students’ assessment of the reasonableness of answers, especially
problem situations involving fractional or decimal numbers, use whole-number
approximations for the computation and then compare to the actual
computation. Connections between performing the inverse operation and
undoing the operations are appropriate here. It is appropriate to expect students
to show the steps in their work. Students should be able to explain their
thinking using the correct terminology for the properties and operations.
Continue to build on students’ understanding and application of writing and
solving one-step equations from a problem situation to multi-step problem
situations. This is also the context for students to practice using rational
numbers including: integers, and positive and negative fractions and decimals.
As students analyze a situation, they need to identify what operation should be
completed first, then the values for that computation. Each set of the needed
operation and values is determined in order. Finally an equation matching the
order of operations is written. For example, Bonnie goes out to eat and buys a
meal that costs $12.50 that includes a tax of $.75. She only wants to leave a tip
based on the cost of the food. In this situation, students need to realize that the
tax must be subtracted from the total cost before being multiplied by the
percent of tip and then added back to obtain the final cost. C = (12.50 - .75)(1 +
T) + .75 = 11.75(1 +T) + .75 where C = cost and T = tip.
Provide multiple opportunities for students to work with multi-step problem
situations that have multiple solutions and therefore can be represented by an
inequality. Students need to be aware that values can satisfy an inequality but
not be appropriate for the situation, therefore limiting the solutions for that
particular problem.
Instructional Resources/Tools Common Misconceptions
Solving for a Variable http://ohiorc.org/for/math/learningconductor/dlw_lesson.aspx?file=5
This activity for students uses a pan balance to model solving equations for
a variable.
Solving an Inequality http://ohiorc.org/for/math/learningconductor/dlw_lesson.aspx?file=6
This activity for students illustrates the solution to inequalities modeled on a
number line.
Connections – Critical Areas of Focus Connections to Other Grade Levels
This cluster is connected to the second Critical Area of Focus for 7th
grade, Developing
understanding of operations with rational numbers and working with expressions
and linear equations, and to the third CCSSM Critical Area of Focus for 7th
grade,
Solving problems involving scale drawings and informal geometric constructions,
and working with two- and three-dimensional shapes to solve problems involving
CCGPS 7th Grade Math Content Standards Unpacked Page 29 of 55 Bibb County School System May 2012
Standards Mathematical Practices
What students
should know
What students
should do
Prerequisites Examples/Explanations
7.EE.3 Solve multi-step real-life and mathematical problems posed with positive and negative rational numbers in any form (whole numbers, fractions, and decimals), using tools strategically. Apply properties of operations to calculate with numbers in any form; convert between forms as appropriate; and assess the reasonableness of answers using mental computation and estimation strategies. For example: If a woman making $25 an hour gets a 10% raise, she will make an additional
1/10 of
her salary an hour, or $2.50, for a new salary of $27.50. If you want to place a towel bar 9 3/4 inches long in the center of a door that is 27½ inches wide, you will need to place the bar about 9 inches from each edge; this estimate can be used as a check on the exact computation. DOK 2
7.MP.1. Make sense of problems and persevere in solving them. 7.MP.2. Reason abstractly and quantitatively. 7.MP.3. Construct viable arguments and critique the reasoning of others. 7.MP.4. Model with mathematics. 7.MP.5. Use appropriate tools strategically. 7.MP.6. Attend to precision. 7.MP.7. Look for and make use of structure. 7.MP.8. Look for and express regularity in repeated reasoning.
solve equations convert fractions to decimals and decimals to fractions properties of operations estimation order of operations
Students solve contextual problems using rational numbers. Students convert between fractions, decimals, and percents as needed to solve the problem. Students use estimation to justify the reasonableness of answers. Estimation strategies for calculations with fractions and decimals extend from students’ work with whole number operations. Estimation strategies include, but are not limited to:
front-end estimation with adjusting (using the
highest place value and estimating from the front end making adjustments to the estimate by taking into account the remaining amounts),
clustering around an average (when the values are close together an average value is selected and multiplied by the number of values to determine an estimate),
rounding and adjusting (students round down or round up and then adjust their estimate depending on how much the rounding affected the original values),
using friendly or compatible numbers such as factors (students seek to fit numbers together - i.e., rounding to factors and grouping numbers together that have round sums like 100 or 1000), and
using benchmark numbers that are easy to compute (students select close whole numbers for fractions or decimals to determine an estimate).
Example:
The youth group is going on a trip to the state fair. The trip costs $52. Included in that price is $11 for a concert ticket and the cost of 2 passes, one for the rides and one for the game booths. Each of the passes cost the same price. Write an equation representing the cost of the trip and determine the price of one pass.
CCGPS 7th Grade Math Content Standards Unpacked Page 30 of 55 Bibb County School System May 2012
2x + 11 = 52 2x = 41 x = $20.5
7.EE.4 Use variables to represent quantities in a real-world or mathematical problem, and construct simple equations and inequalities to solve problems by reasoning about the quantities. a. Solve word
problems leading to equations of the form px + q = r and p(x + q) = r, where p, q, and r are specific rational numbers. Solve equations of these forms fluently. Compare an algebraic solution to an arithmetic solution, identifying the sequence of the operations used in each approach. For example, the perimeter of a rectangle is 54
7.MP.1. Make sense of problems and persevere in solving them. 7.MP.2. Reason abstractly and quantitatively. 7.MP.3. Construct viable arguments and critique the reasoning of others. 7.MP.4. Model with mathematics. 7.MP.5. Use appropriate tools strategically. 7.MP.6. Attend to precision. 7.MP.7. Look for and make use of structure. 7.MP.8. Look for and express regularity in
word problems equations form rational numbers algebraic solution arithmetic solution sequence operations approach
solve compare identify
inverse operations solve an equation order of operations
Students solve multi-step equations and inequalities derived from word problems. Students use the arithmetic from the problem to generalize an algebraic solution. Examples:
Amie had $26 dollars to spend on school supplies.
After buying 10 pens, she had $14.30 left. How much did each pen cost?
The sum of three consecutive even numbers is 48. What is the smallest of these numbers?
Solve: 2054
5n
x x 11
52
CCGPS 7th Grade Math Content Standards Unpacked Page 31 of 55 Bibb County School System May 2012
cm. Its length is 6 cm. What is its width?
DOK 2
repeated reasoning.
b. Solve word problems leading to inequalities of the form px + q > r or px + q < r, where p, q, and r are specific rational numbers. Graph the solution set of the inequality and interpret it in the context of the problem. For example: As a salesperson, you are paid $50 per week plus $3 per sale. This week you want your pay to be at least $100. Write an inequality for the number of sales you need to make, and describe the solutions.
DOK 3
7.MP.1. Make sense of problems and persevere in solving them. 7.MP.2. Reason abstractly and quantitatively. 7.MP.3. Construct viable arguments and critique the reasoning of others. 7.MP.4. Model with mathematics. 7.MP.5. Use appropriate tools strategically. 7.MP.6. Attend to precision. 7.MP.7. Look for and make use of structure. 7.MP.8. Look for and express regularity in repeated reasoning.
word problems inequalities form rational numbers solution set context
solve graph
understand meaning of inequality symbols inverse operations solve an equation solve an inequality order of operations graph an inequality on a number line
Students graph inequalities and make sense of the inequality in context. Inequalities may have negative coefficients. Problems can be used to find a maximum or minimum value when in context. Examples:
Florencia has at most $60 to spend on clothes. She wants to buy a pair of jeans for $22 dollars and spend the rest on t-shirts. Each t-shirt costs $8. Write an inequality for the number of t-shirts she can purchase.
Steven has $25 dollars. He spent $10.81, including tax, to buy a new DVD. He needs to set aside $10.00 to pay for his lunch next week. If peanuts cost $0.38 per package including tax, what is the maximum number of packages that Steven can buy? Write an equation or inequality to model the situation. Explain how you determined whether to write an equation or inequality and the properties of the real number system that you used to find a solution.
Solve 232
1x and graph your solution on a
number line.
Return to Contents
CCGPS 7th Grade Math Content Standards Unpacked Page 32 of 55 Bibb County School System May 2012
Geometry Transition Standard for 2012-2013 CC.6.G CCGPS Cluster: Solve real-world and mathematical problems involving area, surface area, and volume.
Instructional Strategies
It is very important for students to continue to physically manipulate materials
and make connections to the symbolic and more abstract aspects of geometry.
Exploring possible nets should be done by taking apart (unfolding) three-
dimensional objects. This process is also foundational for the study of surface
area of prisms. Building upon the understanding that a net is the two-
dimensional representation of the object, students can apply the concept of area
to find surface area. The surface area of a prism is the sum of the areas for each
face.
Multiple strategies can be used to aid in the skill of determining the area of
simple two-dimensional composite shapes. A beginning strategy should be to
use rectangles and triangles, building upon shapes for which they can already
determine area to create composite shapes. This process will reinforce the
concept that composite shapes are created by joining together other shapes, and
that the total area of the two-dimensional composite shape is the sum of the
areas of all the parts.
A follow-up strategy is to place a composite shape on grid or dot paper. This
aids in the decomposition of a shape into its foundational parts. Once the
composite shape is decomposed, the area of each part can be determined and
the sum of the area of each part is the total area.
Fill prisms with cubes of different edge lengths (including fractional lengths) to
explore the relationship between the length of the repeated measure and the
number of units needed. An essential understanding to this strategy is the
volume of a rectangular prism does not change when the units used to measure
the volume changes. Since focus in Grade 6 is to use fractional lengths to
measure, if the same object is measured using one centimeter cubes and then
measured using half centimeter cubes, the volume will appear to be eight times
greater with the smaller unit. However, students need to understand that the
value or the number of cubes is greater but the volume is the same.
Instructional Resources/Tools Common Misconceptions
Cubes of fractional edge length
Squares that can be joined together used to develop possible nets for a cube
Use floor plans as a real world situation for finding the area of composite
shapes.
Online dot paper http://illuminations.nctm.org/lessons/DotPaper.pdf#search=%22dot
visualization skills. Students should have the opportunity to physically create
some of the three-dimensional figures, slice them in different ways, and
describe in pictures and words what has been found. For example, use clay to
form a cube, then pull string through it in different angles and record the shape
of the slices found. Challenges can also be given: “See how many different
two-dimensional figures can be found by slicing a cube” or “What three-
dimensional figure can produce a hexagon slice?” This can be repeated with
other three-dimensional figures using a chart to record and sketch the figure,
slices and resulting two-dimensional figures.
Instructional Resources/Tools Common Misconceptions
Straws, clay, angle rulers, protractors, rulers, grid paper
Road Maps - convert to actual miles
Dynamic computer software - Geometer's SketchPad. This cluster lends
itself to using dynamic software. Students sometimes can manipulate the
software more quickly than do the work manually. However, being able to
use a protractor and a straight edge are desirable skills.
Student may have misconceptions about
Correctly setting up proportions
How to read a ruler
Doubling side measures does not double perimeter
Connections – Critical Areas of Focus Connections to Other Grade Levels
This cluster is connected to the third Critical Area of Focus for 7th grade,
Solving problems involving scale drawings and informal geometric
constructions, and working with two- and three-dimensional shapes to
solve problems involving area, surface area, and volume.
Connections should be made between this cluster and the 7th grade standards
CC.7.G.4, CC.7.G.5, and CC.7.G.6.
Connections should also be made between this cluster and the standards in the
Ratios and Proportional Relationships domain in 6th and 7
th grade standards.
This cluster leads to the development of the triangle congruence criteria in 8th
grade.
CCGPS 7th Grade Math Content Standards Unpacked Page 36 of 55 Bibb County School System May 2012
Standards Mathematical Practices
What students
should know
What students
should do
Prerequisites Examples/Explanations
7.G.1 Solve problems involving scale drawings of geometric figures, including computing actual lengths and areas from a scale drawing and reproducing a scale drawing at a different scale. DOK 2
7.MP.1. Make sense of problems and persevere in solving them. 7.MP.2. Reason abstractly and quantitatively. 7.MP.3. Construct viable arguments and critique the reasoning of others. 7.MP.4. Model with mathematics. 7.MP.5. Use appropriate tools strategically. 7.MP.6. Attend to precision. 7.MP.7. Look for and make use of structure. 7.MP.8. Look for and express regularity in repeated reasoning.
scale drawings geometric figures length area scale
solve compute reproduce
ratio proportion area
Students determine the dimensions of figures when given a scale and identify the impact of a scale on actual length (one-dimension) and area (two-dimensions). Students identify the scale factor given two figures. Using a given scale drawing, students reproduce the drawing at a different scale. Students understand that the lengths will change by a factor equal to the product of the magnitude of the two size transformations. Example:
Julie showed you the scale drawing of her room. If each 2 cm on the scale drawing equals 5 ft, what are the actual dimensions of Julie’s room? Reproduce the drawing at 3 times its current size.
7.G.2 Draw (freehand, with ruler and protractor, and with technology) geometric shapes with given conditions. Focus on constructing triangles from three measures of angles or sides, noticing when the
7.MP.4. Model with mathematics. 7.MP.5. Use appropriate tools strategically. 7.MP.6. Attend to precision.
protractor geometric shapes conditions triangles measures of angles measures of sides
draw
shapes angles sides using a ruler and protractor
Students understand the characteristics of angles that create triangles. For example, can a triangle have more than one obtuse angle? Will three sides of any length create a triangle? Students recognize that the sum of the two smaller sides must be larger than the third side. Conditions may involve points, line segments, angles, parallelism, congruence, angles, and perpendicularity. Examples:
CCGPS 7th Grade Math Content Standards Unpacked Page 37 of 55 Bibb County School System May 2012
conditions determine a unique triangle, more than one triangle, or no triangle. DOK 2
7.MP.7. Look for and make use of structure. 7.MP.8. Look for and express regularity in repeated reasoning.
Is it possible to draw a triangle with a 90˚ angle and one leg that is 4 inches long and one leg that is 3 inches long? If so, draw one. Is there more than one such triangle?
Draw a triangle with angles that are 60 degrees. Is this a unique triangle? Why or why not?
Draw an isosceles triangle with only one 80 degree angle. Is this the only possibility or can you draw another triangle that will also meet these conditions?
Can you draw a triangle with sides that are 13 cm, 5 cm and 6cm?
Draw a quadrilateral with one set of parallel sides and no right angles.
7.G.3 Describe the two-dimensional figures that result from slicing three- dimensional figures, as in plane sections of right rectangular prisms and right rectangular pyramids. DOK 1
7.MP.2. Reason abstractly and quantitatively. 7.MP.4. Model with mathematics. 7.MP.5. Use appropriate tools strategically. 7.MP.7. Look for and make use of structure.
two-dimensional figures three-dimensional figures plane sections right rectangular prisms right rectangular pyramids
describe
2D and 3D shapes Students need to describe the resulting face shape from cuts made parallel and perpendicular to the bases of right rectangular prisms and pyramids. Cuts made parallel will take the shape of the base; cuts made perpendicular will take the shape of the lateral (side) face. Cuts made at an angle through the right rectangular prism will produce a parallelogram; cuts made at an angle through the right rectangular pyramid will also produce a parallelogram. Example:
Using a clay model of a rectangular prism, describe the shapes that are created when planar cuts are made diagonally, perpendicularly, and parallel to the base.
Return to Contents
CCGPS 7th Grade Math Content Standards Unpacked Page 38 of 55 Bibb County School System May 2012
Geometry CC.7.G CCGPS Cluster: Solve real-life and mathematical problems involving angle measure, area, surface area, and volume.
What does this standard mean that a student will know and be able to do?
This is the students’ initial work with circles. Knowing that a circle is created
by connecting all the points equidistant from a point (center) is essential to
understanding the relationships between radius, diameter, circumference, pi
and area. Students can observe this by folding a paper plate several times,
finding the center at the intersection, then measuring the lengths between the
center and several points on the circle, the radius. Measuring the folds through
the center, or diameters leads to the realization that a diameter is two times a
radius. Given multiple-size circles, students should then explore the
relationship between the radius and the length measure of the circle
(circumference) finding an approximation of pi and ultimately deriving a
formula for circumference. String or yarn laid over the circle and compared to
a ruler is an adequate estimate of the circumference. This same process can be
followed in finding the relationship between the diameter and the area of a
circle by using grid paper to estimate the area.
Another visual for understanding the area of a circle can be modeled by cutting
up a paper plate into 16 pieces along diameters and reshaping the pieces into a
parallelogram. In figuring area of a circle, the squaring of the radius can also be
explained by showing a circle inside a square. Again, the formula is derived
and then learned. After explorations, students should then solve problems, set
in relevant contexts, using the formulas for area and circumference.
In previous grades, students have studied angles by type according to size:
acute, obtuse and right, and their role as an attribute in polygons. Now angles
are considered based upon the special relationships that exist among them:
supplementary, complementary, vertical and adjacent angles. Provide students
the opportunities to explore these relationships first through measuring and
finding the patterns among the angles of intersecting lines or within polygons,
then utilize the relationships to write and solve equations for multi-step
problems.
Real-world and mathematical multi-step problems that require finding area,
perimeter, volume, surface area of figures composed of triangles,
quadrilaterals, polygons, cubes and right prisms should reflect situations
relevant to seventh graders. The computations should make use of formulas
and involve whole numbers, fractions, decimals, ratios and various units of
Students measure circular objects to collect data to investigate the
relationship between the circumference of a circle and its diameter. They
find that, regardless of the size of the object or the size of the measuring
unit, it always takes a little more than three times the length of the diameter
to measure the circumference.
Geometry of Circles http://illuminations.nctm.org/LessonDetail.aspx?id=L647
Using a MIRA geometry tool, students determine the relationships between
radius, diameter, circumference and area of a circle.
Parallel Lines
Students use Geometer's Sketchpad® or Geogebra® to explore relationships
among the angles formed when parallel lines are cut by a transversal. The
software is integral to the lesson, and step-by-step instructions are provided.
Students may believe:
Pi is an exact number rather than understanding that 3.14 is just an
approximation of pi.
Many students are confused when dealing with circumference (linear
measurement) and area. This confusion is about an attribute that is
measured using linear units (surrounding) vs. an attribute that is measured
using area units (covering).
Connections – Critical Areas of Focus Connections to Other Grade Levels
This cluster is connected to the third Critical Area of Focus for 7th grade,
Solving problems involving scale drawings and informal geometric
constructions, and working with two- and three-dimensional shapes to
solve problems involving area, surface area, and volume.
This cluster builds from understandings of Geometry and in Measurement and
Data grades 3-6. It also utilizes the scope of the number system experienced
thus far and begins the formal use of equations, formulas and variables in
representing and solving mathematical situations.
Standards Mathematical Practices
What students
should know
What students
should do
Prerequisites Examples/Explanations
7.G.4 Know the formulas for the area and circumference of a circle and use them to solve problems; give an informal derivation of the relationship between
7.MP.1. Make sense of problems and persevere in solving them. 7.MP.2. Reason abstractly and quantitatively.
formulas for area and circumference of a circle informal derivation relationship
know use solve give
computational skills shapes
Students understand the relationship between radius and diameter. Students also understand the ratio of
circumference to diameter can be expressed as . Building on these understandings, students generate the formulas for circumference and area. The illustration shows the relationship between the circumference and area. If a circle is cut into wedges and
CCGPS 7th Grade Math Content Standards Unpacked Page 40 of 55 Bibb County School System May 2012
the circumference and area of a circle. DOK 2
7.MP.3. Construct viable arguments and critique the reasoning of others. 7.MP.4. Model with mathematics. 7.MP.5. Use appropriate tools strategically. 7.MP.6. Attend to precision. 7.MP.7. Look for and make use of structure. 7.MP.8. Look for and express regularity in repeated reasoning.
laid out as shown, a parallelogram results. Half of an end wedge can be moved to the other end a rectangle results. The height of the rectangle is the same as the radius of
the circle. The base length is ½ the circumference (2 r). The area of the rectangle (and therefore the circle) is found by the following calculations:
Arect = Base Height
Area = ½ (2 r) r
Area = r r
Area = r2
http://mathworld.wolfram.com/Circle.html Students solve problems (mathematical and real-world) including finding the area of left-over materials when circles are cut from squares and triangles or from cutting squares and triangles from circles. “Know the formula” does not mean memorization of the formula. To “know” means to have an understanding of why the formula works and how the formula relates to the measure (area and circumference) and the figure. This understanding should be for all students.
7.G.5 Use facts about supplementary, complementary, vertical, and adjacent angles in a multi-step problem to write and solve simple equations for an unknown angle in a figure. DOK 2
7.MP.3. Construct viable arguments and critique the reasoning of others. 7.MP.4. Model with mathematics. 7.MP.5. Use appropriate tools strategically. 7.MP.6. Attend to precision. 7.MP.7. Look for and make use of structure.
CCGPS 7th Grade Math Content Standards Unpacked Page 41 of 55 Bibb County School System May 2012
7.G.6 Solve real-world and mathematical problems involving area, volume and surface area of two- and three-dimensional objects composed of triangles, quadrilaterals, polygons, cubes, and right prisms. DOK 2
7.MP.1. Make sense of problems and persevere in solving them. 7.MP.2. Reason abstractly and quantitatively. 7.MP.3. Construct viable arguments and critique the reasoning of others. 7.MP.4. Model with mathematics. 7.MP.5. Use appropriate tools strategically. 7.MP.6. Attend to precision. 7.MP.7. Look for and make use of structure. 7.MP.8. Look for and express regularity in repeated reasoning.
area volume surface area two-dimensional objects three-dimensional objects triangles quadrilaterals polygons cubes right prisms
solve
area surface area volume 2D and 3D shapes
Students continue work from 5th and 6
th grade to work with
area, volume and surface area of two-dimensional and three-dimensional objects (composite shapes). Students will not work with cylinders, as circles are not polygons. “Know the formula” does not mean memorization of the formula. To “know” means to have an understanding of why the formula works and how the formula relates to the measure (area and volume) and the figure. This understanding should be for all students. Surface area formulas are not the expectation with this standard. Building on work with nets in the 6
th grade,
students should recognize that finding the area of each face of a three-dimensional figure and adding the areas will give the surface area. No nets will be given at this level.
Return to Contents
CCGPS 7th Grade Math Content Standards Unpacked Page 42 of 55 Bibb County School System May 2012
Statistics and Probability CC.7.SP CCGPS Cluster: Use random sampling to draw inferences about a population.
Instructional Strategies
In Grade 6, students used measures of center and variability to describe data.
Students continue to use this knowledge in Grade 7 as they use random
samples to make predictions about an entire population and judge the possible
discrepancies of the predictions. Providing opportunities for students to use
real-life situations from science and social studies shows the purpose for using
random sampling to make inferences about a population.
Make available to students the tools needed to develop the skills and
understandings required to produce a representative sample of the general
population. One key element of a representative sample is understanding that a
random sampling guarantees that each element of the population has an equal
opportunity to be selected in the sample. Have students compare the random
sample to population, asking questions like “Are all the elements of the entire
population represented in the sample?” and “Are the elements represented
proportionally?” Students can then continue the process of analysis by
determining the measures of center and variability to make inferences about the
general population based on the analysis.
Provide students with random samples from a population, including the
statistical measures. Ask students guiding questions to help them make
inferences from the sample.
Instructional Resources/Tools Common Misconceptions
Guidelines for Assessment and instruction in Statistics Education (GAISE)
CCGPS 7th Grade Math Content Standards Unpacked Page 43 of 55 Bibb County School System May 2012
Connections – Critical Areas of Focus Connections to Other Grade Levels
This cluster is connected to the fourth Critical Area of Focus for 7th grade,
Drawing inferences about populations based on samples.
Initial understanding of statistics, specifically variability and the measures of
center and spread begins in Grade 6.
Standards Mathematical Practices
What students
should know
What students
should do
Prerequisites Examples/Explanations
7.SP.1 Understand that statistics can be used to gain information about a population by examining a sample of the population; generalizations about a population from a sample are valid only if the sample is representative of that population. Understand that random sampling tends to produce representative samples and support valid inferences. DOK 1
7.MP.3. Construct viable arguments and critique the reasoning of others. 7.MP.6. Attend to precision.
statistics information population sample generalizations valid representative random sampling inferences
understand
general understanding of statistics from 6
th
grade
Students recognize that it is difficult to gather statistics on an entire population. Instead a random sample can be representative of the total population and will generate valid results. Students use this information to draw inferences from data. A random sample must be used in conjunction with the population to get accuracy. For example, a random sample of elementary students cannot be used to give a survey about the prom. Example:
The school food service wants to increase the number of students who eat hot lunch in the cafeteria. The student council has been asked to conduct a survey of the student body to determine the students’ preferences for hot lunch. They have determined two ways to do the survey. The two methods are listed below. Identify the type of sampling used in each survey option. Which survey option should the student council use and why?
1. Write all of the students’ names on cards and pull
them out in a draw to determine who will complete the survey.
2. Survey the first 20 students that enter the lunch room.
7.SP.2 Use data from a random sample to draw inferences about a population with an unknown characteristic of interest. Generate multiple samples (or simulated samples) of
7.MP.1. Make sense of problems and persevere in solving them. 7.MP.2. Reason abstractly and quantitatively.
data random sample inferences population unknown characteristic samples simulated samples size
use draw inferences generate
how to make an inference sample and population measures of center and variability
Students collect and use multiple samples of data to answer question(s) about a population. Issues of variation in the samples should be addressed. Example:
Below is the data collected from two random samples of 100 students regarding student’s school lunch preference. Make at least two inferences based on the results.
CCGPS 7th Grade Math Content Standards Unpacked Page 44 of 55 Bibb County School System May 2012
the same size to gauge the variation in estimates or predictions. For example, estimate the mean word length in a book by randomly sampling words from the book; predict the winner of a school election based on randomly sampled survey data. Gauge how far off the estimate or prediction might be. DOK 3
7.MP.3. Construct viable arguments and critique the reasoning of others. 7.MP.5. Use appropriate tools strategically. 7.MP.6. Attend to precision. 7.MP.7. Look for and make use of structure.
variation estimates predictions
Return to Contents
CCGPS 7th Grade Math Content Standards Unpacked Page 45 of 55 Bibb County School System May 2012
Statistics and Probability CC.7.SP CCGPS Cluster: Draw informal comparative inferences about two populations.
Instructional Strategies
In Grade 6, students used measures of center and variability to describe sets of data. In the cluster “Use random sampling to draw inferences about a population” of
Statistics and Probability in Grade 7, students learn to draw inferences about one population from a random sampling of that population. Students continue using
these skills to draw informal comparative inferences about two populations.
Provide opportunities for students to deal with small populations, determining measures of center and variability for each population. Then have students compare
those measures and make inferences. The use of graphical representations of the same data (Grade 6) provides another method for making comparisons. Students
begin to develop understanding of the benefits of each method by analyzing data with both methods.
When students study large populations, random sampling is used as a basis for the population inference. This build on the skill developed in the Grade 7 cluster
“Use random sampling to draw inferences about a population” of Statistics and Probability. Measures of center and variability are used to make inferences on each
of the general populations. Then the students have make comparisons for the two populations based on those inferences.
This is a great opportunity to have students examine how different inferences can be made based on the same two sets of data. Have students investigate how
advertising agencies uses data to persuade customers to use their products. Additionally, provide students with two populations and have them use the data to
persuade both sides of an argument.
Instructional Resources/Tools Common Misconceptions
CCGPS 7th Grade Math Content Standards Unpacked Page 46 of 55 Bibb County School System May 2012
Connections – Critical Areas of Focus Connections to Other Grade Levels
This Cluster is connected to the fourth Critical Area of Focus for 7th grade,
Drawing inferences about populations based on samples.
Measures of center and variability are developed in Grade 6. This cluster
expands standards 1 and 2 in Grade 7 to make inferences between populations.
Standards Mathematical Practices
What students
should know
What students
should do
Prerequisites Examples/Explanations
7.SP.3 Informally assess the degree of visual overlap of two numerical data distributions with similar variabilities, measuring the difference between the centers by expressing it as a multiple of a measure of variability. For example, the mean height of players on the basketball team is 10 cm greater than the mean height of players on the soccer team, about twice the variability (mean absolute deviation) on either team; on a dot plot, the separation between the two distributions of heights is noticeable. DOK 2
7.MP.1. Make sense of problems and persevere in solving them. 7.MP.2. Reason abstractly and quantitatively. 7.MP.3. Construct viable arguments and critique the reasoning of others. 7.MP.4. Model with mathematics. 7.MP.5. Use appropriate tools strategically. 7.MP.6. Attend to precision. 7.MP.7. Look for and make use of structure.
degree of visual overlap numerical data distributions variabilities centers multiple measure of variability
informally assess measure express
measures of center and variability graphing data (plots)
This is the students’ first experience with comparing two data sets. Students build on their understanding of graphs, mean, median, Mean Absolute Deviation (M.A.D.) and interquartile range from 6
th grade. Students
understand that 1. a full understanding of the data requires consideration
of the measures of variability as well as mean or median;
2. variability is responsible for the overlap of two data sets, and that an increase in variability can increase the overlap; and
3. median is paired with the interquartile range and mean is paired with the mean absolute deviation.
Students can readily find data as described in the example on sports team or college websites. Other sources for data include American Fact Finder (Census Bureau), Fed Stats, Ecology Explorers, USGS, or CIA World Factbook. Researching data sets provides opportunities to connect mathematics to their interests and other academic subjects. Students can utilize statistic functions in graphing calculators or spreadsheets for calculations with larger data sets or to check their computations. Students calculate mean absolute deviations in preparation for later work with standard deviations.
7.SP.4 Use measures of center and measures of variability for numerical data from
7.MP.1. Make sense of problems and persevere in solving them.
measures of center measures of variability numerical data
use draw inferences
measures of center and variability samples and populations
Students are expected to compare two sets of data using measures of center and variability. Measures of center include mean, median, and mode. The measures of variability include range, mean absolute deviation, and interquartile range.
CCGPS 7th Grade Math Content Standards Unpacked Page 47 of 55 Bibb County School System May 2012
random samples to draw informal comparative inferences about two populations. For example, decide whether the words in a chapter of a seventh-grade science book are generally longer than the words in a chapter of a fourth-grade science book. DOK 3
7.MP.2. Reason abstractly and quantitatively. 7.MP.3. Construct viable arguments and critique the reasoning of others. 7.MP.4. Model with mathematics. 7.MP.5. Use appropriate tools strategically. 7.MP.6. Attend to precision. 7.MP.7. Look for and make use of structure.
random samples informal comparative inferences populations
Return to Contents
CCGPS 7th Grade Math Content Standards Unpacked Page 48 of 55 Bibb County School System May 2012
Statistics and Probability CC.7.SP CCGPS Cluster: Investigate chance processes and develop, use, and evaluate probability models.
Instructional Strategies
The introduction to the formal study of probability is in 7th grade. Through
multiple experiences, students begin to understand the probability of chance
(simple and compound), develop and use sample spaces, compare experimental
and theoretical probabilities, develop and use graphical organizers, and use
information from simulations for predictions.
Help students understand the probability of chance is using the benchmarks of
probability: 0, 1 and ½. Provide students with situations that have clearly
defined probability of never happening as zero, always happening as 1 or
equally likely to happen as to not happen as 1/2. Then advance to situations in
which the probability is somewhere between any two of these benchmark
values. This builds to the concept of expressing the probability as a number
between 0 and 1. Use this understaind to build the understanding that the closer
the probability is to 0, the more likely it will not happen, and the closer to 1,
the more likely it will happen. Students learn to make predictions about the
relative frequency of an event by using simulations to collect, record, organize
and analyze data. Students also develop the understanding that the more the
simulation for an event is repeated, the closer the experimental probability
approaches the theoretical probability.
Have students develop probability models to be used to find the probability of
events. Provide students with models of equal outcomes and models of not
equal outcomes are developed to be used in determining the probabilities of
events.
Students should begin to expand the knowledge and understanding of the
probability of simple events, to find the probabilities of compound events by
creating organized lists, tables and tree diagrams. This helps students create a
visual representation of the data; i.e., a sample space of the compound event.
From each sample space, students determine the probability or fraction of each
possible outcome. Students continue to build on the use of simulations for
simple probabilities and now expand the simulation of compound probability.
Providing opportunities for students to match situations and sample spaces
assists students in visualizing the sample spaces for situations.
Students often struggle making organized lists or trees for a situation in order
to determine the theoretical probability. Having students start with simpler
situations that have fewer elements enables them to have successful
experiences with organizing lists and trees diagrams. Ask guiding questions to
help students create methods for creating organized lists and trees for situations
with more elements.
Students often see skills of creating organized lists, tree diagrams, etc. as the
end product. Provide students with experiences that require the use of these
graphic organizers to determine the theoretical probabilities. Have them
practice making the connections between the process of creating lists, tree
diagrams, etc. and the interpretation of those models.
Additionally, students often struggle when converting forms of probability
from fractions to percents and vice versa. To help students with the discussion
of probability, don’t allow the symbol manipulation/conversions to detract
from the conversations. By having students use technology such as a graphing
calculator or computer software to simulate a situation and graph the results,
the focus is on the interpretation of the data. Students then make predictions
about the general population based on these probabilities.
CCGPS 7th Grade Math Content Standards Unpacked Page 50 of 55 Bibb County School System May 2012
Standards Mathematical Practices
What students should know
What students
should do
Prerequisites Examples/Explanations
7.SP.5 Understand that the probability of a chance event is a number between 0 and 1 that expresses the likelihood of the event occurring. Larger numbers indicate greater likelihood. A probability near 0 indicates an unlikely event, a probability around ½ indicates an event that is neither unlikely nor likely, and a probability near 1 indicates a likely event. DOK 1
7.MP.4. Model with mathematics. 7.MP.5. Use appropriate tools strategically. 7.MP.6. Attend to precision. 7.MP.7. Look for and make use of structure.
probability chance event number likelihood occurring unlikely likely
understand
fractions decimals
This is students’ first formal introduction to probability. Students recognize that all probabilities are between 0 and 1, inclusive, the sum of all possible outcomes is 1. For example, there are three choices of jellybeans – grape, cherry and orange. If the probability of
getting a grape is 10
3and the probability of getting cherry is
5
1, what
is the probability of getting oranges? The probability of any single event can be recognized as a fraction. The closer the fraction is to 1, the greater the probability the event will occur. Larger numbers indicate greater likelihood. For example, if you have 10 oranges and 3 apples, you have a greater likelihood of getting an orange when randomly selecting a fruit from the collection. Probability can be expressed in terms such as impossible, unlikely, likely, or certain or as a number between 0 and 1 as illustrated on the number line. Students can use simulations such as Marble Mania on AAAS or the Random Drawing Tool on NCTM’s Illuminations to generate data and examine patterns. Marble Mania http://www.sciencenetlinks.com/interactives/marble/marblemania.html Random Drawing Tool - http://illuminations.nctm.org/activitydetail.aspx?id=67
Example:
The container below contains 2 gray, 1 white, and 4 black marbles. Without looking, if you choose a marble from the container, will the probability be closer to 0 or to 1 that you will select a white marble? A gray marble? A black marble? Justify each of your predictions.
CCGPS 7th Grade Math Content Standards Unpacked Page 51 of 55 Bibb County School System May 2012
7.SP.6 Approximate the probability of a chance event by collecting data on the chance process that produces it and observing its long-run relative frequency, and predict the approximate relative frequency given the probability. For example, when rolling a number cube 600 times, predict that a 3 or 6 would be rolled roughly 200 times, but probably not exactly 200 times. DOK 2
7.MP.1. Make sense of problems and persevere in solving them. 7.MP.2. Reason abstractly and quantitatively. 7.MP.3. Construct viable arguments and critique the reasoning of others. 7.MP.4. Model with mathematics. 7.MP.5. Use appropriate tools strategically.
probability chance event data process long-run relative frequency approximate relative frequency
approximate collect observe predict
probability fractions decimals solve proportions frequency
Students collect data from a probability experiment, recognizing that as the number of trials increase, the experimental probability approaches the theoretical probability. The focus of this standard is relative frequency. The relative frequency is the observed number of successful events for a finite sample of trials. Relative frequency is the observed proportion of successful events. Students can collect data using physical objects or graphing calculator or web-based simulations. Students can perform experiments multiple times, pool data with other groups, or increase the number of trials in a simulation to look at the long-run relative frequencies. Example: Each group receives a bag that contains 4 green marbles, 6 red marbles, and 10 blue marbles. Each group performs 50 pulls, recording the color of marble drawn and replacing the marble into the bag before the next draw. Students compile their data as a group and then as a class. They summarize their data as experimental probabilities and make conjectures about theoretical probabilities (How many green draws would you expect if you were to conduct 1000 pulls? 10,000 pulls?). Students create another scenario with a different ratio of marbles in the bag and make a conjecture about the outcome of 50 marble pulls with replacement. (An example would be 3 green marbles, 6 blue marbles, 3 blue marbles.) Students try the experiment and compare their predictions to the experimental outcomes to continue to explore and refine conjectures about theoretical probability.
7.SP.7 Develop a probability model and use it to find probabilities of events.
7.MP.1. Make sense of problems and persevere in solving them.
CCGPS 7th Grade Math Content Standards Unpacked Page 52 of 55 Bibb County School System May 2012
Compare probabilities from a model to observed frequencies; if the agreement is not good, explain possible sources of the discrepancy. a. Develop a
uniform probability model by assigning equal probability to all outcomes, and use the model to determine probabilities of events. For example, if a student is selected at random from a class, find the probability that Jane will be selected and the probability that a girl will be selected.
DOK 2
7.MP.2. Reason abstractly and quantitatively. 7.MP.3. Construct viable arguments and critique the reasoning of others. 7.MP.4. Model with mathematics. 7.MP.5. Use appropriate tools strategically. 7.MP.6. Attend to precision. 7.MP.7. Look for and make use of structure. 7.MP.8. Look for and express regularity in repeated reasoning.
uniform probability model outcomes probability events
develop use
probability proportion
Students need multiple opportunities to perform probability experiments and compare these results to theoretical probabilities. Critical components of the experiment process are making predictions about the outcomes by applying the principles of theoretical probability, comparing the predictions to the outcomes of the experiments, and replicating the experiment to compare results. Experiments can be replicated by the same group or by compiling class data. Experiments can be conducted using various random generation devices including, but not limited to, bag pulls, spinners, number cubes, coin toss, and colored chips. Students can collect data using physical objects or graphing calculator or web-based simulations. Probabilities are useful for predicting what will happen over the long run. Using theoretical probability, students predict frequencies of outcomes. Students recognize an appropriate design to conduct an experiment with simple probability events, understanding that the experimental data give realistic estimates of the probability of an event but are affected by sample size.
b. Develop a probability model (which may not be uniform) by observing frequencies
7.MP.1. Make sense of problems and persevere in solving them. 7.MP.2. Reason
probability model frequencies data chance process
develop
frequency distribution probability equivalent fractions
Students can also develop models for geometric probability (i.e. a target). Example:
If you choose a point in the square, what is the probability that it is not in the circle?
Return to Contents
CCGPS 7th Grade Math Content Standards Unpacked Page 53 of 55 Bibb County School System May 2012
in data generated from a chance process. For example, find the approximate probability that a spinning penny will land heads up or that a tossed paper cup will land open-end down. Do the outcomes for the spinning penny appear to be equally likely based on the observed frequencies?
DOK 3
abstractly and quantitatively. 7.MP.3. Construct viable arguments and critique the reasoning of others. 7.MP.4. Model with mathematics. 7.MP.5. Use appropriate tools strategically. 7.MP.6. Attend to precision. 7.MP.7. Look for and make use of structure. 7.MP.8. Look for and express regularity in repeated reasoning.
7.SP.8 Find probabilities of compound events using organized lists, tables, tree diagrams, and simulation. a. Understand
that, just as with simple events, the probability of a compound
7.MP.1. Make sense of problems and persevere in solving them. 7.MP.2. Reason abstractly and quantitatively. 7.MP.4. Model with mathematics.
simple events probability compound event fraction outcomes sample space
understand
fraction sample space compound event tree diagrams frequency tables
Students use tree diagrams, frequency tables, and organized lists, and simulations to determine the probability of compound events.
CCGPS 7th Grade Math Content Standards Unpacked Page 54 of 55 Bibb County School System May 2012
event is the fraction of outcomes in the sample space for which the compound event occurs.
DOK 1
7.MP.5. Use appropriate tools strategically. 7.MP.7. Look for and make use of structure. 7.MP.8. Look for and express regularity in repeated reasoning.
b. Represent sample spaces for compound events using methods such as organized lists, tables and tree diagrams. For an event described in everyday language (e.g., “rolling double sixes”), identify the outcomes in the sample space which compose the event.
DOK 2
7.MP.1. Make sense of problems and persevere in solving them. 7.MP.2. Reason abstractly and quantitatively. 7.MP.4. Model with mathematics. 7.MP.5. Use appropriate tools strategically. 7.MP.7. Look for and make use of structure. 7.MP.8. Look for and express regularity in repeated reasoning.
sample space compound event methods organized lists tables tree diagrams outcomes compose
represent identify
tree diagrams outcomes sample space tables
Show all possible arrangements of the letters in the word FRED using a tree diagram. If each of the letters is on a tile and drawn at random, what is the probability that you will draw the letters F-R-E-D in that order? What is the probability that your “word” will have an F as the first letter?
c. Design and use a simulation to
7.MP.1. Make sense of problems and
simulation frequencies compound
design use
ratio frequencies
Probabilities are useful for predicting what will happen over the long run. Using theoretical probability, students predict frequencies of outcomes. Students recognize an appropriate design to conduct an
CCGPS 7th Grade Math Content Standards Unpacked Page 55 of 55 Bibb County School System May 2012
generate frequencies for compound events. For example, use random digits as a simulation tool to approximate the answer to the question: If 40% of donors have type A blood, what is the probability that it will take at least 4 donors to find one with type A blood?
DOK 4
persevere in solving them. 7.MP.2. Reason abstractly and quantitatively. 7.MP.4. Model with mathematics. 7.MP.5. Use appropriate tools strategically. 7.MP.7. Look for and make use of structure. 7.MP.8. Look for and express regularity in repeated reasoning.
event experiment with simple probability events, understanding that the experimental data give realistic estimates of the probability of an event but are affected by sample size.