48
CCMA Landslide and Erosion Database Version 2 Warren Feltham July 2005 (Dept. Geology)
CCMA Landslide and Erosion Database
Version 2
Warren Feltham July 2005
(Dept. Geology)

CCMA Landslide and Erosion Database. July 2005
2
Summary Within the Corangamite Catchment Management Authority (CCMA) region, land degradation due to soil erosion and mass wasting impacts on waterway health, agricultural productivity, infrastructure and the environment. The CCMA is developing a Soil Health Strategy which aims to encourage sustainable soil health management practices to reduce the impact of land degradation on assets. The aim of this project is to create a spatial erosion and landslide database for the CCMA region. The erosion and landslide database will be eventually be used to develop Resource Condition Targets as part of the Corangamite Soil Health Strategy (CSHS). The data will also be used in the Corangamite River Health Strategy (RHS) to assist in determining the source of sediments and nutrients within the catchment. An initial pilot project was undertaken in 2004 by the University of Ballarat which covered 13% of the CCMA area. This project continues on from the pilot project and has completed the coverage of the entire CCMA area. Erosion and landslide features were identified using aerial photo identification and field checking. The initial pilot project identified 639 features in two 1:50 000 map areas. A further 2424 features have been added to the database from aerial photo interpretation and field checking during the current project. Additional data sets were also included in the Landslide and Erosion Database from previous studies in the Woady Yaloak catchment, landslide studies in south west Victoria and data provided by the City of Greater Geelong, bringing the total number of features in the database to 4673, with 3893 features having a confidence value of ‘certain’ This report covers the methods used to collect the data contained in the database and some limited geographical distribution analysis and comparisons against other environmental data sets. A more detailed analysis of the Erosion and Landslide Database will be undertaken in the second half of the year and the results will be included as part of an Bachelor of Applied Science Honours thesis.

CCMA Landslide and Erosion Database. July 2005
3
Table of Contents
1.0 Introduction ........................................................................... 5 1.1 Project Aims................................................................................. 5
1.2 CCMA Region............................................................................... 5
2.0 Erosion and Landslide Processes .............................. 6 2.1 Erosion ......................................................................................... 6
2.2 Landslides.................................................................................... 14
3.0 Methods ................................................................................... 16 3.1 Database Creation ....................................................................... 16
3.2 Aerial Photo Mapping.................................................................. 16
3.3 Field Work .................................................................................... 19
3.4 Database Consolidation.............................................................. 20
3.5 Additional Datasets Added to Database ................................... 20
4.0 Results ..................................................................................... 24 4.1 Coverage of the CCMA area ....................................................... 24
4.2 Summary of Collected Data........................................................ 24
4.3 Comparison against Landscape Zones..................................... 25
4.4 Coverage of Municipalities ......................................................... 29
4.5 Proximity to Priority Waterways ................................................ 32
4.6 Proximity to Wetlands................................................................. 32
4.7 Proximity to Transport Infrastructure........................................ 33
4.8 Comparison against CCMA Bioregions .................................... 33
4.9 Comparison against Ecological Vegetation Classes............... 34
4.10 Comparison against Total Annual Rainfall ............................. 36
4.11 Comparison against CCMA LRA Soil-Landform Maps .......... 37

CCMA Landslide and Erosion Database. July 2005
4
4.12 Comparison against Surface Geology .................................... 39
5.0 Conclusions........................................................................... 42
5.1 General Conclusions................................................................... 42
5.2 Methods........................................................................................ 42
5.3 Statistics....................................................................................... 42
6.0 Further Work.......................................................................... 43
References..................................................................................... 44
Appendices.................................................................................... 45
Acknowledgements Troy Clarkson, Soils Program Manager, Department of Primary Industries Victoria, for financial support and information. Corangamite CMA, for supply of data sets and support of the project. Peter Dahlhaus & Tony Miner, for Honours supervision. Bob Smith, Technical Officer, University of Ballarat, for technical and administrative support.

CCMA Landslide and Erosion Database. July 2005
5
1.0 Introduction Land degradation due to soil erosion and mass wasting has a major impact on water way health, agricultural productivity, rural and urban infrastructure and the environment within the Corangamite Catchment Management Authority (CCMA) area. In an attempt to address these issues, the CCMA is developing the Corangamite Soil Health Strategy (CSHS) as a sub-strategy of the Regional Catchment Strategy (RCS). The CSHS aims to promote sustainable management of soils to reduce the impact of land degradation on these assets (Clarkson 2003).
1.1 Project Aims This project aims to create an erosion and landslide database for the CCMA area. The main purpose of the database is to determine the spatial distribution of the various forms of erosion in the Corangamite region. The knowledge gained in this project will inform the economic analysis of the CSHS and ultimately help develop Resource Condition Targets and Management Action Targets. The CCMA Landslide and Erosion Database was created as a MapInfo table to capture important spatial information and to allow for easier comparison against existing Geographic Information System (GIS) datasets such as those compiled by Victorian State Government Departments. The Landslide and Erosion Database will be distributable on CD along with MapInfo’s freely distributable GIS viewer, Proviewer. This project was funded by the Department of Primary Industries Victoria.
1.2 CCMA Region The CCMA covers an area of approximately 13340 km2 and is located in south western Victoria (Figure 1.1). The broad geomorphic land forms of the CCMA include the Central Highlands, the Volcanic Plains, the Otway Ranges and the Coastal Plains. Topography varies from deeply dissected valleys in the Otway Ranges to broad, flat landscapes on the plains. Annual rainfall varies from 470mm in the east of the CCMA to up to 1900mm in the Otway Ranges.
Figure 1.1 . CCMA location

CCMA Landslide and Erosion Database. July 2005
6
2.0 Erosion and Landslide Processes This section provides a brief overview of erosion and landslide processes and includes definitions of the types of erosion identified in the database. Examples of the various forms of erosion are illustrated.
2.1 Erosion Erosion of landscapes is a natural and on-going geological process. The major agents of erosion are wind and water. Erosion can be accelerated by the removal of surface material and or vegetation. This may occur due to human activity such as land clearance for agriculture, animal activity such as rabbit burrowing or due to other geological processes such as landslides. The eroded material is generally deposited locally downslope from the affected area (Dahlhaus 2003). Several forms of erosion may be present at one site. Forms of erosion include inter-rill (sheet) erosion, rill erosion, tunnel erosion, gully erosion and incised stream erosion. Factors that may affect susceptibility to erosion include slope characteristics such as slope gradient, slope geometry, slope length, vegetation cover, rainfall patterns, soil properties and the susceptibility of the soil to erosion, past and present land use and land management practices (Toy et al. 2002).
2.1.1 Inter-rill (Sheet) and Rill Erosion Inter-rill erosion occurs in areas of the landscape that experience overland flow as a result of the generation of surface runoff from a rainfall event. The dominant cause of erosion in inter-rill areas is by the detachment of soil particles by the impact of rain drops on the soil surface (Toy et al. 2002). Rill erosion occurs in conjunction with inter-rill erosion in overland flow areas of the landscape and consists of small channels where overland flow becomes concentrated due to the micro-topography of the landscape. The location and pattern of rill erosion is determined by the small scale topography of the soil surface on the hill slope, not the large scale topography of the landscape (Toy et al. 2002). The main cause of rill erosion is the detachment of soil particles by surface runoff with the effects of rain drop impact being of lesser importance.

CCMA Landslide and Erosion Database. July 2005
7
Figure 2.1 Feature WF01. Inter–rill / Rill erosion, Peady Street Reserve, Ballarat.
Figure 2.2 Feature WF05. Inter-rill / Rill erosion, Peady Street Reserve, Ballarat.

CCMA Landslide and Erosion Database. July 2005
8
Figure 2.3 Feature WF2391. Inter–rill / Rill erosion east of Clifton Springs along the north shore of the Bellarine Peninsula.
2.1.2 Gully Erosion Gully erosion is the most visually apparent form of erosion. Gully erosion is the development of steep sided channels that erode headward due to concentrated runoff (McDonald 1990) (Figure 2.4 - 2.7). Gully erosion occurs in areas of the landscape that form natural depressions where overland flow generated from a rainfall event converges into a concentrated flow (Toy et al. 2002). Gullies may also form due to sub-surface tunnel collapse where sub surface flow forms tunnels in dispersive soils that are prone to collapse.

CCMA Landslide and Erosion Database. July 2005
9
Erosion is concentrated at the head of the depression where steep scarps develop as a result of undercutting. The undercutting of the head scarp deepens the channel and undermines the headwall which eventually causes collapse, increasing the length of the gully upslope (Morgan 1986). Erosion also occurs along the side walls of gullies by similar processes to stream bank erosion, partly by the scouring action of channel flow with its sediment load and partly by the slumping of sidewalls due to saturation during periods of channel flow along the gully (Morgan 1986). Rates of erosion in gullies are episodic, varying from year to year depending on the magnitude of rainfall events that occur and variations in vegetation cover (Toy et al. 2002).
Figure 2.4 Feature WF2422. Gully erosion south of Berringa.

CCMA Landslide and Erosion Database. July 2005
10
Figure 2.5 Feature WF27. Gully erosion north of Meredith.
Figure 2.6. Feature WF38 revegetated but still active gully erosion, north of Invermay.

CCMA Landslide and Erosion Database. July 2005
11
Figure 2.7 Feature WF39 revegetated but still active gully erosion, north of Invermay.
2.1.3 Tunnel Erosion Tunnel erosion is the removal of subsurface material by water while surface material remains intact (Figure 2.8). Susceptibility to tunnel erosion is affected by soil properties, slope angle and high rainfall. This process can be accelerated by rabbit burrowing. Eventually tunnel erosion can collapse to form gullies. Tunnels occur in soils where the structural stability is poor, such as soils that are prone to slaking and dispersion or sodic soils.

CCMA Landslide and Erosion Database. July 2005
12
Figure 2.8 Feature WF2427. Tunnel erosion south of Berringa.
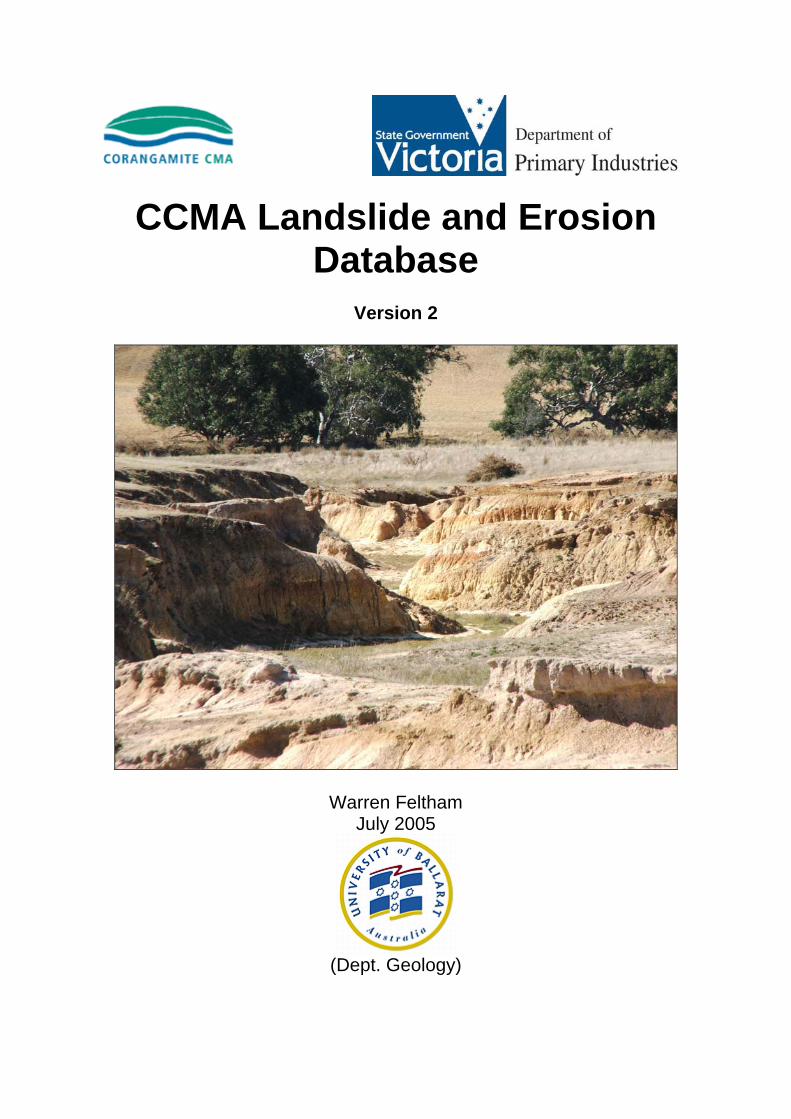
2.1.4 Incised Stream Erosion Incised Stream erosion occurs along stream banks during periods of higher water volume such as flood waters (Figure 2.9 – 2.11). The stream banks are undercut by the flow of water and eventually the bank collapses into the stream. The clearing of vegetation along the banks of a stream can accelerate erosion (Morgan 1986). Human activities on upland areas and within stream channels can greatly influence stream erosion. Dramatic changes in land use such as the removal of natural vegetation for agriculture or urban development, that increase runoff levels can destabilise stream channels and initiate stream bank under cutting and erosion. The increase in flow volume and velocity causes undercutting of the stream banks to occur, eventually the over hanging material fails and slumps into the stream channel. Stream banks can also erode when the soil becomes saturated and fails due to the increase in weight, slumping into the stream channel (Morgan 1986). Erosion widens stream channels, producing large sediment loads that can severely degrade water quality.
CCMA Landslide and Erosion Database. July 2005
13
Figure 2.9 Feature WF648. An example of incised stream erosion north east of Rokewood, border collie for scale
Figure 2.10 Feature WF695. Incised stream erosion near Rokewood Junction.

CCMA Landslide and Erosion Database. July 2005
14
Figure 2.11 Feature WF2398. Stream sediment obstructing a road bridge along the Geelong - Bacchus Marsh Road.
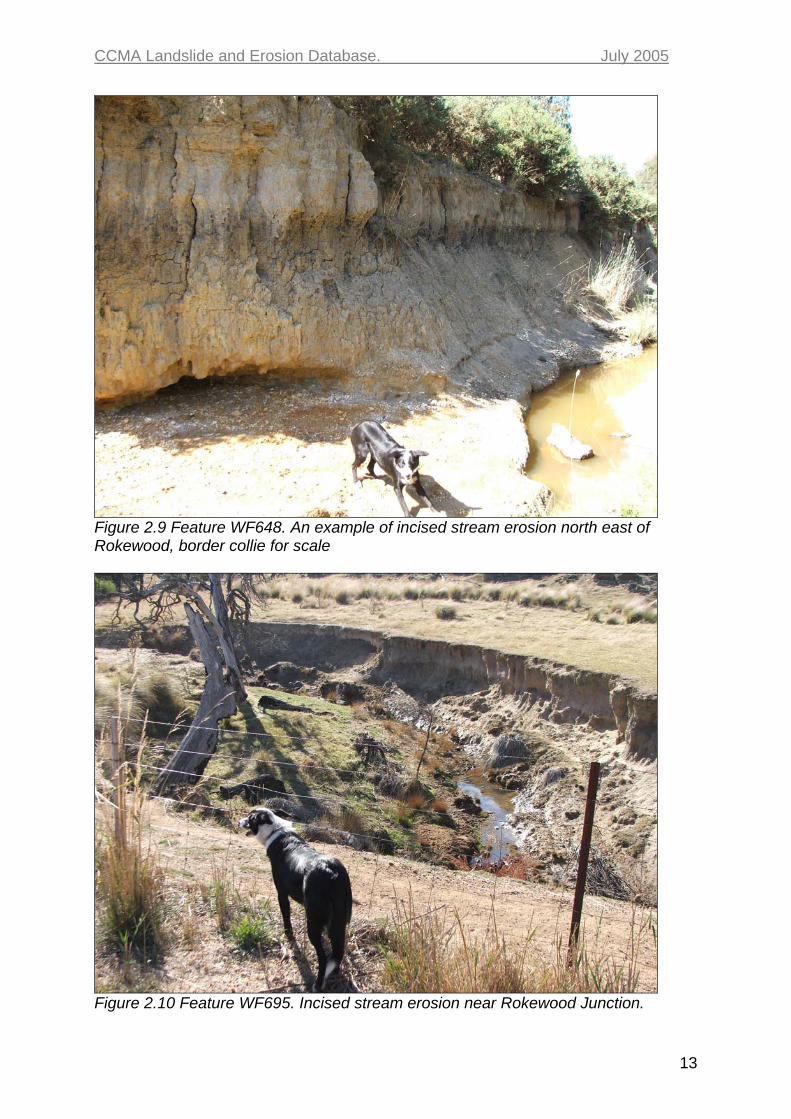
2.2 Landslides Landslides consist of the movement of earth materials downslope under the influence of gravity. Landslide events are a natural geological agent in landscape evolution (Figure 2.12, 2.13). They are the major factor in the formation of valleys and coastlines. The major forces controlling landslides is the force of gravity and the resistance to the force of gravity. For a landslide to occur the force of resistance must become less than the force of gravity. The area affected by a landslide event may be a few metres to over 120 hectares and the amount of material dislodged may vary from a few cubic metres to over ten million cubic metres (Dahlhaus 2003). Factors influencing the likelihood of landslides include rainfall, slope angle, slope aspect, previous movement, the geological attributes, drainage, vegetation and human activity. Landslide events can be triggered by extended or heavy rainfall, human alteration of landscapes such as land clearance or property development or by earthquake events. Landslides have an adverse impact on agricultural production and stream siltation and can present a significant threat to life, property and infrastructure.
CCMA Landslide and Erosion Database. July 2005
15
Figure 2.12. Feature WF2410. A recent landslide at Lake Bullen Merri near Camperdown.
Figure 2.13 Feature WF28. A landslide north of Meredith

CCMA Landslide and Erosion Database. July 2005
16
3.0 Methods This section outlines the methods of mapping and data entry. It includes a discussion of the additions to the database from existing sources
3.1 Database Creation The database structure was established in the initial pilot project in 2004 (Appendix A). The majority of the database fields were defined during meetings with Primary Industries Research Victoria (PIRVic) on 2 September 2004 and were finalised at a CSHS Technical Meeting on 16 September 2004.The centroid coordinates fields were added at a later stage. The database fields include: a unique identifier for each feature, geographic coordinates, the type/s of degradation (gully erosion, sheet erosion, stream erosion, mass wasting & other soil degradation) and fields for details of the data source and method of data capture. There has been one minor modification in that the ‘access’ field has been removed from the final version. Column values used in the database are in full english (Appendix A). The use of abbreviations can be ambiguous and confusing, especially for users that have no familiarity with the correct meanings.
3.2 Aerial Photo Mapping Orthophoto mosaics of the study areas supplied by the CCMA, were the main data sets used to identify erosion and landslide features. Each set of orthophoto mosaics was associated with an individual shire within the CCMA area. The date flown for sets of orthophotos for the City of Greater Geelong, Golden Plains Shire, Colac Otway Shire and the Surf Coast Shire were not determined except for the year. To indicate this lack of information, the database field ‘date_aerial_photo’ for features identified from these orthophotos has been set to 01/01/2002.
Municipality Pixel Size Date Flown City of Ballarat 0.8m March 2003 Moorabool Shire 0.5m November 2004 Golden Plains Shire 0.5m November 2004 Golden Plains Shire unknown (month?) 2002 Corangamite Shire 0.8m April 2003 Colac Otway Shire 0.35m November 2004 Colac Otway Shire unknown (month?) 2000 Surf Coast Shire 0.35m November 2004 Surf Coast Shire unknown (month?) 2002 City of Greater Geelong unknown (month?) 2002 Table 3.1. Pixel Size in metres of each orthophoto set and the date when each set was flown.

CCMA Landslide and Erosion Database. July 2005
17
Figure 3.1. The local government areas encompassed by the CCMA. Gully and sheet erosion features that were not obscured by vegetation were particularly well defined on the aerial photographs (Figure 3.1). Landslide features that had occurred recently were relatively easy to identify, whereas landslides that had occurred some time ago and had undergone the effects of weathering and revegetation were difficult to identify. The resolution of the aerial photos greatly affected the likelihood of identifying erosion and landslide features. The Ballarat, Corangamite, Geelong and the 2002 Surf Coast Shire aerial photo sets were of good definition, allowing for the identification of relatively small scale features. In April 2005, more recent aerial photo sets that were flown during November 2004 became available for several shires. These new aerial photo sets covered approximately 64% of the CCMA region. These aerial photo sets were of a very good resolution, in the case of the Colac – Otway Shire and Golden Plains shire the photos were a significant improvement on the previous sets. This resulted in a number of features being identified in the new aerial photos that were not visible in the previous sets. A number of features that had been identified in previous versions of aerial photos that were marked as uncertain were able to be better identified in the more recent aerial photos. The shires for which new aerial photo sets became available were:
Moorabool Shire Golden Plains Shire Colac Otway Shire Surf Coast Shire

CCMA Landslide and Erosion Database. July 2005
18
Drainage and contour topography data were very useful in identifying prospective areas where erosion and landslide features were likely to be found. Contour data was very useful in estimating the steepness of slopes. The aerial photos did not provide a good perception of topographical variation and the contour data assisted in this. Features were entered as polygon objects for larger scale objects (Figure 3.1, 3.2), line objects were used for stream erosion and point objects were used for small scale features. Point objects were also used when the interpretation of possible degradation features was ambiguous but still worth recording.
Figure 3.2 . Feature WF58. Aerial Photo Mapping of gully erosion
Figure 3.3 . Feature WF58. Aerial Photo Mapping of gully erosion with polygon object overlying the erosion feature.

CCMA Landslide and Erosion Database. July 2005
19
3.3 Field Work The field work stage involved the physical inspection of landslide and erosion features. General areas of interest were identified from reviewing the data collected from the aerial photographs. A print out of the areas was made from MapInfo displaying the mapped erosion and landslide features and road topography data to aid in navigation. To assist in the location of features that were identified from aerial photographs, a simple GIS application was developed using Visual Basic and MapX Mobile software for use on a pocket PC that could be carried easily in the field. The application displayed the landslide and erosion features mapped from the aerial photos, town locations for the study areas and road topography. The functions included in the application were: Pan allows user to pan map display in desired direction Zoom In/Out allows user to zoom map display in and out Select Numeric Coordinate System presents the user with a choice of
coordinate systems to use in displaying a feature’s X and Y coordinates. Turn Roads On/Off, this option was included to allow quicker screen refreshing when looking at large areas. Display Feature X/Y Coordinates, display message box with X and Y grid coordinates of selected feature.
To locate an individual feature that had been mapped from the aerial photographs, the X and Y coordinates could be displayed using the GIS application and then entered into a Global Positioning System (GPS) hand unit as a landmark. This landmark could then be used to navigate to the location of a particular feature. Field data on each feature inspected was recorded in a spreadsheet on the pocket PC. The spreadsheet was structured identically to the final database structure. Conversion of the recorded data in the spreadsheet into the final database was greatly aided by this method of data collection. This eliminated a time consuming step in digitising collected data as the information was captured in a digital format at the point of entry in the field. The pocket PC had text recognition software that worked well, allowing for data to be written directly onto the screen. The cut and paste functionality allowed for standard values to be easily transferred into a new entry very quickly. The combination of features on the pocket PC allowed for data recording in the field in a far more efficient manner that the use of a traditional notebook. A digital camera with a resolution of 4.0 mega pixels was used to photograph each of the features recorded. The digital camera had an optical zoom of 10x that was useful for taking pictures of greater detail especially where features were of a small size or some distance from a public road. Images were labelled after the unique identifier for each feature. Multiple images of a feature were numbered sequentially eg: ‘WF01-01.jpg’. The inclusion of images of erosion and landslide features in the data set on the final CD is of enormous benefit to end users. Although the images have not been incorporated into the database itself, the images can still be accessed from the using a simple image viewing application.

CCMA Landslide and Erosion Database. July 2005
20
The images can display a significant amount of information quickly to a user. The images will be of great use in locating features if users wish to inspect specific sites. The coordinates were recorded for each position where a physical inspection of a feature was undertaken. These coordinates were of use in matching the field inspected features with those identified from the aerial photographs. The projection system used to record location coordinates was WGS84, zones 54 and 55. The location coordinates are recorded in the database using WGS84 Zone 54. A single projection system was used for all coordinates to simplify the database structure. If a user requires the coordinate data in a different projection system, a GIS application can be used to convert the provided coordinates. The location coordinates in the database were taken from the centroid of the graphical object representing each feature. Such an approach was taken due to the variety of graphical shapes and formats used to represent erosion and landslide features in the database. Where an erosion or landslide feature was inaccessible, a laser range finder was used to determine the distance to the feature from the position where the data was recorded. The laser range finder was particularly useful in determining the position of inaccessible landslides that had occurred along shoreline cliff faces. Landslides that have occurred along shoreline cliff faces are difficult to identify from aerial photographs due to their vertical profile. The range finder was also of use in hilly areas. Where a small scale feature was identified on a hillside, the range finder would be used to determine the distance from the point of observation. This distance value was very useful later on when attempting to locate the position of the feature on aerial photographs.
3.4 Database Consolidation The data collected during field work on the pocket PC was consolidated in Excel spreadsheets. This data was combined with the relevant GIS graphical object identified from the Aerial Photo Mapping table and added to the erosion and landslide database using a MapBasic application to link the two datasets by matching the field: ‘Poly_Id’. The remaining features that were identified from the Aerial Photo Mapping that were not inspected during the field work stage were transferred into the erosion and landslide database with no alterations. A separate MapBasic application was used to populate the CentroidX and CentroidY database fields for each feature in the database. This application extracted the centroid coordinates from each feature’s graphical object and inserted the values into the CentroidX and CentroidY fields.
3.5 Additional Datasets Added to Database Three existing data sets were added to the database, viz: the Woady Yaloak Catchment erosion map, the SWLandslides database and the City of Greater Geelong’s erosion and landslide data set. As is usually the case, these datasets had their own existing data structure. Where possible, information from these datasets was inserted into corresponding fields within the Erosion and Landslide Database.
3.5.1 Woady Yaloak Catchment erosion map The Woady Yaloak Catchment erosion map was compiled as part of the Department of Agriculture’s report: “The Woady Yaloak River Catchment Action Plan” (Nicholson,

CCMA Landslide and Erosion Database. July 2005
21
1993). The original data was collected in a field mapping project undertaken by a Graduate Diploma of Land Rehabilitation student; Graeme Stockfeld, at the University of Ballarat. Two main types of erosion are represented in the Woady Yaloak data, gully erosion and stream erosion. The hard copy of the map was scanned in to a digital image and registered as a raster image in MapInfo. The map image was displayed in MapInfo with road topography overlain. The image registered reasonably well, the road topography was important in accurately positioning the mapped stream and gully erosion represented in MapInfo. The mapped stream and gully erosion was then digitised in MapInfo (Figure 3.4).
Figure 3.4. Example of digital capture of Woady Yaloak erosion map in MapInfo. Green lines indicate mapped erosion features, the red dashed lines represent the initial graphical objects within MapInfo. The digitised erosion features were then displayed over the aerial photography for the area, along with drainage topography. Most of the mapped features aligned well with the drainage topography and observable gully and incised stream erosion features. Where the graphical objects did not align with the topography or the aerial photographs they were adjusted to fit observable drainage patterns and erosion features. The digitised Woady Yaloak data was inserted into the Erosion and Landslide Database using a MapBasic application that was written specifically for the task. The Woady Yaloak data consists of line objects, no points or polygons were included as these objects did not suit the original data format. All of the Woady Yaloak data was given the following default values for the database fields of ‘Date_mapped’ and ‘Mapped_by’; “01/03/1993” (the approximate date the mapping was undertaken) and “G Stockfeld” (the person who undertook the mapping). The Woady Yaloak data can be separately selected from the rest of the database using these values.

CCMA Landslide and Erosion Database. July 2005
22
3.5.2 South West Landslides database The SWLandslides database (McVeigh, 2001) was already in a MapInfo format which allowed for easier transfer of data into the erosion and landslide database. Selected fields from the SWLandslides database were transferred across to equivalent fields in the erosion and landslide database (Table 3.1). The graphical object representing the landslide feature was transferred directly across with no alterations. The centroid X and Y values of the graphical object were inserted into the ‘Centroid_X’ and ‘Centroid_Y’ fields of the Erosion and Landslide Database using the projection system WGS84, Zone 54.
SWLandslides database CCMA Erosion and Landslide Database
Data_Source Data_source Data_Mapped_by Mapped_by
Data_Mapped_Method Map_method Data_Capture_Date Date_captured Data_Mapped_Date Date_mapped
Table 3.2 . Fields transferred from SWLandslides database to CCMA Erosion and Landslide database. The data from the South West Landslide database can be distinguished by the graphical objects used to display the data. The object colour is black. Graphical objects consist of points, lines and polygons with a cross hatch fill pattern (Figure 3.5). The data was transferred by a simple MapBasic application that was written specifically for this task.
Figure 3.5 Example of features from the South West Landslides database

CCMA Landslide and Erosion Database. July 2005
23
3.5.3 City of Greater Geelong EMO data An additional data set was provided by the City of Greater Geelong in a GIS format. This data consisted of erosion and landslide features that were identified from previous council and consultant reports for the area of the City of Greater Geelong. This data was transferred into the Landslide and Erosion Database using a Mapbasic application that was written specifically for this task.
Figure 3.6. Example of features from City of Greater Geelong data set. The data from the City of Greater Geelong can be distinguished by the graphical objects used to represent the data. The graphical objects consist of polygon objects with a black outline and a solid white fill (Figure 3.6). This data set is only found within the municipal boundaries of the City of Greater Geelong. The data represents instances of three main types of land degradation; Landslides, Coastal and Erosion. These were represented in the CCMA Erosion and Landslide Database in the following manner:
• Landslide was given a ‘certain’ value for the ‘Mass wasting’ field. • Coastal was given a ‘certain’ value for the ‘Other’ field with the value ‘coastal
degradation’ for the ‘Comments’ field. The Landslide and Erosion Database currently has no provision for coastal degradation processes.
• Erosion was given an ‘uncertain’ value for the ‘Gully’ and ‘Sheet’ fields as no supporting data was supplied to distinguish the type of erosion represented by the City of Greater Geelong graphical objects.
All features included in the CCMA Landslide and Erosion Database that were derived from the City of Greater Geelong data were given default values listed in Table 3.3 as information to populate these fields was not part of the original data set.
Landslide and Erosion Database field Value
Data_source City of Greater Geelong Map_method unknown Mapped_by unknown Date_captured 15/05/2005 Table 3.3. Lists the default values assigned to certain database fields for features derived from the City of Greater Geelong data set.

CCMA Landslide and Erosion Database. July 2005
24
4.0 Results This section provides a limited spatial analysis of the features in the database. A more thorough analysis and discussion will be provided following the completion of the B.App.Sci.(Hons). research thesis.
4.1 Coverage of the CCMA area Aerial Photo Mapping has been completed for the entire CCMA area. The extent of field checking undertaken varied across the CCMA. Extensive field checking was undertaken in the City of Greater Geelong, City of Ballarat, Golden Plains Shire, Moorabool Shire, and the Surf Coast Shire. Limited field checking was undertaken in the Corangamite Shire and the Colac Otway Shire, this was mainly due to the large areas covered by these shires and the large number of features identified within these shires.
4.2 Summary of Collected Data The total number of features in the database that were field checked was 169. The number of features in the database identified by aerial photo interpretation and field checking was 3063. The total number of features in the database including the Woady Yaloak erosion map, SWLandslides database and the City of Greater Geelong data set is 4673 (Figure 4.2). The total number of features in the database with a confidence value of “certain” is 3893. A particular feature may have more than one type of erosion present. Table 4.1 displays the total number of each type of erosion identified.
Feature Type Certain Total No. Identified
% of Total as Certain
Gully Erosion 626 696 90% Sheet Erosion 993 1311 76% Stream Erosion 209 241 87% Mass Wasting 1924 2252 85% Other Soil Degradation 423 641 67%
Table 4.1 . Breakdown of erosion and landslide features in the final database. The Total No. Identified includes features with a value of ‘uncertain’. The percentage of features with a value of ‘certain’ is displayed in the final column. The approximate total area for feature types represented by polygons with a confidence value of “certain” (polyline and point objects return an area value of zero) is displayed in Table 4.2. The feature types are Gully Erosion, Sheet Erosion and Mass Wasting. The area values are an approximation as the polygon graphical objects are only a rough outline of the shape of each feature and slope gradients have not been taken into account. It should also be considered that the majority of Mass Wasting features are represented in the database as polyline and point objects

CCMA Landslide and Erosion Database. July 2005
25
as well as comparatively few polygon objects; these objects return an area value of zero within MapInfo.
Feature Type Approximate Total Area km2 Gully Erosion 12 km2 Sheet Erosion 18 km2 Mass Wasting (polygon objects only) 92 km2 Table 4.2 Approximate Total Area of mapped instances of Gully Erosion, Sheet Erosion & Mass Wasting.
Figure 4.1 Final data set for CCMA Erosion and Landslide Database as at July 2005.
4.3 Comparison against Landscape Zones The erosion and landslide data was compared against CCMA Landscape Zones (Figure 4.2) using the graphical object of each feature (Table 4.3). Table 4.4 displays the total approximate area (km2) affected for gully erosion, sheet erosion and mass wasting by Landscape Zone. These comparisons include features from the database with a column value of “certain”, all features with a column value of “uncertain” were not included.

CCMA Landslide and Erosion Database. July 2005
26
Figure 4.2 Landscape Zones within the CCMA.
Landscape Zone
Gully Erosion
Sheet Erosion
Mass Wasting
Stream Erosion
Aire 0 21 130 0 Bellarine 12 15 24 5 Curdies 7 1 452 1 Gellibrand 3 57 565 0 Hovells 17 73 3 18 Leigh 140 132 2 34 Lismore 3 6 0 10 Mid Barwon 6 57 15 10 Moorabool 135 216 25 25 Murdeduke 0 18 0 2 Otway Coast 0 21 402 0 Stony Rises 3 4 7 3 Thompsons 8 51 55 13 Upper Barwon 28 52 206 19 Woady Yaloak 242 147 0 55 Table 4.3 Erosion and Landslide features by CCMA Landscape Zones.

CCMA Landslide and Erosion Database. July 2005
27
Landscape Zone
Gully Erosion
(km2)
Sheet Erosion
(km2)
Mass Wasting
(km2) Aire 0 km2 0.2 km2 0.3 km2
Bellarine 0.4 km2 0.4 km2 0.7 km2
Curdies 0.1 km2 < 0.1 km2 47.3 km2
Gellibrand < 0.1 km2 0.8 km2 32.5 km2
Hovells 0.6 km2 1.2 km2 < 0.1 km2
Leigh 1.6 km2 1.9 km2 0 km2
Lismore < 0.1 km2 < 0.1 km2 0 km2
Mid Barwon 0.2 km2 0.7 km2 0.2 km2
Moorabool 1.7 km2 2.9 km2 0.6 km2
Murdeduke 0 km2 0.2 km2 0 km2
Otway Coast 0 km2 0.2 km2 3.4 km2
Stony Rises < 0.1 km2 < 0.1 km2 < 0.1 km2
Thompsons 0.1 km2 0.6 km2 1.6 km2 Upper Barwon 2 km2 1.7 km2 4.7 km2
Woady Yaloak 4.1 km2 4.3 km2 0 km2
Table 4.4 Total approximate area (km2) affected by Landscape Zone
4.3.1 Threats to catchment assets by Landscape Zone At the request of DPI and the CCMA, counts of the erosion features within a 50 metre buffer of waterways, wetlands and roads by Landscape Zone was also undertaken (Table 4.5). This data was used in the economic analysis of the CSHS to determine the threats to assets and benefit – cost of the actions to reduce the impact of erosion.

CCMA Landslide and Erosion Database. July 2005
28
Table 4.5. Feature types by catchment asset 50 metre buffers and Landscape Zone.
Gully Erosion
Sheet Erosion
Mass Wasting
Stream Erosion
Landscape Zone
Tota
l gul
lies
50 m
from
uns
eale
d ro
ads
50m
from
sea
led
road
s
50 m
from
wat
erw
ays
50m
from
wet
land
s
Tota
l she
et e
rosi
on
50 m
from
uns
eale
d ro
ads
50m
from
sea
led
road
s
50 m
from
wat
erw
ays
50m
from
wet
land
s
Tota
l land
slid
es
50 m
from
uns
eale
d ro
ads
50m
from
sea
led
road
s
50 m
from
wat
erw
ays
50m
from
wet
land
s
Tota
l stre
am e
rosi
on
50 m
from
uns
eale
d ro
ads
50m
from
sea
led
road
s
50 m
from
wat
erw
ays
50m
from
wet
land
s
Aire 0 0 0 0 0 21 0 1 0 0 125 6 13 10 0 0 0 0 0 0 Bellarine 12 1 2 1 0 14 1 5 1 0 23 0 5 2 0 5 0 0 2 0 Curdies 7 1 1 0 0 1 0 0 0 0 442 37 39 37 6 0 0 0 0 0
Gellibrand 3 0 0 1 0 57 4 5 0 0 558 65 26 34 3 1 0 0 0 0 Hovells 17 2 1 1 0 73 9 8 6 3 3 0 0 0 0 18 3 3 6 0 Leigh 140 6 2 15 1 132 5 6 23 1 2 0 0 0 0 34 7 0 6 1
Lismore 3 0 0 1 0 6 1 0 1 0 0 0 0 0 0 10 1 1 10 1 Mid Barwon 6 0 0 1 0 56 2 4 24 3 14 1 0 8 0 10 1 1 4 0 Moorabool 135 4 7 9 2 216 7 11 22 1 23 2 3 12 0 25 3 10 9 0 Murdeduke 0 0 0 0 0 17 1 0 10 0 0 0 0 0 0 2 0 0 0 0
Otway Coast 0 0 0 0 0 21 3 2 4 0 399 77 50 59 0 0 0 0 0 0 Stony Rises 3 0 0 0 0 4 0 0 2 0 6 0 1 1 0 3 1 1 0 0 Thompsons 8 1 1 2 1 49 6 3 20 2 49 15 9 1 0 13 0 1 3 0
Upper Barwon 28 2 4 7 3 52 2 3 9 3 205 20 12 31 5 19 3 7 8 0
Woady Yaloak 242 31 17 47 2 147 14 11 41 3 0 0 0 0 0 55 15 16 17 4

CCMA Landslide and Erosion Database. July 2005
29
4.4 Coverage of Municipalities The erosion and landslide data was compared against the local government areas (Fig 3.1) using the graphical object’s centroid value in MapInfo. This comparison includes features from the database with a column value of “certain”, all features with a column value of “uncertain” were not included. The centroid value for an object is a point within the graphical object’s perimeter, generally the geographic centre of the object. Table 4.6 lists the number of each feature type that occurs within each municipality. Table 4.7 lists the total area and the total coverage achieved by this project of each municipality, the total approximate area of degradation by municipality and the total approximate area for each feature type. In assessing the information displayed in Table 4.5 it should be remembered that a particular feature may have more than one type of degradation and as a result that feature’s total area will be counted in multiple feature comparisons. Comparisons against the Borough of Queenscliff and Moyne Shire have been omitted from the following tables due to the low number of features mapped within their respective areas. In the current database there are only two features mapped that fall within the area of the Borough of Queenscliff, both are coastal degradation that fall under the field ‘other’ within the database. In the current database there are only seventeen features mapped within the area of the Moyne Shire, these consist of 1 ‘gully erosion’, 14 ‘mass wasting’ and 2 ‘other’.
Municipality Gully Erosion
Sheet Erosion
Mass Wasting
Stream Erosion
Other Soil Degradation
City of Ballarat 6 13 2 3 24
City of Greater Geelong
47 244 43 42 89
Colac-Otway Shire 15 122 1018 7 66
Corangamite Shire 14 23 645 14 46
Golden Plains Shire 379 359 14 94 98
Moorabool Shire 141 130 9 27 28
Surf Coast Shire 30 111 156 35 68
Table 4.6 The number of each feature that occurs within each municipality.
4.4.1 Threats to catchment assets by Municipality At the request of DPI and the CCMA, counts of the erosion features within a 50 metre buffer of waterways, wetlands and roads by Municipality was undertaken (Table 4.8). This data was used in the economic analysis of the CSHS to determine the threats to assets and benefit – cost of the actions to reduce the impact of erosion.

CCMA Landslide and Erosion Database. July 2005
30
Municipality Total Area km2
Coverage (% mapped)
Total Area Affected
km2
Gully Erosion
km2
Sheet Erosion
km2 Mass Wasting
km2 Other Soil
Degradation km2
City of Ballarat 739 km2 33% 2.2 km2 < 0.1 km2 0.1 km2 0 km2 2.1 km2
City of Greater Geelong
1274 km2 100% 33.8 km2 1.6 km2 4.1 km2 1.1 km2 28.1 km2
Colac-Otway Shire 3429 km2 100% 17.0 km2 1.1 km2 1.9 km2 12 km2 3.5 km2
Corangamite Shire 4407 km2 77% 76.6 km2 0.2 km2 0.2 km2 74 km2 2.3 km2
Golden Plains Shire 2701 km2 100% 15.1 km2 6.3 km2 7.4 km2 0.1 km2 5.4 km2
Moorabool Shire 2110 km2 43% 3.2 km2 1.1 km2 1.5 km2 0.2 km2 1.1 km2
Surf Coast Shire 1555 km2 100% 11.8 km2 1.3 km2 2.3 km2 2.5 km2 8.2 km2
Table 4.7 The coverage of each municipality achieved by this project and the Total Approximate Area of all degradation within each Municipality and the Total Approximate Area affected of each feature type by Municipality.

CCMA Landslide and Erosion Database. July 2005
31
Table 4.8 Feature type by catchment asset 50 metre buffers and municipality.
Gully Erosion
Sheet erosion
Mass wasting
Stream erosion
Municipality
Tota
l gul
lies
50 m
from
uns
eale
d ro
ads
50m
sea
led
from
road
s
50 m
from
wat
erw
ays
50m
from
wet
land
s
Tota
l she
et e
rosi
on
50 m
from
uns
eale
d ro
ads
50m
from
sea
led
road
s
50 m
from
wat
erw
ays
50m
from
wet
land
s
Tota
l land
slid
es
50 m
from
uns
eale
d ro
ads
50m
from
sea
led
road
s
50 m
from
wat
erw
ays
50m
from
wet
land
s
Tota
l stre
am e
rosi
on
50 m
from
uns
eale
d ro
ads
50m
from
sea
led
road
s
50 m
from
wat
erw
ays
50m
from
wet
land
s
City of Ballarat 6 0 0 0 0 13 2 3 0 0 2 0 0 0 0 3 1 0 0 0 City of Greater
Geelong 47 3 3 2 0 244 12 19 14 3 43 2 6 14 0 42 3 7 11 0
Colac-Otway Shire 15 1 2 1 2 122 6 9 11 1 1018 143 82 121 7 7 2 4 4 0
Corangamite Shire 14 1 1 2 0 23 3 1 2 0 645 53 61 40 8 14 1 1 11 1
Golden Plains Shire 379 36 22 67 3 359 21 19 89 5 14 0 0 7 0 94 24 19 28 5
Moorabool Shire 141 5 4 4 2 130 2 1 8 1 9 1 2 1 0 27 1 4 3 0
Surf Coast Shire 30 2 3 9 2 111 9 8 39 6 156 24 18 12 0 35 2 5 11 0

CCMA Landslide and Erosion Database. July 2005
32
4.5 Proximity to Priority Waterways The erosion and landslide data was compared against a series of buffers around priority waterways within the CCMA area (Table 4.9). These buffers were fifty, one hundred, two hundred, five hundred and one thousand metres. This comparison includes features from the database with a column value of “certain”, all features with a column value of “uncertain” were not included. The graphical object of each feature was used in the comparison against the priority waterways buffers. Waterways Buffer Size
Gully Erosion
Sheet Erosion
Mass Wasting
Stream Erosion
50 metres 85 163 195 68 100 metres 122 197 255 70 200 metres 182 256 382 72 500 metres 258 353 691 86 1000 metres 319 493 996 107 Table 4.9. The number of features within 50, 100, 200, 500, 1000 metres of priority streams within the CCMA area.
4.5.1 by Priority Waterways and Landscape Zone At the request of DPI and the CCMA, counts of the erosion features by Priority Waterways and Landscape Zone (Appendix B). This data was used in the economic analysis of the CSHS to determine the threats to assets and benefit – cost of the actions to reduce the impact of erosion.
4.6 Proximity to Wetlands The erosion and landslide data was compared against a series of buffers around wetlands within the CCMA area (Table 4.10). These buffers were fifty, one hundred, two hundred, five hundred and one thousand metres. This comparison includes features from the database with a column value of “certain”, all features with a column value of “uncertain” were not included. The graphical object of each feature was used in the comparison against the wetland buffers.
Wetland Buffer Size
Gully Erosion
Sheet Erosion
Mass Wasting
Stream Erosion
50 metres 9 16 18 6 100 metres 12 23 30 8 200 metres 15 41 43 13 500 metres 36 99 115 24 1000 metres 73 182 239 49 Table 4.10 The number of features within 50, 100, 200, 500 & 1000 metres of wetlands within the CCMA area.

CCMA Landslide and Erosion Database. July 2005
33
4.7 Proximity to Transport Infrastructure The Erosion and Landslide data was compared against fifty and one hundred metre buffers around all sealed roads, unsealed roads and railways within the CCMA area (Table 4.11). This comparison includes features from the database with a column value of “certain”, all features with a column value of “uncertain” were not included. The graphical object of each feature was used in the comparisons for the sealed and unsealed road fifty metre buffers. The entire graphical object for each feature was used in the comparison against railways fifty metre buffers.
Transport Buffer
Gully Erosion
Sheet Erosion
Mass Wasting
Stream Erosion
Sealed Road 50 metres 35 60 185 40
Sealed Road 100 metres 46 86 271 43
Unsealed Road 50 metres 48 55 226 34
Unsealed Road 100 metres 63 76 260 40
Railways 50 metres 2 0 0 1
Table 4.11 The number of features that occur within 50 & 100 metres of transport infrastructure within the CCMA area.
4.8 Comparison against CCMA Bioregions Table 4.12 displays the total number of each feature type compared against CCMA Bioregions (Figure 4.3). This comparison includes features from the database with a column value of “certain”, all features with a column value of “uncertain” were not included. The graphical object of each feature was used in the comparison against the CCMA Bioregions.

CCMA Landslide and Erosion Database. July 2005
34
Figure 4.3 Bioregions within the CCMA.
Bioregion name Gully Erosion
Sheet Erosion
Mass Wasting
Stream Erosion
Central Victorian Uplands 408 423 4 98 Otway Plain 47 146 303 31 Otway Ranges 4 75 979 2 Victorian Volcanic Plain 207 389 81 109 Warrnambool Plain 8 6 597 3
Table 4.12 Comparison of CCMA Bioregions with the different feature types from the CCMA Erosion and Landslide Database
4.9 Comparison against Ecological Vegetation Classes The following table (Table 4.13) displays the total number of each feature type compared against Ecological Vegetation Classes (EVC’s). This comparison includes features from the database with a column value of “certain”, all features with a column value of “uncertain” were not included. The graphical object of each feature was used in the comparison against the EVC’s.

CCMA Landslide and Erosin Database July 2005
EVC Number EVC Name Gully Erosion Sheet Erosion Mass Wasting Stream Erosion1 Coastal Dune Scrub / Coastal Dune Grassland Mosaic 1 2 32 03 Damp Sands Herb-rich Woodland 1 4 30 06 Sands Heathland 0 4 7 08 Wet Heathland 0 0 6 0
10 Esturine Wetland 0 1 2 016 Lowland Forest 17 25 354 217 Ribarian Scrub / Swampy Riparian Woodland Complex 0 7 44 018 Riparian Forest 2 8 60 020 Heathy Dry Forest 55 72 0 1221 Shrubby Dry Forest 0 3 18 022 Grassy Dry Forest 67 70 2 423 Herb-rich Foothill Forest 0 0 295 030 Wet Forest 3 18 338 031 Cool Temperate Rainforest 0 3 56 045 Shrubby Foothill Forest 3 26 352 047 Valley Grassy Forest 71 86 0 1048 Heathy Woodland 1 19 53 053 Swamp Scrub 0 5 10 055 Plains Grassy Woodland 29 55 5 956 Floodplain Riparian Woodland 1 1 10 957 Conifer Plantation 0 10 147 058 Cleared / severley disturbed 79 93 100 1168 Creekline Grassy Woodland 1 3 0 271 Hills Herb-rich Woodland 8 30 0 572 Granitic Hills Woodland 3 12 1 083 Swampy Riparian Woodland 2 4 1 4
121 Hardwood Plantation 1 1 1 0125 Plains Grassy Wetland 0 0 0 1128 Grassy Forest 6 6 3 0132 Plains Grassland 0 0 6 0161 Coastal Headland Scrub 1 10 167 1162 Coastal Headland Scrub / Coastal Tussock Grassland Mosaic 0 0 8 0163 Coastal Tussock Grassland 0 2 31 0164 Creekline Herb-rich Woodland 29 28 1 4165 Damp Heath Scrub 0 0 13 0175 Grassy Woodland 28 31 20 10178 Herb rich Foothill / Shrubbry Foothill Forest Complex 0 0 27 2181 Coastal Gully Thicket 0 0 6 0198 Sedgy Riparian Woodland 0 0 12 0201 Shrubby Wet Forest 2 15 317 0233 Wet Sands Thicket 0 0 2 0641 Riparian Woodland 4 1 0 6851 Stream Bank Shrubland 5 9 2 1858 Coastal Alkaline Shrub 0 0 1 0894 Scoria Cone Woodland 0 0 10 0895 Escarpment Shrubland 0 0 1 0897 Plains Grassland / Plains Grassy Woodland Mosaic 9 6 0 7987 Plantation (undefined) 5 8 71 5992 Water body - fresh 0 1 0 0995 Ocean 0 0 18 0997 Private land - no tree cover 618 922 1551 213998 Water body - natural or man made 6 9 34 0
Fig 4.13. features by Ecological Vegetation Class
35

CCMA Landslide and Erosion Database. July 2005
36
4.10 Comparison against Total Annual Rainfall The following table displays the total number of each feature type represented by Total Annual Rainfall. This comparison includes features from the database with a column value of “certain”, all features with a column value of “uncertain” were not included. The centroid of each feature’s graphical object was used in the comparison. The rainfall data was derived by a Point Comparison operation in Vertical Mapper, an ‘add in’ for MapInfo Professional. A number of features did not have a rainfall value from the Point Comparison operation. These features were located outside the boundaries of the Total Annual Rainfall data set. The number of features without a rainfall value was 220. These features were not included in the table below (Table 4.14).
Feature type 470 – 700 mm 700 – 1000 mm 1000 – 1900 mm Gully Erosion 572 39 2 Sheet Erosion 751 75 83 Stream Erosion 183 14 1 Mass Wasting 86 832 941 Other Soil Degradation 235 100 58
Table 4.14 Comparison of Erosion and Landslide feature types against Total Annual Rainfall.

CCMA Landslide and Erosion Database. July 2005
37
4.11 Comparison against CCMA LRA Soil-Landform Maps The following graphs (Figures 4.4 – 4.6) compare the Erosion and Landslide feature types against the CCMA Land Resource Assessment Soil Susceptibility Maps. This comparison includes features from the database with a column value of “certain”, all features with a column value of “uncertain” were not included. The graphical object of each feature was used in the comparison.
LRA Gully Erosion Susceptibility Against No. of features from CCMA Erosion & Landslide Database
0 5 337
15 2545
170
437
12 40
50
100
150
200
250
300
350
400
450
500
0 1 2 3 4 5 6 7 8 9 10
LRA Susceptibility Rating
No.
of G
ully
Ero
sion
Fea
ture
s
Figure 4.4 Graph of LRA Gully Erosion Susceptibility against the number of Gully Erosion features from the CCMA Erosion and Landslide Database.

CCMA Landslide and Erosion Database. July 2005
38
LRA Sheet Erosion Susceptibility Against No. of features from CCMA Erosion & Landslide Database
2 0 124
65
263
198
95
322
56
0
50
100
150
200
250
300
350
0 1 2 3 4 5 6 7 8 9
LRA Susceptibility Rating
No.
of S
heet
Ero
sion
feat
ures
Figure 4.5 Graph of LRA Sheet Erosion Susceptibility against the number of Sheet Erosion features from the CCMA Erosion and Landslide Database.
LRA Landslide Susceptibility against No. of features from CCMA Erosion & Landslide Database
570
148
22 49 42 16
210
349310
1041
0
200
400
600
800
1000
1200
0 1 2 3 4 5 6 7 8 9 10
LRA Susceptibility Rating
No. o
f Lan
dslid
e fe
atur
es
Figure 4.6 Graph of LRA Landslide Erosion Susceptibility against the number of Landslide features from the CCMA Erosion and Landslide Database.

CCMA Landslide and Erosion Database. July 2005
39
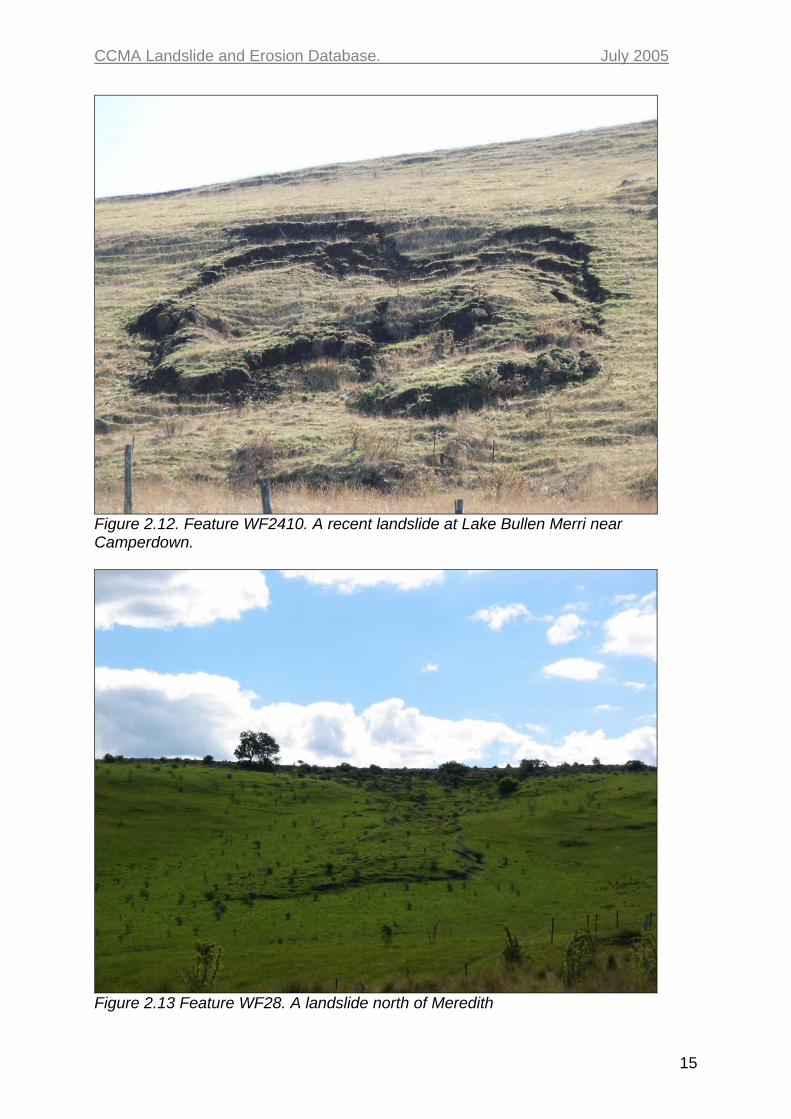
4.12 Comparison against Surface Geology The following pie charts (Figures 4.5 – 4.9) display the total number of each feature represented by surface geology. This comparison includes features from the database with a column value of “certain”, all features with a column value of “uncertain” were not included. The coordinates used to compare the erosion and landslide features against surface geology were taken from the centroid of each feature’s graphical MapInfo object. As a result, features such as incised stream erosion may not include all possible geological units intersected.
Gully Erosion Geology
49%
16%
10%
8%
8%
3%
2%
2%
1%
1%
0%
0%
0%
Ordovician SedimentaryRocksNeogene FluvialSedimentary RocksQuartenary Newer Volcanics
Cambrian SedimentaryRocksQuartenary Non MarineSedimentary RocksDevonian Granitic Rocks
Neogene Gellibrand Marl
Cretaceous Otway Group
Palaeogene Non MarineSedimentary RocksPalaeogene MarineSedimentary RocksPalaeogene OlderVolcanicsNeogene Port CambellLimestoneQuartenary Beach Deposits
Figure 4.5 Gully Erosion represented by Surface Geology
CCMA Landslide and Erosion Database. July 2005
40
Sheet Erosion Geology
30%
16%
16%
15%
8%
4%
4%3%
2%
1%
1%
0%
0%
0%
Ordovician SedimentaryRocksNeogene FluvialSedimentary RocksQuartenary NewerVolcanicsQuartenary Non MarineSedimentary RocksCretaceous Otway Group
Neogene Gellibrand Marl
Devonian Granitic Rocks
Palaeogene MarineSedimentary RocksCambrian SedimentaryRocksPalaeogene Non MarineSedimentary RocksPalaeogene OlderVolcanicsQuartenary BeachDepositsCambrian Volcanics
Neogene Port CambellLimestone
Figure 4.6 Sheet Erosion represented by Surface Geology
Stream Erosion Geology
33%
21%
18%
18%
5%3%
1%
1%
0% Ordovician SedimentaryRocksNeogene FluvialSedimentary RocksQuartenary Newer Volcanics
Quartenary Non MarineSedimentary RocksDevonian Granitic Rocks
Cretaceous Otway Group
Palaeogene MarineSedimentary RocksPalaeogene Non MarineSedimentary RocksCambrian SedimentaryRocks
Figure 4.7 Stream Erosion represented by Surface Geology

CCMA Landslide and Erosion Database. July 2005
41
Mass Wasting Geology
51%
23%
7%
7%
6%3%
2%
1%
0%
0%
0%
0%
Cretaceous Otway Group
Neogene Gellibrand Marl
Palaeogene MarineSedimentary RocksQuartenary Non MarineSedimentary RocksNeogene Port CambellLimestoneNeogene FluvialSedimentary RocksQuartenary Newer Volcanics
Palaeogene Non MarineSedimentary RocksOrdovician SedimentaryRocksQuartenary Beach Deposits
Devonian Granitic Rocks
Palaeogene OlderVolcanics
Figure 4.8 Mass Wasting represented by Surface Geology
Other Soil Degradation Geology
18%
16%
15%11%
9%
9%
9%
4%
3%
2%
2%
1%
1% Quartenary Newer Volcanics
Neogene FluvialSedimentary RocksOrdovician SedimentaryRocksCretaceous Otway Group
Quartenary Non MarineSedimentary RocksPalaeogene Non MarineSedimentary RocksPalaeogene MarineSedimentary RocksQuartenary Beach Deposits
Neogene Port CambellLimestoneDevonian Granitic Rocks
Neogene Gellibrand Marl
Cambrian SedimentaryRocksPalaeogene OlderVolcanics
Figure 4.9 Other Soil Degradation represented by Surface Geology

CCMA Landslide and Erosion Database. July 2005
42
5.0 Conclusions The following conclusions can be drawn from this study:
5.1 General Conclusions 1. Soil erosion and landslides are a serious threat to catchment assets
such as waterways wetlands, and transport infrastructure. 2. The majority of features (%) mapped are landslides in the southern
regions of the Corangamite CMA. Gully and sheet erosion are prevalent in the three northern catchments; the Woady Yaloak, Leigh and Moorabool.
5.2 Methods 3. The use of GIS software in this project was indispensable, a project of
this type would have been infinitely more time consuming to complete without such resources.
4. The use of very good quality orthophoto mosaics resulted in a high level of accuracy and very good coverage in the mapping of soil degradation features within the CCMA.
5. The level of detail provided in the orthophotos greatly assisted in identifying smaller scale features down to a dimension of about forty metres across.
6. Hand held computing devices with handwriting recognition software and GIS software greatly assist in gathering data in the field and greatly reduce the amount of time required to enter recorded information into a database.
7. The use of GIS software in data comparisons allows for statistics to be produced relatively quickly.
5.3 Statistics 8. The geographical distribution of mapped landslides and erosion
features compares favourably against the CCMA Land Resource Assessment Soil Susceptibility Ratings, particularly for landslides.
9. 65% of mapped gully and tunnel erosion features within the database occur in Ordovician Sedimentary rocks and Neogene Fluvial Sedimentary rocks.
10. 46% of mapped sheet and rill erosion features within the database occur in Ordovician Sedimentary rocks and Neogene Fluvial Sedimentary rocks.
11. 74% of mapped landslides within the database occur in the Cretaceous Otway Group and the Neogene Gellibrand Marl.
12. 91% of mapped gully and tunnel erosion features within the database have a total annual rainfall of between 400mm and 700mm.
13. 76% of mapped sheet and rill erosion features within the database have a total annual rainfall of between 400mm and 700mm.
14. 88% of mapped stream erosion features within the database have a total annual rainfall of between 400 and 700mm.
15. 43% of mapped landslides within the database have a total annual rainfall of between 700 and 1000mm and 49% have a total annual rainfall of between 1000mm and 2000mm.

CCMA Landslide and Erosion Database. July 2005
43
16. The total area (km2) affected by gully and tunnel erosion within the Golden Plains Shire (6.3 km2) is greater than the total area affected in all other municipalities within the CCMA combined.
17. The Golden Plains Shire has the greatest area affected (km2) by sheet and rill erosion (7.4 km2) of any municipality within the CCMA area.
6.0 Further Work The erosion and landslide research and database development will continue during 2005 as follows:
• Soil degradation data collected from Landcare groups throughout the CCMA will be added to the existing Landslide and Erosion Database.
• Further comparisons of the Landslide and Erosion Database against regional environmental data sets will be undertaken.
• Work will be undertaken in an attempt to determine Rates of Erosion for specific areas within the CCMA.
• Work will be undertaken to improve the Erosion Susceptibility models for areas within the CCMA.
• The final version of the CCMA Landslide and Erosion Database from this project will be completed by December 2005.

CCMA Landslide and Erosion Database. July 2005
44
References Nicholson C. 1993. The Woady Yaloak River Catchment Action Plan. Department of Agriculture. McVeigh J A. 2001. A landslide database for Southwest Victoria. BApp.Sci.(Hons) thesis (unpublished). Geology Department, University of Ballarat. Dahlhaus P.G. 2003. Landslides and erosion, Background information for the development of the Corangamite Soil Health Strategy. Consultant report. Dahlhaus Environmental Geology Pty Ltd. Clarkson T. 2003. Draft Corangamite Soil Health Strategy 2003. Corangamite Catchment Management Authority. McDonald R.C. 1990. Australian Soil and Land Survey 2nd Ed. Inkata Press. Robinson N., Rees D., Reynard K., MacEwan R., Dahlhaus P., Imhof M., Boyle G., & Baxter N. 2003. A land resource assessment of the Corangamite region. Primary Industries Research Victoria. Bendigo. Stockfeld G. 1992. An area plan for the control of land degradation in the Woady Yaloak catchment. Grad.Dip. Land Rehab. (unpublished). Dept. Biological & Chemical Sciences, Ballarat University College. Morgan R.P.C. 1986. Soil Erosion and Conservation. Longman Scientific and Technical. New York. Toy T.J. Foster G.R. Renard K.G. 2002. Soil Erosion: Processes, Prediction, Measurement and Control. John Wiley & Sons. New York.

CCMA Landslide and Erosion Database. July 2005
45
Appendices
Appendix A Database field definitions The fields included in the Landslide and Erosion Database consist of: Poly_Id an alpha – numeric unique identifier. The Poly_Id consists of two
initials of the person entering the data into the database eg: WF01, WF02, etc.
Centroid_X X coordinate of the centre of the Mapinfo object in WGS84 Zone
54 Centroid_Y Y coordinate of the centre of the Mapinfo object in WGS84 Zone
54 Confidence the overall level of confidence in the interpretation of the feature,
indicated by the values: ‘certain’ or ‘uncertain’ A particular feature may have one or more of the following types of degradation; features do not have to be limited to one particular type of degradation. Gully indicating whether gully erosion and/or tunnel erosion is
present, ‘certain’ or ‘uncertain’ Sheet indicating whether sheet (inter-rill) erosion and/or rill
erosion is present, ‘certain’ or ‘uncertain’ Mass_wasting indicating whether any various forms of mass wasting are
present, ‘certain’ or ‘uncertain’ Stream_erosion indicating whether forms of stream erosion are present,
‘certain’ or ‘uncertain’ Other a miscellaneous field covering various other types of
exposed terrain bare of vegetation and other forms of soil degradation, ‘certain or ‘uncertain’. This may include: landfill sites, exploration, mining & quarrying activities, abandoned mining sites, exposed roadsides, agricultural activities, recreational activities, construction activity, Acid Sulphate Soils, water logging, salinity sites, coastal degradation and contaminated soil sites

CCMA Landslide and Erosion Database. July 2005
46
Date_captured the date the feature was first entered into a database, the database in question does not necessarily have to be the erosion and landslide database
Map_method the method of data recording, eg: aerial photo
interpretation, field checked, field mapped Date_aerial_photo the date of the aerial photos from which the feature was
initially captured Date_mapped the date of mapping/recording of feature, not when the
feature was first entered into the database Mapped_by the name of the person who mapped the data (may be
different to the person entering the data into the database Data_source the original source of the data, such as student projects,
honours thesis, geological survey reports consultant reports, etc
Comment any general information that may be of relevance

CCMA Landslide and Erosion Database July 2005
Appendix BLandslide and Erosion features by Priority Waterway and Landscape Zone
SI_Reach_ID Waterway Waterway_ID Basin_ID Landscape_Zone "Gully Count" "Sheet Count" "Stream Count" "Mass Wasting Count"9 ? 35/2-68 35 CURDIES 2
10 ? 35/2-68 35 CURDIES22 ? 35/11-62 35 GELLIBRAND27 Aire River 35/32 35 AIRE28 Aire River 35/32 35 AIRE 256 Aire River (Upper) 35/2 35 AIRE30 Barham River (East Br) 35/47 35 OTWAY COAST 2 653 Barham River (West Branch 35/47-6 35 OTWAY COAST 620 Barongarook Creek 34/25 34 STONY RISES 1
1 Barwon River 33/1 33 BELLARINE2 Barwon River 33/1 33 MID BARWON 3 22 Barwon River 33/1 BELLARINE3 Barwon River 33/1 33 MID BARWON 5 64 Barwon River 33/1 33 MID BARWON 4 15 Barwon River 33/1 33 UPPER BARWON 2 56 Barwon River 33/1 33 UPPER BARWON 8
27 Barwon River East Br 33/1-84 33 UPPER BARWON28 Barwon River East Br 33/1/84 33 UPPER BARWON 1 1
7 Barwon River Upper 33/1 33 UPPER BARWON8 Black Glen Creek 35/2-40-7 35 CURDIES 3
33 Boundary Creek 33/1-83 33 UPPER BARWON 69 Bruce Creek 33/1-41 33 MID BARWON 2
49 Carisbrook Creek 35/65 35 OTWAY COAST21 Carisle Creek 35/11-48 35 GELLIBRAND 319 Chapple Creek 35/11-34 35 GELLIBRAND
5 Corriemungle Creek 35/2-40 35 CURDIES 57 Corriemungle Creek 35/2-40 35 CURDIES 3
32 Cumberland River 35/79 35 OTWAY COAST1 Curdies River 35/2 35 CURDIES2 Curdies River 35/2 35 CURDIES 13 Curdies River 35/2 35 CURDIES 144 Curdies River 35/2 35 CURDIES
19 Dean Creek 34/24 34 STONY RISES 1 3 125 Dewing Creek 33/1-84-1 33 UPPER BARWON 226 Dewing Creek 33/1-84-1 33 UPPER BARWON41 Distillery Creek 35/92-4 35 THOMPSONS38 Dunneed Creek 35/113-10 35 THOMPSONS 454 Elliot River 35/43 35 AIRE33 Erskine River 35/82 35 OTWAY COAST 1 126 Ford River 35/32-3 35 AIRE 712 Gellibrand River 35/11 35 GELLIBRAND 113 Gellibrand River 35/11 35 GELLIBRAND 1 114 Gellibrand River 35/11 35 GELLIBRAND 615 Gellibrand River 35/11 35 GELLIBRAND 616 Gellibrand River 35/11 35 GELLIBRAND 916 Gnarkeet Chain of Ponds 34/4 34 LISMORE 248 Grey River 35/69 35 OTWAY COAST15 Hovell Creek 32/6 32 HOVELLS16 Hovell Creek 32/6 32 HOVELLS 1 6 647 Kennett River 35/70 35 OTWAY COAST
5 Kuruc-a-ruc Creek 34/1-8 34 WOADY YALOAK 2 26 Kuruc-a-ruc Creek 34/1-8 34 WOADY YALOAK 3 37 Kuruc-a-ruc Creek 34/1-8 34 WOADY YALOAK 2 1
14 Lal Lal Creek 32/1-66 32 MOORABOOL23 Lardner Ck (&West Br) 35/11-80 35 GELLIBRAND 311 Leigh River 33/1-49 33 LEIGH 212 Leigh River 33/1-49 33 LEIGH 1 929 Little Aire Creek 35/32-11 35 AIRE 111 Little Woady Yaloak Ck 34/1-19 34 WOADY YALOAK 3 210 Little Woady Yaloak Creek 34/1-19 34 WOADY YALOAK 28 22 324 Love / Porcupine Ck 35/11-78 35 GELLIBRAND 125 Love / Porcupine Ck 35/11-78 35 GELLIBRAND 334 Marshy Ck/ Anglesea River 35/102 35 THOMPSONS39 Merrijig Creek 35/113-11 35 THOMPSONS29 Mia Mia Creek 33/39 33 MURDEDUKE 530 Mia Mia Creek 33/39 33 MURDEDUKE 543 Moggs Creek 35/90 35 THOMPSONS
1 Moorabool River 32/1 32 MOORABOOL 3 82 Moorabool River 32/1 32 MOORABOOL 1 13 Moorabool River 32/1 32 MOORABOOL 14 Moorabool River 32/1 32 MOORABOOL
10 Moorabool River East Br 32/1-54 32 MOORABOOL 2 111 Moorabool River East Br 32/1-54 32 MOORABOOL12 Moorabool River East Br 32/1-54 32 MOORABOOL13 Moorabool River East Br 32/1-54 32 MOORABOOL
6 Moorabool River West Br 32/1 32 MOORABOOL5 Morrabool River West Br 32/1 32 MOORABOOL 2 1

CCMA Landslide and Erosion Database July 200513 Mundy Gully 34/35 34 LISMORE 114 Mundy Gully 34/35 34 LISMORE 618 Murree Ck 35/11-33 35 GELLIBRAND17 Murree Creek 35/11-33 35 GELLIBRAND 1
9 Naringhil Creek 34/1-18 34 WOADY YALOAK 2 410 Native Hut Creek 33/1-44 33 MID BARWON 1 9 442 Painkalac Creek 35/92 35 THOMPSONS55 Parker River 35/33 35 AIRE23 Penny Royal Creek 33/1-76 33 UPPER BARWON 1 124 Penny Royal Creek 33/1-76 33 UPPER BARWON 117 Pirron Yallock Creek 34/11 34 STONY RISES11 Port Cambell Creek 35/6 35 CURDIES 221 Retreat Creek 33/1-72 33 UPPER BARWON 1 1 2 322 Retreat Creek 33/1-72 33 UPPER BARWON15 Salt Creek 34/36 34 LISMORE 1 240 Salt Creek 35/102-5 35 THOMPSONS20 Sandy Creek 35/11-44 35 GELLIBRAND
6 Scotts Creek 35/2-40-9 35 CURDIES 720 Scrubby Creek 33/1-67 33 UPPER BARWON 5 6 5 351 Skenes Creek 35/53 35 OTWAY COAST 350 Smythes Creek 35/59 35 OTWAY COAST 5
8 Spring Ck/ Ferrers Ck 34/1-8-5 34 WOADY YALOAK 535 Spring Creek 35/111 35 THOMPSONS18 Spring Gully 34/12 34 STONY RISES44 St George River 35/81 35 OTWAY COAST 145 St George River (Upper) 35/81 35 OTWAY COAST31 Stoney Creek 35/37 35 OTWAY COAST 1
7 Sutherland Creek 32/1-11 32 MOORABOOL 4 29 Sutherland Creek East Br 32/1-11-7 32 MOORABOOL 6 8 7 18 Sutherland Creek West Br 32/1-11 32 MOORABOOL 2 1 1
36 Thompson Creek 35/113 35 THOMPSONS 1 1737 Thompson Creek 35/113 35 THOMPSONS 1 3 2 112 Trib of Woady 34/1-46 34 WOADY YALOAK18 Warrambine Creek 33/1-53 33 MURDEDUKE19 Warrambine Creek 33/1-53 33 MURDEDUKE
8 Waurn Ponds Creek 33/1-12 33 BELLARINE 1 1 2 252 Wild Dog Creek 35/50 35 OTWAY COAST 2516 Williamson Creek 33/1-49-42 33 LEIGH 4 4 217 Winter Creek 33/1-49-83 33 LEIGH
1 Woady Yaloak River 34/1 34 WOADY YALOAK2 Woady Yaloak River 34/1 34 WOADY YALOAK 2 23 Woady Yaloak River 34/1 34 WOADY YALOAK 3 24 Woady Yaloak River 34/1 34 WOADY YALOAK 12 11 1
13 Woodbourne Creek 33/1-49-26 33 LEIGH 8 8 446 Wye River 35/73 35 OTWAY COAST 1114 Yarrowee River 33/1-49 33 LEIGH 215 Yarrowee River 33/1-49 33 LEIGH


![Effects of Soil and Rock Mineralogy on Soil Erosion Features in … · 2013. 12. 24. · piping, landslide and gully erosion [4-6]. Vermiculite is one of the common soil minerals](https://static.documents.pub/doc/80x56/5fd4592f2eb2797bbc1a2b72/effects-of-soil-and-rock-mineralogy-on-soil-erosion-features-in-2013-12-24.jpg)


