69


CPB Discussion Paper
No 161
November, 2010
Measuring and interpreting trends in the division
of labour in the Netherlands
I. Semih Akçomak, Lex Borghans, Bas ter Weel
The responsibility for the contents of this CPB Discussion Paper remains with the author(s)

2
CPB Netherlands Bureau for Economic Policy Analysis
Van Stolkweg 14
P.O. Box 80510
2508 GM The Hague, the Netherlands
Telephone +31 70 338 33 80
Telefax +31 70 338 33 50
Internet www.cpb.nl
ISBN 978-90-5833-479-4

3
Abstract in English
This paper introduces indicators about the division of labour to measure and interpret recent
trends in employment in the Netherlands. We show that changes in the division of labour occur
at three different levels: the level of the individual worker, the level of the industry and the
spatial level. At each level, the current organisation of work is determined by an equilibrium of
forces that glue tasks together and unbundled tasks. Communication costs are the main force for
clustering or gluing together tasks; comparative advantage stimulates unbundling and
specialisation. Our results show that on average the Netherlands has witnessed unbundling in
the period 1996-2005. So, on average the advantages of specialisation have increased. These
developments can explain to a considerable extent changes in the structure of employment.
Especially at the spatial level, our approach explains a substantial part of the increase in
offshoring during this period.
Key words: Division of labour, unbundling, offshoring
JEL code: F2, J24, J31
Abstract in Dutch
Als gevolg van globalisering neemt wereldwijd de concurrentie toe. Dit gaat gepaard met
veranderingen op de arbeidsmarkt; recentelijk vooral met veranderingen in de verdeling van
taken. In dit onderzoek laten we op basis van een aantal indicatoren trends zien in de
Nederlandse werkgelegenheid in de periode 1996-2005. We laten zien dat veranderingen in de
manier waarop taken worden verdeeld op drie verschillende niveaus plaatsvinden: tussen
werknemers, tussen sectoren en tussen landen/productielocaties. Op ieder niveau wordt de
verdeling van taken bepaald door een evenwicht van krachten die taken aan elkaar vastplakken
en krachten die ze proberen los te weken. Communicatiekosten zijn de belangrijkste kracht om
taken vast te plakken, terwijl relatieve voordelen de belangrijkste kracht zijn om te
specialiseren. Onze bevindingen laten zien dat de gemiddelde Nederlandse werknemer zich is
gaan specialiseren en minder taken is gaan uitvoeren. Het werk is meer opgeknipt in kleine
stukjes en werknemers zijn gemiddeld meer gaan communiceren in hun werk. Deze
ontwikkelingen kunnen een deel van de veranderingen in de structuur van de werkgelegenheid
in Nederland verklaren, zowel tussen beroepen als tussen sectoren. Ook op het ruimtelijke
niveau zijn we met dit raamwerk in staat een deel van de trend richting uitbesteding van werk
naar het buitenland te verklaren.
Steekwoorden: Verdeling van taken, uitbesteden van werk

4

Measuring and interpreting trends in the division of labour in the Netherlands*
Đ. Semih Akçomak
CPB Netherlands Bureau for Economic Policy Analysis and Maastricht University
Lex Borghans
Maastricht University
Bas ter Weel
CPB Netherlands Bureau for Economic Policy Analysis and Maastricht University
Abstract
This paper introduces indicators about the division of labour to measure and interpret recent
trends in employment in the Netherlands. We show that changes in the division of labour
occur at three different levels: the level of the individual worker, the level of the industry and
the spatial level. At each level the current organisation of work is determined by an
equilibrium of forces that glue tasks together and unbundled tasks. Communication costs are
the main force for clustering or gluing together tasks; comparative advantage stimulates
unbundling and specialisation. Our results show that on average the Netherlands has
witnessed unbundling in the period 1996-2005. So, on average the advantages of
specialisation have increased. These developments can explain to a considerable extent
changes in the structure of employment. Especially at the spatial level our approach explains a
substantial part of the increase in offshoring during this period.
* Richard Baldwin, Luis Garicano, George Gelauff, Edward Glaeser, Suzanne Kok, Arjan Lejour and Anna
Salomons gave very useful feedback on an earlier version of this research. Seminar audiences at the CPB, IZA in
Bonn, the NSI seminar at Maastricht University, the NL2040 workshop at the Ministry of Finance in the
Netherlands, the T.A.S.K.S. Workshop at IAB in Nuremberg, the University of Groningen and ZEW are
acknowledged for helpful suggestions. Akçomak acknowledges support from the Network Social Innovation
(NSI) of Maastricht University.
2
1. Introduction
The division of labour has changed over the past fifteen years. Revolutionary progress in
information and communication technologies (ICT) has enabled a break-up of the production
process, which has had implications for the structure of employment (e.g., Bresnahan, 1999,
Autor et al., 2006, Blinder, 2006 and Baldwin, 2010). ICT has changed the way individual
tasks can be carried out and it has created new possibilities for communication between
workers. ICT has also substantially lowered coordination costs (e.g., Varian, 2010). Since
firms take advantage of these new opportunities by organising the production process
differently, this has changed the task composition of occupations across workers (e.g.,
Borghans and Ter Weel, 2006). The same development also created new opportunities to
outsource substantial parts of the production to other firms. This changes the organisation of
work across industries as well (e.g., Bloom et al., 2009). Finally, production increasingly
takes place in global supply chains in which the tasks required to manufacture goods and
services are performed in several locations all over the world. This changes the composition
of occupations across countries as well (e.g., Antràs et al., 2006). These rapid and complex to
comprehend developments have triggered concerns that in the end more and more tasks
currently performed by Dutch workers can and most likely will be carried out abroad. This
modern way of organising work demands a framework for analysing what the consequences
are for labour-market outcomes.
The aim of this paper is to document trends in the division of labour in the Netherlands
in the most recent period and to shed light on what type of tasks are most likely to be affected
by these new technological possibilities to organise production differently. We introduce a set
of empirical indicators to measure the possibilities and benefits of separating tasks at the
worker, industry and spatial level. These indicators are based on a theoretical framework that
defines economic activities as a set of tasks. There are forces stimulating bundling of tasks
across occupations, industries and space and forces stimulating the separation of tasks across
these three dimensions. We relate these indicators to changes in employment across
occupations in the Netherlands to investigate to what extent changes in the optimal division of
labour can account for recent employment trends in the Dutch labour market.
Our approach builds on the notion that occupations are bundles of tasks. The
organisation of these tasks is determined by different forces. It depends on the trade-off
between coordination and production costs whether tasks are separated into different
occupations or not. When coordination becomes easier it might be beneficial to separate tasks
into different occupations. When tasks can be separated from occupations, they could also be
3
leaving the firm (be outsourced). Whether or not this happens depends on the make-or-buy
trade-off. Carrying out tasks in-house has a coordination advantage, whereas outsourcing
tasks could have a cost advantage. Finally, if tasks leave the firm they could also leave the
country (be offshored). Whether or not this happens depends on proximity vs. cost
advantages. In our framework we introduce indicators to measure these forces of bundling
and unbundling of tasks. We introduce measures of connectivity and comparative advantage
at the level of the worker, industry and across space. Differences in how tasks are connected
determine to what extent tasks belong together and differences in task prices in the labour
market measure comparative advantage and show to what extent there is a potential for
separating tasks from each other.
Measuring what has been going on in terms of the changes in how work is organised is
important to understand employment changes. There has been a lot of speculation about the
effects of offshoring on employment in Western economies and the subject has been on the
international policy agenda for a while now. But, so far, there is hardly any framework
suitable for examining some of the basic mechanisms and facts. Recent work by Antràs et al.
(2006), Grossman and Rossi-Hansberg (2008) and Baldwin and Robert-Nicoud (2010)
provides models to think about the labour-market effects of offshoring, but these models are
not easily brought to the data. In addition, the literature has been hampered by the difficulty of
finding good proxies for the division of labour at different levels of aggregation and
offshoring. Indeed, to measure the effect of offshoring on employment we require a model of
differences in offshoring costs across tasks. Our framework and empirical work is among the
first attempts to do so.1
In our empirical work we focus on the Netherlands in the period 1996-2005. This is a
period of rapid change in terms of ICT diffusion. The Internet and modern communication
technologies have affected coordination costs especially in this period. In addition, the Dutch
economy is a small open economy that should go with the worldwide trends of economic and
technological developments to remain competitive (e.g., Ter Weel et al., 2010). Finally, there
is no previous work on how recent developments in technology and trade have affected
employment in the Netherlands.2 Earlier work by Borghans and Ter Weel (2006) presents
1 A recent paper by Criscuolo and Garicano (2010) utilises a measure of offshorability by investigating the legal
licensing requirements to execute some tasks. Legal requirements are a burden to offshore tasks that would have
been offshored otherwise. Their findings suggest that jobs that are “stuck” at home benefit from
complementarities with the offshored inputs. 2 CPB (2008) presents a sound analysis of wage inequality in the Netherlands relative to the United States in the
period 1979-2005 but does not address the underlying changes in the division of labour. Earlier work on wage
inequality in the Netherlands, summarised in Ter Weel (2003), looks at earlier periods and focuses mainly on

4
estimates of the division of labour in Dutch firms, but does not look at the individual and
spatial dimensions. The only recent estimate for the effects of offshoring on Dutch
employment is one from Goos et al. (2009). They present evidence of polarisation in the
labour market in terms of employment in a number of OECD countries, including the
Netherlands. However, their analysis neither addresses the division of labour nor is it able to
present a picture at a sufficiently detailed level to understand the underlying mechanisms of
changes in the structure of employment.
Our main findings are that the Netherlands has indeed witnessed a period of
unbundling of tasks in the past decade. We are able to identify specific tasks and occupations
that have been most vulnerable to these developments. Possibilities for unbundling at the
individual level are to a large extent comparable to such possibilities at the industry level.
These trends are able to explain a large part of the changes in the structure of employment
over this period and especially the development at the spatial level can account for the trend
in offshoring of activities
An important policy conclusion is that although unbundling at the individual and
industrial level is not favourable for the employment of relatively low-educated workers, the
employment risks for this group are not larger than for others. The reason for this is that the
link between the tasks performed by relatively low-skilled workers and local demand are
stronger than for tasks carried out by higher skilled workers. Thinking in terms of clusters of
activities provides an interesting tool for policy makers to reduce the vulnerability to
offshoring of regions in the Netherlands.
Our work is related to the research focussing on explaining changes in the structure of
employment and wage inequality (see Acemoglu and Autor, 2010, for an overview of this
literature). Particularly the recent body of work by Autor et al. (2006), Goos and Manning
(2007), Goos et al. (2009), Criscuolo and Garicano (2010) and Firpo et al. (2009) shows that
certain types of occupations seem to be disappearing in terms of employment and/or seem to
be paying lower wages over time. The latter paper shows that offshoring and technological
change account for about half of the changes in the US wage distribution between the early
1980s and 2002. Second, from a firm’s organisational perspective Osterman (1994), Caroli
and Van Reenen (2001) and Bresnahan et al. (2002) suggest both independent and
complementary effects of organisational change and computer technology adoption on the
institutional factors in explaining differences in wages across groups in the Dutch labour market. Gorter et al.
(2005) analyse the effects of offshoring for the Dutch economy. They do however not pay attention to
employment.

5
demand for labour in Britain, France and the United States. These studies focus on
decentralisation of authority within firms. The changes in the assignment of workers to tasks
we focus on are related to papers by Borghans and Ter Weel (2004, 2006), Autor et al. (2003),
Garicano and Rossi-Hansberg (2006), Spitz-Oener (2006) and Green (2009). Third, trade
economists have began to recognise that most trade is in intermediate products. Feenstra and
Hanson (1996, 1999) show that outsourcing has contributed to an increase in the relative
demand for skilled workers in the United States. The fragmentation of production into
intermediate products suggests that changing the internal composition of sectoral production
is a potential channel through which trade affects the demand for labour. However, this
literature neglects the division of labour. Trade economists have recently begun to study how
technology has facilitated the breaking up of occupations into tasks and how falling costs of
offshoring affect factor prices. Most prominently the theoretical work by Grossman and
Rossi-Hansberg (2008) combines the work by labour economists on the importance of tasks
and the work by trade economists on the breaking up of the supply chain to study the effects
on wages. They point to the role of improvements in communication and transportation
technology in explaining the unbundling of the production process.3 As technologies improve,
it becomes more beneficial to fragment the production process to take advantage of cross-
country differences in the cost of performing the tasks, or producing the (intermediate) goods.
Empirically, Crino’s (2010) estimates suggest that service offshoring from the United States
has led to increases in high-skilled US service occupations since the late 1990s.
This paper proceeds as follows. The next section presents the theoretical background
of the paper. Section 3 explains how we constructed the database for the empirical analysis. In
Section 4 we present the empirical strategy and compose the several measures used in the
empirical analysis. Section 5 and 6 present the results. In Section 7 we discuss the
implications and conclusions.
2. The division of labour
Discussions about the division of labour enter the economics literature via Adam Smith’
Wealth of Nations in which he puts forward the example of the pin factory that benefits from
specialisation. It became practical in Henry Ford’s production model of the T-Ford and was
criticised by Charlie Chaplin in the movie Modern Times. Essentially the idea of the division
3 Ellison et al. (2010) examine decisions of firms to co-locate to explain co-agglomeration patterns in the United
States. Proximity of consumers, thick labour markets, face-to-face interactions to exchange ideas and natural
advantages all play a role in the firm’s decision making. It turns out that input-output linkages are still important
in US manufacturing.

6
of labour and the gains from specialisation was already present in Plato’s piece The Republic
in which he argues: “Quantity and quality are more easily produced when a man specialises
appropriately on a single job for which he is naturally fitted, and neglects all others.”
2.1. Modern times
Originally Adam Smith related the division of labour to the extent of the market. Now, more
than two centuries later, when markets have become very large, we know that many people
within one market perform the same tasks without further specialisation (e.g., Baumgardner,
1988).
Smith already noticed that communication costs are crucial in determining the division
of labour, although the word communication still referred to transport at that time: “Were
there no other communication between those two places, therefore, but by land-carriage, as no
goods could be transported from the one to the other, except such whose price was very
considerable in proportion to their weight, they could carry on but a small part of that
commerce which at present subsists between them, and consequently could give but a small
part of that encouragement which they at present mutually afford to each other’s industry.”
(Smith, 1776). Since the time of Smith transport costs have fallen substantially, leading to the
notion of a global village. However, it did not lead to a degree of specialisation far beyond
what people have been expecting, because more subtle communication costs have led to new
limitations to specialisation.
Since the 1990s, the division of labour has been heavily influenced by the
computerisation of work. The adoption and rapid diffusion of the bundle of new information
and communication technologies has been the most radical technological change of the last
century, and its development will continue for a number of decades to come. The ICT
revolution has caused the costs of many kinds of interactions to drop by making a great many
processes operate more efficiently, and it has allowed for the opportunity to engage in new
interactions that have become cost effective.
ICT has therefore affected the division of labour. At first, revolutionary technologies
are implemented in a rather mechanical way to make it less costly to produce the same level
of output. Over time, a revolutionary technology changes and amends to do new things, such
as to change the way in which markets are functioning and structured, demand and supply are
brought together, or to restructure the way in which a firm is organised and influence the way
in which innovation activities are pursued. Is it only computers that matter for the division of
labour of today? No, but as Bresnahan (1999) shows in an overview study, the “computer” as

7
a general purpose technology has had by far the greatest impact on the way we work; and will
continue to do so in coming decades, because its diffusion is far from complete. Also, Varian
(2010) presents several important ways in which ICT has lowered coordination costs.
For Smith, time reduction in communication costs as a result of the introduction of
communication by water-carriage increased the incentives for specialisation. Obviously,
production costs have since then decreased so much compared to communication costs that
now a decline in much more subtle communication between workers in the same workplace,
already makes a difference. For example, a Boeing 787 Dreamliner is presently produced by
43 firms in 135 locations all over the world. From Boeing’s headquarters in Chicago 70
percent of all tasks are offshored, a way of producing an airplane that was infeasible before
the 1990s. This modern way of production demands a framework of analysing tasks.
2.2. Framework
The theoretical notions and empirical observations need an analytical framework to be able to
structure what is going on. In general, working activities are not carried out in isolation, but
the output of some tasks is the input of others, with the end product being consumed by
consumers. For physical production this means that products have to be transported from one
producer to the other or to the consumer. One the one hand, carrying out related physical
activities next to each other saves on transport costs. On the other hand, different locations all
over the world could have costs advantages in the production of specific intermediate inputs.
Beyond physical distribution, production requires coordination, consultation, and planning.
Here too proximity reduces communication costs, although having different workers at
specific locations might have cost advantages. The way work is organised and the resulting
division of labour depend on these economic forces.
The modern economic stance on the division of labour is that computer technology
affects the classical trade-off between the productivity advantages of specialisation and
communication costs, as studied by Baumgardner (1988), Becker and Murphy (1992), Radner
(1993) and Bolton and Dewatripont (1994). Without denying the potential for innovation that
can be associated with the computer revolution, when the trade-off between the benefits of
specialisation and the costs of communication determines the division of labour, it is hard to
imagine that computer technology did not affect the division of labour. Yet, both increased
productivity within specific tasks and increased efficiency of communication will affect the
benefits of specialisation and communication costs. This process occurs at different levels: the
worker, the industry and the region.

8
Thinking about two tasks that are needed for the production of one type of output, the
decision at each level is whether to bundle these tasks (in a person, a company or a region) or
to carry out the two tasks separately (by different persons, in different companies and in
different regions).
When production of both tasks is combined in one unit, communication costs will be
saved. The larger the costs of communication in case two tasks are carried out separately, the
more connected these tasks are. The cost of combining tasks is that no advantage can be taken
of comparative advantages of specific units of production. For example, at the individual
level, a task that can be carried out equally well by two different types of workers would be
allocated most optimally to the worker with the lowest wage, or if two workers have the same
wage level one could be more productive in one activity while the other specialises in the
other activity. The same potential to benefit from comparative advantages applies to the
regional level.
These two aspects of the division of labour play a role at three levels of analyses: the
worker (individual) level, the firm/industry level, and the spatial (geographical) level. The
left-hand side of Figure 1 provides three pictures of the framework we have in mind. The
column in the middle defines the trade-offs between connectivity and price differentials at the
three different levels. The right-hand side of Figure 1 will be discussed in Section 4.
At the worker level connectivity means to what extent there are coordination costs
involved when two related tasks are carried out by more than one person. If one worker
carries out a set of tasks he is automatically aware of the specificities of each task, knows all
the details and is aware about the progress of each of the tasks he has to carry out. Assigning
these tasks to different workers might require coordination but could increase productivity
due to specialisation. Comparative advantage refers to the wage/productivity differential
between workers with different skills. Separating tasks makes it possible to benefit from wage
or productivity differentials since the optimal skill level might be different for each task. The
classical example is the manager with his secretary. For the firm a secretary is cheaper than
the manager and can take over a lot of work. But, to make this team work the two need to
coordinate substantially. The profitability of separating tasks or keeping them together into
one occupation depends on the balance of task connectivity and comparative advantage.
Technological change might affect the connectivity of tasks, while developments in the wage
structure might affect the relevant comparative advantage. Borghans and Ter Weel (2006)
show that technologies that improve productivity in a specific task will lead to generalisation
since in relative terms coordination costs increase. Technology that facilitates communication
9
will lead to specialisation.
A similar trade-off can be distinguished at the firm level. A firm can buy goods and
services in the market or can produce these goods and services in-house. Acquiring these
goods and services at the market makes it possible to gain from the productivity and scale
advantages of specialised firms. Search and contracting on the other hand lead to coordination
costs. It is the balance between make or buy that determines whether tasks are carried our in-
house or not. Tasks for which it is not beneficial to separate them at the individual level will
also not be separated from the firm. The unbundling at the individual level is therefore a
conditio sina qua non for this firm level unbundling.
At the third level, the spatial level, it is distance that constitutes coordination costs. For
physical goods it is obvious that distance matters, but also for services it might be important
that workers, although possibly working in different firms, can meet each other. There is a
strong tendency for economic activities to cluster. Workers in these regions might benefit
from contacts with other workers both formally and informally (e.g., Gaspar and Glaeser,
1998).4 This proximity effect is counterbalanced by the possible cost advantage of offshoring
activities to low-wage countries. It depends on the balance between proximity and cost
advantages whether or not work will be offshored. At the geographical level also the distance
to the customer comes into play. For products with high transportation costs proximity to the
client is crucial. Goods that can easily be transported and services that can be carried out at
the different location are more easily offshored.
For each combination of tasks needed for the production of a specific good or service
the trade-off between connectivity and comparative advantage determines whether they are
bundled (in one person, one firm, or one region) or not. What we actually observe in the data
are bundles of tasks. Some of these combinations will be close to the threshold of being
changed: A marginal decrease in connectivity or a marginal reduction in comparative
advantage could lead to an unbundling of these tasks. With a general trend towards
unbundling (e.g., Baldwin, 2010), it will be particularly these tasks that actually become
unbundled. That is why we investigate in our empirical analyses whether indicators of
connectivity and comparative advantage at each level predict tasks becoming less important in
an occupation, industry or region. In addition, if some tasks have the potential of being taken
out of the bundle of a worker, industry or region, it can be expected that fewer workers are
4 Gaspar and Glaeser (1998) report a complementary relationship between ICT and face-to face interactions in
the 1970s and 1980s in the US. Venables (2001) shows that this relationship is particularly present in production
processes involving skilled activities; low-skilled work is moving to cheaper places (the standardised nature of
the work implies that it hardly benefits from face-to-face interactions).

10
needed to carry out the work. This yields our second type of analysis, which investigates
whether indicators of connectivity and comparative advantage predict a decline or rise in
employment. Finally, as unbundled work might be offshored, we investigate whether
unbundling at the different levels is related to indicators of outsourcing.
Of course, a general trend of unbundling of tasks does not necessarily apply to each
combination of tasks or to each occupation. Our approach of documenting this development
will show which occupations fit into this general pattern, but will also reveal the occupations
that do not fit into this picture.
3. Data
We use several data sources to construct our indicators for connectivity and comparative
advantage and the relevant outcome variables. Here we present the most salient details of how
we compose the database. The interested reader can find additional and more detailed
information in the Data Appendix at the end.
We use three main data sources, which are well-known and often used in Dutch labour
market research. First, we use the Dutch Labour Force Survey (Enquête Beroeps Bevolking
(EBB)) from 1996 to 2005 to gather information on employment by occupation and other
relevant personal characteristics of individual Dutch workers. It also contains spatial
information about where workers reside. Each wave of the EBB contains about 85,000
observations. Since the EBB does not include wage information, we merge the EBB to
administrative wage data in the Sociaal Statistisch Bestand (SSB) and the Dutch Socio-
Economic Panel (SEP). The wage data are appended to the EBB based on occupational
classifications. For each occupational code we obtain a corresponding wage for each year in
between 1996 and 2005.
Second, we lack information about work tasks in the Netherlands. Only for Germany
(e.g., Spitz-Oener, 2006), the United States (e.g., Autor et al., 2003) and Britain (e.g., Green
et al., 2007) task data are available. The main advantage of the British data is that it contains
uniformly measured information about the importance of job tasks, whereas the German task
data only contain information about whether the task or a bundle of tasks is present in an
occupation. The US Dictionary of Occupational Titles (DOT) uses different scales for
different tasks and requirements. Since these measures are expert ratings, they do not change
over time. For our analysis of connectivity and comparative advantage, having information
about the importance of job tasks is crucial. The data for Britain are also the most detailed in
terms of the number of job tasks and especially designed to address questions about the
11
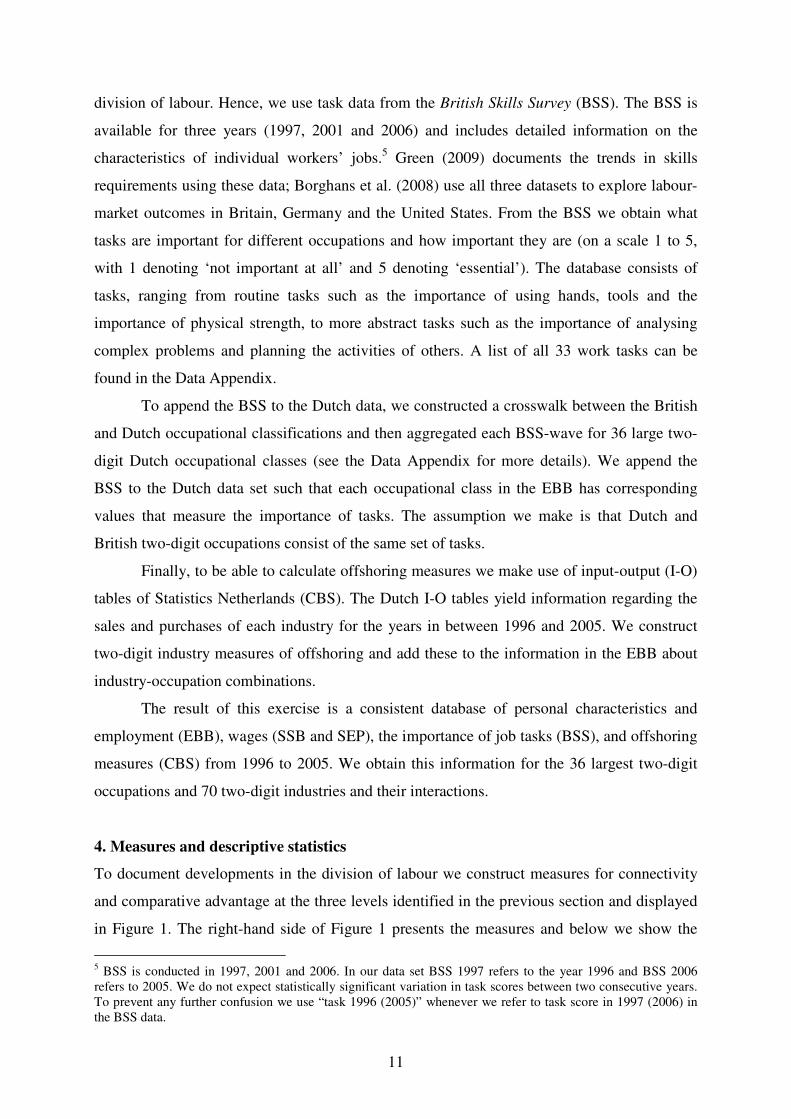
division of labour. Hence, we use task data from the British Skills Survey (BSS). The BSS is
available for three years (1997, 2001 and 2006) and includes detailed information on the
characteristics of individual workers’ jobs.5 Green (2009) documents the trends in skills
requirements using these data; Borghans et al. (2008) use all three datasets to explore labour-
market outcomes in Britain, Germany and the United States. From the BSS we obtain what
tasks are important for different occupations and how important they are (on a scale 1 to 5,
with 1 denoting ‘not important at all’ and 5 denoting ‘essential’). The database consists of
tasks, ranging from routine tasks such as the importance of using hands, tools and the
importance of physical strength, to more abstract tasks such as the importance of analysing
complex problems and planning the activities of others. A list of all 33 work tasks can be
found in the Data Appendix.
To append the BSS to the Dutch data, we constructed a crosswalk between the British
and Dutch occupational classifications and then aggregated each BSS-wave for 36 large two-
digit Dutch occupational classes (see the Data Appendix for more details). We append the
BSS to the Dutch data set such that each occupational class in the EBB has corresponding
values that measure the importance of tasks. The assumption we make is that Dutch and
British two-digit occupations consist of the same set of tasks.
Finally, to be able to calculate offshoring measures we make use of input-output (I-O)
tables of Statistics Netherlands (CBS). The Dutch I-O tables yield information regarding the
sales and purchases of each industry for the years in between 1996 and 2005. We construct
two-digit industry measures of offshoring and add these to the information in the EBB about
industry-occupation combinations.
The result of this exercise is a consistent database of personal characteristics and
employment (EBB), wages (SSB and SEP), the importance of job tasks (BSS), and offshoring
measures (CBS) from 1996 to 2005. We obtain this information for the 36 largest two-digit
occupations and 70 two-digit industries and their interactions.
4. Measures and descriptive statistics
To document developments in the division of labour we construct measures for connectivity
and comparative advantage at the three levels identified in the previous section and displayed
in Figure 1. The right-hand side of Figure 1 presents the measures and below we show the
5 BSS is conducted in 1997, 2001 and 2006. In our data set BSS 1997 refers to the year 1996 and BSS 2006
refers to 2005. We do not expect statistically significant variation in task scores between two consecutive years.
To prevent any further confusion we use “task 1996 (2005)” whenever we refer to task score in 1997 (2006) in
the BSS data.

12
equations. The Data Appendix at the end of the paper provides a more detailed overview of
the measures developed below.
4.1. Workers
To measure and analyse the division of labour at the level of the worker we construct two
measures: the task-occupation wage differential (to measure the potential for separating tasks
by computing the differences in labour-market prices between particular tasks relative to the
occupation they are in) and the task-occupation connectivity (to measure the extent to which
tasks belong together).
The absolute difference between the occupation wage and the task wage determines
the potential productivity advantage from unbundling tasks. The higher the difference
between the occupation and task wage, the higher this advantage can be. We calculate the
task-occupation wage differential (ijtowd ) as the absolute difference between the occupation
and task wage:
ij i jtowd w w= − , (1)
where i
w is the occupation wage and jw is the task wage. The index i indexes 36 occupations
and j indexes 33 task measures.6 The occupation wage
iw is observed in the data and the task
wage jw is constructed by taking the weighted average wage for each task weighting
occupations by the importance of the task concerned. Higher values of ijtowd mean a larger
discrepancy between the task and the occupation wage, suggesting that based on labour-
market prices the specific task belongs less naturally to an occupation relative to a task with
an on average low value of ijtowd .
The second measure is task-occupation connectivity. It measures the presence of a task
if another task is part of an occupation. Task-occupation connectivity (ijtoc ) is constructed as
follows:
' 33
' '
' 1
j
ij j j i j
j
toc c m=
=
= ∑ . (2)
6 Ranging from least important to most important, we use [0, 1, 2, 3, 4] as weights to calculate task wages. We
experimented with two other weights to see whether this affects our findings. We have applied the rule [0, 1, 3,
6, 10] that puts more emphasis on more higher values of importance and [0, 0, 0, 0, 1] in which task wages are
computed taking into consideration only the most essential task in an occupation. These measures produce task
wages that display higher variance. The correlation among the three task-occupation wage differential indicators
is at least 0.98 and all correlation coefficients are significant at the 1 percent level. The alternative measures
yield qualitatively similar regression results.
13
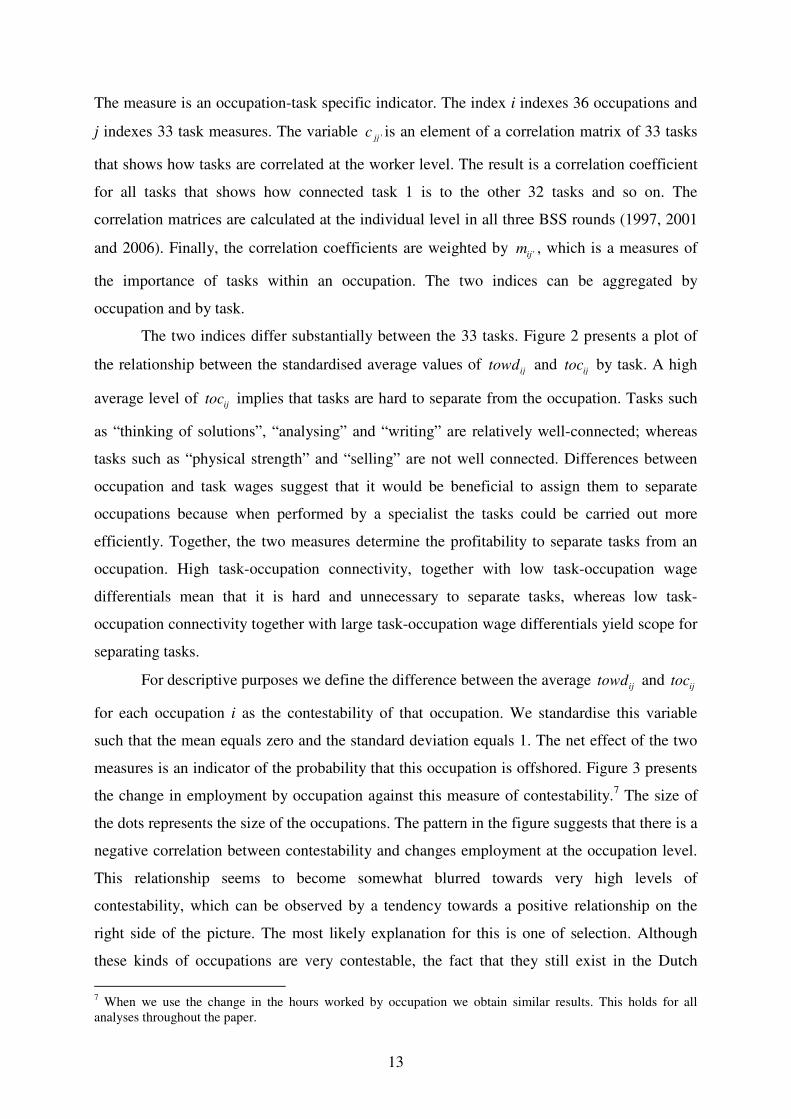
The measure is an occupation-task specific indicator. The index i indexes 36 occupations and
j indexes 33 task measures. The variable 'jjc is an element of a correlation matrix of 33 tasks
that shows how tasks are correlated at the worker level. The result is a correlation coefficient
for all tasks that shows how connected task 1 is to the other 32 tasks and so on. The
correlation matrices are calculated at the individual level in all three BSS rounds (1997, 2001
and 2006). Finally, the correlation coefficients are weighted by 'ijm , which is a measures of
the importance of tasks within an occupation. The two indices can be aggregated by
occupation and by task.
The two indices differ substantially between the 33 tasks. Figure 2 presents a plot of
the relationship between the standardised average values of ijtowd and
ijtoc by task. A high
average level of ijtoc implies that tasks are hard to separate from the occupation. Tasks such
as “thinking of solutions”, “analysing” and “writing” are relatively well-connected; whereas
tasks such as “physical strength” and “selling” are not well connected. Differences between
occupation and task wages suggest that it would be beneficial to assign them to separate
occupations because when performed by a specialist the tasks could be carried out more
efficiently. Together, the two measures determine the profitability to separate tasks from an
occupation. High task-occupation connectivity, together with low task-occupation wage
differentials mean that it is hard and unnecessary to separate tasks, whereas low task-
occupation connectivity together with large task-occupation wage differentials yield scope for
separating tasks.
For descriptive purposes we define the difference between the average ijtowd and
ijtoc
for each occupation i as the contestability of that occupation. We standardise this variable
such that the mean equals zero and the standard deviation equals 1. The net effect of the two
measures is an indicator of the probability that this occupation is offshored. Figure 3 presents
the change in employment by occupation against this measure of contestability.7 The size of
the dots represents the size of the occupations. The pattern in the figure suggests that there is a
negative correlation between contestability and changes employment at the occupation level.
This relationship seems to become somewhat blurred towards very high levels of
contestability, which can be observed by a tendency towards a positive relationship on the
right side of the picture. The most likely explanation for this is one of selection. Although
these kinds of occupations are very contestable, the fact that they still exist in the Dutch
7 When we use the change in the hours worked by occupation we obtain similar results. This holds for all
analyses throughout the paper.

14
labour market implies that some of them are still needed in the labour market for reasons not
caught by our indicators. The absolute level of employment of these occupations is very low
though (small dots), suggesting that these occupations how been under pressure already in the
past. Indeed, closer inspection shows that typical occupations in this area of Figure 3 are
elementary or low-skill occupations and low-end service occupations.
4.2. Industry
To measure trends over the last decade in the division of tasks across industries we construct a
measure of task-industry connectivity (jrtic ), where r indexes 70 industries. We assume that
there are no task-occupation wage differentials between industries (i.e., 0jrtiwd = by
definition). In practice there can be differences in the average wages of workers with the same
occupation or set of tasks in different industries. We consider these differences to reflect
productivity differentials between sectors due to the selection of workers into industries,
which are irrelevant for our analysis of the division of labour.
If it is possible to separate tasks from a worker and assign these tasks to other workers,
it is not necessarily the case that these tasks will leave the firm (or the country). Since it is not
possible to construct a database that shows tasks (and occupations) by firm for the
Netherlands, we use two-digit industry level data to carry out the analysis. The measure of
task-industry connectivity is composed as follows:
' 33
' '
' 1
j
jr jj j r
j
tic c m=
=
= ∑ , (3)
where 'jjc now measures the task correlations at the industry level. This means that in all
three BSS waves the individual level data is first aggregated to Dutch industries. The cross-
section industry level data show the importance of tasks for each industry across all three
years. These correlations are then weighted by the importance level of tasks within an
industry ('j rm ).
The measure of connectivity of tasks at the industry level (jrtic ) yields a picture of the
extent to which tasks are connected to an industry. Similar to tasks connected to occupations
(jrtoc ), we expect tasks that are relatively well-connected to industries to be less likely to be
leaving the industry. Again the indices can be aggregated by task or by industry.
Figure 4 shows a scatter plot of the average jrtic and
jrtoc by task. The points
represent the average levels of connectivity across all three waves of the data. The correlation

15
is positive and significant at the one percent level; the coefficient equals 0.912. We have
included a 45-degree line and expect all tasks to be below this line because it seems easier to
separate tasks from a worker than from an industry, i.e. reshuffling the tasks across workers is
a sine qua non for outsourcing the task elsewhere. The graph indeed suggests that tasks can be
assigned to a specific person but that it is harder to set these tasks apart from the industry. The
figure also shows heterogeneity across tasks. Tasks closer to the 45-degree line have a more
similar probability of being separated, while tasks further away are more easily separated
from the worker relative to the firm. For example, tasks such as physical strength have a more
or less equal probability of being separated from the worker and the firm, while analysing is
more easily split off a worker’s occupation relative to the firm.
4.3. Space
The final step of the analysis is space. When it is possible to separate tasks from occupations
and from industries, it does not necessarily lead to the offshoring of these tasks abroad. In the
spatial dimension there could be advantages to bundle activities, since this reduces transport
costs and makes communication between people involved in different related processes
easier. Therefore, if occupations are well-connected to other occupations across space, there
might be less scope for offshoring. In the spatial dimension also the link between production
and consumption becomes relevant. If tasks serve local demand, they are scattered around the
whole (or a large part) of the Netherlands. To measure the development of the division of
labour across space we construct two measures: spatial occupation concentration (to measure
the potential for separating occupations from others) and occupation-space connectivity (to
measure how well occupations are connected).
We measure spatial occupation concentration and occupation-space connectivity in
terms of occupations instead of tasks. The reason is that although task measures are much
more detailed and taken from a unique data source, they are still too abstract to distinguish
between regional patterns in a relatively small country such as the Netherlands. For example,
in the metal industry and the chemical industry, physical strength is an important task for
many blue-collar occupations. The metal industry is concentrated around city X, while the
chemical industry is concentrated mainly around city Y. So, in terms of the importance of
tasks we do not see much of a difference between these cities, while in terms of the
probability of offshoring there might be substantial differences. These differences will not be
picked up by an analysis of tasks.

16
The measure of spatial occupation concentration (i
soc ) is an adjusted version of
concentration index proposed by Ellison and Glaeser (1997). The spatial occupation
concentration index is calculated as follows:
17
1
v
i iv i
v
soc occ ps=
=
= −∑ . (4)
In this equation iv
occ is the occupation share of region v and i
ps its population share.8 We
use a regional classification that divides the Netherlands into 17 different regions. In the
equation the first term acts as local employment and the second term as local demand. The
difference is traded outside the region. Thus, domestically traded occupations are expected to
be internationally tradable as well (e.g., Jensen and Kletzer, 2005). A higher score on this
measure suggests that occupations are relatively concentrated. More concentration increases
the scope to transfer the activity elsewhere.
Occupation-space connectivity (i
osc ) is measured based on the distribution of
occupations. We construct an index of occupation connectivity that originates from a matrix
of correlations of the share of occupations. Each observation is a region and occupations are
variables, so that each cell contains the share of an occupation in a particular region. We
obtain a correlation matrix of the share of occupations from this database and apply the same
procedure we use to calculate task-occupation connectivity:
' 36
' '
' 1
i
i ii i
i
osc c m=
=
= ∑ , (5)
where 'iic is an element of the correlation matrix of occupations that shows the correlation of
the share of occupation i with other occupations. The correlation matrix is calculated from the
dataset that shows occupation shares for each region. These correlations are weighted by the
importance of an occupation, the overall share of occupations in total employment 'im . A
higher score on this measure indicates a higher level of occupation-space connectivity. Higher
levels suggest that it is harder to move this occupation elsewhere since it is well-connected to
other occupations.
Figure 5 shows the correlation between the measures isoc and
iosc . The dots
represent occupations and the size of the dots the size of these occupations in the Netherlands.
8 This geographic concentration index is proposed by Spieza (2003). We calculate a second index similar to
Ellison and Glaeser (1997) as the square of equation (4). However, this measure is sensitive to the level of
aggregation. At the regional level the index may under or overestimate the actual spatial occupation
concentration due to the fact that differences in occupation and population shares are squared. It is for this reason
that we use an adjusted version. The correlation between two indices is 0.81, significant at the one percent level.
17
Again the dotted lines present median values of the two variables. The interpretation of Figure
5 is similar to the interpretation of Figure 2. The difference is that we do not measure task-
occupation wage differentials but spatial-occupation concentration as a measure of separating
tasks. Indeed, the higher the level of isoc , the more contestable an occupation is likely to be.
So, again the south-east quadrant (defined by the medians of both variables) is the one we
expect to be mostly affected by offshoring: these occupations are relatively low-connected
and score high on concentration. By contrast, occupations located towards the north-west of
Figure 5 seem to be less contested at this time because they are relatively more spread over
the country and relatively well-connected geographically to other occupations. This makes it
relatively difficult to offshore such occupations.
A simple measure of contestability can be constructed similar to the one we composed
for individual workers. We now define the difference between isoc and
iosc for each
occupation i as the contestability of that occupation. We standardise this variable such that the
mean equals zero and the standard deviation equals 1. The net effect of the two measures is an
indicator of the probability that this occupation is offshored similar to the one we plotted in
Figure 3 above. Figure 6 presents the change in employment by occupation against this
measure of contestability. The size of the dots represents the size of the occupations. The
relationship between this measure of contestability and employment changes is (similar to the
relationship documented in Figure 3) negative suggesting that the more contestable
occupations have been facing the least employment growth since 1996.
4.4. Offshoring
The final measure we need to construct is a measure of offshoring. The three types of
measures developed above are able to explain the connectivity and separability of tasks and
occupations but need to be related to a direct measure of offshorability.
Feenstra and Hanson (1996) measure offshoring based on a proxy of the share of non-
energy imported intermediate goods in total non-energy intermediate inputs. The intuition for
this way of approaching offshoring is the following: part of the goods that are now offshored
have to be brought back to the sending country to be further assembled and/or made ready for
final consumption. We calculate an offshoring indicator that shows the amount of imported
inputs needed to produce one unit of output taking all embodied imports into account:
70
1
r
i r ri
r
offshoring imp c=
=
= ∑ , i=1,...,70 and r=1,...,70 (6)

18
where r
imp shows non-energy intermediate input purchases of industry r as a share of all
input purchases. The second component jr
c is an element of the Leontieff inverse matrix (I-A)-
1 that takes all direct and indirect processes to produce one unit of a product. A is a 70×70
matrix where the input-output coefficients ir
a show intermediate purchases of industry i
directly used to produce one unit of industry r output. The result, offshoring, shows embodied
imported inputs for each industry. We append this information to the individual level data
such that each person has an offshoring indicator depending on the industry of employment.
When this is aggregated across occupations we obtain an occupation specific offshoring
indicator.
Figure 7 ranks each occupation according to the exposure to offshoring in 1996. The
bars are the changes in employment and hours worked in the period 1996-2005. The pattern
that emerges is one that suggests that employment and hours worked have diminished in
occupations that are more heavily exposed to offshoring. The correlation between the
offshoring measure and the two measures of contestability shown in Figures 3 and 6 is 0.267
and 0.105, respectively. This pattern reassures us that our measure of offshoring picks up the
right phenomenon.
5. The importance of tasks
To check the empirical relevance of our indicators for the division of labour we first examine
to what extent connectivity and wage differentials at the beginning of the period of analysis
(i.e., 1996) are important for explaining changes in the importance of job tasks in the period
1996-2005 at the worker and industry level.
To investigate this we first run simple regressions with the difference in task
importance as the dependent variable and task-occupation connectivity and task-occupation
wage differentials as the main independent ones. We also add the task importance in 1996 as a
covariate to address level effects. All regression equations include task and occupation
dummies too. All indicators in these regressions have been standardised: a coefficient of one
implies that a one standard deviation change in the independent variable changes the
dependent variables by one standard deviation (variables that indicate differences are
differences of the standardised scores; not the standardised differences). We have chosen this
way of reporting because not all variables have a natural metric.
Table 1 shows the results of this exercise at the level of individual workers. Column
(1) shows the effects over the entire sample period. The estimates reveal that tasks that are
19
more connected in 1996 become more important over time. In addition, larger task-occupation
wage differentials in 1996 result in a fall in task importance within jobs over time. Borghans
and Ter Weel (2006) describe that the simultaneous development of communication and
information technologies can lead to more specialisation in certain occupations and tasks and
to generalisation in others. The pattern in the data suggests generalisation, although at the
margin tasks are unbundled pointing at specialisation. See also Bloom et al. (2009) and Ter
Weel et al. (2010) for a discussion of models of specialisation and generalisation.
Column (2) shows the results of the same analysis with only the ten least important
tasks within each occupation included; column (4) presents estimates of including the ten
most important job tasks; and the estimates in column (3) use the thirteen tasks in the middle.
The estimates reveal the same pattern suggesting that we are not picking up the effects of
changes in particularly important or unimportant tasks. The effects seem to be present across
all tasks. What is worth noticing from columns (2)-(4) in Table 1 is that the task-occupation
wage differential is more important for explaining changes in the importance the least
important tasks and not of significant importance for explaining changes in the most
important job tasks. This suggests that relatively important tasks are core to the job, whereas
relatively unimportant tasks are not core to the job. This difference in importance is revealed
in differences in their prices.
Finally, we repeat the analysis for two sub-periods, 1996-2001 and 2001-2005.
Columns (5) and (6) in Table 1 show the estimates. For the first sub-period the results lead to
similar conclusions; for the period 2001-2005 we observe that the task-occupation wage
differential does not significantly matter for explaining changes in the importance of job
tasks. The estimates suggest that in the second half of the analysed time interval only task-
occupation connectivity is important for explaining changes in the importance of job tasks.
The task-occupation wage differential seems to have its main effect in the first half of the
sample period.9
Overall this first set of results points towards a pattern of specialisation of work in the
Dutch labour market over the course of the sample period. High-connected tasks seem to gain
importance and the coefficients for task-occupation wage differentials suggest that tasks with
relatively large task-wage gaps lose importance and could be separated from the occupation.
9 There is a possibility that due to changes in task composition, the measure for task-occupation wage
differentials and task-occupation connectivity are affected. To account for this possibility we present estimates in
column (6) of Table 1 with regressors of task-occupation connectivity in 1996 and task-occupation wage
differentials in that year. The dependent variable is the change in task importance 1996-2005. We obtain similar
point estimates to the ones reported in the other columns of Table 1.
20
This effect is particularly present in the first half of the sample period and for the least
important tasks. Hence, workers seem to give up tasks that do not belong to the core of their
job, whereas core tasks (i.e., those with high levels of task-occupation connectivity and low
task-occupation wage differentials) gain importance.
A similar analysis is relevant to examine the task indicator at the industry level. In
Table 2 we present the results of a regression analysis to investigate whether our measure of
task-industry connectivity correlates with changes in the importance of tasks at this level of
analysis. We present estimates for the entire period and two sub-periods and control for the
initial level of task importance. All regressions include industry and task dummies too.
The estimates presented in column (1) of Table 2 suggest that there is a positive
correlation between task-industry connectivity and the change in the importance of tasks,
which is consistent with the findings for the occupation-task analysis. In columns (2) and (4)
we present estimates for the ten least and the ten most important tasks; column (3) presents
the estimates from the thirteen tasks in the middle. These estimates are also in line with the
ones presented in Table 1. Finally, we split the sample into two sub-periods. The estimate of
task-industry connectivity for the first period (1996-2001) presented in column (5) is positive
but insignificant, the estimate for the second period (2001-2005) is positive and significant
(column (6)). These latter two estimates suggest that the effect of connectivity on the change
in the importance of tasks at the industry level is especially present in the most recent
period.10
Overall, the estimates in Tables 1 and 2 yield a picture consistent with the framework
developed in Section 2: higher levels of connectivity are positively correlated with the
importance of the task to do the job at both levels of analysis and higher levels of task-wage
differentials are negatively correlated with core tasks suggesting that there is scope for
separating these tasks from the occupation.
6. Results
Based on the set of indicators for the division of labour we are now able to investigate to what
extent changes in the composition of employment can be explained by the process of
unbundling of tasks. We proceed in Section 6.1 with presenting simple regression results to
examine employment changes. The next section shows what fraction of the changes in
employment we are able to capture with our approach. Finally, we analyse the impact of
10
The issue of causality might be a problem here too (see footnote 9).
21
offshoring on employment in the Netherlands in the period 1996-2005.
6.1. Changes in employment
Table 3 presents the results of a simple regression analysis in which we explain changes in
employment over the period 1996-2005 by task-occupation connectivity, task-occupation
wage differentials and a number of covariates. The first column presents OLS estimates. The
estimates suggest that the more connected tasks are the higher (and more positive) the
employment change has been. For the task-occupation wage differential we find no effects. In
column (2) we present the results when adding the average level of education in an occupation
at the start of the regression period and the log of the level of employment in each occupation.
The results remain similar, although the effect of task-occupation connectivity doubles in
terms of magnitude. Now a one standard deviation change in task-occupation connectivity
increases employment by 0.153 of a standard deviation. The next two columns present the
results of a weighted least squares approach. This set of estimates points at two developments.
First, tasks that are well-connected have experienced positive employment changes. This is
consistent with the notion that the least connected tasks are more likely to be separated from a
worker’s job. Second, tasks with larger wage-differentials have experienced no significant
employment changes in the OLS regressions and correlate positively with employment
changes in the WLS setting. This suggests that although these tasks have a higher probability
to be separated from occupations, this does not necessarily imply that they lose in terms of
employment. The pattern of contestability at the task level in Figure 3 is consistent with this
observation.
The next step is to investigate the effects of connectivity of tasks at the industry-task
level on employment changes within occupations. Since we assume that there are no inter-
industry wage differentials, the variable of interest is task-industry connectivity. We run a
number of regressions to see whether there is a correlation between employment changes and
task-industry connectivity. We do so by regressing task connectivity and a number of control
variables on employment changes in the period 1996-2005. Table 4 presents the estimation
results. Similar to the results present in Table 3, task-industry connectivity contributes to
positive changes in employment in the period 1996-2005. This is both true for the OLS and
WLS regressions and for a number of different specifications.
Finally, a similar regression analysis at the spatial level confirms the pattern of
findings in Tables 3 and 4. Spatial occupation concentration is negatively correlated with
employment changes, while occupation-space connectivity relates positively to employment

22
change. Table 5 shows these regression results in two specifications. The first column
presents the results of a simple regression analysis in which we explain changes in
employment between 1996 and 2005 with spatial occupation concentration and occupation-
space connectivity and a number of usual suspects. The second column documents the
estimates when we weight by occupation size. The results of these two exercises are similar.
The fact that we do not find significant coefficients for occupation-space connectivity might
be caused by the fact that we have been able to include only 17 different regions in the
Netherlands in the analysis. The final two columns repeat the analysis without our measures
of concentration and connectivity. The explanatory power of these analyses is much lower,
while the coefficients on the covariates education and log wages in 1996 remain similar. The
effect of log employment in 1996 cannot be distinguished from zero here, while it has a small
and negative effect when including concentration and connectivity.
Together the estimates in Tables 3-5 suggest that our measures correlate with
employment changes consistent with the framework of the division of labour developed
above.
6.2. Explanatory power
We explore the economic meaning of these results by expressing the contribution of task-
occupation connectivity and task-occupation wage differentials to the changes in employment
over the last decade. The results of this exercise are documented in Figure 8. This figure
presents a scatter plot of the actual change in employment and the predicted change for each
occupation in the database. A similar picture for the industry-level analysis is presented in
Figure 9 and for the spatial level in Figure 10. We have added a 45-degree line along with a
regression line to give an impression of the average predictions of our approach. Ideally all
points would be on the 45-degree line.
The regression line in Figure 8 reveals that we overestimate the employment changes
when they are employment losses and do a good job when we predict employment growth.
This seems consistent with Figure 3 in which we plot contestability. There some jobs are
extremely contestable according to our measures, but have experienced employment growth
over the last decade. These are by and large the same occupations for which we predict
employment deterioration in Figure 8. The predicted changes in Figure 9 are relatively good.
We only understate some effects towards the high-growth occupations. The same argument
goes for our predictions at the spatial level in Figure 10.
What is interesting to note is that we are most off when jobs consist of relatively many

23
routine tasks, such as elementary occupations and low-skilled service occupations. According
to our measures these jobs could be outsourced because they do not connect very well at the
worker and industry level. However, at the spatial level we are fairly good at predicting
employment changes in these occupations. In addition, our measures do not predict changes in
public sector jobs very well. For example, the employment growth of teachers and public
sector caring and medical jobs is not very well predicted by our measures.
In the Data Appendix we provide a list of all occupations and our predictions at the
different levels of aggregation.
6.3. Offshoring
The final step of the empirical analysis is to estimate the relationship between offshoring and
spatial occupation concentration and occupation-space connectivity. Figures 11 and 12
present scatter plots of the relationship between our measures of offshoring and job
concentration and job connectivity. For spatial occupation concentration Figure 11 suggests
that job concentration is positively correlated to changes in offshoring. So, it seems to be the
case that more concentrated jobs have been more contestable since 1996. Figure 12 plots the
correlation between changes in offshoring and job connectivity. Although eyeball
econometrics would suggest a negative correlation between these two variables, the pattern is
not very clear. We expect more connected jobs to be less contestable. When we exclude two
observation (high-level economic jobs (91) and high-level legal jobs (93) the relationship is
indeed negative, and significantly so. Both figures are consistent with the evidence on the
contestability measure in Figure 6.
The patterns present in these pictures are confirmed by a regression analysis in which
we try to explain offshoring by job concentration and job connectivity and a number of
covariates. Table 6 lists the results of this regression analysis. The dependent variable is the
change in offshoring. The independent variables are job concentration, job connectivity and
the level of offshoring in 1996. When we carry out the analysis at the individual worker level
and at the industry level, we obtain insignificant estimates. This suggests that offshoring is
best explained at the spatial level of the division of labour.
7. Conclusions
The main goal of this paper has been to develop measures of division of labour and to
document and understand trends in the unbundling of tasks in the Netherlands in the period
1996-2005. We have shown that looking at current trends in the structure of employment can
24
be understood from a framework of unbundling of tasks. It is important to distinguish three
levels of aggregation at which developments take place: the individual level, the industry
level and the spatial level. An important conclusion is that globalisation not just affects all the
work, but only specific tasks and occupations that are most contestable, whereas others
remain unaffected.
The analyses in this paper show that in the period 1996-2005 there has been a
tendency of unbundling tasks in the Netherlands. When thinking about the threat of offshoring
for employment in the Netherlands, it has to be kept in mind that not every occupation and not
every task in every occupation is subject to the process of unbundling and this wave of
globalisation. Our indicators show determinants of task unbundling and potential offshoring.
They are able to document which tasks and which occupations might be contestable and
which are not. At the same time, and based on the same logic, this type of globalisation also
offers opportunities for the Netherlands to inshore tasks. That is why we also find some tasks
and occupations to be growing over time, which is a sign of comparative strength of the
Netherlands.
When looking at the kinds of tasks that are relatively easily unbundled from the task
bundle of an individual worker, our analyses reveal that especially physical tasks are not very
connected to other tasks. In general these tasks can be carried out by other workers whose
earnings are substantially lower. Some less obvious tasks seem to be contestable as well. For
example, selling, doing statistical analysis and performing calculations are tasks observed to
be relatively less connected to others tasks. For a task such as giving speeches there is a
relatively large comparative advantage that can be obtained from specialisation in this task.
Possibilities for unbundling at the individual level are the main restriction for unbundling at
the industry level. Especially for the statistical and calculation tasks, connectivity at the
industry level is higher than at the individual level. This limits the possibilities to outsource
this work to other firms, although it can easily be taken out of the bundle of tasks of the
individual worker. At the spatial level, research in math and science is the most obvious
example of work that could be easily moved to other places: There is not strong link to the
location of the customers and this work is not strongly connected to other economic activities.
Also agriculture, transport and remarkably some safety occupation fall into this category.
The analyses show that unbundling accounts for substantial changes in the
employment of occupations and accounts for – especially at the spatial level – a substantial
share of the increase in offshoring of activities abroad. While some occupations lost
employment and offshoring increased, other occupations gained employment. This indicates
25
that international developments are important for determining Dutch task bundles, and not just
that the Netherlands has lost employment. There is a restructuring of employment rather than
a loss of employment.
For individual tasks the low-educated workers are faced with this loss of employment,
while high-educated workers seem to gain. Since unbundling at the individual level and
unbundling at the industry level are highly correlated, this also holds for the industry
developments. At the spatial level the story is different though. Since the link between
production and the customer has a stronger influence on employment changes and offshoring
than job connectivity, here the low-educated gain from their position. Offshoring tasks such as
cleaning and other types of low-skilled service tasks seem to be impossible.
Overall there is no strong sign of polarisation of the Dutch labour market as observed
in the United States in the 1990s. If anything, polarisation has taken place across regions. To
strengthen the Dutch labour market, thinking in terms of the connectivity of activities at the
spatial level can be a very effective approach. In the Netherlands the Randstad region and the
region of Eindhoven have grown in the past decades. They have become the most important
centres of productivity and employment, most likely because of tendencies for certain tasks
and occupations to cluster together. An interesting challenge is to see whether also in other
regions of the country clusters of tasks are likely to emerge. Such clusters are able to reduce
the contestability of economic activities and resist the strong forces of globalisation.
In further research the indicators introduced in this paper could be further developed,
fitting them more accurate in a theoretical model of the division of labour. In this paper we
had to rely on British tasks data. The collection of data for the Dutch labour market about
employment in terms of tasks is very important to gain more insight in current and future
labour-market developments in the Netherlands.
References
Acemoglu, Daron and David H. Autor (2010), Skills, tasks and technologies: Implications for
Employment and Earnings, NBER Working Paper No. 16082.
Antràs, Pol, Luis Garicano and Esteban Rossi-Hansberg (2006), Offshoring in a knowledge
economy, Quarterly Journal of Economics, vol. 121, no. 1, pp. 31-77.
Autor, David H., Frank Levy and Richard J. Murnane (2003), The skill content of recent
technological change: An empirical exploration, Quarterly Journal of Economics, vol.
118, no. 4, pp. 1279-1333.
Autor, David H., Lawrence F. Katz and Melissa S. Kearney (2006), The polarization of the
U.S. labor market, American Economic Review, vol. 96, no. 2, pp. 189-194.
Baldwin, Richard (2010), Integration of the North American economy and new-paradigm

26
globalisation, CEPR Discussion Paper No. 7523.
Baldwin, Richard and Frederic Robert-Nicoud, (2010), Trade in goods and trade in tasks: An
integrating framework, NBER Working Paper No: 15882.
Baumgardner, James R. (1988), The division of labor, local markets, and worker organization,
Journal of Political Economy, vol. 96, no. 3, pp. 509-527.
Becker, Gary S. and Kevin M. Murphy (1992), The division of labor, coordination costs, and
knowledge, Quarterly Journal of Economics, vol. 107, no. 4, pp. 1137-1160.
Blinder, Alan S. (2006), Offshoring: The next industrial revolution, Foreign Affairs, vol. 85,
no. 2, pp. 113-128.
Bloom, Nicholas, Luis Garicano, Raffaella Sadun and John Van Reenen (2009), The distinct
effects of information technology and communication technology on firm organization,
NBER Working Paper No. 14975.
Bolton, Patrick and Mathias Dewatripoint (1994), The firm as a communication network,
Quarterly Journal of Economics, vol. 109, no. 3, pp. 809-839.
Borghans, Lex and Bas ter Weel (2004), What happens when agent T gets a computer? The
labor market impact of cost efficient computer adoption, Journal of Economic Behavior &
Organization, vol. 54, no. 2, pp. 137-151.
Borghans, Lex and Bas ter Weel (2006), The division of labour, worker organisation and
technological change, Economic Journal, vol. 116, no. 509, pp. F45-F72.
Borghans, Lex, Bas ter Weel and Bruce A. Weinberg (2008), Interpersonal styles and labor
market outcomes, Journal of Human Resources, vol. 43, no. 4, pp. 815-858
Bresnahan, Timothy F. (1999), Computerisation and wage dispersion: An analytical
reinterpretation, Economic Journal, vol. 109, no. 456, pp. F390-F415.
Bresnahan, Timothy F., Erik Brynjolfsson and Lorin Hitt (2002), Information technology,
workplace organization and the demand for skilled labor: Firm-level evidence, Quarterly
Journal of Economics, vol. 117, no. 1, pp. 339-376.
Caroli, Eve and John Van Reenen (2001), Skill biased organizational change? Evidence from
British and French establishments, Quarterly Journal of Economics, vol. 116, no. 4, pp.
1448-1492.
CPB (2008), Centraal Economisch Plan, Centraal Planbureau, The Hague.
Crino, Rosario (2010), Service offshoring and white-collar employment, Review of Economic
Studies, vol. 77, no. 2, pp. 595-632.
Criscuolo, Chiara and Luis Garicano (2010), Offshoring and wage inequality: Using
occupational licensing as a shifter of offshoring costs, American Economic Review, vol.
100, no. 2, pp. 439-443.
Ellison, Glenn and Edward L. Glaeser (1997), Geographic concentration in US manufacturing
industry: a dartboard approach, Journal of Political Economy, vol. 105, no. 5, pp. 889-
927.
Ellison, Glenn, Edward L. Glaeser and William R. Kerr (2010), What causes industry
agglomeration? Evidence from coagglomeration patterns, American Economic Review,
vol. 100, no. 3, pp. 1195-1213.
Feenstra, Robert C. and Gordon Hanson (1996), Globalization, outsourcing and wage
27
inequality, American Economic Review, vol. 86, no. 2, pp. 240-245.
Firpo, Sergio, Nicole Fortin, and Thomas Lemieux (2009), Occupational tasks and changes in
the wage structure, University of British Columbia, Working Paper.
Garicano, Luis and Esteban Rossi-Hansberg (2006), Organization and inequality in a
knowledge economy, Quarterly Journal of Economics, vol. 121, no. 4, pp. 1383-1435.
Gaspar, Jess and Edward Glaeser (1998), Information technology and the future of cities,
Journal of Urban Economics, vol. 43, no. 1, pp. 136-156.
Goos, Maarten and Alan Manning (2007), Lousy and lovely jobs: The rising polarization of
work in Britain, Review of Economics and Statistics, vol. 89, no. 1, pp. 118-133.
Goos, Maarten, Alan Manning and Anna Salomons (2009), Job polarization in Europe,
American Economic Review, vol. 99, no. 2, pp. 58-63.
Gorter, Joeri, Paul Tang and Michel Toet (2005), Verplaatsing vanuit Nederland, CPB
Document No. 76.
Green, Francis, Alan Felstead, Duncan Gallie and Ying Zhou (2007), Skills at Work, 1986-
2006, SKOPE, University of Oxford, http://www.skope.ox.ac.uk/publications/skills-work-
1986-2006.
Green, Francis (2009). Employee involvement, technology and job tasks, University of Kent,
Department of Economics, Discussion Papers in Economics No. 09/03
Grossman, Gene M. and Esteban Rossi-Hansberg (2008), Trading tasks: A simple theory of
offshoring, American Economic Review, vol. 98, no. 5, pp. 1978-1997.
Jensen, Bernard and Lori G. Kletzer (2005), Tradable services: Understanding the scope and
impact of services offshoring, Institute for International Economics Working Paper No.
05-9.
Osterman, Paul (1994), How common in workplace transformation and who adopts it?,
Industrial and Labor Relations Review, vol. 47, no. 1, pp. 173-188.
Radner, Roy (1993), The organization of decentralized information processing, Econometrica,
vol. 61, no. 5, pp. 1109-1146.
Spieza, Vincenzo (2003), Geographic concentration and territorial disparity in OECD
countries, http://www.oecd.org/dataoecd/43/1/15179757.doc accessed on 02/03/2010.
Spitz-Oener, Alexandra (2006), Technical change, job tasks and rising educational demands:
Looking outside the wage structure, Journal of Labor Economics, vol. 24, no. 2, 235-270.
Ter Weel, Bas, Albert van der Horst and George Gelauff (2010), The Netherlands of 2040,
Centraal Planbureau, The Hague.
Ter Weel, Bas (2003), The structure of wages in the Netherlands, 1986-1998, Labour, vol. 17,
no. 3, pp. 361-382.
Varian, Hall R. (2010), Computer mediated transactions, American Economic Review, vol.
100, no. 2, pp. 1-10.
Venables, Anthony J. (2001), Geography and international inequalities: The impact of new
technologies, Journal of Industry Competition and Trade, vol. 1, no. 2, pp. 135-159.

28
Figures and tables
Figure 1 - Framework
task 1
occupation
Separate?
firm
Outsource?
country
Offshore?
Trade-off Measures
• task-industry
connectivity
• Occupation-space
connectivity
• Spatial occupation
concentration
task 2 task 3 tasks…… task n
task 1 task 2 task 3 tasks…… task n
occupations
task 1 task 2 task 3 tasks…… task n
occupations
Production
• task-occupation
connectivity
• task-occupation
wage differential
Coordination
vs. production
Make vs. buy
Proximity vs.
cost advantages

29
Figure 2 - Task-occupation connectivity and task-occupation wage differentials
detailpeople
teach
cspeech
persuad
selling
caring
strengtstamina
hands
tools
product
special
orgworkfaults
cause
solutn analyse
noerrormistake
planme
planothmytime
ahead
read
short
long
write
writeshwritelg
calca
percent
stats
-3-2
-10
1
task-o
ccupation c
onnectivity
-1 0 1 2 3 4
task-occupation wage differential
Note: The dotted lines reflect median values. A detailed list of tasks in provided in the Data Appendix. The task-
occupation wage differential is defined in equation (1) and task-occupation connectivity is defined in equation
(2). The measures are standardised such that mean is 0 and variance is 1.

30
Figure 3 - Contestability of tasks and changes employment, 1996-2005
76
62
5696
51
93
75
53
33
6544
48
71
69
42
6485
66
91
73
49
4686
55
26
31
57
28
29
78
8998
24
11 37
68
0
% c
hange in e
mplo
ym
ent
1996-2
005
-2 -1 0 1 2 3
contestability
bandwidth = .8
sdf
Note: The dots refer to occupations and the size of the dots reflects the size of an occupation. The data appendix
provides a list of all occupations. Contestability is defined as the difference between the task-occupation wage
differential as defined in equation (1) and task-occupation connectivity as defined in equation (2). The measure
of contestability is normalised, see the main text for details.

31
Figure 4 - Correlation between task-occupation connectivity and task-industry connectivity
detailpeople
teachcspeech
persuad
selling
caring
strengtstamina
handstools
product
special
orgworkfaults
cause
solutn analyse
noerrormistakeplanme
planothmytime
ahead
read
shortlong
write
writeshwritelg
calca
percentstats
0.1
.2.3
.4.5
task
-occ
upat
ion
con
nect
ivit
y
0 .1 .2 .3 .4 .5
task-industry connectivity
Note: The dotted lines reflect median values. A detailed list of tasks in provided in the Data Appendix. The task-
industry connectivity is defined in equation (3) and task-occupation connectivity is defined in equation (2).
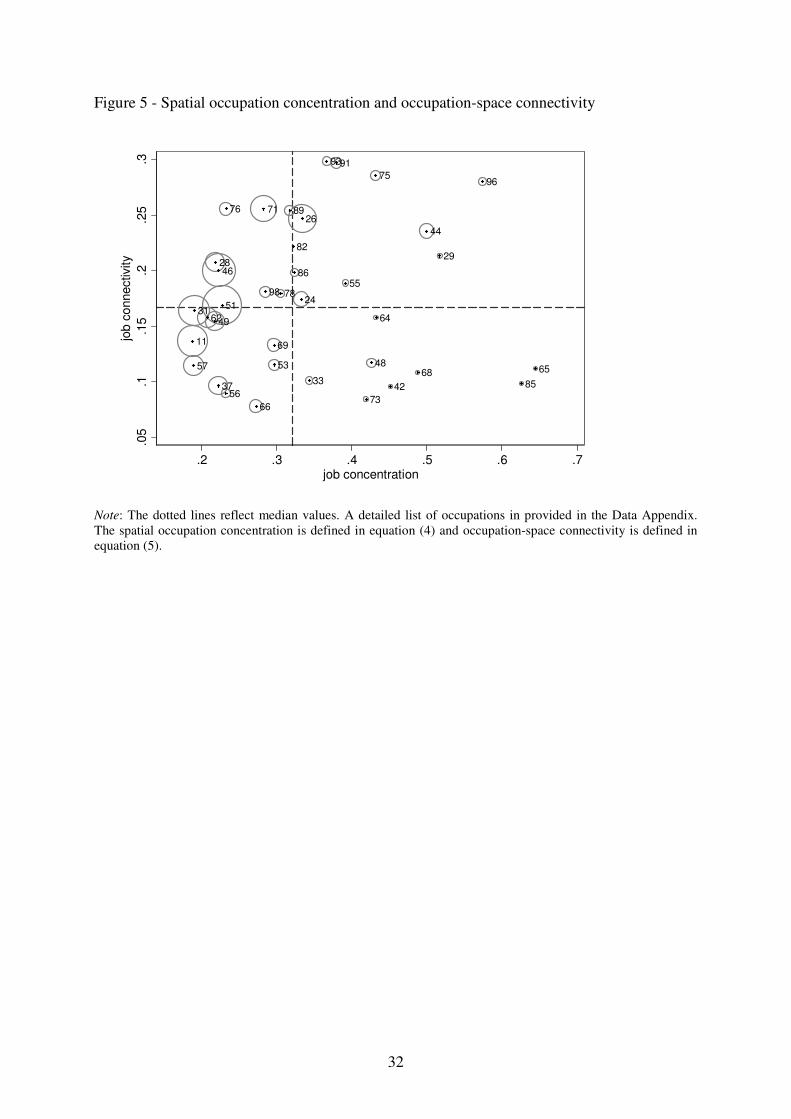
32
Figure 5 - Spatial occupation concentration and occupation-space connectivity
11
24
26
2829
31
3337 42
44
46
48
49
51
53
55
56
57
62 64
65
66
68
69
71
73
75
76
78
82
85
86
89
9193
96
98
.05
.1.1
5.2
.25
.3
job c
onnectivity
.2 .3 .4 .5 .6 .7job concentration
Note: The dotted lines reflect median values. A detailed list of occupations in provided in the Data Appendix.
The spatial occupation concentration is defined in equation (4) and occupation-space connectivity is defined in
equation (5).

33
Figure 6 - Spatial contestability and changes in employment, 1996-2005
76
93
91
71
89
75
28
26
46
31
5162
86
98
49
96
78
11
4424
55
57
29
69
37
53
56
64
6633
48
42
7368
6585
0
% c
han
ge
in e
mp
loy
men
t 1
99
6-2
005
-2 -1 0 1 2
spatial contestability
bandwidth = .8
sdf
Note: The dots refer to occupations and the size of the dots reflects the size of an occupation. The data appendix
provides a list of all occupations. Contestability is defined as the difference between the spatial occupation
concentration as defined in equation (4) and occupation-space connectivity as defined in equation (5). The
measure of contestability is normalised, see the main text for details.

34
Figure 7 - Employment change 1996-2005 ranked according to embodied imports in 1996
-2
-1.5
-1
-0.5
0
0.5
1
1.5
2
2.5
3
62 29 56 53 69 49 93 73 57 89 96 42 37 33 76 98 31 91 28 78 55 51 64 71 11 75 85 24 65 48 44 66 86 68 26 46
sta
nd
ard
ize
d v
alu
es
total hours worked employment
total work hour employment

35
Figure 8 - Employment change 1996-2005 and predicted change at the task level
24
37
28
11
26
46
29
57
55
48
31
65
49
33
44
75
51
69
53
42
64
78
6266
7368
89
98
85
86
71
5676 96
91
93
-.2
0.2
.4
actu
al c
han
ge
in e
mp
loy
men
t 1
99
6-2
00
5
-.4 -.2 0 .2 .4
predicted change in employment
bandwidth = .8
Lowess smoother

36
Figure 9 - Employment change 1996-2005 and predicted change at the industry level
4424
28
48
31
68
37
46
26
57
11
78
51
64
56
49
336689
96
71
76
29
98
69
55
65
86
85
5373
75
91
93
62
42
-.2
0.2
.4
actu
al c
han
ge
in e
mp
loy
men
t 1
99
6-2
00
5
-.3 -.2 -.1 0 .1 .2
predicted change in employment
bandwidth = .8
Lowess smoother

37
Figure 10 - Employment change 1996-2005 and predicted change at the spatial level
6585
68
42
96
73
29
48
4464
3355
66
75
53
24
69
86
78
5691
37
98
26
93
89
57
49
5162
7111
46
31
28
76
-.2
0.2
.4
actu
al c
han
ge
in e
mp
loy
men
t 1
99
6-2
00
5
-.3 -.2 -.1 0 .1 .2
predicted change in employment
bandwidth = .8
Lowess smoother

38
Figure 11 - Changes in offshoring and spatial occupation concentration, 1996-2005
1157
31
62
49
28
37
46
51
56
76
66
71
98
69
53
78
89
86
24
26
33
93
9155
73
48
75
64
42
68
44
29 96
85
65
0
% c
hange in o
ffshoring 1
996-2
005
.2 .3 .4 .5 .6 .7job concentration
bandwidth = .8
Lowess smoother

39
Figure 12 - Changes in offshoring and occupation-space connectivity, 1996-2005
66
73
56
42
37
85
33
6865
57
53
48
69
1149
6462
3151
24
78
9855
86
46
28
29
44
26
89
7176
9675
91
93
0
% c
hange in o
ffshoring 1
996-2
005
.05 .1 .15 .2 .25 .3job connectivity
bandwidth = .8
Lowess smoother

40
Figure 13 - Actual and predicted change in employment at the task level ranked according to
education in 1996
-0.4
-0.3
-0.2
-0.1
0
0.1
0.2
0.3
0.4
0.5
11 26 28 24 29 37 31 44 33 46 48 42 53 51 57 49 55 56 78 68 71 66 64 73 75 69 62 76 98 65 86 91 85 93 96 89
sta
ndard
ized v
alu
es
prediction employment
prediction employment

41
Figure 14 - Actual and predicted change in employment at the industry level ranked according
to education in 1996
-0.4
-0.3
-0.2
-0.1
0
0.1
0.2
0.3
0.4
0.5
11 26 28 24 29 37 31 44 33 46 48 42 53 51 57 49 55 56 78 68 71 66 64 73 75 69 62 76 98 65 86 91 85 93 96 89
sta
ndard
ized v
alu
es
prediction employment
prediction employment

42
Figure 15 - Actual and predicted change in employment at the spatial level ranked according
to education in 1996
-0.3
-0.2
-0.1
0
0.1
0.2
0.3
0.4
0.5
11 26 28 24 29 37 31 44 33 46 48 42 53 51 57 49 55 56 78 68 71 66 64 73 75 69 62 76 98 65 86 91 85 93 96 89sta
ndard
ized v
alu
es
prediction employment
prediction employment

43
Tab
le 1
- E
xpla
inin
g c
han
ges
in t
he
import
ance
of
job t
asks
from
tas
k-o
ccu
pat
ion c
onnec
tivit
y a
nd t
ask-o
ccup
atio
n w
age
dif
fere
nti
als
(1
)
(2)
(3)
(4)
(5)
(6)
Dep
end
ent
var
iab
le
Chan
ge
in t
ask
imp
ort
ance
19
96
-
20
05
, al
l ta
sks
Chan
ge
in t
ask
imp
ort
ance
19
96
-
20
05
, te
n l
east
imp
ort
ant
task
s
Chan
ge
in t
ask
imp
ort
ance
19
96
-
20
05
, m
idd
ling
imp
ort
ant
task
s
Chan
ge
in t
ask
imp
ort
ance
19
96
-
20
05
, te
n m
ost
imp
ort
ant
task
s
Chan
ge
in t
ask
imp
ort
ance
19
96
-
20
01
, al
l ta
sks
Chan
ge
in t
ask
imp
ort
ance
20
01
-
20
05
, al
l ta
sks
task
-occ
up
atio
n c
onnec
tiv
ity 1
99
6
3.0
48
***
2.8
21
**
2.4
07
***
1.1
06
*
2.6
85
***
(0
.485
) (0
.843
) (0
.537
) (0
.640
) (0
.434
)
-0.6
61
**
-0.7
54
**
-0.2
11
-0
.08
7
-0.7
76
**
ta
sk-o
ccup
atio
n
wage
dif
fere
nti
al
19
96
(0
.290
) (0
.221
) (0
.276
) (0
.470
) (0
.353
)
task
im
po
rtan
ce 1
99
6
-1.1
69
***
-1.3
69
***
-1.8
72
***
-1.5
29
***
-1.1
89
***
(0
.149
) (0
.154
) (0
.129
) (0
.117
) (0
.120
)
task
-occ
up
atio
n c
onnec
tiv
ity 2
00
1
2
.82
1***
(0.4
62
)
-0
.22
2
task
-occ
up
atio
n
wage
dif
fere
nti
al
20
01
(0.3
56
)
task
im
po
rtan
ce 2
00
1
-0
.70
1***
(0.1
25
)
const
ant
5.6
22
***
0.3
60
-0
.29
9
3.9
77
**
3.4
59
**
6.2
33
***
(1
.106
) (1
.446
) (0
.900
) (1
.737
) (1
.290
) (1
.043
)
Ob
serv
atio
ns
1,1
88
3
60
4
68
3
60
1
,18
8
1,1
88
R-s
quar
ed
0.5
63
0
.58
9
0.7
57
0
.78
0
0.5
87
0
.40
1
No
te:
Ro
bu
st s
tand
ard
err
ors
clu
ster
ed a
t th
e o
ccup
atio
n l
evel
in p
aren
thes
es.
*** p
<0
.01
, ** p
<0
.05
, * p
<0
.10
. T
he
dep
end
ent
var
iab
le i
s th
e d
iffe
rence
in t
ask
im
po
rtan
ce
bet
wee
n y
ear
X a
nd
yea
r Y
. A
ll v
aria
ble
s ar
e st
and
ard
ised
such t
hat
the m
ean i
s 0
and
th
e var
iance
is
1.
All
est
imat
ion
s in
clud
e ta
sk a
nd
occ
up
atio
n d
um
mie
s. C
olu
mn
s (2
),
(3)
and
(4
) re
pli
cate
the
anal
ysi
s in
co
lum
n (
1)
for
the
ten l
east
, th
e th
irte
en t
asks
in t
he
mid
dle
, an
d t
he
ten m
ost
im
po
rtan
t ta
sks
wit
hin
eac
h o
ccup
atio
n,
resp
ecti
vel
y.
Co
lum
ns
(5)
and
(6
) p
rese
nt
the
resu
lts
of
the
anal
ysi
s fo
r tw
o d
iffe
rent
sub
-per
iod
s. T
he
var
iab
le ta
sk-o
ccup
atio
n co
nnec
tivit
y is
an
in
dex
sh
ow
ing
th
e d
egre
e o
f
connec
ted
ness
am
ong
dif
fere
nt
task
s (s
ee e
quat
ion (
2)
and
the
corr
esp
ond
ing e
xp
lanat
ion).
The
dif
fere
nce
bet
wee
n t
ask
and
occ
up
atio
n w
ages
are
calc
ula
ted
as
the a
bso
lute
val
ue
of
the
wage
dif
fere
nti
al b
etw
een t
he
occ
up
atio
n a
nd
task
wage
in 1
99
9 (
see
equat
ion
(1
) w
ith t
ask w
ages
bei
ng c
alcu
late
d w
ith [
0 1
2 3
4]
as w
eights
.

44
Tab
le 2
- E
xpla
inin
g c
han
ges
in t
he
import
ance
of
job t
asks
from
tas
k-i
ndust
ry c
onn
ecti
vit
y
(1)
(2
) (3
) (4
) (5
) (6
)
Dep
end
ent
var
iab
le
Chan
ge
in t
ask
imp
ort
ance
19
96
-20
05
,
all
task
s
Chan
ge
in t
ask
imp
ort
ance
19
96
-
20
05
, te
n l
east
imp
ort
ant
task
s
Chan
ge
in t
ask
imp
ort
ance
19
96
-
20
05
, m
idd
ling
imp
ort
ant
task
s
Chan
ge
in t
ask
imp
ort
ance
19
96
-
20
05
, te
n m
ost
imp
ort
ant
task
s
Chan
ge
in t
ask
imp
ort
ance
19
96
-
20
01
, al
l ta
sks
Chan
ge
in t
ask
imp
ort
ance
20
01
-
20
05
, al
l ta
sks
task
-ind
ust
ry c
on
nec
tivit
y 1
99
6
2.2
64
***
1.7
98
***
1.2
86
***
1.7
82
***
1.3
84
(0
.349
) (0
.674
) (0
.450
) (0
.510
) (0
.953
)
task
im
po
rtan
ce 1
99
6
-1.0
50
***
-1.1
34
***
-1.6
26
***
-1.5
29
***
-0.9
10
***
(0
.095
) (0
.118
) (0
.066
) (0
.101
) (0
.095
)
task
-ind
ust
ry c
on
nec
tivit
y 2
00
1
1
.69
4***
(0.6
15
)
task
im
po
rtan
ce 2
00
1
-1
.00
0***
(0.1
17
)
const
ant
-2.3
69
***
1.2
81
***
-2.1
89
***
3.4
98
***
-1.3
12
2
.29
2*
(0
.394
) (0
.206
) (0
.267
) (1
.165
) (1
.134
) (1
.368
)
Ob
serv
atio
ns
2,2
74
6
90
8
97
6
87
2
,27
4
2,2
77
R-s
quar
ed
0.5
26
0
.57
0
0.7
16
0
.80
3
0.4
41
0
.46
2
No
te:
Ro
bu
st s
tand
ard
err
ors
clu
ster
ed a
t th
e in
dust
ry l
evel
in p
aren
thes
es.
*** p
<0
.01
, ** p
<0
.05
, * p
<0
.10
. T
he
dep
end
ent
var
iab
le i
s th
e d
iffe
rence
in t
ask i
mp
ort
ance
bet
wee
n y
ear
X a
nd
yea
r Y
. A
ll v
aria
ble
s ar
e st
and
ard
ised
such
that
the
mea
n i
s 0
and
the v
aria
nce
is
1.
All
est
imat
ions
incl
ud
e ta
sk a
nd
ind
ust
ry d
um
mie
s. C
olu
mn
s (2
), (
3)
and
(4
) re
pli
cate
the
anal
ysi
s in
co
lum
n (
1)
for
the
ten l
east
, th
e th
irte
en t
ask
s in
the
mid
dle
, an
d t
he
ten m
ost
im
po
rtan
t ta
sks
wit
hin
eac
h o
ccup
atio
n,
resp
ecti
vel
y.
Co
lum
ns
(5)
and
(6
) p
rese
nt
the
resu
lts
of
the
anal
ysi
s fo
r tw
o d
iffe
rent
sub
-per
iod
s. T
ask-i
nd
ust
ry c
onnec
tivit
y i
s an
ind
ex t
hat
sho
ws
the
deg
ree
of
connec
ted
nes
s am
on
g d
iffe
ren
t
task
s (s
ee e
quat
ion (
3)
and
the c
orr
esp
ond
ing e
xp
lanat
ion).
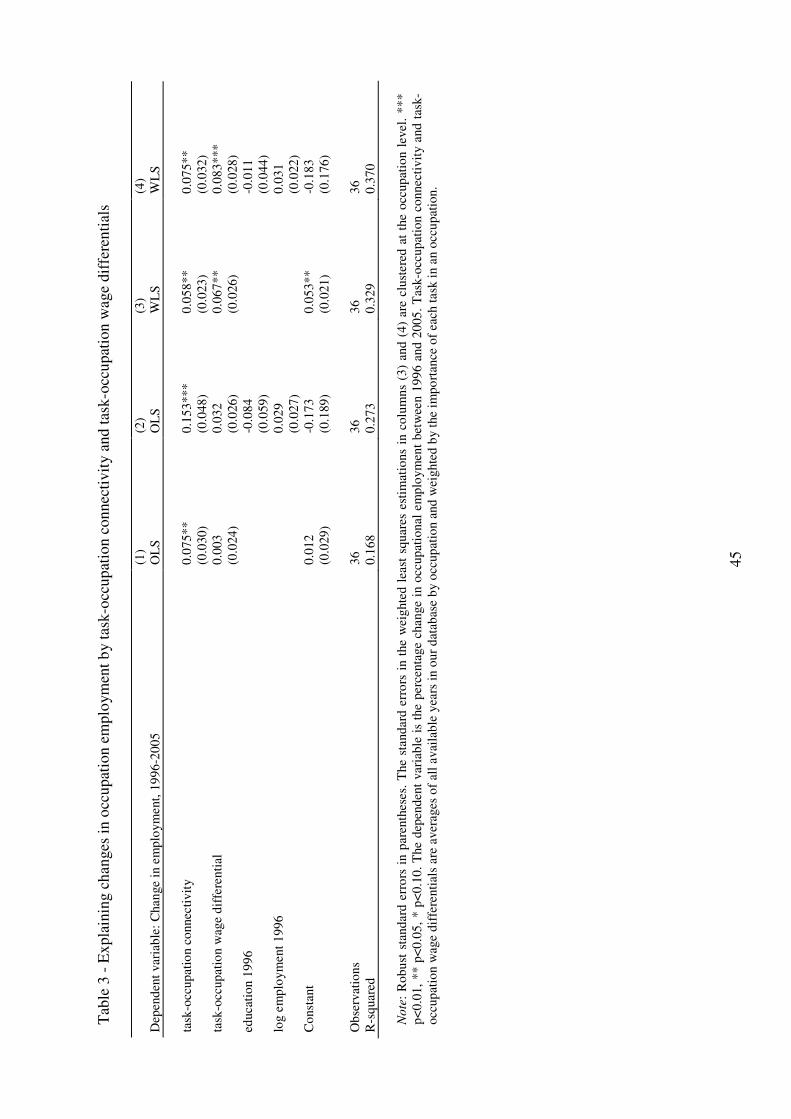
45
Tab
le 3
- E
xpla
inin
g c
han
ges
in o
ccupat
ion e
mplo
ym
ent
by t
ask-o
ccup
atio
n c
onnec
tivit
y a
nd t
ask-o
ccupat
ion w
age
dif
fere
nti
als
(1)
(2)
(3)
(4)
Dep
end
ent
var
iab
le:
Chan
ge
in e
mp
loym
ent,
19
96
-20
05
O
LS
O
LS
W
LS
W
LS
task
-occ
up
atio
n c
onnec
tiv
ity
0.0
75
**
0.1
53
***
0.0
58
**
0.0
75
**
(0
.030
) (0
.048
) (0
.023
) (0
.032
)
task
-occ
up
atio
n w
age
dif
fere
nti
al
0.0
03
0
.03
2
0.0
67
**
0.0
83
***
(0
.024
) (0
.026
) (0
.026
) (0
.028
)
educa
tio
n 1
99
6
-0
.08
4
-0
.01
1
(0.0
59
)
(0.0
44
)
log e
mp
loym
ent
19
96
0.0
29
0.0
31
(0.0
27
)
(0.0
22
)
Co
nst
ant
0.0
12
-0
.17
3
0.0
53
**
-0.1
83
(0
.029
) (0
.189
) (0
.021
) (0
.176
)
Ob
serv
atio
ns
36
3
6
36
3
6
R-s
quar
ed
0.1
68
0
.27
3
0.3
29
0
.37
0
No
te:
Ro
bu
st s
tand
ard
err
ors
in p
aren
thes
es.
The
stand
ard
err
ors
in t
he
wei
ghte
d l
east
sq
uar
es e
stim
atio
ns
in c
olu
mn
s (3
) an
d (
4)
are
clust
ered
at
the
occ
up
atio
n l
evel.
**
*
p<
0.0
1,
** p
<0
.05
, * p
<0
.10
. T
he
dep
end
ent
var
iab
le i
s th
e p
erce
nta
ge
change
in o
ccup
atio
nal
em
plo
ym
ent
bet
wee
n 1
99
6 a
nd
20
05
. T
ask-o
ccup
atio
n c
onnec
tiv
ity a
nd
tas
k-
occ
up
atio
n w
age
dif
fere
nti
als
are
aver
ages
of
all
avai
lab
le y
ears
in o
ur
dat
abas
e b
y o
ccup
atio
n a
nd
wei
ghte
d b
y t
he
imp
ort
ance
of
each
task
in a
n o
ccu
pat
ion.

46
Tab
le 4
- E
xpla
inin
g c
han
ges
in o
ccupat
ion e
mplo
ym
ent
by t
ask-i
ndust
ry c
onnec
tivit
y
(1)
(2)
(3)
(4)
Dep
end
ent
var
iab
le:
Chan
ge
in e
mp
loym
ent,
19
96
-20
05
O
LS
O
LS
W
LS
W
LS
task
-ind
ust
ry c
on
nec
tivit
y
0.0
84
***
0.1
02
***
0.0
81
***
0.0
74
**
(0
.022
) (0
.032
) (0
.021
) (0
.033
)
educa
tio
n 1
99
6
-0
.00
6
0
.01
1
(0.0
43
)
(0.0
53
)
log e
mp
loym
ent
19
96
0.0
34
0.0
03
(0.0
24
)
(0.0
19
)
const
ant
0.0
12
-0
.21
2
0.0
31
0
.01
4
(0
.028
) (0
.163
) (0
.026
) (0
.152
)
Ob
serv
atio
ns
36
3
6
36
3
6
R-s
quar
ed
0.2
08
0
.25
9
0.2
46
0
.24
8
No
te:
Ro
bu
st s
tand
ard
err
ors
in p
aren
thes
es.
The
stand
ard
err
ors
in t
he
wei
ghte
d l
east
sq
uar
es e
stim
atio
ns
in c
olu
mn
s (3
) an
d (
4)
are
clust
ered
at
the
occ
up
atio
n l
evel.
**
*
p<
0.0
1,
** p
<0
.05
, * p
<0
.10
. T
he
dep
end
ent
var
iab
le i
s th
e p
erce
nta
ge
change i
n e
mp
loym
ent
fro
m 1
99
6 t
o 2
00
5.
Tas
k-i
nd
ust
ry c
onnec
tiv
ity i
s ca
lcu
late
d b
y a
ggre
gat
ing t
he
task
-ind
ust
ry c
on
nec
tivit
y a
cro
ss o
ccup
atio
ns
and
wei
ghin
g t
he
nu
mb
ers
by t
he
ind
ust
ry e
mp
loym
ent
shar
e w
ithin
eac
h o
ccup
atio
n (
equat
ion (
3)
in t
he
mai
n t
ext)
.
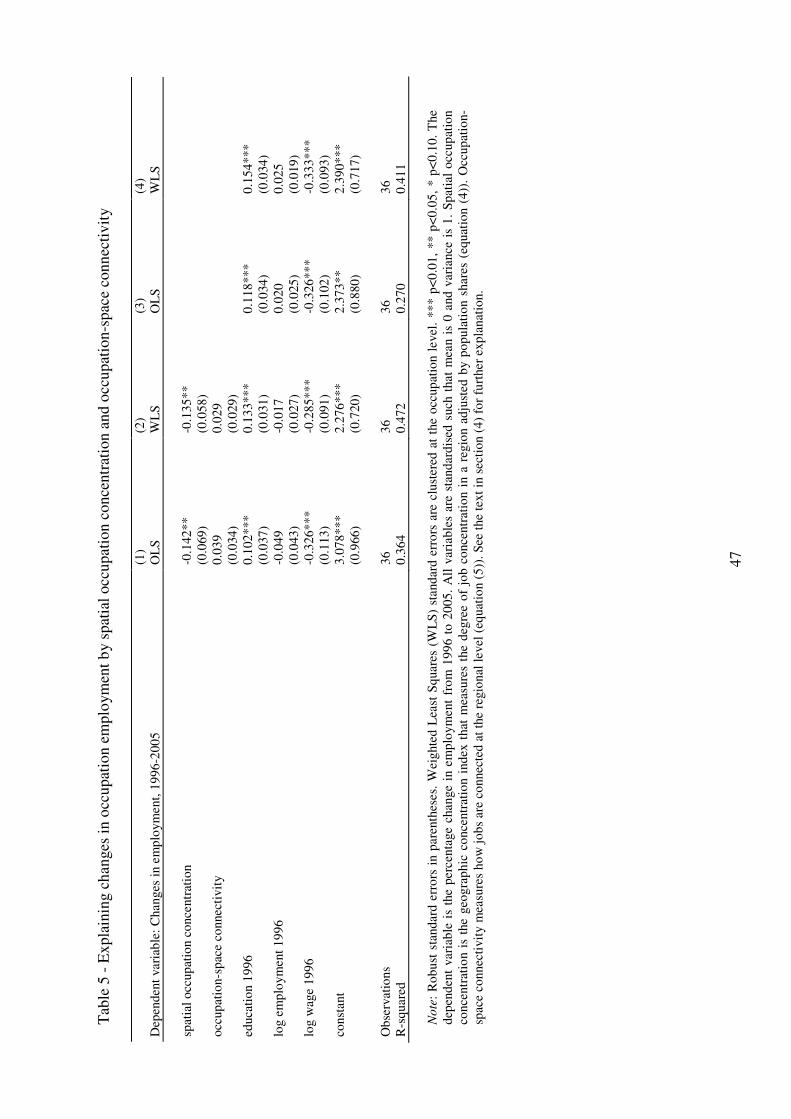
47
Tab
le 5
- E
xpla
inin
g c
han
ges
in o
ccupat
ion e
mplo
ym
ent
by s
pat
ial
occ
upat
ion c
once
ntr
atio
n a
nd o
ccupat
ion-s
pac
e co
nn
ecti
vit
y
(1)
(2)
(3
) (4
)
Dep
end
ent
var
iab
le:
Chan
ges
in e
mp
loym
ent,
19
96
-20
05
O
LS
W
LS
O
LS
W
LS
spat
ial
occ
up
atio
n c
once
ntr
atio
n
-0.1
42
**
-0.1
35
**
(0
.069
) (0
.058
)
occ
up
atio
n-s
pac
e co
nnec
tivit
y
0.0
39
0
.02
9
(0
.034
) (0
.029
)
educa
tio
n 1
99
6
0.1
02
***
0.1
33
***
0.1
18
***
0.1
54
***
(0
.037
) (0
.031
) (0
.034
) (0
.034
)
log e
mp
loym
ent
19
96
-0
.04
9
-0.0
17
0
.02
0
0.0
25
(0
.043
) (0
.027
) (0
.025
) (0
.019
)
log w
age
19
96
-0
.32
6***
-0.2
85
***
-0.3
26
***
-0.3
33
***
(0
.113
) (0
.091
) (0
.102
) (0
.093
)
const
ant
3.0
78
***
2.2
76
***
2.3
73
**
2.3
90
***
(0
.966
) (0
.720
) (0
.880
) (0
.717
)
Ob
serv
atio
ns
36
3
6
36
3
6
R-s
quar
ed
0.3
64
0
.47
2
0.2
70
0
.41
1
No
te:
Ro
bu
st s
tand
ard
err
ors
in p
aren
thes
es.
Wei
ghte
d L
east
Sq
uar
es (
WL
S)
stand
ard
err
ors
are
clu
ster
ed a
t th
e o
ccup
atio
n l
evel
. **
* p
<0
.01
, ** p
<0
.05
, * p
<0
.10
. T
he
dep
end
ent
var
iab
le i
s th
e p
ercen
tage c
han
ge
in e
mp
loym
ent
fro
m 1
99
6 t
o 2
005
. A
ll v
aria
ble
s ar
e st
and
ard
ised
such
that
mea
n i
s 0
and
var
iance
is
1.
Sp
atia
l o
ccup
atio
n
conce
ntr
atio
n i
s th
e geo
gra
ph
ic c
once
ntr
atio
n i
nd
ex t
hat
mea
sure
s th
e d
egre
e o
f jo
b c
once
ntr
atio
n i
n a
reg
ion a
dju
sted
by p
op
ula
tio
n s
har
es (
equat
ion (
4))
. O
ccup
atio
n-
spac
e co
nnec
tivit
y m
easu
res
ho
w j
ob
s ar
e co
nnec
ted
at
the
regio
nal
level
(eq
uat
ion (
5))
. S
ee t
he
text
in s
ecti
on (
4)
for
furt
her
exp
lanat
ion.
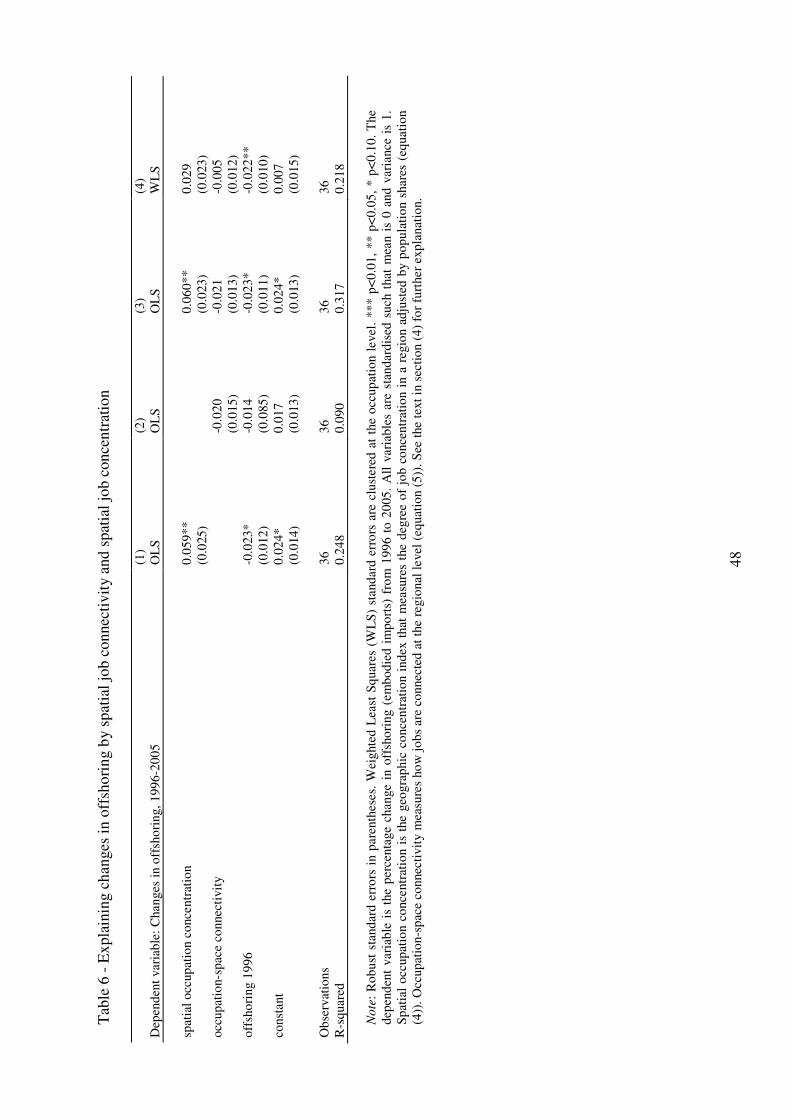
48
Tab
le 6
- E
xpla
inin
g c
han
ges
in o
ffsh
ori
ng b
y s
pat
ial
job c
onnec
tivit
y a
nd s
pat
ial
job c
once
ntr
atio
n
(1)
(2)
(3
) (4
)
Dep
end
ent
var
iab
le:
Chan
ges
in o
ffsh
ori
ng,
19
96
-20
05
O
LS
O
LS
O
LS
W
LS
spat
ial
occ
up
atio
n c
once
ntr
atio
n
0.0
59
**
0
.06
0**
0.0
29
(0
.025
)
(0.0
23
) (0
.023
)
occ
up
atio
n-s
pac
e co
nnec
tivit
y
-0
.02
0
-0.0
21
-0
.00
5
(0.0
15
) (0
.013
) (0
.012
)
off
sho
ring 1
99
6
-0.0
23
*
-0.0
14
-0
.02
3*
-0.0
22
**
(0
.012
) (0
.085
) (0
.011
) (0
.010
)
const
ant
0.0
24
*
0.0
17
0
.02
4*
0.0
07
(0
.014
) (0
.013
) (0
.013
) (0
.015
)
Ob
serv
atio
ns
36
3
6
36
3
6
R-s
quar
ed
0.2
48
0
.09
0
0.3
17
0
.21
8
No
te:
Ro
bu
st s
tand
ard
err
ors
in p
aren
thes
es.
Wei
ghte
d L
east
Sq
uar
es (
WL
S)
stand
ard
err
ors
are
clu
ster
ed a
t th
e o
ccup
atio
n l
evel
. **
* p
<0
.01
, ** p
<0
.05
, * p
<0
.10
. T
he
dep
end
ent
var
iab
le i
s th
e p
erce
nta
ge c
han
ge
in o
ffsh
ori
ng (
em
bo
die
d i
mp
ort
s) f
rom
19
96
to
20
05
. A
ll v
aria
ble
s ar
e st
and
ard
ised
such t
hat
mea
n i
s 0
and
var
iance
is
1.
Sp
atia
l o
ccup
atio
n c
once
ntr
atio
n i
s th
e geo
gra
ph
ic c
once
ntr
atio
n i
nd
ex t
hat
mea
sure
s th
e d
egre
e o
f jo
b c
once
ntr
atio
n i
n a
reg
ion a
dju
sted
by p
op
ula
tio
n s
har
es (
equati
on
(4))
. O
ccup
atio
n-s
pac
e co
nnec
tivit
y m
easu
res
ho
w j
ob
s ar
e co
nnec
ted
at
the
regio
nal
level
(eq
uat
ion (
5))
. S
ee t
he
text
in s
ecti
on (
4)
for
furt
her
exp
lanat
ion.

49
Data Appendix
A.1. Variable definitions
Variable Definition
worker
task 1996-2005 Difference in task importance between BSS 1997 and BSS 2006 (Occupation-task specific). Source:
BSS and EBB.
task 1996-2001 Difference in task importance between BSS 1997 and BSS 2001 (Occupation-task specific). Source:
BSS and EBB.
task 2001-2005 Difference in task importance between BSS 2001 and BSS 2006 (Occupation-task specific). Source:
BSS and EBB.
task importance 1996 (2001) Occupation-task specific task importance within an occupation class for 1996 (2001). Source: British
Skills Survey (BSS) 1997 (2001).
task-occupation
connectivity 1996 (2001)
Occupation task specific index that measures the connectedness of a task to other tasks in 1996
(2001). See equation (2). Source BSS and EBB.
task-occupation
wage differential 1996 (2001)
Absolute value of the difference between occupation and task wages in 1996 (2001). The earliest
wage information that is available for Dutch occupation classes is for 1999. Therefore 1999 wages are
used. Task wages are calculated by multiplying the wage by task importance (weight is [0 1 2 3 4]
from least important to most important) at the individual level and then calculating averages by Dutch
occupation classes. See equation (1) and the corresponding explanation. Source: EBB, SSB and BSS.
contestability contestability measuring offshorability calculated as task-occupation wage differential minus task-
occupation connectivity. Source: BSS.
task-occupation
connectivity
Occupation specific measure obtained by weighting task-occupation connectivity by task importance
and aggregating over occupations. Average of three years 1996, 2001 and 2005. Source: BSS
task-occupation
wage differential
Occupation specific measure obtained by weighting the task-occupation specific wage differential by
task importance and aggregating over occupations. Average of three available years 1996, 2001 and
2005. Source BSS
industry
task-industry connectivity
1996 (2001)
Industry-task specific index that measures the connectedness of a task to other tasks in 1996 (2001).
See equation (3). Source BSS 1997, 2001, 2006 and EBB.
task-industry
connectivity
Occupation specific measure obtained by aggregating the task-industry specific connectivity over
industries and merging to occupation-industry data. We aggregate task-industry connectivity over
occupations by weighting it by the share of industry employment within each occupation. The result is
an occupation specific measure. Average of three years 1996, 2001 and 2005. Source: BSS, EBB
spatial
spatial occupation concentration
(soc)
Occupation specific index measuring spatial job concentration adjusted by population share of the
region. We used RBA definition that divides the Netherlands in 17 regions. See equation (4) and the
corresponding explanation. Source: EBB 1996.
occupation-space
connectivity (osc)
Index that measures job connectivity at the regional level. We used RBA definition that divides the
Netherlands in 17 regions. See equation (5) and the corresponding explanation. Source: EBB 1996.
offshoring 1996 Level of offshoring in 1996 that shows the amount of imported inputs needed to produce one unit of
output taking all embodied imports into account. The numbers are then merged to individual level
data such that every individual in the same industry class has the same value and then aggregated over
2-digit occupations. Source. Input-Output tables of the Netherlands, CBS
change in offshoring 1996-2005 percentage change in offshoring from 1996 to 2005. Offshoring measure is calculated as above.
Source. Input-Output tables of Netherlands, CBS
other variables
education 1996 education level for each occupational class in 1996. Source EBB.
log employment 1996 log of employment for each occupational class in 1996. Source EBB.
log wage 1996 log of wage for each occupational class in 1996. Source: SSB.
change in employment,1996-2005 percentage change in employment 1996-2005. Source: EBB

50
A.2. Summary statistics
Variable Mean Std. Dev. Min Max
worker
task importance 1996 3.550 0.90 1.00 5.00
task importance 2001 3.605 0.81 1.16 5.00
task importance 2005 3.652 0.82 1.24 5.00
task 1996-2005 0.102 0.41 -1.66 2.24
task 1996-2001 0.055 0.41 -1.73 2.74
task 2001-2005 0.046 0.29 -1.17 1.11
task-occupation connectivity 1996 0.226 0.07 0.029 0.334
task-occupation connectivity 2001 0.204 0.06 0.036 0.304
task-occupation connectivity 2005 0.209 0.07 0.041 0.314
task-occupation wage differential 1996 708.99 526.23 0.34 2724.42
task-occupation wage differential 2001 830.91 651.41 1.34 3418.18
task-occupation connectivity 0.0066 0.0002 0.0060 0.0071
task-occupation wage differential 22.91 16.03 2.23 72.30
contestability 0.051 1.304 -2.11 3.12
industry
task importance 1996 3.360 0.793 1.00 5.00
task importance 2001 3.464 0.784 1.00 5.00
task importance 2005 3.536 0.742 1.00 5.00
task 1996-2005 0.176 0.493 -2.77 4.00
task 1996-2001 0.102 0.527 -4.00 4.00
task 2001-2005 0.071 0.480 -3.05 2.72
task-industry connectivity 1996 0.313 0.109 0.034 0.481
task-industry connectivity 2001 0.293 0.121 0.017 0.505
task-industry connectivity 2005 0.285 0.101 0.034 0.469
task-industry connectivity 0.299 0.004 0.287 0.305
spatial
spatial occupation concentration 0.344 0.125 0.187 0.644
occupation space connectivity 0.173 0.067 0.078 0.298
offshoring 1996 0.128 0.048 0.041 0.225
change in offshoring 1996-2005 0.015 0.080 -0.087 0.259
change in employment 1996-2005 0.008 0.184 -0.255 0.413
log employment 1996 6.60 1.26 4.35 9.00
education 1996 3.35 0.82 2.09 4.89
log wage 1996 7.64 0.33 6.99 8.19

51
A.3. List of occupations according to Dutch Occupation Classification 92
NLSBC92 code occupation
11 elementary occupations
24 agricultural (low)
26 technical (low)
28 transport (low)
29 (para)medical (low)
31 administrative, commercial, economic (low)
33 security (low)
37 care taking (low)
42 teachers (low)
44 agricultural (medium)
46 technical (medium-low)
48 transport (medium)
49 (para)medical (medium-low)
51 administrative, commercial, economic (medium-low)
53 security (medium-low)
55 linguistic, cultural (low)
56 societal, governmental (medium)
57 care taking (medium)
62 teachers (medium)
64 agricultural (high)
65 scientific (medium)
66 technical (medium-high)
68 transport (high)
69 (para)medical (medium-high)
71 administrative, commercial, economic (medium-high)
73 security (medium-high)
75 linguistic, cultural (high)
76 societal, governmental (medium-high)
78 managers (medium)
85 scientific (high)
86 technical (high)
89 (para)medical (high)
91 administrative, commercial, economic (high)
93 security (high)
96 societal, governmental (high)
98 managers (high)

52
A.4. List of task in BSS
Task Importance of task:
detail paying close attention to detail
people dealing with people
peach teaching people (individuals or groups)
speech making speeches/ presentations
persuad persuading or influencing others
selling selling a product or service
caring counselling, advising or caring for customers or clients
strength physical strength (e.g., to carry, push or pull heavy objects)
stamina physical stamina (e.g., to work for long periods on physical activities)
hands skill or accuracy in using hands/fingers (e.g., to mend or repair, assemble etc.)
tools knowledge of use or operation of tools/equipment machinery)
product knowledge of particular products or services
special specialist knowledge or understanding
orgwork knowledge of how organisation works
faults spotting problems or faults (in your own work or somebody else’s work)
cause working out cause of problems/ faults (in your own work or somebody else’s work)
solutn thinking of solutions to problems (in your own work or somebody else’s work)
analyse analysing complex problems in depth
noerror checking things to ensure no errors (in your own work or somebody else’s work)
mistake noticing when there is a mistake (in your own work or somebody else’s work)
panme planning own activities
planoth planning the activities of others
mytime organising own time
ahead thinking ahead
read reading written information (e.g., forms, notices and signs)
short reading short documents such as reports, letters or memos?
long reading long documents such as long reports, manuals, articles or books
write writing materials such as forms, notices and signs
writesh writing short documents (e.g., reports, letters or memos)
writelg writing long documents with correct spelling and grammar
calca adding, subtracting, multiplying and dividing numbers
percent calculations using decimals, percentages or fractions
stats Calculations using more advanced mathematical or statistical procedures
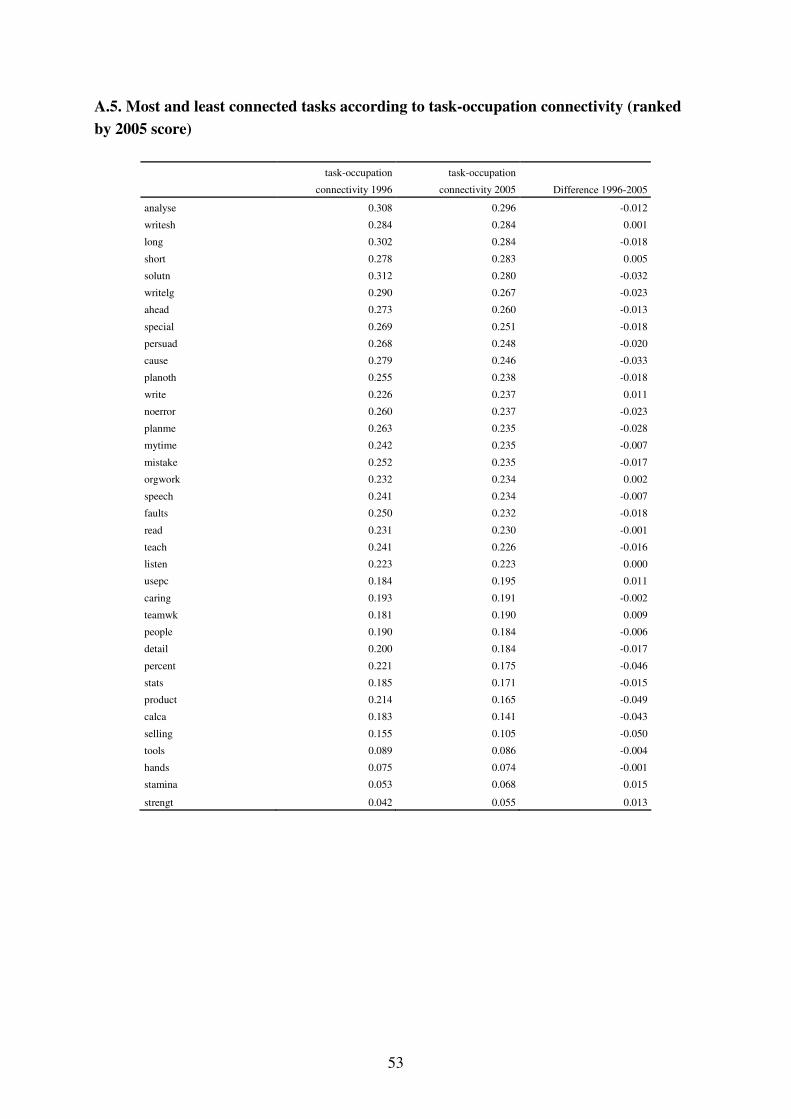
53
A.5. Most and least connected tasks according to task-occupation connectivity (ranked
by 2005 score)
task-occupation
connectivity 1996
task-occupation
connectivity 2005 Difference 1996-2005
analyse 0.308 0.296 -0.012
writesh 0.284 0.284 0.001
long 0.302 0.284 -0.018
short 0.278 0.283 0.005
solutn 0.312 0.280 -0.032
writelg 0.290 0.267 -0.023
ahead 0.273 0.260 -0.013
special 0.269 0.251 -0.018
persuad 0.268 0.248 -0.020
cause 0.279 0.246 -0.033
planoth 0.255 0.238 -0.018
write 0.226 0.237 0.011
noerror 0.260 0.237 -0.023
planme 0.263 0.235 -0.028
mytime 0.242 0.235 -0.007
mistake 0.252 0.235 -0.017
orgwork 0.232 0.234 0.002
speech 0.241 0.234 -0.007
faults 0.250 0.232 -0.018
read 0.231 0.230 -0.001
teach 0.241 0.226 -0.016
listen 0.223 0.223 0.000
usepc 0.184 0.195 0.011
caring 0.193 0.191 -0.002
teamwk 0.181 0.190 0.009
people 0.190 0.184 -0.006
detail 0.200 0.184 -0.017
percent 0.221 0.175 -0.046
stats 0.185 0.171 -0.015
product 0.214 0.165 -0.049
calca 0.183 0.141 -0.043
selling 0.155 0.105 -0.050
tools 0.089 0.086 -0.004
hands 0.075 0.074 -0.001
stamina 0.053 0.068 0.015
strengt 0.042 0.055 0.013

54
A.6. Task-occupation connectivity and task-occupation wage differential by occupation
NLSBC92
code occupation
task-occupation
connectivity 1996
task-occupation
connectivity 2005
task-occupation
wage differential
1999
11 elementary occupations 0.216 0.201 909.9
24 agricultural (low) 0.214 0.202 488.3
26 technical (low) 0.218 0.204 287.3
28 transport (low) 0.216 0.204 380.4
29 (para)medical (low) 0.218 0.206 855.8
31 administrative, commercial, economic (low) 0.225 0.207 813.7
33 security (low) 0.225 0.210 179.4
37 care taking (low) 0.215 0.201 1116.7
42 teachers (low) 0.228 0.210 463.5
44 agricultural (medium) 0.233 0.207 415.4
46 technical (medium-low) 0.219 0.204 164.4
48 transport (medium) 0.225 0.209 116.8
49 (para)medical (medium-low) 0.226 0.208 669.5
51 administrative, commercial, economic (medium-low) 0.227 0.211 146.2
53 security (medium-low) 0.226 0.213 346.7
55 linguistic, cultural (low) 0.223 0.208 381.6
56 societal, governmental (medium) 0.231 0.215 517.8
57 care taking (medium) 0.221 0.207 718.8
62 teachers (medium) 0.230 0.213 76.1
64 agricultural (high) 0.230 0.210 599.0
65 scientific (medium) 0.223 0.208 225.0
66 technical (medium-high) 0.228 0.213 813.8
68 transport (high) 0.226 0.211 2478.8
69 (para)medical (medium-high) 0.227 0.210 427.3
71 administrative, commercial, economic (medium-high) 0.231 0.214 750.6
73 security (medium-high) 0.231 0.212 945.7
75 linguistic, cultural (high) 0.228 0.210 177.1
76 societal, governmental (medium-high) 0.233 0.214 188.1
78 managers (medium) 0.228 0.210 1445.5
85 scientific (high) 0.233 0.212 1194.9
86 technical (high) 0.230 0.213 1182.3
89 (para)medical (high) 0.227 0.212 1382.6
91 administrative, commercial, economic (high) 0.233 0.216 1221.1
93 security (high) 0.234 0.218 1074.8
96 societal, governmental (high) 0.232 0.218 625.6
98 managers (high) 0.228 0.212 1743.2

55
A.7. Most and least connected tasks according to task-industry connectivity (ranked by
2005 score)
tasks
task-industry
connectivity 1996
task-industry
connectivity 2005 Difference 1996-2005
analyse 0.443 0.446 0.004
special 0.428 0.427 -0.001
short 0.434 0.419 -0.015
long 0.346 0.414 0.068
solutn 0.451 0.391 -0.060
writesh 0.413 0.361 -0.052
persuad 0.397 0.358 -0.039
ahead 0.357 0.357 0.001
write 0.385 0.348 -0.037
percent 0.385 0.341 -0.044
orgwork 0.305 0.336 0.031
speech 0.414 0.335 -0.080
mytime 0.246 0.328 0.081
cause 0.353 0.325 -0.028
noerror 0.339 0.319 -0.019
teach 0.372 0.319 -0.053
stats 0.375 0.289 -0.086
planme 0.326 0.282 -0.044
faults 0.280 0.281 0.001
people 0.274 0.280 0.007
mistake 0.360 0.279 -0.081
calca 0.344 0.279 -0.065
read 0.345 0.276 -0.069
caring 0.193 0.245 0.052
writelg 0.370 0.236 -0.134
planoth 0.325 0.234 -0.091
detail 0.329 0.233 -0.095
product 0.265 0.229 -0.037
selling 0.089 0.137 0.049
tools 0.139 0.101 -0.038
hands 0.128 0.083 -0.045
strengt 0.066 0.067 0.000
stamina 0.065 0.059 -0.005

56
A.8. Task-industry connectivity by industry
EBB Industry
code industry
task-industry connectivity
1996
task-industry connectivity
2005
1 Agriculture and fishery 0.301 0.277
2 Mining and Quarrying 0.315 0.289
3 Manufacturing food products 0.309 0.278
4 Manufacture of textiles 0.309 0.277
5 Manufacturing of wearing apparel 0.308 0.284
6 Manufacture of leather and footwear 0.292 0.275
7 Manufacture of wood 0.303 0.279
8 Manufacture of paper 0.312 0.281
9 Publishing 0.313 0.293
10 Extraction and agglomeration of peat 0.313 0.282
11 Extraction of crude petroleum and gas 0.319 0.289
12 Manufacture, chemicals/ chemical product 0.324 0.288
13 Manufacture, rubber/plastic products 0.304 0.280
14 Quarrying and winning of sand 0.307 0.276
15 Manufacture of basic metals 0.307 0.282
16 Manufacture,. fabricated metal products 0.314 0.283
17 Machine industry 0.312 0.284
18 Manufacturing of electrical machinery 0.316 0.288
19 Manufacturing of audio equipment 0.312 0.293
20 Manufacturing of medical equipment 0.318 0.285
21 Manufacture of motor vehicles 0.311 0.283
22 Manufacture of transport equipment 0.315 0.285
24 Manufacture of furniture 0.310 0.284
25 Energy and water supply 0.323 0.292
26 Construction 0.309 0.281
27 Building and construction 0.309 0.281
28 Building and installation 0.309 0.276
29 Sale and repair of motor vehicles 0.308 0.282
30 Wholesale agricultural products 0.313 0.283
31 Wholesale of food 0.313 0.285
32 Wholesale of intermediate goods 0.313 0.283
33 Wholesale of machines and equipment 0.313 0.291
34 Other wholesale 0.313 0.288
35 Retail sale, warehouses and supermarkets 0.307 0.279
36 Retail sale, supermarkets in foods 0.307 0.280
37 Other retail trade 0.307 0.281
38 Hotels and Restaurants 0.305 0.277
39 Land transport, transport via pipelines 0.306 0.281
40 Other transport 0.306 0.281
41 Water transport 0.310 0.284
42 Air transport 0.321 0.283
43 Travel agencies and tour operators 0.317 0.290

57
44 Renting of motor vehicles 0.317 0.282
45 Post and telecommunications 0.313 0.285
46 Financial activities, banks 0.322 0.295
47 Insurance and pension funds 0.325 0.297
48 Other financial services 0.324 0.294
49 Real estate and renting 0.322 0.291
50 Computer services, information technology 0.318 0.293
51 Research and development 0.328 0.292
52 Legal/economic activities 0.320 0.297
53 Architectural and engineering activities 0.320 0.292
55 Cleaning activities 0.320 0.281
56 Other business activities 0.320 0.288
57 Public administration 0.321 0.292
58 basic and special education 0.322 0.290
59 Secondary education 0.322 0.292
60 Higher education 0.322 0.295
61 Other education 0.322 0.290
62 Hospitals 0.315 0.287
63 Other health related services 0.315 0.287
64 Nursing and retirement homes 0.315 0.287
65 Other self-care activities 0.315 0.287
66 Sewage refusal and disposal, sanitation 0.306 0.278
67 Activities of membership organisation 0.321 0.293
68 Recreational, cultural and sporting activities 0.311 0.285
69 Laundry, personal care 0.307 0.277
70 Private household activities 0.299 0.276
71 Extraterritorial organisations and bodies 0.310 0.292
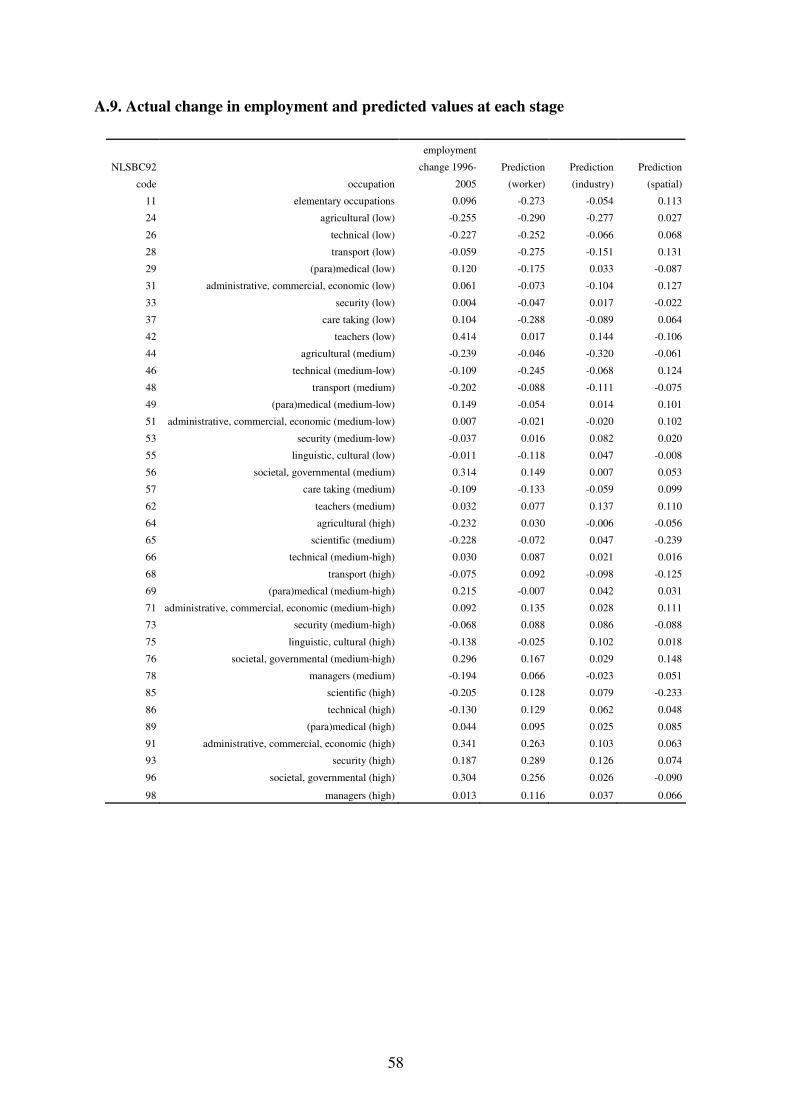
58
A.9. Actual change in employment and predicted values at each stage
NLSBC92
code occupation
employment
change 1996-
2005
Prediction
(worker)
Prediction
(industry)
Prediction
(spatial)
11 elementary occupations 0.096 -0.273 -0.054 0.113
24 agricultural (low) -0.255 -0.290 -0.277 0.027
26 technical (low) -0.227 -0.252 -0.066 0.068
28 transport (low) -0.059 -0.275 -0.151 0.131
29 (para)medical (low) 0.120 -0.175 0.033 -0.087
31 administrative, commercial, economic (low) 0.061 -0.073 -0.104 0.127
33 security (low) 0.004 -0.047 0.017 -0.022
37 care taking (low) 0.104 -0.288 -0.089 0.064
42 teachers (low) 0.414 0.017 0.144 -0.106
44 agricultural (medium) -0.239 -0.046 -0.320 -0.061
46 technical (medium-low) -0.109 -0.245 -0.068 0.124
48 transport (medium) -0.202 -0.088 -0.111 -0.075
49 (para)medical (medium-low) 0.149 -0.054 0.014 0.101
51 administrative, commercial, economic (medium-low) 0.007 -0.021 -0.020 0.102
53 security (medium-low) -0.037 0.016 0.082 0.020
55 linguistic, cultural (low) -0.011 -0.118 0.047 -0.008
56 societal, governmental (medium) 0.314 0.149 0.007 0.053
57 care taking (medium) -0.109 -0.133 -0.059 0.099
62 teachers (medium) 0.032 0.077 0.137 0.110
64 agricultural (high) -0.232 0.030 -0.006 -0.056
65 scientific (medium) -0.228 -0.072 0.047 -0.239
66 technical (medium-high) 0.030 0.087 0.021 0.016
68 transport (high) -0.075 0.092 -0.098 -0.125
69 (para)medical (medium-high) 0.215 -0.007 0.042 0.031
71 administrative, commercial, economic (medium-high) 0.092 0.135 0.028 0.111
73 security (medium-high) -0.068 0.088 0.086 -0.088
75 linguistic, cultural (high) -0.138 -0.025 0.102 0.018
76 societal, governmental (medium-high) 0.296 0.167 0.029 0.148
78 managers (medium) -0.194 0.066 -0.023 0.051
85 scientific (high) -0.205 0.128 0.079 -0.233
86 technical (high) -0.130 0.129 0.062 0.048
89 (para)medical (high) 0.044 0.095 0.025 0.085
91 administrative, commercial, economic (high) 0.341 0.263 0.103 0.063
93 security (high) 0.187 0.289 0.126 0.074
96 societal, governmental (high) 0.304 0.256 0.026 -0.090
98 managers (high) 0.013 0.116 0.037 0.066
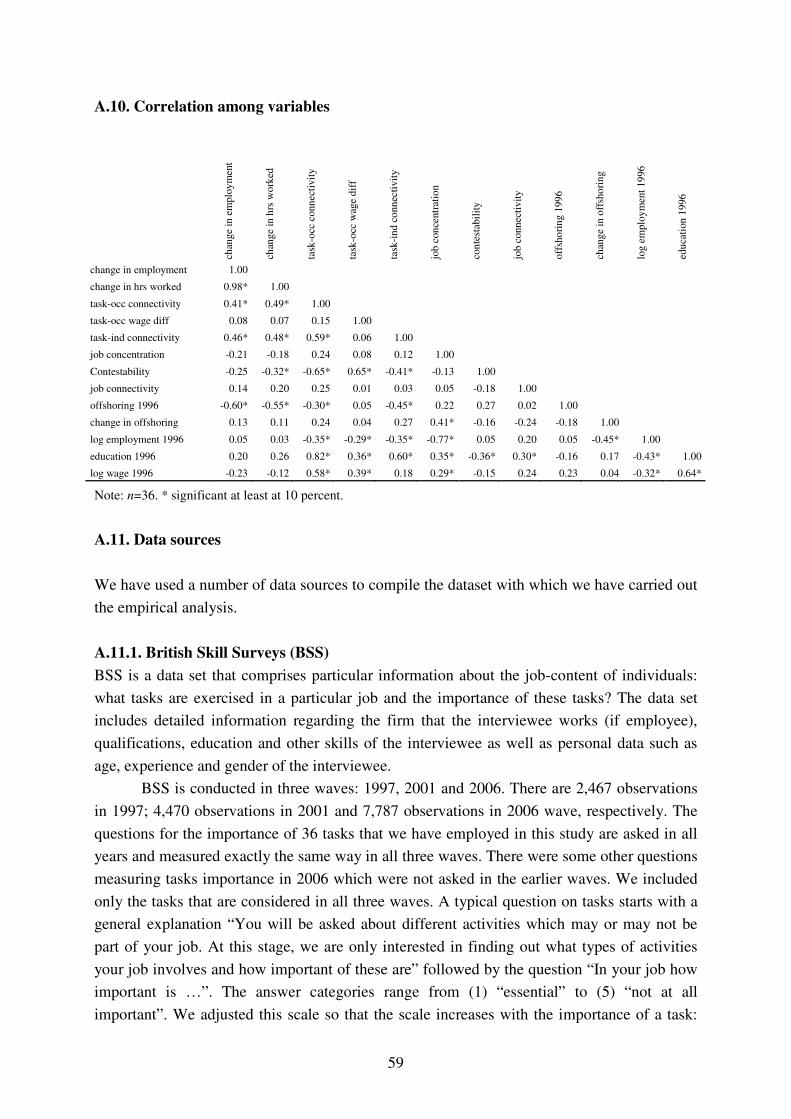
59
A.10. Correlation among variables
chan
ge
in e
mplo
ym
ent
chan
ge
in h
rs w
ork
ed
task
-occ
conn
ecti
vit
y
task
-occ
wag
e d
iff
task
-in
d c
onn
ecti
vit
y
job
con
centr
atio
n
con
test
abil
ity
job
conn
ecti
vit
y
off
sho
rin
g 1
99
6
chan
ge
in o
ffsh
ori
ng
log
em
plo
ym
ent
19
96
edu
cati
on
1996
change in employment 1.00
change in hrs worked 0.98* 1.00
task-occ connectivity 0.41* 0.49* 1.00
task-occ wage diff 0.08 0.07 0.15 1.00
task-ind connectivity 0.46* 0.48* 0.59* 0.06 1.00
job concentration -0.21 -0.18 0.24 0.08 0.12 1.00
Contestability -0.25 -0.32* -0.65* 0.65* -0.41* -0.13 1.00
job connectivity 0.14 0.20 0.25 0.01 0.03 0.05 -0.18 1.00
offshoring 1996 -0.60* -0.55* -0.30* 0.05 -0.45* 0.22 0.27 0.02 1.00
change in offshoring 0.13 0.11 0.24 0.04 0.27 0.41* -0.16 -0.24 -0.18 1.00
log employment 1996 0.05 0.03 -0.35* -0.29* -0.35* -0.77* 0.05 0.20 0.05 -0.45* 1.00
education 1996 0.20 0.26 0.82* 0.36* 0.60* 0.35* -0.36* 0.30* -0.16 0.17 -0.43* 1.00
log wage 1996 -0.23 -0.12 0.58* 0.39* 0.18 0.29* -0.15 0.24 0.23 0.04 -0.32* 0.64*
Note: n=36. * significant at least at 10 percent.
A.11. Data sources
We have used a number of data sources to compile the dataset with which we have carried out
the empirical analysis.
A.11.1. British Skill Surveys (BSS)
BSS is a data set that comprises particular information about the job-content of individuals:
what tasks are exercised in a particular job and the importance of these tasks? The data set
includes detailed information regarding the firm that the interviewee works (if employee),
qualifications, education and other skills of the interviewee as well as personal data such as
age, experience and gender of the interviewee.
BSS is conducted in three waves: 1997, 2001 and 2006. There are 2,467 observations
in 1997; 4,470 observations in 2001 and 7,787 observations in 2006 wave, respectively. The
questions for the importance of 36 tasks that we have employed in this study are asked in all
years and measured exactly the same way in all three waves. There were some other questions
measuring tasks importance in 2006 which were not asked in the earlier waves. We included
only the tasks that are considered in all three waves. A typical question on tasks starts with a
general explanation “You will be asked about different activities which may or may not be
part of your job. At this stage, we are only interested in finding out what types of activities
your job involves and how important of these are” followed by the question “In your job how
important is …”. The answer categories range from (1) “essential” to (5) “not at all
important”. We adjusted this scale so that the scale increases with the importance of a task:

60
(5) “task is essentially important” and (1) “task is not important at all”.
The information on 36 tasks and other relevant variables are linked to EBB by using
two-digit occupation codes. For each round of BSS, we came up with a correspondence table
linking UK occupation classification [Standard Occupation Classification (SOC 1990)] codes
to Dutch occupation classification [Standaard Beroepenclassificatie (SBC 1992)]. The
crosswalk is first done at the two-digit level. For the occupation groups that we are not certain
about the quality of the matching, we used three-digit codes. After reviewing the crosswalk, if
we are still not satisfied, we used four-digit occupation codes. This procedure resulted in a
correspondence table that matches 161 two, three and four-digit SOC codes to 36 SBC two-
digit codes. We omitted all the codes that refer to general occupation classes such as 20, 40,
60 etc. This is first because, these classes do not have exact occupation definitions and more
importantly the number of individuals registered to these occupation classes vary in great
extent from year to year. For instance, occupation class 80 varies between 98 and 370
individuals, changing from year to year without a pattern. This applies for the other general
groups as well. Some smaller categories that have less than 0.1 percent of total employment
are also not considered. The omitted 9 occupation classes in total correspond to less than 1
percent of total employment. Once these classes are omitted we end up with 38 two-digit
occupations. The three waves of BSS are aggregated for this 38 Dutch occupation classes.
The correspondence table is available upon request.
A.11.2. Enquête Beroepsbevolking (EBB)
We use the Dutch Labour Force survey from 1996 to 2005 for employment figures per
occupation (2-digit, 1992 Dutch occupation classification, 47 occupation classes) and industry
(2-digit, 1993 Dutch industry classification, 70 industry classes). EBB also comprises data on
personal characteristics such as age, education, qualifications, gender, ethnic background and
some other information regarding the content of the job. Unfortunately, EBB doesn’t include
wage data. We gathered wage data from the SSB at the occupation level from 1999 to 2005
and merge it to EBB. Wage data for earlier years are gathered from the Dutch Socio-
economic Panel (SEP). For years 1999 and 2000 the wage data is present in both SSB and
SEP. We used these two years to interpolate wages from 1996 to 1998. The number of
observations in each EBB round ranges between 80,541 to 99,137 with an average of 89,746.
A.11.3. Input-output tables
Input-output tables from 1996 to 2005 at CPB are used to compute the import component of
inputs for each industry. We used both the total and import input-output tables for the
Netherlands. The input-output tables comprise information on sales and purchases of each
industry from and to other industries with additional information on other variables such as
exports, final demand, total salary payments and social security contributions etc. giving a full
account of the Dutch economy.
The industry classification of the I-O tables does not exactly follow the standard
industry classifications. The I-O tables present detailed information for some two-digit
61
industries. For instance, Chemical Industry is a standard two-digit class in Standaard
Bedrijfsindeling 1993, but to provide better information this class is divided into five sub-
categories in I-O tables. The tables are available for 112 industry classes and sub-classes (112
by 112 matrix for each year). To match with the standard classification we constructed a
correspondence table matching each 112 industry code to a two-digit Standaard
Bedrijfsindeling 1993. This resulted in 70 two-digit industry classes. For each class we
calculated offshoring and narrow offshoring indicators as explained in the main text. The
correspondence table is available upon request.
A.12 Dataset
For the purpose of this project, the EBB data 1996-2005 is stacked in one large data set that
comprises all relevant information from EBB for 10 years (the master data). This resulted in a
data set of over a million observations. Then we add the necessary information from other
data sets in 3 steps.
• First, we append wage information. By using data from SSB and SEP as described above we
came up with a data set of wages that comprise wage information for every two-digit
occupation code from 1996-2005. This data is matched to the master data so that each two-
digit occupation code has a corresponding wage for each year.
• Second, we add information from the BSS. We aggregated the data on tasks from BSS for
Dutch two-digit occupations as explained above and than append this information to EBB
master data such that each two-digit occupation code has a corresponding task measure for
each year. Since there are only three waves of BSS, years 1996-1997 corresponds to BSS
1997 task values; 1998-2001 corresponds to BSS 2001 task values; and 2002-2005
corresponds to BSS 2006 task values.
• Third, we append the offshoring measures that we calculated from the I-O tables. The 112
industry groups in the I-O tables were matched to 70 two-digit industry classes in the EBB as
explained above. In the resulting data set each two-digit industry code has a corresponding
offshoring coefficient.
The resulting master data set comprise information on age, education, gender, ethnicity,
wages, tasks, other relevant information regarding the occupation and offshoring indicators.
The data set has information for 10 years, 36 two-digit occupation classes and 70 two-digit
industries. This data set can be aggregated in many ways, such as year-occupation, year-
industry and even year-occupation-industry cells, depending on the analysis to be conducted.


