28
Comparing Australia and New Zealand Broadband Policies 20 April 2015 CommsDay Summit 2015 Westin Hotel, Sydney 12225542 Dr Ross Patterson Partner, Competitors & Economic Regulation
| Date post: | 15-Jul-2015 |
| Category: |
Technology |
| Upload: | grahame-lynch |
| View: | 76 times |
| Download: | 0 times |

Comparing Australia and New Zealand Broadband
Policies
20 April 2015
CommsDay Summit 2015Westin Hotel, Sydney
12225542
Dr Ross PattersonPartner, Competitors & Economic
Regulation
Page l 2
Comparing Australia and New Zealand Broadband Policies
1. Process
2. Regulatory Framework
3. Progress Against Plan
4. Penetration and Uptake
5. Services and Prices
6. Conclusions

Page l 3
New Zealand
Process
2007 2008 2009 2010
Telecom Op Sep Undertakings – 80% of lines
capable of delivering 10 Mbps by 2011 with enforceable roll out obligations (FTTN)
PPP tender $4.7 billion (FTTN model) Expert Panel
concluded no bid was viable – recommended
FTTP model
PPP tender terminated. Announcement of $41.3
billion publicly owned network (93% FTTP,7%
(wireless and satellite) by 2020)
NBNCo established
Australia

Page l 4
ProcessOECD Fixed Broadband Penetration Rankings
15
16
17
18
19
20
21
22
20
06
20
07
20
08
20
09
20
10
20
11
20
12
20
13
20
14
New Zealand
Australia
Source: OECD Broadband Portal
OECD median
th
th
nd
st
th
th
th
th
(out of 34)
Page l 5
New Zealand
Process
2010 2011
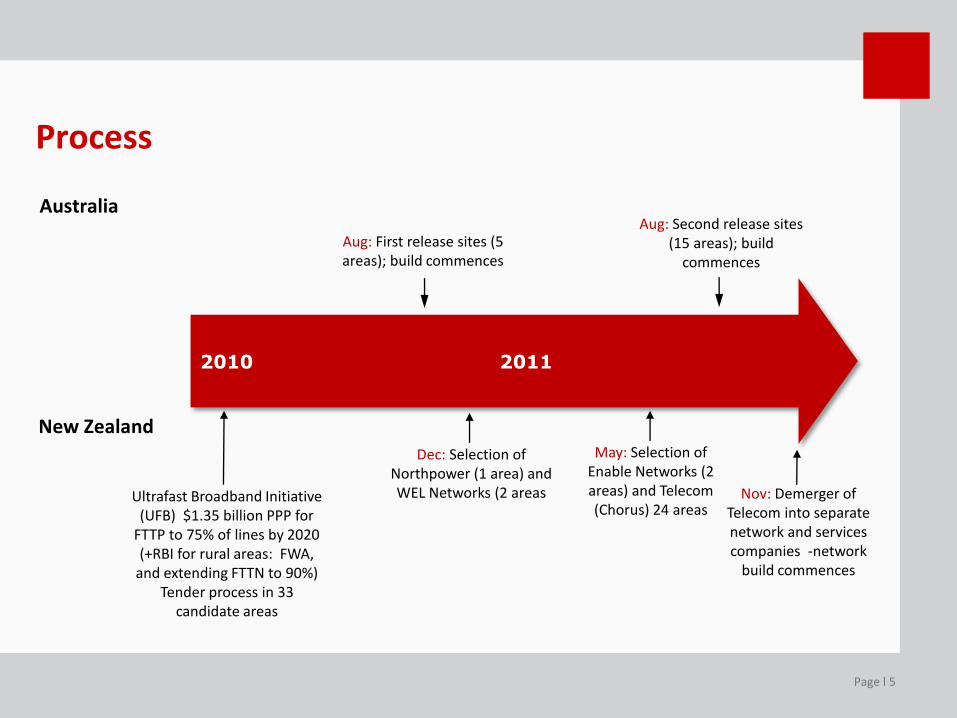
Ultrafast Broadband Initiative (UFB) $1.35 billion PPP for
FTTP to 75% of lines by 2020 (+RBI for rural areas: FWA,
and extending FTTN to 90%) Tender process in 33
candidate areas
Aug: First release sites (5 areas); build commences
Aug: Second release sites (15 areas); build
commences
Australia
Dec: Selection of Northpower (1 area) and WEL Networks (2 areas
May: Selection of Enable Networks (2 areas) and Telecom (Chorus) 24 areas
Nov: Demerger of Telecom into separate network and services companies -network
build commences

Page l 6
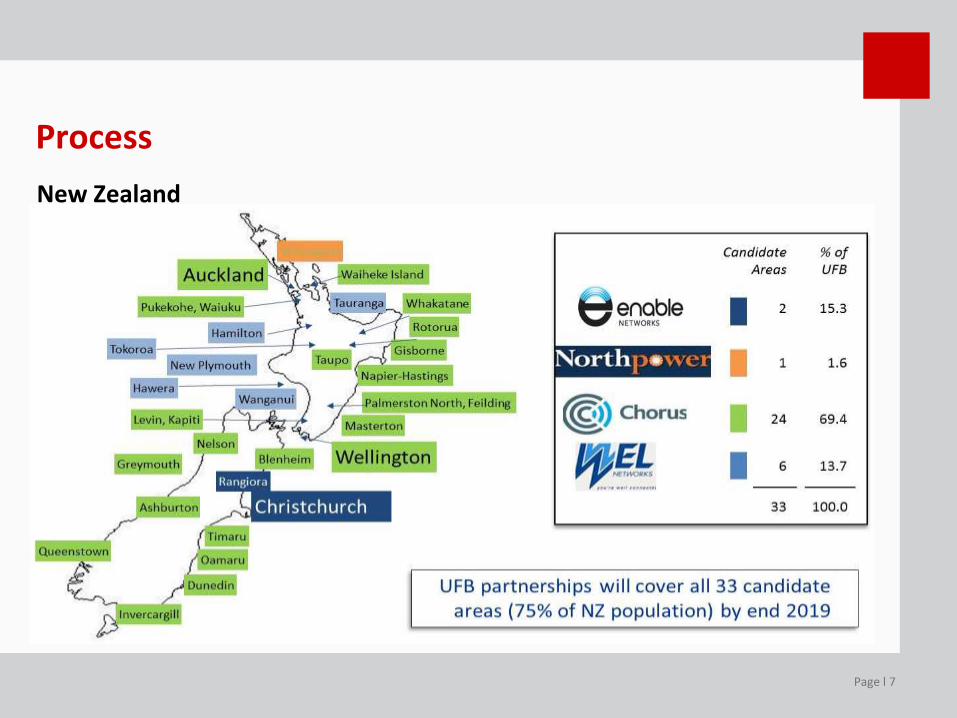
Australia
Process
Page l 7
New Zealand
Process
Page l 8
New Zealand
Process
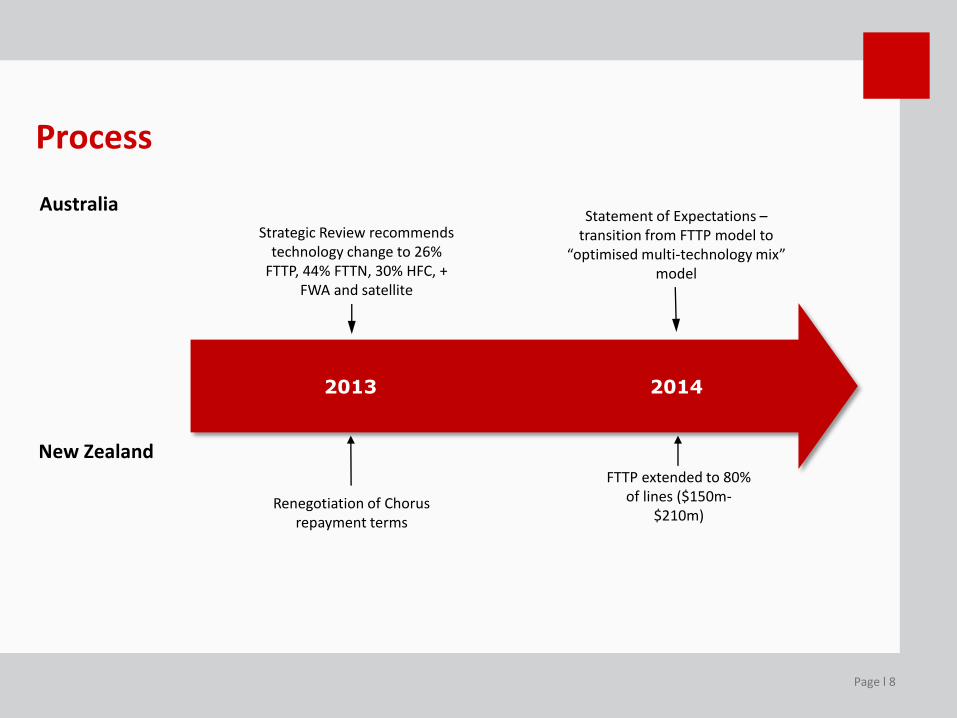
2013 2014
Renegotiation of Chorus repayment terms
Australia
FTTP extended to 80% of lines ($150m-
$210m)
Strategic Review recommends technology change to 26%
FTTP, 44% FTTN, 30% HFC, + FWA and satellite
Statement of Expectations –transition from FTTP model to
“optimised multi-technology mix” model

Page l 9
Australia New Zealand
Regulatory Framework – ownership and services
State owned and operated network –able to be privatised after 2020 [subject to Productivity Commission review]
PPP for the 3 LFCs (A and B shares); Chorus funding arrangement (equity and debt securities)
Wholesale layer 2 provider only –unbundling possible after 2020
Wholesale layer 2 provider only –required to supply unbundled layer 1 services from 2020 (EOI-capable)
Non-discrimination and transparency obligations
Non-discrimination and transparency obligations
No participation in retail services No participation in retail services

Page l 10
Australia New Zealand
Regulatory Framework – prices and roll out
Prices and service offerings set out in Special Access Undertaking (SAU) subject to acceptance by the ACCC following public consultation
Prices and services set by contract with CFH through tender process
Roll out obligations set by NBN Co in three year plan approved by shareholding Ministers
Roll out obligations set by contract with CFH through tender process

Page l 11
Australia New Zealand
Regulatory Framework – structural separation
Progressive structural separation of Telstra as customers migrate to fibre
Structural separation of Telecom a pre-condition to its participation in UFB
Existing copper services subject to “robust, effective and appropriate equivalence” but less than functional separation
De-merger of Telecom into separate listed network and retail companies in November 2011
Structural separation applies to copper as well as fibre services

Page l 12
Regulatory Framework
Source: Telecom NZ

Page l 13
Regulatory Framework – migration
Mandated migration (18 months from date of service availability)
Australia
Migration left to market forces
New Zealand
Page l 14
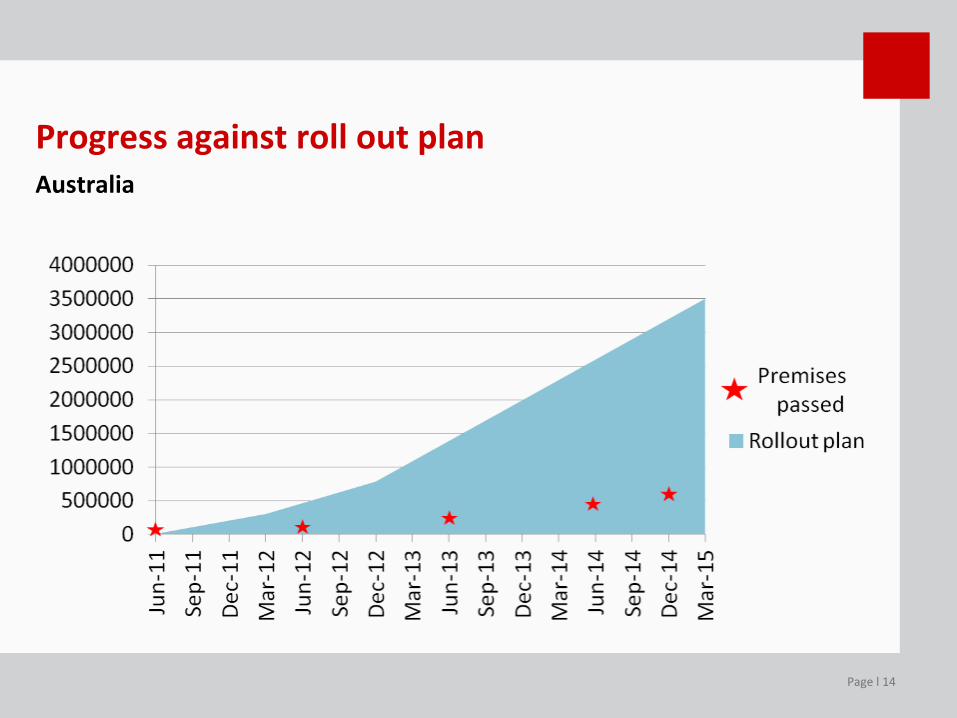
Progress against roll out planAustralia
Page l 15
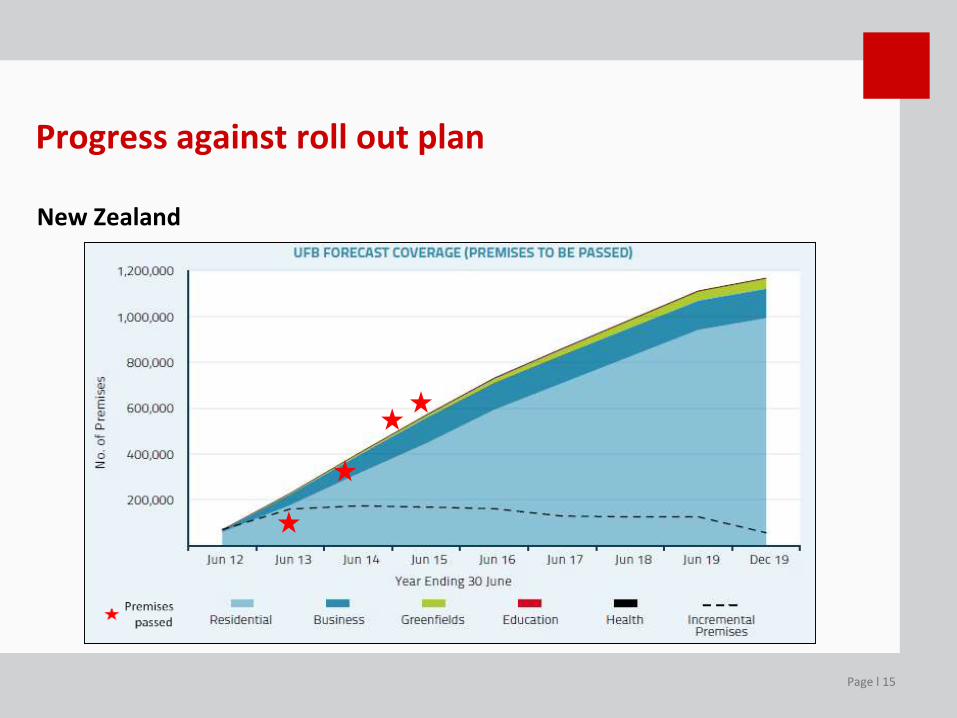
New Zealand
Progress against roll out plan
Page l 16
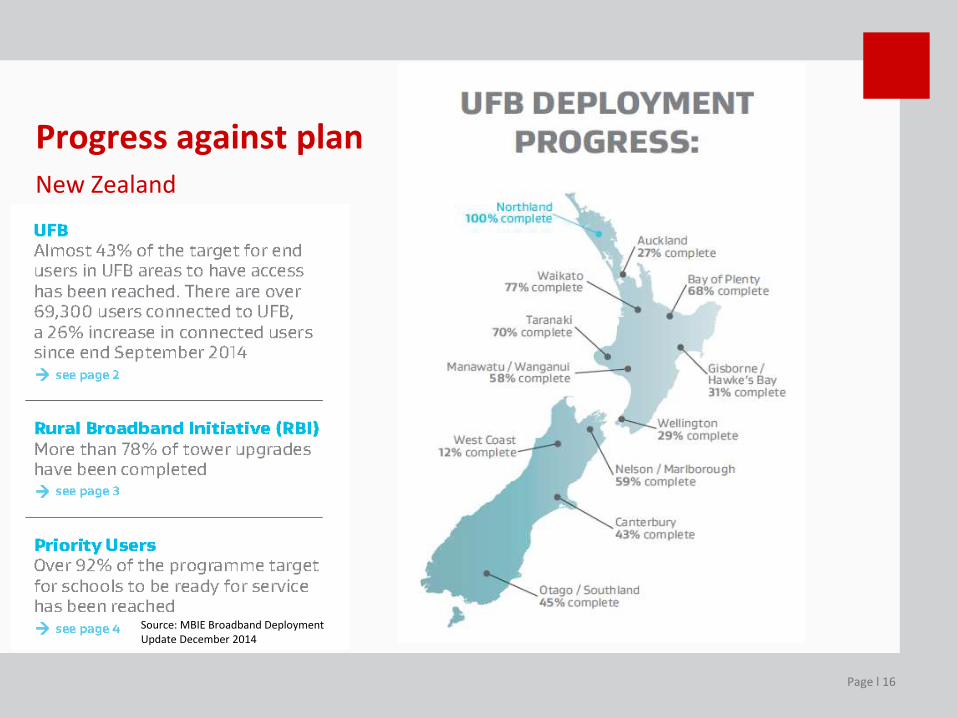
New Zealand
Source: MBIE Broadband Deployment Update December 2014
Progress against plan
Page l 17
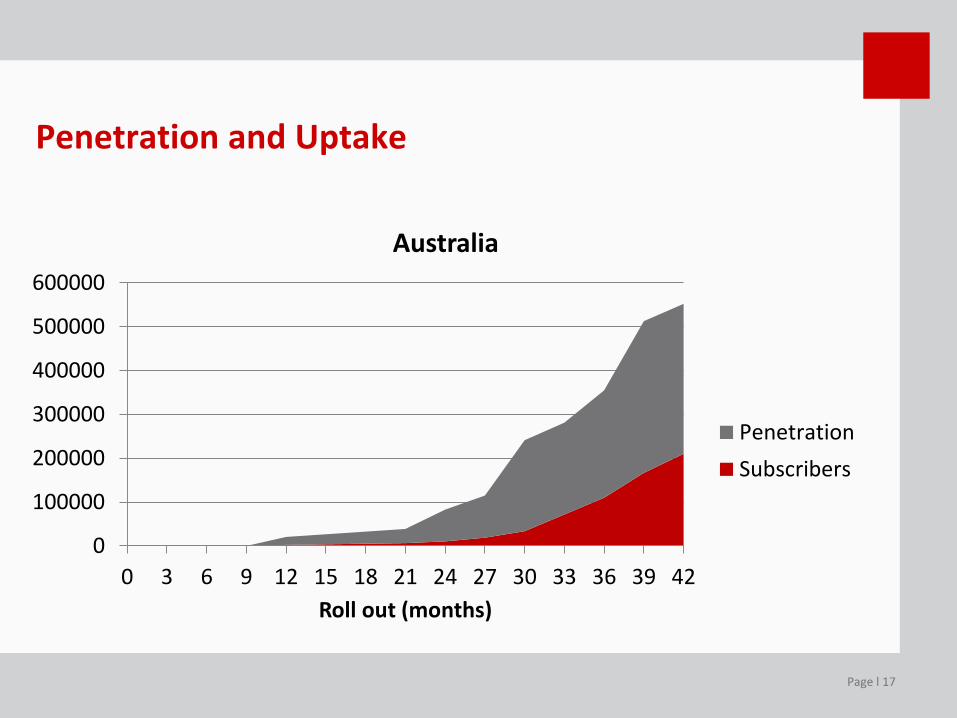
Penetration and Uptake
0
100000
200000
300000
400000
500000
600000
0 3 6 9 12 15 18 21 24 27 30 33 36 39 42
Roll out (months)
Australia
Penetration
Subscribers

Page l 18
Penetration and Uptake
0
100000
200000
300000
400000
500000
600000
0 3 6 9 12 15 18 21 24 27 30 33 36
Roll out (months)
New Zealand
Penetration
Subscribers

Page l 19
Australia New Zealand
Services and PricesWholesale
25/10 $30.00 30/10 $37.50*
50/20 $34.00 50/20 $37.50**
100/40 $38.00 100/20100/50
200/20
$40.00**$55.00* ($45.00**)
$55.00**
All NBNCo pricing *CFH negotiated pricing**Chorus commercial pricing

Page l 20
Australia New Zealand
Services and PricesRetail
25/5 $90 - $113 30/10 $85 - $89
100/40 $133 100/50 $109 - $119
200/20 $119 - $139
All unlimited data plans All unlimited data plans

Page l 21
Australia New Zealand
Services and PricesNew services
Page l 22
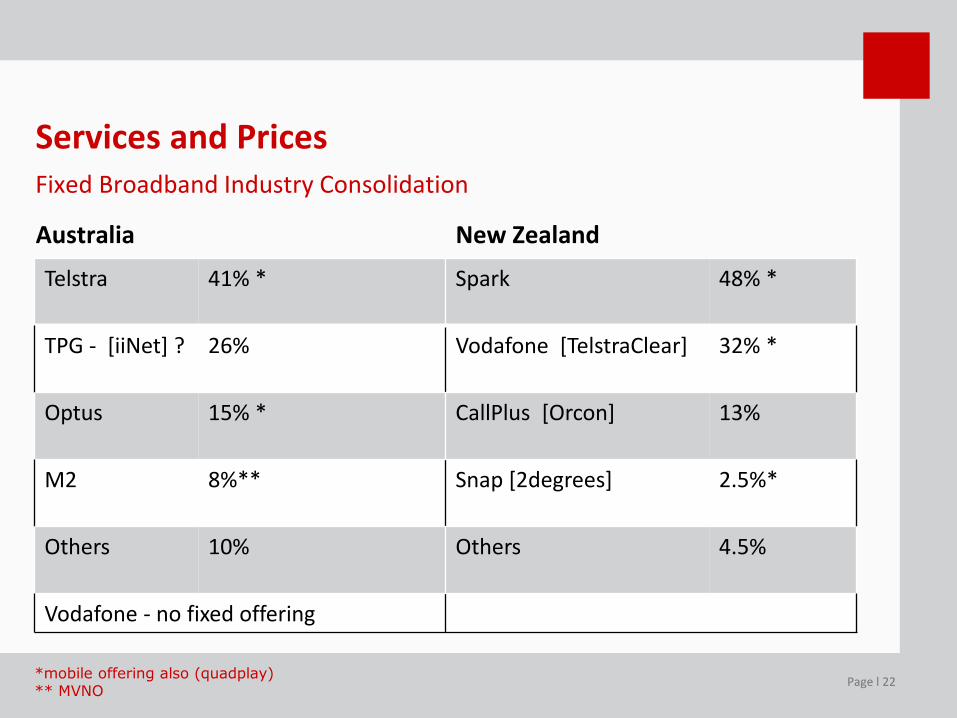
Australia New Zealand
Services and PricesFixed Broadband Industry Consolidation
*mobile offering also (quadplay)** MVNO
Telstra 41% * Spark 48% *
TPG - [iiNet] ? 26% Vodafone [TelstraClear] 32% *
Optus 15% * CallPlus [Orcon] 13%
M2 8%** Snap [2degrees] 2.5%*
Others 10% Others 4.5%
Vodafone - no fixed offering
Page l 23
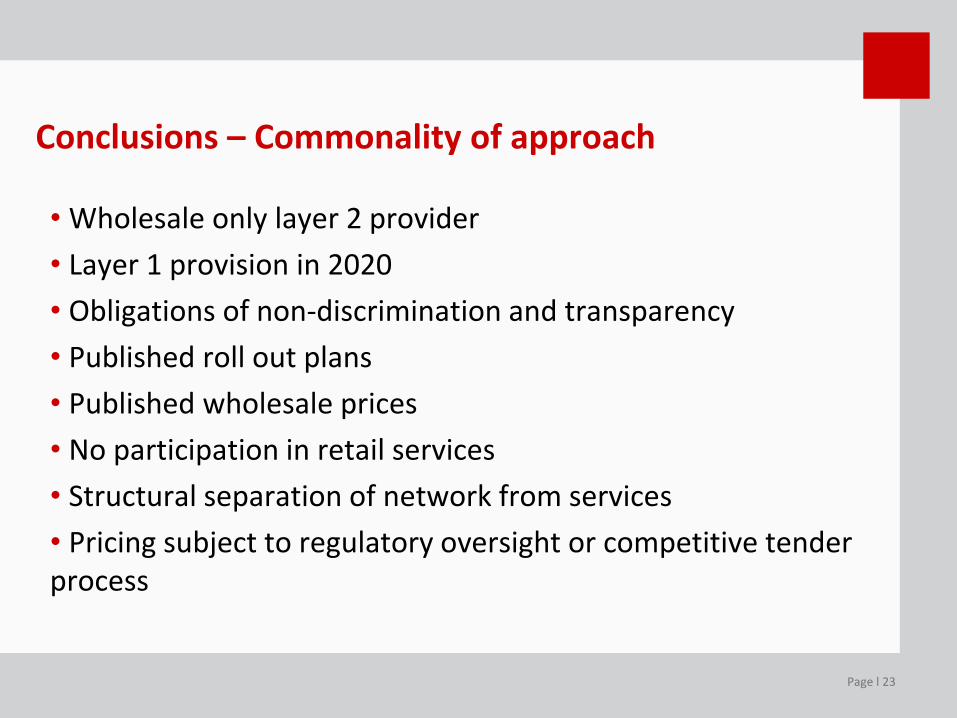
Conclusions – Commonality of approach
• Wholesale only layer 2 provider
• Layer 1 provision in 2020
• Obligations of non-discrimination and transparency
• Published roll out plans
• Published wholesale prices
• No participation in retail services
• Structural separation of network from services
• Pricing subject to regulatory oversight or competitive tender process
Page l 24
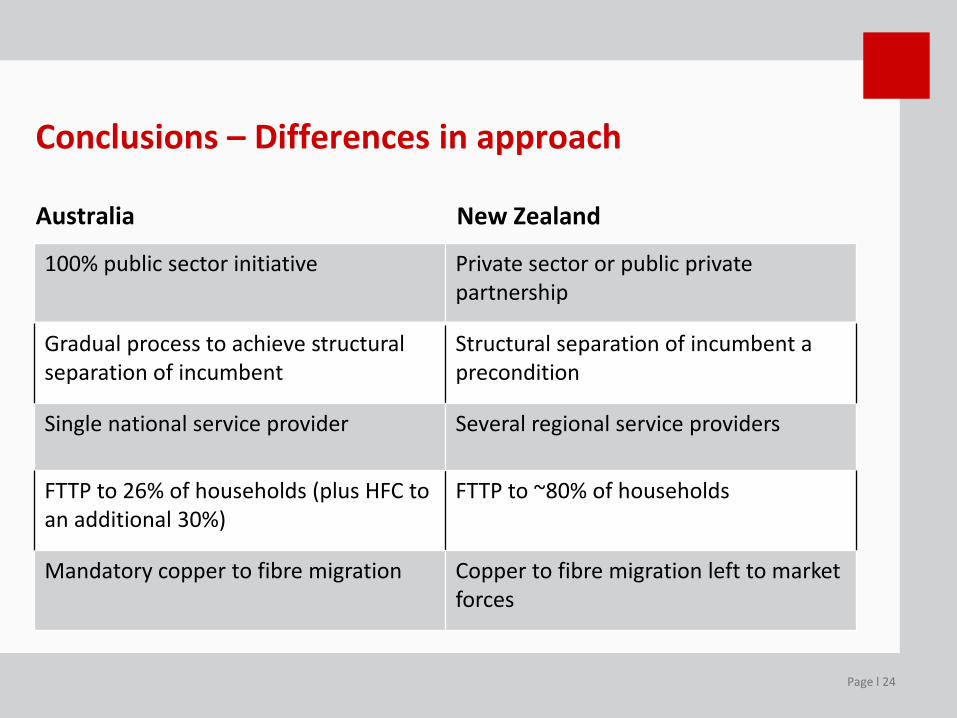
Australia New Zealand
Conclusions – Differences in approach
100% public sector initiative Private sector or public private partnership
Gradual process to achieve structural separation of incumbent
Structural separation of incumbent a precondition
Single national service provider Several regional service providers
FTTP to 26% of households (plus HFC to an additional 30%)
FTTP to ~80% of households
Mandatory copper to fibre migration Copper to fibre migration left to market forces

Page l 25
Conclusions – Consequences of difference in approach
• Under public ownership roll out and cost overrun risk is borne by the taxpayer and becomes a political issue.
• Under private ownership roll out and cost overrun risk is borne by the private sector participant and is a commercial issue.
• Commercial decision makers are more likely to still be involved at the end of the project than political decision makers, and therefore have greater accountability for decisions they have made.
• Commercial operators are bound by contract and do not have the option to unilaterally change the deal if they have miscalculated.

Page l 26
Conclusions – the jury is still out
• Benefits of broadband said to deliver increase in per capita GDP – but are there measurable benefits of a 100 Mbps (fibre) consumer service compared with a 20Mbps (VDSL) service?
• Is 80% FTTP coverage measurably of greater benefit than 26% FTTP, 30% HFC and the balance FTTN?
• Does mandatory copper to fibre migration stifle inter-modal retail competition? If so, do the benefits of faster (or greater) migration outweigh the detriments of higher retail prices?
The Australian and New Zealand fibre roll outs provide a rare “natural experiment” which should over the next few years provide answers to these questions.

Page l 27
Conclusions – the good news
-50
0
50
100
150
200
250
300 Annual Growth of fibre connections among countries reporting %
Source: OECD Broadband Portal, 2015

Dr Ross Patterson PartnerCompetition & Economic Regulationt +64 9 353 9864f +64 9 353 9701m +64 21 225 [email protected]


