Please send questions and comments to [email protected]. Drink Up Lesson in Survey Methodology Overview Certain data from the Youth Risk Behavior Surveillance System (YRBSS) are used to teach about the connection between soda and sports drink consumption among teens and teen health. Students will collect and analyze local peer data and learn health implications of their beverage choices while improving skills in critical thinking and data use to justify decision making. Students will practice real- life public health surveillance techniques, develop surveys, collect and compare data, and draw evidence-based conclusions. Throughout the lesson, students will learn about limitations and biases of different public health surveillance methods. Students will be encouraged to communicate their knowledge and create intervention strategies to positively influence beverage choices among their peers. Age/Grade Level Middle and High School Learning Objectives After completing this lesson, students should be able to • examine existing surveillance data to identify trends; • formulate evidence-based choices regarding personal beverage consumption; and • determine the limitations and biases of surveys when used as a surveillance method. Activities 1. Dietary Behaviors and Survey Design 2. Survey Critique and Discussion Duration This lesson can be taught as one, 90-minute session or divided into two, 45-minute sessions.
Overview Certain data from the Youth Risk Behavior Surveillance System (YRBSS) are used to teach about the connection between soda and sports drink consumption among teens and teen health. Students will collect and analyze local peer data and learn health implications of their beverage choices while improving skills in critical thinking and data use to justify decision making. Students will practice real-life public health surveillance techniques, develop surveys, collect and compare data, and draw evidence-based conclusions. Throughout the lesson, students will learn about limitations and biases of different public health surveillance methods. Students will be encouraged to communicate their knowledge and create intervention strategies to positively influence beverage choices among their peers. Age/Grade Level Middle and High School Learning Objectives After completing this lesson, students should be able to • examine existing surveillance data to identify trends; • formulate evidence-based choices regarding personal beverage consumption; and • determine the limitations and biases of surveys when used as a surveillance method. Activities 1. Dietary Behaviors and Survey Design 2. Survey Critique and Discussion Duration This lesson can be taught as one, 90-minute session or divided into two, 45-minute sessions.
Authors Teachers who attended CDC’s Science Ambassador Fellowship workshop developed this lesson plan. Science Ambassadors is an annual career workforce training for science, math, and health science teachers. For more information, visit http://www.cdc.gov/careerpaths/scienceambassador/.
Bob Rice Hamilton Southeastern Fishers, Indiana
Jenn Lowes-Seiler, MNS Woodland Middle School Marble Hill, Missouri
Jasmine Parker, BSE Peachtree Charter Middle School Atlanta, Georgia
Amy Koonce, NBCT, MEd Andrew Jackson Language Academy Chicago, Illinois
Christine Mytko, MS 2016 Science Ambassador Peer Leader Black Pine Circle School Berkeley, California
Acknowledgements This lesson plan was developed in consultation with subject matter experts from the U.S. Centers for Disease Control and Prevention.
Gabrielle F. Miller, PhD Economist, Division of Analysis, Research and Practice Integration National Center for Injury Prevention and Control
Scientific review was provided by Caitlin Merlo, MPH, Division of Population Health, National Center for Chronic Disease Prevention and Health Promotion, Sohyun Park, PhD, Division of Nutrition, Physical Activity, and Obesity, National Center for Chronic Disease Prevention and Health Promotion and Nancy Brener, PhD, Division of Adolescent and School Health, National Center for HIV/AIDS, Viral Hepatitis, STD, & TB Prevention. Scientific and editorial review was provided by Kelly Cordeira, MPH, Division of Scientific Education and Professional Development, Center for Surveillance, Epidemiology, and Laboratory Services, Office of Public Health Scientific Services, Centers for Disease Control and Prevention. Suggested Citation Centers for Disease Control and Prevention (CDC). Science Ambassador Workshop—Drink Up: Lesson in Survey Methodology. Atlanta, GA: US Department of Health and Human Services, CDC; 2016. Available at http://www.cdc.gov/careerpaths/scienceambassador/lesson-plans/.
Disclaimers: This lesson plan is in the public domain and may be used without restriction. Citation as to source, however, is appreciated. Links to nonfederal organizations are provided solely as a service to our users. These links do not constitute an endorsement of these organizations nor their programs by the Centers for Disease Control and Prevention (CDC) or the federal government, and none should be inferred. CDC is not responsible for the content contained at these sites. URL addresses listed were current as of the date of publication. Use of trade names and commercial sources is for identification only and does not imply endorsement by the Division of Scientific Education and Professional Development, Center for Surveillance, Epidemiology, and Laboratory Services, CDC, the Public Health Service, or the U.S. Department of Health and Human Services. The findings and conclusions in this Science Ambassador Workshop lesson plan are those of the authors and do not necessarily represent the official position of the Centers for Disease Control and Prevention (CDC).
Background Reducing consumption of calories from added sugar is a recommendation of the 1 2015–2020 Dietary Guidelines for Americans1and an objective of Healthy People 20202. Sugar-sweetened beverages (SSB) are major sources of added sugars in the diets of U.S. residents. Some popular sweeteners include high-fructose corn syrup and other syrups, fructose, fruit juice concentrates, honey, sugar, sucrose, and dextrose. If these appear in the ingredients list of your favorite beverage, you are drinking an SSB. In 2015, 20% of high school students in the United States drank
Figure 1. This “Rethink Your Drink fact sheet wasdesigned to help people consider how many calories different drinks add to total daily intake. Learn more at: https://www.cdc.gov/healthyweight/healthy_eating/drinks.html.
a can, bottle, or glass of soft drink ≥1 times/day, and 14% of high school students drank a sports drink ≥1 times/day.3 This is a public health concern because, frequently drinking sugar-sweetened beverages is associated with weight gain/obesity, type 2 diabetes, heart disease, kidney diseases, non-alcoholic liver disease, tooth decay and cavities, and gout, a type of arthritis. Public health surveillance systems are used to monitor SSB consumption and other dietary behaviors of youth. One type of surveillance system is a series of cross-sectional surveys administered regularly to monitor long-term trends in public health. This survey type can help to examine public health problems across several years, track trends, compare health among groups of people, and determine whether a health matter is improving or worsening for population groups.4 The Youth Risk Behavior Surveillance System (YRBSS) monitors six types of health-risk behaviors, including dietary behaviors. YRBSS also assesses the prevalence of obesity and asthma among middle school and high school students. YRBSS includes a national survey administered by CDC and state, territorial, tribal, and local education and health agencies and governments.5 Summary Students learn about beverage choices and consumption among high school students by collecting and comparing classroom and national data by using basic math. Students create their own surveys and present the collected data. Through this process, students learn about study limitations and the reliability of self-reported data. Finally, students compare calories among popular SSBs and learn about healthier alternatives.
1 Learn more about the 2010 Dietary Guidelines for Americans at https://health.gov/dietaryguidelines/2010/. 2 Learn more about Healthy People 2020 at https://www.healthypeople.gov/. 3 YRBSS data from 1991-2015 can be assessed at CDC’s Youth Online website at https://nccd.cdc.gov/youthonline/App/Default.aspx. 4 Learn more about surveillance systems at https://www.cdc.gov/obesity/data/surveillance.html. 5 Learn more about YRBSS at: http://www.cdc.gov/healthyyouth/data/yrbs/index.htm.
National Standards The following CDC Epidemiology and Public Health Science (EPHS) Core Competencies for High School Students1 and Next Generation Science Standards* (NGSS) are addressed: HS-EPHS2-1. Describe how to collect reliable data regarding priority health-related phenomena by using public health surveillance systems. • NGSS Key Science & Engineering Practice2: Planning & Carrying out Investigations • NGSS Key Crosscutting Concept2: System and System Models HS-EPHS2-2. Use credible evidence to describe a public health surveillance system. • NGSS Key Science & Engineering Practice2: Planning & Carrying out Investigations • NGSS Key Crosscutting Concept2: Patterns Contents Activity 1: Dietary Behaviors and Survey Design .................................................................................. 1 Activity 2: Survey Critique and Discussion ............................................................................................. 3 Worksheets
1A: Drink Up: Soda and Sports Drinks ...................................................................................... 6 1B: Drink Up: Soda and Sports Drinks, Answer Key .............................................................. 12 2A: Drink Up: Survey ............................................................................................................... 13 2C: Drink Up: Survey, Answer Key ......................................................................................... 15 3A: How many calories do you drink in a year? ...................................................................... 16 3B: How many calories do you drink in a year? Answer Key .................................................. 19
1 Centers for Disease Control and Prevention (CDC). Science Ambassador Workshop—Epidemiology and Public Health Science: Core
Competencies for high school students. Atlanta, GA: US Department of Health and Human Services, CDC; 2015. 2 NGSS Lead States. Next Generation Science Standards: For States, By States (Appendix F–Science and Engineering Practices, Appendix
G–Crosscutting Concepts). Achieve, Inc. on behalf of the twenty-six states and partners that collaborated on the NGSS. 2013. Available at: http://www.nextgenscience.org/get-to-know.
* Next Generation Science Standards is a registered trademark of Achieve. Neither Achieve nor the lead states and partners that developed the Next Generation Science Standards was involved in the production of, and does not endorse, this product.
Activity 1: Dietary Behaviors and Survey Design (45 minutes) Preparation Before Part 1, • make one copy of Worksheet 1A for each student, and • review YRBSS survey data online. (See Online Resources.) Materials • Worksheet 1A: Dietary Behaviors
Description: This worksheet has four parts. A guide to this worksheet is provided as Worksheet 1B. - Part 1 contains the two SSB questions asked in the 2015 YRBSS questionnaire. After students
recall types and amounts of soft drinks and sports drinks consumed in the past 7 days, they will circle the answer that best represents their beverage consumption.
- Part 2 provides data table shells for class data. The teacher will collect class data on the board. Students will record their data in the table provided. Then students will calculate percentages.
- Part 3 prompts students to compare national data reported from the 2015 YRBSS survey with the class data. Students graph the national data and the classroom data. This will help compare data sets and complete discussion questions.
- Part 4 provides discussion questions to help students analyze national and class data. • Worksheet 2A: Drink up: Student Survey, Part 1 and Part 2, only
Description: As a follow-up activity, students work together to design a survey and collect data. Although many other SSBs are available, for simplicity, this activity will only focus on brands of soft drinks and sports drinks. - Part 1 provides students with the opportunity to design a five-question survey to collect data and
determine which type(s) (e.g., brand names) of soft drinks and sports drinks are the most popular at their school.
- Part 2 instructs students to collect data using their five-question survey. Online Resources • YRBSS Online: Dietary Behaviors, 2015
https://nccd.cdc.gov/youthonline/App/Default.aspx Instructions: Select “High School YRBS” then “View U.S. Data.” Go to the “Filter data” sorting panel on the left side of the screen and select “Dietary Behaviors”. Check that data is being viewed by the subgroup “Sex.” To view the data as a graph, select the “Graph” tab. Description: This is an interactive YRBS data set from 2015. This lesson plan uses select dietary behavior questions and U.S. data.
• YRBSS http://www.cdc.gov/healthyyouth/data/yrbs/index.htm Description: This page provides information about YRBSS.
a. For Part 1, ask students to recall the types and amounts of beverages they consumed in the past 7 days, and circle the most appropriate answer.
b. For Part 2, draw the class data table on the board. Read each question aloud to the class. Instruct students to stand when you call the letter for the answer they selected (e.g., “A,” “B,” “C”). Categorize students by sex (males and females), and record the totals for each answer while students enter the numbers in the table provided. Instruct students to calculate each male and female total per question as a percentage. Finally, have students use their data to calculate the missing numbers in the last two rows of the table.
c. For Part 3, assign students to review the 2015 YRBSS national data. Instruct students to transfer the class data from Part 2. Then assign students to make a bar graph of the class data and the 2015 YRBSS national data. Remind them to use a color for the class data and different color for national data and to include a title and axis labels.
d. For Part 4, instruct students to answer discussion questions on their own. Then, as a class, review the discussion questions and any additional trends.
2. Distribute only Part 1 and Part 2 of Worksheet 2A. a. For Part 1, assign students to groups of 4. Explain that each group will create a five-question
survey to determine the types of beverages and amounts (e.g., 12 ounces, 20 ounces, or 2 glasses) consumed by their peers in the past 7 days. Explain that they need to plan how they will survey other students.
b. For homework, assign Part 2 of Worksheet 2A. Announce that each student in the group should survey 5 students who are not in this class. Remind them that before leaving class, they should decide on a survey collection strategy. Suggest that they also consider if they want to collect names or other information on those surveyed, such as male or female, age, etc. Remind them that if they choose to collect this information, it will be in addition to the five questions.
3 | P a g e
Activity 2: Survey Critique and Discussion (45 minutes) Preparation Before Part 2, • make one copy per group of Worksheet 3A and the “Rethink Your Drink” Brochure, and • review Online Resources as needed. Materials • Worksheet 2A: Drink up: Student Survey, Parts 3–5
Description: Students analyze data collected. - Part 3 uses discussion questions to help students critique their survey design and analyze data. - Part 4 directs students to work in their groups to compile and present their data by using a table. - Part 5 allows students to draw conclusions about their study using data.
• Worksheet 3A: How many calories do you drink in a year? Description: Drinks in common sizes are listed with their estimated calorie count. Students complete the table by filling in the number of each drink consumed in an average week. Then they calculate the number of calories consumed in an average week and year as a result of consuming those drinks.
Online Resources • CDC’s Rethink Your Drink Brochure
http://www.cdc.gov/nccdphp/dnpa/nutrition/pdf/rethink_your_drink.pdf Description: Data from this brochure is used in Worksheet 3.
• CDC’s The Buzz on Energy Drinks https://www.cdc.gov/healthyschools/nutrition/energy.htm Description: This page presents information about caffeine content and potential harm of energy drinks.
• CDC’s Water Access in Schools Toolkit https://www.cdc.gov/healthyschools/npao/pdf/water_access_in_schools_508.pdf Description: This downloadable PDF provides information about clean drinking water access in schools.
• CDC’s Get the Facts: Sugar-Sweetened Beverages and Consumption https://www.cdc.gov/nutrition/data-statistics/sugar-sweetened-beverages-intake.html Description: This website provides information about SSB.
• CDC’s Get the Facts: Drinking Water and Intake https://www.cdc.gov/nutrition/data-statistics/plain-water-the-healthier-choice.html Description: This web page provides information about drinking water and intake.
• CDC’s Know Your Limit for Added Sugars https://www.cdc.gov/nutrition/data-statistics/know-your-limit-for-added-sugars.html Description: This resource provides health information about added sugars in drinks.
Instructions 1. Distribute Parts 3–5 of Worksheet 2A.
a. For Part 3, students will work with their groups to discuss their survey methods. Ask students to consider the number and characteristics of students who participated in their survey. As a class, discuss sample size and selection bias. Caution students about how they word their conclusions on the basis of study limitations.
b. For Part 4, students will work with their groups to compile and present data using a table. Students should discuss the presentation. Some considerations include using numbers, percentages, or both, and stratifying by sex where these data were collected.
c. For Part 5, ask each group to draw conclusions about their study. Remind them to use data to support their conclusions.
d. Compare data and conclusions among student groups. Ask students to consider why different conclusions were made from group to group. Discuss how students might compile all group data into one data set. Discuss some difficulties (or limitations) of combining data sets (e.g., different questions asked) and some benefits (e.g., larger sample size). If time allows, combine the data sets to find if a different conclusion is drawn.
5. Distribute Worksheet 3A. a. Discuss the number of calories in different drinks. Discuss how the number of calories from
drinks can add up quickly each week. The topic of energy drinks might emerge during this discussion. Energy drink information can be found at https://www.cdc.gov/healthyschools/nutrition/energy.htm.
b. Ask students to consider what they drink in an average week. Instruct students to complete the table to determine the number of calories they consume in an average week and year from drinks.
c. Direct students to complete the discussion questions about lower calorie alternatives. A follow-up discussion could be about the composition of calories (i.e., sugars) in beverages and their biological effects.
Drink Up: Soda and Sports Drinks Name: ___________________________________ Date: ________________ Part 1: Questionnaire Directions: The questions below are from the Youth Risk Behavior Surveillance System regarding dietary behaviors.6 The questions ask about drinking behaviors during the past 7 days. Think about all the drinks you had from the time you got up until you went to bed. Be sure to include drinks you had at home, school, restaurants, or anywhere else. Circle the best answer for each question. 1. During the past 7 days, how many times did you drink a can, bottle, or glass of soda or pop, such as
Coke®, Pepsi™, or Sprite®? (Do not count diet soda or diet pop)
A. I did not drink soda during the past 7 days
B. 1–3 times during the past 7 days
C. 4–6 times during the past 7 days
D. 1 time per day
E. 2 times per day
F. 3 times per day
G. ≥4 times per day
2. During the past 7 days, how many times did you drink a can, bottle, or glass of sports drink, such as Gatorade® or Powerade®? (Do not count low-calorie sports drink.)
A. I did not drink soda during the past 7 days
B. 1–3 times during the past 7 days
C. 4–6 times during the past 7 days
D. 1 time per day
E. 2 times per day
F. 3 times per day
G. ≥4 times per day
6 The complete survey can be found at: ftp://ftp.cdc.gov/pub/data/yrbs/2015/2015_hs_questionnaire.pdf.
Part 2: Class Data Directions: Complete the tables below by using data from your classmates. With each response, provide the number (n) and percentage (%) of females and males who answered the question. Then combine this information to identify the number and percentage of students who drank soft drinks or sports drinks at least one a week and at least once a day. Total number of: female students in class: _________ male students in class: _________ Soft Drink Consumption
Question 1: During the past 7 days, how many times did you drink a can, bottle, or glass of soda or pop, such as Coke®, Pepsi™, or Sprite®? (Do not count diet soda or diet pop.)
Female (n)
Male (n)
Female (%)
Male (%)
A. I did not drink a can, bottle, or glass of soda or pop during the past 7 days
B. 1–3 times during the past 7 days
C. 4–6 times during the past 7 days
D. 1 time per day
E. 2 times per day
F. 3 times per day
G. ≥4 times per day
Students who drank a can, bottle, or glass of soda or pop, such as Coke®, Pepsi™, or Sprite® during the past 7 days.
Students who drank a can, bottle, or glass of soda or pop, such as Coke®, Pepsi™, or Sprite® 1 or more times per day during the past 7 days.
8 | P a g e
Sports Drink Consumption
Question 2: During the past 7 days, how many times did you drink a can, bottle, or glass of sports drink, such as Gatorade® or Powerade®? (Do not count low-calorie sports drink.)
Female (n)
Male (n)
Female (%)
Male (%)
A. I did not drink a can, bottle, or glass of sports drink, such as Gatorade® or Powerade® during the past 7 days
B. 1–3 times during the past 7 days
C. 4–6 times during the past 7 days
D. 1 time per day
E. 2 times per day
F. 3 times per day
G. ≥4 times per day
Students who drank a can, bottle, or glass of sports drink, such as Gatorade® or Powerade® during the past 7 days
Students who drank a can, bottle, or glass of sports drink, such as Gatorade® or Powerade® 1 or more times per day during the past 7 days.
9 | P a g e
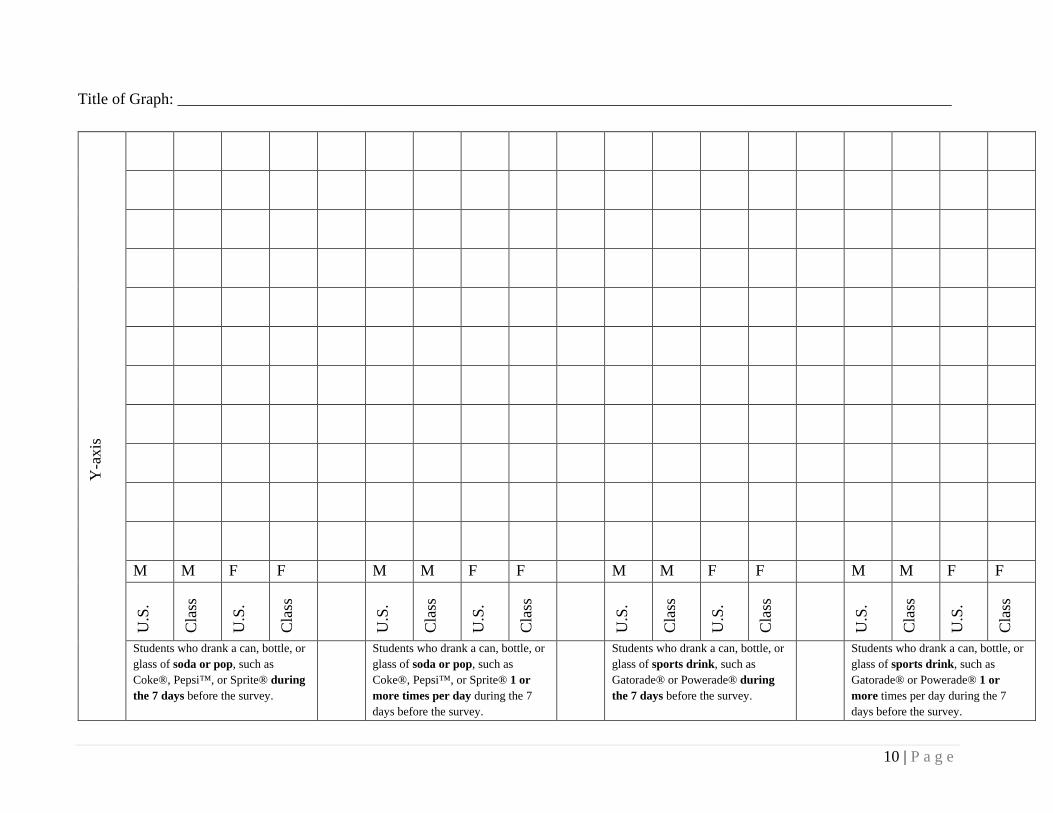
Part 3: Comparing 2015 National Data to Class Data Directions: Review the 2015 national data for high school students provided by the Youth Risk Behavior Surveillance System. Transfer class data from the previous worksheet to the worksheet below. Then create a bar graph from the class data and the national data. Use a different color for the National data and the class data. Include a title and axis labels for your graph.
National Data Class Data
Female (%)
Male (%)
Female (%)
Male (%)
Students who drank a can, bottle, or glass of soda or pop, such as Coke®, Pepsi™, or Sprite® during the 7 days before the survey.
69.0 78.6
Students who drank a can, bottle, or glass of soda or pop, such as Coke®, Pepsi™, or Sprite® 1 or more times per day during the 7 days before the survey.
16.4 24.3
Students who drank a can, bottle, or glass of sports drink, such as Gatorade® or Powerade® during the 7 days before the survey.
47.3 67.7
Students who drank a can, bottle, or glass of sports drink, such as Gatorade® or Powerade® 1 or more times per day during the 7 days before the survey.
8.8 18.7
10 | P a g e
Title of Graph: _________________________________________________________________________________________________
Y-a
xis
M M F F M M F F M M F F M M F F
U.S
.
Cla
ss
U.S
.
Cla
ss
U.S
.
Cla
ss
U.S
.
Cla
ss
U.S
.
Cla
ss
U.S
.
Cla
ss
U.S
.
Cla
ss
U.S
.
Cla
ss
Students who drank a can, bottle, or glass of soda or pop, such as Coke®, Pepsi™, or Sprite® during the 7 days before the survey.
Students who drank a can, bottle, or glass of soda or pop, such as Coke®, Pepsi™, or Sprite® 1 or more times per day during the 7 days before the survey.
Students who drank a can, bottle, or glass of sports drink, such as Gatorade® or Powerade® during the 7 days before the survey.
Students who drank a can, bottle, or glass of sports drink, such as Gatorade® or Powerade® 1 or more times per day during the 7 days before the survey.
11 | P a g e
Part 4: Discussion Questions 1. Was it difficult to remember what you had to drink during the last 7 days? How might your ability to
remember what you had to drink affect how you answered the survey questions? 2. How might the students’ ability to remember what they had to drink over the past 7 days in the
national survey affect the national surveillance data? 3. When comparing class data with national data, why is it important to compare percentages and not
the number of students who answered “Yes”? 4. Compare the data. a. Compare the dietary behaviors between males and females in your classroom. b. Compare the dietary behavior between males and females nationally. c. Compare dietary behaviors between the class and the national data.
12 | P a g e
Worksheet 1B Part 4: Discussion Questions, Answer Key 1. Was it difficult to remember what you had to drink during the last 7 days? How might your ability to
remember what you had to drink affect how you answered the survey questions? Answer: Answers will vary. Students will likely describe how and why it was difficult to remember exactly what they had to drink. To illustrate how the information becomes less clear as you ask for more details, use prompts, such as “Did you drink 12 or 20 ounces?” Developers of YRBSS have stated this type of question is too difficult for middle school students to answer reliably.
2. How might the students’ ability to remember what they had to drink over the past 7 days in the
national survey affect the national surveillance data? Answer: Answers will vary. In research, this effect is called recall bias. Because this type of data rely on memory of a past occurrence, the researcher cannot be certain of what actually happened, and the data might not be 100% correct. Another type of bias that this effect may refer to is social desirability bias or the tendency of survey respondents to answer questions in a manner that will be viewed favorably by others. It can take the form of over-reporting "good behavior" or under-reporting "bad", or undesirable behavior. Strategies are available to check how correct the data might be. For example, students could keep a food journal for 7 days. When surveys are completed, the results are compared with food journal entries.
3. When comparing class data with national data, why is it important to compare percentages and not
the number of students who answered “Yes”? Answer: Comparing percentages and not numbers is important because the total number of students who complete each survey is different. For example, you might have surveyed only 30 students in your class while approximately 15,000 students are surveyed at the national level. By considering the denominator, the difference in sample size is accounted for.
4. Compare the data. a. Compare the dietary behaviors between males and females in your classroom.
Answer: Answers will vary on the basis of student responses. b. Compare the dietary behavior between males and females nationally.
Answer: At the national level, a greater proportion of males drank soda and sports drinks, ≥1 soda or pop weekly, and drank soda or pop on a daily basis. For soft drinks, 78.6% of males drank ≥1 can, glass, or bottle over the 7-day period, compared with 69.0% of females. Daily consumption was also higher for males (24.3%) than females (16.4%). For sports drinks, 67.7% of males drank sports drinks ≥1 time in the 7-day period, compared with 47.3% of females. Daily consumption was also higher for males (18.7%), compared with females (8.8%).7
c. Compare dietary behaviors between the class and the national data.
Answer: Answers will vary on the basis of student responses.
7 P-values are available on https://nccd.cdc.gov/youthonline/. View U.S. data. Select “Dietary Behaviors” with the column variable “Sex.” Then select the boxes above “Female” and “Male”. Choose “Compare Two.”
Drink Up: Survey Part 1: Questionnaire Design Directions: In your established groups, design a five-question questionnaire for data collection to determine which type(s) (e.g., brand names) of soft drinks and sports drinks are the most popular at your school. For each question, be sure to provide several multiple-choice options. 1.
2.
3.
4.
5.
Part 2: Data Collection For homework, each student in the group should survey five students not in the class. As a group, you should discuss your strategy for survey collection. Determine if you will collect names or other information from those you survey, such as male or female, age, etc. If you choose to collect this information, those will be in addition to the five topic specific questions.
14 | P a g e
Part 3: Reviewing your data collection methods Directions: As a group, answer the questions below using complete sentences. 1. As a group, you surveyed 20 students.
a. Was anyone surveyed twice? If so, can you use their data more than once? b. What percentage of students in your school does this sample represent? c. Think about who you asked to participate in your survey. Did you survey a specific group (e.g., only fellow athletes, your friends, or only girls)? Why might this matter?
2. On the basis of your answer to Question 1, do you think you surveyed enough students to draw a conclusion about the most popular brands of soft drinks or sports drinks in your school?
Part 4: Results 3. Create a data table. Think about your data. If a student was surveyed more than once, generate a rule
about how to select which survey to use. The total number of students surveyed minus those who were excluded is called your final sample. Include only data from your final sample in your data table. Display the data in a format you think is appropriate. As a group, decide if you should present your data by using numbers, percentages, or both. Answer: Answers will vary.
Part 5: Conclusions 4. Which type(s) (e.g., brand names) of soft drinks and sports drinks were the most popular among
your final sample? Use data to support your answer.
15 | P a g e
Worksheet 2B, Answer Key Part 3: Reviewing your data collection methods Directions: As a group, answer the questions below using complete sentences. 1. As a group, you surveyed 20 students.
a. Was anyone surveyed twice? If so, can you use their data more than once? Answer: Answers will vary. If the same person was surveyed twice, their data can only be used once. If a difference is reported between questionnaires, you cannot choose which one to use. In this case, you could generate a rule about which one to select (e.g., the first survey reviewed is the one used).
b. What percentage of students in your school does this sample represent? Answer: Answers will vary on the basis of the total number of students in the school. c. Think about who you asked to participate in your survey. Did you survey a specific group (e.g.,
only fellow athletes, your friends, or only girls)? Why might this matter? Answer: Answers will vary. Answers from one specific group might not be like answers from another. One should be cautious about applying data from one group to another group.
2. On the basis of your answer to Question 1, do you think you surveyed enough students to draw a conclusion about the most popular brands of soft drinks or sports drinks in your school? Answer: Answers will vary, according to answers to Question 1. With only 20 students participating in the survey, it will be difficult to draw strong conclusions about the most popular brands of beverages in the school. Discussion topics might include sample size and selection bias. Sample size is the number of participants needed to be confident in the data. In research, sample size can be calculated to make sure that an adequate number of people participate to draw conclusions. Generally, the more participants in the survey, the more confident we can be in the data to draw conclusions. Selection bias relates to the selection of participants who are similar, such as student friend groups or students who play on the girls’ soccer team. This can result in skewed data that is truer for this group, but might not be true for the whole school.
Part 4: Results 3. Create a data table. Think about your data. If a student was surveyed more than once, generate a rule
about how to select which survey to use. The total number of students surveyed minus those who were excluded is called your final sample. Include only data from your final sample in your data table. Display the data in a format you think is appropriate. As a group, decide if you should present your data by using numbers, percentages, or both. Answer: Answers will vary.
Part 5: Conclusions 4. Which type(s) (e.g., brand names) of soft drinks and sports drinks were the most popular among
your final sample? Use data to support your answer. Answer: Answers will vary. Answers should include data. For example, “Brand X was the most popular soft drink among survey peers. In this study, 75% participants (n = 15/20 students) reported they drank Brand X in the last week”. An important note, “Brand” can be interpreted different by students. For example, are “Coke®” and “Lime Flavored Coke®” the same? There is no right or wrong answer, but there needs to be consistency.
Worksheet 3A
How many calories do you drink in a year? Name: ___________________________________ Date: ________________ Directions: In the table below, drink types in common sizes are listed with their estimated calorie count. Think about what you drink during a normal week. Complete the table by filling in the number of each drink consumed in an average week. Then calculate the number of calories consumed in an average week and year due to those drinks. Type of Beverage Size of
drink Calories per drink
Number of drinks consumed in an average week
Calories consumed = Calories per drink X number of drinks consumed in an average week
Fruit punch (e.g., Minute Maid® or Fruitopia®)
12 ounces 192
20 ounces 320
100% apple juice 12 ounces 192
20 ounces 300
100% orange juice 12 ounces 168
20 ounces 280
Lemonade 12 ounces 168
20 ounces 280
Regular lemon/lime soda (e.g., Sprite® or Mountain Dew®)
12 ounces 148
20 ounces 247
Regular cola (e.g., Coca Cola® or Pepsi™)
12 ounces 136
20 ounces 227
Sweetened iced tea (bottled) (e.g., Snapple® or Lipton®)
12 ounces 135
20 ounces 225
Tonic water (e.g., Schweppes® or Canada Dry®)
12 ounces 124
20 ounces 207
16 | P a g e
Type of Beverage Size of drink
Calories per drink
Number of drinks consumed in an average week
Calories consumed = Calories per drink X number of drinks consumed in an average week
Regular ginger ale (e.g., Canada Dry® or Vernors®)
12 ounces 124
20 ounces 207
Regular Sports drink (e.g., Gatorade® or Powerade®)
12 ounces 99
20 ounces 165
Fitness water (e.g., Vitamin water®)
12 ounces 18
20 ounces 36
Unsweetened iced tea (e.g., Snapple® or Lipton®)
12 ounces 2
20 ounces 3
Diet soda (with aspartame)* (e.g., Diet Coke® or Pepsi™)
12 ounces 0
20 ounces 0
Carbonated water (unsweetened) (e.g., La Croix™ or San Pellegrino®)
12 ounces 0
20 ounces 0
Water (unsweetened) 12 ounces 0
20 ounces 0
Total calories per week (sum of all rows)
**Total calories per year (Total calories per week x 52)
l*Some diet soft drinks can contain a small number of calories that are not listed on the nutrition facts label. (USDA Nationa Nutrient Database for Standard Reference)Source: http://www.cdc.gov/healthyweight/healthy_eating/drinks.html
17 | P a g e
18 | P a g e
Discussion Questions 1. Do drinks play a role in your calorie intake? 2. Provide examples of sugar-sweetened beverages (SSB) that you normally drink. Then provide some
healthier options that you would be willing to try instead. Try to provide a variety of options. Instead of… Calories …I might try: Calories
3. While getting your lunch from the cafeteria, you decide to get the drink with the least amount of
calories. Of the drinks offered, what would you choose? 4. You look at the nutrition label on a 20-ounce bottle of a regular sports drink that lists 100 calories
per serving. On a second look at the label, you notice that there are 2.5 servings per container. If you drank the whole container, how many calories would you be drinking?
5. You know your friends like to drink soft drinks and sports drinks. Name three strategies you might give them to reduce the number of calories they drink.
19 | P a g e
Worksheet 3B, Answer Key Discussion Questions 1. Do drinks play a role in your calorie intake?
Answer: Yes, many drinks contain calories. A discussion topic might be how to identify the number of calories in different sizes of a drink by using the nutrition facts label.
2. Provide examples of sugar-sweetened beverages (SSB) that you normally drink. Then provide some
healthier options that you would be willing to try instead. Try to provide a variety of options. Instead of… Calories …I might try: Calories
3. While getting your lunch from the cafeteria, you decide to get the drink with the least amount of
calories. Of the drinks offered, what would you choose? Answer: Plain water has 0 calories. A lower calorie drink offered in school might be fat-free unflavored milk (90 calories).
4. You look at the nutrition label on a 20-ounce bottle of a regular sports drink that lists 100 calories
per serving. On a second look at the label, you notice that there are 2.5 servings per container. If you drank the whole container, how many calories would you be drinking? Answer: A total of 250 calories per container. This is calculated by multiplying the number of calories per serving (100 per serving) by the number of servings per container (2.5 per container).
5. You know your friends like to drink soft drinks and sports drinks. Name three strategies you might
give them to reduce the number of calories they drink. Answer: Answers will vary. Some CDC tips to making smart beverage choices, include the following: • choose water, diet, or low-calorie beverages instead of sugar-sweetened beverages; • carry a water bottle and refill it throughout the day; • do not stock the refrigerator with sugar-sweetened beverages. Instead, keep a jug or bottles of
cold water in the refrigerator; • serve water with meals; • make water more exciting by adding slices of lemon, lime, cucumber, or watermelon, or drink
sparkling water; • add a splash of 100% juice to plain sparkling water for a refreshing, low-calorie drink; • when you do choose a sugar-sweetened beverage, go for the small size. Some companies are
now selling 8-ounce cans and bottles of soda that contain about 100 calories; and • Be a role model for your friends and family by choosing healthy, low-calorie beverages. Source: https://www.cdc.gov/nccdphp/dnpa/nutrition/pdf/rethink_your_drink.pdf.