2007 Denver X-ray Conference Page 1 of 25 CdTe Detectors for Quantitative X-Ray Fluorescence R. Redus, J. Pantazis, T. Pantazis, A. Huber Amptek, Inc 14 DeAngelo Dr, Bedford MA 01730 B. Cross CrossRoads Scientific 414 Av. Portola, El Granada, CA
Transcript
2007 Denver X-ray Conference Page 1 of 25
CdTe Detectors for Quantitative X-Ray Fluorescence
R. Redus, J. Pantazis, T. Pantazis, A. Huber
Amptek, Inc14 DeAngelo Dr, Bedford MA 01730
B. CrossCrossRoads Scientific
414 Av. Portola, El Granada, CA
2007 Denver X-ray Conference Page 2 of 25
Why use CdTe?Much higher sensitivity > 20 keV
RoHS/WEE demands accurate measurement of metals
With CdTe, one can measure K X-rays (with few interferences) with much higher sensitivity than Si diodes Energy (keV)
1 10 100 1000
Inte
ract
ion
Prob
abili
ty
0.01
0.1
1
O F NeNaMgAl Si P S Ar Ca Ti CrFeNiZnGeBr Sr Mo AgSbBa TaAuPb U Fm
500 μm Si-PIN1 mil Be window
200 μm (active) Si-PIN0.5 mil Be window
750 μm CdTe4 mil Be window
1 mm CdTe
Photoelectric Interactions
1000 μm Si-PIN
2007 Denver X-ray Conference Page 3 of 25
57Co spectra measured with 25 mm2 Si-PIN and CdTe
– 6.4 keV Fe Kα X-ray• Equal photopeak area
– 14.4 keV γ-ray• CdTe has 25% more
photopeak area
– 122 keV γ-ray• CdTe has 140x photopeak
area0.0E+00
1.0E+04
2.0E+04
3.0E+04
4.0E+04
0 20 40 60 80 100 120 140
Energy (keV)
Cou
nts
122 keV γ-ray CdTe Si-PIN
14.4 keV γ-ray
6.4 keV Fe Kα X-ray
0 5 10 15 20Energy (keV)
Cou
nts
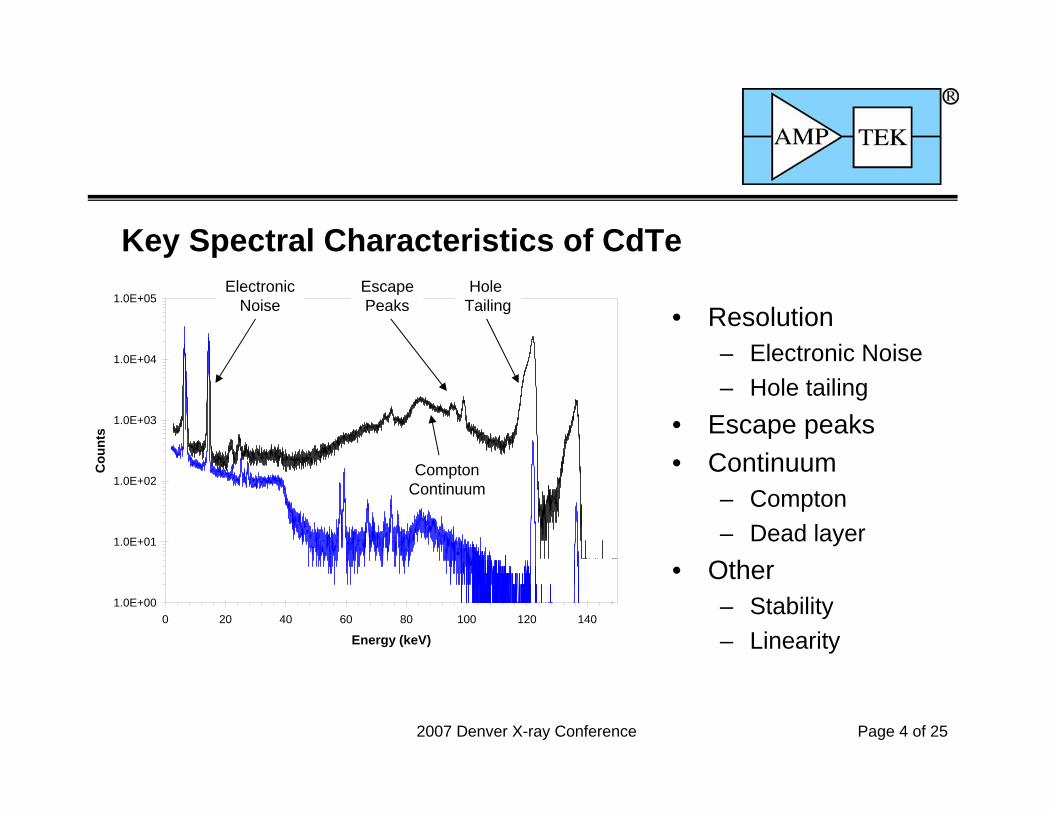
2007 Denver X-ray Conference Page 4 of 25
• Resolution– Electronic Noise– Hole tailing
• Escape peaks• Continuum
– Compton– Dead layer
• Other– Stability– Linearity
Key Spectral Characteristics of CdTe
1.0E+00
1.0E+01
1.0E+02
1.0E+03
1.0E+04
1.0E+05
0 20 40 60 80 100 120 140
Energy (keV)
Cou
nts
ElectronicNoise
Hole Tailing
EscapePeaks
ComptonContinuum
2007 Denver X-ray Conference Page 5 of 25
ApparatusDetectors
– CdTe• Compound semiconductor with wide bandgap (4.4 eV), high density (6.2
g/cm3), and high atomic number (48,52)• Charge transport better than most alternatives μτh=2x10⁻⁴ cm2/V• Studied and used for γ-ray spectroscopy since late 1960s
– Amptek detectors• Schottky (blocking) contacts to reduce leakage current• Idark ≈ 5 nA/cm2 at 500V and 300K • Mπn structure from Acrorad, Inc
– Good yield, reproducible properties
– Amptek diodes are 0.5 to 1 mm thick from 3x3 to 7x7 mm2
– Results here are for 0.75 x 5 x 5 mm3 unless otherwise stated
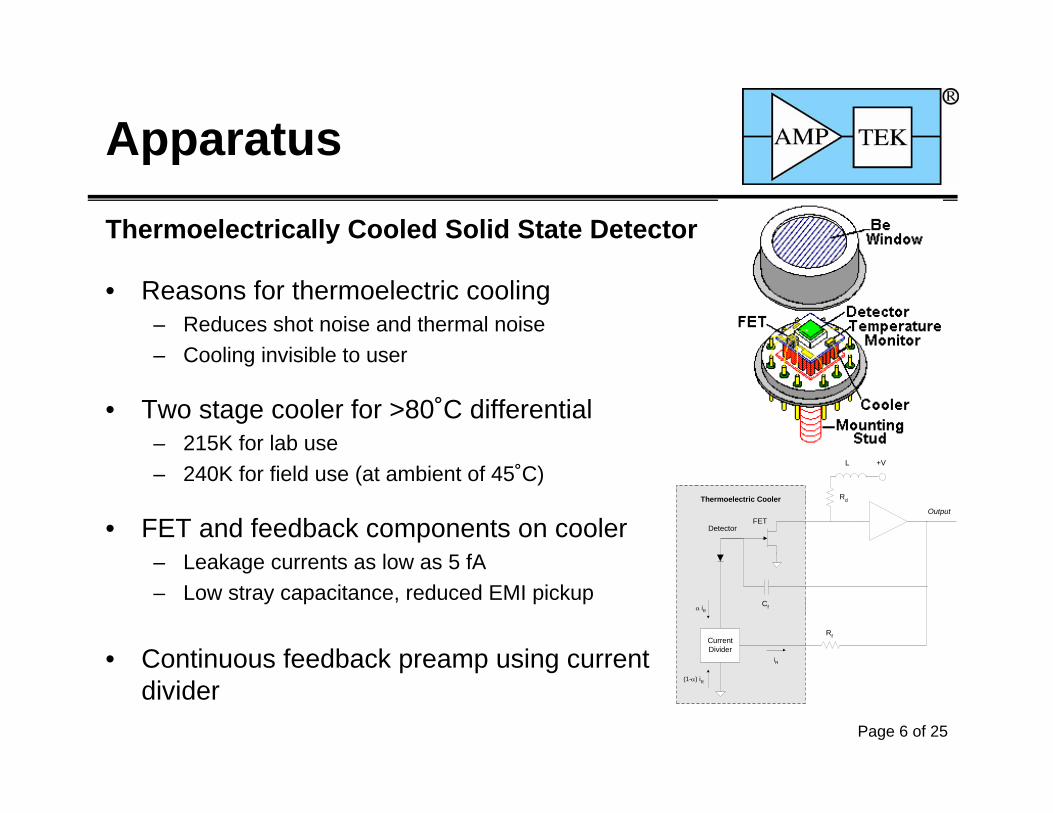
Page 6 of 25
Apparatus
Thermoelectrically Cooled Solid State Detector
• Reasons for thermoelectric cooling– Reduces shot noise and thermal noise– Cooling invisible to user
• Two stage cooler for >80˚C differential– 215K for lab use– 240K for field use (at ambient of 45˚C)
• FET and feedback components on cooler– Leakage currents as low as 5 fA– Low stray capacitance, reduced EMI pickup
• Continuous feedback preamp using current divider
+VL
Rd
FETDetector
Cf
OutputThermoelectric Cooler
RfCurrentDivider
iR
α iR
(1-α) iR
2007 Denver X-ray Conference Page 7 of 25
ApparatusX123, PX4, DP4
– All are complete spectroscopy systems– All share core technologies
• Digital pulse processor for pulse shaping, selection logic, and multichannel analyzer
• Power supplies, including 1.5 kV bias supply and closed loop temperature control
• USB interface, +5V power input
– Targeted at different applications
PX4 and XR100 for benchtop & laboratory
DP4 and PA210 for embedding in instruments
X123 for compact, packaged system
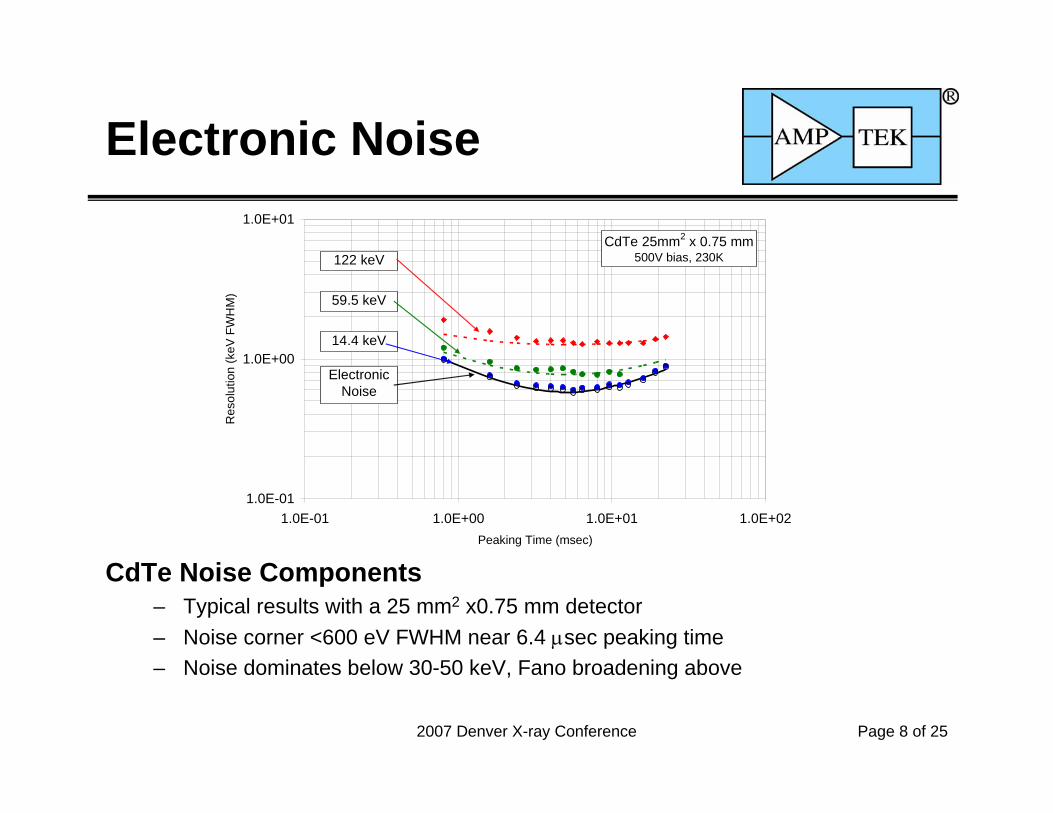
2007 Denver X-ray Conference Page 8 of 25
Electronic Noise
CdTe Noise Components– Typical results with a 25 mm2 x0.75 mm detector– Noise corner <600 eV FWHM near 6.4 μsec peaking time– Noise dominates below 30-50 keV, Fano broadening above
1.0E-01
1.0E+00
1.0E+01
1.0E-01 1.0E+00 1.0E+01 1.0E+02Peaking Time (msec)
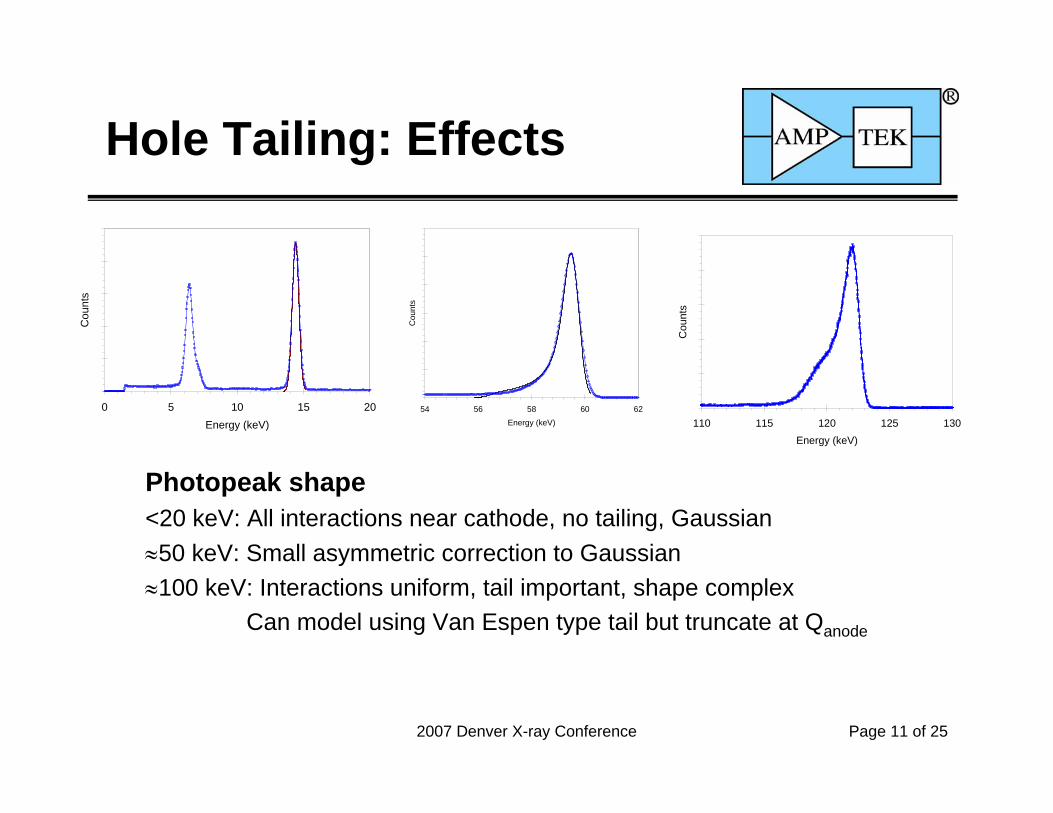
Photopeak shape<20 keV: All interactions near cathode, no tailing, Gaussian≈50 keV: Small asymmetric correction to Gaussian≈100 keV: Interactions uniform, tail important, shape complex
Can model using Van Espen type tail but truncate at Qanode
0 5 10 15 20Energy (keV)
Cou
nts
54 56 58 60 62Energy (keV)
Cou
nts
110 115 120 125 130Energy (keV)
Cou
nts
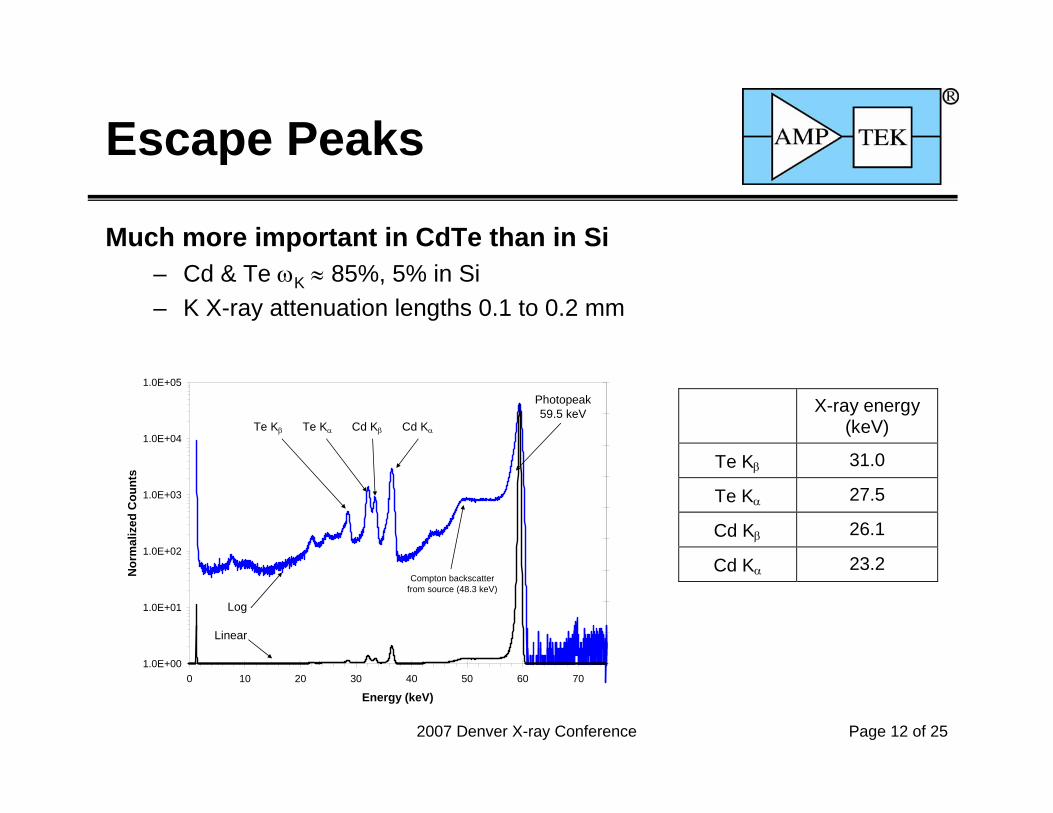
2007 Denver X-ray Conference Page 12 of 25
Escape Peaks
Much more important in CdTe than in Si– Cd & Te ωK ≈ 85%, 5% in Si– K X-ray attenuation lengths 0.1 to 0.2 mm
1.0E+00
1.0E+01
1.0E+02
1.0E+03
1.0E+04
1.0E+05
0 10 20 30 40 50 60 70
Energy (keV)
Nor
mal
ized
Cou
nts
Compton backscatter from source (48.3 keV)
Photopeak59.5 keV
Log
Linear
Te Kβ Te Kα Cd Kβ Cd Kα
X-ray energy (keV)
Te Kβ 31.0
Te Kα 27.5
Cd Kβ 26.1
Cd Kα 23.2
2007 Denver X-ray Conference Page 13 of 25
Escape Peaks: Correction
Intensity vs energy– Computed using EGS4
Monte Carlo softwareCarried out by Paul Bennett of RMD, Inc.
– Data using filtered isotopic sources.
Algorithm– 4 analytical equations, one
for each of the weighted centroids for Kα and Kβ of Cdand Te
– Subtraction starts at high energy, looking for all events above K edge
0%
5%
10%
15%
20%
0 50 100 150
Incident energy (keV)
Esca
pe p
eak
/ pho
tope
ak r
atio
Modeled Cd Kα
Measured Cd Kα
Cd Kβ
Te Kα
Te Kβ
Equations of the general form:
Esc = a0 + a1•e + a2•e2 + a3•e3 + a4•e4 + a5•e5
where Esc=escape events, e=parent energy, and the a terms are coefficients.
2007 Denver X-ray Conference Page 14 of 25
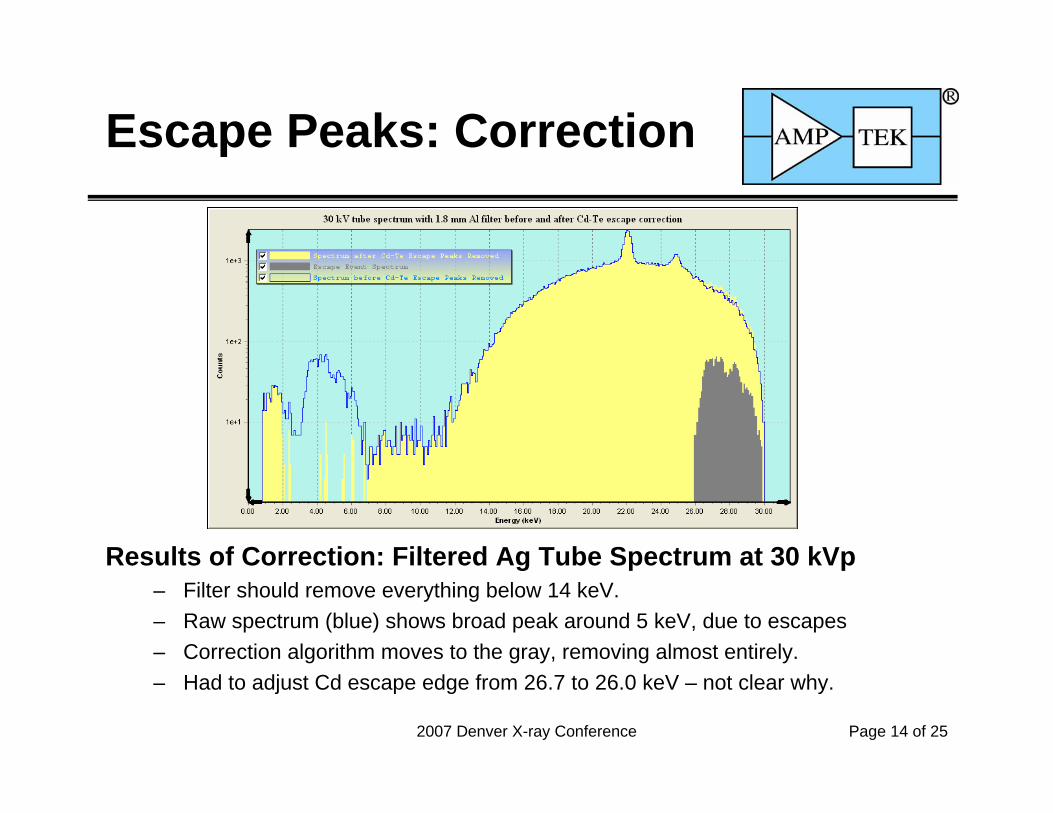
Escape Peaks: Correction
Results of Correction: Filtered Ag Tube Spectrum at 30 kVp– Filter should remove everything below 14 keV.– Raw spectrum (blue) shows broad peak around 5 keV, due to escapes– Correction algorithm moves to the gray, removing almost entirely.– Had to adjust Cd escape edge from 26.7 to 26.0 keV – not clear why.
2007 Denver X-ray Conference Page 15 of 25
Escape Peaks: Correction
Results of Correction: W Tube Spectrum at 80 kVp– Raw spectrum (blue) has large “steps” at K edges– Theoretical correction (yellow) helped but left some structure at K edges– Adjusting the Cd-K edge from 26.7 to 26.0 keV improves greatly, leaves a little
structure at the K edges.
2007 Denver X-ray Conference Page 16 of 25
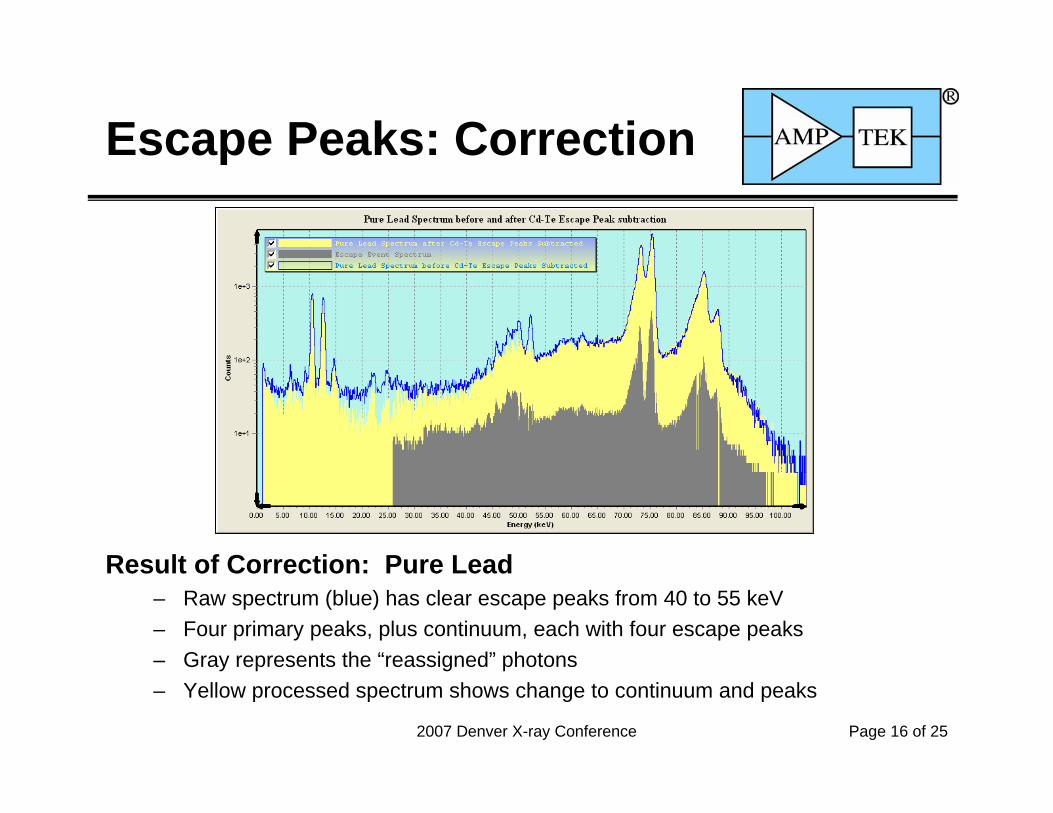
Escape Peaks: Correction
Result of Correction: Pure Lead– Raw spectrum (blue) has clear escape peaks from 40 to 55 keV– Four primary peaks, plus continuum, each with four escape peaks– Gray represents the “reassigned” photons– Yellow processed spectrum shows change to continuum and peaks
2007 Denver X-ray Conference Page 17 of 25
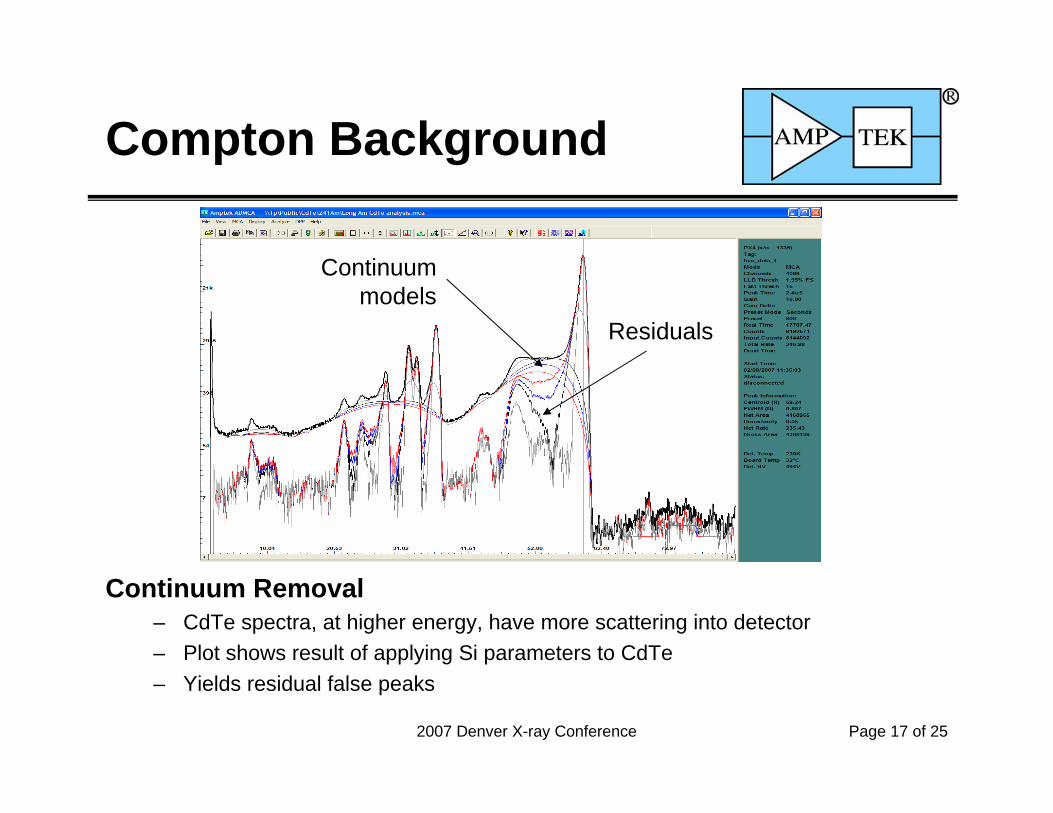
Compton Background
Continuum Removal– CdTe spectra, at higher energy, have more scattering into detector– Plot shows result of applying Si parameters to CdTe– Yields residual false peaks
Continuummodels
Residuals
2007 Denver X-ray Conference Page 18 of 25
Compton Background
Continuum Removal– Adjust parameters to give high curvature background continuum
• First, Cd-Te escape peaks are removed (partially at least)• Second, automatic background function applied to spectrum
– Very little residual continuum
2007 Denver X-ray Conference Page 19 of 25
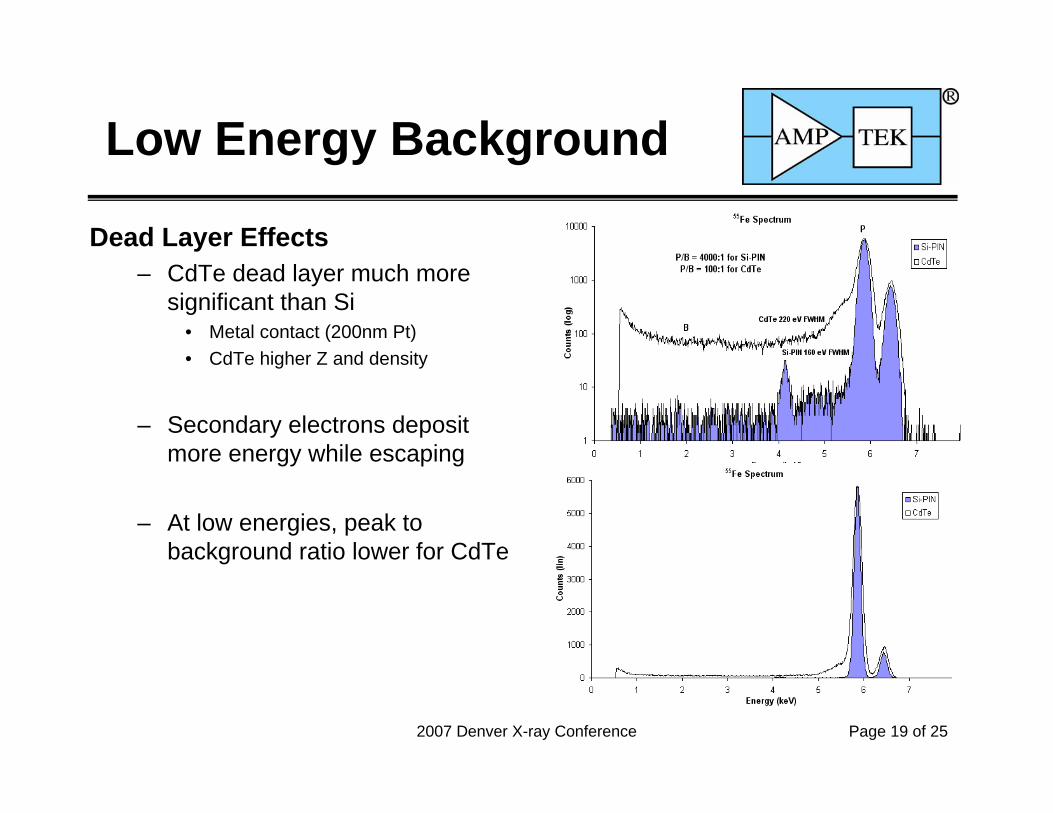
Low Energy Background
Dead Layer Effects– CdTe dead layer much more
significant than Si• Metal contact (200nm Pt)• CdTe higher Z and density
– Secondary electrons deposit more energy while escaping
– At low energies, peak to background ratio lower for CdTe
2007 Denver X-ray Conference Page 20 of 25
Stability
Does CdTe polarize?– At room temperature and low electric field strength, CdTe
Schottky diodes polarize– Polarization slows rapidly with cooling and high bias voltage– As operated in XR100-CdTe, negligible on time scale of days– Recovers within minutes at zero bias
Cathode (-)
Anode (+)
e-
+
h+
Cathode (-)
Anode (+)
e-
+
h+
++ +
+++
TrappedChargesinitialE
Reduced
E
0
400
800
1200
45 50 55 60 65 70
Energy (keV)
Cou
nts
Start2 hours4 hours6 hours8 hours
16 hours18 hours20 hours22 hours24 hours
Data taken at 300K, 200V
2007 Denver X-ray Conference Page 21 of 25
Stability
– Left: photopeak centroid and counts over 5 days• Gain fluctuations consistent with 30 ppm/˚C temperature coefficient • Count rate follows radioactive decay of 57Co
– Right: Spectra measured 60 hours apart– Stable over period of days. Expect drift at some longer time scale
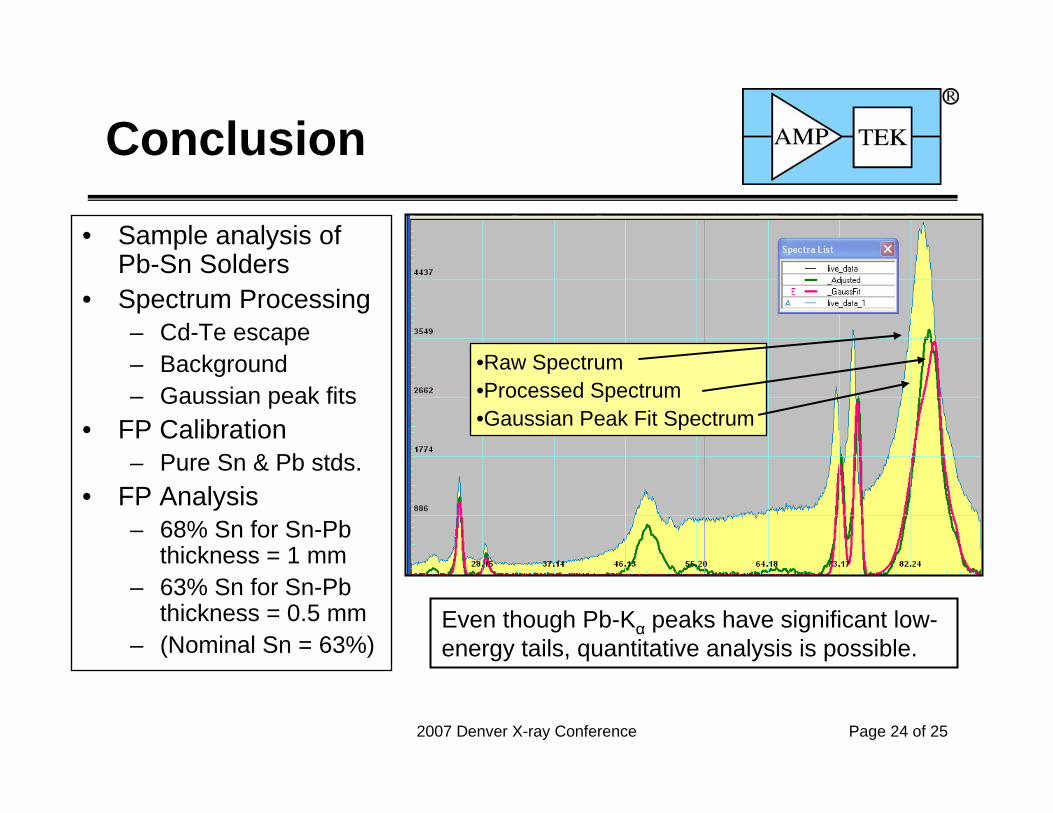
•Raw Spectrum•Processed Spectrum•Gaussian Peak Fit Spectrum
Even though Pb-Kα peaks have significant low-energy tails, quantitative analysis is possible.
2007 Denver X-ray Conference Page 25 of 25
Conclusions– CdTe is a powerful tool for measuring metals via XRF
• It has high sensitivity for K lines, with fewer interferences• One can carry out quantitative analysis
– Spectral characteristics require changes to algorithms• Hole tailing shape is different• Escape peaks more significant• Continuum more significant and shape different• Amptek’s XRS-FP will implement these corrections