30
CECL – Where to Start, How to Succeed April 2019

CECL – Where to Start, How to Succeed
April 2019
CECL Webinar – Where to Start, How to Succeed 2
Today’s Discussion Points
» CECL Overview: What’s Changing?
» Recent Accounting Updates: Real-life Impact
» Where to Start: Historical Losses
» Concluding Remarks and Q&A
CECL Overview1
CECL Webinar – Where to Start, How to Succeed 4
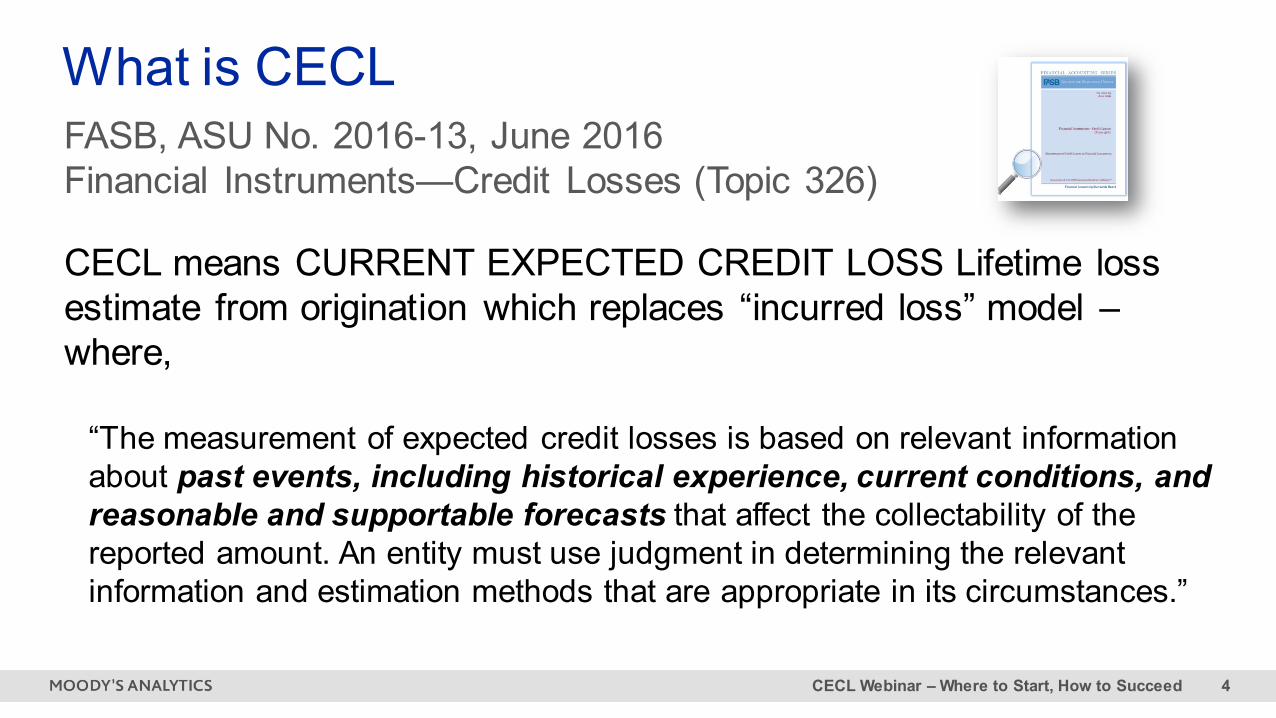
CECL means CURRENT EXPECTED CREDIT LOSS Lifetime loss estimate from origination which replaces “incurred loss” model –where,
“The measurement of expected credit losses is based on relevant information about past events, including historical experience, current conditions, and reasonable and supportable forecasts that affect the collectability of the reported amount. An entity must use judgment in determining the relevant information and estimation methods that are appropriate in its circumstances.”
What is CECLFASB, ASU No. 2016-13, June 2016Financial Instruments—Credit Losses (Topic 326)

CECL Webinar – Where to Start, How to Succeed 5
Changes under CECLApplies to all banks, savings associations, credit unions
» Scope: financial instruments measured at amortized cost basis– Loans held for investment– Debt securities held to maturity– Debt securities available for sale*– Off balance sheet exposures (Loan commitments, Letters of Credit)
» Measure expected credit losses over the life of financial asset based on: – Past events, including historical experience– Current conditions– Reasonable and supportable forecasts
» New and changing GAAP Disclosure requirements: amortized cost by credit quality indicators and vintage, collateral dependent loans and PCD disclosure
*Credit losses are recorded through the allowance and can be reversed. Allowance is subject to FV floor. Holding gain/loss – OCI. AFS security’s Am Cost is written down to FV only if Am Cost<FV and the institution intends to sell or more than likely will be required to sell.

CECL Webinar – Where to Start, How to Succeed 6
Historical loss
experience
Adjustments for Current Economic Conditions
Adjustments for
Reasonable &
Supportable Forecast*
Your CECL Formula =
Summary
*326-20-30-9 - An entity is not required to develop forecasts over the contractual term of the financial asset or group of financial assets. Rather, for periods beyond which the entity is able to make or obtain reasonable and supportable forecasts of expected credit losses, an entity shall revert to historical loss information.

CECL Webinar – Where to Start, How to Succeed 7
Defining What is Acceptable…There are a few elements that are required to be incorporated when using any methods…
» Historical Information
» Current conditions
» Reasonable & Supportable
» Reversion to long term averages
» Expert Judgement
326-20-30-8 Historical credit loss …. provides a basis for an entity’s assessment of expected credit losses. Historical loss information can be internal or external historical loss information (or a combination of both). An entity shall consider adjustments to historical loss information for differences in current asset specific risk characteristics, such as differences in underwriting standards, portfolio mix, or asset term within a pool at the reporting date or when an entity’s historical loss information is not reflective of the contractual term of the financial asset or group of financial assets.
326-20-30-9 An entity shall not rely solely on past events to estimate expected credit losses…. The adjustments to historical loss information may be qualitative in nature and should reflect changes related to relevant data ….. . However, an entity is not required to develop forecasts over the contractual term of the financial asset or group of financial assets. Rather, for periods beyond which the entity is able to make or obtain reasonable and supportable forecasts of expected credit losses, an entity shall revert to historical loss information

CECL Webinar – Where to Start, How to Succeed 8
Disclosing Credit Quality Indicators of FinancingReceivables by Amortized Cost Basis
326-20-55-79 The following Example illustrates the presentation of credit qualitydisclosures for a financial institution
New and Changed Reporting
Requirements

Recent Updates2

CECL Webinar – Where to Start, How to Succeed 10
NR 2018-142FOR IMMEDIATE RELEASEDecember 21, 2018
Agencies Allow Three-Year Regulatory Capital Phase In for New Current Expected Credit Losses (CECL) Accounting Standard
The federal bank regulatory agencies approved a final rule modifying their regulatory capital rules and providing an option to phase in over a period of three years the day-one regulatory capital effects of the update to the accounting standard known as the “Current Expected Credit Losses” (CECL) methodology. The final rule also revises the agencies’ other rules to reflect the update to the accounting standards.
Regulatory Capital Changes

CECL Webinar – Where to Start, How to Succeed 11
Draft Reporting Form Call Report Revisions Proposed to Take Effect March 31, 2019
This draft reporting form reflects revisions addressing the revised accounting for credit losses under the Financial Accounting Standards Board’s Accounting Standards Update No. 2016-13, “Financial Instruments –Credit Losses (Topic 326): Measurement of Credit Losses on Financial Instruments” to the FFIEC 031 Call Report, proposed to take effect March 31, 2019, as described in the federal banking agencies’ initial Paperwork Reduction Act Federal Register notice published on September 28, 2018.
Proposed changes to Call Report FFIEC 031

Where to Start: Historical Losses3

CECL Webinar – Where to Start, How to Succeed 13
Historical loss rates and estimates of PDs/LGDs can be a great place to start» Loss Rate
– Pool/cohort approach– Rating and loan type
» Probability of Default (“PD”) and Loss Given Default (“LGD”) – Mapping internal ratings to agency ratings– Use internal rating distribution and a central tendency of default
› Improve granularity with a PD (LGD) model– Build or buy PD/LGD scorecards as part of a “dual risk ratings” framework
CECL Webinar – Where to Start, How to Succeed 14
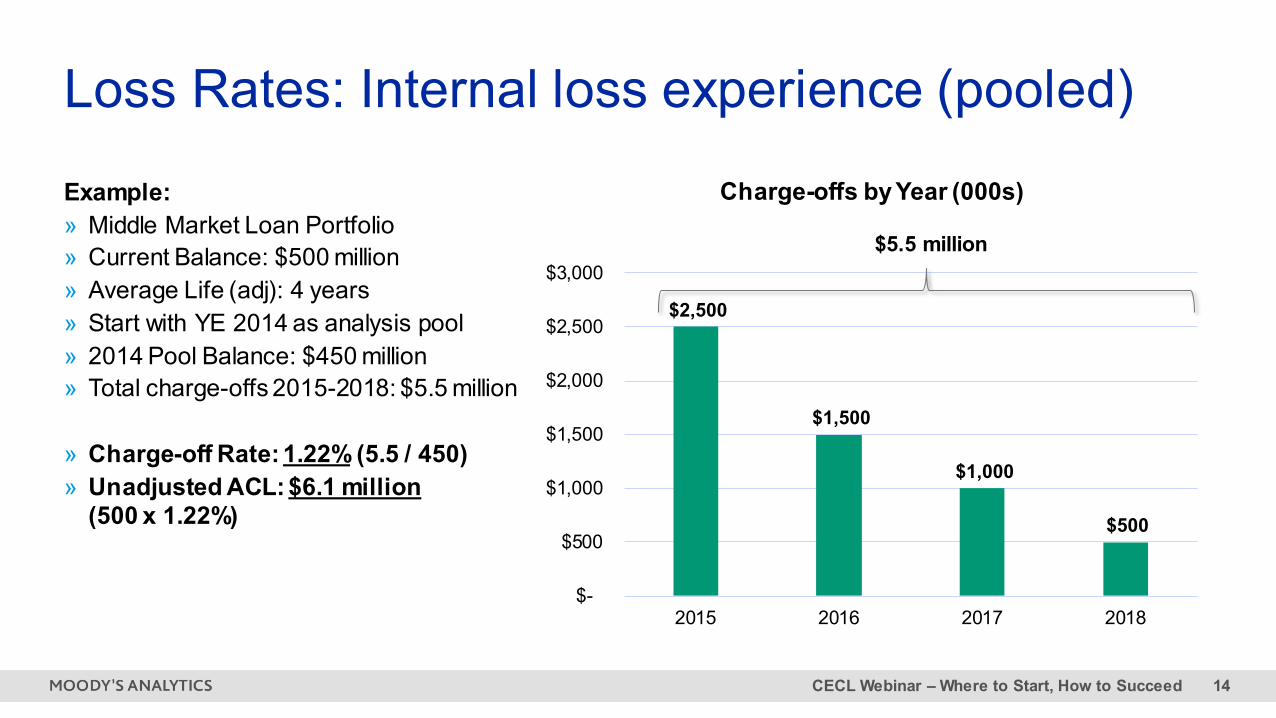
Loss Rates: Internal loss experience (pooled)
Example:» Middle Market Loan Portfolio» Current Balance: $500 million » Average Life (adj): 4 years» Start with YE 2014 as analysis pool» 2014 Pool Balance: $450 million» Total charge-offs 2015-2018: $5.5 million
» Charge-off Rate: 1.22% (5.5 / 450)» Unadjusted ACL: $6.1 million
(500 x 1.22%)
$2,500
$1,500
$1,000
$500
$-
$500
$1,000
$1,500
$2,000
$2,500
$3,000
2015 2016 2017 2018
Charge-offs by Year (000s)
$5.5 million

CECL Webinar – Where to Start, How to Succeed 15
0.00%
0.50%
1.00%
1.50%
2.00%
2.50%Annual Net Charge-Off Rate
Industry experience can help offset data limitations
Banks and SIs $1B-$10B
A more relevant benchmark and a slightly different risk metric
Avg. 0.66%
Source: FDIC
All Institutions
Noncurrent loans can serve as a proxy for default in the absence of data
0.00%
0.50%
1.00%
1.50%
2.00%
2.50%
3.00%
3.50%
4.00%Annual Noncurrent Loan Rate
Avg. 1.33%

CECL Webinar – Where to Start, How to Succeed 16
The length of the dataset used can have a material impact on the historical loss rate(s) used
Time
Annu
al L
oss
Rat
e
One and a half credit cycles
One credit cycle
Half credit cycle => high average loss rate
=> lower average loss rate
=> lowest average lowest rate
A longer time series of data may not be as reflective today, but it may prove to be the most accurate over time

CECL Webinar – Where to Start, How to Succeed 17
Assigning loss rate factors to internal ratings can differentiate loans by risk profile and type
Rating CRE - Construction CRE - Stabilized C&I - Working Capital Rating Distribution1 0.33% 0.05% 0.10% 1%2 0.69% 0.15% 0.20% 3%3 1.05% 0.35% 0.50% 10%4 2.45% 0.75% 1.00% 35%
5 4.50% 1.25% 1.85% 40%
6 7.25% 2.25% 2.75% 7%7 22.50% 10.00% 15.00% 3%8 50.00% 50.00% 50.00% 1%9 100.00% 100.00% 100.00% 0%

CECL Webinar – Where to Start, How to Succeed 18
… how likely the borrower is to go
into default
… the estimate of loss (1-recovery)
should default occur
… the amount of the credit exposure
Probability of Default (%)
Loss Given Default (%)
Exposure Amount ($)
= ∑ x xPD LGD Exposure
On average, the amount we could potentially lose
depends on four things …
Expected Credit Loss ($)
ECL
Measuring credit risk using a PD and LGD approach has become industry standard
3% 30% $1 millionxx=$9 thousand
0.90% Expected Loss (%)

CECL Webinar – Where to Start, How to Succeed 19
Internal ratings or scores can be mapped to quantitative risk measures, like PDs
Aaa Aa A Baa Ba B Caa_C0.00% 0.02% 0.02% 0.12% 0.56% 2.35% 7.88%
Average annual credit loss rates by letter rating (1983-2018)
Aaa
Aa
A
Baa
Ba
B
Caa
C
Score
30.50%
7.90%
3.50%
0.75%
0.20%
0.08%
0.05%
0.03%
Scale PD
87.35 - 100
75.20 - 87.34
60.15 - 75.19
50.05 - 60.14
41.07 - 50.04
25.78 - 41.06
13.55 - 25.77
0 - 13.54
By assigning a PD (or loss rate) to each borrower (or loan), you can further differentiate the level of credit risk within the portfolio

CECL Webinar – Where to Start, How to Succeed 20
Sector-level data can be used to improve the accuracy of the PD’s (align with an average)
NAICS SectorNAICS
(2-digit)
Annual Default Rate (Illustrative)
Agriculture, Forestry, Fishing and Hunting 11 1.61%Mining 21 2.82%Utilities 22 0.90%Construction 23 3.21%Manufacturing 31 - 33 2.16%Wholesale Trade 42 2.11%Retail Trade 44 - 45 2.56%Transportation and Warehousing 48 - 49 3.39%Information 51 2.94%Finance and Insurance 52 2.02%Real Estate Rental and Leasing 53 2.38%Professional, Scientif ic, and Technical Services 54 2.44%Management of Companies and Enterprises 55 1.36%Administrative and Support and Waste Management and Remediation Services 56 2.42%Educational Services 61 1.39%Health Care and Social Assistance 62 1.32%Arts, Entertainment, and Recreation 71 2.00%Hospitality 72 2.66%Other Services (except Public Administration) 81 1.86%Public Administration 92 0.61%
» Calculate the amount of the portfolio in each sector (%)
» Multiply the sector exposure to the sector default rat
» Determine portfolio weighted-average default (or loss) rate for a more “granular” measure of risk for the portfolio
» Can be used as derive a long-run average default (or loss) rate, or a central tendency estimate

CECL Webinar – Where to Start, How to Succeed 21
Dual Risk Rating Scorecard Example
Rating Grade PD (1 Year) Rating
Grade
1 0.08% 12 0.14% 23 0.25% 34 0.43% 45 0.75% 56 1.31% 67 2.30% 78 4.02% 89 7.04% 9
10 12.31% 10… … …
Custom Qualitative Factors
Quantitative Risk Measure (EDF%)
Quantitative Model
Qualitative Score (0–100)
Borrower Rating
Total Score
Custom Qualitative Factors
Quantitative Risk Measure (EDF%)
Quantitative Model
Qualitative Score (0–100)
Borrower Rating
Total Score
Commercial Real Estate Loan Commercial & Industrial Loan
Master Rating Scale
Consistent grades across the entire loan portfolio

CECL Webinar – Where to Start, How to Succeed 22
Example of a PD and LGD Rating Scale
A B C D E F G5% 15% 20% 25% 35% 45% 55%
1 Pass 0.08% 0.00% 0.01% 0.02% 0.02% 0.03% 0.04% 0.04%2 Pass 0.14% 0.01% 0.02% 0.03% 0.04% 0.05% 0.06% 0.08%3 Pass 0.25% 0.01% 0.04% 0.05% 0.06% 0.09% 0.11% 0.13%4 Pass 0.43% 0.02% 0.06% 0.09% 0.11% 0.15% 0.19% 0.24%5 Pass 0.75% 0.04% 0.11% 0.15% 0.19% 0.26% 0.34% 0.41%6 Pass 1.31% 0.07% 0.20% 0.26% 0.33% 0.46% 0.59% 0.72%7 Pass 2.30% 0.11% 0.34% 0.46% 0.57% 0.80% 1.03% 1.26%8 Pass 4.02% 0.20% 0.60% 0.80% 1.01% 1.41% 1.81% 2.21%9 Pass 7.04% 0.35% 1.06% 1.41% 1.76% 2.46% 3.17% 3.87%
10 OAEM 12.31% 0.62% 1.85% 2.46% 3.08% 4.31% 5.54% 6.77%11 Substandard - A 20.00% 1.00% 3.00% 4.00% 5.00% 7.00% 9.00% 11.00%12 Substandard - NA 35.00% 1.75% 5.25% 7.00% 8.75% 12.25% 15.75% 19.25%13 Doubtful 50.00% 2.50% 7.50% 10.00% 12.50% 17.50% 22.50% 27.50%14 Loss 100.00% 5.00% 15.00% 20.00% 25.00% 35.00% 45.00% 55.00%

Concluding Remarks and Q&A4

CECL Webinar – Where to Start, How to Succeed 24
Banking Industry Growth & Consolidation
-
100
200
300
400
500
600
700
800
-
2,000
4,000
6,000
8,000
10,000
12,000
14,000
16,000
Banks & Bank Mergers(1990-2018)
Commercial Banks and Savings Institutions Mergers
# of comm
ercial banks and savings institutions#
of b
ank
mer
gers
$4T total assets
$17T total assets
15,000 institutions
5,000 institutions
Source: FDIC as of December 31, 2018

CECL Webinar – Where to Start, How to Succeed 25
The starting point will influence the level of your reserves, and more…explore your options
0.00%
0.50%
1.00%
1.50%
2.00%
2.50%
0.00%20.00%40.00%60.00%80.00%100.00%120.00%140.00%160.00%180.00%
Reserves to Loans Coverage
Res
erve
s to
Loa
ns
Reserves to Noncurrent Loans
Banks and SIs $1B-$10B Segment-at-a-glance:» The number of institutions is at an all-time
high (638); among the fastest growing segment in banking
» Assets per employee at an all-time high ($6.5 million; avg. $4.6 million)
» Average loans outstanding is at an all-time high ($1.19 billion)
» Highest % of loans to total assets (71%)
» Among the highest in profitability in recent years (pre-tax ROA 1.7%); Efficiency Ratio declined each year since 2013 (below 60% for the first time since 2007)

CECL Webinar – Where to Start, How to Succeed 26

Moody’s Analytics Countdown to CECL Conference 27
Chief Accountant –Office of Examination & Insurance
NCUA
Alison ClarkEVP and Senior Loan Review Officer
SOUTHSIDE BANK
Anne MartinezMD – Accounting and
Reporting Transformation
DELOITTE
Jonathan PrejeanFormer Chair
FASB
Leslie SeidmanChief Economist
MOODY’S ANALYTICS
Mark Zandi
cecl-conference-2019.moodys.io
Speakers include::


moodysanalytics.com
Robby HolditchDirector+1 (212) [email protected]
Chris HenkelSenior Director+1 (212) [email protected]

CECL Webinar – Where to Start, How to Succeed 30
© 2019 Moody’s Corporation, Moody’s Investors Service, Inc., Moody’s Analytics, Inc. and/or their licensors and affiliates (collectively, “MOODY’S”). All rights reserved.
CREDIT RATINGS ISSUED BY MOODY'S INVESTORS SERVICE, INC. AND ITS RATINGS AFFILIATES (“MIS”) ARE MOODY’S CURRENT OPINIONS OF THE RELATIVE FUTURE CREDIT RISK OF ENTITIES, CREDIT COMMITMENTS, OR DEBT OR DEBT-LIKE SECURITIES, AND MOODY’S PUBLICATIONS MAY INCLUDE MOODY’S CURRENT OPINIONS OF THE RELATIVE FUTURE CREDIT RISK OF ENTITIES, CREDIT COMMITMENTS, OR DEBT OR DEBT-LIKE SECURITIES. MOODY’S DEFINES CREDIT RISK AS THE RISK THAT AN ENTITY MAY NOT MEET ITS CONTRACTUAL, FINANCIAL OBLIGATIONS AS THEY COME DUE AND ANY ESTIMATED FINANCIAL LOSS IN THE EVENT OF DEFAULT. CREDIT RATINGS DO NOT ADDRESS ANY OTHER RISK, INCLUDING BUT NOT LIMITED TO: LIQUIDITY RISK, MARKET VALUE RISK, OR PRICE VOLATILITY. CREDIT RATINGS AND MOODY’S OPINIONS INCLUDED IN MOODY’S PUBLICATIONS ARE NOT STATEMENTS OF CURRENT OR HISTORICAL FACT. MOODY’S PUBLICATIONS MAY ALSO INCLUDE QUANTITATIVE MODEL-BASED ESTIMATES OF CREDIT RISK AND RELATED OPINIONS OR COMMENTARY PUBLISHED BY MOODY’S ANALYTICS, INC. CREDIT RATINGS AND MOODY’S PUBLICATIONS DO NOT CONSTITUTE OR PROVIDE INVESTMENT OR FINANCIAL ADVICE, AND CREDIT RATINGS AND MOODY’S PUBLICATIONS ARE NOT AND DO NOT PROVIDE RECOMMENDATIONS TO PURCHASE, SELL, OR HOLD PARTICULAR SECURITIES. NEITHER CREDIT RATINGS NOR MOODY’S PUBLICATIONS COMMENT ON THE SUITABILITY OF AN INVESTMENT FOR ANY PARTICULAR INVESTOR. MOODY’S ISSUES ITS CREDIT RATINGS AND PUBLISHES MOODY’S PUBLICATIONS WITH THE EXPECTATION AND UNDERSTANDING THAT EACH INVESTOR WILL, WITH DUE CARE, MAKE ITS OWN STUDY AND EVALUATION OF EACH SECURITY THAT IS UNDER CONSIDERATION FOR PURCHASE, HOLDING, OR SALE.
MOODY’S CREDIT RATINGS AND MOODY’S PUBLICATIONS ARE NOT INTENDED FOR USE BY RETAIL INVESTORS AND IT WOULD BE RECKLESS AND INAPPROPRIATE FOR RETAIL INVESTORS TO USE MOODY’S CREDIT RATINGS OR MOODY’S PUBLICATIONS WHEN MAKING AN INVESTMENT DECISION. IF IN DOUBT YOU SHOULD CONTACT YOUR FINANCIAL OR OTHER PROFESSIONAL ADVISER.
ALL INFORMATION CONTAINED HEREIN IS PROTECTED BY LAW, INCLUDING BUT NOT LIMITED TO, COPYRIGHT LAW, AND NONE OF SUCH INFORMATION MAY BE COPIED OR OTHERWISE REPRODUCED, REPACKAGED, FURTHER TRANSMITTED, TRANSFERRED, DISSEMINATED, REDISTRIBUTED OR RESOLD, OR STORED FOR SUBSEQUENT USE FOR ANY SUCH PURPOSE, IN WHOLE OR IN PART, IN ANY FORM OR MANNER OR BY ANY MEANS WHATSOEVER, BY ANY PERSON WITHOUT MOODY’S PRIOR WRITTEN CONSENT.
CREDIT RATINGS AND MOODY’S PUBLICATIONS ARE NOT INTENDED FOR USE BY ANY PERSON AS A BENCHMARK AS THAT TERM IS DEFINED FOR REGULATORY PURPOSES AND MUST NOT BE USED IN ANY WAY THAT COULD RESULT IN THEM BEING CONSIDERED A BENCHMARK.
All information contained herein is obtained by MOODY’S from sources believed by it to be accurate and reliable. Because of the possibility of human or mechanical error as well as other factors, however, all information contained herein is provided “AS IS” without warranty of any kind. MOODY'S adopts all necessary measures so that the information it uses in assigning a credit rating is of sufficient quality and from sources MOODY'S considers to be reliable including, when appropriate, independent third-party sources. However, MOODY’S is not an auditor and cannot in every instance independently verify or validate information received in the rating process or in preparing the Moody’s publications.
To the extent permitted by law, MOODY’S and its directors, officers, employees, agents, representatives, licensors and suppliers disclaim liability to any person or entity for any indirect, special, consequential, or incidental losses or damages whatsoever arising from or in connection with the information contained herein or the use of or inability to use any such information, even if MOODY’S or any of its directors, officers, employees, agents, representatives, licensors or suppliers is advised in advance of the possibility of such losses or damages, including but not limited to: (a) any loss of present or prospective profits or (b) any loss or damage arising where the relevant financial instrument is not the subject of a particular credit rating assigned by MOODY’S.
To the extent permitted by law, MOODY’S and its directors, officers, employees, agents, representatives, licensors and suppliers disclaim liability for any direct or compensatory losses or damages caused to any person or entity, including but not limited to by any negligence (but excluding fraud, willful misconduct or any other type of liability that, for the avoidance of doubt, by law cannot be excluded) on the part of, or any contingency within or beyond the control of, MOODY’S or any of its directors, officers, employees, agents, representatives, licensors or suppliers, arising from or in connection with the information contained herein or the use of or inability to use any such information.
NO WARRANTY, EXPRESS OR IMPLIED, AS TO THE ACCURACY, TIMELINESS, COMPLETENESS, MERCHANTABILITY OR FITNESS FOR ANY PARTICULAR PURPOSE OF ANY SUCH RATING OR OTHER OPINION OR INFORMATION IS GIVEN OR MADE BY MOODY’S IN ANY FORM OR MANNER WHATSOEVER.
Moody’s Investors Service, Inc., a wholly-owned credit rating agency subsidiary of Moody’s Corporation (“MCO”), hereby discloses that most issuers of debt securities (including corporate and municipal bonds, debentures, notes and commercial paper) and preferred stock rated by Moody’s Investors Service, Inc. have, prior to assignment of any rating, agreed to pay to Moody’s Investors Service, Inc. for appraisal and rating services rendered by it fees ranging from $1,500 to approximately $2,500,000. MCO and MIS also maintain policies and procedures to address the independence of MIS’s ratings and rating processes. Information regarding certain affiliations that may exist between directors of MCO and rated entities, and between entities who hold ratings from MIS and have also publicly reported to the SEC an ownership interest in MCO of more than 5%, is posted annually at www.moodys.com under the heading “Investor Relations — Corporate Governance — Director and Shareholder Affiliation Policy.”
Additional terms for Australia only: Any publication into Australia of this document is pursuant to the Australian Financial Services License of MOODY’S affiliate, Moody’s Investors Service Pty Limited ABN 61 003 399 657AFSL 336969 and/or Moody’s Analytics Australia Pty Ltd ABN 94 105 136 972 AFSL 383569 (as applicable). This document is intended to be provided only to “wholesale clients” within the meaning of section 761G of the Corporations Act 2001. By continuing to access this document from within Australia, you represent to MOODY’S that you are, or are accessing the document as a representative of, a “wholesale client” and that neither you nor the entity you represent will directly or indirectly disseminate this document or its contents to “retail clients” within the meaning of section 761G of the Corporations Act 2001. MOODY’S credit rating is an opinion as to the creditworthiness of a debt obligation of the issuer, not on the equity securities of the issuer or any form of security that is available to retail investors. It would be reckless and inappropriate for retail investors to use MOODY’S credit ratings or publications when making an investment decision. If in doubt you should contact your financial or other professional adviser.
Additional terms for Japan only: Moody's Japan K.K. (“MJKK”) is a wholly-owned credit rating agency subsidiary of Moody's Group Japan G.K., which is wholly-owned by Moody’s Overseas Holdings Inc., a wholly-owned subsidiary of MCO. Moody’s SF Japan K.K. (“MSFJ”) is a wholly-owned credit rating agency subsidiary of MJKK. MSFJ is not a Nationally Recognized Statistical Rating Organization (“NRSRO”). Therefore, credit ratings assigned by MSFJ are Non-NRSRO Credit Ratings. Non-NRSRO Credit Ratings are assigned by an entity that is not a NRSRO and, consequently, the rated obligation will not qualify for certain types of treatment under U.S. laws. MJKK and MSFJ are credit rating agencies registered with the Japan Financial Services Agency and their registration numbers are FSA Commissioner (Ratings) No. 2 and 3 respectively.
MJKK or MSFJ (as applicable) hereby disclose that most issuers of debt securities (including corporate and municipal bonds, debentures, notes and commercial paper) and preferred stock rated by MJKK or MSFJ (as applicable) have, prior to assignment of any rating, agreed to pay to MJKK or MSFJ (as applicable) for appraisal and rating services rendered by it fees ranging from JPY200,000 to approximately JPY350,000,000.
MJKK and MSFJ also maintain policies and procedures to address Japanese regulatory requirements.


