CEE DP 118 Do Differences in School's Instruction Time Explain International Achievement Gaps in Maths, Science and Language? Evidence from Developed and Developing Countries Victor Lavy October 2010 ISSN 2045-6557
Transcript
CEE DP 118
Do Differences in School's Instruction Time Explain
All rights reserved. No part of this publication may be reproduced, stored in a retrieval
system or transmitted in any form or by any means without the prior permission in writing of
the publisher nor be issued to the public or circulated in any form other than that in which it
is published.
Requests for permission to reproduce any article or part of the Working Paper should be
sent to the editor at the above address.
The Centre for the Economics of Education is an independent multidisciplinary research
centre. All errors and omissions remain the authors.
Do Differences in School's Instruction Time Explain
International Achievement Gaps in Maths, Science
and Language? Evidence from Developed and
Developing Countries
Victor Lavy
1. Introduction 1
2. Empirical Strategy 4
3. Data 7
4. Results 11
Estimates of the effects of instructional time in OECD countries 11
Robustness of main results and checks for threats of identification 12
Heterogeneous treatment effects 16
Evidence from middle and low income countries 16
Evidence from primary and middle schools in Israel 18
5. Correlates of Productivity Differences of Instructional Time across
Countries 21
6. Conclusions 23
References 25
Tables 27
Appendices 39
Acknowledgments
Victor Lavy is the William Haber Chaired Professor of Economics at the Hebrew University of
Jerusalem, Chaired Professor of Economics at Royal Holloway, University of London and an
Associate of the Centre for the Economics of Education.
1
1 Introduction
There are large differences across countries in instructional time in public schooling institutions.
For example, among European countries such as Belgium, France and Greece, pupils aged 15 have an
average of over a thousand hours per year of total compulsory classroom instruction while in England,
Luxembourg and Sweden the average is only 750 hours per year.1 For children aged 7-8 in England,
Greece, France and Portugal average instructional time is over 800 hours per year while in Finland and
Norway it is less than 600 hours. Similar differences among countries exist in the number of classroom
lessons per week in different subjects as evident from the PISA 2006 data. For example, pupils aged 15
in Denmark are exposed to 4 hours of instruction per week in math and 4.7 in language, while pupils of
the same age in Austria have only 2.7 hours of weekly classroom lessons in math and 2.4 in language.
Overall, total weekly hours of instruction in math, language and science is 55 percent higher in Denmark
(11.5 hours) than in Austria (7.4 hours). Similar magnitudes of disparities in instructional time are
observed among the Eastern European and developing countries that are included in PISA 2006. Can
these large differences explain some of the differences across countries in pupils’ achievements in
different subjects? What is the likely impact of changes in instructional time? This later question is of
policy relevance in many countries, for example, it became very concrete recently in the US as
President Barrack Obama argued that American children should go to school longer, either to stay later
in the day or into the summer. He announced the objective of extending the school week and year as a
central element in his proposed education reform for the US.2
The simple correlations and the simple OLS regression relationship between classroom
instructional time per week and test scores of pupils aged 15 in the 2006 PISA exams in math, science
and language are positive and highly significant. Of course, these correlations do not represent causal
relationships because of potential selection and endogeneity. In this paper, I investigate the causal
relationship between instructional time and pupils' knowledge in these subjects. While research in recent
1 Source: OECD Education at Glance, 2006: http://www.oecd.org/dataoecd/6/47/37344903.xls. 2 President Barrack Obama said recently (March 10, 2009, at a speech to the U.S. Hispanic Chamber of Commerce) that American children should go to school longer — either stay later in the day or into the summer — if they're going to have any chance of competing for jobs and paychecks against foreign kids. He said “We can no longer afford an academic calendar designed when America was a nation of farmers who needed their children at home plowing the land at the end of each day. That calendar may have once made sense, but today, it puts us at a competitive disadvantage. Our children spend over a month less in school than children in South Korea. That is no way to prepare them for a 21st Century economy. The challenges of a new century demand more time in the classroom. If they can do that in South Korea, we can do it right here in the United States of America." He urged administrators to "rethink the school day" to add more class time. He proposed longer class hours as part of a broader effort to improve U.S. schools that he said are falling behind foreign competitors. "Despite resources that are unmatched anywhere in the world, we have let our grades slip, our schools crumble, our teacher quality fall short, and other nations outpace us," Obama said. "In 8th grade math, we've fallen to 9th place. Singapore's middle-schoolers outperform ours three to one. Just a third of our 13- and 14-year olds can read as well as they should.”
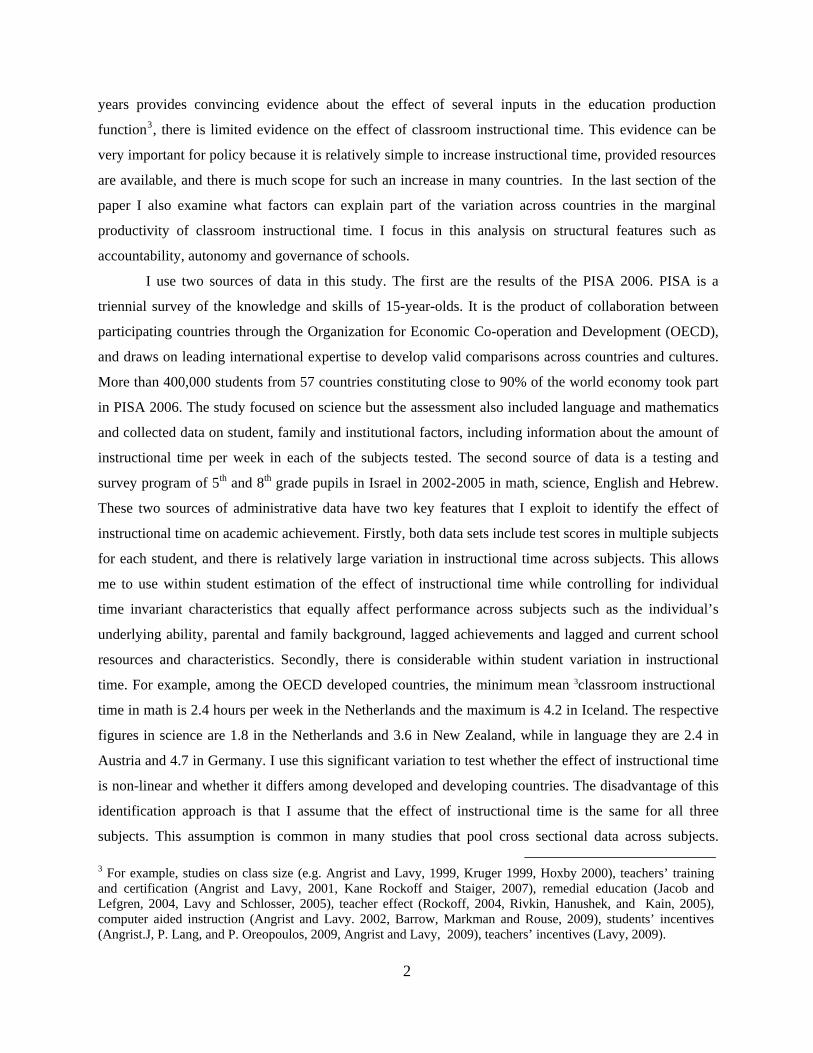
years provides convincing evidence about the effect of several inputs in the education production
function3, there is limited evidence on the effect of classroom instructional time. This evidence can be
very important for policy because it is relatively simple to increase instructional time, provided resources
are available, and there is much scope for such an increase in many countries. In the last section of the
paper I also examine what factors can explain part of the variation across countries in the marginal
productivity of classroom instructional time. I focus in this analysis on structural features such as
accountability, autonomy and governance of schools.
I use two sources of data in this study. The first are the results of the PISA 2006. PISA is a
triennial survey of the knowledge and skills of 15-year-olds. It is the product of collaboration between
participating countries through the Organization for Economic Co-operation and Development (OECD),
and draws on leading international expertise to develop valid comparisons across countries and cultures.
More than 400,000 students from 57 countries constituting close to 90% of the world economy took part
in PISA 2006. The study focused on science but the assessment also included language and mathematics
and collected data on student, family and institutional factors, including information about the amount of
instructional time per week in each of the subjects tested. The second source of data is a testing and
survey program of 5th and 8th grade pupils in Israel in 2002-2005 in math, science, English and Hebrew.
These two sources of administrative data have two key features that I exploit to identify the effect of
instructional time on academic achievement. Firstly, both data sets include test scores in multiple subjects
for each student, and there is relatively large variation in instructional time across subjects. This allows
me to use within student estimation of the effect of instructional time while controlling for individual
time invariant characteristics that equally affect performance across subjects such as the individual’s
underlying ability, parental and family background, lagged achievements and lagged and current school
resources and characteristics. Secondly, there is considerable within student variation in instructional
time. For example, among the OECD developed countries, the minimum mean 3classroom instructional
time in math is 2.4 hours per week in the Netherlands and the maximum is 4.2 in Iceland. The respective
figures in science are 1.8 in the Netherlands and 3.6 in New Zealand, while in language they are 2.4 in
Austria and 4.7 in Germany. I use this significant variation to test whether the effect of instructional time
is non-linear and whether it differs among developed and developing countries. The disadvantage of this
identification approach is that I assume that the effect of instructional time is the same for all three
subjects. This assumption is common in many studies that pool cross sectional data across subjects.
3 For example, studies on class size (e.g. Angrist and Lavy, 1999, Kruger 1999, Hoxby 2000), teachers’ training and certification (Angrist and Lavy, 2001, Kane Rockoff and Staiger, 2007), remedial education (Jacob and Lefgren, 2004, Lavy and Schlosser, 2005), teacher effect (Rockoff, 2004, Rivkin, Hanushek, and Kain, 2005), computer aided instruction (Angrist and Lavy. 2002, Barrow, Markman and Rouse, 2009), students’ incentives (Angrist.J, P. Lang, and P. Oreopoulos, 2009, Angrist and Lavy, 2009), teachers’ incentives (Lavy, 2009).
3
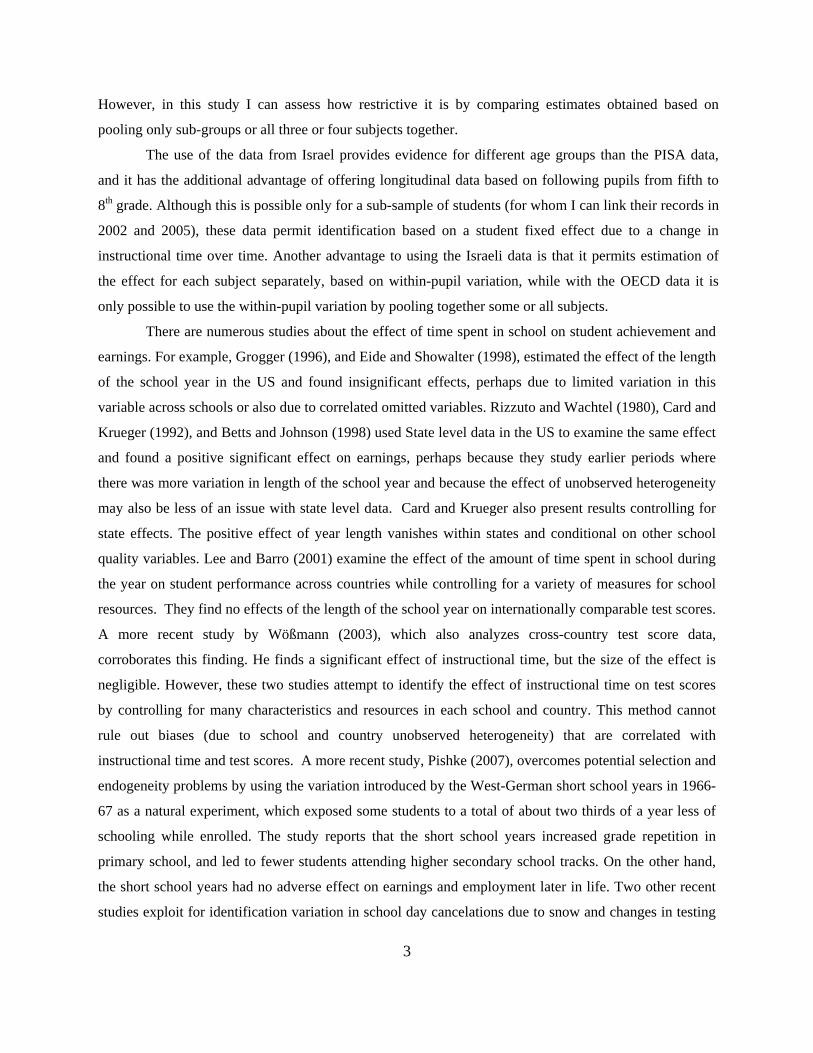
However, in this study I can assess how restrictive it is by comparing estimates obtained based on
pooling only sub-groups or all three or four subjects together.
The use of the data from Israel provides evidence for different age groups than the PISA data,
and it has the additional advantage of offering longitudinal data based on following pupils from fifth to
8th grade. Although this is possible only for a sub-sample of students (for whom I can link their records in
2002 and 2005), these data permit identification based on a student fixed effect due to a change in
instructional time over time. Another advantage to using the Israeli data is that it permits estimation of
the effect for each subject separately, based on within-pupil variation, while with the OECD data it is
only possible to use the within-pupil variation by pooling together some or all subjects.
There are numerous studies about the effect of time spent in school on student achievement and
earnings. For example, Grogger (1996), and Eide and Showalter (1998), estimated the effect of the length
of the school year in the US and found insignificant effects, perhaps due to limited variation in this
variable across schools or also due to correlated omitted variables. Rizzuto and Wachtel (1980), Card and
Krueger (1992), and Betts and Johnson (1998) used State level data in the US to examine the same effect
and found a positive significant effect on earnings, perhaps because they study earlier periods where
there was more variation in length of the school year and because the effect of unobserved heterogeneity
may also be less of an issue with state level data. Card and Krueger also present results controlling for
state effects. The positive effect of year length vanishes within states and conditional on other school
quality variables. Lee and Barro (2001) examine the effect of the amount of time spent in school during
the year on student performance across countries while controlling for a variety of measures for school
resources. They find no effects of the length of the school year on internationally comparable test scores.
A more recent study by Wößmann (2003), which also analyzes cross-country test score data,
corroborates this finding. He finds a significant effect of instructional time, but the size of the effect is
negligible. However, these two studies attempt to identify the effect of instructional time on test scores
by controlling for many characteristics and resources in each school and country. This method cannot
rule out biases (due to school and country unobserved heterogeneity) that are correlated with
instructional time and test scores. A more recent study, Pishke (2007), overcomes potential selection and
endogeneity problems by using the variation introduced by the West-German short school years in 1966-
67 as a natural experiment, which exposed some students to a total of about two thirds of a year less of
schooling while enrolled. The study reports that the short school years increased grade repetition in
primary school, and led to fewer students attending higher secondary school tracks. On the other hand,
the short school years had no adverse effect on earnings and employment later in life. Two other recent
studies exploit for identification variation in school day cancelations due to snow and changes in testing
4
dates. Hansen (2008) use data from two states in the US (Colorado and Maryland) and report that more
instructional time prior to test administration increases student performance. Marcotte and Hemelt
(2008) investigates the reduced form relationship between yearly snowfall and test scores, finding years
with substantial snowfall are associated with lower performance in Maryland.
The results I present in the paper show that instructional time has a positive and significant effect
on the academic achievements of pupils but the estimates are much lower than the ‘naïve’ OLS estimates
which overstate the extent to which countries like the US might “catch up” to other developed nations by
increasing instructional time. The within country within pupil analysis derived both from the 2006 PISA
data of pupils aged 15 and the Israeli data of pupils in 5th and 8th grade yields consistent results. The size
of the estimated effects is modest to large. On average an increase of one hour of instruction per week in
math, science or language raises the test score in these subjects by 0.15 of a standard deviation of the
within student distribution of test scores. The size of the effect is larger for girls, for pupils from low
socio economic status families and for immigrants. Estimates based on the sample of the former Soviet
block eastern European countries are very similar to the average effect obtained from the sample of
OECD developed countries. The evidence based on a sample of developing countries suggests a much
lower effect of instructional time on test scores, on average one additional instructional hour improves
test scores by 0.075 standard deviation of the within pupil test score distribution. In similarity to the
OECD results, the effect is much larger for girls, for pupils from disadvantaged backgrounds and for
immigrants. Overall, the main results presented in the paper are very robust to a variety of robustness
checks with respect to the identification assumptions and to threats to their validity. The evidence from
Israel add to the credibility of the results based on the PISA data as they yield very similar estimates of
the effect of instructional time on pupil achievements. The estimates are consistent across primary and
middle schools and across the various methods of identification and estimation.
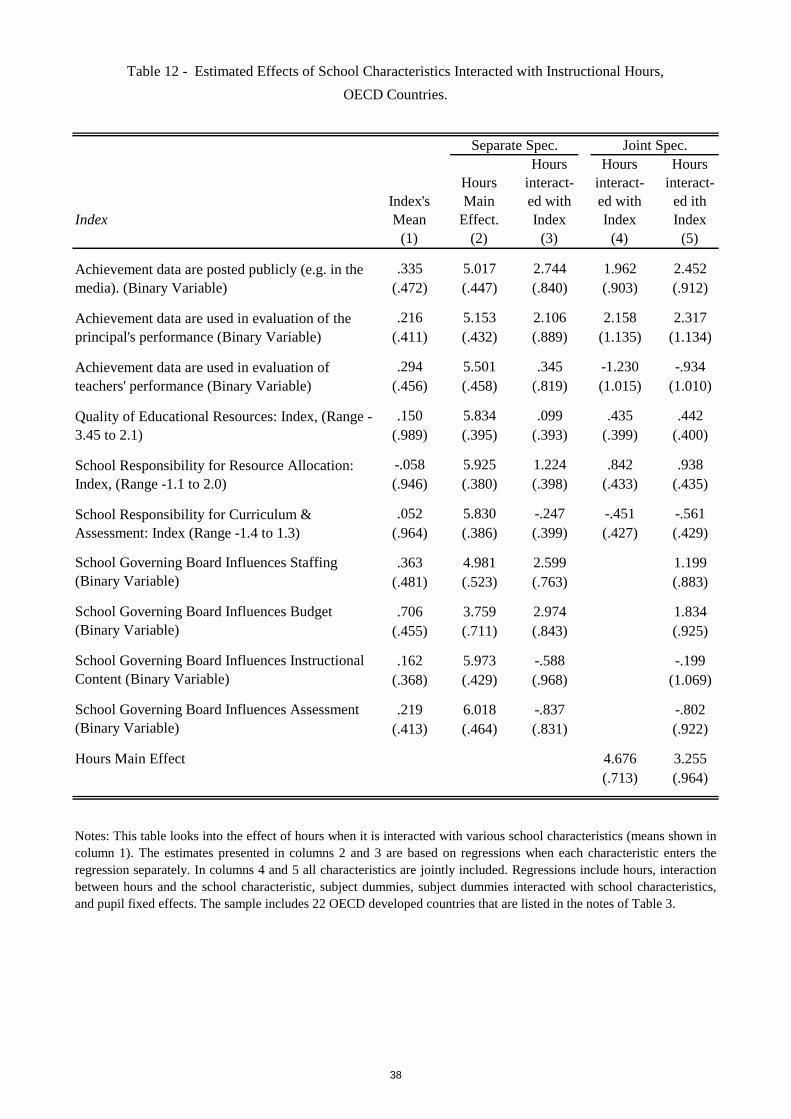
In the second part of the paper, I investigate whether the estimated effect of instructional time
varies by certain characteristics of the labor market for teachers and of the school environment. I use
information from PISA 2006 about school accountability measures and the degree of school autonomy
such as the role of schools in hiring and firing teachers and in determining wages of teachers. The main
effects of these characteristics, which vary by school, are absorbed in the estimation by the school fixed
effect but I am able to estimate the effect of their interactions with instructional time in each subject. The
evidence suggest that the productivity of instructional time is higher in schools that operate under well
defined accountability measures, and in schools that enjoy extensive autonomy in budgetary decisions
and in hiring and firing teachers.
5
The rest of the paper is organized as follows: Section 2 describes the identification strategy.
Section 3 discusses the data, the construction of the analysis samples, and presents various pieces of
evidence that assess the validity of the identification strategy. Section 4 reports the pupil cross section
fixed effects estimates of the effect of instructional time in each subject using the three international
samples of countries, while section 5 presents evidence based on Israeli data. Section 6 shows results
about the correlations of the average productivity of instructional time with schools and teachers’ labor
market characteristic. Section 7 concludes.
2 Empirical Strategy
The effects of unobserved correlated factors usually confound the effect of instructional time on
students’ outcomes. Such correlations could result if self-selection and sorting of students across schools
are affected by school resources or if there is a correlation between school instructional time and other
characteristics of the school that may affect students’ outcomes. One possible method to account for both
sources of confounding factors in the estimation of instructional time is to rely on within-student
variations in instructional time across various subjects of study. Based on this approach, I examine
whether differences in a student between subjects are systematically associated with differences between
subjects in instructional time. The basic idea for identification is that the student’s characteristics, ability,
and the school environment are the same for all three subjects except for the fact that some subjects have
more instructional time than the other subjects do. Of course, it could be that at the school level, such
variation is not purely random but the cause of such selection across schools is constant for each student
in school and therefore does not vary within each student. Based on this approach I present within
student estimates of the effect of instructional time on individual test scores using the following panel
Where Aijk is the achievement of the ith student, in the jth school, in the kth subject, Hkj is instructional time
in the kth subject in the jth school, X is a vector of characteristics of the ith student in the jth school and Sj is
a vector of characteristics of the jth school. εj and ηk represent the unobserved characteristics of the
school and the subject, respectively, and uijk is the remaining unobserved error term. The student fixed
effect μi captures the individual’s family background, underlying ability, motivation, and other constant
non-cognitive skills. Note that by controlling for this individual fixed effect, using within-student across
subjects' variation in test scores, I also control for the school fixed effect ε j. Therefore, exploiting within-
student variation allows for the controlling of a number of sources of potential biases related to
unobserved characteristics of the school, the student or their interaction. Firstly, students might be placed
6
or be sorted according to their ability across schools that provide more (less) instructional time in some
subjects. If, for example, more able students attend better schools who provide more instructional hours
overall in each subject, it would cause γ to be downward biased unless the effect of student and school
fixed effects are accounted for. The bias will have an opposite sign if the less able students are exposed
to more instructional time. Identification of the effect of instructional time based on a comparison of the
performance of the same student in different subjects is therefore immune to biases due to omitted school
level characteristics, such as resources, peer composition and so on, or to omitted individual background
characteristics, such as parental schooling and income.4
I should make here three important remarks about this identification strategy. First, the necessary
assumption for this identification strategy is that the effect of instructional time is the same for all
subjects, implying that γ cannot vary by subject. Although this restriction is plausible, in the analysis that
follows I will provide some evidence to support this conjecture. Second, the effect of instructional time is
‘net’ of instructional time spillovers across subjects, (e.g. instruction time in language might influence
pupils’ test scores in Mathematics). Third, the pupil fixed effect framework does not preclude the
possibility that pupils select or are sorted across schools partly based on subject-specific instructional
time. Stated differently, pupils who are high ability, for example, in math may select or be placed in a
school that specialize in math and have more instructional time in math. This concern may be less
relevant in the sample that I use for two reasons. First, such tacking is mostly within schools and I
measure instructional time in each subject by the school level means and not by the class means or even
the within school program level means. Secondly, the pupils in the sample are age 15 and therefore most
are still in 9th grade. In most countries, 9th grade is part of middle school or lower secondary school while
schools that specialize in a given subject are mostly upper secondary schools, from 10th grade on.
Moreover, I am able to stratify the sample according to good proxies of whether the school sorts and
selects students based on subject specific considerations. For example, I observe in the PISA data
information of whether the school considers for admission the student's academic record, whether the
school considers for admission the student’s need or desire for a special program, whether it uses
tracking in forming classes and whether it is a public or a private school. I assume that a school that do
not use academic ability as criterion for admission or that in this process it does not take into account
student’s desire for a particular program, will most likely not select students on subject specific
considerations. Such selection is also less likely to take place in schools that do not use any form of
4 Since the treatment variable, instructional time, is measured at the school level, the error term, uijk, is clustered by school to capture common unobservable shocks to students at the same school.
7
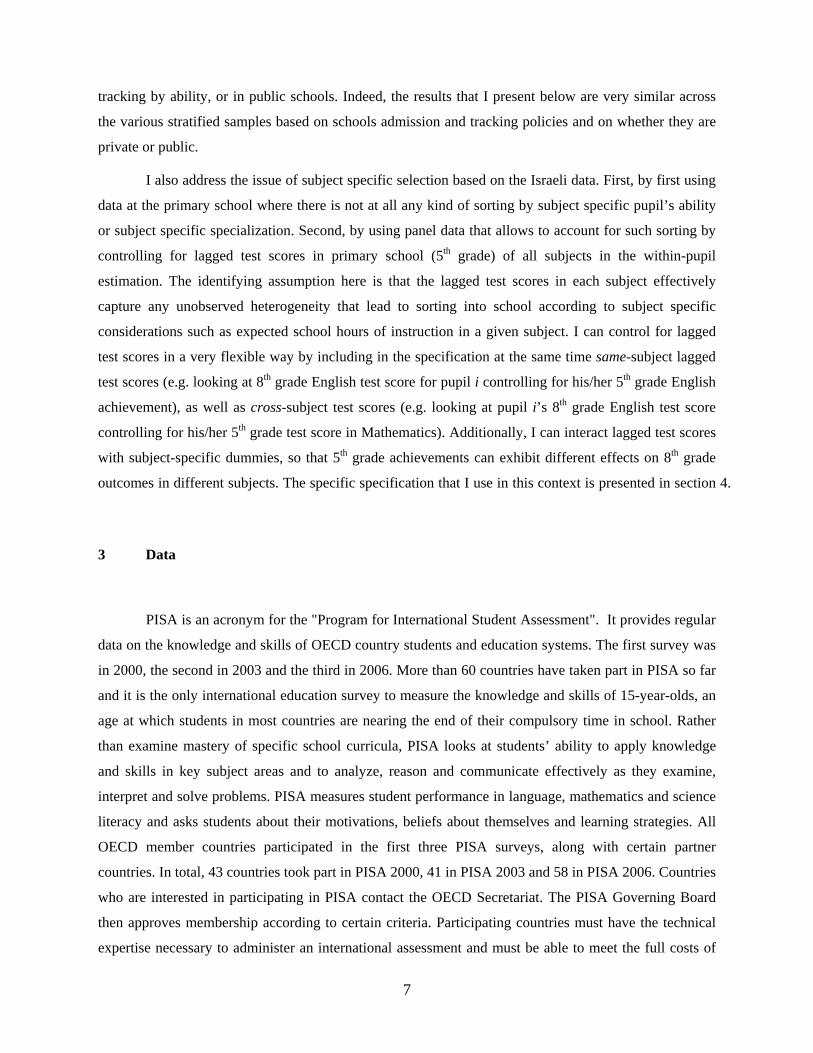
tracking by ability, or in public schools. Indeed, the results that I present below are very similar across
the various stratified samples based on schools admission and tracking policies and on whether they are
private or public.
I also address the issue of subject specific selection based on the Israeli data. First, by first using
data at the primary school where there is not at all any kind of sorting by subject specific pupil’s ability
or subject specific specialization. Second, by using panel data that allows to account for such sorting by
controlling for lagged test scores in primary school (5th grade) of all subjects in the within-pupil
estimation. The identifying assumption here is that the lagged test scores in each subject effectively
capture any unobserved heterogeneity that lead to sorting into school according to subject specific
considerations such as expected school hours of instruction in a given subject. I can control for lagged
test scores in a very flexible way by including in the specification at the same time same-subject lagged
test scores (e.g. looking at 8th grade English test score for pupil i controlling for his/her 5th grade English
achievement), as well as cross-subject test scores (e.g. looking at pupil i’s 8th grade English test score
controlling for his/her 5th grade test score in Mathematics). Additionally, I can interact lagged test scores
with subject-specific dummies, so that 5th grade achievements can exhibit different effects on 8th grade
outcomes in different subjects. The specific specification that I use in this context is presented in section 4.
3 Data
PISA is an acronym for the "Program for International Student Assessment". It provides regular
data on the knowledge and skills of OECD country students and education systems. The first survey was
in 2000, the second in 2003 and the third in 2006. More than 60 countries have taken part in PISA so far
and it is the only international education survey to measure the knowledge and skills of 15-year-olds, an
age at which students in most countries are nearing the end of their compulsory time in school. Rather
than examine mastery of specific school curricula, PISA looks at students’ ability to apply knowledge
and skills in key subject areas and to analyze, reason and communicate effectively as they examine,
interpret and solve problems. PISA measures student performance in language, mathematics and science
literacy and asks students about their motivations, beliefs about themselves and learning strategies. All
OECD member countries participated in the first three PISA surveys, along with certain partner
countries. In total, 43 countries took part in PISA 2000, 41 in PISA 2003 and 58 in PISA 2006. Countries
who are interested in participating in PISA contact the OECD Secretariat. The PISA Governing Board
then approves membership according to certain criteria. Participating countries must have the technical
expertise necessary to administer an international assessment and must be able to meet the full costs of
8
participation. To take part in a cycle of PISA, countries must join two years before the survey takes
place.
Each OECD country participating in PISA has a representative on the PISA Governing Board,
appointed by the country’s education ministry. Guided by the OECD’s education objectives, the Board
determines the policy priorities for PISA and makes sure that these are respected during the
implementation of each PISA survey. For each survey, an international contractor (usually made up of
testing and assessment agencies) has been responsible for the survey design and implementation.
Working with the OECD Secretariat, the PISA Governing Board and the international contractor, the
PISA National Project Managers oversee the implementation of PISA in each participating country.
PISA has Subject Matter Expert Groups for its three key areas of testing – language, mathematics and
science literacy – as well as for other subjects when appropriate (problem solving in PISA 2003, for
example). These groups include world experts in each area. They design the theoretical framework for
each PISA survey.
The international contractor randomly selects schools in each country. The tests are administered
to students who are between 15 years 3 months and 16 years 2 months of age at the time of the test,
rather than to students in a specific year of school. This average age of 15 was chosen because at this age
young people in most OECD countries are nearing the end of compulsory education. The selection of
schools aims to be representative of the respective population of schools and students. To date, PISA has
used pencil-and-paper tests. The tests are made up of both multiple-choice questions and questions
requiring students to construct their own responses. The material is organized around texts and
sometimes includes pictures, graphs or tables setting out real-life situations. Each PISA survey includes
about seven hours of test material. From this, each student takes a two-hour test, with the actual
combination of test materials different for every student. All PISA countries are invited to submit
questions to the international contractor; in addition, the international contractor also writes some
questions. The questions are reviewed by the international contractor and by participating countries and
are carefully checked for cultural bias. Only those questions that are unanimously approved are used in
PISA.
Students answer a background questionnaire, providing information about themselves, their
attitudes to learning and their homes. It takes 20-30 minutes to complete. In addition, school principals
are given a 20-minute questionnaire about their schools.
Each country has its own group of test markers, overseen by the country’s National Project
Manager. They mark the PISA tests using a guide developed by the international contractor and the PISA
Subject Experts (with input from all participating countries). Other experts crosscheck the corrections.
9
The results are then sent to the international contractor, who in turn transmits the final data to the OECD
Secretariat. The average score among OECD countries is 500 points and the standard deviation is 100
points. The results from PISA can be compared across the surveys, as can some of the background
questionnaire items.
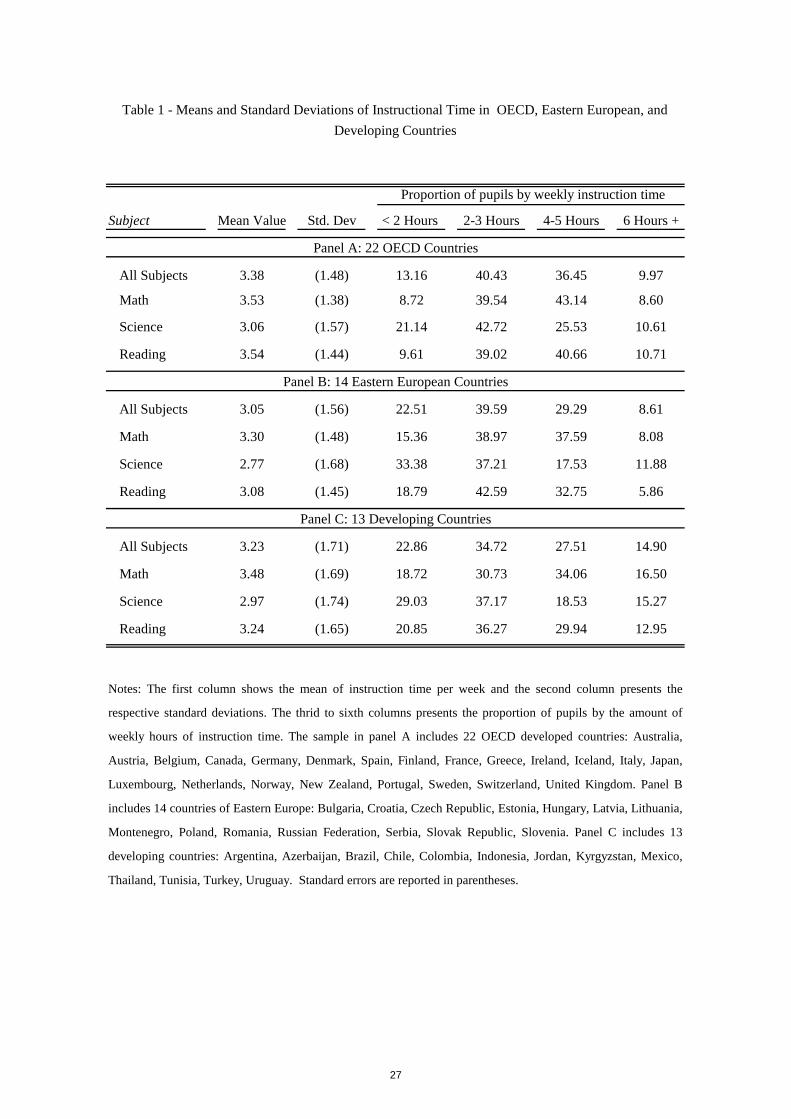
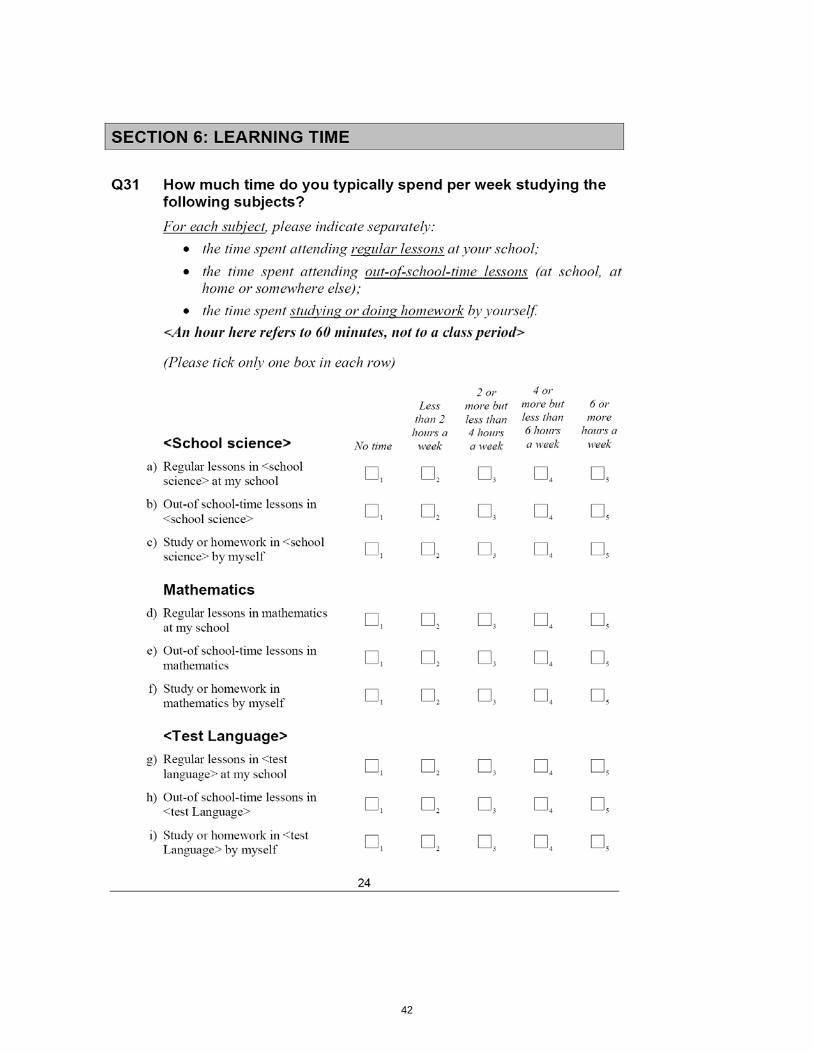
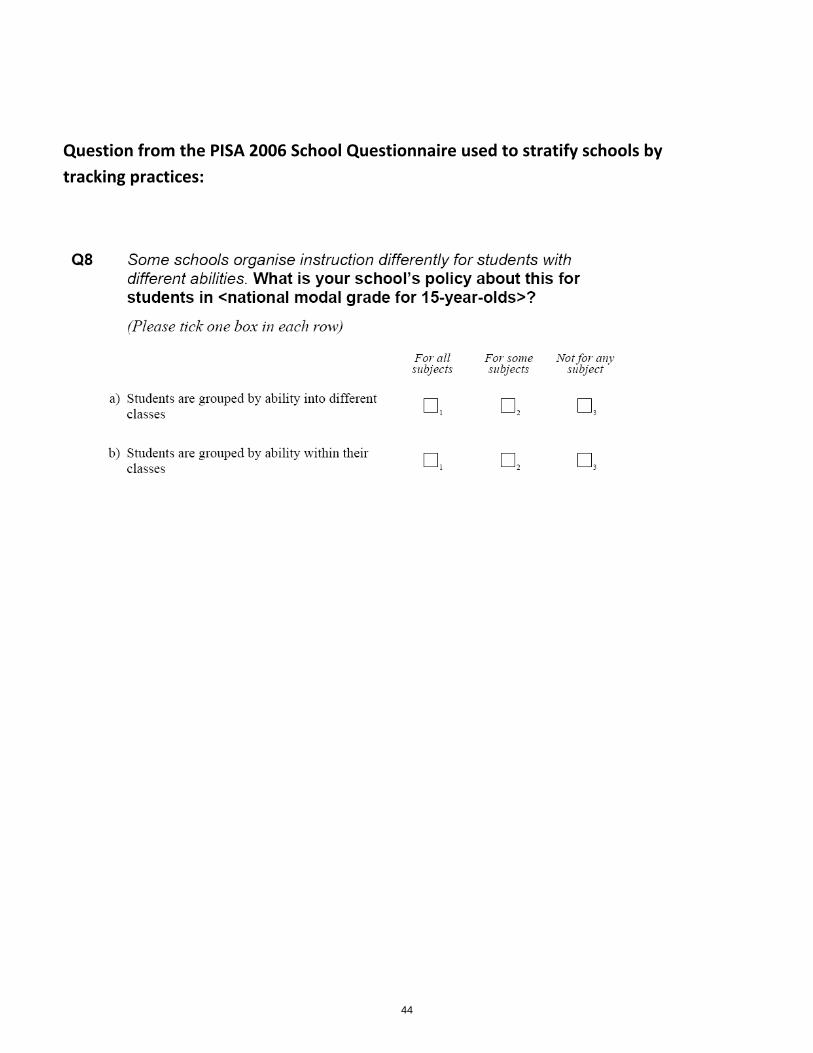
Table 1 reports the distribution of instructional time in each of the three international samples of
countries in the 2006 PISA based on the pupil level data. Each pupil replied to the following question
(see on line appendix for the exact format of this question in the PISA 2006 student’s questionnaire):
“How much time do you typically spend per week studying the following subjects in regular lessons in at
school?” The student could choose from the following options: No time, Less than 2 hours a week, 2 or
more but less than 4 hours a week, 4 or more but less than 6 hours a week, or more hours a week. I
merged the first two options into one as less than two hours a week and used the other categories as is. I
computed the school average in each subject using the mid values of each range. Two remark about the
accuracy of these instruction time measures. Since the PISA data allows to compute overall instruction
time per week in all subjects together, I have aggregated and averaged this information at the country
annual level for all OECD countries and the correlation of these country means with the administrative
data on total annual hours of instruction in secondary schooling reported in the OECD report Education
at Glance is very high. Second, the analysis with the Israeli data for primary and middle school is based
on administrative data of instruction time. As will be shown below the results based on this data are very
much in line with the evidence based on PISA 2006 data.
The means of instructional time in the developed OECD countries in math, science and language
are 3.53, 3.06 and 3.54 hours, respectively. In the Eastern European’s sample mean instructional time in
math are 3.30, in science 2.77 and in language 3.08, lower than in the OECD countries in all subjects.
Mean instructional time in the sample of developing countries is similar to the means in the Eastern
Europe sample, math - 3.48, science - 2.97 and language - 3.24. Surprisingly, the respective means of
instructional time in four new-industrialized East Asian countries, Macao-China, Korea, Hong Kong and
Chinese Taipei, are much higher, and they are similar to the means of the developing countries sample.
Tables A1-A3 in the online appendix present the mean instructional time in each of the subjects
for each of the countries included in the three samples of the 2006 PISA. As discussed in the introduction
there is large variation across countries in each of the three groups of countries. There also large
variation within countries across subjects and as a result a significant proportion of the overall variation
in instruction time is due to the variation within countries between schools (evidence not shown here but
available from the author). A key question of course is how are decisions about instructional time made.
It is probably a fairly complex process that will vary both across and within nations. One potential factor
10
explaining this variation that we can explore based on the PISA data is variation due to the variation in
total instruction time per week over all subjects of study in school. The question about instruction time
provides us with information about regular lessons in other subjects so that adding this with instruction
time in math, science, and language sums up to total weekly instruction time in school. Apparently, large
part of the variation across subjects in instruction time is explained by variation across schools in total
instruction time per week. The variation in total weekly instruction time across schools originates
naturally from many sources, for example differential government resource allocation to schools by their
socio-economic background, differential contribution from parents and the community of local school
authority and more. Much of these factors vary at the school or country level and our identification
methodology will account for them because of the within school and pupil estimation strategy. It is also
important to note in this regard that the PISA sample in each country includes 9th and 10th grade students
and the curriculum of study at this age in most or all countries is completely compulsory. It is only at the
latter part of high school, perhaps at 11th and 12th grade that students get to choose some of their
coursework. Therefore the variation in subject instruction hours across students in the same school is not
due to an endogenous decision of pupils though it could be due to tracking practices in schools. We will
examine directly how sensitive are our results to differences in tracking practices across schools. It is
also important to note again that the measure of instruction time in each subject is the average in the
school and not the hours reported by each student. Another important comment about the measure of
instruction time is that its weekly time dimension is not a limitation for the purpose I use it here, again
because of the within pupil estimation strategy that I adopt in this study. There are as noted in the
introduction differences across countries in the length of the school year (number of weeks of study) but
this is a fix factor that is the same for all schools in the country and for all four subjects which is netted
out in the within estimation strategy.
Tables A1-A3 in the online appendix present as well the country means of the test scores in each
of the subjects for each of the countries. PISA assesses how far students near the end of compulsory
education have acquired knowledge and skills tin reading, mathematical and scientific literacy, not
merely in terms of mastery of the school curriculum, but also in terms of important knowledge and skills
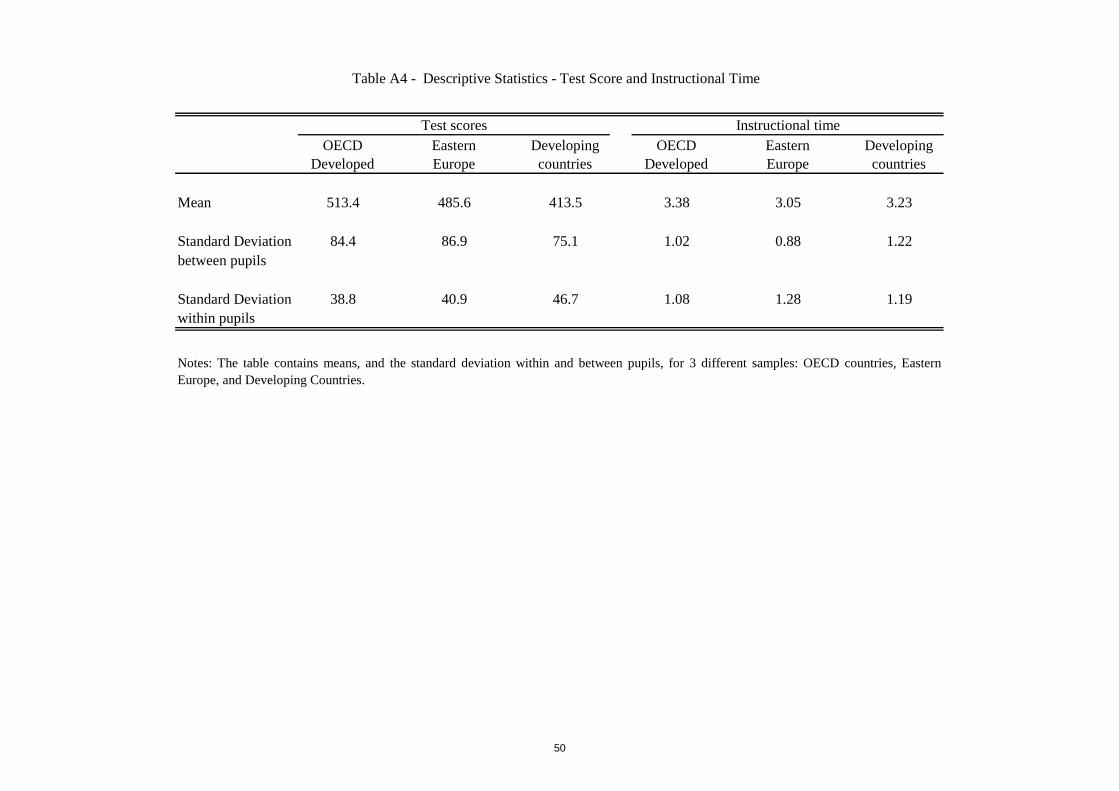
needed in adult life. In Table A4 in the online appendix, I present the means of the test score and the
instruction time variables for all three samples of countries. The average test score in the developed
OECD countries is 513.4, the standard deviation in test scores between pupils is 84.4, and most relevant
for our analysis, the within student standard deviation in test scores is almost half as large, 38.8. In short,
there is considerable variation in test scores within the same pupil to explain. The average instructional
time per subject in the OECD sample is 3.38 hours, and the within pupil standard deviation in
11
instructional time is 1.02 — comparable in magnitude to the standard deviation in instructional time
between students, 1.08. The rest of Table A4 in the online appendix presents the evidence for the Eastern
Europe and developing countries samples. No dramatic differences are observed in the within and
between pupil standard deviations of these two samples in comparison to the OECD sample.
4 Results
Estimates of the effects of instructional time in OECD countries
Table 2 reports the estimated coefficients of instructional time from subject specific test scores
regressions based on the sample of the OECD countries. For each subject I report estimates from three
specifications: firstly without any controls, secondly with country fixed effects and thirdly with country
fixed effects and pupil characteristics. The first row presents the OLS estimates when instructional time
is measured in hours per week. The following two rows report estimates when three indicators, one for
each for the following groups, measure instructional time: less than 2 hours per week, 2-3 hours per
week, and 4+ hours. The first group indicator is the omitted group in the regression.
The estimated effects of instructional time presented in Table 2 are all positive, very large,
always significantly different from zero and not dramatically sensitive to the addition of controls to the
regression. For example, the estimate for total instructional time in mathematics is 21.69 with no
controls, 27.98 with country fixed effects and 24.45 with the addition of student’s controls. In science,
the respective estimates are about 25-30 percent higher than in math. The language estimates are much
lower than in math and science. The estimates of the instructional time’ indicators presented in panel II
show that the largest marginal effect of one additional hour of instruction is when classroom hours are
increased from less than 2 hours to 2-3 hours. In math for example, such a change is associated with an
increase in test scores of about 0.5 of the standard deviation (s.d) of between pupils test score distribution
and more than a standard deviation of the within pupils test score distribution. We will see below that the
OLS estimates are highly biased upward.
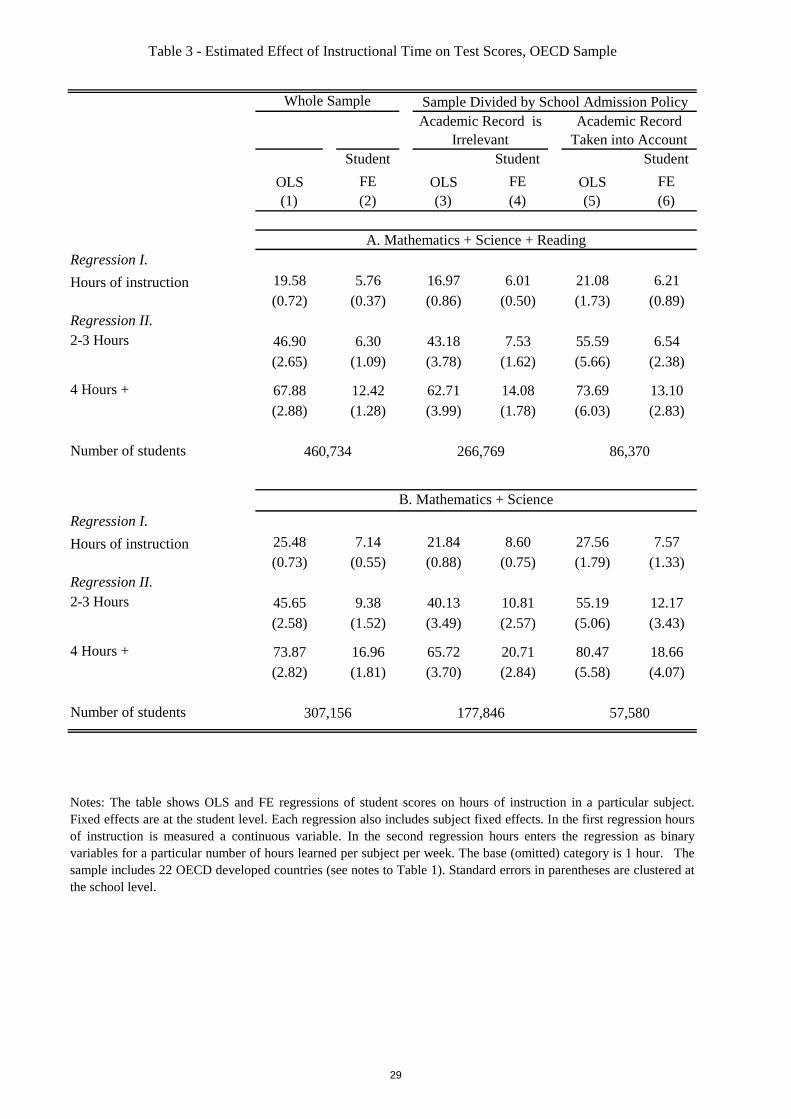
Column 1 in Table 3 presents estimates from regressions based on a pooled sample of all three
subjects (with subject fixed effects included as controls) while column 2 presents estimates when student
fixed effects are included. The OLS estimates in column 1 are very similar to the estimates presented in
Table 2. The within-student estimates in column 2 are all positive and much smaller than the OLS
estimates in column 1 but they are still very precisely measured. Assuming a constant linear effect of
instructional time, the effect of one additional hour of classroom instruction in the within student
regression is 5.76 points. The effect amounts to 0.15 of the standard deviation within pupil and 0.07
standard deviation of the between pupil test score distribution. However, the more relevant scale for the
12
effect size is the within pupil standard deviation as this is the variation that we use to estimate the effect
of instructional time in the within pupil regression.
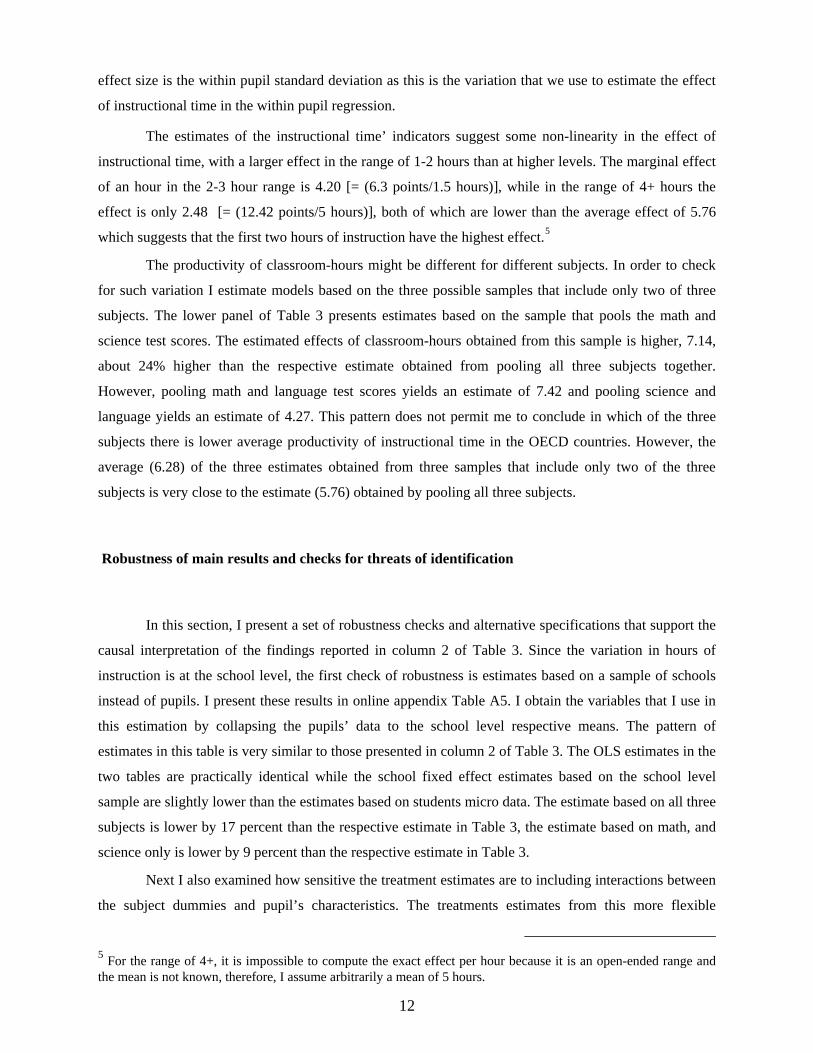
The estimates of the instructional time’ indicators suggest some non-linearity in the effect of
instructional time, with a larger effect in the range of 1-2 hours than at higher levels. The marginal effect
of an hour in the 2-3 hour range is 4.20 [= (6.3 points/1.5 hours)], while in the range of 4+ hours the
effect is only 2.48 [= (12.42 points/5 hours)], both of which are lower than the average effect of 5.76
which suggests that the first two hours of instruction have the highest effect.5
The productivity of classroom-hours might be different for different subjects. In order to check
for such variation I estimate models based on the three possible samples that include only two of three
subjects. The lower panel of Table 3 presents estimates based on the sample that pools the math and
science test scores. The estimated effects of classroom-hours obtained from this sample is higher, 7.14,
about 24% higher than the respective estimate obtained from pooling all three subjects together.
However, pooling math and language test scores yields an estimate of 7.42 and pooling science and
language yields an estimate of 4.27. This pattern does not permit me to conclude in which of the three
subjects there is lower average productivity of instructional time in the OECD countries. However, the
average (6.28) of the three estimates obtained from three samples that include only two of the three
subjects is very close to the estimate (5.76) obtained by pooling all three subjects.
Robustness of main results and checks for threats of identification
In this section, I present a set of robustness checks and alternative specifications that support the
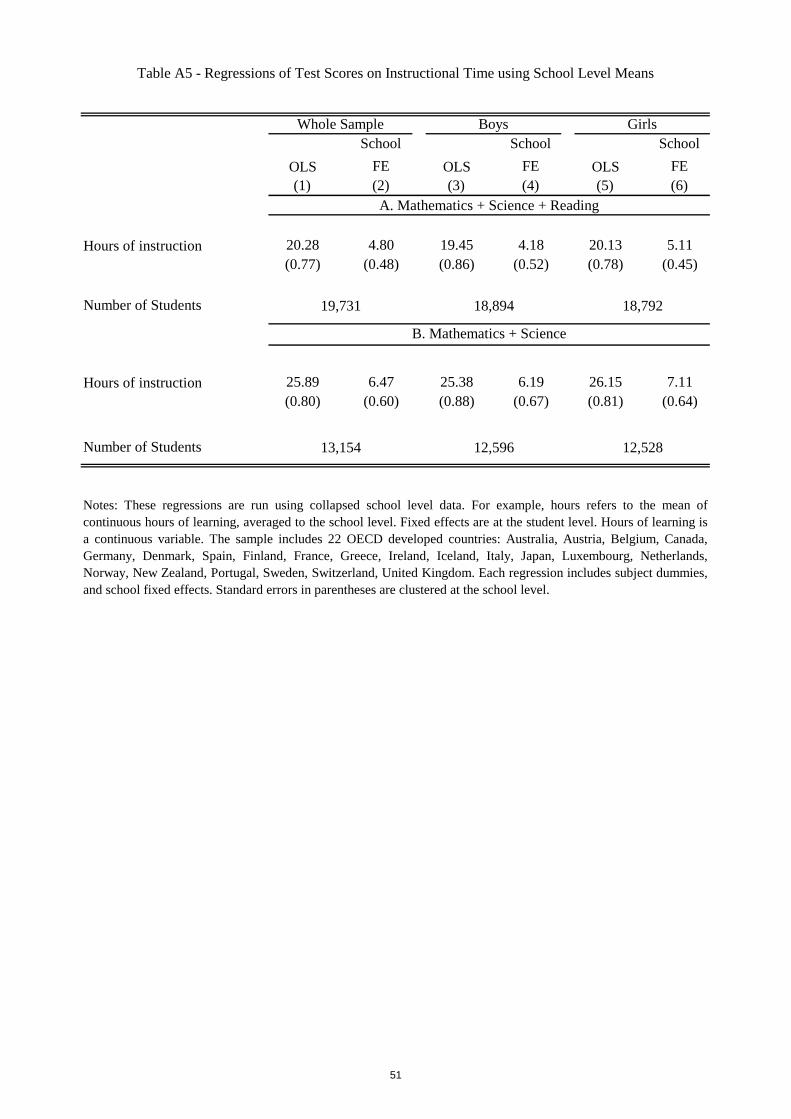
causal interpretation of the findings reported in column 2 of Table 3. Since the variation in hours of
instruction is at the school level, the first check of robustness is estimates based on a sample of schools
instead of pupils. I present these results in online appendix Table A5. I obtain the variables that I use in
this estimation by collapsing the pupils’ data to the school level respective means. The pattern of
estimates in this table is very similar to those presented in column 2 of Table 3. The OLS estimates in the
two tables are practically identical while the school fixed effect estimates based on the school level
sample are slightly lower than the estimates based on students micro data. The estimate based on all three
subjects is lower by 17 percent than the respective estimate in Table 3, the estimate based on math, and
science only is lower by 9 percent than the respective estimate in Table 3.
Next I also examined how sensitive the treatment estimates are to including interactions between
the subject dummies and pupil’s characteristics. The treatments estimates from this more flexible
5 For the range of 4+, it is impossible to compute the exact effect per hour because it is an open-ended range and the mean is not known, therefore, I assume arbitrarily a mean of 5 hours.
13
specification (not shown here and available from the author) are very similar to those presented in Table
3 though overall they are about 10 percent lower.
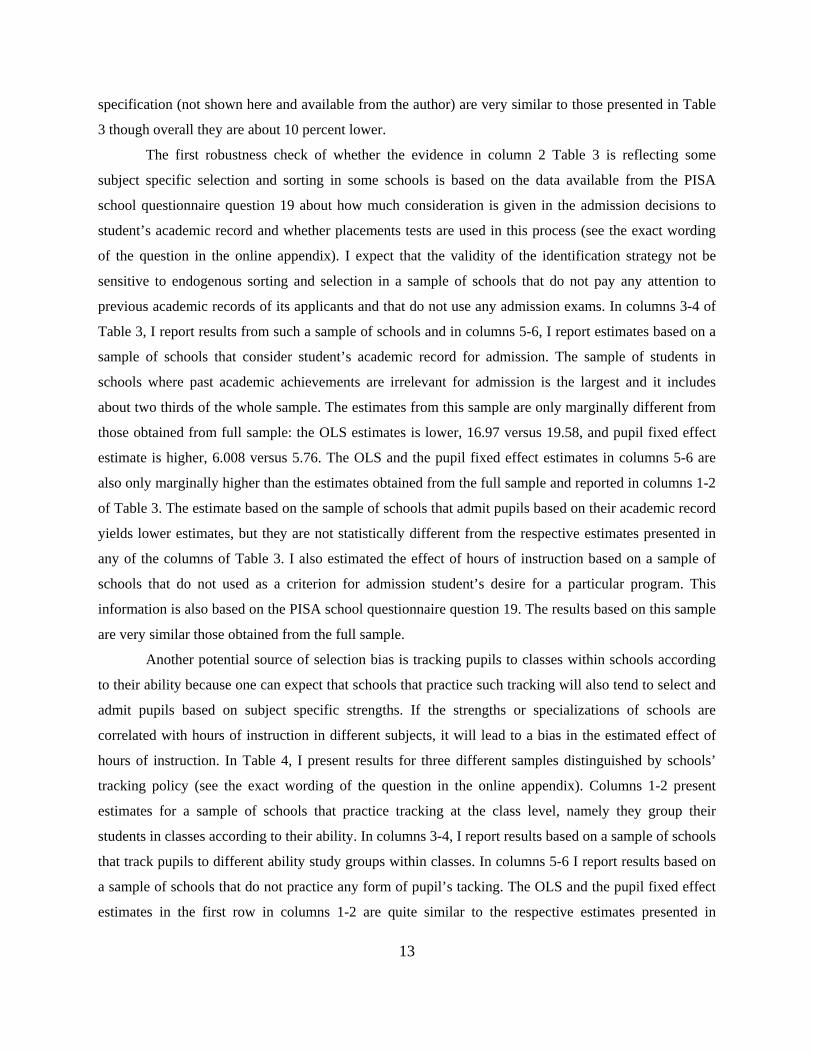
The first robustness check of whether the evidence in column 2 Table 3 is reflecting some
subject specific selection and sorting in some schools is based on the data available from the PISA
school questionnaire question 19 about how much consideration is given in the admission decisions to
student’s academic record and whether placements tests are used in this process (see the exact wording
of the question in the online appendix). I expect that the validity of the identification strategy not be
sensitive to endogenous sorting and selection in a sample of schools that do not pay any attention to
previous academic records of its applicants and that do not use any admission exams. In columns 3-4 of
Table 3, I report results from such a sample of schools and in columns 5-6, I report estimates based on a
sample of schools that consider student’s academic record for admission. The sample of students in
schools where past academic achievements are irrelevant for admission is the largest and it includes
about two thirds of the whole sample. The estimates from this sample are only marginally different from
those obtained from full sample: the OLS estimates is lower, 16.97 versus 19.58, and pupil fixed effect
estimate is higher, 6.008 versus 5.76. The OLS and the pupil fixed effect estimates in columns 5-6 are
also only marginally higher than the estimates obtained from the full sample and reported in columns 1-2
of Table 3. The estimate based on the sample of schools that admit pupils based on their academic record
yields lower estimates, but they are not statistically different from the respective estimates presented in
any of the columns of Table 3. I also estimated the effect of hours of instruction based on a sample of
schools that do not used as a criterion for admission student’s desire for a particular program. This
information is also based on the PISA school questionnaire question 19. The results based on this sample
are very similar those obtained from the full sample.
Another potential source of selection bias is tracking pupils to classes within schools according
to their ability because one can expect that schools that practice such tracking will also tend to select and
admit pupils based on subject specific strengths. If the strengths or specializations of schools are
correlated with hours of instruction in different subjects, it will lead to a bias in the estimated effect of
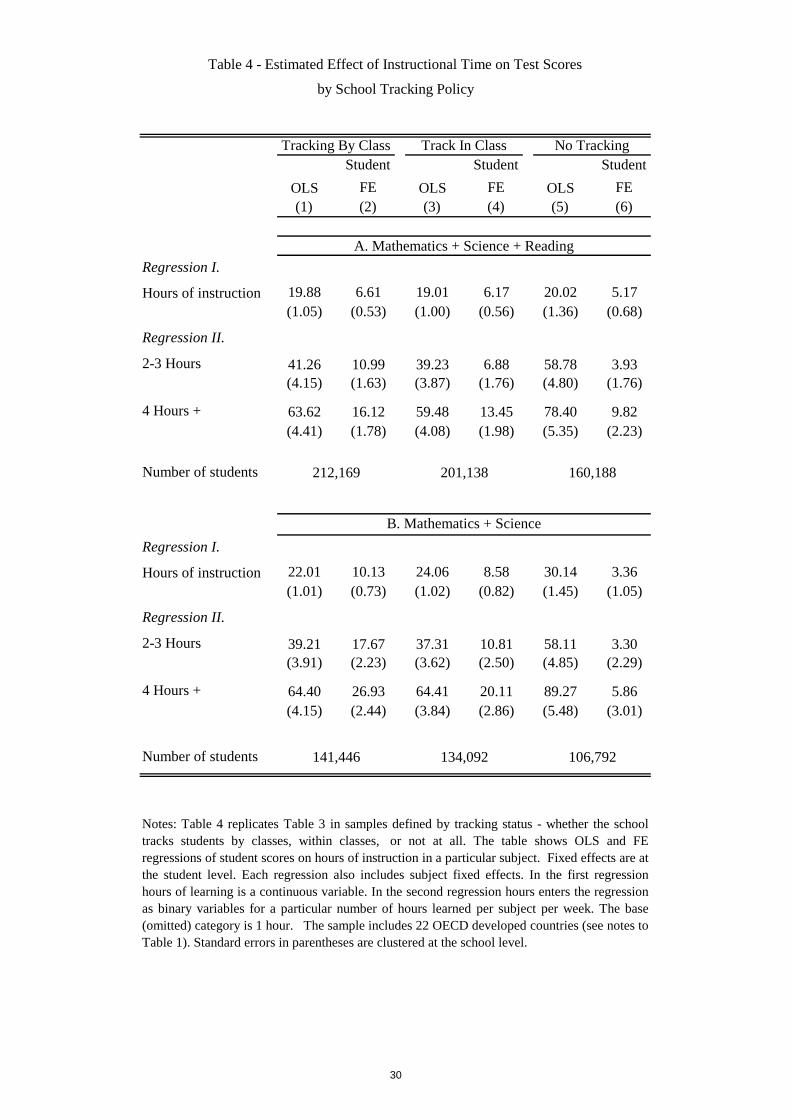
hours of instruction. In Table 4, I present results for three different samples distinguished by schools’
tracking policy (see the exact wording of the question in the online appendix). Columns 1-2 present
estimates for a sample of schools that practice tracking at the class level, namely they group their
students in classes according to their ability. In columns 3-4, I report results based on a sample of schools
that track pupils to different ability study groups within classes. In columns 5-6 I report results based on
a sample of schools that do not practice any form of pupil’s tacking. The OLS and the pupil fixed effect
estimates in the first row in columns 1-2 are quite similar to the respective estimates presented in
14
columns 3-4. They are marginally higher than the estimates obtained from the full sample and reported in
columns 1-2 of Table 3. The sample of schools that track pupils into different classes by ability yields
estimates that are higher by 15 percent than the respective estimates in Table 3 and the sample of schools
that practice within class tracking yields estimates that are higher by 7 percent of the estimates in Table
3. However, in both cases these estimates are not different significantly from the point estimates obtained
from the full sample as the confidence intervals of the latter estimates include the point estimates
obtained from each of these samples. Finally, the effect of instruction hours on test scores in schools that
practice no tracking at all is 5.17, not significantly different from the estimate from the full sample (5.76)
but significantly lower than the estimates obtained for schools which practice tracking between classes.
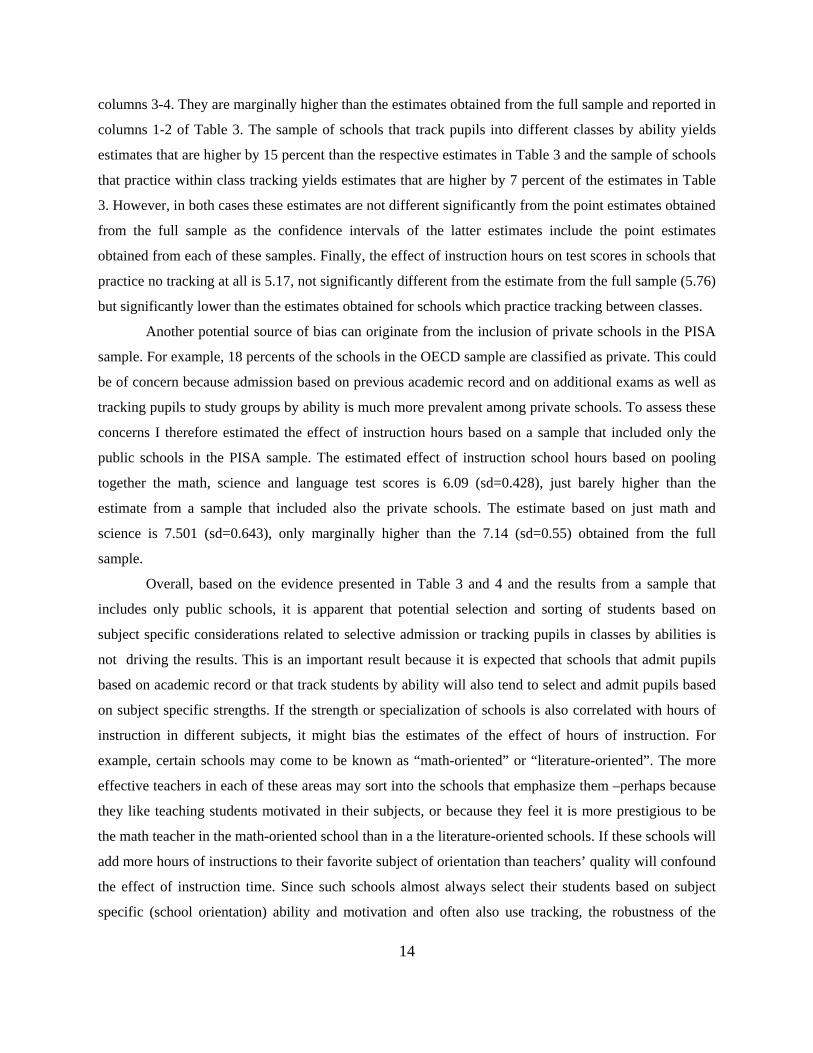
Another potential source of bias can originate from the inclusion of private schools in the PISA
sample. For example, 18 percents of the schools in the OECD sample are classified as private. This could
be of concern because admission based on previous academic record and on additional exams as well as
tracking pupils to study groups by ability is much more prevalent among private schools. To assess these
concerns I therefore estimated the effect of instruction hours based on a sample that included only the
public schools in the PISA sample. The estimated effect of instruction school hours based on pooling
together the math, science and language test scores is 6.09 (sd=0.428), just barely higher than the
estimate from a sample that included also the private schools. The estimate based on just math and
science is 7.501 (sd=0.643), only marginally higher than the 7.14 (sd=0.55) obtained from the full
sample.
Overall, based on the evidence presented in Table 3 and 4 and the results from a sample that
includes only public schools, it is apparent that potential selection and sorting of students based on
subject specific considerations related to selective admission or tracking pupils in classes by abilities is
not driving the results. This is an important result because it is expected that schools that admit pupils
based on academic record or that track students by ability will also tend to select and admit pupils based
on subject specific strengths. If the strength or specialization of schools is also correlated with hours of
instruction in different subjects, it might bias the estimates of the effect of hours of instruction. For
example, certain schools may come to be known as “math-oriented” or “literature-oriented”. The more
effective teachers in each of these areas may sort into the schools that emphasize them –perhaps because
they like teaching students motivated in their subjects, or because they feel it is more prestigious to be
the math teacher in the math-oriented school than in a the literature-oriented schools. If these schools will
add more hours of instructions to their favorite subject of orientation than teachers’ quality will confound
the effect of instruction time. Since such schools almost always select their students based on subject
specific (school orientation) ability and motivation and often also use tracking, the robustness of the
15
evidence presented above with respect to patterns of admission and selection of students based on
academic ability is especially reassuring that the effect of instruction time that I estimate is not capturing
other effects such as teachers’ quality.
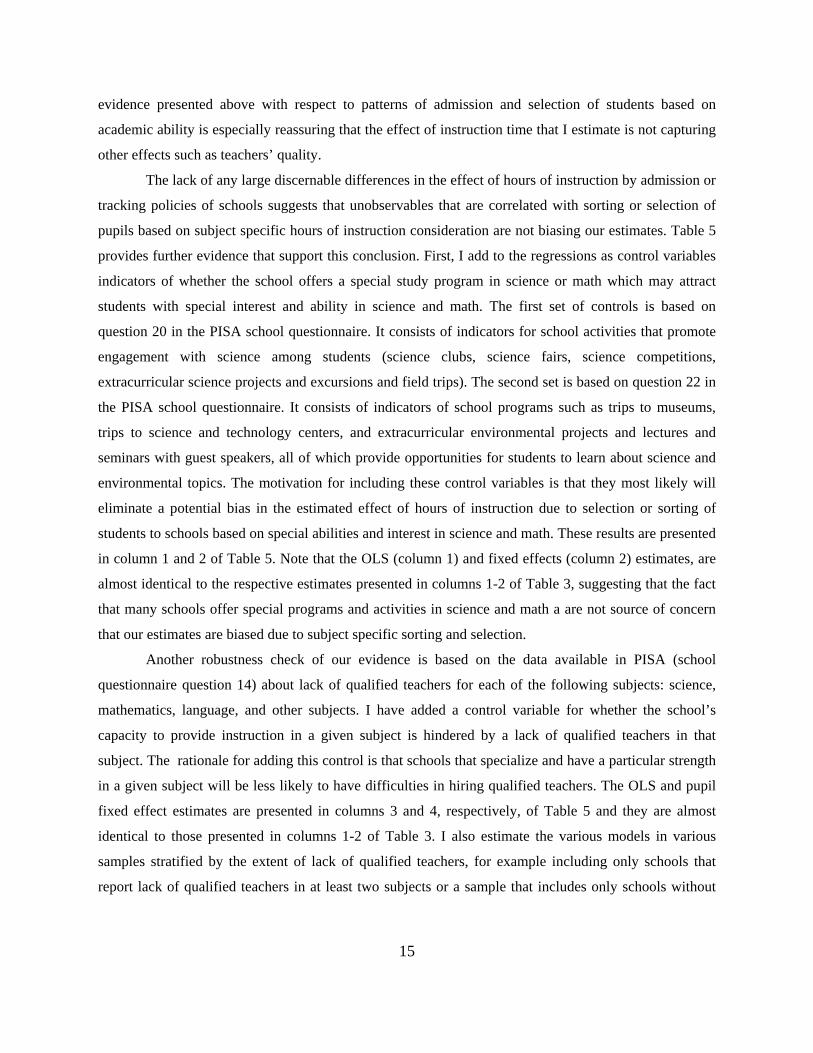
The lack of any large discernable differences in the effect of hours of instruction by admission or
tracking policies of schools suggests that unobservables that are correlated with sorting or selection of
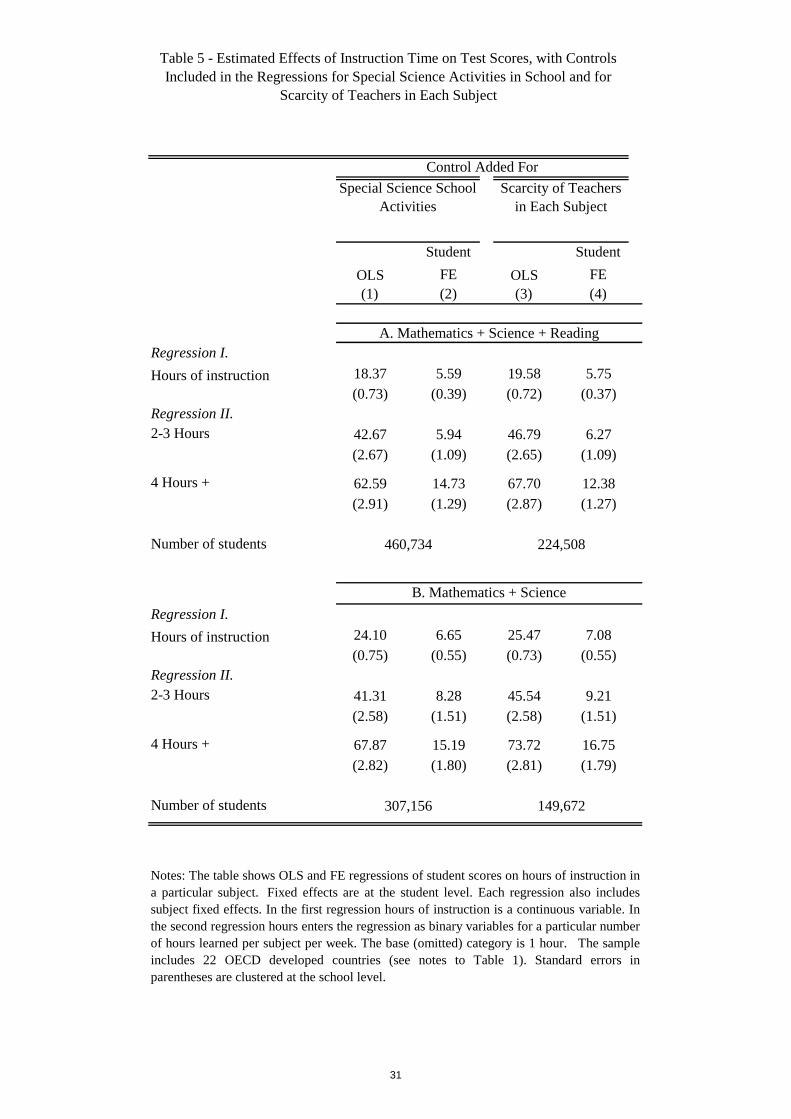
pupils based on subject specific hours of instruction consideration are not biasing our estimates. Table 5
provides further evidence that support this conclusion. First, I add to the regressions as control variables
indicators of whether the school offers a special study program in science or math which may attract
students with special interest and ability in science and math. The first set of controls is based on
question 20 in the PISA school questionnaire. It consists of indicators for school activities that promote
engagement with science among students (science clubs, science fairs, science competitions,
extracurricular science projects and excursions and field trips). The second set is based on question 22 in
the PISA school questionnaire. It consists of indicators of school programs such as trips to museums,
trips to science and technology centers, and extracurricular environmental projects and lectures and
seminars with guest speakers, all of which provide opportunities for students to learn about science and
environmental topics. The motivation for including these control variables is that they most likely will
eliminate a potential bias in the estimated effect of hours of instruction due to selection or sorting of
students to schools based on special abilities and interest in science and math. These results are presented
in column 1 and 2 of Table 5. Note that the OLS (column 1) and fixed effects (column 2) estimates, are
almost identical to the respective estimates presented in columns 1-2 of Table 3, suggesting that the fact
that many schools offer special programs and activities in science and math a are not source of concern
that our estimates are biased due to subject specific sorting and selection.
Another robustness check of our evidence is based on the data available in PISA (school
questionnaire question 14) about lack of qualified teachers for each of the following subjects: science,
mathematics, language, and other subjects. I have added a control variable for whether the school’s
capacity to provide instruction in a given subject is hindered by a lack of qualified teachers in that
subject. The rationale for adding this control is that schools that specialize and have a particular strength
in a given subject will be less likely to have difficulties in hiring qualified teachers. The OLS and pupil
fixed effect estimates are presented in columns 3 and 4, respectively, of Table 5 and they are almost
identical to those presented in columns 1-2 of Table 3. I also estimate the various models in various
samples stratified by the extent of lack of qualified teachers, for example including only schools that
report lack of qualified teachers in at least two subjects or a sample that includes only schools without
16
lack of qualified teachers in any subject. The results obtained from these samples are practically
identical.
Heterogeneous treatment effects
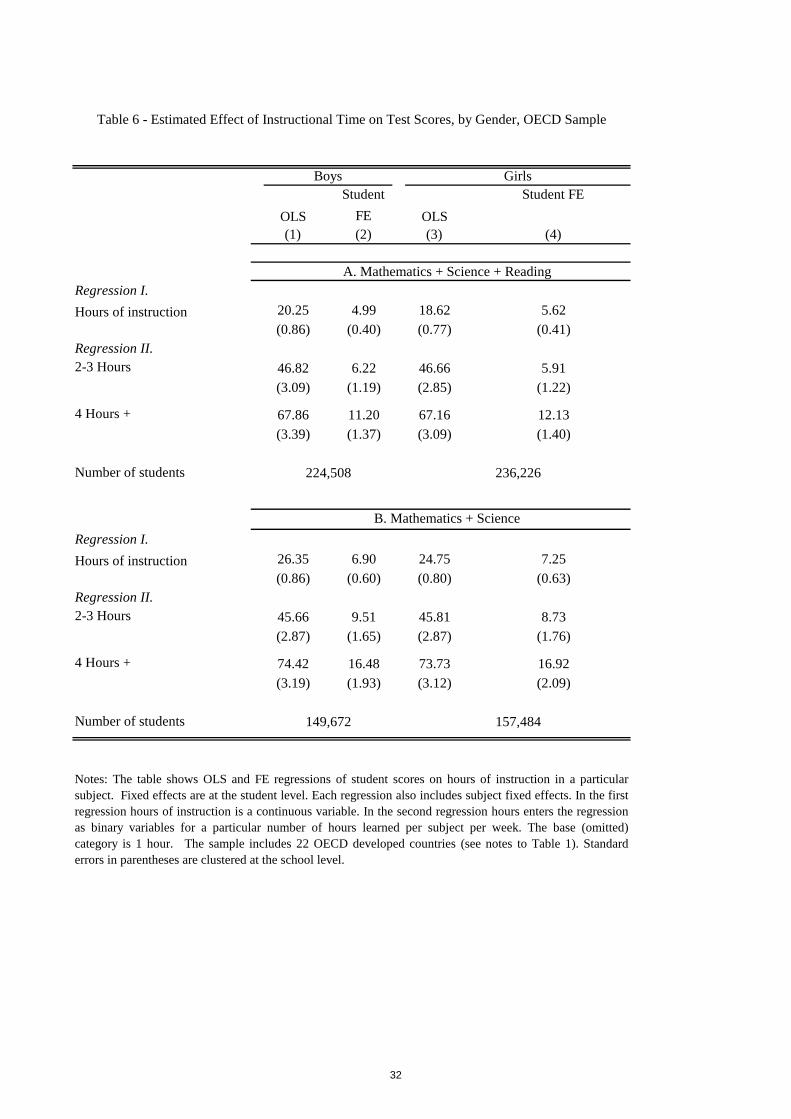
To gain further insights into the effect of instructional time, I explore heterogeneous effects of
classroom hours for different sub-samples. In Table 6, I report separate estimates for boys and for girls.
The estimates show a positive impact of instructional time for both genders but the effect is marginally
higher (by 13%) for girls than for boys but this difference is not significantly different from zero. A
somewhat lower gender difference in the effect of instructional time is observed when only math and
science test scores are pooled jointly in the estimation. This pattern may suggest that the gender related
difference in marginal productivity of instructional time is due to the marginally lower effect of language
classes on boys language proficiency than on girls. The pattern of the non-linear effect further suggests
that most of this gender difference comes from the higher effect of 4+ hours on girls than on boys.
In Table 7, I report results for two sub-samples stratified by the average years of schooling of
both parents and for two sub-samples of immigrants, first generation and second generation. The
productivity of instructional time is clearly higher (35%) for pupils from low education families.
However, again this differential productivity does not exist when only math and science are used in the
estimation, which suggests that pupils from low education families benefit significantly more than other
pupils from additional classroom instruction in language.
Finally, an interesting pattern is seen in the estimated effect of instructional time for immigrants.
Firstly, the estimates are marginally higher for first generation immigrants but they are much higher
(30%) for second-generation immigrants. Secondly, these differences are even larger when these
estimates are based on pooling in the estimation only math and science test scores. Instruction time in
school is 69 percent more productive for second-generation immigrants in comparison to natives (an
estimate of 11.99 versus 7.11). This suggests that the relative gain for an hour of instruction in language
is much lower for second-generation immigrants than for natives.
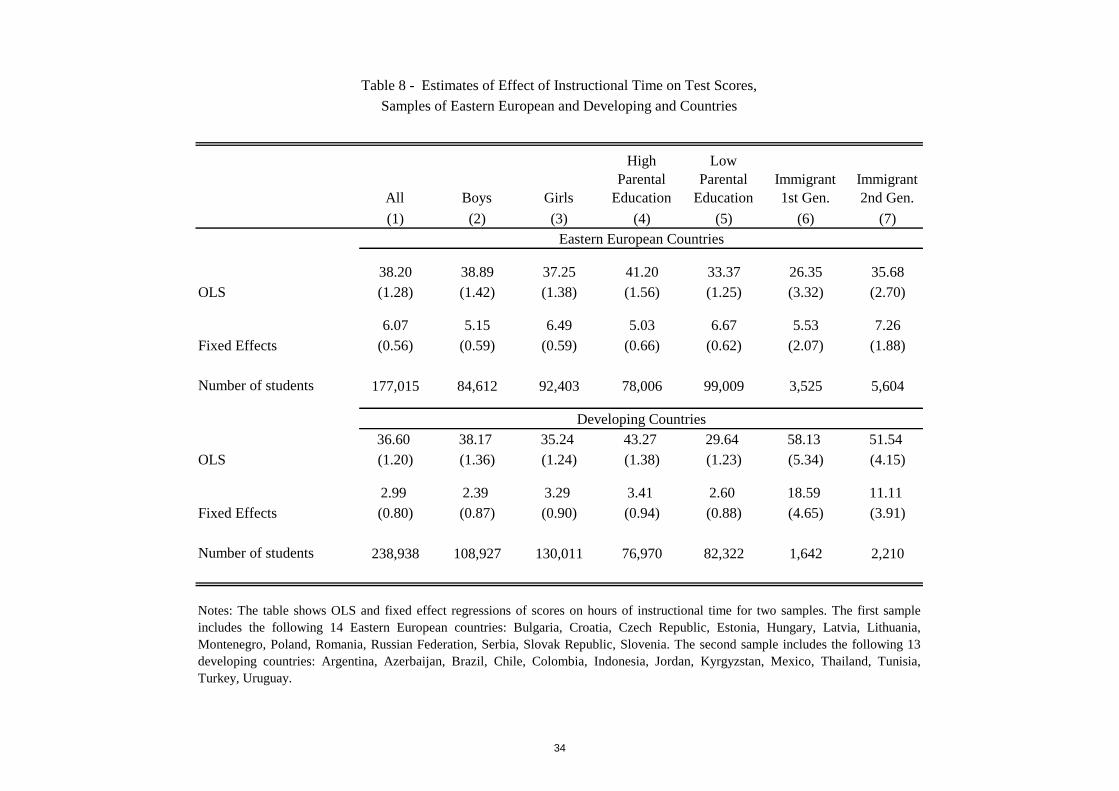
Evidence from middle and low income countries
The first row in Table 8 presents evidence based on a sample of the following middle-income
countries, all former Soviet block: Bulgaria, Czech Republic, Estonia, Croatia, Hungary, Lithuania,
Latvia, Montenegro, Poland, Romania, Russian Federation, Serbia, Slovak Republic and Slovenia. The
mean test scores of the three subjects in this sample are all lower than the respective means of the OECD
developed countries: math - 472.4, science - 480.4, language - 458.3 (see Table A2 in the online
17
appendix). The standard deviations in the pupil level distribution of test scores are similar to those in the
OECD sample, 97.8 in math, 97.9 in science and 105.0 in language.
The OLS estimates of the effect of instructional time are much higher in this sample than in
OECD developed countries. The OLS estimate of the continuous hours of instruction variable is 38.2
versus 19.58 in the OECD sample. However, the within pupil estimate is 6.07, almost identical to the
respective OECD estimate. This suggests that the selection or endogeneity in school resources in the
Eastern European countries are much more important.
The estimate for girls is again higher (26%) than for boys and it is much higher (by 33%) for
pupils from low education families. The higher effect of hours of instruction on second-generation
immigrants is again evident as in the OECD sample.
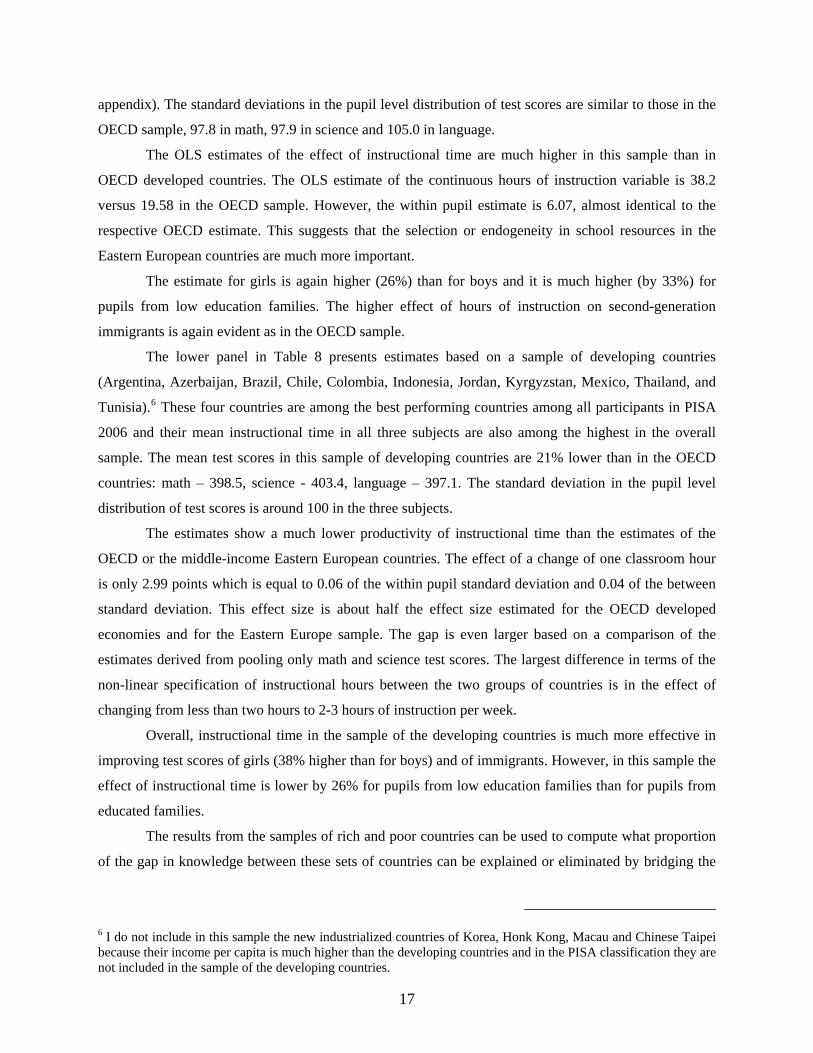
The lower panel in Table 8 presents estimates based on a sample of developing countries
(Argentina, Azerbaijan, Brazil, Chile, Colombia, Indonesia, Jordan, Kyrgyzstan, Mexico, Thailand, and
Tunisia).6 These four countries are among the best performing countries among all participants in PISA
2006 and their mean instructional time in all three subjects are also among the highest in the overall
sample. The mean test scores in this sample of developing countries are 21% lower than in the OECD
countries: math – 398.5, science - 403.4, language – 397.1. The standard deviation in the pupil level
distribution of test scores is around 100 in the three subjects.
The estimates show a much lower productivity of instructional time than the estimates of the
OECD or the middle-income Eastern European countries. The effect of a change of one classroom hour
is only 2.99 points which is equal to 0.06 of the within pupil standard deviation and 0.04 of the between
standard deviation. This effect size is about half the effect size estimated for the OECD developed
economies and for the Eastern Europe sample. The gap is even larger based on a comparison of the
estimates derived from pooling only math and science test scores. The largest difference in terms of the
non-linear specification of instructional hours between the two groups of countries is in the effect of
changing from less than two hours to 2-3 hours of instruction per week.
Overall, instructional time in the sample of the developing countries is much more effective in
improving test scores of girls (38% higher than for boys) and of immigrants. However, in this sample the
effect of instructional time is lower by 26% for pupils from low education families than for pupils from
educated families.
The results from the samples of rich and poor countries can be used to compute what proportion
of the gap in knowledge between these sets of countries can be explained or eliminated by bridging the
6 I do not include in this sample the new industrialized countries of Korea, Honk Kong, Macau and Chinese Taipei because their income per capita is much higher than the developing countries and in the PISA classification they are not included in the sample of the developing countries.
18
gap in instructional time and in its productivity in the different subjects. The mean instructional time in
math, science and language in the rich countries are 3.5, 3.1 and 3.5 while in the poor countries they are
3.5, 3.0 and 3.2. The gap in instructional time is relatively small, 0% in math, 14% in science and 9% in
language. The mean test scores in the developing countries sample are much lower: 398.5 in math, 403.4
in science, and 397.1 in language. Therefore, the gap in mean test scores between the developing and the
OECD developed countries is very large, over 20% and its size is about one standard deviation in each of
the subjects. Obviously, equalizing the instructional time in the poor countries to the level in rich
countries will not significantly eliminate the test score gap between these two parts of the world.
However, the poor countries can reduce this gap by raising the marginal productivity of instructional
time to the level in rich countries. The average instructional time in the three subjects in the developing
countries sample is 3.2. Converging to the productivity of instructional time in the OECD countries will
therefore raise achievements in each of the three subjects by 0.10 of a standard deviation. In section 5, I
will explore what structural changes in the education system in developing countries can lead to
convergence of the productivity of instructional time to the level in the OECD countries.
Evidence from Primary and Middle Schools in Israel
Using Within Student between Subject Variation in Instructional time
Data for elementary and middle schools is based on the GEMS (Growth and Effectiveness
Measures for Schools - Meizav in Hebrew) datasets for the years 2002-2005. The GEMS includes a
series of tests and questionnaires administered by the Division of Evaluation and Measurement of the
Ministry of Education.7 The GEMS is administered at the midterm of each school year to a
representative 1-in-2 sample of all elementary and middle schools in Israel, so that each school
participates in GEMS once every two years. The GEMS student data include test scores of fifth and
eighth graders in math, science, Hebrew, and English. In principle, all students except those in special
education classes are tested and the proportion of students who are tested is above 90 percent. The raw
test scores used a 1-to-100 scale that I transform into z-scores to facilitate interpretation of the results.
The test scores for the years 2002-2005 are linked to student administrative records collected by
the Israel Ministry of Education. The administrative records include student demographics that I use to
construct all measures of students’ background characteristics. Using the linked datasets, I build a panel
for elementary schools and a panel for middle schools. I drop any schools with an annual enrollment
lower than 10 students from the panel. The elementary school panel includes data for 5th grade student
7 The GEMS are not administered for school accountability purposes and only aggregated results at the district level are published. For more information on the GEMS see the Division of Evaluation and Measurement website (in Hebrew): http://cms.education.gov.il/educationcms/units/rama/odotrama/odot.htm.
where p denotes primary school and m denotes middle school. A student fixed effect is differenced out
from this equation. However, I attempted specifications that included as controls the students’
background characteristics, the average characteristics of their cohort in elementary and middle school, a
grade fixed effect, a fixed effect for all students who attended the same primary school and a fixed effect
for all students who attend the same middle school.10 I therefore base the identification on contrasting the
change in hours of instruction in each subject across elementary and middle school, and within students.
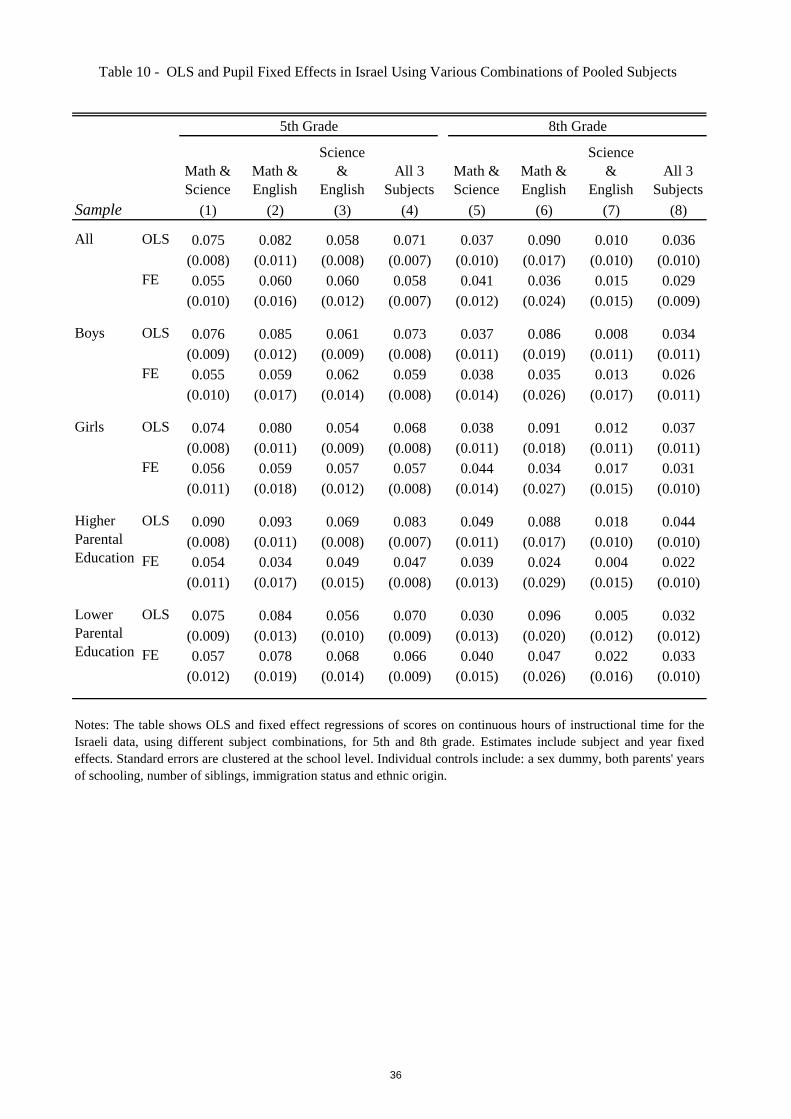
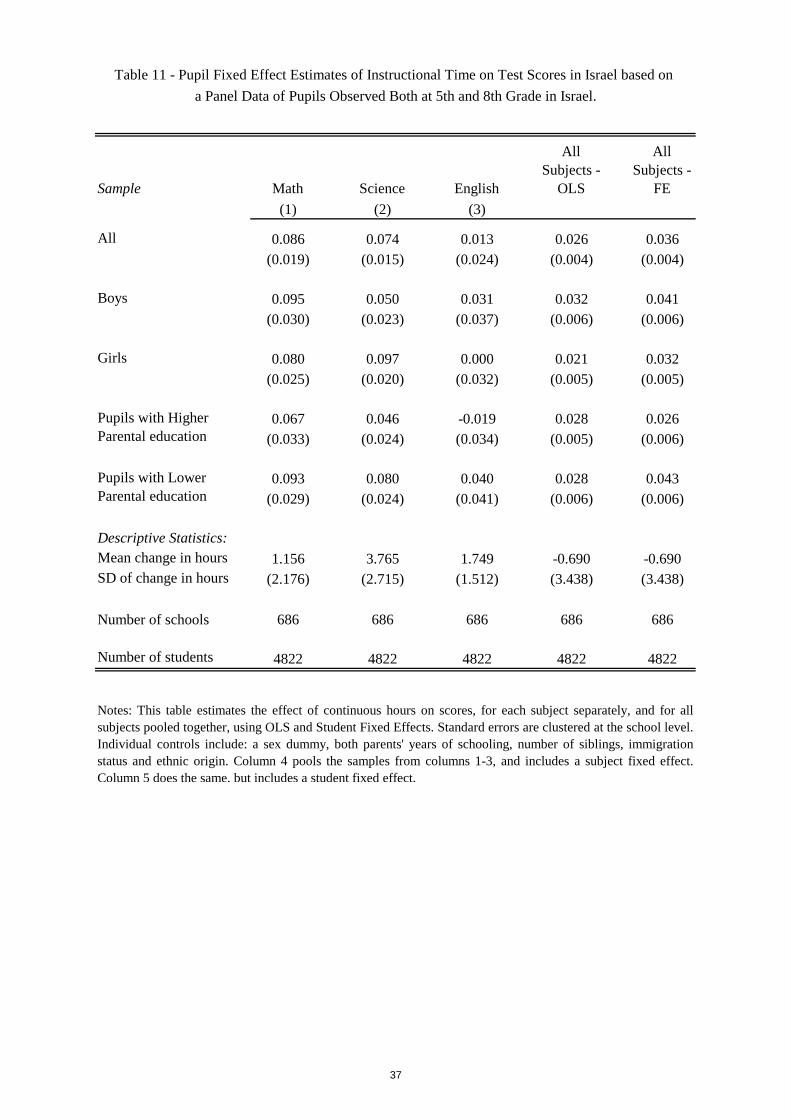
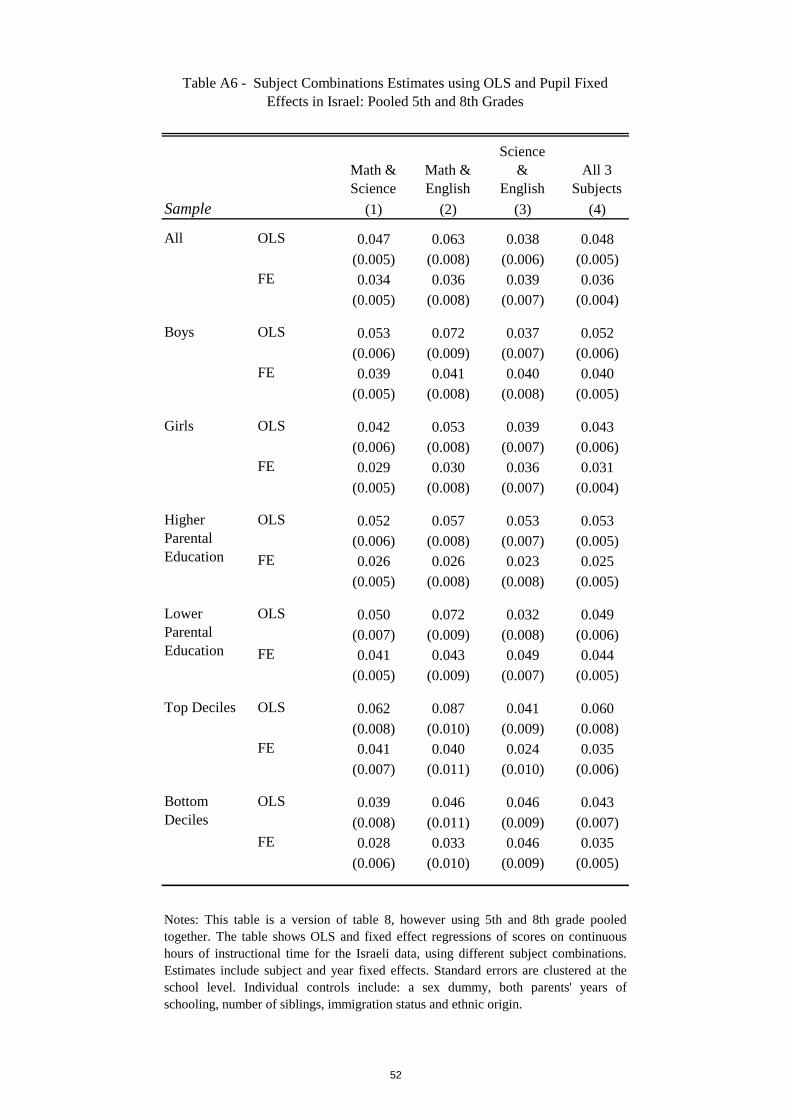
Table 11 presents estimates of γ of equation (2). I actually estimated this parameter using a
model that pools a panel data the 5th and 8th grade information for every pupil and including student fixed
effect as a control. This model yields exactly the same point estimates at equation (2) and it has an
advantage of estimating the correct standard errors. I estimate this model for each subject separately and
for the pool of all test scores. The estimated effect of instructional time is positive and significant in
math, science and it is positive in English as well but it is not precisely measured. The highest estimate is
8 The lower productivity of instruction time in middle school in Israel is consistent with the view that this part of the schooling cycle is the weakest link in the school system and there are discussions and recommendations to abolish it and make the 6-8 grades an integral part of secondary schools. 9 I link only a fourth of the students because except the large cities almost all other localities were sampled once every two years. 10 The results are virtually identical when these controls are omitted from the regression. They are also qualitatively unchanged when I simply include a separate fixed effect for each primary and each middle school.
21
in math and the lowest in English. The estimated effect of instructional time obtained from a sample of
all subjects together is 0.036, which is larger than the estimate that is reported in Table 10 (0.029) for 8th
grade and smaller than the estimate for 5th grade (0.058) reported in Table 9. It is also higher than the
average of the two, which is 0.043 and also lower than the estimate that I obtained from the sample of all
the developed OECD countries but we have to note that the later estimate is for ninth and tenth grade
students.
As an alternative to the difference specification (equation 2), I also estimated the following value
Table 2 - OLS Regressions of Test Scores on Instructional Time, OECD Sample
Mathematics Science Reading
Hours
2-3 Hours
4 Hours +
Notes: The table shows OLS regression estimates of student test scores on hours of school instruction in a particular subject. In the first regression hours of instruction is a
continuous variable. In the second regression hours enters the regression as binary variables for a particular number of hours learned per subject per week. The base (omitted)
category is 1 hour. Controls on individual characteristics include binary variables for gender, fathers' and mothers' education and immigrant status. The sample includes 22
OECD developed countries (see notes to Table 1). Standard errors in parentheses are clustered at the school level. Each regression contains 137 083 observations.
28
(1) (2) (3) (4) (5) (6)
Regression I.
19.58 5.76 16.97 6.01 21.08 6.21
(0.72) (0.37) (0.86) (0.50) (1.73) (0.89)
Regression II.
46.90 6.30 43.18 7.53 55.59 6.54
(2.65) (1.09) (3.78) (1.62) (5.66) (2.38)
67.88 12.42 62.71 14.08 73.69 13.10
(2.88) (1.28) (3.99) (1.78) (6.03) (2.83)
Number of students
Regression I.
25.48 7.14 21.84 8.60 27.56 7.57
(0.73) (0.55) (0.88) (0.75) (1.79) (1.33)
Regression II.
45.65 9.38 40.13 10.81 55.19 12.17
(2.58) (1.52) (3.49) (2.57) (5.06) (3.43)
73.87 16.96 65.72 20.71 80.47 18.66
(2.82) (1.81) (3.70) (2.84) (5.58) (4.07)
Number of students
4 Hours +
307,156 177,846 57,580
Notes: The table shows OLS and FE regressions of student scores on hours of instruction in a particular subject.
Fixed effects are at the student level. Each regression also includes subject fixed effects. In the first regression hours
of instruction is measured a continuous variable. In the second regression hours enters the regression as binary
variables for a particular number of hours learned per subject per week. The base (omitted) category is 1 hour. The
sample includes 22 OECD developed countries (see notes to Table 1). Standard errors in parentheses are clustered at
the school level.
460,734 266,769 86,370
B. Mathematics + Science
Hours of instruction
2-3 Hours
OLS
Student
FE
A. Mathematics + Science + Reading
Hours of instruction
2-3 Hours
4 Hours +
Sample Divided by School Admission Policy
Table 3 - Estimated Effect of Instructional Time on Test Scores, OECD Sample
Whole Sample
Academic Record is
Irrelevant
Academic Record
Taken into Account
OLS
Student
FE OLS
Student
FE
29
(1) (2) (3) (4) (5) (6)
19.88 6.61 19.01 6.17 20.02 5.17
(1.05) (0.53) (1.00) (0.56) (1.36) (0.68)
41.26 10.99 39.23 6.88 58.78 3.93
(4.15) (1.63) (3.87) (1.76) (4.80) (1.76)
63.62 16.12 59.48 13.45 78.40 9.82
(4.41) (1.78) (4.08) (1.98) (5.35) (2.23)
Number of students
22.01 10.13 24.06 8.58 30.14 3.36
(1.01) (0.73) (1.02) (0.82) (1.45) (1.05)
39.21 17.67 37.31 10.81 58.11 3.30
(3.91) (2.23) (3.62) (2.50) (4.85) (2.29)
64.40 26.93 64.41 20.11 89.27 5.86
(4.15) (2.44) (3.84) (2.86) (5.48) (3.01)
Number of students
4 Hours +
Student
FE
201,138
Tracking By Class
by School Tracking Policy
OLS
4 Hours +
Regression I.
Regression II.
Regression II.
2-3 Hours
B. Mathematics + Science
212,169
Student
FE
Hours of instruction
160,188
Table 4 - Estimated Effect of Instructional Time on Test Scores
No Tracking
OLS
Student
FE OLS
Regression I.
141,446 134,092 106,792
Notes: Table 4 replicates Table 3 in samples defined by tracking status - whether the school
tracks students by classes, within classes, or not at all. The table shows OLS and FE
regressions of student scores on hours of instruction in a particular subject. Fixed effects are at
the student level. Each regression also includes subject fixed effects. In the first regression
hours of learning is a continuous variable. In the second regression hours enters the regression
as binary variables for a particular number of hours learned per subject per week. The base
(omitted) category is 1 hour. The sample includes 22 OECD developed countries (see notes to
Table 1). Standard errors in parentheses are clustered at the school level.
2-3 Hours
Track In Class
Hours of instruction
A. Mathematics + Science + Reading
30
(1) (2) (3) (4)
Regression I.
18.37 5.59 19.58 5.75
(0.73) (0.39) (0.72) (0.37)
Regression II.
42.67 5.94 46.79 6.27
(2.67) (1.09) (2.65) (1.09)
62.59 14.73 67.70 12.38
(2.91) (1.29) (2.87) (1.27)
Number of students
Regression I.
24.10 6.65 25.47 7.08
(0.75) (0.55) (0.73) (0.55)
Regression II.
41.31 8.28 45.54 9.21
(2.58) (1.51) (2.58) (1.51)
67.87 15.19 73.72 16.75
(2.82) (1.80) (2.81) (1.79)
Number of students
2-3 Hours
224,508
Notes: The table shows OLS and FE regressions of student scores on hours of instruction in
a particular subject. Fixed effects are at the student level. Each regression also includes
subject fixed effects. In the first regression hours of instruction is a continuous variable. In
the second regression hours enters the regression as binary variables for a particular number
of hours learned per subject per week. The base (omitted) category is 1 hour. The sample
includes 22 OECD developed countries (see notes to Table 1). Standard errors in
parentheses are clustered at the school level.
307,156
Control Added For
2-3 Hours
460,734
Student
FE OLS
B. Mathematics + Science
Hours of instruction
A. Mathematics + Science + Reading
149,672
4 Hours +
Student
FE
4 Hours +
Table 5 - Estimated Effects of Instruction Time on Test Scores, with Controls
Included in the Regressions for Special Science Activities in School and for
Scarcity of Teachers in Each Subject
Special Science School
Activities
Scarcity of Teachers
in Each Subject
OLS
Hours of instruction
31
(1) (2) (3) (4)
Regression I.
20.25 4.99 18.62 5.62
(0.86) (0.40) (0.77) (0.41)
Regression II.
46.82 6.22 46.66 5.91
(3.09) (1.19) (2.85) (1.22)
67.86 11.20 67.16 12.13
(3.39) (1.37) (3.09) (1.40)
Number of students
Regression I.
26.35 6.90 24.75 7.25
(0.86) (0.60) (0.80) (0.63)
Regression II.
45.66 9.51 45.81 8.73
(2.87) (1.65) (2.87) (1.76)
74.42 16.48 73.73 16.92
(3.19) (1.93) (3.12) (2.09)
Number of students 149,672 157,484
Notes: The table shows OLS and FE regressions of student scores on hours of instruction in a particular
subject. Fixed effects are at the student level. Each regression also includes subject fixed effects. In the first
regression hours of instruction is a continuous variable. In the second regression hours enters the regression
as binary variables for a particular number of hours learned per subject per week. The base (omitted)
category is 1 hour. The sample includes 22 OECD developed countries (see notes to Table 1). Standard
errors in parentheses are clustered at the school level.
Hours of instruction
2-3 Hours
4 Hours +
Hours of instruction
2-3 Hours
A. Mathematics + Science + Reading
B. Mathematics + Science
4 Hours +
224,508 236,226
Table 6 - Estimated Effect of Instructional Time on Test Scores, by Gender, OECD Sample
Notes: The table shows, for each OECD country, average hours of instruction per week, for Mathematics, Science and Reading, and the total for all three subjects. Average
Scores are also shown for these categories.
Table A1 - Average Hours of Instructional Time and Pisa Scores, for OECD Countries
Hours of Instruction per week Pisa Score Number of
Students
47
# Country Code Mathematics Science Reading All (sum) Mathematics Science Reading All (average)
Notes: The table shows, for 14 Eastern European countries, average hours of instruction per week, for Mathematics, Science and Reading, and the total for all three subjects.
Average Scores are also shown for these categories. The sample includes 14 countries of Eastern Europe: Bulgaria, Croatia, Czech Republic, Estonia, Hungary, Latvia, Lithuania,
Notes: The table shows, for 13 Developing Countries, average hours of instruction per week, for Mathematics, Science and Reading, and the total for all three subjects. Average
Scores are also shown for these categories. The sample includes 13 developing countries: Argentina, Azerbaijan, Brazil, Chile, Colombia, Indonesia, Jordan, Kyrgyzstan,
Mexico, Thailand, Tunisia, Turkey, Uruguay.
Table A3 - Average Hours of Instructional Time and Pisa Scores, for Developing Countries
Hours of Instruction per week Pisa Score Number of
Students
49
Mean 513.4 485.6 413.5 3.38 3.05 3.23
Standard Deviation 84.4 86.9 75.1 1.02 0.88 1.22
between pupils
Standard Deviation 38.8 40.9 46.7 1.08 1.28 1.19
within pupils
Notes: The table contains means, and the standard deviation within and between pupils, for 3 different samples: OECD countries, Eastern
Europe, and Developing Countries.
Table A4 - Descriptive Statistics - Test Score and Instructional Time
Test scores Instructional time
OECD
Developed
Eastern
Europe
Developing
countries
OECD
Developed
Eastern
Europe
Developing
countries
50
(1) (2) (3) (4) (5) (6)
20.28 4.80 19.45 4.18 20.13 5.11
(0.77) (0.48) (0.86) (0.52) (0.78) (0.45)
Number of Students
25.89 6.47 25.38 6.19 26.15 7.11
(0.80) (0.60) (0.88) (0.67) (0.81) (0.64)
Number of Students
Table A5 - Regressions of Test Scores on Instructional Time using School Level Means
Whole Sample Boys Girls
OLS
School
FE OLS
School
FE OLS
School
FE
A. Mathematics + Science + Reading
Hours of instruction
19,731 18,894 18,792
12,596 12,528
Notes: These regressions are run using collapsed school level data. For example, hours refers to the mean of
continuous hours of learning, averaged to the school level. Fixed effects are at the student level. Hours of learning is
a continuous variable. The sample includes 22 OECD developed countries: Australia, Austria, Belgium, Canada,