CELEBRATING OVER 80 YEARS JOANNA A. WALDRON [email protected]2081053.1/52750 January 11, 2019 Via Electronic Filing Rosemary Chiavetta, Secretary PA Public Utility Commission P.O. Box 3265 Harrisburg, PA 17105-3265 Re: Application of Transource Pennsylvania, LLC Filed Pursuant to 52 Pa. Code Chapter 57 Subchapter G, for Approval of the Siting and Construction of the 230kV Project in Portions of Franklin County, Pennsylvania Docket No. A-2017-2640200 Application of Transource Pennsylvania, LLC filed Pursuant to 52 Pa. Code Chapter 57, Subchapter G, for Approval of the Siting and Construction of the 230kV Transmission Line Associated with the Independence Energy Connection-East Project in Portions of York County, Pennsylvania Docket No. A-2017-2640195 Dear Secretary Chiavetta: Attached for filing is a Motion of Stop Transource Franklin County to Designate Stricken Testimony Pursuant to the Sixth Prehearing Order to be filed in the above-referenced matter. Thank you. CURTIN & HEEFNER LLP BY: Joanna A. Waldron, Esq. Counsel for Stop Transource Franklin County cc: Per Certificate of Service
for approval of the Siting and Construction of the A-2017-2640195
230 kV Transmission Line Associated with the A-2017-2640200
Independence Energy Connection - East and West Projects
in portions of York and Franklin Counties, Pennsylvania.
Petition of Transource Pennsylvania, LLC
for a finding that a building to shelter control equipment P-2018-3001878
at the Rice Substation in Franklin County, Pennsylvania
is reasonably necessary for the convenience or welfare of the public.
Petition of Transource Pennsylvania, LLC
for a finding that a building to shelter control equipment
at the Furnace Run Substation in York County, Pennsylvania P-2018-3001883
is reasonably necessary for the convenience or welfare of the public.
Application of Transource Pennsylvania, LLC
for approval to acquire a certain portion of the lands of
various landowners in York and Franklin Counties, Pennsylvania A-2018-3001881,
for the siting and construction of the 230 kV Transmission Line et al.
associated with the Independence Energy Connection –
East and West Projects as necessary or proper for the service,
accommodation, convenience or safety of the public.
MOTION OF STOP TRANSOURCE FRANKLIN COUNTY TO DESIGNATE
STRICKEN TESTIMONY PURSUANT TO THE SIXTH PREHEARING ORDER
Stop Transource Franklin County (“STFC”), by and through its attorneys, respectfully
files this Motion in the above-referenced Applications of Transource Pennsylvania, LLC
(“Transource”) and related proceedings, to Designate Stricken Testimony Pursuant to the Sixth
Prehearing Order.
2 2082247.1/52750
Your Honors issued the Sixth Prehearing Order on December 31, 2018, granting petitions
for leave to withdraw eminent domain applications, striking certain witness testimony and
amending the procedural schedule (hereinafter “Order”).
Consistent with the Order, this Motion designates the testimony that should be stricken as
improper because it is “direct testimony raised as rebuttal testimony” and contains “specific
issues relating to reliability that should have been set forth in the siting applications.” Order at ¶
9, and p. 5.
I. BACKGROUND
On December 27, 2017, Transource Pennsylvania, LLC (“Transource”) filed two
Applications for siting electric transmission lines, one proposed line for Franklin County, which
is the subject of Transource’s Application filed Pursuant to 52 Pa. Code Chapter 57, Subchapter
G, for Approval of the Siting and Construction of the 230 kV Transmission Line Associated
with the Independence Energy Connection West Project in Portions of Franklin County,
Pennsylvania, docketed at A-2018-2640200 and one proposed line in York County, which is the
subject of the Application filed Pursuant to 52 Pa. Code Chapter 57, Subchapter G, for Approval
of the Siting and Construction of the 230 kV Transmission Line Associated with the
Independence Energy Connection East Project in Portions of York County, Pennsylvania,
docketed at A-2018-2640195 (hereinafter, collectively, “Siting Applications”). Transource filed
six (6) witness statements in its case-in-chief to support its Applications.
On May 15, 2018, Transource Pennsylvania, LLC (“Transource” or “Company”) filed
133 eminent domain applications (“Eminent Domain Applications”), and two Petitions for
findings that building to shelter control equipment at the proposed Rice Substation in Franklin
County (Docket No. 2018-3001878, hereinafter “Franklin County Shelter Petition”), and for the
3 2082247.1/52750
Furnace Run Substation in York County (Docket No. 2018-3001883, hereinafter “York County
Shelter Petition”) (collectively, “Shelter Petitions”). Prior to Transource filing its Siting
Applications, on December 23, 2017, the Commission approved a settlement of Transource’s
application for certification under Docket Nos. A-2017-2587821 and G-2017-2587822,
recognizing that Transource was “a new type of entity in this Commonwealth” that was formed
solely to carry out a particular market efficiency project.
Eight public hearings were held in Franklin and York Counties in May of 2018. After
Transource filed the late-added eminent domain applications, Administrative Law Judges Barnes
and Calvelli issued a Third Procedural Order dated June 26, 2018, which permitted additional
public input hearings in September of 2018 in Franklin and York Counties, and extended the due
date for Direct Testimony to September 25, 2018. After all of the public input hearing were
conducted, and the other parties’ Direct Testimony was served, Transource filed its Rebuttal
Testimony, which consisted of sixteen (16) statements.
The Sixth Prehearing Order addressed three Motions for an extension of the procedural
schedule and/or to strike testimony. On December 7, 2018, the Office of Consumer Advocate
(OCA) filed a Motion to Amend Procedural Schedule, and had requested a minimum of 90-day
extension of time to submit Surrebuttal testimony. On December 10, 2018, Citizens to Stop
Transource, York County filed a Motion to Amend Procedural Schedule, requesting a five-
month extension for the deadlines, or in the alternative, to strike testimony. On December 13,
2018, STFC filed a Motion to Amend Procedural Schedule and Strike Certain Testimony.
The Sixth Prehearing Order granted the Motions of OCA, STFC, and the Citizens to
Stop Transource in part, and denied the Motions in part. The Order provides is relevant part:
4 2082247.1/52750
3. That the Office of Consumer Advocate’s
Motion to Amend Procedural Schedule is granted in part and denied
in part.
4. That Stop Transource Franklin County’s
Motion to Amend Procedural Schedule is granted in part and denied
in part.
5. That Citizens to Stop Transource, York
County’s Motion to Amend Procedural Schedule is granted in part
and denied in part.
5. That the procedural schedule as amended by
the Fourth Prehearing Order dated July 30, 2018 is amended as
follows:
Surrebuttal Testimony January 30, 2019
Written Rejoinder February 11, 2019
Evidentiary Hearings February 21-22 and
February 25 – March 1
Main Briefs March 28, 2019
Reply Briefs April 17, 2019
6. That landowners subject to applications for
eminent domain who testified in person are given leave to serve
written surrebuttal testimony on or before January 30, 2019 and
written rejoinder testimony on or before February 11, 2019 to the
parties and the presiding Administrative Law Judges.
7. That the motion to strike the rebuttal
testimony of James Cawley is denied.
8. That the motion to strike the rebuttal
testimony of Judy Chang is granted in part and denied in part
consistent with the body of this Order.
9. That the motion to strike the rebuttal
testimonies of Steven Herling, Kent Herzog and Stephen Stein is
granted to the extent they are introducing direct testimony as rebuttal
testimony consistent with the body of this Order.
Order at p. 7-8.
5 2082247.1/52750
In response to the portion of the Order striking testimony, STFC conferred with counsel
for Transource about designating specific testimony as being struck by the Order, with
suggested page and line number designations. STFC and Transource did not reach agreement;
however, the parties jointly agreed that any motion that STFC files seeking this relief be filed
and answered on an expedited basis, in consideration of the ongoing procedural schedule. To
that end, we respectfully request that this Motion be considered under an expedited schedule,
rather than the 20-day response period under 52 Pa. Code § 5.103(c).
II. LEGAL STANDARD
Under the Commission’s regulations, a request can be made by motion to relief desired,
except as otherwise expressly provided for in the regulations. 52 Pa. Code § 5.103(a). Under 52
Pa Code § 5.483, the presiding officer has “the power to exclude irrelevant, immaterial or unduly
repetitive evidence…to schedule…and to otherwise regulate the course of the proceeding.” 52
Pa. Code § 5.483. Further, as set forth in the Order “the Commission’s regulations also prohibit
parties from introducing evidence at the rebuttal phase that substantially varies from the party’s
case-in-chief.” Order at p.4. Further, the Order cites the Commission’s regulations at 52 Pa.
Code § 5.243(e), stating “a party is not permitted to introduce evidence during a rebuttal phase
which is repetitive, should have been included, or substantially varies from the parties case-in
chief.” Order at p. 4.
III. DESIGNATIONS OF TRANSOURCE REBUTTAL STATEMENTS STRICKEN
BY THE ORDER
The Order “granted in part” both the STFC and Citizens to Stop Transource’s Motions.
See Order at Paragraphs 8 and 9. As discussed below, STFC identifies the following testimony
as violative of the Order, and required to be stricken.
A. The Rebuttal Statements of Herling, Herzog and Stein Violate the Order
6 2082247.1/52750
Exhibit A identifies the testimony that the Order required be stricken, and which
otherwise violates Order. The rebuttal statements of Herling, Herzog and Stein are to be stricken
pursuant to Paragraph 9 of the Order, which states that “the motion to strike the rebuttal
testimonies of Steven Herling, Kent Herzog and Stephen Stein is granted to the extent that they
are introducing direct testimony as rebuttal testimony consistent with the body of the Order.”
Order at ¶ 9.
Mr. Herling offers rebuttal testimony, and adopts direct statements of Mr. McGlynn
because Mr. McGlynn “changed his role within PJM.” Transource St. No. 7-R at p.3. Mr.
Herling did not adopt Mr. McGlynn’s testimony until November 2018, even though the role
change requiring the switch occurred in February 2018, nine (9) months earlier. Mr. Herling’s
rebuttal statement should have been introduced on direct. Mr. Herling introduces the prohibited
topic of the “specific issues relating to reliability,” as explained in the summary of his testimony:
“While Project 9A was originally approved as a market efficiency project, it is now expected to
provide specific reliability benefits because PJM has identified potential reliability violations that
would be resolved by this Project.” Statement No. 7-R. p. 6. As such, the entire rebuttal
statement is to be stricken under the Order.
Transource Statement No. 11-R of Stephen Stein also violates the Order’s prohibition on
introducing direct testimony as rebuttal. Mr. Stein, the Director of Transmission Projects for
American Electric Power, offers “rebuttal” testimony on “the cost, construction and schedule for
the IEC project.” However, Transource did not offer his testimony before in this proceeding.
Mr. Stein could have offered testimony on direct about the reevaluation and cost updates that
were certainly anticipated (albeit not completed) at the time the Application was filed. Likewise,
the reliability benefits and the identity of the person affiliated with the Project who could offer
7 2082247.1/52750
testimony to support the Application, should have been anticipated, before the Rebuttal
Testimony.
The Order also requires striking Mr. Herzog’s Rebuttal Statement. As discussed below,
the Rebuttal Statement of Mr. Horger, not Mr. Herzog, contains significant prohibited direct
testimony. STFC’s Motion dated December 13, 2018 contained references to both the Rebuttal
Statement of Mr. Horger and the Rebuttal Statement of Mr. Herzog. STFC suggests that in the
alternative to striking Mr. Herzog’s testimony in its entirety under the existing Paragraph 9 of the
Order, that the Statement of Mr. Horger is to be stricken in its entirety.
B. The Rebuttal Statements of Brian Weber, Kamran Ali, and Timothy Horger
Contain Violations of the Order.
Certain portions of the rebuttal statements of Brian Weber, Kamran Ali and Timothy
Horger contain prohibited references relating to specific reliability issues that violate the Order.
The specific testimony that violates the Order, and should have been set forth in the direct
testimony is contained in Exhibit A. Copies of the Statements of Brian Weber, Kamran Ali, and
Timothy Horger, and an exhibit sponsored by Mr. Horger, identifying the stricken language is
contained in Exhibit B.
Mr. Weber’s testimony improperly discusses reliability in the context of his Need Issue
No. 2. Mr. Weber states that Witness Herling, “will demonstrate that if the Project were not
constructed this would cause multiple reliability criteria violations.” Transource St. No. 1 at p. 5.
Mr. Weber’s reference to Mr. Stein, whose statement the Order strikes, is likewise to be stricken.
Witness Kamran Ali, has some prohibited references that must be stricken, because Mr.
Ali’s testimony references to reliability arguments that should have been set forth in direct.
Order at Page 5 (“However, specific issues relating to reliability should have been set forth in the
siting applications and direct testimonies of Transource PA. Here, the Order strikes Mr. Ali’s
8 2082247.1/52750
discussion of adverse effects of chronic congestion beyond congestion costs, all of which could
have been discussed in direct.”)
Likewise, the testimony of Timothy Horger contains testimony on the Project resolving
specific reliability benefits, which testimony must be stricken per the Order. As STFC explained
in its prior Motion,
Transource offers two statements by PJM employees, Mr. Herling
and Mr. Horger, both of which introduce reliability violations as the
basis for the “need” of the project, For example, on p. 4, the last
bullet point (lines 13-15) states “Without the inclusion of Project 9A
into the PJM RTEP, the PJM region would incur increased costs and
additional transmission upgrades would be necessary to ensure the
reliability of the PJM region.”
STFC Motion at p. 6.
The Order specifically concludes that in the direct testimony “no references were
specified to suggest the project is necessary to resolve potential reliability violations or the
provide reliability benefits.” Order at 5. STFC explained that Mr. Horger’s testimony contained
some improper reliability statements in its Motion :
Transource offers two statements by PJM employees, Mr.
Herling and Mr. Horger, both of which introduce reliability
violations as the basis for the “need” of the project, as well
as the Rebuttal Testimony of Mr. Ali, who now asserts for
the first time that the IEC Project would remove “specific
reliability violations” and addresses “local reliability needs.”
Ali, Transource Statement 2-R at p. 2-3.
As such, the references identified in Exhibit A need to be removed from Mr. Horger’s Rebuttal
Statement, to the extent the Statement is not entirely stricken.
C. Rebuttal Statement of Judy Chang Is Revised per the Order
Transource St. No. 10 should be adjusted as indicated on Exhibit A, striking Ms. Chang’s
testimony in part, consistent with Paragraph 8. Exhibit A strikes the offending testimony and
9 2082247.1/52750
maintains the permitted testimony “regarding employment and economic stimulus benefits” as
set forth in the Order at p. 5. See Exhibit B, Judy Chang Statement No. 10-R.
IV. CONCLUSION
For all the foregoing reasons, STFC respectfully requests that STFC’s Motion to Designate
Stricken Testimony Pursuant to the Sixth Prehearing Order be granted.
CURTIN & HEEFNER LLP
By:_____________________________
Jordan B. Yeager (Pa. I.D. No. 72947)
Mark L. Freed (Pa. I.D. No.63860)
Joanna A. Waldron (Pa. I.D. No. 84768)
2005 South Easton Road, Suite 100
Doylestown, PA 18901
Dated: January 11, 2019
Exhibit A
2080385.1/52750
Stricken Testimony Transource Rebuttal Testimony
Testimony Witness Page(s) Line Number(s) Note
Transource St. No. 7- R Steven Herling ALL Per ¶ 9
Transource St. No. 5-R Kent Herzog ALL Per ¶ 9
Transource St. No. 11-R Stephen Stein ALL Per ¶ 9
Partially Stricken Transource Rebuttal Testimony
Testimony Witness Page(s) Line Number(s) Note
Transource St. No. 1-R Brian D. Weber 5 15-23
12 Ln. 20-22
Transource St. No. 2-R Kamran Ali
2-3 Pg. 2, Ln. 17 –
Pg. 3, Ln. 12
Beginning after
“benefits.”
7-9 Pg. 7, Ln. 19 –
Pg. 9, Ln. 7.
Transource St. No. 8-R Timothy Horger
4 13-15 Fifth bullet point
6 Ln. 8 Strike “and
reliability benefits”
7-13 Ln. 4- P.13, ln.
20.
15 13-21 Beginning after
“years”
17-18 Pg. 17, Ln. 23 –
Pg. 18, Ln. 19
Beginning after
“paths.”
19 Ln. 12 – 18
Exhibit No. TH-5R Timothy Horger
1
Remove last portion
of first bullet point
starting with “and”
Fourth and fifth
bullet point.
4
Everything under
“Reliability
Benefits”
Last full sentence
stating “addresses
emerging reliability
issues”
Exhibit A
2080385.1/52750
Testimony Witness Page(s) Line Number(s) Note
Exhibit No. TH-5R
(cont.)
Timothy Horger
(cont.)
5-6
Everything after
“III. Reliability
Benefits”
11
Fourth and fifth last
sentence, starting
with “Today” and
ending with “2023.”
Transource St.
No. 10-R Judy Chang
3 1-11
4-10
11-12
Pg. 11, Ln. 14 –
Pg. 12, Ln. 17
EXHIBIT B
BEFORE THEPENNSYLVANIA PUBLIC UTILITY COMMISSION
Application of Transource Pennsylvania, LLCfor approval of the Siting and Construction ofthe 230 kV Transmission Lines Associatedwith the Independence Energy Connection –East and West Projects in portions of Franklinand York Counties, Pennsylvania
Petition of Transource Pennsylvania, LLC for afinding that a building to shelter controlequipment at the Rice Substation in FranklinCounty, Pennsylvania is reasonably necessaryfor the convenience or welfare of the public
::::::
Docket No. P-2018-3001878
Petition of Transource Pennsylvania, LLC for afinding that a building to shelter controlequipment at the Furnace Run Substation inYork County, Pennsylvania is reasonablynecessary for the convenience or welfare of thepublic
:::::::
Docket No. P-2018-3001883
Application of Transource Pennsylvania, LLCfor approval to acquire a certain portion of thelands of various landowners in York andFranklin Counties, Pennsylvania for the sitingand construction of the 230 kV TransmissionLines associated with the Independence EnergyConnection – East and West Projects asnecessary or proper for the service,accommodation, convenience or safety of thepublic
::::::::::
Docket No. A-2018-3001881, et al.
TRANSOURCE PENNSYLVANIA, LLC
REBUTTAL TESTIMONY OF
BRIAN D. WEBER
STATEMENT NO. 1-R
Date: November 27, 2018
1
Q. Please state your name and business address.1
A. My name is Brian D. Weber, and my primary office is located at 1 Riverside Plaza in2
Columbus, Ohio.3
4
Q. Have you previously provided Direct Testimony in this proceeding?5
A. No, however I am adopting the direct testimony of witness Peggy Simmons.6
7
Q. Please describe the purpose of your Rebuttal Testimony.8
A. In my testimony, I will first organize and summarize the various positions and opposition9
to Transource Pennsylvania, LLC’s (“Transource PA” or the “Company”) Application10
made by parties in their direct testimonies. I will then summarize Transource PA’s11
response to each objection and introduce the witnesses that will provide the detailed12
rebuttal testimony regarding these issues. I will also provide more detailed testimony on13
several topics that will not be covered by other witnesses.14
15
Q. Are you sponsoring any exhibits with your Rebuttal Testimony?16
A. Yes. I am sponsoring the following exhibits:17
TPA Exhibit Nos. BDW-1R through BDW-9R.18
19
SUMMARY OF REBUTTAL CASE20
Q. Mr. Weber, please provide a summary of the objections to Transource PA’s21
Application made by interveners in their direct testimonies.22
A. The objections to Transource PA’s Application can be split into two broad categories:23
217806837v1
• First, parties have raised issues with the need for and selection of the Project; I1
will refer to these topics as Need Issues in my testimony.2
• Second, parties have also identified specific issues with the siting of the3
Project; I will refer to these topics as Siting Issues in my testimony.4
5
SUMMARY OF NEED ISSUES6
Q. Please summarize the Need Issues raised by interveners and reference the7
arguments made by intervener witnesses relevant to each of the Need Issues.8
A. Certain parties have questioned both the value of the Project and PJM Interconnection9
LLC’s (“PJM”) underlying planning process for determining and approving Market10
Efficiency projects. I have generally identified six specific Need Issues raised, along11
with the party which makes each claim:12
1) The following witnesses make various claims that PJM’s underlying Market13
Efficiency planning process is flawed.14
o Office of Consumer Advocate (“OCA”) witness Rubin claims that the15
PJM benefits metric is not sound. (See OCA St. No. 1, p. 24)16
o Witness Shaw claims that the ProMod market simulation software17
analysis is ineffective. (See Shaw St. No. 1, pp. 16-17)18
2) The following witnesses make various claims that the Project has no19
reliability benefits, or make other statements pertaining to reliability matters.20
o Both OCA witnesses Rubin and Lanzalotta claim the project has no21
reliability benefits. (See OCA St. No. 1, p. 44; OCA St. No. 2, pp. 11-22
12)23
317806837v1
o Witness Shaw also claims that non-transmission solutions closer to the1
load are better for reliability. (See Shaw St. No. 1, p. 15)2
3) The following witnesses make various claims that PJM’s Market Efficiency3
planning process does not align with PA’s rules and interests.4
o OCA witness Rubin claims the PJM process does not consider5
Pennsylvania PEDF/PUC regulations and siting rules. (See OCA St.6
No. 1, pp. 16-18)7
o OCA witness Lanzalotta claims the PJM process does not consider8
environmental and land use impacts. (See OCA St. No. 2, p. 21)9
4) The following witnesses make various claims that the value of the Project has10
deteriorated since its approval by PJM through decreased benefit to cost11
metrics that continue to trend downward.12
o OCA witness Lanzalotta claims that the addressed congestion, and13
resultant economic value of the Project, has dropped. (See OCA St.14
No. 2, pp. 17-20)15
o OCA witness Lanzalotta also claims that the cost estimate for the16
Project has not been updated. (See OCA St. No. 2, p. 14)17
5) The following witnesses make various claims that a different project that18
makes greater use of existing transmission corridors should be utilized or that19
PJM did not fully consider alternatives to the Project.20
o OCA witness Rubin claims PJM did not evaluate adequate alternatives21
in its planning process. (See OCA St. No. 2, pp. 43-33)22
417806837v1
o OCA witness Lanzalotta claims the East Leg of the Project (e.g.1
Furnace Run to Conastone) should be replaced by additions within2
existing corridors of two transmission lines owned by PPL; this claim3
was also voiced in public hearings. (See OCA St. No. 2, pp. 20-21)4
o OCA witness Lanzalotta also claims the West Leg of the Project (Rice5
to Ringgold) should be replaced by the Mid-Atlantic Interstate6
Transmission proposal referred to as Project 18H in the PJM selection7
process. (See OCA St. No. 2, pp. 21-22)8
6) The following witnesses make various claims that this congestion issue can be9
addressed with non-transmission investment and program alternatives.10
o OCA witness Crandall and witness Shaw both claim that non-11
transmission alternatives can more effectively address the AP South12
congestion. (See OCA St. No. 3, pp. 3-6; 12-28)13
o OCA witness Crandall also points to various speculative programs that14
he claims will sum to a “small utility” worth of capacity and energy in15
the future that PJM does not take into account in its planning process.16
(See OCA St. No. 3, p. 28)17
18
Q. How will Transource PA respond to Need Issue #1: the claim that PJM’s underlying19
Market Efficiency planning process is flawed?20
A. Transource PA will clearly demonstrate that PJM’s Market Efficiency planning process is21
highly sound and the selected Project 9A will provide substantial benefit to both the22
broad PJM region and Pennsylvania specifically.23
517806837v1
• Witness Herling, PJM’s Vice President - Planning, will demonstrate that investing1
in transmission solutions to remove congestion on the transmission system is a2
vital part of preserving and facilitating efficient regional markets that, taken as a3
whole, generate tremendous value to participants, including the state of PA. Mr.4
Herling will provide additional support to validate the methodology used by PJM5
to calculate benefits of a Market Efficiency Project, refuting the claim by Mr.6
Rubin.7
• Witness Cawley will explain why the benefits calculation used by PJM is8
reasonable and appropriate to ensuring non-discriminatory open access to the PJM9
transmission system.10
• Witness Chang, Principal of the Brattle Group, will demonstrate that there are11
multiple additional benefits of the Project that are not considered in the PJM12
benefits metric that add to the value of the Project.13
14
Q. How will Transource PA respond to Need Issue #2: the claim that the Project has no15
reliability benefits?16
A. Transource PA will clearly demonstrate that the Project does address both specific PJM17
reliability criteria violations and provide broader regional system resiliency.18
• Witness Herling will demonstrate that if the Project were not constructed this19
would cause multiple reliability issues on the PJM system.20
• Witness Ali, Director Transmission Planning, will describe how the Project21
provides broader regional system resilience.22
23
PD1�
Cross-Out
PD1�
Cross-Out
CVP�
Cross-Out
CVP�
Cross-Out
CVP�
Cross-Out
CVP�
Cross-Out
CVP�
Cross-Out
CVP�
Cross-Out
CVP�
Cross-Out
CVP�
Cross-Out
CVP�
Cross-Out
CVP�
Cross-Out
CVP�
Cross-Out
CVP�
Cross-Out
CVP�
Cross-Out
CVP�
Cross-Out
617806837v1
Q. How will Transource PA respond to Need Issue #3: the claim that PJM’s Market1
Efficiency planning process does not align with Pennsylvania’s rules and interests?2
A. Transource PA will clearly demonstrate that PJM planning processes are very well3
aligned with the interests of Pennsylvania. Pennsylvania broadly benefits from its4
participation in the efficient PJM regional markets, which are made possible by all5
market participants following PJM’s policies and market rules including planning6
processes which ensure the market can operate efficiently.7
• Witness Herling will highlight the tremendous benefits to Pennsylvania8
generated by the efficient PJM markets that would not be realized if market9
participants selectively picked which PJM market rules they choose to follow.10
• Witness Cawley explains the importance of regional planning for11
Pennsylvania and the Commission’s policy of supporting regional planning.12
• I will also directly discuss why this project-specific siting proceeding is not13
the appropriate venue to decide regional policy issues which pertain to items14
jurisdictional to the FERC including transmission cost allocation and planning15
processes.16
17
Q. How will Transource PA respond to Need Issue #4: the claim that the value of the18
Project has deteriorated since its approval by PJM and is trending downward?19
A. Transource PA will clearly demonstrate that the value of the Project remains very strong20
and that it continues to be a highly cost effective solution to this chronic market21
inefficiency.22
717806837v1
• Witnesses Herling and Ali both will demonstrate that the AP South congestion1
remains a significant issue.2
• Witness Horger will describe how the Project has been validated in multiple PJM3
restudies, the most recent of which was presented in September.4
• I will describe the timing and impact of the recent update to the Project cost5
estimate provided by Transource for its portions of Project 9A that totaled a $36
million increase, with supporting information provided by Witness Stein.7
8
Q. How will Transource PA respond to Need Issue #5: the claim that PJM should have9
selected a project that makes greater use of existing transmission corridors?10
A. Transource PA will clearly demonstrate that existing transmission corridors have been11
studied and are not viable alternatives to this project.12
• I will discuss PJM’s FERC Order No. 1000 competitive process sponsorship13
model, which was expressly designed to encourage submission and robust14
analysis of multiple alternatives to find the most cost-effective solution to15
regional system planning needs.16
• Witness Horger will discuss the specific analysis of the 9A proposal and how17
it considered alternatives to the West Leg of the Project in PJM’s planning18
process and determined those to be inferior to Project 9A.19
• Wintess Herling will present the results of PJM’s recent study of an20
alternative to the East Leg of the Project using existing transmission corridors21
and his conclusion that this option is deficient.22
23
817806837v1
Q. How will Transource PA respond to Need Issue #6: the claim that this congestion1
issue should be addressed with non-transmission investments and programs?2
A. Transource PA will clearly demonstrate that congestion on the AP South interface is not a3
local problem that impacts only Maryland and Virginia; rather, it is a chronic market4
inefficiency that impacts the PJM region including Pennsylvania. Transource PA will5
demonstrate that other options to reduce this congestion are already appropriately6
considered.7
• Witnesses Herling and Ali will describe how this market inefficiency broadly8
impacts regional system planning and why a robust transmission solution is9
appropriate.10
• Witness Herling will also describe how non-transmission investments and11
programs are already appropriately considered in PJM’s planning process,12
both in terms of creating opportunity and incentive to locate new generation13
resources and in terms of capturing expected impacts in load forecasts. In14
contrast, Mr. Crandall’s allegations that the need for the Project can be15
eliminated by non-transmission alternatives are both unsupported and16
inaccurate.17
• I will discuss that OCA’s forecasts of increased non-transmission alternatives18
to reduce congestion are too speculative to be considered; and even if they19
were to occur no evidence has been provided to demonstrate that they either20
impact the need of the Project or address the energy needs of future load21
forecasts.22
23
917806837v1
SUMMARY OF SITING ISSUES1
Q. Please summarize the Siting Issues raised by interveners.2
A. The Siting Issues pertain to specific concerns and issues voiced by interveners and in3
public hearings about the siting work done by Transource PA and about potential impacts4
the line may have on the local area. I have identified seven general Siting Issues:5
1) There are concerns voiced by intervener witnesses Rubin, Lanzalotta and6
Shaw and in the public hearings about the Siting Study and Proposed Route.7
(See OCA St. No. 1, pp. 17-17; OCA St. No. 2, pp. 20-22; Shaw St. No. 1, pp.8
7-11; see, e.g., Tr. at pp. 230, 288, 750, 756, 1101, 1088, 1090, 1107, 1124)9
2) There are concerns voiced by intervener witnesses Gobrecht, Shaw and Dague10
and in public hearings about various potential environmental impacts. (See11
YCPC St. No. 1, pp. 18-31; Shaw St. No. 1, p. 11; STFC St. No. 1, pp. 3-5;12
see, e.g., Tr. at pp. 430, 550, 1388-89, 1524, 1959, 1988)13
3) There are concerns voiced by intervener witnesses Gobrecht and Shaw and in14
public hearings about potential impacts on farming operations and agri-15
tourism. (See YCPC St. No. 1, pp. 7-17; Shaw St. No. 1, pp. 7-11; see, e.g.,16
Tr. at pp. 104, 328, 1165, 1179)17
4) Witnesses Rubin and Gobrecht make several allegations that Transource has18
not followed various state and local zoning and regulatory requirements. (See19
OCA St. No. 1, pp. 16-18; YCPC St. No. 1, pp. 36-38)20
5) Several witnesses in the public hearings expressed concern about the impact21
of the Project on property values. (See, e.g., Tr. at pp. 227, 369, 430, 1906,22
1918)23
1017806837v1
6) Several witnesses in the public hearings expressed concern about EMF, stray1
or induced voltage and compatibility with communications equipment. (See,2
e.g., Tr. at pp. 128, 137-138, 356, 462, 581, 609-610, 799, 876, 880, 914-15,3
921-22)4
7) Several witnesses in the public hearings expressed concerns about interactions5
with representatives of Transource. (See, e.g., Tr. at pp. 136, 182, 628, 1133-6
34)7
8
Q. How will Transource respond to Siting Issue #1 that the siting analysis is flawed?9
A. Transource PA will demonstrate that its siting process considered approximately 15010
different route segments for the East and West Legs, paralleled existing infrastructure to11
the extent reasonably possible and presented a Proposed Route that minimizes impacts to12
landowners.13
• Witness Baker will demonstrate that the siting methodology used for the14
Project complies with the Commission’s rules and regulations.15
• Witness Baker will testify that Transource PA evaluated multiple16
opportunities to parallel existing infrastructure and evaluated many different17
route segments such that presenting another alternative would have not value.18
• Witness Baker will also testify that Transource PA’s siting process did not19
target any particular segment of the population or religious group but20
attempted to site the lines to comply with the Commission’s regulations.21
22
1117806837v1
Q. How will Transource respond to Siting Issue #2 that the siting will have adverse1
environmental impacts?2
A. Transource PA will demonstrate that its siting process appropriately minimizes and3
mitigates environmental impacts and is fully consistent with Commission regulations,4
Court decisions and statutes regarding environmental impacts.5
• Witness Baker will discuss the environmental surveys conducted by the6
Company and the coordination with agencies to address and mitigate7
environmental impacts. Witness Baker also discusses efforts to mitigate8
environmental impacts for specific features such as Falling Springs and9
Muddy Creek mentioned by parties.10
• Witness Baker will also explain that the Company meets the requirements of11
PEDF and appropriately considers the factors set forth in Act 45 related to12
preserved farmland.13
• Witness Yamatani will explain that the Company’s engineers have extensive14
experience constructing transmission lines in areas where there is karst15
topography; that existing transmission lines, including in Franklin County,16
have been built over karst topography and that the Company is conducting a17
karst inventory and will be able to safely build the transmission line.18
19
Q. How will Transource respond to Siting Issue #3 that the proposed transmission lines20
will have a negative impact on farming operations?21
A. Transource PA will demonstrate that the transmission lines will have a minimal impact22
on farming operations.23
1217806837v1
• Witness Herzog testifies that farming is compatible with the proposed1
transmission lines and that the Company is mitigating the impacts on farming2
by using monopole towers as opposed to lattice towers.3
• Witness Baker will testify that the Company attempts to locate towers as close4
to property lines as reasonably possible but cannot do this at all times due to5
environmental issues, structures or causing too many directional changes.6
• Witness Mercer will testify that EMF from the lines will not negatively affect7
farm animals such as cows or horses.8
• Witness Silva will testify that the proposed transmission lines will not impact9
Global Positioning Systems.10
11
Q. How will Transource respond to Siting Issue #4 that the siting is inconsistent with12
zoning and other local regulatory requirements?13
A. Transource PA will demonstrate that its siting is consistent with local zoning regulations14
to the extent reasonably possible and that Transource PA will continue to work with local15
governments regarding project construction issues.16
• Witness Baker explains that the location of the substation building in York17
County is consistent with local zoning regulations to the extent reasonably18
possible.19
• Witness Stein explains that the Company will cooperate with local20
municipalities to address project construction issues.21
22
CVP�
Cross-Out
CVP�
Cross-Out
CVP�
Cross-Out
CVP�
Cross-Out
CVP�
Cross-Out
1317806837v1
Q. How will Transource respond to Siting Issue #5 that the proposed lines will1
significantly decrease property values?2
A. Transource PA will demonstrate that the proposed transmission lines will not have a3
material impact on property values.4
• Witness Dominy presents national and Pennsylvania studies demonstrating5
that transmission lines do not materially impact property values.6
• Witness Rothman explains his analysis that transmission lines located in7
Franklin and York counties do not materially impact property values.8
9
Q. How will Transource respond to Siting Issue #6 that the proposed transmission lines10
will cause EMF concerns and stray voltage?11
A. Transource PA will demonstrate that the proposed transmission lines will be safe and will12
not present concerns as to EMF or stray voltage.13
• Witness Silva calculates the EMF levels from the proposed transmission lines14
and explains how they relate to common everyday EMF levels. Witness Silva15
also explains that the proposed transmission lines will not present stray16
voltage concerns.17
• Witness Lee explains that the EMF levels from the lines will not increase18
cancer or other health risks.19
• Witness Mercer explains that dairy cow production will not be negatively20
impacted by the proposed transmission lines.21
22
1417806837v1
Q. How will Transource respond to Siting Issue #7 that Transource PA representatives1
have not been honest in dealing with landowners?2
A. Transource PA will explain its approach to working with landowners.3
• Witness Schaffer explains the Company’s policy with respect to dealing with4
landowners on power line projects and address some concerns raised in public5
hearings.6
7
Q. Does this conclude your organization and summarization of the various objections8
to Transource PA’s application and can you briefly restate this effort?9
A. Yes. This is a multifaceted case with many topics discussed by both the Company and10
the interveners. In an effort to organize the content of this case, I first grouped the topics11
as Need Issues or Siting Issues; next, I further defined the topics within each grouping,12
summarized the Company’s response to each topic, and identified the witness that will13
provide detailed testimony regarding that topic. These responses will clearly demonstrate14
that the need for Project 9A continues to be supported, and the Company has met or15
surpassed Pennsylvania’s siting requirements and, therefore, this Application should be16
approved.17
18
Q. You stated that you will provide more detailed testimony on several topics that will19
not be covered by other witnesses, please state these topics.20
A. I will provide more detailed testimony on the following topics:21
• The timing and impact of cost updates provided by Transource to PJM for the22
Project.23
1517806837v1
• PJM’s competitive planning process uses market forces to broadly consider1
many alternatives to find the most cost effective solution to regional system2
planning needs.3
• Alternatives suggested to the East Leg of the Project are not viable.4
• OCA Witness Crandall’s forecasts of non-transmission alternatives are5
completely speculative; and even if they were to occur no evidence has been6
provided to demonstrate that they either impact the need of the Project or7
address the energy needs of future load forecasts.8
• This project-specific siting proceeding is not the appropriate venue to decide9
regional policy issues.10
• The Company’s position on funding a Land Impact Mitigation Fund.11
12
DISCUSSION OF IEC PROJECT COST UPDATES13
Q. OCA witness Lanzalotta and several witnesses at the public input hearings claim14
that the cost estimate for the Project has not been updated, is this accurate? (See15
OCA St. No. 2, p. 14)16
A. No. Transource has constantly monitored the expected cost of the Project and provided17
PJM with quarterly updates to the cost estimate pursuant to PJM protocols. Prior to18
October 2018, these updates provided to PJM confirmed that the existing cost estimate of19
$197 million (in 2015 dollars) remained valid. Subsequently, in October 2018,20
Transource provided to PJM an updated cost estimate for the Project of $200 million (in21
2015 dollars), an approximately $3 million increase. After applying appropriate22
1617806837v1
escalation to account for annual inflation, this updated cost estimate was reflected in the1
PJM RTEP project database as $217 million in October 2018 dollars.2
3
Q. So, prior to October 2018, Transource had provided PJM with updates to the cost4
estimate for the Project?5
A. Yes. These updates confirmed that the existing cost estimate remained unchanged.6
7
Q. Did any project component costs vary over time from the original estimate before8
October 2018?9
A. Yes.10
11
Q. If that was the case, why wasn’t the estimated project cost not changed until12
October 2018?13
A. As part of its cost estimate submission to PJM, Transource included in its project costs14
two provisions to cover future project cost variability.15
The first provision is a known adjustment to the 2015 cost submission to cover16
future general inflationary estimates to ensure that cost changes that happen through17
industry-wide factor causes are planned for. It is my understanding that PJM uses an18
annual inflation adjuster of 2.3%. This adjuster ensures that future inflationary increases19
in project costs are considered as part of the benefit to cost analysis that PJM undertakes20
for market efficiency projects.21
1717806837v1
The second provision is a reservation for project contingency to cover project1
unknowns in the case that they arrive. The project estimate included a reservation for2
contingency at that time.3
Based upon multiple discussions with the project management team led by4
Company Witness Stein, costs on certain components within the Project had both5
increased and decreased. These increases and decreases largely offset each other. Any6
costs variances known before October 2018 were within the provisions for cost variance7
discussed above so there was no reason to change the overall project cost estimate until8
October 2018.9
10
Q. What happened in October 2018 that led to a change in project cost estimate?11
A. Along with the most recent cost update provided to PJM in September 2018 to support a12
re-evaluation of the Project benefit to cost ratio, Transource PA advised PJM that the line13
construction contract work for the Project was out for competitive bid, and therefore a14
cost update was expected in October 2018 when these bids were received. Transource15
committed to provide an update to the Project costs incorporating the line construction16
bid results as part of its quarterly progress report to PJM.17
18
Q. What were the major drivers of the $3 million increase to the cost estimate of the19
Project as of October 2018?20
A. Factors contributing to the October 2018 change to the cost estimate of the Project21
include:22
1817806837v1
• Changing the structure type from lattice towers to steel monopoles; this has1
been the only substantial scope change to the Project.2
• Monitoring recent pricing both monopoles and conductor reflecting steel and3
aluminum prices.4
• Bids received from contractors for the construction of the transmission line5
work which is the largest single contract component for the Project.6
• Updated pricing from suppliers for the thirteen 500/230 kV transformers7
which is largest material cost component for the substations.8
• Updated projections for right-of-way (“ROW”), siting/permitting and project9
management costs based on actual costs incurred up to that point as well as10
future projections.11
As discussed previously, some factors caused the expected Project cost to go up and12
others caused the expected Project cost to go down. Company Witness Stein provides a13
breakdown of the costs submitted in October 2018 in his rebuttal testimony.14
15
Q. You mention substantial scope change in structure type from lattice towers to steel16
monopoles. Why is this important?17
A. As further outlined in the testimony of Company Witness Herzog, Transource received18
multiple comments and concerns with the use of lattice towers and supporting the use of19
steel monopole structures. Steel monopoles result in less ROW and smaller footprints on20
the ROW and are more compatible with land uses such as agriculture as further discussed21
by Witness Herzog.22
1917806837v1
Steel monopoles use more steel and concrete than the originally planned lattice1
structures; this makes the use of steel monopoles somewhat more expensive. As a result,2
the project design team estimated that this scope change would cause an approximately3
$7.3 million increase to the transmission line portions of the cost estimate.4
Transource was able to offset a portion of these costs from savings through the5
procurement activities associated with other major items, such as major substation6
equipment, but was not able to fully offset the cost of implementation of monopoles7
within its original cost estimate which was for a lattice tower scope.8
9
Q. So the use of steel monopoles resulted in a cost increase of approximately $7.310
million but the overall costs were only increased by $3 million. Does this mean that11
without the scope change to steel monopoles the costs would still be within the12
original costs?13
A. Yes.14
15
Q. Have the cost estimates changed for other (non-Project) components of PJM Project16
9A?17
A. Yes. My understanding is that PJM receives cost estimate updates for the other (non-18
Project) components of PJM Project 9A from the utilities which are constructing those19
components. Witness Horger provides more information on those cost estimate updates.20
21
2017806837v1
Q. While you can’t speak directly for the cost of project being constructed by others,1
do you have any thoughts on why the costs for other (non-Project) components of2
PJM Project 9A may have changed more than the Project?3
A. Yes. When Transource proposed Project 9A to PJM, it was able to analyze in detail the4
components of the project scope it would be responsible for (the Project components) and5
provide a thorough initial cost estimate. For the non-Project components, such as work6
needed to interconnect to the existing Ringgold and Conastone substations, Transource7
had less information about the required scope of work and, therefore, provided to PJM8
initial cost estimates based upon limited information. Once Project 9A was approved by9
PJM, the designated entities for the non-Project components have since completed a10
detailed analysis of the work scope associated with and provided PJM with updated cost11
estimates.12
13
DISCUSSION OF PJM'S COMPETITIVE PLANNING PROCESS14
Q. You stated earlier under Need Issue #5 that OCA witness Rubin and Lanzalotta15
both claim that PJM and Transource PA did not consider various alternatives to the16
Project. (OCA St. No. 1, pp. 16-17; OCA St. No. 2, pp. 20-22) Do you agree with17
Mr. Rubin and Mr. Lanzalotta on this point?18
A. No, I do not agree. As explained in the direct and rebuttal testimony of witnesses Baker19
and Herling, PJM and Transource PA evaluated multiple alternatives. In addition to20
these analyses, it should be noted that the PJM competitive planning process uses market21
forces to generate and incentivize market participants to submit a very robust response22
and compete for the best project.23
2117806837v1
Q. How does the PJM competitive planning process use market forces to generate a1
robust response of ideas for the best project?2
A. The PJM competitive planning process starts with engagement from a broad set of market3
participants, including incumbent and non-incumbent transmission owners and other4
competitive developers to submit creative solutions in response to a PJM problem5
statement. In the PJM 2014/15 Long Term Proposal Window, a total of 19 entities6
submitted proposals for market efficient projects.7
Next, the PJM competitive planning process creates a clear incentive for these8
participants to evaluate every realistic option in an effort to identify the best project as the9
proposer or “sponsor” of that idea will be awarded the project to construct and own.10
However, while market participants look at many different solutions, they likely do not11
just propose to PJM every idea they come up with as there is a proposal submission fee12
and a substantial amount of work necessary to meet PJM’s proposal requirements. As a13
result, Transource PA, and likely other participants, analyze and filter their ideas by14
weeding out the poorly performing ideas and proposing to PJM their most promising15
solutions.16
In the PJM 2014/15 Long Term Proposal Window in which PJM Project 9A was17
selected, PJM received 41 proposals for solutions to the PJM problem statement to18
relieve congestion on the AP South interface. These 41 solutions were evaluated by PJM19
over an 18-month process, resulting in the selection of Project 9A; the Company has20
made this point in direct testimony. What I want to emphasize here is that there were21
likely many more solutions evaluated by the 19 developers who submitted proposals to22
PJM, with the poorly performing ideas eliminated by the developers.23
2217806837v1
1
Q. So, you are saying that the search for the best solution to address congestion on the2
AP South interface was actually likely much broader than just the 41 proposals3
received by PJM?4
A. Yes.5
6
DISCUSSION OF ALTERNATIVES TO THE EAST LEG OF THE PROJECT7
Q. OCA witness Lanzalotta, as well as multiple witnesses in the public hearings,8
recommends that the East Leg of the Project should be either be replaced with9
line(s) in existing transmission corridors owned by PPL or that the East Leg of the10
Project should be replaced with additional circuits on lines already owned by PPL.11
(OCA St. No. 2, pp. 20-21) How will you address this?12
A. For clarity and completeness, I will separately define these options and address why13
neither is viable. The first suggested option is to move the route of the East Leg into the14
existing corridors owned by PPL; I will refer to this as “East Leg Paralleling Option.”15
The second suggested option is to replace the East Leg with additional circuits hung on16
the existing towers of lines owned by PPL; I will refer to this as “East Leg Replacement17
Option.”18
19
Q. How will the Company address the East Leg Paralleling Option?20
A. As further described in the testimony of Witness Baker, the use of existing corridors21
would need additional ROW as the facilities cannot be placed into the existing corridors.22
23
2317806837v1
Q. How will the Company address the East Leg Replacement Option?1
A. PJM has studied the East Leg Replacement Option and demonstrated that it is not an2
acceptable technical solution; this analysis is discussed in the rebuttal testimony of3
Witness Herling.4
5
Q. Please provide additional background on the PJM analysis of the East Leg6
Replacement Option referenced above.7
A. OCA Witness Lanzalotta presents a recommendation to add a new 230-kV circuit to each8
of the existing PPL tower lines as a replacement to the East Leg of the Project. (OCA St.9
No. 2, pp. 20-21) Mr. Lanzalotta does not provide any additional technical detail or10
analysis of this alternative. See TPA Exhibit No. BDW-1R, which is OCA’s response to11
TPA-OCA, Set II, Question 9.12
Subsequent to the submittal of Mr. Lanzalotta’ s direct testimony, a party in the13
Maryland regulatory proceedings for the Project, Power Plant Research Program or14
“PPRP”, submitted a data request describing a more detailed and technically supported15
version of the option described by Mr. Lanzalotta; PPRP referred to this options as the16
“Conceptual Alternative.” The PPRP data request asked if the Company and/or PJM had17
performed any analysis of the Conceptual Alternative and, if not, requested that analysis18
be performed. The Conceptual Alternative was defined by PPRP as:19
Conceptual Alternative to Transource’s proposed new Furnace Run-Conastone double-20
circuit 230 kV line with a new Furnace Run-Conastone 230 kV line and a new Furnace21
Run-Graceton 230 kV line.22
2417806837v1
• Transource’s proposed Furnace Run Substation and its tap into the Peach1
Bottom-Three Mile Island 500 kV line would not change with the Conceptual2
Alternative.3
• The new Furnace Run-Conastone 230 kV line would parallel PPL’s de-4
energized Yorkana-Face Rock 69 kV line to the interconnection point with the5
existing PPL Otter Creek-Conastone 230 kV line then would be installed on6
the existing structures of this line from this point to Conastone.7
• The new Furnace Run-Graceton 230 kV line would parallel PPL’s de-8
energized Yorkana-Face Rock 69 kV line to the interconnection point with the9
existing PPL Manor-Graceton 230 kV line then would be installed on the10
existing structures of this line from this point to Graceton.11
• Incremental terminal equipment in the Conastone Substation would decrease12
with the Conceptual Alternative’s single incremental 230 kV line terminating13
in that substation.14
• Incremental terminal equipment would have to be added in the Graceton15
Substation to accommodate the new incremental 230 kV line into that16
substation with the Conceptual Alternative.17
• BGE’s rebuild of the Conastone-Northwest double circuit 230 kV line would18
be modeled as part of the Conceptual Alternative just as it was with the IEC19
project.20
2517806837v1
• To the extent practicable, the conductors to be modeled for the Conceptual1
Alternative would be the same as those used by PPL when it rebuilt the2
Conastone-Otter Creek and Graceton-Manor 230 kV lines—1590 KCMIL3
45/7 ACSR “Lapwing”conductor with a summer normal rating of 1626 Amps4
(647 MVA @ 230 kV) and summer emergency rate of 2013 Amps (801 MVA5
@ 230 kV). That same conductor should be modeled for the rebuilt portion of6
BGE’s Graceton-Manor 230 kV line noted above.7
• The conductors to be installed on BGE’s portion of the new Furnace Run-8
Conastone 230 kV line and a rebuild, if any, of its portion of the Conastone-9
Otter Creek 230 kV line, would be determined by BGE given the capability of10
the existing double-circuit structures and consistent with good utility11
practices.12
See TPA Exhibit BDW-2R, which is a copy of the response to PPRP’s data request in the13
Maryland regulatory proceeding. As described by Witness Ali, the Conceptual14
Alternative represents a practical and more sophisticated implementation of Mr.15
Lanzalotta’s general concept.16
17
Q. Has PJM performed an analysis of the Conceptual Alternative?18
A. Yes. As I stated above, PJM has studied the Conceptual Alternative and demonstrated19
that it is not an acceptable technical solution; this analysis is discussed in the rebuttal20
testimony of Witness Herling.21
22
2617806837v1
Q. In PJM’s competitive planning process, what company would be assigned by PJM1
as the Designated Entity for work within existing electric utility rights-of-way, such2
as the suggested use of PPL’s corridors in Conceptual Alternative?3
A. Under the PJM Tariff, the incumbent transmission owner would be assigned by PJM as4
the Designated Entity for any work within their existing rights-of-way; in this case PPL.5
6
Q. So, PPL had a strong incentive to propose a solution either adding circuits to7
structures or placing facilities in their existing structures if such a solution were8
promising. Is this right?9
A. Yes and PPL did not propose such an alternative, despite submitting four other proposals10
into the PJM 2014/15 Long Term Proposal Window. Since then, PPL has not provided11
any evidence that either of these solutions are workable. Even with this uncertainty, PJM12
has studied the only solution that PPL indicates has a potential to be workable, although13
additional facilities would still be needed to fully address technical constraints with this14
solution.15
16
Q. Has any entity presented evidence that either the East Leg Paralleling Option or the17
East Leg Replacement Option is an acceptable replacement to the East leg of the18
Project?19
A. No. In fact, PPL has confirmed in data requests that they have completed no such20
analysis. See TPA Exhibit No. BDW-3R, which are PPL’s responses to TPA-PPL Set I,21
Questions 4 and 8 and PPL’s supplemental responses to TPA-PPL Set I, Questions 1022
2717806837v1
and 11. Comments and testimony by other parties about the viability of these alternatives1
is simply conjecture.2
3
NON-TRANSMISSION ALTERNATIVES4
Q. OCA witness Crandall argues that non-transmission alternatives such as energy5
efficiency, demand response, renewable energy and distributed resources reduce the6
need for the IEC Project. (OCA St. No. 3, p. 30.) Witness Crandall then forecasts7
the level of energy reductions from these resources in his testimony, which he claims8
will reduce congestion. Can Witness Crandall’s forecasts be relied upon?9
A. No. I am not aware of any requirement that the non-transmission alternatives forecasted10
by Witness Crandall actually be constructed, or in the case of energy efficiency measures,11
be implemented. Even Witness Crandall recognized this in his discovery responses.12
Transource PA asked Witness Crandall to:13
Please describe in detail all the regulatory or other approvals that have14been obtained in connection with the 206 MW and 545 GWh/year energy15efficiency resources and the 3,723 MW of renewable energy predicted by16Mr. Crandall.17
18Witness Crandall responded:19
To clarify the premise of the question, this is not Mr. Crandall’s prediction20of what will occur.21
22(See OCA response to TPA-OCA Set III, Question 7, which is provided as TPA Exhibit23
No. BDW-4R)24
Likewise, when asked how the District of Columbia City Council will meet its goal of25
supplying 50% of its energy usage by solar photovoltaics by 2032. Witness Crandall26
stated:27
2817806837v1
Whether they [the District of Columbia] actually achieve 50%, or more, or1less, is not the point.2
3(See OCA response to TPA-OCA Set III, Question 8, which is provided as TPA Exhibit4
No. BDW-5R)5
These statements made by Witness Crandall clearly demonstrate that his forecasts are6
speculative, not supported by evidence and cannot be relied upon. In addition, Witness7
Crandall provides no evidence that even if the speculative alternatives he lists were to8
occur it would reduce congestion on the AP South interface.9
10
Q. Are there other reasons to believe Witness Crandall’s argument that non-11
transmission alternative in Virginia, Maryland and D.C. will reduce congestion on12
AP South is flawed?13
A. Yes. I reviewed the Dominion Energy Integrated Resource Plan (“Dominion IRP”) that14
Witness Crandall relied upon as support for his claims that the Virginia Grid15
Transformation and Security Act of 2018 (the “GTSA”) would reduce customers’ overall16
annual energy usage by 805 GWh and peak demand by 304 MW by 2033. (See TPA17
Exhibit No. BDW-6R, which is OCA’s response to TPA-OCA Set III, Question 5)18
Witness Crandall emphasizes the 805 GWhs of future demand side management19
identified in this plan in his testimony. However, he fails to also mention that Dominion20
projects an energy shortfall of 25,935 GWh in 2033 even including the 805 GWh of21
annual energy savings from the GTSA. See the Chart below which was included on page22
6 of the Dominion IRP.23
24
2917806837v1
1
2
Likewise, Witness Crandall also did not mention that Dominion projects a capacity3
shortfall of 5,501 MW in 2033 even including the 304 MW of capacity from the GTSA.4
See the chart below which was included on page 5 of the Dominion IRP.5
6
3017806837v1
1
2
Q. In the tables from the Dominion IRP above, do you have any other general3
observations which you would like to point out?4
A. Yes, four items stand out from a summary review.5
First, the energy gap identified by Dominion of 25,935 GWh in 2033 is over 326
times as much as the 805 GWh of demand side management that Witness Crandall bases7
his testimony upon, yet he fails to mention this as a significant item.8
Second, the generation forecast of Dominion in the future already anticipates the9
need to add 1,585 MW of new capacity, providing 11,964 GWh of energy.10
Third, even with significant levels of planned future additions generation, there11
remains a significant energy gap.12
3117806837v1
Fourth, even with the addition of new generation and future demand side1
management, the total energy requirement is significantly higher than today, while the2
total energy in the forecast is lower than today.3
4
Q. Why are these facts, which Witness Crandall omitted in this testimony, important?5
A. While no studies were provided by Witness Crandall to support his position, Witness6
Crandall appears to base a large portion of his testimony upon the high level premise that:7
“If the load on the higher cost side of the transmission constraint8is too great for the transmission system to carry from the lower9cost side, and if that then causes the higher cost generation in the10higher cost area to be dispatched to alleviate the load on the11transmission system, then reducing load in the higher cost area12will also reduce the load on the transmission system. Dispatching13generation and reducing load in the higher cost area both reduce14the power flow across the congested transmission lines.”15
(See OCA response to TPA-OCA Set III, Question 19, which is provided as TPA Exhibit16
No. BDW-7R)17
Based upon Witness Crandall’s logic outlined above, it would seem appropriate to note18
that the total load in the future is higher even with the 805 GWh demand side19
management assumption Witness Crandall mentions in the same areas and the energy20
shortfall of 25,935 GWh is projected in the same timeframe.21
22
DISCUSSION OF REGIONAL POLICY ISSUES23
Q. Intervenor witnesses point to a number of alleged issues with the PJM Market24
Efficiency Planning Process as part of their recommendations that the Commission25
deny the Transource PA Application. How do you respond?26
3217806837v1
A. This project-specific siting proceeding is not the appropriate venue to decide regional1
policy issues such as how market efficiency projects are selected or how costs are2
allocated. Transmission ratemaking, including allocation of costs associated with a3
regional transmission system, are the jurisdiction of the Federal Energy Regulatory4
Commission (“FERC”). For example, as described in more detail by Witness Herling,5
the benefit metric used by PJM in the Market Efficiency analysis was resoundingly6
supported in an open stakeholder process at PJM and approved without protest at the7
FERC in Docket No. ER14-1394-000. The PJM stakeholder process and before the8
FERC are the appropriate venues to debate and determine key regional policies because it9
allows broad participation by impacted parties. Raising these concerns on ratemaking10
process and cost allocation in a siting forum is both out of time and in the incorrect11
venue.12
13
ENVIRONMENTAL ISSUES14
Q. YCPC Witness Gobrecht argues that Transource Pennsylvania should set aside15
funds in a Land Impact Mitigation Fund to offset environmental impacts. (YCPC16
St. No. 1, p. 23.) Is Transource PA willing to do this?17
A. Transource PA is willing to consider this proposal, however, there are many unanswered18
questions that must first be addressed. When asked in discovery, YCPC did not propose19
any specific amount to be set aside. (See TPA Exhibit No. BDW-8R, which is YCPC’s20
response to TPA-YCPC Set I, Question 7) It is also unclear from YCPC’s testimony how21
the funds would be used, how they would be distributed and who would be entitled to22
3317806837v1
them. (See TPA Exhibit No. BDW-9R, which is YCPC’s response to TPA-YCPC Set I,1
Question 3)2
3
Q. Does this conclude your Rebuttal testimony?4
A. Yes.5
6
TPA Exhibit No, BDW-1R
Application of Transource Pennsylvania, LLC for Approval of the Siting and Construction of the 230 kV Transmission Line Associated with the Independence Energy Connection - East and West Projects in Portions of York and Franklin Counties, Pennsylvania, etal.
Docket No. A-2017-2640195, et al.
Responses of the Office of Consumer Advocate to Transource’s Interrogatories and
Requests for Production of Documents SET II
Transource to OCA-IL9
9, Re OCA Statement No. 2, page 20, Provide all analysis, study results, work papers or
other correspondence relied upon or considered which would 'indicate that, the
reconfiguration of the PPL lines would provide an equivalent benefit of the IEC Project.
Answer:
■ Mr. Lanzalotta’s.referenced testimony does not address reconfiguring PPL lines.’ . It-
addresses using available 230 kV line positions on existing PPL transmission lines
partially in lieu of transmission facilities proposed for the IEC, Mr. Lanzalotta does not
address the benefits of this approach relative to the benefits projected for the IBC,
Prepared by: Peter Lanzalotta
TPA Exhibit No, BDW-2R
Response of the Applicant
Maryland Public Service Commission - Case No, 9471 In the Matter of the Application of Transource Maryland, LLC for a Certificate of Public
Convenience and Necessity to Construct Two New 230 KV Transmission Lines Associated
with the Independence Energy Connection Project in Portions of Harford and Washington
Counties, Maryland
Discovery request submitted by: Power Plant Research Program
Discovery request set number: Five
Response prepared by or under the direction of: Paul F, McGlytm and ICamran All
Response date: November 19,2018
These data requests are directed to whichever of. the following entities has the
knowledge to answer these data requests: Transource Maryland, LLC ("Transource
MD"), Transource Energy, AEP Transmission Holding Company, LLC, American
Electric Power Company, Inc, ("AEP"), American Electric Power Service Corporation
o Transource's proposed Furnace Run Substation and its tap into the Peach
Bottom-Three Mile Island 500 kV line would not change with the Conceptual
Alternative,
o Incremental terminal equipment in the Conastone Substation would decrease
with the Conceptual Alternative's single incremental 230 kV line terminating in
that substation.
o Incremental terminal equipment would have to be added in the Graceton
Substation to accommodate tire new incremental 230 kV line into that substation
with the Conceptual Alternative,
o BGE's rebuild of the Conastone-Northwest double circuit 2301<V line would be
modeled as part of the Conceptual Alternative just as it was with the IBC project,
TPA Exhibit No. BDW-2R
o To the extent practicable/ the conductors to be modeled for the Conceptual
Alternative would be the same as those used by PPL when it rebuilt the
Conastone-Otter Creek and Graceton-Manor 230 kV lines—1590 KCMIL 45/7
ACSR "Lapwing" conductor with a summer normal rating of 1626 Amps (647
MVA @ 230 kV) and summer emergency rate of 2013 Amps (801MVA @ 230 kV) /
' That same conductor should be modeled for the rebuilt portion of BGE's
Graceton-Manor 230 kV line noted above,
o The conductors to be installed on BGE's portion of the new Furnace Run-
Conastone 230 kV line and a rebuild/ if any, of its portion of the Conastone-Otter
Creek 230 kV line/ would be determined by BGE given the capability of the
existing double-circuit structures and consistent with good utility practices.
Response;PJM has conducted an analysis that modeled the "Conceptual Alternative" cited above,
A summer 2023 generator deliverability study identified two single-contingency (n-1)
thermal criteria violations:
, 1.. Fumac.e Run-Cpnastone. 2301<V line oyerload for the logs of .the Conastone-Peach .
Bottom 500 kV line
2, Furnace Run-Graceton 230 kV line overload for the loss of the Conastone-Peach
Bottom 500 kV line
These results were identified horn only a subset of RTEP process tests that PJM
conducts to ensure compliance with reliability criteria, For example, other tests
performed to.ensure compliance with reliability would include an n-l?l analysis, If this.
"Conceptual Alternative" were to have been submitted as a project proposal through
the 2014/2015 Long-term Proposal Window, it would not have moved forward with
any additional evaluation - including that for market efficiency benefits - because it
creates reliability violations,
TPA Exhibit No, BDW-3RWitness: Phi! 0. Penny
PPL Electric Utilities Corporation Response to Interrogatories of
TRANSOURCE PA, Set I Dated Octobers, 2018
Pocket Nos, A-2017-2640195 and A-2017-2640200
Has PPL Electric conducted any analyses, studies, or reviews to determine whether PPL Electric’s Otter Creek to Conastone could be modified by adding a second circuit In order to provide the equivalent electrical characteristics (as measured by the performance criteria below) of the proposed Furnace Run-Conastone portion of the IEC Project? Please describe In detail any such modifications, and provide any analyses, reviews, plans, documents, or opinions related to such modifications.
Perfo'rmahce criteria •1800 / 2400 MVA summer normal / emergency rating with the following parameters:R = 0, 00134928 pu X = 0. 0146981 pu B » 0. 0608184 pu
PPL Electric has not conducted analyses or studies or reviews to determine If adding a second circuit to the Otter Creek to Conestone line would provide equivalent electrical characteristics as measured by the performance criteria cited in the above question # 4.
TPA Exhibit No. BDW-3R
Witness: Phil 0, Penny
PPL Electric Utilities Corporation Response to Interrogatories of
TRANSOURCE PA, Set I Dated October 2, 2018
Docket Nos. A-2017-2640195 and A-2017-2640200
Has PPL Electric conducted any analyses, studies, or reviews to determine whether PPL Electric's Graceton-Manor could be modified by adding a second circuit In order to provide the equivalent electrical characteristics (as measured by the performance criteria below) of the proposed Furnace Run-Conastone portion of the IEC Project? Please describe In detail any such modifications, and provide any analyses, reviews, plans, documents, or opinions related to such modifications.
Performance criteria■ 1800- / 2400 MVA-summer mormal / emergency rating with the following parameters:R- 0.00134928 pu X»0. 0146981 pu B - 0, 0608184 pu
PPL Electric has not conducted analyses or studies or reviews to determine If adding a second circuit to the Graceton-Manor line would provjde equivalent .electrical characteristics as measured by the performance criteria cited in the above question # 8.
TPA Exhibit No. BDW-3R
Witness: Phil 0. Penny
( PPL Electric Utilities Corporation Response to Interrogatories of
TRANSOURCE PA, Set I Dated October 2, 2018
Docket Nos, A~2017-2640195 and A-2017-2640200
In PPL Electric Utilities Corporation Response to Interrogatories of Office of Consumer Advocate, Set XII, Q.4, It was stated that "there is ability to utilize conductors with a higher capacity rating" for the Otter Creek-Conastone transmission line.
a, Based upon all studies and analyses completed or . . . known at. the.time of the integratory response, please provide
the maximum rating of any conductors studied along with the conductor specifications that can be added to the existing structures without modification to the structures or land rights,
• : ■ .-and the related summer- normal- and .-summer emergency ratings In MVA and the associated R, X and B pu values, Please provide the englneer(s) responsible for any assessment supporting this determination, their contact Information and qualifications along with any applicable professional certifications that they possess,
PPL Electric performed a preliminary review that showed that almost all existing structures could accommodate higher capacity conductors, PPL Electric has not performed the detailed engineering or planning studies required to select a specific higher capacity conductor or determine specific modifications to structures or land rights that may be required, The review was performed by Mr. Horst Lehmann, Mr, Lehmann Is employed by PPL Electric Utilities, Two North Ninth Street Allentown, PA 18101, Mr, Lehmann has over ten years of electric utility operating experience Including six years In the design of transmission lines, Mr, Lehmann has B.S, degrees in both Electrical Engineering and Economics from Rensselaer Polytechnic Institute and is a licensed Professional Engineer in the Commonwealth of Pennsylvania.
Supplemental Information provided 10/31/18:
PPL Electric.utilized UHS 1949.6 45/7 ACSS TW Athabaska and UHS 2153.8 60/19 ACSS TW Powder conductors as representative examples for the purpose of determining feasibility of reconductorlng
TPA Exhibit No. BDW-3R
Witness: Phil 0, Penny
the existing transmission structures with higher capacity conductors. The maximum rating for such conductors per PPL Electric's rating methodology would be 180 Degrees C, However, PPL Electric has not conducted the planning and engineering studies necessary to select a specific higher capacity conductor that would be utilized or determined the applicable rating of any such conductor, nor did It do the engineering and planning studies necessary to determine what the maximum rating of the Identified conductors would be on the PPL Electric system.
Witness: Phil 0. Penny
TPA Exhibit No. BDW-3R
PPL Electric Utilities Corporation Response to Interrogatories of
TRANSOURCE PA, Set I Dated October 2, 2018
Docket Nos. A-2017-2640195 and A-2017-264Q200
Q. 11 In PPL Elec trie Utilities Corporation Response to Interrogatories ofOffice of Consumer Advocate, Set XII, Q.11, it was stated that "there is ability to utilize conductors with a higher capacity rating” for the rebuilt portions of the Graceton-Manor transmission line.
a. Based upon all studies and analyses completed or known at the time of the integratory response, please provide the maximum rating of any conductors studied along with the conductor specifications that can be added to the existing structures without modification to the structures or land rights,
■ and the related summer normal and summer emergency.....................; ■ • ratings In MVA and' the' associated R, X and' B- pm values.: •
Please provide the names of any engineer(s) or other persons responsible for any assessment supporting this determination, their contact information and qualifications along with any applicable professional certifications that they possess,
A. 11 PPL Electric performed a preliminary review that showed that almostall existing .structures could accommodate higher capacity conductors. PPL Electric has not performed the detailed engineering or planning studies required to select a specific higher capacity conductor or determine specific modifications to structures or land rights that may be required. The review was performed by Mr. Horst Lehmann. Mr. Lehmann Is employed by PPL Electric Utilities, Two North Ninth Street Allentown, PA 18101. Mr. Lehmann has over ten years of electric utility operating experience Including six years In the design of transmission lines, Mr. Lehmann has B.S. degrees In both Electrical Engineering and Economics from Rensselaer Polytechnic Institute and is a licensed Professional Engineer In the Commonwealth of Pennsylvania.
Supplemental Information provided 10/31/18:
PPL Electric utilized UHS 1949.6 45/7 ACSS TW Athabaska and UHS 2153.8 60/19 ACSS TW Powder conductors as representative examples for the purpose of determining feasibility of reconductoring the existing transmission structures with higher capacity conductors,
TPA Exhibit No. BDW-3R
Witness: Phil 0, Penny
The maximum rating for such conductors per PPL Electric’s rating methodology would be 180 Degrees C. However, PPL Electric has not conducted the planning and engineering studies necessary to select a specific higher capacity conductor that would be utilized or determined the applicable rating of any such conductor, nor did it do the engineering and planning studies necessary to determine what the maximum rating of the identified conductors would be on the PPL Electric system,
TPA Exhibit No, BDW-4R
Responses of the Office of Consumer Adyocate to Transource’s Interrogatories and
Requests for Production of Documents
SETIH
Application of Transource Pennsylvania, LLC for Approval of the Siting andConstruction of the 230 IcV Transmission Line Associated with the IndependenceEnergy Connection - East and West Projects in Portions of York and Franklin
Couniies, Pennsylvania, et al.
Docket No. A-2017-264019S, et al..
Transouroe to OCA-III-7
7, Re OCA Statement No, 3, page 21. Please describe in detail all the regulatory or
other-approvals that have been obtained in connection with the 206 MW and 545
GWh/year energy efficiency resources and the 3,723 MW of renewable energy
predicted by Mr, Crandall, To the extent regulatory or other approvals are
required hut have not yet' been obtained, please describe in-detail the process and
standards required to obtain such approval, and describe in detail the basis supporting Mr.' Crandall’s prediction that these resources will in' fact :occuf and be
placed in service.
Answer:
To clarify the premise of the question, this is not Mr, Crandall’s prediction of
what will occur, It is Mi', Crandall’s recognition of the State mandate and utility
IRP plans to fulfill the mandate - it is much more than simply Mr, Crandall’s
forecast, The point, as Mr, Crandall stated in his duect testimony, is that P JM did
not consider the impact of the Virginia mandate nor the utilities ’ plans to achieve
it, In effect, PJM is forecasting that Virginia’s mandate and the utilities’ plans
result in no load reductions, i,e., have zero impact,
The Grid Transformation and Security Act became effective in Virginia in March
2018. In May 2018 Dominion Energy filed its 2018 Integrated Resource Plan,
As is customary, it is seeking approval from-the Virginia State Corporation
Commission to use various combustion and non-combustion resources to meet
their IRP Plan goals from 2019-2033,
Prepared by: Geoffi'ey Crandall
TPA Exhibit No. BDW.5R
Responses of the Office of Consumer Advocate to
Transource’s Interrogatories and
Requests for Production of Documents
SET in
Application of Transource Pennsylvania, LLC for* Approval of tile Siting andConstruction of the 230 kV Transmission Line Associated with the IndependenceEnergy Connection - East and West Projects in Portions of York and Franklin
Counties, Pennsylvania, et al.Docket No. A-2017-2640195, et al.
Transource to OCA-III-8 . •
8, Re OCA Statement No. 3, page 23. Fully explain how the District of Columbia
City Council will achieve that one-half of the electric energy used in the District
of Columbia by 2032 be supplied by solar photovoltaios,
Answer:
In July 2016 Mayor Bowser signed into law a 50% renewable energy mandate. To-'
be obtained by 2032, The District of Columbia Government Mayor’s Office Press
Release and a relevant news article provides further details on the establishment
of and requirement for a 50% renewable energy target in the District of Columbia,
PJM did not consider this; effectively forecasting it will have zero impact on
loads. Whether they actually achieve 50%, or more, or less, is not the point,
Anything DC and PBPCO actually accomplish is not being considered in PJMs
plans,
Table 2 of Mr, Crandall’s Direct Testimony does not contain assumptions
regarding the viability of the District of Columbia accomplishing a 50%
renewables level by 2032. Instead the renewable energy values were based on the
technical potential of renewables study done by the D.C. Government Department
of Environment, That study showed a technical potential in DC for renewables of
2,498,000 MWH, which is about 13% of the DC energy use, Mr. Crandall
assumed the market potential would be 5% of technical potential, which is about
0,63% of the DC energy use, not 50%, The assumption was 1/80 of the 50%
mandate, which is conservative.
Prepared by: Geoffrey Crandall
TPA Exhibit No, BDW-6R
Responses of the Office of Consumer Advocate to Transource’s Interrogatories and
Requests for Production of Documents SETHI
Application of Transource Pennsylvania, LLC for Approval of the Siting and
Construction of the 230 ltV Transmission Line Associated with the IndependenceEnergy Connection - East and West Projects in Portions of York and Franklin
Counties, Pennsylvania, et al,Docket No. A-2017-2d40195, et al.
Transource to OCA-III-5
5, OCA Statement No. 3, page 20, Provide all calculations for how the GTSA will
reduce customers overall annual energy usage by 805 GWh and peak demand by
3 04 MW by 2033,
Answer:
• See-the'Dominion Energy correspondence to- the Virginia'S.tate Corporation
Commission page 4 for the basis of the estimates of 805 GWh annual reduction
and the peak demand reduction of 3 04 MW by 2033. See:
The impacts emanate from Dominion Energy’s Demand Side Management/energy
efficiency programs. This information was provided by Dominion Energy
President Mr. Paul Koonce as part of the 2018 Integrated Resource Plan
submission on May 1,2018 to the Virginia State Corporation Commission,
Prepared by: Geoffrey Crandall
TPA Exhibit No, BDW-7R
Responses of the Office of Consumer Advocate to Transource’s Interrogatories and
Requests for Production of Documents SETHI
Application of Transource Pennsylvania, LLC for Approval of the Siting andConstruction of the 230 kV Transmission Line Associated with the IndependenceEnergy Connection - East and West Projects in Portions of York and Franklin
Counties, Pennsylvania, et al,
Docket No, A-2017-2640195, et al.
Transource to OCA-M-19
19, Re: OCA Statement No, 3, page 8, linps 34, Please provide all supporting
analysis, studies, or work papers supporting the statement that “reducing load will
mitigate the constraint” which were relied upon or considered to prepare this
testimony,
Answer:
Please refer to OCA Statement No, 3, page 8, lines 1-15, If the load on the higher
cost side of the transmission constraint is too great for the transmission system to
carry horn the lower cost side, and if that then causes the higher cost generation in
the higher cost area to he dispatched to alleviate the load on the transmission
system, then reducing load in the higher cost area will also reduce the load on the
transmission system, Dispatching generation and reducing load in the higher cost
area both reduce the power flow across the congested transmission lines,
Prepared by: Geoffrey Crandall
TPA Exhibit No, BDW-8R
Application of Transouroe Pennsylvania, LLC Filed Pursuant to 52 Pa, Code Chapter 57, Subchapter G, for Approval of the Siting and Construction of the 230 kV Transmission Line Associated with the
independence Energy Connection-East Project in Portions of York County, Pennsylvania;
Docket No, A-2017-26401-95
Application of Transource Pennsylvania, LLC Filed Pursuant to 52 Pa, Code Chapter 57, Subohapter G, for Approval of the Siting and Construction of the 230 kV Transmission Line Associated with the
Independence Energy Connection - West Project in Portions of Franklin County, Pennsylvania;
Docket No. A-2017-2 640200
YORK COUNTY PLANNING COMMISSION’S RESPONSES TO TRANSOURCE
PENNSYLVANIA, LLC’S INTERROGATORIES AND REQUESTS FOR PRODUCTION OF
documents, SET I
7, Based on Mr, Gobrecht’s review of the Project, please provide an estimate of the proposed
funding amount for the Land Impact Mitigation Fund.
RESPONSE; We do not have an estimate at this time, The funding amount should be sufficient
to offset the impacts to the following: conservation easements, designated naturai
areas, habitat corridors, wetlands, and high quality streams within the right-of-way.
The funding amount should also cover the costs of BMP design and construction to
■ offset stormwater impacts within the right-of-way,
PROVIDED BY: Wade Gobrecht
DATE: October 22,2018
TPA Exhibit No. BDW-9R
Application of Transource Pennsylvania) LLC Filed Pursuant to 52 Pa, Code Chapter 57, Subchapter 0, for Approval of the Siting and Construction of the 230 kV Transmission Line Associated with the
Independence Energy Connection-East Project in Portions of York County, Pennsylvania;
DooketNo, A-2017-2640195
Application of Transource Pennsylvania, LLC Filed Pursuant to 52 Pa, Code Chapter 57, Subchapter G, for Approval of the Siting and Construction of the 230 kV Transmission Line Associated with the Independence Energy Connection -r West Project in Portions of Franklin County, Pennsylvania;
DooketNo, A-2017-2640200
YORK COUNTY PLANNING COMMISSION’S RESPONSES TO TRANSOURCE PENNSYLVANIA, LLC’S INTERROGATORIES AND REQUESTS FOR PRODUCTION OF
DOCUMENTS, SET I
3. Re YCPC StatementNo, 1, page 13. Does the Land Mitigation Fund currently exist? If yes,
how is it funded and how are the funds used and please provide a copy of any guidance
documents, charters, or other documents, that describe the Implementation, execution, and
binding of the referenced “Land Impact Mitigation Fund,”
RESPONSE: No.
PROVIDED BY: WadeGobrecht
DATE:' October 22,2018
BEFORE THEPENNSYLVANIA PUBLIC UTILITY COMMISSION
Application of Transource Pennsylvania, LLCfor approval of the Siting and Construction ofthe 230 kV Transmission Lines Associatedwith the Independence Energy Connection –East and West Projects in portions of Franklinand York Counties, Pennsylvania
Petition of Transource Pennsylvania, LLC for afinding that a building to shelter controlequipment at the Rice Substation in FranklinCounty, Pennsylvania is reasonably necessaryfor the convenience or welfare of the public
::::::
Docket No. P-2018-3001878
Petition of Transource Pennsylvania, LLC for afinding that a building to shelter controlequipment at the Furnace Run Substation inYork County, Pennsylvania is reasonablynecessary for the convenience or welfare of thepublic
:::::::
Docket No. P-2018-3001883
Application of Transource Pennsylvania, LLCfor approval to acquire a certain portion of thelands of various landowners in York andFranklin Counties, Pennsylvania for the sitingand construction of the 230 kV TransmissionLines associated with the Independence EnergyConnection – East and West Projects asnecessary or proper for the service,accommodation, convenience or safety of thepublic
::::::::::
Docket No. A-2018-3001881, et al.
TRANSOURCE PENNSYLVANIA, LLC
REBUTTAL TESTIMONY
KAMRAN ALI
STATEMENT NO. 2-R
Date: November 27, 2018
1
Q. Please state your name and business address.1
A. My name is Kamran Ali. My business address is 8500 Smiths Mill Road, 2nd Floor, New2
Albany, OH 43054.3
4
Q. Have you previously provided Direct Testimony in this proceeding?5
A. Yes. Transource Pennsylvania, LLC (“Transource PA” or the “Company”) Statement6
No. 2 is my written Direct Testimony.7
8
Q. Please describe the purpose of your Rebuttal Testimony.9
A. In this rebuttal testimony I will address several specific topics raised by intervenors and10
in the public hearings that relate to the overall public need for the Project; Mr. Weber11
includes these topics in his summarization of “Need Issues” in his Rebuttal Testimony.12
Specifically, I will discuss the following:13
• The claim that the Project has no reliability benefits by describing how the14
Project provides broad regional and specific local reliability benefits.15
• The claim that the value of the Project has deteriorated since its approval by16
PJM by demonstrating that congestion remains a significant issue that17
adversely impacts system planning in PJM.18
• The claim that this congestion issue should be addressed with investments and19
programs in Maryland and Virginia through rebuttal of multiple points made20
by OCA Witness Crandall.21
• The validity of the PROMOD model for this type of transmission system22
planning.23
217815646v1
• How from a technical standpoint the “Conceptual Alternative” described by1
Witness Weber represents a practical and more sophisticated implementation2
of Mr. Lanzalotta’s general concept for using existing transmission line3
corridors owned by PPL Electric as a replacement for the East Leg of the4
Project5
6
Q. Are you sponsoring any exhibits with your Rebuttal Testimony?7
Objective of PJM Market Efficiency Operating Agreement : 1.5.7 Development of Economic-based Enhancements or Expansions (b) Following PJM Board consideration of the assumptions, the Office of the Interconnection shall perform a market efficiency analysis to compare the costs and benefits of: (i) accelerating reliability-based enhancements or expansions already included in the Regional Transmission Plan that if accelerated also could relieve one or more economic constraints; (ii) modifying reliability–based enhancements or expansions already included in the Regional Transmission Plan that as modified would relieve one or more economic constraints; and (iii) adding new enhancements or expansions that could relieve one or more economic constraints, but for which no reliability-based need has been identified. Economic constraints include, but are not limited to, constraints that cause: (1) significant historical gross congestion; (2) pro-ration of Stage 1B ARR requests as described in section 7.4.2(c) of Schedule 1 of this Agreement; or (3) significant simulated congestion as forecasted in the market efficiency analysis. The timeline for the market efficiency analysis and comparison of the costs and benefits for items 1.5.7(b)(i-iii) is described in the PJM Manuals.
(c) The process for conducting the market efficiency analysis described in subsection (b) above shall include the following:
(i)The Office of the Interconnection shall identify and provide to the Transmission Expansion Advisory Committee a list of economic constraints to be evaluated in the market efficiency analysis.
Economic Justification for Market Efficiency Operating Agreement : 1.5.6 Development of the Recommended Regional Transmission Expansion Plan (i) The recommended plan shall identify enhancements and expansions that relieve transmission constraints and which, in the judgment of the Office of the Interconnection, are economically justified. Such economic expansions and enhancements shall be developed in accordance with the procedures, criteria and analyses described in Sections 1.5.7 and 1.5.8 of this Schedule 6.
• In determining eligible congestion drivers PJM will consider all binding flowgates internal to the PJM footprint (including tie lines), current active Market-to-Market flowgates listed in the NERC book of flowgates, and potential future Market-to-Market flowgates between PJM and MISO
• Eligible congestion drivers are selected to focus proposals on significant issues – Identified coincident with the opening of market efficiency proposal window
• Only proposals which address one or more of these PJM identified congestion drivers will be evaluated
– If the proposal does not substantially address a PJM identified congestion driver, or is otherwise substantially deficient or is seriously flawed, it will be rejected and the proposer will be notified
• Facilities below these thresholds are not anticipated to pass the benefit/cost threshold because of the expected cost of an upgrade
Market Efficiency Criteria for Target Congestion Drivers
• Market Efficiency Criteria – Annual simulated congestion frequency of at least 25 hours in each 2023 and 2026
study years – Congestion threshold
• Lower voltage facilities: minimum of $1 million congestion in each 2023 and 2026 study years
• Regional facilities: minimum of $10 million congestion in each 2023 and 2026 study years • Interregional facilities: minimum of $0.5 million congestion in each 2023 and 2026 study
years (lower threshold as there may be interregional benefits in addition to the regional benefits)
• Congestion for 2029 study year is considered more speculative and therefore will be monitored in future analysis
• Using the same topology as the Market Efficiency process, PJM will define its control areas to align with the CMP processes as described in the MISO-PJM JOA, Attachment 2, Section 3.2.1
• Monitored facilities included in MISO’s Market Efficiency process will be combined with the set of contingencies used in both PJM’s and MISO’s Market Efficiency processes to establish the domain of flowgates that will be tested for eligibility
• Each of these flowgates will be studied in a sensitivity analysis that will establish the flowgates as congestion drivers should they meet either study criteria:
• GLDF Threshold Study – Under the historical control area representation, if any two PJM generating stations at
electrically unique locations have a Generation-to-Load Distribution Factor (GLDF) that is 5% or greater, this flowgate will be eligible to be an identified congestion driver in the Market Efficiency process
• TDF Threshold Study – Under the historic control area representation, if any historical control area to historical control
area transaction (Generation-to-Generation transfer) has a 5% or greater Transfer Distribution Factor (TDF), this flowgate will be eligible to be an identified congestion driver in the Market Efficiency process
• Posted updated 2023 Base Case (XML files PROMOD 11.1.13 format) – Includes MISO feedback received by Oct 11th – Includes PJM stakeholders feedback received by Oct 23nd – Model includes all years: 2019, 2023, 2026, 2029 – Also posted updated noFSA case (PROMOD XML file to remove FSA units)
• Posted Additional Files – Updated event file – 15-years Monte Carlo outage library – Current Congestion Output Report (simulated years 2023 and 2026)
• Final Base Case to be posted before the start of Long-Term Window
Component Status Quo PJM Modification PJM Reasoning
FSA Modeling Consider all FSA and
Suspended ISA resources at time of case build
By default, exclude from the base case the FSA and Suspended ISA resources, and their associated network upgrades
at time of case build. FSA sensitivity studies will be used for proposal
evaluations, but not for B/C ratio test.
Including FSAs in the Market Efficiency Base Case can result in unrealistic estimates of
specific benefits for any system reinforcement due to having significantly more generation than
the reserve requirement.
FSA Exception
If FSA or Suspended ISA resources are excluded from the base case at time of case
build, TEAC should be notified.
If FSA or Suspended ISA resources are included in the base case at time of
case build or mid-cycle update, TEAC will be notified and the assumptions will be reviewed at TEAC on an as needed
basis.
In the case of including FSA or suspended ISA resources in the base case, TEAC will be notified
and the assumptions will be reviewed at TEAC
Criterion to Include FSAs
Not defined. PJM practice includes all.
In case of a reserve deficiency, include FSA and Suspended ISA resources (as well as the expected network upgrades) ranked by their commercial probability, until the reserve requirement is met.
In the case of including FSA or suspended ISA resources in the base case, TEAC will be notified
Component Status Quo PJM Modification PJM Reasoning
Benefit Adjustment for
In-Service Date* N/A
Energy benefits of projects that are proposed to be in service later than the
RTEP year will be adjusted to account for any savings forgone due to later in-service
date.
It is PJM’s goal to address Market Efficiency constraints via transmission solutions by the
RTEP year, and to incentivize projects that are designed and proposed to be in service by the RTEP year. Therefore, PJM will adjust energy benefits of projects that are proposed to be in
service later than the RTEP year to account for any savings forgone due to later in-service date.
* Includes 15-year cap. Will be used as sensitivity if only one proposal per target congestion driver.
• OA revisions were endorsed at September MC for December 1, 2018 effective date
• Any potential changes will be effective for 18/19 Long Term Window
– PROMOD input files: .lib, .eve – Benchmark test case and results
• Auxiliary Files – Input Assumptions Summary – Updated Modeling Document which will provide details of setup and modeling methods – Benefit/Cost Evaluation Tool – ARR Data
• Project must reduce or relieve economic congestion on identified PJM constraints
• Project’s Benefit/Cost Ratio > 1.25 – Various scenario analysis may be performed
• Cost – Consistent with the OA Schedule 6 section 1.5.7 (g), for a Market Efficiency proposal with
costs in excess of $50 million, an independent review of such costs will be performed
• Projects may be further analyzed for other secondary considerations – Zonal/Total Savings – Risk Evaluation – Sensitivity Evaluation – Reliability Impacts
Rank Constraint Type Location Approximate total Market Congestion
(Millions)*
% of Total Congestion* Comment
1 Braidwood - East Frankfort M2M ComEd $43.4 6.2% RTEP upgrades expected to reduce congestion (s0756 breaker replacement).
2 Conastone - Peach Bottom PJM Line 500 $39.5 5.7% RTEP upgrades expected to reduce congestion (b2766 substation equipment upgrade).
3 Emilie - Falls PJM Line PECO $25.1 3.6% RTEP upgrades expected to reduce congestion (b2774 Emilie - Falls 138 kV line reconductoring). Partial congestion is outage related (work on Alburtis-Branchbu, Bustleto-Crosswic, Emilie-Roll, Crosswic-Wardav).
4 Graceton - Safe Harbor PJM Line BGE $23.9 3.4% RTEP upgrades expected to reduce congestion (b2690 Graceton - Safe Harbor 230 kV line reconductoring). Partial congestion is outage related (work on Conaston-Ottcrkpl, Conaston-Peachbot, Manor-Safeharb, Conaston-Hunterst).
5 5004/5005 Interface Interface 500 $22.5 3.2% West - East Transfers.
6 AP South Interface 500 $21.6 3.1% RTEP upgrades expected to reduce congestion (b2752, b2743).
7 Westwood M2M MISO $19.6 2.8%
8 Cherry Valley Transformer M2M ComEd $18.7 2.7% RTEP upgrades expected to reduce congestion (s0900 parallel xfmr).
9 Carson - Rawlings PJM Line Dominion $18.2 2.6%
10 Conastone - Otter Creek PJM Line PPL $15.1 2.2% RTEP upgrades expected to reduce congestion (s0233 Otter Creek - Conastone 230 kV line rebuild). Partial congestion is outage related (work on Manor-Safeharb, Conaston-Hunterst).
Top 25 Congestion Causing Constraints in 2017 (Cont’d)
PJM TEAC – 10/24/2018
Rank Constraint Type Location Approximate total Market Congestion
(Millions)*
% of Total Congestion* Comment
11 Conastone - Northwest PJM Line BGE $14.1 2.0% RTEP upgrades expected to reduce congestion (b2752.7 Conastone - Northwest 230 kV lines reconductor/rebuild). Partial congestion is outage related (work on Conaston-Northwes, Brighton-Conaston).
12 Three Mile Island Transformer 500 $13.3 1.9% Impacted by Three Mile Island retirement.
13 Butler - Shanorma PJM Line APS $11.4 1.6% RTEP upgrades expected to reduce congestion (b2696 substation equipment upgrade at Butler, Shanor Manor and Krendale substations).
14 Lakeview - Greenfield PJM Line ATSI $10.8 1.5% Partial congestion is outage related (work on Beaver-Davisbes, Hayes_FE-Davisbes, Lemoyne2 -Wfremont)
Application of Transource Pennsylvania, LLCfor approval of the Siting and Construction ofthe 230 kV Transmission Lines Associatedwith the Independence Energy Connection –East and West Projects in portions of Franklinand York Counties, Pennsylvania
Petition of Transource Pennsylvania, LLC for afinding that a building to shelter controlequipment at the Rice Substation in FranklinCounty, Pennsylvania is reasonably necessaryfor the convenience or welfare of the public
::::::
Docket No. P-2018-3001878
Petition of Transource Pennsylvania, LLC for afinding that a building to shelter controlequipment at the Furnace Run Substation inYork County, Pennsylvania is reasonablynecessary for the convenience or welfare of thepublic
:::::::
Docket No. P-2018-3001883
Application of Transource Pennsylvania, LLCfor approval to acquire a certain portion of thelands of various landowners in York andFranklin Counties, Pennsylvania for the sitingand construction of the 230 kV TransmissionLines associated with the Independence EnergyConnection – East and West Projects asnecessary or proper for the service,accommodation, convenience or safety of thepublic
::::::::::
Docket No. A-2018-3001881, et al.
TRANSOURCE PENNSYLVANIA, LLC
REBUTTAL TESTIMONY OF
TIMOTHY HORGER
STATEMENT NO. 8-R
Date: November 27, 2018
117820083v1
Q. Please state your name and business address.1
A. My name is Timothy J. Horger, and my business address is 2750 Monroe Boulevard,2
Audubon, Pennsylvania 19403.3
4
Q. By whom are you employed and in what capacity?5
I am employed by PJM Interconnection, L.L.C (“PJM”), a regional transmission6
organization (“RTO”), as Director of Energy Market Operations.7
8
Q. Please describe your professional experience and educational background.9
A. As Director of Energy Market Operations, I am responsible for overseeing the execution10
of the PJM Market systems, including the Day-ahead, Real-time, Financial Transmission11
Rights (“FTR”), Market Efficiency, and Interregional Market Operations areas. In12
addition, I am responsible for the design and development of the PJM market systems,13
facilitation of stakeholder initiatives, strategic market initiatives, and development of14
staff.15
I have been employed by PJM for over sixteen years. Prior to being the Director16
of Energy Market Operations at PJM, I was the manager of the PJM Interregional Market17
Operations department, manager of the PJM Market Simulation department, and the18
Senior Lead Engineer of the Auction Revenue Rights (“ARR”) and FTR group. In the19
role of Interregional Market Operations Manager, my responsibilities included overseeing20
all market activities associated with interregional market coordination with neighboring21
areas including Market-to-Market daily congestion management, Congestion22
217820083v1
Management Process, Joint and Common Market, Interchange Distribution Calculator1
Working Group, North America Energy Standards Board, and project support.2
In my role as Market Simulation Manger, I was also responsible for overseeing all3
activities associated with the ARR/FTR Markets and the Market Efficiency Economic4
Planning process at PJM. This included responsibility for execution and design of the5
Market Efficiency Analysis, Annual FTR Auctions, ARR Allocations, Long Term and6
Monthly FTR Auctions, and Incremental ARR analysis. As related to this proceeding, I7
was responsible for the Market Efficiency analysis associated with the Transource8
Independence Energy Connection project (“Project 9A”).9
In my role as Senior Lead Engineer for the ARR/FTR group, I was responsible for10
leading and conducting all activities related ARR and FTR functions including11
I. Introduction .................................................................................................................................................... 2 Reliability Benefits ........................................................................................................................................... 4
II. Third Re-Evaluation Reaffirms Transource Project .................................................................................... 4 Benefit/Cost Ratio Reaffirms Need .................................................................................................................. 5
The re-evaluation of the Transource project in September 2018 and a ratio update in October 2018, continued to find
that it would provide benefits that extend across a wide area, including areas of Pennsylvania and Maryland.
I. Introduction Transmission congestion arises when least-cost energy cannot be delivered to the consumer because of physical
limitations to the electric transmission system. Indeed, recent history drives home the economic impact of congestion.
Congestion across the four 500 kV transmission lines comprising the APSouth Interface along the Pennsylvania-
Maryland border has imposed economic transmission constraint costs totaling approximately $800 million from 2012
through 20161. These costs are ultimately borne by residents, commercial businesses and industrial customers in
eastern PJM.
PJM’s forward-looking studies have also identified persistent congestion on the AP-South Interface over a 15-year
planning horizon. Those studies drove PJM’s request during a 2014/2015 window for solicitation of technical
solutions to alleviate the identified persistent congestion. Based on subsequent evaluation of the proposals received,
PJM recommended the Transource project2 – shown on Map 1 – to alleviate AP-South congestion allowing lower-
cost energy to be delivered efficiently and reliably to consumers.
The Transource project – also known as Project 9A – is expected to provide economic benefits at least 25 percent
higher than the cost of the project. PJM uses this 1.25 benefit/cost threshold criterion in its FERC-approved planning
process to evaluate market efficiency proposals for potential recommendation to the PJM Board of Managers
(Board). With the Board’s approval, recommendations become part of the Regional Transmission Expansion Plan
(RTEP).
Since 2016, PJM has evaluated the need for the Transource recommended project four times, the most recent in
September 2018. All four evaluations – the original justification and three subsequent re-evaluations, shown in
Table 1 – confirmed the project provided significant economic benefits and passed the required 1.25 benefit/cost
threshold. The re-evaluations have continued to reaffirm the PJM Board’s August 2016 approval of the Transource
project.
1 Data drawn from State of the Market Reports published by PJM’s market monitoring unit, Monitoring Analytics. 2 The Transource project was originally designated Project 9A within the context of PJM’s RTEP process and has appeared in
The Transource project was approved by the PJM Board in 2016 as the more efficient, cost-effective project to
address persistent congestion identified in forward-looking economic studies on the AP-South Interface. While not
needed to address reliability criteria violations at that time, PJM noted that the project would inherently enhance
system reliability by introducing additional transmission network paths. In parallel with the September 2018
benefit/cost ratio re-evaluation, PJM assessed the extent to which the Transource project provides identifiable
reliability benefits. Power flow results have confirmed that the Transource project does indeed solve identified 2023
overloads on a 500 kV line, a 500/230 kV transformer and other transmission facilities.
II. Third Re-Evaluation Reaffirms Transource Project PJM recommended the Transource project from among 41 developer proposals formally submitted as part of a
solicitation window from Oct. 30, 2014 through Feb. 27, 2015. Initial evaluation of the Transource project proposal
yielded a benefit/cost ratio of 2.48. Given that the ratio exceeded PJM’s Tariff-specified 1.25 threshold for market
efficiency projects, the result justified the Transource project approved by the PJM Board in August 2016, as shown
in the timeline in Figure 1.
Based on established RTEP planning practice – consistent with the PJM Operating Agreement (OA) – PJM
conducted subsequent re-evaluations, also shown in the Figure 1 timeline. PJM conducted studies in
September 2017 and February 2018 to re-evaluate the Transource project under updated project cost and simulation
input parameters. Those re-evaluations yielded benefit/cost ratios of 1.30 and 1.32, respectively, as summarized
earlier in Table 1. As Table 1 also shows, PJM has completed a third September 2018 re-evaluation reaffirming
project justification with a benefit/cost ratio equal to 1.42, decreasing slightly to 1.40 in October 2018 with updated
cost estimates from Transource for its portions of the project. The project also addresses emerging reliability issues
and, as mentioned later, provides capacity market benefits in the BGE LDA.
IV. Background – Initial Evaluations Justifying Project Selection PJM opened a long-term RTEP window from Oct. 30, 2014 through Feb. 27, 2015, to solicit, among other system
needs, proposals to alleviate AP-South interface congestion identified in long-term simulation results, shown in Table 2.
The AP-South Interface is shown on Map 3. PJM is required5 to recommend transmission system enhancements to
lower costs to customers if project benefits exceed costs by at least 1.256. The benefit/cost calculation is described in
APPENDIX A2: Benefit/Cost Ratio Calculation.
Submitted project proposals comprised system enhancements that would relieve congestion constraints for which no
reliability-based RTEP project was already identified, as the 2014/15 Long-Term Window Problem Statement &
Requirements document specified. PJM received 41 proposals to alleviate AP-South congestion. After extensive
evaluation and stakeholder review, PJM selected and recommended the Transource project as approved by the PJM
Board in August 2016.
Table 2 Long-Term Simulated Congesion on the AP-South Interface
5 PJM’s authority with respect to its planning process is based on its role as a FERC-approved RTO and its authority and
responsibilities under the PJM Operating Agreement, the PJM Tariff and the PJM Consolidated Transmission Owners
Agreement. The process is regulated by FERC. The final recommended RTEP is submitted to and approved by the PJM
Board.
6 Governed by Section 1.5.7(d) of Schedule 6 to the PJM Operating Agreement.
V. APPENDIX A1: October 2018 IEC Project Cost Breakdown
Upgrade ID Description
TO/ Designated
Entity
Full In-Service
Year Estimate
b2752.7 Conductor/rebuild the two Conastone-Northwest 230 kV lines and upgrade terminal equipment on both ends.
BGE
$52.14
b2752.6 Conastone 230 kV substation tie-in work (install a new circuit breaker at Conastone 230 kV and upgrade any required terminal equipment to terminate the new circuit).
$6.14
b2752.5 Build new 230 kV double-circuit line between Furnace Run and Conastone 230 kV, operated as a single circuit.
Transource $53.25
b2752.4 Upgrade terminal equipment and required relay communication at TMI 500 kV: on the Peach Bottom-TMI 500 kV circuit.
ME $2.00
b2752.3 Upgrade terminal equipment and required relay communication at Peach Bottom 500 kV: on the Peach Bottom-TMI 500 kV circuit. PECO
$2.00
b2752.2 Tie in new Furnace Run substation to Peach Bottom-TMI 500 kV. $6.90
b2752.1 Tap the Peach Bottom-TMI 500 kV line and create new Furnace Run 500 kV and 230 kV stations. Install two 500/230 kV transformers, operated together.
Transource $41.46
b2743.6.1 Replace the two Ringgold 230/138 kV transformers.
APS
$14.13 b2743.6
Reconfigure the Ringgold 230 kV substation to double bus double breaker scheme.
b2743.7 Rebuild/reconductor the Ringgold-Catoctin 138 kV circuit and upgrade terminal equipment on both ends.
$47.04
b2743.5 Build new 230 kV double-circuit line between Rice and Ringgold 230 kV, operated as a single circuit.
Transource $98.35
b2743.4 Upgrade terminal equipment at Hunterstown 500 kV: on the Conemaugh-Hunterstown 500 kV circuit.
ME $0.20
b2743.3 Upgrade terminal equipment at Conemaugh 500 kV: on the Conemaugh-Hunterstown 500 kV circuit. PENELEC
$0.20
b2743.2 Tie in new Rice substation to Conemaugh-Hunterstown 500 kV. $15.16
b2743.1 Tap the Conemaugh-Hunterstown 500 kV line and create new Rice 500 kV and 230 kV stations. Install two 500/230 kV transformers, operated together.
VI. APPENDIX A2: Benefit/Cost Ratio Calculation PJM uses a benefit/cost ratio test to determine whether an economic-based enhancement or expansion will be
included in the RTEP. Specifically, to be included in the RTEP recommended to the PJM Board of Managers for
approval, the relative benefits and costs of the economic-based enhancement or expansion must meet or exceed a
benefit/cost ratio threshold of at least 1.25.
The benefit/cost ratio is calculated by dividing the present value of the total annual benefit for each of the first 15
years of the life of the enhancement or expansion by the present value of the total annual cost for each of the first 15
years of the life of the enhancement or expansion. Assumptions for determining the present value of the benefits and
costs (e.g., discount rate and annual revenue requirement) are considered by the PJM Board of Managers each year
to be used in the economic planning process.
The purpose of a benefit/cost ratio threshold is to hedge against the uncertainty of estimating benefits in the future
and to provide a degree of assurance that a project with a 15-year net benefit near zero will not be approved. At the
same time, the threshold is not so restrictive as to unreasonably limit the economic-based enhancements or
expansions that would be eligible for inclusion in the RTEP.
Additional information explaining PJM’s market efficiency process and the benefit/cost ratio in particular can be found
in Manual 14B, “PJM Region Transmission Planning Process,” Section 2.6 and Attachment E: https://www.pjm.com/-
Application of Transource Pennsylvania, LLCfor approval of the Siting and Construction ofthe 230 kV Transmission Lines Associatedwith the Independence Energy Connection –East and West Projects in portions of Franklinand York Counties, Pennsylvania
Petition of Transource Pennsylvania, LLC for afinding that a building to shelter controlequipment at the Rice Substation in FranklinCounty, Pennsylvania is reasonably necessaryfor the convenience or welfare of the public
::::::
Docket No. P-2018-3001878
Petition of Transource Pennsylvania, LLC for afinding that a building to shelter controlequipment at the Furnace Run Substation inYork County, Pennsylvania is reasonablynecessary for the convenience or welfare of thepublic
:::::::
Docket No. P-2018-3001883
Application of Transource Pennsylvania, LLCfor approval to acquire a certain portion of thelands of various landowners in York andFranklin Counties, Pennsylvania for the sitingand construction of the 230 kV TransmissionLines associated with the Independence EnergyConnection – East and West Projects asnecessary or proper for the service,accommodation, convenience or safety of thepublic
::::::::::
Docket No. A-2018-3001881, et al.
TRANSOURCE PENNSYLVANIA, LLC
REBUTTAL TESTIMONY OF
JUDY CHANG
STATEMENT NO. 10-R
Date: November 27, 2018
117810903v1
Q. Please state your name and business address.1
A. My name is Judy Chang. My business address is One Beacon Street, Suite 2600, Boston,2
MA 02108.3
4
Q. By whom are you employed and in what capacity?5
A. I am a Principal of The Brattle Group, an economic and finance consulting firm.6
7
Q. Please describe your professional and educational background.8
A. I have over 20 years of experience in advising energy companies on regulatory and9
financial issues, including investment decisions in transmission. I have submitted expert10
testimonies to the U.S. Federal Energy Regulatory Commission, U.S. state and Canadian11
provincial regulatory authorities on topics related to transmission planning, access, and12
pricing; resource planning; and power purchase and sale agreements. Relatedly, I have13
conducted analyses to advise clients on various topics across the energy sector, including14
evaluating proposed transmission projects, forming or expanding regional electricity15
markets, approaches to integrating renewable energy onto power systems, and proposed16
energy and environment policies. I have estimated the economic impacts associated with17
transmission and renewable energy investments and provided public policy advice to18
policymakers regarding energy investments. I have presented at a variety of industry19
conferences and have presented at graduate school seminars on energy and environmental20
policies at Harvard Law School, Tuft’s Fletcher School of Law and Diplomacy, and21
MIT’s Sloan School of Management. I hold a Bachelor of Science in Electrical22
217810903v1
Engineering and Computer Science from University of California, Davis and a Master of1
Public Policy from Harvard Kennedy School.2
3
Q. What is the purpose of your testimony?4
A. I describe the economic benefits associated with the proposed Independence Energy5
Connection Project (“IEC Project” or “the Project”). Specifically, these benefits include6
those that the project can provide to electricity customers in Pennsylvania. Further, I7
estimate the potential employment and economic stimulus impacts associated with the8
construction of the IEC Project.9
10
Q. Please describe the IEC Project.11
A. The IEC Project is an electric transmission project that is a component of PJM’s Market12
Efficiency Project 9A. The project is designed to include approximately 45 miles of new13
230 kV transmission line, separated into two segments. The western segment will14
connect from the newly constructed Rice substation located in Franklin County,15
Pennsylvania to the Ringgold substation in Washington County, Maryland. The eastern16
segment will connect from another new substation, Furnace Run, in York County,17
Pennsylvania to the Conastone substation in Harford County, Maryland. The IEC Project18
includes the construction of two new substations, one at each of the northern ends of the19
segments in Pennsylvania.20
21
Q. Please summarize the findings of your testimony.22
317810903v1
A. I present several benefits of the IEC Project that are not considered in PJM’s estimate of1
the benefits of the Project. In the first section of the testimony, I discuss how PJM’s2
estimate of the benefits from the IEC Project is conservatively low, as it only considers3
one type of benefit—transmission congestion relief—that will be provided by the Project.4
While PJM’s approach is sufficient for the purpose of PJM’s market efficiency analysis, I5
explain that additional economic benefits will accrue to Pennsylvania electricity6
customers due to the Project. These benefits include: improved reliability of the7
transmission system and avoided reliability-related transmission costs; enhanced8
operation of the PJM market; capacity market efficiencies; storm hardening; and9
insurance against extreme market conditions and different future policies that would10
significantly affect the way the electricity grid will be used.11
The second part of the testimony presents an analysis I conducted to estimate the12
employment and economic stimulus benefits to the local economies in Franklin and York13
Counties in Pennsylvania, the rest of the state of Pennsylvania, and in Maryland. That14
analysis finds that the construction of the IEC Project will support between 74 and 9315
jobs and generate between $25.6 million and $29.6 million in economic activity in16
Pennsylvania. In addition, the construction of the IEC Project will create between17
$530,000 and $660,000 in tax revenue for state and local governments within18
Pennsylvania.19
20
PD1�
Cross-Out
CVP�
Cross-Out
CVP�
Cross-Out
417810903v1
BENEFITS FROM THE IEC PROJECT FOR PENNSYLVANIA ELECTRICITY1CUSTOMERS NOT CONSIDERED IN PJM’S ANALYSIS2
Q. Various parties argue that PJM’s market efficiency analysis overstates the overall3
benefits of the IEC Project (See OCA St. No. 1, pp. 34, 42; Shaw St. No. 1, pp. 16-4
17). Do you agree with these comments?5
A. No. PJM has conducted its market efficiency analysis solely to quantify the benefits6
associated with relieving transmission congestion in PJM. However, the IEC project will7
bring other benefits to electricity users across PJM, which PJM’s analysis did not8
consider.9
10
Q. Please describe the additional benefits of the Project that you reference in your11
response above.12
A. High-voltage transmission infrastructure, like the IEC Project, provides many benefits to13
the electric power system and the associated electricity customers in the region. The14
analysis used by PJM to estimate the market efficiency benefit of the Project is focused15
on only one specific type of benefit—congestion relief in the PJM market. As described16
in the testimony of PJM Witness Horger, the IEC Project is designed to alleviate17
congestion on the AP-South constraint. This type of congestion relief is important for the18
PJM market to continue to function efficiently and provide low-cost power to all19
electricity customers in its footprint,1 but it is not the only benefit the IEC Project will20
deliver to electricity customers in the region.21
1 See Rebuttal Testimony of PJM witness Steven R. Herling, Transource St. No. 7-R.
CVP�
Cross-Out
CVP�
Cross-Out
CVP�
Cross-Out
CVP�
Cross-Out
CVP�
Cross-Out
517810903v1
The benefit analysis conducted by PJM is conservative for two reasons. First, the1
PJM analysis studies the congestion relief provided by the IEC Project only under normal2
system conditions. This ignores the type of system conditions, such as high load3
situations and system outages that typically increase transmission congestion and4
augment the value of a project like the IEC beyond those experienced under normal5
system conditions. Second, the PJM analysis considers only congestion relief benefits6
and does not account for the other benefits electricity customers in Pennsylvania will7
experience due to the construction of the IEC Project.8
9
Q. Please explain why the analysis produces conservatively low benefits when PJM10
studies only normal system conditions in determining the congestion relief benefits11
of the IEC Project.12
A. The PJM study simulates how much congestion is reduced by the IEC Project under13
normal system conditions. That means that the PJM simulation does not take into14
account any transmission outages, both expected and unexpected, or high load conditions15
driven by weather events, such as heat waves or cold snaps. System conditions, such as a16
sudden spike in load or outages, can cause congestion that is much higher than what PJM17
has simulated, often increasing the costs to electricity users. These conditions can occur18
unexpectedly, and at times in locations where PJM usually does not experience19
congestion. Transmission investments that reduce congestion, improve the robustness of20
the transmission system, and increase the efficient use of power generation across the21
PJM footprint are typically more valuable and beneficial to customers during these22
system events, that are not accounted for in PJM’s analysis of benefits.23
CVP�
Cross-Out
CVP�
Cross-Out
CVP�
Cross-Out
617810903v1
There have been several recent examples of extreme conditions or events in PJM1
that can illustrate how system congestion increases under high load or outage conditions;2
for example the Polar Vortex extreme cold conditions in January 2014 and the Cold Snap3
in December 2017 and January 2018. During both of these extreme weather and4
therefore electricity usage events, unusually high load conditions and generation outages5
caused unusually high congestion on PJM’s system. The elevated levels of congestion on6
the PJM system cause prices to spike up to abnormally high levels. For example, the7
service territories of Metropolitan Edison Co. (METED), PECO, and PPL Electric8
Utilities experienced average day-ahead wholesale electricity prices of $308/MWh,9
$311/MWh, and $308/MWh, respectively, during the 12 days from January 20–31,10
2014.2 This compares to the average day-ahead price in PJM during the year 2013 prior11
to the Polar Vortex of $37.15/MWh.312
Day-ahead congestion in the PJM market was $720 million4 in just a few days,13
from January 20–31, 2014, which represented over 32% of the annual day-ahead14
congestion for all of 2014.5 I understand that the AP-South constraint was the most15
constrained interface in PJM during that period, accounting for nearly $285 million of16
2 Average prices are calculated using the hourly day-ahead zonal prices for METED, PECO, and PPL. Datawere sourced from the ABB Velocity Suite.
3 “2013 Annual State of the Market Report for PJM Volume 2: Detailed Analysis”, Monitoring Analytics,LLC, Section 3, p. 60, March 13, 2014.
4 “PJM Cold Snap Performance December 28, 2017 to January 7, 2018,” PJM Interconnection, February 26,2018, p. 25.
5 Total day-ahead congestion in PJM during 2014 was $2,231.3 million. See “2014 State of the MarketReport for PJM Volume 2: Detailed Analysis”, Monitoring Analytics, LLC, Chapter 11, p. 389, March 12,2015.
CVP�
Cross-Out
CVP�
Cross-Out
CVP�
Cross-Out
CVP�
Cross-Out
717810903v1
day-ahead congestion during those 12 days.6 Similarly, during the 12 days from1
December 28, 2017 through January 8, 2018, the day-ahead congestion in PJM was $4352
million,7 or over two-thirds the amount of congestion experienced in the entire first3
quarter of 2018 ($641.7 million).8 None of these types of events is captured in PJM’s4
congestion relief analysis because the type of analysis conducted by PJM are based only5
on assumptions that represent normal and anticipated system conditions. Since very large6
cost savings associated with congestion relief provided by high-voltage transmission lines7
such as the IEC Project would accumulate during these types of extreme events, PJM’s8
analysis and finding of congestion relief benefits are conservative in nature.9
10
Q. Is congestion relief, including those during extreme system conditions, the only11
benefit Pennsylvania electricity customers will receive from the IEC Project?12
A. No. In addition to providing congestion relief, the IEC Project will deliver other benefits13
for electricity customers in Pennsylvania and surrounding regions. In Table 1 below, I14
list the potential values that the IEC Project is likely to deliver to Pennsylvania electricity15
users.16
6 “PJM Cold Snap Performance December 28, 2017 to January 7, 2018,” PJM Interconnection, February 26,2018, p. 26.
7 “PJM Cold Snap Performance December 28, 2017 to January 7, 2018,” PJM Interconnection, February 26,2018, p. 25.
8 “2018 Quarterly State of the Market Report for PJM: January through March”, Monitoring Analytics,LLC, Section 11, p. 501, May 10, 2018.
CVP�
Cross-Out
CVP�
Cross-Out
CVP�
Cross-Out
CVP�
Cross-Out
CVP�
Cross-Out
817810903v1
Table 1: Sample of Benefits Provided by Transmission Infrastructure Projects
Benefit Category Transmission-Provided Benefit Accounted for in
PJM Analysis ofIEC Project
Traditional ProductionCost Analysis
• Congestion relief under normal systemconditions
Additional ProductionCost Analysis
• Mitigation of extreme weather/load events andsystem contingencies
• Reduced congestion due to system outages
• Reduced transmission system losses
Reliability Benefits • Avoided or deferred reliability projects Capacity Market Benefits • Increased import/export capability between
capacity zones in PJM market Market Benefits • Enhanced competition in the PJM market
• Increased market liquidity Storm Hardening • Improved flexibility of the transmission system in
cases of damage from severe weather events Public Policy / CustomerChoice Benefits
• Reduced cost of meeting policy and othercustomers power purchase goals (e.g.,increasingly higher levels of renewable energypurchases)
Insurance Value • Having a robust and flexible transmission systemcan deliver cost savings or mitigate increasesunder uncertain market futures
Benefits Beyond 15-yearTime Horizon
• Transmission infrastructure provide benefitsthroughout its entire useful life, which is generallymuch longer than 15 years
Table 1 above provides a more comprehensive range of potential economic benefits that1
the IEC Project could provide to Pennsylvania electricity users. For example, the IEC2
Project, even though it was not approved explicitly for reliability reasons, enhances the3
reliability of the system and thereby reduces the need for future projects or upgrades to4
address reliability issues. In its latest evaluation of the benefits of the IEC Project, PJM5
PD1�
Cross-Out
PD1�
Cross-Out
PD1�
Cross-Out
CVP
Line
CVP�
Cross-Out
CVP�
Cross-Out
917810903v1
has found that if the IEC Project were not built, five additional transmission elements1
would need to be upgraded or enhanced to maintain the continued reliability of the PJM2
system.9 The five elements identified by PJM are entirely or partially located in the state3
of Pennsylvania. This means that the IEC Project, in addition to providing significant4
congestion relief and other economic benefits, maintains the reliability of the overall5
transmission system, including the grid located in Pennsylvania.10 If the IEC Project6
were not built, the reliability issues that PJM has identified would need to be addressed7
through investments in other transmission upgrades or replacements, and the costs of8
those investments would likely be paid by the electricity customers of the utilities that9
would have to address the five reliability violations in their service territories. Overall,10
PJM’s identification of these reliability needs in the absence of IEC shows that11
constructing the IEC Project avoids other reliability transmission projects and thereby12
saves ratepayers money by doing so. Such avoided reliability costs are true cost savings13
that have not been considered in PJM’s market efficiency analysis.14
As stated in Table 1, new transmission lines can further produce benefits in the15
PJM capacity market by increasing the ability to import and export capacity across the16
capacity zones within PJM’s footprint. This can help lower prices in the areas of PJM17
that have been subject to higher capacity prices, such as the eastern portions of18
9 “Transource AP-South (2014/15_9A) Project Reevaluation,” PJM Transmission Expansion AdvisoryCommittee, September 13, 2018, p. 4.
10 The five elements are: 1) a transformer at Three Mile Island, 2) a conductor on the Peach Bottom-Conastone 500kV line, 3) a conductor on the Hunterstown-Lincoln 115kV line, 4) a conductor on theLincoln Tap-Lincoln 115kV line, and 5) a conductor on the Lincoln-Straban 115kV line. The PeachBottom-Conastone 500kV line is partially located in Maryland. The other 4 elements are located inPennsylvania.
PD1�
Cross-Out
PD1�
Cross-Out
CVP�
Cross-Out
CVP�
Cross-Out
1017810903v1
Pennsylvania.11 PJM has recently identified this as an additional benefit of the IEC1
Project.122
3
Q. The PJM analysis of benefits from the IEC Project focuses on the reduction in load4
payments due to congestion relief over the first 15 years of the IEC’s useful life.5
Will the IEC Project stop providing benefits after being in service for 15 years?6
A. No. Transmission infrastructure, like the IEC Project, generally has a useful life that is7
well beyond 50 years13 and will continue to provide benefits as long as it is in service.8
The IEC project will continue to provide congestion relief and other benefits beyond the9
15 year time horizon studied by PJM. In fact, one of the benefits transmission10
infrastructure, like the IEC Project, provides electricity customers is its ability to provide11
reliability and flexibility value far into the future even when future system conditions and12
regulatory policies for the power sector are uncertain today. Transmission infrastructure,13
like the IEC Project, provides insurance value against changing system conditions in the14
future because it has a long useful life and will continue to enhance the flexibility of the15
electric grid as long as it remains in service.16
17
11 The Philadelphia Electric Co. (PECO) and Metropolitan Edison Co. (METED) areas both experiencedhigher prices than parts of western Pennsylvania, West Virginia, and Virginia in the capacity auctionconducted in May 2017 for the 2020/2021 delivery year. See 2020/2021 RPM Base Residual AuctionResults located here: https://www.pjm.com/-/media/markets-ops/rpm/rpm-auction-info/2020-2021-base-residual-auction-report.ashx?la=en
12 See “Transource AP-South (2014/15_9A) Project Reevaluation,” PJM Transmission Expansion AdvisoryCommittee, September 13, 2018, p. 5.
13 See Rebuttal Testimony of Company Witness Kamran Ali, Transource PA St. No. 2-R.
CVP�
Cross-Out
CVP�
Cross-Out
CVP�
Cross-Out
CVP�
Cross-Out
1117810903v1
Q. The Office of Consumer Advocate witness, Mr. Geoffrey C. Crandall, states that the1
addition of energy efficiency, distributed generation (including combined heat and2
power), demand response, and renewable energy resources (“non-transmission3
alternatives”) in Virginia, Maryland, and Washington DC will alleviate congestion4
on the AP-South constraint and reduce the need for the IEC Project.14 Will adding5
non-transmission alternatives in Virginia, Maryland, and Washington DC provide6
the same benefits as the IEC Project?7
A. No. The non-transmission alternatives discussed by Mr. Crandall are not able to deliver8
the full range of benefits that the IEC Project can provide. Non-transmission alternatives,9
like the resources Mr. Crandall describes, may be able to provide some of the benefits10
listed in Table 1 in the areas where they are deployed. However, the non-transmission11
alternatives cannot simultaneously provide all of those benefits across a broader section12
of the PJM footprint like the IEC Project.13
For example, as PJM’s analysis shows, the IEC Project provides congestion relief14
benefits for customers in Virginia, Maryland, and Washington DC, but the Project also15
provides reliability benefits for electricity customers in Pennsylvania in the form of16
avoided or deferred reliability investments. Non-transmission alternatives in Virginia,17
Maryland, and Washington DC may be able to reduce prices in those areas in some of the18
hours, depending on how they might be deployed and other factors on the system, but19
they will likely be unable to avoid reliability-related investments in Pennsylvania.20
In addition, the IEC Project provides insurance value against unforeseen future21
market conditions, both in the near-term and in the long-term. While non-transmission22
14 OCA St. No. 3, p. 30.
PD1�
Cross-Out
CVP�
Cross-Out
CVP�
Cross-Out
1217810903v1
alternatives can reduce load when they are activated and can be valuable, they are not1
likely to provide long-term insurance against unforeseen policies or system conditions in2
a systematic manner. For instance, the IEC Project will increase grid flexibility and the3
ability of the PJM transmission system to transfer power between Pennsylvania and4
Maryland for many decades to come. This flexibility and capability provided by the IEC5
Project can help the PJM market significantly by helping the operators manage the power6
transfers under future changes such as generation retirements or additions, shifts in the7
geographic dispersion of load, or significant changes in fuel prices.8
As an example, if power prices in the Virginia, Maryland, and Washington DC9
area decrease due to the installation of renewable energy resources, as Mr. Crandall10
suggests would be possible, the IEC Project would still provide benefits to Pennsylvania11
electricity customers by helping PJM manage the intermittent production from these new12
renewable resources and allow increasing the flows of any such low-cost energy into13
Pennsylvania. Non-transmission alternatives are local solutions and do not add flexibility14
to the transmission system like the IEC Project would be able to provide. Therefore, non-15
transmission alternatives do not always provide the same type of insurance against16
unforeseen market conditions that the IEC Project can provide.17
JOBS AND ECONOMIC STIMULUS IMPACT ANALYSIS FOR THE IEC18PROJECT19
Q. Various parties argue that the Project does not provide employment or economic20
stimulus value to Pennsylvania (see, e.g., Tr. at pp. 1060, 1075, 1101, 1128, 1135).21
Do you agree with this position?22
CVP�
Cross-Out
1317810903v1
A. No, I do not agree. In addition to the various benefits from the new transmission1
facilities outlined above, I have performed a study of employment and economic impacts2
from the Project.3
4
Q. Please summarize the results of the employment and economic impact analysis.5
A. Across Pennsylvania and Maryland, I estimate that during the construction phase of the6
Project, Transource’s investment will support the equivalent of between 85 to 112 full-7
time equivalent years (“FTE-years”) of employment,15 stimulate between $30.7 million8
and $36.8 million of economic activities, and generate between $690,000 and $900,0009
of tax revenues for state and local governments. In Pennsylvania, I estimate that the10
Project would support between the equivalent of 74 and 93 FTE-years and stimulate11
between $25.6 and $29.6 million of economic activities. In addition, the construction of12
the IEC Project will create between $530,000 and $660,000 in tax revenue for state and13
local governments within Pennsylvania14
15
Q. Please explain how you estimated the employment and economic stimulus impact of16
the IEC Project.17
A. I gathered information about the Project’s expenditures from Transource, including how18
those investment dollars would be spent across materials, equipment, and labor, to19
estimate the likely economic impact of the Project. Specifically I focused on the labor,20
15 This employment figure includes FTE-years calculated using an economic impact model (IMPLAN) andfigures provided by Transource, specifically Company Witness Stephen P. Stein. In the economic impactmodel used here, one FTE-year is equivalent to 52 weeks of 40 hour per week employment, and a singleFTE-year could be one year-long full-time position or multiple part-time positions. Transource’sestimates of FTE-years are based on a 50-hour work week, which primarily affects direct jobs.
1417810903v1
materials, and equipment supplied from within the counties and states analyzed. After1
gathering the information about the expected investment, an input-output model, called2
IMpact Analysis for PLANing or IMPLAN, is used to estimate the employment and3
economic stimulus impact associated with the IEC Project. I have assumed that the4
investment dollars associated with paying for materials, equipment, and labor that would5
be procured from outside the localities analyzed would not induce local economic6
activities. The model reports the economic activities as the value of all goods and7
services sold throughout the supply chain (such as in the form of sale and resale8
revenues). Thus, reported economic output refers to the total flow of money that occurs9
throughout the local economy examined.10
11
Q. You stated that the IEC Project is part of PJM Market Efficiency Project 9A. Did12
you quantify the economic impacts of investments other than the IEC Project that13
are part of PJM Project 9A?14
A. No, my analysis includes only the investments made by Transource as part of the IEC15
Project. While I understand that Project 9A also includes additional investments by other16
utilities, I did not estimate the potential economic impacts from investments other than17
the IEC Project.18
19
Q. Please describe the IMPLAN model and your use of the model.20
A. IMPLAN is a well-established industry-standard model used by economists to estimate21
how an economy responds to a change in expenditures and adjusts in a way that the22
overall quantity of goods and services produced balances with the quantity consumed23
1517810903v1
across the economy.16 Input-output models contain detailed relationships between the1
“outputs” of certain activities across various sectors of the economy (such as constructing2
new transmission infrastructure), to their required “inputs,” (such as salaries paid to3
workers, spending on certain materials for the project, and the up-stream processes of4
producing the necessary materials and equipment that would be used in the project). It is5
an industry-standard approach to use an input-output model to estimate the impact of6
infrastructure investments on the various sectors of a state’s or region’s economy. The7
results that I report in this testimony can be interpreted as the economic activities that8
take place in the localities analyzed when Transource invests in the IEC Project.9
10
Q. What are the economic effects that you estimate using IMPLAN?11
A. The impacts that I estimate using the IMPLAN model include: (1) the number of jobs12
supported in each county or state (measured in full-time-equivalent years or FTE-years);13
(2) the economic activities associated with the Project (increases in “economic output” as14
measured in total sales and resale revenues of businesses within the areas analyzed); and15
(3) the likely state and local tax revenues collected due to the Project during construction.16
These effects are reported by IMPLAN as direct, indirect, or induced effects.17
Direct effects represent the changes in employment and economic activities in the18
industries that directly support the investment. For example, the investment in the IEC19
Project would include direct spending on design, engineering, and construction services.20
16 The IMPLAN economic impact modeling system is developed and maintained by the IMPLAN GroupLLC, which has continued the original work on the system done at the University of Minnesota in closepartnership with the U.S. Forest Service’s Land and Management Planning Unit. IMPLAN divides theeconomy into 440 sectors and allows the user to specify the expenditure allocations associated with agiven expansion in demand to all relevant parts of the local economy in order to derive the economicimpacts—changes in employment, earnings, and economic output.
1617810903v1
Indirect effects measure the changes in the supply chain and inter-industry purchases1
associated with the transmission project, including the upstream activities associated with2
the construction and manufacturing of the equipment and materials used in the Project.3
These activities include, for example, the revenues for and the employment associated4
with the suppliers of transmission equipment and installation supplies, such as concrete.5
Induced effects represent the increased spending on housing, food, clothing, and other6
products and services by those directly or indirectly employed in the development and7
construction of the Project.8
9
Q. Which regions did you analyze in your economic impact analysis of the IEC10
Project?11
A. I analyzed the economic impact of the IEC Project in four distinct regions: (1) Franklin12
County, Pennsylvania; (2) York County, Pennsylvania; (3) the remaining part of13
Pennsylvania (“Rest of PA”), and (4) Maryland.14
15
Q. When Transource invests in Maryland for the IEC Project, would there be any spill-16
over effects in Pennsylvania? If so, have you analyzed the cross-regional effects?17
A. Yes, when spending occurs in Maryland, there may be spill-over effects into18
Pennsylvania, and vice versa. I use IMPLAN’s Multi-Regional Input-Output (MRIO)19
model to estimate the likely economic impact of Transource’s investment in each region20
separately, which automatically accounts for cross-regional impacts. Even though the21
investment dollars are provided based on the location of the spending, the model22
considers the interactions among employment, taxes, trade flows, and other aspects of the23
1717810903v1
local economy such that the results capture the spill-over effects that would occur due to1
the movements of workers and goods traded across the jurisdictional borders. For2
example, when using the IMPLAN MRIO model, the investment dollars assumed to be3
made by Transource in Franklin County, PA would affect the regional economy and may4
yield indirect and induced effects in the surrounding areas, including York County, PA,5
other parts of Pennsylvania, and Maryland. Thus, in reporting the estimated economic6
impact, I pay particular attention to account for the interactions across county and state7
boundaries.8
9
Q. Why did you model Pennsylvania as three regions and Maryland as one region?10
A. I modeled the states differently due to the geographic distribution of the proposed project.11
The IEC Project will include over 37 miles of new transmission line in Pennsylvania and12
approximately 7.5 miles of new transmission line in Maryland. Since a significant13
portion of the physical infrastructure will be constructed in Pennsylvania, I separately14
estimated the economic impact on Franklin and York Counties in Pennsylvania, as well15
as the rest of Pennsylvania.16
17
Q. How did you estimate the investment expenditures associated with the IEC Project?18
A. I obtained the investment expenditures by spending category and location from19
Transource, specifically from Company Witness Stephen P. Stein. Those expenditure20
data reflect the best estimate of the local spending associated with building the IEC21
Project. For the purpose of this study, I use only the investments that will be made in the22
regions of interest: Pennsylvania and Maryland. For example, if Transource plans to23
1817810903v1
purchase materials or equipment from outside the two states, the amount budgeted for1
that spending is not included in my analysis because I assume that any spending outside2
of Pennsylvania and Maryland would not affect the economic activities in the two states3
of my focus. Similarly, any expenditures budgeted to hire workers from outside of the4
two states is assumed not to contribute toward the economic stimulus impact in the two5
states. One exception is the budget for paying for out-of-area workers’ that will be6
working within Pennsylvania and Maryland on the construction of the IEC Project. The7
budgeted amount for lodging and meals for out-of-area works, in the form of “per-diem,”8
is included in my analysis because I assume that those dollars would likely be spent on9
lodging and restaurants located in Pennsylvania and Maryland, which in turn contributes10
toward the local economies. I will explain how I estimated per-diem expenditures11
following a discussion of the other expenditures.12
13
Q. Please summarize the expenditures analyzed in the economic impact analysis.14
A. The investment expenditures data were provided by Transource Witness Stephen P. Stein15
and a high and low estimate are summarized in Table 2 below. The table provides a16
range of the local investment dollars categorized by the type of spending. Specifically,17
Table 2 shows the estimated expenditures on materials and services that will be sourced18
from within the various localities analyzed, taxes paid on materials and services sourced19
from the local economy, earnings for in-area workers and other payments to local20
entities, and spending on food and lodging for out-of-area workers (per-diem spend).21
1917810903v1
The direct expenditures on materials and services that Transource expects to spend in the1
local economy, as shown in Table 2, exclude my estimates of the state and local taxes.2
The estimates of the taxes are shown in row 2 of Table 2.3
Table 2: Estimated Local Project Expenditures in Pennsylvania and MarylandBased on Cost Categories
Note: The expenditures listed in this table include only the portion of total project costs Transource plans to spendlocally in Pennsylvania and Maryland. Therefore, the range of $23.8 to $27.6 million shown in the table does notrepresent the total project costs, only the portion that will be spent locally. Values are rounded to the nearest$1,000.
Q. How did you allocate the Project’s local spending to Pennsylvania and Maryland?4
A. The investment amounts shown in Table 2 are allocated to the four regions based on the5
proportion of new transmission line miles being built in each region. For example, the6
proposed project will build 24.4 miles of new transmission line in Franklin County, PA,7
which is 55% of total line miles being constructed. Therefore, 55% of the local8
investment is allocated to Franklin County.17 This allocation of the investment dollars by9
line miles is used to represent how spending would affect the local economies due to the10
relative amount of spending and the associated structures of the local economies. Table 311
below shows the investment dollars that I estimate Transource would spend for the IEC12
17 For a subset of categories of expenditures, Transource was able to provide more specific estimates of localspend; this is why “Rest of PA” has direct expenditures in Table 3 despite not having any line miles oftransmission.
Cost Category Low Estimates High Estimates
Materials and Services [1] $6,928,000 $8,503,000
Taxes on Materials & Services [2] $26,000 $36,000
Local Labor Compensa�on & Other Payments [3] $14,778,000 $16,632,000
Per Diem Spend [4] $2,107,000 $2,384,000
Total [5] $23,839,000 $27,555,000
2017810903v1
Project in Pennsylvania and Maryland based on the high and low estimates provided by1
Transource. These investment assumptions are used as input assumptions in the2
IMPLAN model.3
Table 3: Summary of IMPLAN Inputs for Analyzing Impacts on Pennsylvania and Maryland(in $thousands)
Notes: Values are rounded to the nearest $1,000..
4Q. Please explain how you have estimated the taxes from the direct effects associated5
with the Project investment dollars included in Table 2 and Table 3?6
A. I estimated the state and local tax revenues from direct spending on labor and materials7
shown in Table 2 and Table 3 using the IMPLAN model. Specifically, the IMPLAN8
model contains data and information on the tax rates assessed on the purchases of9
materials and services across various sectors of the economy. Thus, I used those data to10
estimate the amount of state and local taxes that Transource would likely pay when the11
investment dollars are spent on the local purchases of materials and services across the12
regions analyzed. The tax rate assumptions contained in the IMPLAN model are not13
specific to the construction of new transmission projects like the IEC. Thus, I used the14
tax rates typically used for the construction of new highways and streets as a proxy for15
Franklin (PA) York (PA) Rest of PA MD Total
Cost Category Low High Low High Low High Low High Low High
estimating the local taxes likely to be associated with Transource’s purchases of its1
project-related materials and services.182
The estimated state and local taxes associated with the purchase of materials and3
services for the Project are shown in row 2 of Table 2. I estimate that Transource will4
pay between $26,000 and $36,000 in state and local taxes when purchasing local5
materials and services across Pennsylvania and Maryland. However, additional direct,6
indirect, and induced tax revenues will materialize. For example, the money spent by7
Transource to hire local workers and purchase materials or services from local businesses8
will ripple through the economy, creating additional tax revenue for local and state9
governments.10
11
Q. Please explain how you estimate the “per-diem” expenditures shown in Table 2 and12
Table 3?13
A. The food and lodging expenditures (depicted as “per-diem spend”) will have an impact14
on the local economies where the IEC Project is being constructed. The per-diem15
expenditures, shown in row 4 of Table 2 and row 4 of Table 3, are based on information16
taken from the U.S. General Services Administration’s (“GSA”) per-diem rates17
18 It is reasonable to use same tax rates for the construction of new highways and streets as for taxes arisingfrom Transource’s direct expenditures on the IEC because Transource’s estimates of local spending on theIEC Project and highway projects have significant similarities in terms of the sectors of the economy theyaffect. This means that due to the lack of a specific tax rate that would be applied when purchasingmaterials and services to build the IEC Project, I have implicitly assumed that the tax rates on the materialsand services for the IEC Project are similar to those that would be applied when purchasing the materialsand services associated with the construction of new highways and roads. Specifically, I used the level oflocal taxes that the IMPLAN model estimates for the amount of local IEC Project spending. I used thisamount as the estimate of Transource’s local taxes paid when purchasing material and services. The useof this proxy industry applies only to the estimation of direct-effect taxes. The other economic impactsdescribed in this report, including the indirect and induced taxes, are estimated by building a customindustry in IMPLAN based on the specific sectors of the local economy Transource will impact through itsinvestment.
2217810903v1
designated for Pennsylvania and Maryland. The GSA establishes the per-diem rates for1
lodging and food to reimburse federal government employees for work-related travel.2
For fiscal year 2018, which runs from October 2017 through September 2018, the GSA3
has established a rate of $93/day for lodging and $51/day for meals and incidentals as the4
standard rate for Pennsylvania and Maryland.19 The salaries of out-of-area workers are5
not included in this analysis since I assume that all of the salaries for out-of-area workers6
would be spent outside of Pennsylvania and Maryland. I obtained information from7
Transource for the estimated number of out-of-areas workers to be employed on the IEC8
Project during construction. Transource estimates that the out-of-area workers will range9
between 56 and 64, and that construction will last approximately one year. Therefore, I10
estimate the amount of per-diem spend as the number of out-of-area workers times 26011
workdays in the year (five days a week times 52 weeks in the year), times the per-diem12
rates specified by GSA.13
I assume that the per-diem paid to out-of-area workers will be spent in the areas14
where the IEC Project will be constructed. The portion of the per-diem spent on lodging15
is allocated to the hotels and motels industry, while the portion spent on meals and16
incidentals is allocated to three food service sectors—food and beverage stores (e.g.,17
grocery stores), full-service restaurants, and limited-service restaurants.18
19
Q. How do the inputs shown in Table 2 influence direct versus indirect and induced20
effects?21
19 The standard rate for each state applies in all areas where the IEC Project is being constructed. See dataprovided on GSA’s website: https://www.gsa.gov/travel/plan-book/per-diem-rates.
2317810903v1
A. All of the expenditures shown in Table 3 represent local spending and as a result produce1
direct effects. The indirect and induced effects from expenditures depend on where local2
business procure materials and services. For example, if Transource purchases certain3
equipment from a supplier in Pennsylvania, the amount spent for those purchases would4
be considered local spending; this local spending would contribute to the direct effects of5
the IEC Project. But if that local supplier does not source all of the equipment sold to6
Transource locally, that “next layer” of local spending would reduce the level of indirect7
and induced effects on the economy of Pennsylvania compared to a situation where all of8
the upstream resources and services were procured locally. As a result, the indirect and9
induced effects may be lower than the direct effects.10
11
Q. How did you estimate what portion of the investment dollars spent locally on12
materials and services would produce indirect effects?13
A. For each category of investment in materials and services listed in Table 3 above, I used a14
combination of default assumptions contained within the IMPLAN model and15
assumptions provided by Transource as to the amount that likely would be provided by16
suppliers within the local region studied. These assumptions do not alter the total amount17
spent locally (which is shown in Table 3 above), they affect only the indirect and induced18
effects associated with the direct spending.19
Within the IMPLAN model, the portion of each sector that is procured locally is20
reflected within the Local Purchase Percentage (“LPP”). The LPP assumptions included21
in the IMPLAN model incorporate the likely regional impacts of the local direct spending22
made in each industry sector, and the default LPP percentages in IMPLAN are derived23
2417810903v1
from data from the U.S. Bureau of Economic Analysis, the U.S. Census Bureau, and the1
analyses of regional trade-flow patterns. For example, an LPP of ten percent results in2
ten cents of every dollar spent in the modeled region and ninety cents spent elsewhere.3
I reviewed the LPP for each category of materials and services listed in Table 44
with Transource’s procurement team to determine if the percentage of locally sourced5
materials and services is relatively accurate for the IEC Project. For most of the materials6
and services categories, I retained the default LPP assumptions that are contained in the7
IMPLAN database. However, for certain categories I adjusted the default LPPs to reflect8
the Project specific information provided to me by Transource. If Transource knows that9
a likely vendor of a material or service will procure 100% of inputs from local sources, I10
reflect that in the input used in IMPLAN. For example, if Transource is planning to hire11
an environmental consulting firm with offices located in Pennsylvania, I assume that12
100% of the money spent to hire that firm will be procured in Pennsylvania based on the13
information provided to me by Transource, whereas IMPLAN’s default assumption may14
be only 68% of expenditures on environmental consulting will be procured locally in15
Pennsylvania. The percentages of how each spending would be sourced locally for each16
category of materials and services are presented in Table 4 below.17
2517810903v1
Table 4: Local Purchase Percentages (LPP) Used in the Modeling
Source: IMPLAN’s Regional Social Accounting Matrices adjusted to reflect estimates of localprocurement provided by Transource.
The local direct investment shown in Table 3 and the LPPs presented in Table 41
make up the main inputs used in simulating the effect of the Project-related expenditures2
on local economies. After these inputs are finalized, the IMPLAN model is used to3
simulate the economic impacts of the investment dollars spent in each of the regions of4
interest.5
6
Q. Please summarize the results of your analysis.7
A. The simulated economic benefits for Franklin County, York County, and the remaining8
part of Pennsylvania are presented in Table 5. The results are broken into three9
categories: (1) the number of jobs supported (measured in full-time equivalent years); (2)10
the amount of economic activity stimulated; and (3) the state and local taxes generated by11
the Project.12
Sector Description Franklin (PA) York (PA) Rest of PA MD
Sand and Gravel Mining [1] 11% 32% N/A 48%
Ready-Mix Concrete [2] 3% 9% N/A 58%
Construction of New Roadways [3] 100% 100% N/A 100%
Waste Management [4] 100% 100% N/A 95%
Spring and Wire Products [5] 0.01% 5% N/A 13%
Real Estate [6] N/A N/A 100% N/A
Architectural and Engineering [7] 45% 77% 100% 92%
Environmental Consulting [8] 37% 45% 100% 91%
Legal Services [9] N/A N/A 100% 100%
Food and Beverage Stores [10] 87% 86% N/A 99%
Full-Service Restaurants [11] 73% 72% N/A 82%
Limited-Service Restaurants [12] 84% 83% N/A 90%
Hotels and Motels [13] 0.02% 0.1% N/A 2%
2617810903v1
Table 5: Economic Impact of the IEC Transmission Project for Pennsylvania
Notes: Values rounded to the nearest $100,000 for Economic Activity and nearest $10,000 for State andLocal Taxes. Direct FTE-years include Transource’s estimates, which are based on a 50-hour work week.IMPLAN FTE-year results assume a 40-hour work week.
Table 5 shows that the IEC project is expected to support 25 to 35 full-time jobs1
in Franklin County and between 15 and 21 full-time jobs in York County during2
construction. The project is expected to stimulate $12.6 million to $14.7 million in3
economic activity within Franklin County, and an additional $7.1 million to $8.3 million4
of economic activity within York County while under construction. The jobs supported5
and the economic activity stimulated in Franklin and York Counties represent about half6
of all the job-supported and two-thirds of local economic activity stimulated by the IEC7
project. As discussed in the previous section, the majority of the jobs supported and8
economic activity stimulated occur within Franklin and York Counties because the9
majority of the new transmission line and the two new substations will be constructed in10
these two counties. Lastly, Table 5 indicates that in Franklin County, the IEC project is11
Franklin County York County Rest of Pennsylvania
Impact Type Low High Low High Low High
Jobs Supported (FTE-years)
Direct Effect [1] 11 16 6 9 19 21
Indirect Effect [2] 6 7 4 5 5 6
Induced Effect [3] 8 12 5 7 10 11
Total Effect [4] 25 35 15 21 34 37
Economic Activity Simulated (thousands $)
Direct Effect [5] $10,700 $12,200 $5,600 $6,400 $2,700 $3,000
Total Effect [8] $12,600 $14,700 $7,100 $8,300 $5,900 $6,600
State and Local Taxes (thousands $)
Direct Effect [9] $80 $110 $40 $50 $90 $110
Indirect Effect [10] $20 $20 $20 $20 $50 $50
Induced Effect [11] $70 $100 $50 $70 $110 $130
Total Effect [12] $170 $230 $110 $140 $250 $290
2717810903v1
expected to generate between $170,000 and $230,000 of state and local taxes while under1
construction. Likewise, in York County, the project is expected to generate between2
$110,000 and $140,000 in state and local taxes.3
Table 5 also presents the results for the rest of the state of Pennsylvania, outside4
of Franklin and York Counties. In the remainder of the state, I estimate that the IEC5
project will support between 34 and 37 FTE-year jobs, stimulate between $5.9 million6
and $6.6 million of economic activities, and generation between $250,000 and $290,0007
of state and local tax revenues. These economic benefits are in addition to the benefits8
seen in Franklin and York Counties.9
The sum of Pennsylvania and Maryland economic benefits, which represent the10
total local economic benefits that I estimate from Transource’s investments in the IEC11
Project, is shown in Table 6.12
2817810903v1
Table 6: Economic Impact of the IEC Transmission Project forPennsylvania and Maryland
Notes: Values rounded to the nearest $100,000 for Economic Activity and nearest $10,000 for State andLocal Taxes. Direct FTE-years include Transource’s estimates, which are based on a 50-hour work week.IMPLAN FTE-year results assume a 40-hour work week.
The number of jobs supported by the IEC Project is presented in rows 1–4 of1
Table 6 above. The results indicate that Transource’s investment in the IEC transmission2
project would support between 85 and 112 full-time FTE-years during construction, of3
which 74 to 93 would be in Pennsylvania. Rows 5–8 of Table 6 show that construction4
of the IEC Project would generate between $30.7 million and $36.8 million of economic5
activity in Pennsylvania and Maryland combined. Of this total, $25.6 million to $29.66
million would be in the state of Pennsylvania.7
The overall economic activities stimulated are larger than the total local8
investment associated with the IEC Project because each dollar spent would have a9
rippling effect through the economy. For example, a dollar paid to a worker hired to10
Pennsylvania Maryland Total
Impact Type Low High Low High Low High
Jobs Supported (FTE-years)
Direct Effect [1] 36 45 6 7 41 52
Indirect Effect [2] 16 17 2 5 17 23
Induced Effect [3] 22 30 4 7 26 37
Total Effect [4] 74 93 11 19 85 112
Economic Activity Simulated (thousands $)
Direct Effect [5] $19,000 $21,600 $3,400 $4,300 $22,400 $25,900


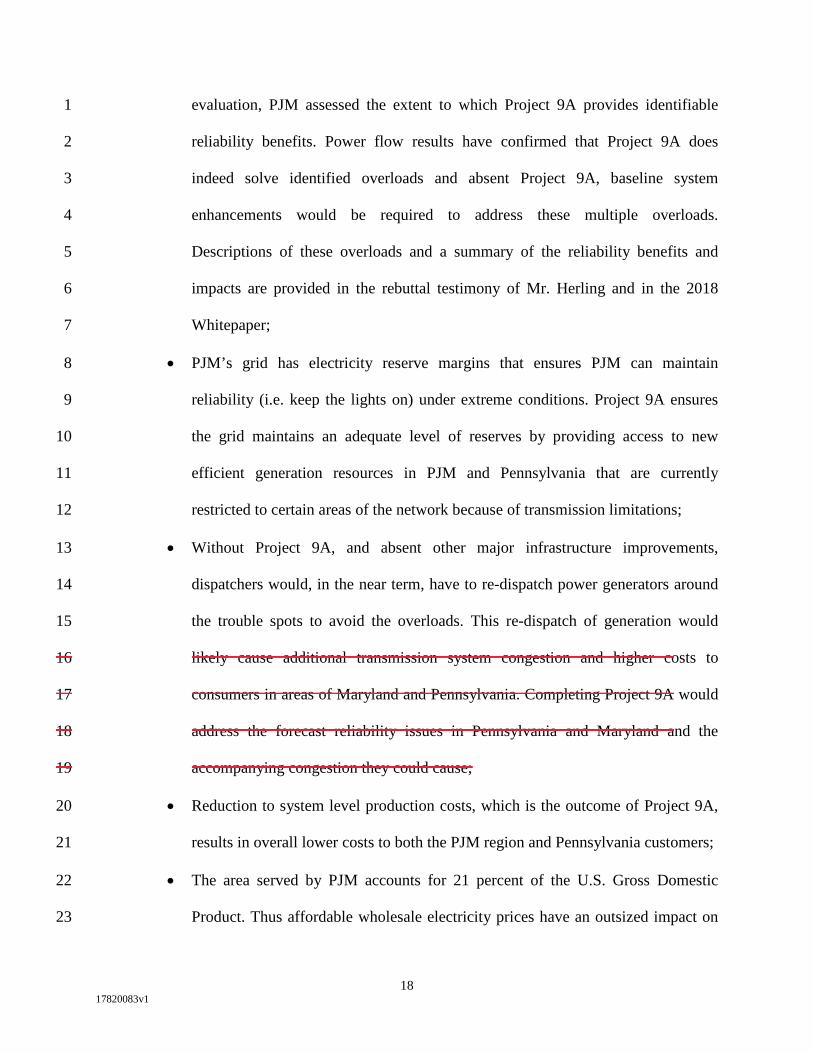


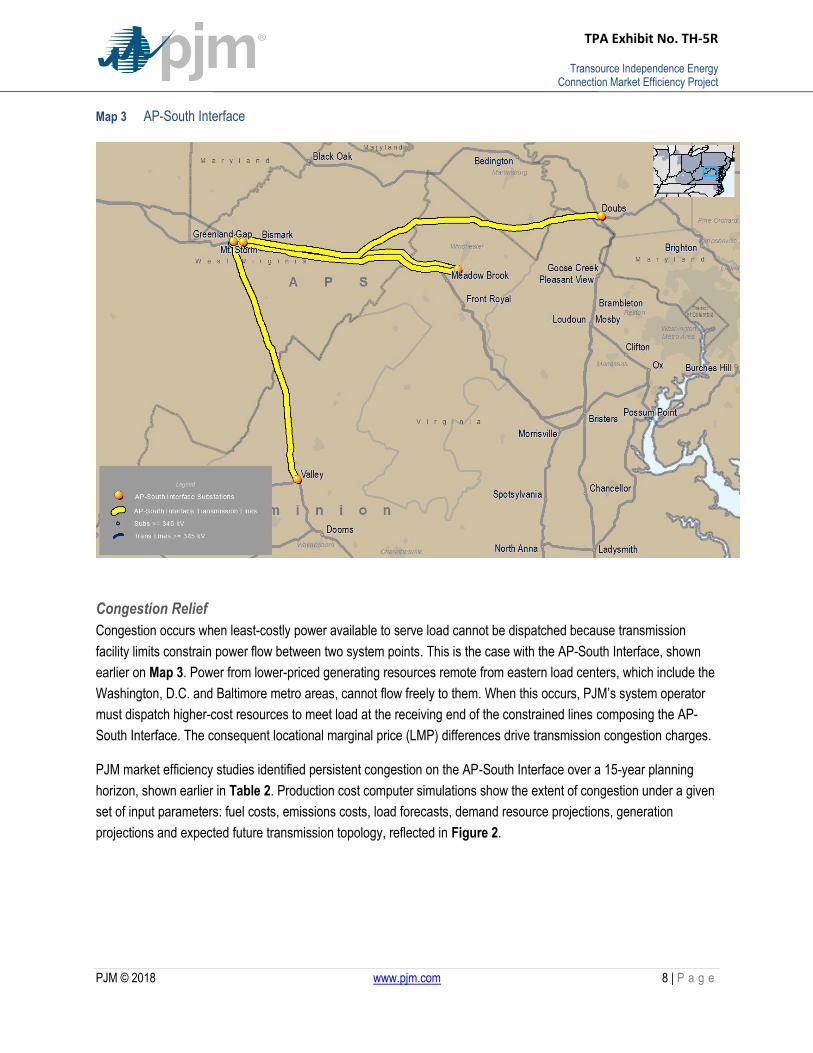


![Waldron Religion and Public Deliberation[1]](https://static.documents.pub/doc/80x56/54f7de114a79593f188b5038/waldron-religion-and-public-deliberation1.jpg)


