1 Adapted from “The Big Ideas of UbD” by Grant Wiggins and Jay McTighe, 2004. CELF Summer Institute ‘10 Subject: Mathematics/Pre-Algebra Grade: 7-8 th School: Boston Latin School [public] MA Teacher: Sarah M Unit Title: The Ecological Footprint– Scatter Plots Introduction Kim Green and I sat down and listed topics that could be used in the sustainability curriculum. We then each chose 2 topics that we wanted to focus on so that we could put them together to form a unit. There were other topics that were brought up but not included in our submitted work. However, we both would be implementing those topics throughout the year while teaching. We wrote up our 2 lesson plans individually after discussing them together. We also met over several iterations to edit, and give each other feedback and suggestions. The following are my ideas/contributions to Kim’s chosen two lesson plans: Compare bulbs to see which type we can challenge students to use at home End the unit with a hands-on project Discuss how the project would include the three earlier topics: scatter plots, percent of change, and system of equation Check out websites like Sears.com to compare existing household appliances Include percent of change (in terms of savings) when comparing the appliances The following are Kim’s ideas/contributions to my chosen two lesson plans: Choice of some of the data for teacher to present in class Include a homework for scatter plot by getting students to plot one with a different set of data Discuss outliers and/or reasons for them Calculate only the percent of change with respect to the ecological balance, instead of the change that occur with students’ change in lifestyle – it was too complicated at this mathematics level
Transcript
1
Adapted from “The Big Ideas of UbD” by Grant Wiggins and Jay McTighe, 2004.
CELF Summer Institute ‘10 Subject: Mathematics/Pre-Algebra Grade: 7-8th
School: Boston Latin School [public] MA Teacher: Sarah M Unit Title: The Ecological Footprint– Scatter Plots
Introduction Kim Green and I sat down and listed topics that could be used in the sustainability curriculum. We then each chose 2 topics that we wanted to focus on so that we could put them together to form a unit. There were other topics that were brought up but not included in our submitted work. However, we both would be implementing those topics throughout the year while teaching. We wrote up our 2 lesson plans individually after discussing them together. We also met over several iterations to edit, and give each other feedback and suggestions.
The following are my ideas/contributions to Kim’s chosen two lesson plans:
Compare bulbs to see which type we can challenge students to use at home
End the unit with a hands-on project
Discuss how the project would include the three earlier topics: scatter plots, percent of
change, and system of equation
Check out websites like Sears.com to compare existing household appliances
Include percent of change (in terms of savings) when comparing the appliances
The following are Kim’s ideas/contributions to my chosen two lesson plans:
Choice of some of the data for teacher to present in class
Include a homework for scatter plot by getting students to plot one with a different set
of data
Discuss outliers and/or reasons for them
Calculate only the percent of change with respect to the ecological balance, instead of
the change that occur with students’ change in lifestyle – it was too complicated at this
mathematics level
1 Adapted from “The Big Ideas of UbD” by Grant Wiggins and Jay McTighe, 2004.
Lesson 2 – Percent of Change ......................................................................................................... 5
Appendix A – Scatter Plot Worksheet .......................................................................................... 10
Appendix B – Scatter Plot Homework........................................................................................... 12
Appendix C – Percent of Change Homework ................................................................................ 13
Appendix D – Percent of Change Worksheet................................................................................ 17
Lesson 1 – Scatter Plots
MA State Standards addressed by the lesson: 8.P.1 Extend, represent, analyze, and generalize a variety of patterns with tables, graphs,
words, and, when possible, symbolic expressions. Include arithmetic and geometric
progressions, e.g., compounding.
8.D.2 Select, create, interpret, and utilize various tabular and graphical representations of data,
e.g., circle graphs, Venn diagrams, scatterplots, stem-and-leaf plots, box-and-whisker
plots, histograms, tables, and charts. Differentiate between continuous and discrete data
and ways to represent them.
National Education for Sustainability Standards addressed by the lesson: 1.1 [Intergenerational Responsibility] Responsibility to Future Generations – Students analyze
and list their roles and responsibility in their family, their school, and their community, now
and into the future
2.4 [Social and Cultural Systems] Resources Distribution – Students compare the distribution of
a common resource (e.g. money, food) of different groups of people in their own
community, region, nation, or world and explain how this resource distribution affects
sustainability.
This document includes lesson plans, classwork and homework for students at the 7th grade level for Pre-Algebra for the topics of Scatter Plots and Percent of Change. It seeks to include sustainability for educating the students for the present and future generations.
2 Adapted from “The Big Ideas of UbD” by Grant Wiggins and Jay McTighe, 2004.
Brief Summary of Unit (including curricular content and unit goals):
Scatter plots can be used to show the relationship between two sets of data. In a scatter plot,
two sets of data are graphed as ordered pairs on a coordinate system. Scatter plots can then be
used to check the types of relationship or patterns of the two data sets.
It shows a positive relationship when the values of one variable increases, the other also
increases. It shows a negative relationship when the values of one variable increase while the
other decreases. If there is no obvious pattern, there is no relationship between the two data
sets.
Stage 1 – Identify desired results
Enduring understandings (what understandings are desired?):
Students will understand…
• What ecological footprint means
• What biocapacity means
• Their role and responsibility in their family, their school and their community and the
impact of decisions made today on the future
• How to develop and evaluate inferences and predictions that are based on data
Essential questions (what essential questions will be considered?):
How do elements in a system depend on each other?
How is mathematics used as a tool in the world around us?
Outcomes (what key knowledge and skills will students acquire as a result of this lesson/unit?)
Students will be able to…
• Graph and understand a scatter plot
• See the trends of the usage of earth’s resources, in this case, productive land with
respect to human development
3 Adapted from “The Big Ideas of UbD” by Grant Wiggins and Jay McTighe, 2004.
• Compare ecological footprints of different countries
Stage 2 – Determine acceptable evidence
Performance tasks (what evidence will show that students understand?):
Students will be grouped to select additional countries, each from different
regions/continents as well as ones that would represent different human development
and ecological footprints.
Students will draw and label axes on a coordinate graph and plot the given data, as well
as the ones they have chosen.
Students will see if the scatter plot shows any relationship.
Students will make predictions and infer from the data the general trend.
Students will discuss outlying points.
Other evidence (quizzes, tests, prompts, observations, dialogues, work samples):
Students will identify the countries selected.
Students will research and provide 2 reasons for the trend they are seeing.
Students will choose some data and present their findings in a scatter plot.
For extra credit, students can research on why some countries have high human
development but yet a small ecological footprint.
4 Adapted from “The Big Ideas of UbD” by Grant Wiggins and Jay McTighe, 2004.
Stage 3 – Learning plan
Learning activities (what will students do and what will you, the teacher do, to prepare the students to achieve the desired outcomes?): Prerequisite Skills and Knowledge:
Students will have basic knowledge of the mathematical operations.
Students will already have some knowledge of graphing.
Possible Misconceptions before and during lesson:
Students may confuse the x-axis and y-axis.
Students are not able to plot with the correct intervals.
Students may not see the trend if their data was plotted too closely together.
Students may not choose data that would provide a wider range of details, including
that of outliers.
Students may not see the relationship between the ecological footprints of various
countries with respect the human development indexes.
Materials Needed:
Scatter Plot Worksheet (Appendix A)
Graph paper
Transparency
Transparency pens
Overhead projector
Scatter Plot Homework (Appendix B)
Procedure:
Teacher will explain terminologies, including ecological footprint, human development.
Teacher will prepare sheets containing data for the human development index and
ecological footprints of various countries.
Students will perform the classwork in groups of 3 to 4; plotting a scatter plot of
different regions of the world showing a relationship between the two factors on a
transparency. (Appendix A)
Students will present their findings to the class.
5 Adapted from “The Big Ideas of UbD” by Grant Wiggins and Jay McTighe, 2004.
Teacher will pull together all the different group transparency to show the general trend
of the world.
Students will discuss in groups the possible reasons for the outliers.1
Students will plot a scatter plot of choice for homework and present their research to
the class for discussion.2 (Appendix B)
Lesson 2 – Percent of Change
Lesson title: The Ecological Footprint – Percent of Change
MA State Standards addressed by the lesson: 8.N.10 Estimate and compute with fractions (including simplification of fractions), integers,
decimals, and percents (including those greater than 100 and less than 1).
8.N.11 Select and use appropriate operations—addition, subtraction, multiplication, division,
and positive integer exponents—to solve problems with rational numbers (including
negatives).
8.D.2 Select, create, interpret, and utilize various tabular and graphical representations of
data, e.g., circle graphs, Venn diagrams, scatterplots, stem-and-leaf plots, box-and-
whisker plots, histograms, tables, and charts. Differentiate between continuous and
discrete data and ways to represent them.
National Education for Sustainability Standards addressed by the lesson:
1 Sustainability Standard 1.1 [Intergenerational Responsibility] Responsibility to Future
Generations – Students analyze and list their roles and responsibility in their family, their
school, and their community, now and into the future
2 Sustainability Standard 2.4 [Social and Cultural Systems] Resources Distribution –
Students compare the distribution of a common resource (e.g. money, food) of different
groups of people in their own community, region, nation, or world and explain how this
resource distribution affects sustainability.
6 Adapted from “The Big Ideas of UbD” by Grant Wiggins and Jay McTighe, 2004.
1.1 [Intergenerational Responsibility] Responsibility to Future Generations – Students
analyze and list their roles and responsibility in their family, their school, and their
community, now and into the future
2.2 [Ecological Systems] Ecological Footprint – Using standard footprint calculation models,
students determine the impact of their lifestyle decisions such as transportation, food, and
housing choices
2.4 [Social and Cultural Systems] Multiple Perspectives – Students consider an issue or
challenge related to sustainability, through a variety of lenses or perspectives and they
explain how approaching that issue or challenge from different perspectives may result in
different decisions and outcomes.
3.1 [Personal Action] Personal Responsibility – Students know the difference between actions
that they can take themselves and those that require the involvement of other people,
organizations, and government. They identify and carry out a personal action that will
enhance quality of life in environment, social/culture, or economic sectors.
3.1 [Personal Action] Personal Footprint Calculation – Students use an online calculator to
determine their ecological footprint.
Brief Summary of Unit (including curricular content and unit goals):
The concept of proportionality is the foundation of many branches of mathematics, including
geometry, statistics, and business math. Percent of change can be used to solve problems in
real-life situations. A percent of change tells the percent an amount has increased or decreased
in relation to the original amount. When an amount increases, the percent of change is a
percent of increase. When an amount decreases, the percent of change is a percent of decrease.
In this lesson, we will be finding the difference between one’s ecological footprint and the
biocapacity. We will then use the difference (amount of change) to find percent of change, and
show what percent of change would need to be made to obtain biocapacity.
7 Adapted from “The Big Ideas of UbD” by Grant Wiggins and Jay McTighe, 2004.
Stage 1 – Identify desired results
Enduring understandings (what understandings are desired?):
Students will understand…
What ecological footprint means
What biocapacity means
Their role and responsibility in their family, their school and their community and the
impact of decisions made today on the future
Understand numbers, ways of representing numbers, relationships among numbers,
and number systems
Analyze change in various contexts
Essential questions (what essential questions will be considered?):
How do elements in a system depend on each other?
How is mathematics used as a tool in the world around us?
Outcomes (what key knowledge and skills will students acquire as a result of this lesson/unit?)
Students will be able to…
Use an online calculator to determine their ecological footprint.
Determine the impact of their lifestyle decisions such as transportation, food, and
housing choices
Know the difference between actions that they can take themselves and those that
require the involvement of other people, organizations, and government
Consider an issue or challenge related to sustainability, through a variety of lenses or
perspectives and then explain how approaching that issue or challenge from different
perspectives may result in different decisions and outcomes
8 Adapted from “The Big Ideas of UbD” by Grant Wiggins and Jay McTighe, 2004.
Stage 2 – Determine acceptable evidence
Performance tasks (what evidence will show that students understand?):
Students will calculate their ecological footprints3 with the help of their parents as
homework.4
Students will understand components of the make-up of an ecological footprint.
Students will re-calculate their ecological footprint, taking into consideration some ways
they can change their lifestyle by re-taking the quiz.
Students will analyze the change.
Students will discuss what percent of change they must make to reduce their ecological
balance to zero.
Other evidence (quizzes, tests, prompts, observations, dialogues, work samples):
Discussion of a commitment to change to improve ecological footprint.
Stage 3 – Learning plan
Learning activities (what will students do and what will you, the teacher do, to prepare the students to achieve the desired outcomes?): Prerequisite Skills and Knowledge:
Students will have basic knowledge of the mathematical operations.
Students will already have some knowledge of percent.
3 Sustainability Standard 3.1 [Personal Action] Personal Footprint Calculation – Students
use an online calculator to determine their ecological footprint.
4 Sustainability Standard 1.1 [Intergenerational Responsibility] Responsibility to Future
Generations – Students analyze and list their roles and responsibility in their family, their
school, and their community, now and into the future
9 Adapted from “The Big Ideas of UbD” by Grant Wiggins and Jay McTighe, 2004.
Students will know how to find the difference when a number has been changed.
Students will know their ecological footprint and what actions have an effect of altering
their footprint.
Possible Misconceptions before and during lesson:
Students may not understand that they have a part to play in the make up of the
ecological footprint of the world – they may feel it to be not related to them directly.
Percent of change is with reference to the original amount; students may confuse the
change with the new amount.
Percent of change is calculated in decimal, and students would need to convert that to
Students will think of ways that can reduce their ecological footprint.7 (Appendix D)
Students will retake the quiz, and record changes accordingly.
Students will calculate and analyze the change.8
Students will calculate the difference between their ecological footprint and the
biocapacity of the earth. They will then calculate the percent of change they need to
make to reduce their ecological balance to zero.
Students will consider committing to short- and long-term changes.
Appendix A – Scatter Plot Worksheet
Worksheet: The Ecological Footprint – Scatter Plots Vocabulary:
Scatter Plot – a graph that shows the relationship between two sets of data. Ecological Footprint – It is a management and communications tool that measures how much nature we have, how much we use, and who uses what. It represents the area of biologically productive land and sea a population (an individual, city, country, or all of
7 Sustainability Standard 2.4 [Social and Cultural Systems] Multiple Perspectives –
Students consider an issue or challenge related to sustainability, through a variety of lenses
or perspectives and they explain how approaching that issue or challenge from different
perspectives may result in different decisions and outcomes.
8 Sustainability Standard 3.1 [Personal Action] Personal Responsibility – Students know the
difference between actions that they can take themselves and those that require the
involvement of other people, organizations, and government. They identify and carry out a
personal action that will enhance quality of life in environment, social/culture, or economic
sectors.
11 Adapted from “The Big Ideas of UbD” by Grant Wiggins and Jay McTighe, 2004.
humanity) requires to provide the resources it consumes and to absorb its waste, using prevailing technology. Human Development Index (HDI) – developed by UNDP, compares countries on their citizens’ achievement of long lives, literacy, and income. The UN considers a HDI of 0.8 to be the threshold for high human development.
Classwork:
We will be going to graph the following data together as a class. We will then break into groups of 3-4 students and graph a different set of data. We will then come together, present your group’s graph, and discuss.
Part I – Teacher Presentation Follow Ms. Lau as we plot the following table together as a class. Data
Country Human Development Index (HDI)
Ecological Footprint
USA 0.95 9.4
Norway 0.97 6.9
Uruguay 0.85 5.5
Botswana 0.65 3.6
Romania 0.82 2.9
China 0.78 2.1
Peru 0.77 1.6
Vietnam 0.73 1.3
Madagascar 0.53 1.1
Haiti 0.53 0.5
* Data from WWF Living Planet Report 2008 Part II – Group Work Each group will be given a different set of data. Follow the instructions below carefully and plot the scatter plot. On a graph paper, draw and label the x-axis. Using an interval of 0.1, complete the x-axis up to 1.0. Make sure that you spread out the axis to cover the entire page. This axis represents the Human Development Index (HDI). On the same graph paper, draw and label the y-axis. Using an interval of 1, complete the y-axis up to 10. Again, make sure that you spread out the axis to cover the entire page. This axis represents the Ecological Footprint. Make a scatter plot of the data. Remember to label each point.
12 Adapted from “The Big Ideas of UbD” by Grant Wiggins and Jay McTighe, 2004.
Does the scatter plot show any relationship? If so, is it positive, negative or no relationship? Explain your reasoning. Part III – Group Presentation, Class Discussion Look at your graph: do any of the points not follow the general trend? Why do you think for example, Romania, which has a high Human Development Index, have a low Ecological Footprint? Is that possible? Part IV – Homework See handout. (Appendix B) Extra Credit:
Research on why countries like Romania have a high Human Development Index but a low Ecological Footprint.
Appendix B – Scatter Plot Homework
Homework – Scatter Plots In class, we looked at how the Human Development Index correlated with the Ecological Footprint of various countries. Go to http://www.worldmapper.org/textindex/text_poverty.html and select a category you would like to compare with some countries’ Ecological Footprint. Note that not every country’s data is available.
For example, under poverty, you may obtain some data based on the Human Poverty Index (http://www.worldmapper.org/posters/worldmapper_map174_ver5.pdf - you will need Acrobat Reader to view the map and data).
For homework, create a scatter plot (make sure you have at least 8-10 data) and present your findings in class: On a graph paper, draw and label the x-axis.
13 Adapted from “The Big Ideas of UbD” by Grant Wiggins and Jay McTighe, 2004.
Using an interval of ____________________, complete the x-axis up to _______________. Make sure that you spread out the axis to cover the entire page. This axis represents the _________________________________________ (whatever you have chosen, in my case, the Human Poverty Index.) On the same graph paper, draw and label the y-axis. Using an interval of ____________________, complete the y-axis up to ______________. Again, make sure that you spread out the axis to cover the entire page. This axis represents the Ecological Footprint. Make a scatter plot of the data. Remember to label each point. Does your scatter plot show any relationship? If so, is it positive, negative or no relationship? Explain your reasoning.
Appendix C – Percent of Change Homework
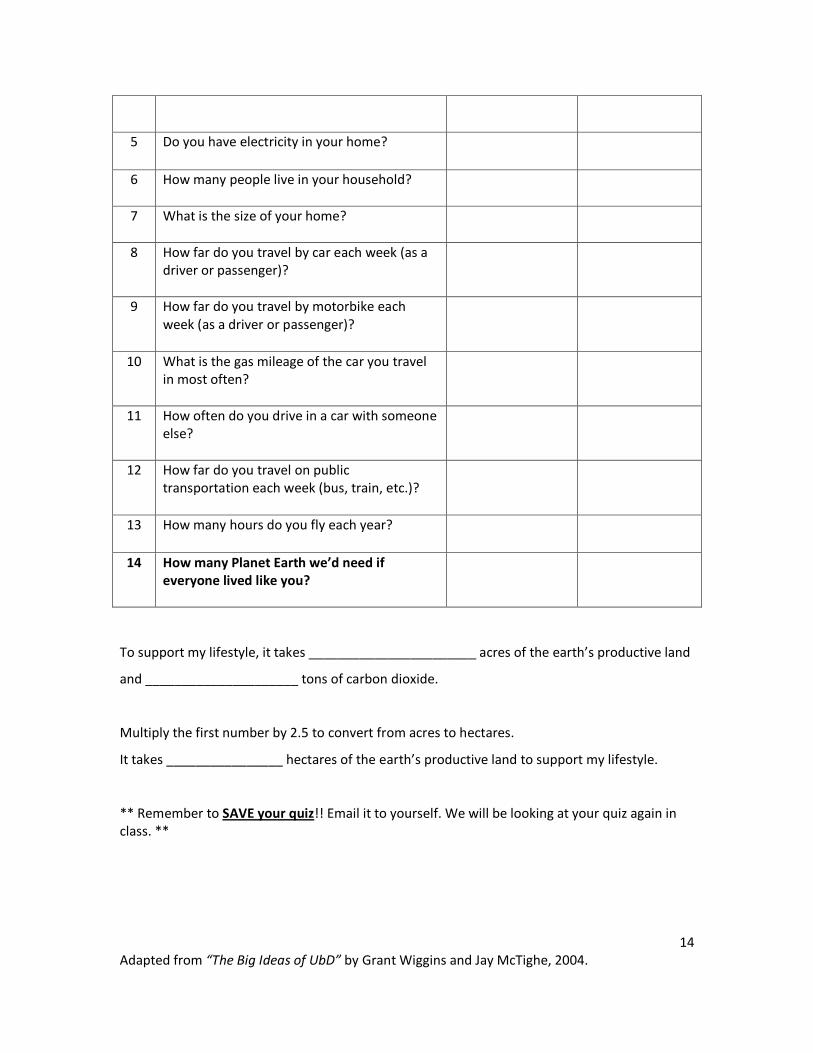
Homework: Calculate your ecological footprint Ever wondered how much “nature” your lifestyle requires? Go to http://www.footprintnetwork.org/en/index.php/GFN/page/calculators/ to take the quiz. Try to answer the questions to the best of your knowledge. You may need to ask your parents for help. You may choose to answer some or all questions with more details. Record your response in the table below. Leave the last column blank for now. SAVE your quiz! Email it to yourself. We will be looking at your quiz again in class.
# Question My Response A Change
1 How often do you eat animal-based foods? (Meat, fish, eggs, diary)
2 How much of the food that you eat is processed, packed and not grown locally (from more than 200 miles away)?
3 Compared to the typical American, how much trash do you think you generate?
14 Adapted from “The Big Ideas of UbD” by Grant Wiggins and Jay McTighe, 2004.
5 Do you have electricity in your home?
6 How many people live in your household?
7 What is the size of your home?
8 How far do you travel by car each week (as a driver or passenger)?
9 How far do you travel by motorbike each week (as a driver or passenger)?
10 What is the gas mileage of the car you travel in most often?
11 How often do you drive in a car with someone else?
12 How far do you travel on public transportation each week (bus, train, etc.)?
13 How many hours do you fly each year?
14 How many Planet Earth we’d need if everyone lived like you?
To support my lifestyle, it takes _______________________ acres of the earth’s productive land
and _____________________ tons of carbon dioxide.
Multiply the first number by 2.5 to convert from acres to hectares.
It takes ________________ hectares of the earth’s productive land to support my lifestyle.
** Remember to SAVE your quiz!! Email it to yourself. We will be looking at your quiz again in class. **
15 Adapted from “The Big Ideas of UbD” by Grant Wiggins and Jay McTighe, 2004.
Appendix D – Percent of Change Worksheet Worksheet: The Ecological Footprint – Percent of Change Vocabulary:
Ecological Footprint – It is a management and communications tool that measures how much nature we have, how much we use, and who uses what. It represents the area of biologically productive land and sea a population (an individual, city, country, or all of humanity) requires to provide the resources it consumes and to absorb its waste, using prevailing technology. Biocapacity – The amount of available land that can support human life. This includes land types such as forests, croplands, and oceans. Based on measurements of the earth’s surface and the productivity of the land, scientists estimate the earth has about 15.7 hectares of productive land per person. That’s equivalent to 39.25 football fields. Ecological Balance – The difference between the earth’s biocapacity and your ecological footprint. An ecological balance tells whether you are ‘overdrawing’ the amount of productive land available to you.
Classwork: Part I You calculated your Ecological Footprint for homework yesterday. Today, we are going to look a little more closely at what might be some contributing factors that play out in the make-up of the Ecological Footprint. If the Ecological Footprint indicates that more natural resources are used than the Earth supplies, then this is not a sustainable lifestyle. It is very important for all of us to live a sustainable lifestyle in order to leave the planet in good shape for future generations to enjoy and prosper. Let’s look at some of the following and see which uses more environmental resources… (Pages 4-6 of http://www.kidsfootprint.org/lessons/Science/What%20is%20an%20EF%20-%20ES,%20MS.pdf) Can you reduce your Ecological Footprint? List out some ways you think you are able to do that: Go back and retake parts of the quiz. Record what changes you made in the last column of the table. You may retake one or more parts of the quiz but you do not have to retake every part.
16 Adapted from “The Big Ideas of UbD” by Grant Wiggins and Jay McTighe, 2004.
Record the new number, if any, for question 14. “How many Planet Earth we’d need if everyone
lived like you?” _________________________
What was the change? __________________________ (hint: take this new number – the old number) Take the change and divide it by the original response you received in question 14. Record it
here: ______________________
Convert this decimal to percents: _________________________
This shows the percent of change that you took when you made some changes to the quiz so that you live using lesser resources. Let’s look at what an average person on earth ought to use: Scientists estimate the earth has about 15.7 hectares of productive land per person. This is also known as “biocapacity”. Part II In the last part of your homework, you filled in the following: To support my lifestyle, it takes _______________________ acres of the earth’s productive land
and _____________________ tons of carbon dioxide.
Multiply the first number by 2.5 to convert from acres to hectares.
It takes ________________ hectares of the earth’s productive land to support my lifestyle.
Subtract the amount it takes to support your current lifestyle from the amount an average person ought to use. Record this amount: ________________________ This is also known as the “ecological balance”. Now, calculate what percent of change you must make to reduce your ecological balance to zero: