Characterizing the nano and micro structure of concrete to improve its durability P.J.M. Monteiro a, * , A.P. Kirchheim a , S. Chae a , P. Fischer b , A.A. MacDowell c , E. Schaible c , H.R. Wenk d a Department of Civil and Environmental Engineering, University of California at Berkeley, USA b Center for X-ray Optics, Lawrence Berkeley National Laboratory, Berkeley, CA, USA c Advanced Light Source, Lawrence Berkeley National Laboratory, USA d Earth and Planetary Science, University of California at Berkeley, USA article info Article history: Received 13 September 2008 Received in revised form 15 December 2008 Accepted 17 December 2008 Available online 25 December 2008 Keywords: Concrete Durability Microscopy Neutron Tomography X-ray abstract New and advanced methodologies have been developed to characterize the nano and microstructure of cement paste and concrete exposed to aggressive environments. High resolution full-field soft X-ray imaging in the water window is providing new insight on the nano scale of the cement hydration process, which leads to a nano-optimization of cement-based systems. Hard X-ray microtomography images of ice inside cement paste and cracking caused by the alkali–silica reaction (ASR) enables three-dimensional structural identification. The potential of neutron diffraction to determine reactive aggregates by measur- ing their residual strains and preferred orientation is studied. Results of experiments using these tools are shown on this paper. Ó 2009 Elsevier Ltd. All rights reserved. 1. Introduction Classical studies of the microstructure of cement paste and con- crete have been largely done using electron microscopy. Transmis- sion electron microscopy has been used to investigate the complex nanostructure of calcium silicate hydrates, and scanning electron microscopy (both in secondary and backscattered mode) is fre- quently used to characterize the phase distributions and assess damage of the material exposed to aggressive environments. Both these techniques normally require high vacuum which can modify or even damage the fragile hydration products. The existence of high vacuum also prevents the in situ imaging of the hydration reactions. X-ray based imaging techniques, which are available at large scale synchrotron radiation facilities, have the potential to revolutionize the current understanding of hydration mechanisms of cements. Neutron scattering has been used to study the hydra- tion of cement minerals and this paper shows how neutron diffrac- tion can be employed to measure the degree of deformation and reactivity in granitic rocks, this being critical information in the study of alkali silica reaction. Recent research using the full-field soft transmission X-ray microscope XM-1 located at beamline 6.1.2 at the Advanced Light Source (ALS) in Berkeley, California, and operated by the Center for X-ray Optics at Lawrence Berkeley National Laboratory since 1994, is described below. Originally designed for the observation of bio- logical cells in their natural, wet state at atmospheric pressure, this microscope has wide application in nano-sciences, such as nano- magnetism and nano-materials sciences. Because this technique allows high resolution soft X-ray imaging of cement in aqueous solution and of the early formation of the hydration products, since 1998 numerous studies on cementitious materials have been car- ried out (see Refs. [1–11]). Characterizing the three-dimensional network of microcracks using non-destructive techniques has proved challenging. The tra- ditional method of first impregnating the concrete and then cutting and polishing the sample may introduce artifacts. In addition, all observations are limited to whatever can be determined from the surface of the sample; any three-dimensional analysis is impossible. Microtomography has produced insightful information on the topology of cracks in the cement paste matrix and how they are de- flected by the dispersed hard inclusions. This study reports on cur- rent research using the Hard X-ray Microtomography (XMT) located at beamline 8.3.2 at the ALS, which analyzes images ob- tained of cement paste exposed to freezing conditions and of three-dimensional cracks forming in mortar, as a result of the alka- li-aggregate reaction. Neutron scattering can provide unique information on poten- tially reactive aggregates for concrete. In many rocks, minerals ex- hibit a preferred orientation pattern, and this is expressed in 0958-9465/$ - see front matter Ó 2009 Elsevier Ltd. All rights reserved. doi:10.1016/j.cemconcomp.2008.12.007 * Corresponding author. Address: Department of Civil Engineering, University of California, 721 Davis Hall, Berkeley, CA 94720, USA. Tel.:+1 510 643 82 51. E-mail address: [email protected](P.J.M. Monteiro). Cement & Concrete Composites 31 (2009) 577–584 Contents lists available at ScienceDirect Cement & Concrete Composites journal homepage: www.elsevier.com/locate/cemconcomp
Characterizing the nano and micro structure of concrete to improve its durability
P.J.M. Monteiro a,*, A.P. Kirchheim a, S. Chae a, P. Fischer b, A.A. MacDowell c, E. Schaible c, H.R. Wenk d
a Department of Civil and Environmental Engineering, University of California at Berkeley, USAb Center for X-ray Optics, Lawrence Berkeley National Laboratory, Berkeley, CA, USAc Advanced Light Source, Lawrence Berkeley National Laboratory, USAd Earth and Planetary Science, University of California at Berkeley, USA
a r t i c l e i n f o
Article history:Received 13 September 2008Received in revised form 15 December 2008Accepted 17 December 2008Available online 25 December 2008
New and advanced methodologies have been developed to characterize the nano and microstructure ofcement paste and concrete exposed to aggressive environments. High resolution full-field soft X-rayimaging in the water window is providing new insight on the nano scale of the cement hydration process,which leads to a nano-optimization of cement-based systems. Hard X-ray microtomography images of iceinside cement paste and cracking caused by the alkali–silica reaction (ASR) enables three-dimensionalstructural identification. The potential of neutron diffraction to determine reactive aggregates by measur-ing their residual strains and preferred orientation is studied. Results of experiments using these tools areshown on this paper.
� 2009 Elsevier Ltd. All rights reserved.
1. Introduction
Classical studies of the microstructure of cement paste and con-crete have been largely done using electron microscopy. Transmis-sion electron microscopy has been used to investigate the complexnanostructure of calcium silicate hydrates, and scanning electronmicroscopy (both in secondary and backscattered mode) is fre-quently used to characterize the phase distributions and assessdamage of the material exposed to aggressive environments. Boththese techniques normally require high vacuum which can modifyor even damage the fragile hydration products. The existence ofhigh vacuum also prevents the in situ imaging of the hydrationreactions. X-ray based imaging techniques, which are available atlarge scale synchrotron radiation facilities, have the potential torevolutionize the current understanding of hydration mechanismsof cements. Neutron scattering has been used to study the hydra-tion of cement minerals and this paper shows how neutron diffrac-tion can be employed to measure the degree of deformation andreactivity in granitic rocks, this being critical information in thestudy of alkali silica reaction.
Recent research using the full-field soft transmission X-raymicroscope XM-1 located at beamline 6.1.2 at the Advanced LightSource (ALS) in Berkeley, California, and operated by the Center for
ll rights reserved.
vil Engineering, University ofel.:+1 510 643 82 51.Monteiro).
X-ray Optics at Lawrence Berkeley National Laboratory since 1994,is described below. Originally designed for the observation of bio-logical cells in their natural, wet state at atmospheric pressure, thismicroscope has wide application in nano-sciences, such as nano-magnetism and nano-materials sciences. Because this techniqueallows high resolution soft X-ray imaging of cement in aqueoussolution and of the early formation of the hydration products, since1998 numerous studies on cementitious materials have been car-ried out (see Refs. [1–11]).
Characterizing the three-dimensional network of microcracksusing non-destructive techniques has proved challenging. The tra-ditional method of first impregnating the concrete and then cuttingand polishing the sample may introduce artifacts. In addition, allobservations are limited to whatever can be determined from thesurface of the sample; any three-dimensional analysis isimpossible.
Microtomography has produced insightful information on thetopology of cracks in the cement paste matrix and how they are de-flected by the dispersed hard inclusions. This study reports on cur-rent research using the Hard X-ray Microtomography (XMT)located at beamline 8.3.2 at the ALS, which analyzes images ob-tained of cement paste exposed to freezing conditions and ofthree-dimensional cracks forming in mortar, as a result of the alka-li-aggregate reaction.
Neutron scattering can provide unique information on poten-tially reactive aggregates for concrete. In many rocks, minerals ex-hibit a preferred orientation pattern, and this is expressed in
anisotropy of physical properties. It is recognized that the defor-mation state, grain size, and development of foliation in graniticrocks used as aggregate in concrete influence the alkali–silica reac-tion. By performing an analysis of preferred orientation in conjunc-tion with expansion tests, Monteiro et al. [12] showed that there isa quantitative relationship between the degree of deformation andreactivity in granitic rocks. In this paper, we summarize our on-going microstructural characterization of reactive rocks by neutrondiffraction and transmission electron microscopy (TEM), observingdislocations and determining dislocation densities of quartz grainsin granitic rocks of different deformation states.
2. Soft X-ray microscopy
Soft X-ray microscopy uses advances in nanotechnology to pro-vide high quality X-ray optical components. Fresnel zone plates,i.e., circular gratings with a radially increasing line density, areused to focus the X-rays, which constitute the basis for performingX-ray microscopy because with a refractive index close to unity,conventional lenses cannot be applied. State-of-the-art Fresnelzone plate optics have now achieved a 15 nm-spatial resolution[13,14]. The optical design for the soft X-ray microscope used hereis an X-ray analogue to a conventional light microscope, wherebyFresnel zone plates are used for the condenser and objective lenses(see Fig. 1).
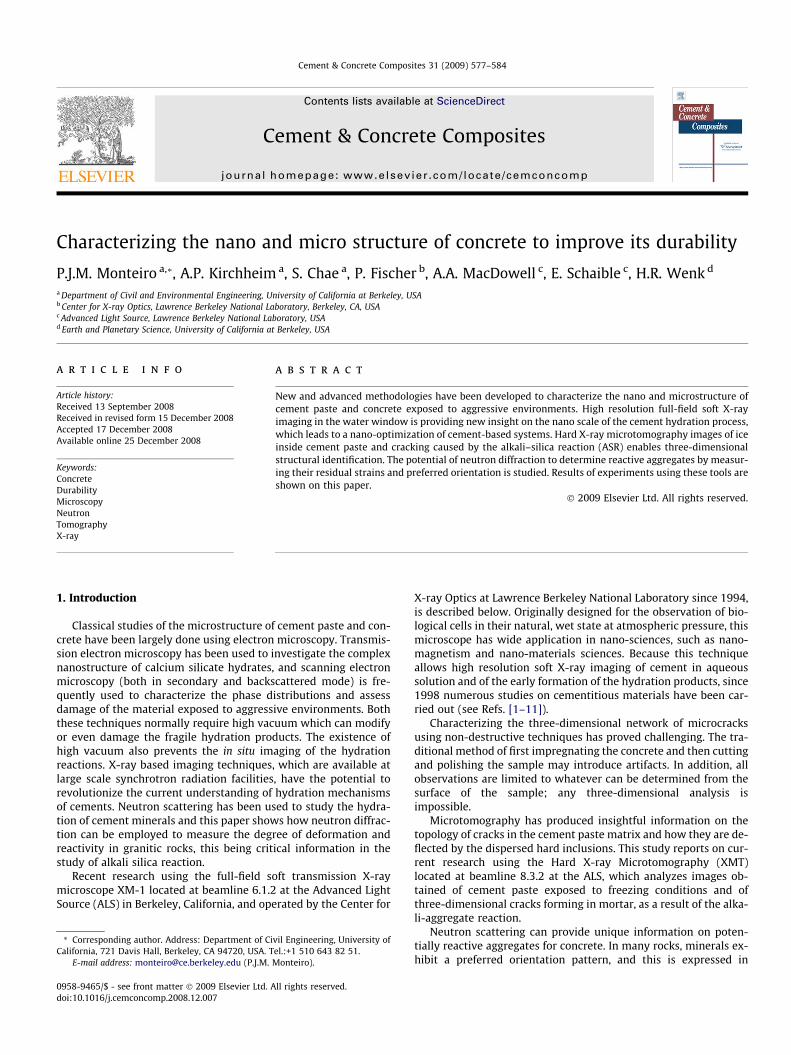
Because the wavelength is dependent on its focal length (to-gether with a pinhole close to the specimen as a monochromatorwith a spectral resolution E/DE � 500), X-rays emitted from abending magnet source propagate to a condenser zone plate, whichprovides a partially incoherent hollow-cone illumination of thesample. The current condenser zone plate has an outer diameterof about 9 mm, about 50,000 rings, and an outermost zone widthDr of about 40 nm. The X-rays penetrating the specimen are pro-jected onto an X-ray sensitive CCD by a micro zone plate, whichis positioned at its focal length downstream of the sample; this cre-ates a full-field image. The backside-illuminated, thinned CCD has2048 � 2048 pixels, with a physical pixel size of 13.5 lm. Becauseof the high flux of synchrotron radiation, typical exposure timesper image are only a few seconds, covering a field of view of about10 lm diameter at a magnification of about 2500. The micro zoneplate, i.e., the high resolution objective lens, has a diameter ofabout 30–60 lm, typically about 500 rings, and an outermost zonewidth Dr down to 15 nm, a critical factor in determining the spatialresolution possible using soft X-ray microscopy.
Fig. 1. Schematic layout of the soft X-ray microscopy beamline XM-1 at the ALS using X-ronto a CCD camera that is sensitive to soft X-rays.
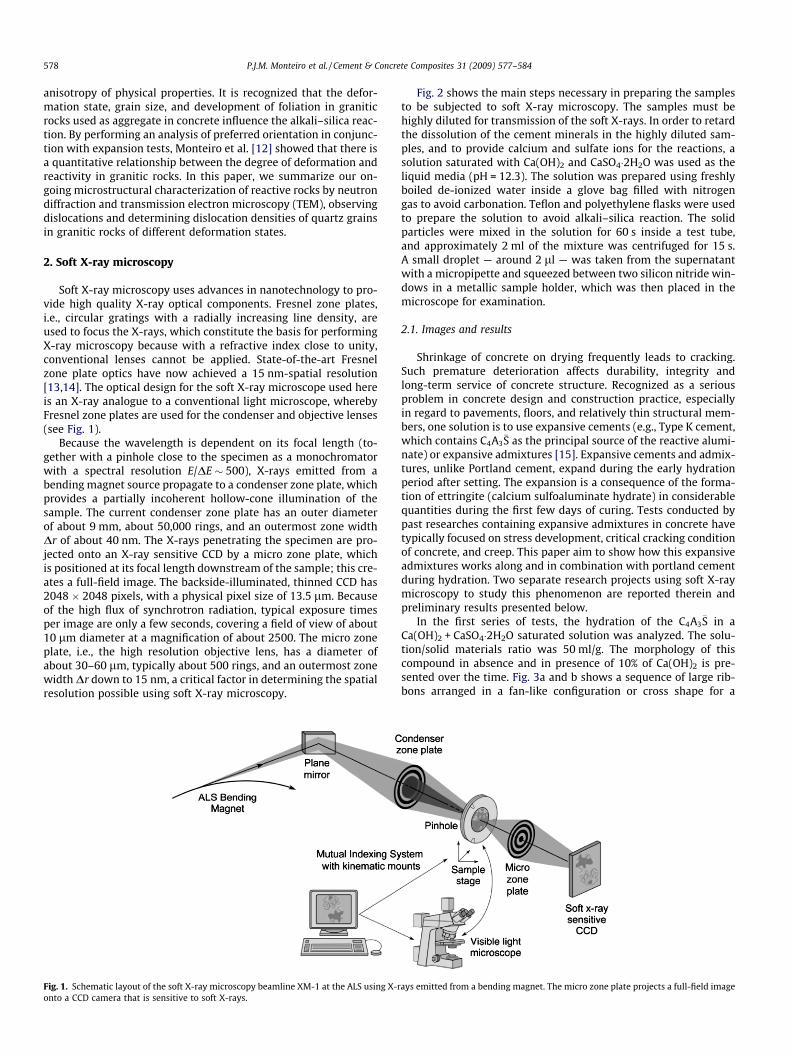
Fig. 2 shows the main steps necessary in preparing the samplesto be subjected to soft X-ray microscopy. The samples must behighly diluted for transmission of the soft X-rays. In order to retardthe dissolution of the cement minerals in the highly diluted sam-ples, and to provide calcium and sulfate ions for the reactions, asolution saturated with Ca(OH)2 and CaSO4�2H2O was used as theliquid media (pH = 12.3). The solution was prepared using freshlyboiled de-ionized water inside a glove bag filled with nitrogengas to avoid carbonation. Teflon and polyethylene flasks were usedto prepare the solution to avoid alkali–silica reaction. The solidparticles were mixed in the solution for 60 s inside a test tube,and approximately 2 ml of the mixture was centrifuged for 15 s.A small droplet — around 2 ll — was taken from the supernatantwith a micropipette and squeezed between two silicon nitride win-dows in a metallic sample holder, which was then placed in themicroscope for examination.
2.1. Images and results
Shrinkage of concrete on drying frequently leads to cracking.Such premature deterioration affects durability, integrity andlong-term service of concrete structure. Recognized as a seriousproblem in concrete design and construction practice, especiallyin regard to pavements, floors, and relatively thin structural mem-bers, one solution is to use expansive cements (e.g., Type K cement,which contains C4A3
�S as the principal source of the reactive alumi-nate) or expansive admixtures [15]. Expansive cements and admix-tures, unlike Portland cement, expand during the early hydrationperiod after setting. The expansion is a consequence of the forma-tion of ettringite (calcium sulfoaluminate hydrate) in considerablequantities during the first few days of curing. Tests conducted bypast researches containing expansive admixtures in concrete havetypically focused on stress development, critical cracking conditionof concrete, and creep. This paper aim to show how this expansiveadmixtures works along and in combination with portland cementduring hydration. Two separate research projects using soft X-raymicroscopy to study this phenomenon are reported therein andpreliminary results presented below.
In the first series of tests, the hydration of the C4A3�S in a
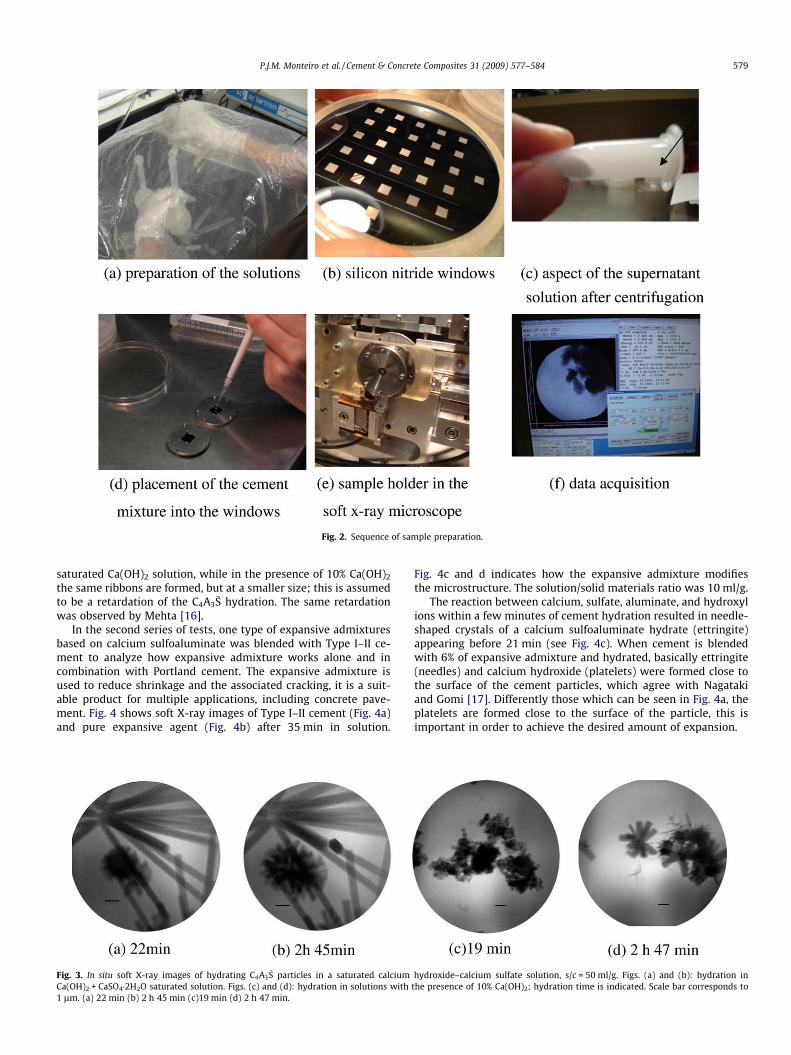
Ca(OH)2 + CaSO4�2H2O saturated solution was analyzed. The solu-tion/solid materials ratio was 50 ml/g. The morphology of thiscompound in absence and in presence of 10% of Ca(OH)2 is pre-sented over the time. Fig. 3a and b shows a sequence of large rib-bons arranged in a fan-like configuration or cross shape for a
ays emitted from a bending magnet. The micro zone plate projects a full-field image
saturated Ca(OH)2 solution, while in the presence of 10% Ca(OH)2
the same ribbons are formed, but at a smaller size; this is assumedto be a retardation of the C4A3
�S hydration. The same retardationwas observed by Mehta [16].
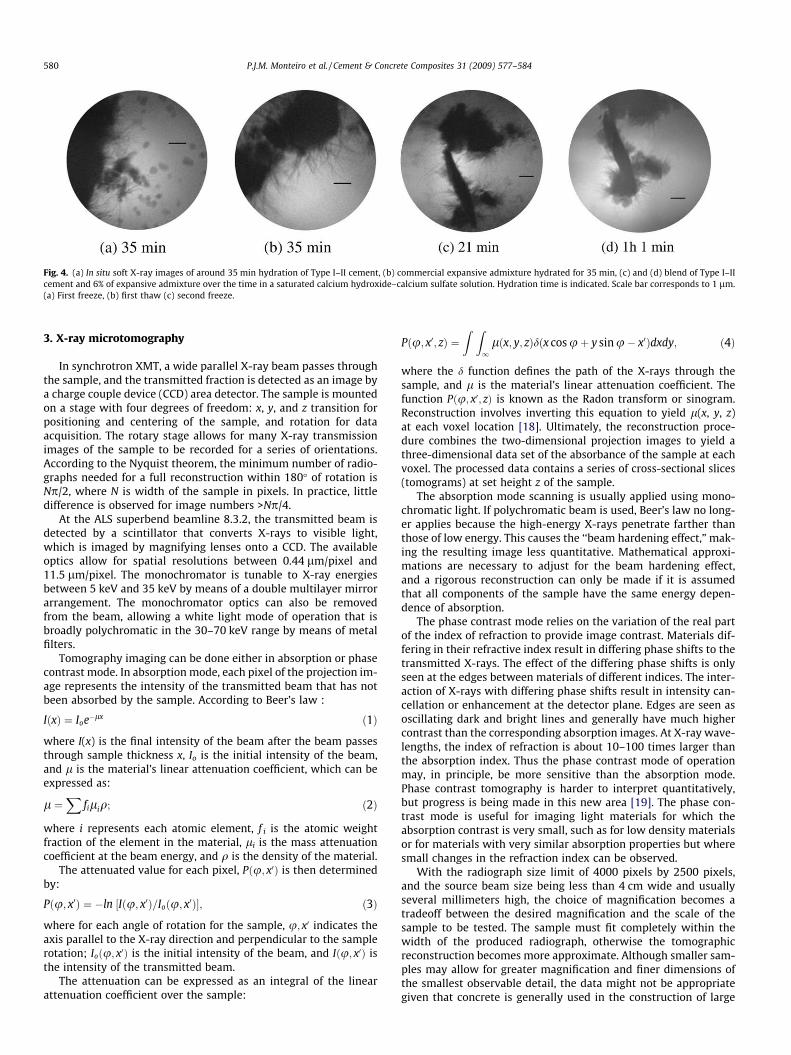
In the second series of tests, one type of expansive admixturesbased on calcium sulfoaluminate was blended with Type I–II ce-ment to analyze how expansive admixture works alone and incombination with Portland cement. The expansive admixture isused to reduce shrinkage and the associated cracking, it is a suit-able product for multiple applications, including concrete pave-ment. Fig. 4 shows soft X-ray images of Type I–II cement (Fig. 4a)and pure expansive agent (Fig. 4b) after 35 min in solution.
Fig. 3. In situ soft X-ray images of hydrating C4A3�S particles in a saturated calcium
Ca(OH)2 + CaSO4�2H2O saturated solution. Figs. (c) and (d): hydration in solutions with1 lm. (a) 22 min (b) 2 h 45 min (c)19 min (d) 2 h 47 min.
Fig. 4c and d indicates how the expansive admixture modifiesthe microstructure. The solution/solid materials ratio was 10 ml/g.
The reaction between calcium, sulfate, aluminate, and hydroxylions within a few minutes of cement hydration resulted in needle-shaped crystals of a calcium sulfoaluminate hydrate (ettringite)appearing before 21 min (see Fig. 4c). When cement is blendedwith 6% of expansive admixture and hydrated, basically ettringite(needles) and calcium hydroxide (platelets) were formed close tothe surface of the cement particles, which agree with Nagatakiand Gomi [17]. Differently those which can be seen in Fig. 4a, theplatelets are formed close to the surface of the particle, this isimportant in order to achieve the desired amount of expansion.
hydroxide–calcium sulfate solution, s/c = 50 ml/g. Figs. (a) and (b): hydration inthe presence of 10% Ca(OH)2; hydration time is indicated. Scale bar corresponds to
Fig. 4. (a) In situ soft X-ray images of around 35 min hydration of Type I–II cement, (b) commercial expansive admixture hydrated for 35 min, (c) and (d) blend of Type I–IIcement and 6% of expansive admixture over the time in a saturated calcium hydroxide–calcium sulfate solution. Hydration time is indicated. Scale bar corresponds to 1 lm.(a) First freeze, (b) first thaw (c) second freeze.
In synchrotron XMT, a wide parallel X-ray beam passes throughthe sample, and the transmitted fraction is detected as an image bya charge couple device (CCD) area detector. The sample is mountedon a stage with four degrees of freedom: x, y, and z transition forpositioning and centering of the sample, and rotation for dataacquisition. The rotary stage allows for many X-ray transmissionimages of the sample to be recorded for a series of orientations.According to the Nyquist theorem, the minimum number of radio-graphs needed for a full reconstruction within 180� of rotation isNp/2, where N is width of the sample in pixels. In practice, littledifference is observed for image numbers >Np/4.
At the ALS superbend beamline 8.3.2, the transmitted beam isdetected by a scintillator that converts X-rays to visible light,which is imaged by magnifying lenses onto a CCD. The availableoptics allow for spatial resolutions between 0.44 lm/pixel and11.5 lm/pixel. The monochromator is tunable to X-ray energiesbetween 5 keV and 35 keV by means of a double multilayer mirrorarrangement. The monochromator optics can also be removedfrom the beam, allowing a white light mode of operation that isbroadly polychromatic in the 30–70 keV range by means of metalfilters.
Tomography imaging can be done either in absorption or phasecontrast mode. In absorption mode, each pixel of the projection im-age represents the intensity of the transmitted beam that has notbeen absorbed by the sample. According to Beer’s law :
IðxÞ ¼ Ioe�lx ð1Þ
where I(x) is the final intensity of the beam after the beam passesthrough sample thickness x, Io is the initial intensity of the beam,and l is the material’s linear attenuation coefficient, which can beexpressed as:
l ¼X
filiq; ð2Þ
where i represents each atomic element, f i is the atomic weightfraction of the element in the material, li is the mass attenuationcoefficient at the beam energy, and q is the density of the material.
The attenuated value for each pixel, Pðu; x0Þ is then determinedby:
Pðu; x0Þ ¼ �ln ½Iðu; x0Þ=Ioðu; x0Þ�; ð3Þ
where for each angle of rotation for the sample, u; x0 indicates theaxis parallel to the X-ray direction and perpendicular to the samplerotation; Ioðu; x0Þ is the initial intensity of the beam, and Iðu; x0Þ isthe intensity of the transmitted beam.
The attenuation can be expressed as an integral of the linearattenuation coefficient over the sample:
Pðu; x0; zÞ ¼Z Z
1lðx; y; zÞdðx cos uþ y sin u� x0Þdxdy; ð4Þ
where the d function defines the path of the X-rays through thesample, and l is the material’s linear attenuation coefficient. Thefunction Pðu; x0; zÞ is known as the Radon transform or sinogram.Reconstruction involves inverting this equation to yield l(x, y, z)at each voxel location [18]. Ultimately, the reconstruction proce-dure combines the two-dimensional projection images to yield athree-dimensional data set of the absorbance of the sample at eachvoxel. The processed data contains a series of cross-sectional slices(tomograms) at set height z of the sample.
The absorption mode scanning is usually applied using mono-chromatic light. If polychromatic beam is used, Beer’s law no long-er applies because the high-energy X-rays penetrate farther thanthose of low energy. This causes the ‘‘beam hardening effect,” mak-ing the resulting image less quantitative. Mathematical approxi-mations are necessary to adjust for the beam hardening effect,and a rigorous reconstruction can only be made if it is assumedthat all components of the sample have the same energy depen-dence of absorption.
The phase contrast mode relies on the variation of the real partof the index of refraction to provide image contrast. Materials dif-fering in their refractive index result in differing phase shifts to thetransmitted X-rays. The effect of the differing phase shifts is onlyseen at the edges between materials of different indices. The inter-action of X-rays with differing phase shifts result in intensity can-cellation or enhancement at the detector plane. Edges are seen asoscillating dark and bright lines and generally have much highercontrast than the corresponding absorption images. At X-ray wave-lengths, the index of refraction is about 10–100 times larger thanthe absorption index. Thus the phase contrast mode of operationmay, in principle, be more sensitive than the absorption mode.Phase contrast tomography is harder to interpret quantitatively,but progress is being made in this new area [19]. The phase con-trast mode is useful for imaging light materials for which theabsorption contrast is very small, such as for low density materialsor for materials with very similar absorption properties but wheresmall changes in the refraction index can be observed.
With the radiograph size limit of 4000 pixels by 2500 pixels,and the source beam size being less than 4 cm wide and usuallyseveral millimeters high, the choice of magnification becomes atradeoff between the desired magnification and the scale of thesample to be tested. The sample must fit completely within thewidth of the produced radiograph, otherwise the tomographicreconstruction becomes more approximate. Although smaller sam-ples may allow for greater magnification and finer dimensions ofthe smallest observable detail, the data might not be appropriategiven that concrete is generally used in the construction of large
Fig. 5. Reconstructed tomograms of the sample in the midsection of one of the larger air voids. The scale bar is 50 lm. The ice crystals (a) in dendritic form; (b) disappearupon thawing; and (c) reappear in changed morphology during the second freeze.
Fig. 6. A 3D reconstruction of ice formation in a single air void. The cement matrixand the glass capillary have been removed via post reconstruction image process-ing. The air void is approximately 150 lm in diameter. (a) 7 Days (b) 14 days.
structures. Using larger samples, however, results in lower magni-fication and coarser dimensions of the smallest observable particlesize.
As an example of the application of microtomography to studythe durability of concrete, reported herein are preliminary conclu-sions of the analyses of images obtained in the study of in situ iceformation in entrained air voids in hydrated cement paste. Whencement paste is exposed to freezing temperatures it experiencesdeformation caused by: (a) volumetric change as liquid watersolidifies, (b) cryo-suction driving liquid water towards the frozenpores, (c) drainage of liquid water from the freezing sites, (d) ther-mo-mechanical response of the porous matrix, the liquid and solidwater. The imaging of ice inside the cement paste can be done bylow-temperature scanning electron microscopy and directionalcooling microscopy but these techniques do not provide thethree-dimensional information which is easily obtained bymicrotomography.
To prevent frost damage in concrete, a well-distributed systemair voids is introduced in the porous cement paste. These air voidsmay also act as an efficient cryo-pump because ice crystals, ini-tially formed in air voids at atmospheric pressure, make the liquidwater diffuse towards the air voids, rather than towards the largeralready frozen pores, resulting in a beneficial lowering of the in-pore crystal pressure. There is a strong technological incentive tofurther characterize the formation and distribution of ice crystalsinside and around the air voids so a new generation of air-entrain-ing admixtures can be developed. For this preliminary experiment,XMT scans were performed on air-entrained, hydrated cementpaste cast in 0.25 mm outer diameter glass capillary tube whilesubjecting the sample to several cycles of evaporated liquid nitro-gen gas cooling and ambient thawing. The samples were frozenusing an Oxford 600-series Cryostream which generates a jet ofcold nitrogen gas with a coaxial outer sheath of dry nitrogen forfrost prevention. The scan settings were optimized for both absorp-tion and phase contrast imaging. The absorption contrast providedimaging of the dense hydrated cement matrix, while the phasecontrast provided imaging of the ice–air phases that would coexistin the partially filled air void. A 13 KeV monochromatic X-ray en-ergy provided sufficient penetration through the hydrated cementpaste, while an approximately 30 cm sample-to-detector distanceenhanced the phase contrast imaging and made visible the ice–air interface within the air voids. The magnification was set at5.4� with the resulting pixel size of 1.54 lm/pixel.
Fig. 5 shows a cross section through one of the cement air voids.The donut shape is the cement material constrained within theglass tube. Fig. 5a shows the sample when frozen, with dendriticice growth obvious within the void. The sample was then allowed
to warm up to room temperature (Fig. 5b). The ice formation dis-appears and then reappears with a different structure as the sam-ple was frozen once again (see Fig. 5c). Fig. 6 shows a three-dimensional reconstruction of the air/ice interface in a single airvoid; it is roughly that of a spherical shell. Upon thawing, the inter-face vanished, confirming that the image of the ice was successful.
Microtomography is also useful for performing time-scaleexperiments. Here, a modified ASTM C-1260 test of aggregate reac-tivity was conducted. In this experiment, three 1 in. � 1 in. � 12 in.mortar bars were cast following the specifications detailed inASTM C-1260, using known inert aggregate, while 50% of theaggregates by weight were substituted with partially strainedquartz sand. The goal was to supplement the expansion results ofthe samples obtained by the ASTM C-1260 test with visual repre-sentation of damage in progress. Considering the scale and thedensity of the sample, the samples were scanned under a whitebeam filtered with aluminum plates and under low magnification.The resulting spatial resolution was 11.55 lm/pixel. The scanswere obtained under phase contrast mode in an attempt to en-hance crack widths smaller than spatial resolution. Because the1 in. � 1 in. cross section of the mortar bars was wider than thebeam width, a narrower sample (0.75 in. � 0.75 in. � 9 in.) wascast. The large bars and the smaller bar were subject to the sametest conditions prescribed by ASTM C-1260. The larger bars weredesigned to provide strain data while the smaller bar would beused for imaging purposes. The smaller bar underwent a slightlyamplified but comparable rate of expansion and was deemed tobe a suitable representation of the standard-sized mortar barexpansion. Fig. 7 shows internal sections of the same sample after
Fig. 7. Tomogram of reduced sized mortar bars at (a) 7 days and (b) 14 days of ASTM C-1260 testing: new microcrack developments (arrows) are visible. The ring-likestructure overlaid on the images is an artifact of the tomographic reconstruction process. The scale bar is 500 lm.
7 and 14 days. Close examination of the older sample shows thedevelopment of microcracks.
Because most existing high resolution characterization tech-niques require drying of the sample or examination in vacuum,in situ studies of corrosion are challenging to perform. Both corro-sion reactions and corrosion products are very sensitive to environ-mental conditions. Microtomography can be an ideal tool to imagethe evolution of the corrosion products and cracking of the matrix.
4. Neutron diffraction and texture analysis of reactive rocks
The previous discussion has mainly focused on the applicationof synchrotron X-rays in cement research. Other opportunities areprovided by neutron scattering (e.g. Wenk, [20]). Compared to X-rays neutrons have low absorption for most elements and arethus ideal to investigate bulk samples with penetration of centi-meters to tens of centimeters. It is easy to perform in situ exper-
Fig. 8. HIPPO time-of-fight neutron diffractometer at LANSCE with a large sample chambdetector views differently oriented crystals (For interpretation of the references to color
iments at low/high temperature and pressure and record changesduring chemical reactions and thus to study kinetics. For cementthe interaction of neutrons with hydrogen is of particular impor-tance: contrary to X-rays which scatter on electrons and thushydrogen with one electron is largely invisible, neutrons scatteron the nucleus and scattering on hydrogen is of similar magni-tude as for heavy elements. For hydrogen (H with one proton)there is a large interaction and energy exchange with thermalneutrons resulting in strong inelastic scattering. For deuterium(D with a proton and a neutron) there is little inelastic interactionand compounds with D are preferred for crystallographic studies.Finally, for neutrons, scattering on the small nucleus the scatter-ing factor does not decrease appreciably with scattering angle 2hand thus high intensities are observed to small d-spacings, result-ing in good resolution for structure refinements. The applicationof neutron scattering to cement has been reviewed by Livingstonet al. [21].
er (person is for scale) and 32 detector panels (green) arranged on four banks. Eachin this figure legend, the reader is referred to the web version of this article.).
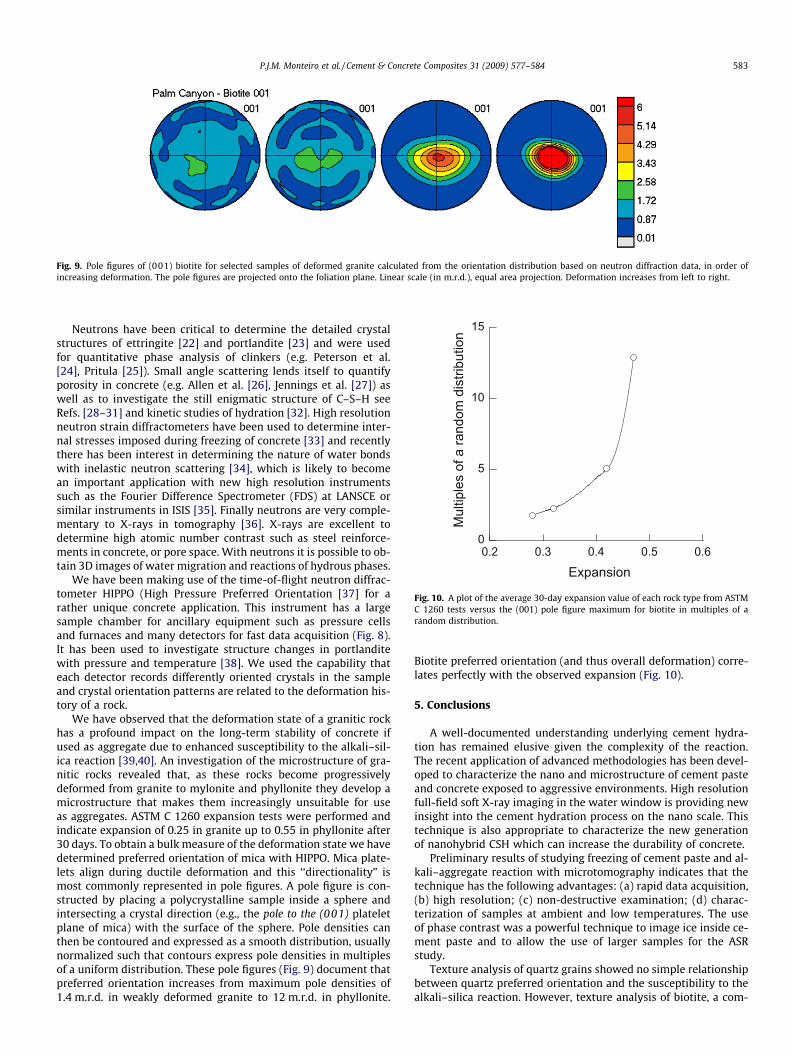
Fig. 9. Pole figures of (001) biotite for selected samples of deformed granite calculated from the orientation distribution based on neutron diffraction data, in order ofincreasing deformation. The pole figures are projected onto the foliation plane. Linear scale (in m.r.d.), equal area projection. Deformation increases from left to right.
0
5
10
15
0.2 0.3 0.4 0.5 0.6
Mul
tiple
s of
a ra
ndom
dis
tribu
tion
Expansion
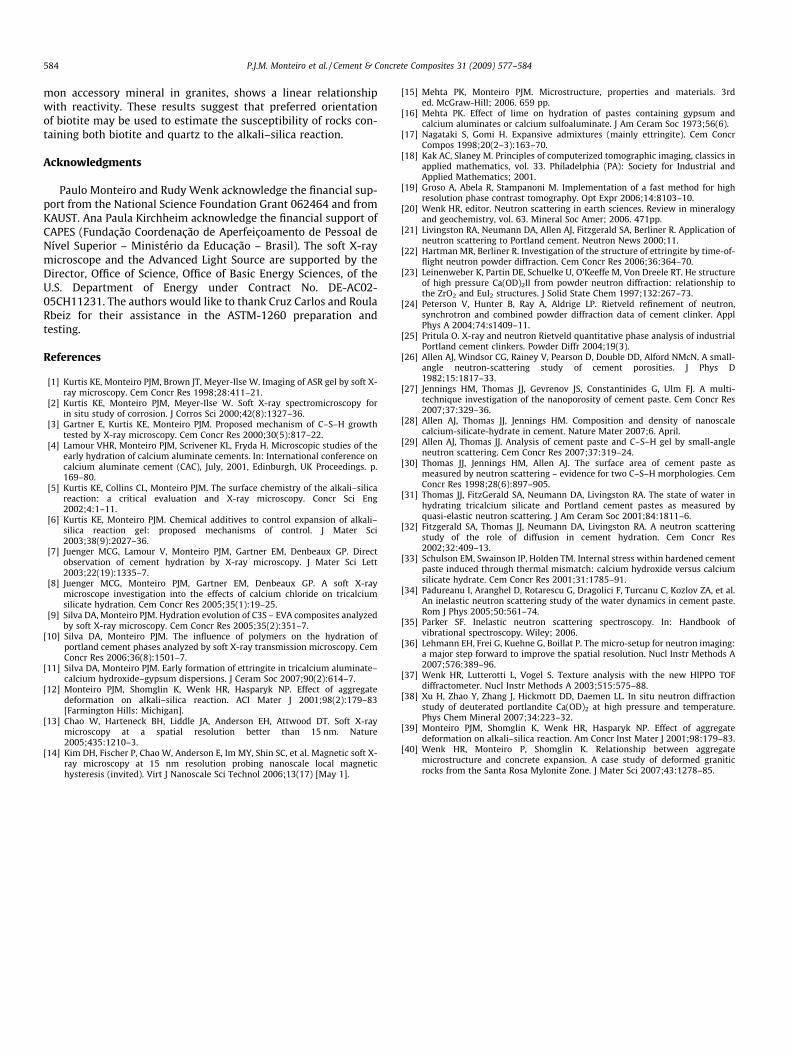
Fig. 10. A plot of the average 30-day expansion value of each rock type from ASTMC 1260 tests versus the (001) pole figure maximum for biotite in multiples of arandom distribution.
Neutrons have been critical to determine the detailed crystalstructures of ettringite [22] and portlandite [23] and were usedfor quantitative phase analysis of clinkers (e.g. Peterson et al.[24], Pritula [25]). Small angle scattering lends itself to quantifyporosity in concrete (e.g. Allen et al. [26], Jennings et al. [27]) aswell as to investigate the still enigmatic structure of C–S–H seeRefs. [28–31] and kinetic studies of hydration [32]. High resolutionneutron strain diffractometers have been used to determine inter-nal stresses imposed during freezing of concrete [33] and recentlythere has been interest in determining the nature of water bondswith inelastic neutron scattering [34], which is likely to becomean important application with new high resolution instrumentssuch as the Fourier Difference Spectrometer (FDS) at LANSCE orsimilar instruments in ISIS [35]. Finally neutrons are very comple-mentary to X-rays in tomography [36]. X-rays are excellent todetermine high atomic number contrast such as steel reinforce-ments in concrete, or pore space. With neutrons it is possible to ob-tain 3D images of water migration and reactions of hydrous phases.
We have been making use of the time-of-flight neutron diffrac-tometer HIPPO (High Pressure Preferred Orientation [37] for arather unique concrete application. This instrument has a largesample chamber for ancillary equipment such as pressure cellsand furnaces and many detectors for fast data acquisition (Fig. 8).It has been used to investigate structure changes in portlanditewith pressure and temperature [38]. We used the capability thateach detector records differently oriented crystals in the sampleand crystal orientation patterns are related to the deformation his-tory of a rock.
We have observed that the deformation state of a granitic rockhas a profound impact on the long-term stability of concrete ifused as aggregate due to enhanced susceptibility to the alkali–sil-ica reaction [39,40]. An investigation of the microstructure of gra-nitic rocks revealed that, as these rocks become progressivelydeformed from granite to mylonite and phyllonite they develop amicrostructure that makes them increasingly unsuitable for useas aggregates. ASTM C 1260 expansion tests were performed andindicate expansion of 0.25 in granite up to 0.55 in phyllonite after30 days. To obtain a bulk measure of the deformation state we havedetermined preferred orientation of mica with HIPPO. Mica plate-lets align during ductile deformation and this ‘‘directionality” ismost commonly represented in pole figures. A pole figure is con-structed by placing a polycrystalline sample inside a sphere andintersecting a crystal direction (e.g., the pole to the (001) plateletplane of mica) with the surface of the sphere. Pole densities canthen be contoured and expressed as a smooth distribution, usuallynormalized such that contours express pole densities in multiplesof a uniform distribution. These pole figures (Fig. 9) document thatpreferred orientation increases from maximum pole densities of1.4 m.r.d. in weakly deformed granite to 12 m.r.d. in phyllonite.
Biotite preferred orientation (and thus overall deformation) corre-lates perfectly with the observed expansion (Fig. 10).
5. Conclusions
A well-documented understanding underlying cement hydra-tion has remained elusive given the complexity of the reaction.The recent application of advanced methodologies has been devel-oped to characterize the nano and microstructure of cement pasteand concrete exposed to aggressive environments. High resolutionfull-field soft X-ray imaging in the water window is providing newinsight into the cement hydration process on the nano scale. Thistechnique is also appropriate to characterize the new generationof nanohybrid CSH which can increase the durability of concrete.
Preliminary results of studying freezing of cement paste and al-kali–aggregate reaction with microtomography indicates that thetechnique has the following advantages: (a) rapid data acquisition,(b) high resolution; (c) non-destructive examination; (d) charac-terization of samples at ambient and low temperatures. The useof phase contrast was a powerful technique to image ice inside ce-ment paste and to allow the use of larger samples for the ASRstudy.
Texture analysis of quartz grains showed no simple relationshipbetween quartz preferred orientation and the susceptibility to thealkali–silica reaction. However, texture analysis of biotite, a com-
mon accessory mineral in granites, shows a linear relationshipwith reactivity. These results suggest that preferred orientationof biotite may be used to estimate the susceptibility of rocks con-taining both biotite and quartz to the alkali–silica reaction.
Acknowledgments
Paulo Monteiro and Rudy Wenk acknowledge the financial sup-port from the National Science Foundation Grant 062464 and fromKAUST. Ana Paula Kirchheim acknowledge the financial support ofCAPES (Fundação Coordenação de Aperfeiçoamento de Pessoal deNível Superior – Ministério da Educação – Brasil). The soft X-raymicroscope and the Advanced Light Source are supported by theDirector, Office of Science, Office of Basic Energy Sciences, of theU.S. Department of Energy under Contract No. DE-AC02-05CH11231. The authors would like to thank Cruz Carlos and RoulaRbeiz for their assistance in the ASTM-1260 preparation andtesting.
References
[1] Kurtis KE, Monteiro PJM, Brown JT, Meyer-Ilse W. Imaging of ASR gel by soft X-ray microscopy. Cem Concr Res 1998;28:411–21.
[2] Kurtis KE, Monteiro PJM, Meyer-Ilse W. Soft X-ray spectromicroscopy forin situ study of corrosion. J Corros Sci 2000;42(8):1327–36.
[3] Gartner E, Kurtis KE, Monteiro PJM. Proposed mechanism of C–S–H growthtested by X-ray microscopy. Cem Concr Res 2000;30(5):817–22.
[4] Lamour VHR, Monteiro PJM, Scrivener KL, Fryda H. Microscopic studies of theearly hydration of calcium aluminate cements. In: International conference oncalcium aluminate cement (CAC), July, 2001, Edinburgh, UK Proceedings. p.169–80.
[5] Kurtis KE, Collins CL, Monteiro PJM. The surface chemistry of the alkali–silicareaction: a critical evaluation and X-ray microscopy. Concr Sci Eng2002;4:1–11.
[6] Kurtis KE, Monteiro PJM. Chemical additives to control expansion of alkali–silica reaction gel: proposed mechanisms of control. J Mater Sci2003;38(9):2027–36.
[7] Juenger MCG, Lamour V, Monteiro PJM, Gartner EM, Denbeaux GP. Directobservation of cement hydration by X-ray microscopy. J Mater Sci Lett2003;22(19):1335–7.
[8] Juenger MCG, Monteiro PJM, Gartner EM, Denbeaux GP. A soft X-raymicroscope investigation into the effects of calcium chloride on tricalciumsilicate hydration. Cem Concr Res 2005;35(1):19–25.
[9] Silva DA, Monteiro PJM. Hydration evolution of C3S – EVA composites analyzedby soft X-ray microscopy. Cem Concr Res 2005;35(2):351–7.
[10] Silva DA, Monteiro PJM. The influence of polymers on the hydration ofportland cement phases analyzed by soft X-ray transmission microscopy. CemConcr Res 2006;36(8):1501–7.
[11] Silva DA, Monteiro PJM. Early formation of ettringite in tricalcium aluminate–calcium hydroxide–gypsum dispersions. J Ceram Soc 2007;90(2):614–7.
[12] Monteiro PJM, Shomglin K, Wenk HR, Hasparyk NP. Effect of aggregatedeformation on alkali–silica reaction. ACI Mater J 2001;98(2):179–83[Farmington Hills: Michigan].
[13] Chao W, Harteneck BH, Liddle JA, Anderson EH, Attwood DT. Soft X-raymicroscopy at a spatial resolution better than 15 nm. Nature2005;435:1210–3.
[14] Kim DH, Fischer P, Chao W, Anderson E, Im MY, Shin SC, et al. Magnetic soft X-ray microscopy at 15 nm resolution probing nanoscale local magnetichysteresis (invited). Virt J Nanoscale Sci Technol 2006;13(17) [May 1].
[15] Mehta PK, Monteiro PJM. Microstructure, properties and materials. 3rded. McGraw-Hill; 2006. 659 pp.
[16] Mehta PK. Effect of lime on hydration of pastes containing gypsum andcalcium aluminates or calcium sulfoaluminate. J Am Ceram Soc 1973;56(6).
[17] Nagataki S, Gomi H. Expansive admixtures (mainly ettringite). Cem ConcrCompos 1998;20(2–3):163–70.
[18] Kak AC, Slaney M. Principles of computerized tomographic imaging, classics inapplied mathematics, vol. 33. Philadelphia (PA): Society for Industrial andApplied Mathematics; 2001.
[19] Groso A, Abela R, Stampanoni M. Implementation of a fast method for highresolution phase contrast tomography. Opt Expr 2006;14:8103–10.
[20] Wenk HR, editor. Neutron scattering in earth sciences. Review in mineralogyand geochemistry, vol. 63. Mineral Soc Amer; 2006. 471pp.
[21] Livingston RA, Neumann DA, Allen AJ, Fitzgerald SA, Berliner R. Application ofneutron scattering to Portland cement. Neutron News 2000;11.
[22] Hartman MR, Berliner R. Investigation of the structure of ettringite by time-of-flight neutron powder diffraction. Cem Concr Res 2006;36:364–70.
[23] Leinenweber K, Partin DE, Schuelke U, O’Keeffe M, Von Dreele RT. He structureof high pressure Ca(OD)2II from powder neutron diffraction: relationship tothe ZrO2 and EuI2 structures. J Solid State Chem 1997;132:267–73.
[24] Peterson V, Hunter B, Ray A, Aldrige LP. Rietveld refinement of neutron,synchrotron and combined powder diffraction data of cement clinker. ApplPhys A 2004;74:s1409–11.
[25] Pritula O. X-ray and neutron Rietveld quantitative phase analysis of industrialPortland cement clinkers. Powder Diffr 2004;19(3).
[26] Allen AJ, Windsor CG, Rainey V, Pearson D, Double DD, Alford NMcN. A small-angle neutron-scattering study of cement porosities. J Phys D1982;15:1817–33.
[27] Jennings HM, Thomas JJ, Gevrenov JS, Constantinides G, Ulm FJ. A multi-technique investigation of the nanoporosity of cement paste. Cem Concr Res2007;37:329–36.
[28] Allen AJ, Thomas JJ, Jennings HM. Composition and density of nanoscalecalcium-silicate-hydrate in cement. Nature Mater 2007;6. April.
[29] Allen AJ, Thomas JJ. Analysis of cement paste and C–S–H gel by small-angleneutron scattering. Cem Concr Res 2007;37:319–24.
[30] Thomas JJ, Jennings HM, Allen AJ. The surface area of cement paste asmeasured by neutron scattering – evidence for two C–S–H morphologies. CemConcr Res 1998;28(6):897–905.
[31] Thomas JJ, FitzGerald SA, Neumann DA, Livingston RA. The state of water inhydrating tricalcium silicate and Portland cement pastes as measured byquasi-elastic neutron scattering. J Am Ceram Soc 2001;84:1811–6.
[32] Fitzgerald SA, Thomas JJ, Neumann DA, Livingston RA. A neutron scatteringstudy of the role of diffusion in cement hydration. Cem Concr Res2002;32:409–13.
[33] Schulson EM, Swainson IP, Holden TM. Internal stress within hardened cementpaste induced through thermal mismatch: calcium hydroxide versus calciumsilicate hydrate. Cem Concr Res 2001;31:1785–91.
[34] Padureanu I, Aranghel D, Rotarescu G, Dragolici F, Turcanu C, Kozlov ZA, et al.An inelastic neutron scattering study of the water dynamics in cement paste.Rom J Phys 2005;50:561–74.
[36] Lehmann EH, Frei G, Kuehne G, Boillat P. The micro-setup for neutron imaging:a major step forward to improve the spatial resolution. Nucl Instr Methods A2007;576:389–96.
[37] Wenk HR, Lutterotti L, Vogel S. Texture analysis with the new HIPPO TOFdiffractometer. Nucl Instr Methods A 2003;515:575–88.
[38] Xu H, Zhao Y, Zhang J, Hickmott DD, Daemen LL. In situ neutron diffractionstudy of deuterated portlandite Ca(OD)2 at high pressure and temperature.Phys Chem Mineral 2007;34:223–32.
[39] Monteiro PJM, Shomglin K, Wenk HR, Hasparyk NP. Effect of aggregatedeformation on alkali–silica reaction. Am Concr Inst Mater J 2001;98:179–83.
[40] Wenk HR, Monteiro P, Shomglin K. Relationship between aggregatemicrostructure and concrete expansion. A case study of deformed graniticrocks from the Santa Rosa Mylonite Zone. J Mater Sci 2007;43:1278–85.