204
Census of Agriculture for Alberta I.D., M.D., and County Data by Land-use Region 2011 AGDEX 852-6 A federal-provincial-territorial initiative

Census ofAgriculture for AlbertaI.D., M.D., and County Data by Land-use Region
2011
AGDEX 852-6
A federal-provincial-territorial initiative
Published by:
Alberta Agriculture and Rural Development Information Management Division 7000 – 113 Street Edmonton Alberta Canada T6H 5T6 Copyright © 2014. Her Majesty the Queen in Right of Alberta (Alberta Agriculture and Rural Development).
This unique compilation of 2011 Census of Agriculture data for Alberta was developed by Alberta Agriculture and Rural Development, Statistics and Data Development Branch, using data obtained under the Statistics Canada Open Licence Agreement. Users of data contained in this publication are subject to the terms of the Statistics Canada Open Licence Agreement, which can be viewed at http://www.statcan.gc.ca/reference/licence-eng.html This publication was sponsored by Growing Forward, a Federal-Provincial-Territorial initiative. ISBN 978-0-7732-6111-2
See our website www.agriculture.alberta.ca/publications for information on other information products. Printed in Canada

Table of Contents Page Table Page
Introduction……………….………………………………………………………………………………..iii Vegetables Grown For Sale (excluding greenhouse vegetables)
Census Definitions and Notes………………………………….………………………………………………………iv 7.1 Total Vegetables; Sweet Corn; Tomatoes; Cucumbers; Green Peas;
Geographic Amalgamations ……………………………….………………………………………………iv Green and Wax Beans……………………………………………………………….. 40
Alberta Land-use Regions Map………………………...……..…………………………………..….xii 7.2 Cabbage; Chinese Cabbage; Cauliflower; Broccoli; Brussel Sprouts;
Alberta Municipalities Classified by Region…………………………...……………………..…………xiii Carrots……………………………………………………………………………………. 43
Highlights……………………...……………………………………………………………………..xiv 7.3 Rutabagas and Turnips; Beets; Radishes; Dry Onions; Shallots and
Green Onions; Celery…………………………………………………………… 46
Table Page 7.4 Lettuce; Spinach; Peppers; Pumpkins; Squash and Zucchini………...………………………………………49
7.5 Asparagus, Producing; Asparagus, Non-producing; Other Vegetables……………………………………………………………………………….52
1.1 Farms Classified by Operating Arrangements…………………………………………….……...…….…………...……..1
8.1 Nursery, Sod and Forest Products Grown for Sale…………………………………………………….55
2.1 Farm Land Area Classified by Tenure………………………………………………. 4
Farm Land Area Classified by Use of Land
3.1 Farms Classified by Total Farm Area…………………………………………………………..7 9.1 Total Area of Farms; Land In Crops; Summerfallow; Tame or Seeded
Pasture; Natural Land for Pasture……………………………………...…………. 58
4.1 Farms Classified by Type of Organic Production ……………………………………10 9.2 Woodland and Wetland; All Other Land ……………………………………...………….61
Field Crops Grown 10.1 Farms Classified by Area in Crops and Summerfallow……………………………64
5.1 Wheat; Oats; Barley………………………………………………………………… 13
5.2 Mixed Grain; Corn for Grain; Buckwheat; Rye…………………………………….....x16 Greenhouse Products and Mushrooms Grown for Sale
5.3 Corn for Silage; Alfalfa and Alfalfa Mixtures; All Other Tame Hay and 11.1 Total Greenhouse Area, Under Protection and In Use; Greenhouse
Fodder; Canola; Flaxseed; Soybeans……………………………………………..…. 19 Flowers; Greenhouse Vegetables; Other Greenhouse Products……………………………………………………...…………………..67
5.4 Mustard Seed; Sunflowers; Potatoes; Dry Field Peas; Lentils; 11.2 Mushrooms Grown for Sale………………………………………………………… 70
Dry White Beans……………………...……………………………………………………………….22
5.5 Chick Peas; Other Dry Beans; Canary Seed; 12.1 Use of Irrigation, Commercial Fertilizer, Herbicides,
Sugar Beets for Sugar; Ginseng; Caraway Seed …………………………..……………………………25 Insecticides, Fungicides and Lime…………………………………………………………….……………………73
5.6 Triticale; Forage Seed for Seed; All Other Field Crops……………………………………………..………………………28
Manure and Manure Application Methods
Fruits, Berries and Nuts Grown For Sale 13.1 Farms Producing or Using Manure ………………………………………………………76
6.1 Total Fruits, Berries & Nuts; Saskatoons; Strawberries; 13.2 Manure Application Methods ………………………………………………………… 79
Raspberries; Apples………………..…………..…………………………………. 31
6.2 Cherries (sour); Cherries (sweet); Blueberries; Cranberries; 14.1 Farms Classified by Conservation Practices and Features………………………………………..82Plums and Prunes……………...…………………………………..………………… 34
6.3 Pears; Peaches; Apricots; Grapes; Other Fruits, Berries & Nuts………………………………………37 15.1 Tillage Practices Used to Prepare Land for Seeding………………………………………………..……………….85
i

Table Page Table Page
16.1 Forms of Weed Control Used on Summerfallow Land……………………………88 25.1 Farms Classified by Total Farm Capital……………………………………… 133
Poultry Inventory Farm Business Operating Expenses
17.1 Total Hens and Chickens; Broilers, Roasters and Cornish; Pullets Intended 26.1 Total Expenses; Total Farm Interest Expenses; Rent and
for Laying; Laying Hens; Laying Hens, Layer and Broiler Breeders……………………………………………………………………..91 Leasing Expenses, Land and Buildings; Total Wages and
17.2 Turkeys; Other Poultry…………………………………………………..…………… 94 Salaries; Wages and Salaries Paid to Family Members………………………………………………………………………………….136
26.2 Wages and Salaries Paid to All Other Persons; Custom, Contract
18.1 Poultry Production, Egg Production and Poultry Hatched in and Hired Trucking; Electricity, Telephone and Other
Commercial Hatcheries…………………………………………………………………………………97 Telecommunications; All Fuel Expenses; Fertilizer and Lime Purchases……………………………………………………………………………….139
26.3 Herbicide/Insecticide/Fungicide Purchases; Seed and Seedling
Cattle and Calves Purchases; Feed and Supplement Purchases;
19.1 Total Cattle & Calves; Bulls; Total Cows; Dairy Cows; Beef Cows; Livestock and Poultry Purchases; Veterinary Services…………………………………………………………………142
Total Heifers; Beef Replacement Heifers………………………………………………………100 26.4 Repairs and Maintenance of Machinery, Equipment and Vehicles;
19.2 Dairy Replacement Heifers; Slaughter/Feeder Heifers; Rental and Leasing of Machinery, Equipment and Vehicles;
Steers; Calves, Under One Year………………………………………………….……………103 Repairs and Maintenance of Farm Buildings and Fences;
All Other Farm Operating Expenses…………………………………………………………………..145
21.1 Sheep and Lambs…………………………………………………………………… 109
Other Livestock and Bees
22.1 Horses and Ponies; Goats; Wild Boars; Mink; Bison (Buffalo); Rabbits…………………………….112 29.1 Paid Agricultural Labour………………………………………………………………………154
22.2 Deer (excluding wild deer); Elk; Llamas and Alpacas;
Colonies of Bees; Gallons of Other Pollinating Bees……………………………………………………………………….115 30.1 Farms Using Computers and Internet for Farm Business…………………………………157
Farm Machinery Inventory and Market Value 31.1 Number of Farm Operators…………………………………………………………………160
23.1 Total Tractors; Tractors Under 60 hp; Tractors 60 to 99 hp;
Tractors 100 to 149 hp ...…………………………………………………………………………….118 32.1 Farm Operators Classified by Sex ……………………………………………… 163
23.2 Tractors Over 149 hp; Cars and Other Passenger Vehicles;
Total Farm Trucks; Pick-ups and Cargo Vans …………………………………………………………….121 33.1 Farm Operators Classified by Age Groups ……………………………………………166
23.3 Other Farm Trucks; Combines; Swathers and
Mower-Conditioners; Balers …………………………………………………….. 124 34.1 Farm Operators Classified by On Farm and Non-Farm Work ………………………………169
23.4 Forage Harvesters; Tillage, Cultivation, Seeding and Planting Equipment;
Irrigation Equipment; All Other Farm Machinery and Equipment……………………127 35.1 Farm Operators Living On and Off the Farm……………………………… 172
Farm Capital
24.1 Total Farm Capital; Land & Buildings, Total, Owned, Rented; Appendix I
Livestock and Poultry; Total Value of Farm Machinery and Equipment………………………………………………………130 2011 Census of Agriculture Questionnaire
ii
20.1 Pigs…………………………………………………………………………………………………..106
28.1 Farms Classified by Type ……………………………………………………… 151
27.1 Farms Classified by Total Gross Farm Receipts……………………………………..148

iii
Acknowledgements The invaluable assistance from all of those who provided input to this publication is greatly appreciated. In particular, a number of people merit special recognition, as follows: From the Statistics and Data Development Branch, Alberta Agriculture and Rural Development (ARD): Huiting Huang and Marion Harry for the many hours spent in working directly with the processing and formatting of the custom data, and to Guangzhi Liu, for mapping the regions, and as well, to John Gilmore, from Ag-Industry Extensional and Training Branch, for the design of the cover. This publication was sponsored by Growing Forward, a Federal-Provincial-Territorial initiative. Reynold N. Jaipaul
Introduction This publication presents farm and farm operator data taken from the 2011 Census of Agriculture, conducted on May 10, 2011. The data is specific to Alberta at the County, Municipality, and Improvement District level, which are equivalent to Census Consolidated Subdivisions. As background, on May 10, 2012, farm and farm operator data relating to the 2011 Census of Agriculture for Canada was released by Statistics Canada on its website: http://www.statcan.gc.ca. At the time of the release, data for all variables were presented at five levels of geography, national, provincial, Census Agriculture Region (CAR), Census Division (CD), and the Census Consolidated Subdivision (CCS). The latter three presented data at the sub-provincial level. The CCS is a grouping of adjacent census subdivisions. A census subdivision with a land area greater than 25 square kilometers can form a census consolidated subdivision of its own, while smaller census subdivisions are usually grouped with a larger census subdivision. The release by Statistics Canada of the CCS data for the 2011 Census of Agriculture will provide those working with lower levels of geography, such as County, Municipal District, etc. an excellent source of detailed data for comparison across Canadian provinces.
The 2011 Census of Agriculture data contained in this publication is for selected farm variables. The data is presented in a tabular format, by County, Municipality and Improvement District, which are subsequently summed to the seven Land-use regions (Lower Peace, Lower Athabasca, Upper Peace, Upper Athabasca, North Saskatchewan, Red Deer, and South Saskatchewan). Land-use regions were created by the Government of Alberta for the Land-use Framework. The seven regions are based on the major watersheds, with boundaries aligned to best fit with existing municipal boundaries and the natural regions. Also worth noting, is that data confidentiality (as designated by an “x”) at the municipal level, has resulted in some data at the regional levels being suppressed to maintain this confidentiality. Users are encouraged to refer to the section containing the Census definitions and notes when attempting to interpret the data. Also, for spatial data interpretation, please refer to the Alberta map with its regional boundaries, and municipalities classified by region. In an ongoing attempt to improve this publication, comments or questions should be directed to: Reynold N. Jaipaul Branch Head Statistics & Data Development Branch #302, 7000 – 113 Street Edmonton, Alberta T6H 5T6 Telephone: (780) 427-5376 E-mail: [email protected] Fax : (780) 427-5220 January 2013

iv
Census Definitions and Notes General Notes Conversion Factors 1 acre = 0.404 685 6 hectares 1 hectare = 2.471 05 acres 1 square foot = 0.092 903 04 square meters 1 square meter = 10.763 91 square feet 1 kilogram = 2.204 622 6 pounds 1 pound = 0.453 592 4 kilograms
Boundary Changes There have been significant refinements in the geographic assignment of agricultural operations and changes in Census Consolidated Subdivision boundaries between 2011 and 2006 making data for Census Consolidated Subdivisions for these two censuses not comparable.
Geographic Amalgamations Due to confidentiality constraints, agricultural data for subdivisions with very few farms were combined with data from adjacent areas. Following are the amalgamations for the 2011 Census of Agriculture: Census 2011 Amalgamations &
Division I.D. Components
C.D. No. 5 482005031 Starland County
482005031 Starland County
482005026 Drumheller
C.D. No. 12 486012037 Lac la Biche County
486012037 Lac la Biche County
486016037 Wood Buffalo (Division #16)
486016051 Improvement District No. 24 Wood Buffalo (Division # 16)
C.D. No. 15 483015045 Ranchland No. 66
483015045 Ranchland No. 66
483015013 Kananaskis
483015007 Crowsnest Pass
483015032 Improvement District No. 9 Banff
C.D. No. 17 487017033 Lesser Slave River No. 124
487017033 Lesser Slave River No. 124
487017031 Opportunity No. 17
Data are not available for: (due to minimal or no agricultural activity)
Improvement District No. 4 (Waterton Park) Improvement District No. 13 (Elk Island) Improvement District No. 25 (Willmore Wilderness Park) Jasper Improvement District
Headquarters Rule Many agricultural operations in Canada are composed of numerous parcels of land in a number of locations. These different locations are often situated in several geographic areas (such as townships or counties). In these situations, the “headquarters rule” assigns all data collected for the agricultural operation to the geographic area where the farm headquarters is located.
Incomplete Enumeration of Indian Reserves and Indian Settlements On some Indian reserves and Indian settlements in the 2011 Census, enumeration was not permitted or was interrupted before it could be completed. These geographic areas are called incompletely enumerated Indian reserves and Indian settlements. Data for census farms located on these incompletely enumerated reserves and settlements are therefore not available. The impact of the missing data is very small for higher-level geographic areas (Canada, provinces, and census agricultural regions). However, the impact is more significant for those smaller areas (census divisions and census consolidated subdivisions) in which the affected reserves and settlements are located. For a listing of the names and locations of the incompletely enumerated Indian reserves and Indian settlements, please refer to the Statistics Canada web site at http://www.statcan.ca.
Rounding Totals may not equal the sum of their parts due to the use of conversion factors or the rounding of fractions to whole numbers. All farm operator data, including totals, were randomly rounded either up or down to a multiple of 5.

v
What’s new for 2011? The 2011 Census of Agriculture questionnaire was modified slightly from 2006. Some highlights are:
Data Collection In 2011, all Census of Agriculture forms were delivered to households and farm operations by Canada Post.
Farm Operator Data In 2011, farm operator data is added to this publication, as Statistics Canada released farm operator data at the same time as farm data.
Business Number For 2011, a question was added requesting the Canada Revenue Agency (CRA) Business Number for the agriculture operation.
Crop Residue In 2011, a question was added to request the area from which crop residue was baled. This is an environmentally relevant question, as crop residue management affects erosion rates, contamination of surface and groundwater, greenhouse gas emissions, and carbon sequestration.
Eggs For egg production, the two new variables Table eggs and Hatching eggs were added in 2011.
Internet In 2011, Access to high-speed Internet was added in order to evaluate the accessibility of respondents to services provided by Internet.
Land Use The variable Total all other land reported in 2006 was dropped for 2011.
Land Tenure For 2011, two new variables Used through Other Arrangements and Total Area Used by Others were added to this publication. Total Area of Farm is the difference between the sum of Area Owned, Leased from Government, Rented/Leased from Others, Crop Shared from Others, and Used through Other Arrangements minus Total Area Used by Others.
Pigs In 2011, Nursing pigs and Weaner pigs are reported separately, whereas in 2006 they were grouped together.
Other Livestock Rabbits was added as a separate variable in 2011. Fox has been removed as a separate variable.
Manure and Manure Application In 2011, the option Applied on land that was rented to others was added to the question on how manure was used or produced. The option Manure spread naturally by grazing livestock was added to the question on application methods, Liquid manure applied by irrigation was removed.
Organic In 2011, the category Organic but not certified was removed in order to reflect the new regulations on the use of the term "organic". Herbs, spices or garlic was added as a variable in 2011, after having been reported under other organic products in 2006.
Paid work In 2011, number of employees working full or part time was added in order to provide a measure of the number of people working on farms.
Practices and Land Features Two options, including In-field winter grazing or feeding and Nutrient management planning, were added in 2011.

vi
Deleted Topics Farm-related injuries In 2011, the topic on farm-related injuries was removed because better quality data are available from alternative sources.
Definitions All Other Land All other land includes land on which farm buildings, barnyards, lanes, home gardens, greenhouses and mushroom houses are located; idle land; woodlots; sugarbush; tree windbreaks; bogs; marshes; sloughs; etc. In 2011, land that was reported as “too wet to seed” was classified as “other land” instead of cropland or summerfallow.
Buffer Zones Around Water Bodies
Areas along natural watercourses left with natural vegetation (unfarmed) and designed to prevent erosion, especially in stream channels that become wider and shallower, to preserve wildlife habitat and fish stocks, and protect water quality for livestock and people. Also referred to as riparian areas, i.e., land bordering a stream or body of water.
Corn for Silage Corn in which the entire plant, including the cob, is chopped up and stored in upright silos, bunker silos or plastic bags, and used for animal feed.
Corporation An incorporated business registered with a provincial or federal agency as a legal entity separate from the owner. Family corporation: an incorporated business operation where an individual or members of a family own the majority of the corporation shares. Non-family corporation: an incorporated business operation where a group of unrelated individuals owns the majority of the corporation shares.
Crop Rotation Changing the type of crop grown on the same land from year to year or periodically to control weeds, insects, disease, and replenish soil nutrients or reduce erosion.
Crop Share An agreement between the landowner and the person operating the land (the share cropper), in which the crop is shared rather than cash rent being paid. Cropping expenses may or may not be shared. The person who does not own the land but operates it reports any areas being crop-shared.
Custom Work Work done somewhere other than on the agricultural operator's operation using his/her equipment in return for money or other payment. Includes custom plowing or combining, trucking, drying grain, cleaning seed, spreading fertilizer, spraying crops, cleaning feedlots, etc.
Farm (Census Farm) Over time, the definition of a farm has changed. In 1971 and 1976, a farm was defined as an agricultural holding of one acre or more with sales of agricultural products of $50 or more. In 1981 and 1986, the minimum sales requirement was increased to $250. In 1991, a farm was referred to as a census farm, ranch or other agricultural holding which produces at least one of the following products intended for sale (no minimum sales requirement): crops, livestock, poultry, animal products, greenhouse or nursery products, mushrooms, sod or honey. The 1996 definition was expanded to include commercial poultry hatcheries and operations that produced only Christmas trees. Since 1996, a census farm has been defined as an agricultural operation that produces at least one of the following products intended for sale: crops (hay, field crops, tree fruits or nuts, berries or grapes, vegetables, seed); livestock (cattle, pigs, sheep, horses, game animals, other livestock); poultry (hens, chickens, turkeys, chicks, game birds, other poultry, commercial poultry hatcheries); animal products (milk or cream, eggs, wool, furs, meat); or other agricultural products (Christmas trees, greenhouse or nursery products, mushrooms, sod, honey, maple syrup products).
Farm Capital Farm capital includes the value of all farmland, buildings, farm machinery and equipment (including passenger vehicles used in the farm business) and livestock and poultry. Respondents report the value of their land, buildings, farm machinery and equipment as of Census Day. Values for livestock and poultry inventories reported in the census are calculated using data on average farm prices for the various types of livestock and poultry. Farm capital does not include the value of crops in the field or in storage, or farm inputs on hand, such as fertilizer and seed.

vii
Farm Operators Since 1991 farm operators have been defined as those persons responsible for the day-to-day management and/or financial decisions made in the operation of a farm or an agricultural operation. Up to three farm operators could be reported per farm, including owners, tenants or hired managers, if they are responsible for management decisions for particular aspects of the farm, such as planting and harvesting, capital purchases, and marketing. Prior to the 1991 Census of Agriculture, the farm operator referred to only one person responsible for the day-to-day decisions made in running an agricultural operation. Farm operator data relating to the 2011 Census of Agriculture are also being provided with farm data in this publication. Farm operator data comprises sex, age, residence status as well as farm and non-farm work measured by average number of hours per week. Farm Operating Expenses Any cost associated with producing crops or livestock, except the purchase of land, buildings or equipment. Includes the cost of seed, feed, fuel, fertilizers, etc. Refers to gross operating expenses of the operation in the previous calendar year, or for the last complete accounting (fiscal) year, and excludes depreciation and capital cost allowance.
Farm Type For this publication, each census farm is classified according to the predominant type of production. This is done by estimating the potential receipts from the inventories of crops and livestock reported on the questionnaire and determining the product or group of products that make up the majority of the estimated receipts. The commodity or group of commodities that account for 51 per cent or more of the total potential receipts determines the farm type. Farm types are derived based on the 2007 North American Industrial Classification System (NAICS).
Dairy cattle and milk production comprises establishments primarily engaged in milking dairy cattle. Examples include fluid and raw cream production, fluid and raw milk production, etc.
Beef cattle ranching and farming comprises establishments primarily engaged in raising and fattening cattle. Examples include beef cattle feedlots, beef cattle ranching, dairy heifer replacement production, etc. Hog and pig farming comprises establishments primarily engaged in raising hogs and pigs. Examples include boar raising, hog feedlot, hog raising, pig farming, swine farrow to finish farming, weanling pigs raising, etc.
Poultry and egg production comprises establishments primarily engaged in breeding, hatching and raising poultry for meat or egg production. Examples include chicken egg farms, started pullet farming, broiler chicken farming, capon farming, fryer chicken raising,
turkey farming, turkey egg production, poultry hatcheries, duck farming, emu farming, geese farming, etc.
Sheep and goat farming comprises establishments primarily engaged in raising sheep and goats, and feeding or fattening lambs. Examples include lamb feedlot, lamb raising, sheep raising, sheep farming, wool production farming, goat farming, raw fluid goat’s milk production, mohair farming, etc.
Other animal production comprises establishments, not classified to any other industry group, primarily engaged in raising animals, such as bees, horses and other equines, rabbits and other fur-bearing animals, llamas, deer and the production of animal products, such as honey and other bee products, are also included. Establishments primarily engaged in raising a combination of animals, classified in other industries with no one predominating, are also included in this industry group. Wheat farming comprises establishments primarily engaged in growing wheat, for example spring, winter and durum wheat growing. Oilseed and grain (except wheat) farming comprises establishments primarily engaged in growing oilseeds and grains. Establishments primarily engaged in producing seeds are classified in the appropriate crop industry. Examples include soybean farming, oats farming, barley farming, mixed grains farming, rye faming, canola farming, flaxseed farming, dry field beans growing, dry field peas growing, forage seed farming, etc. Fruit and tree nut farming comprises establishments primarily engaged in growing fruit and nuts, for example saskatoon berry farming, strawberries farming, raspberries farming, apples faming and other fruits, berries and nuts farming.
Vegetable and melon farming comprises establishments primarily engaged in growing vegetables and melons, vegetable and melon seed production and vegetable and melon bedding plant production. Examples include potato farming, sweet potato farming, cucumber farming, green pea farming, green bean farming, cabbage farming, etc.
Greenhouse, nursery and floriculture production comprises establishments primarily engaged in growing crops of any kind under cover, growing nursery crops and growing flowers. Examples include food crops grown under cover, herbs grown under cover, vegetables grown under cover, mushroom farming, nursery and floriculture products grown under cover or in open fields, etc. Other crop farming comprises establishments, not classified to any other industry group, primarily engaged in growing crops, such as sugarbeets, hay, hay and grass seeds, etc. Combination crop farming and the gathering of maple sap are included in this industry group.
Since 2011, the previously used historical farm type classification based on the Standard Industrial Classifications (SIC) is no longer used for Census of Agriculture.

viii
Field Crops Includes hay, alfalfa and alfalfa mixtures, wheat (spring, durum, winter), oats, barley, mixed grains, corn (grain and silage), rye (fall and spring), canola, soybeans, flaxseed, dry field peas, chick peas, lentils, beans (dry white and other beans), forage seed, potatoes, mustard seed, sunflowers, canary seed, ginseng, buckwheat, sugar beets, caraway seed, triticale, and other field crops such as hemp, spelt, coriander and other spices.
Fodder Crops Includes alfalfa, barley, clover, corn and sorghum and any other crops in which the whole plant is used to feed cattle, sheep and other ruminants.
Forage Seed Seed from fodder crops grown commercially for seed. Includes timothy, fescue, clover, alfalfa, wheat grass, and turf grass seed.
Fungicide A chemical used to control, suppress or kill fungi that severely interrupt normal plant growth.
Green Crops for Plough Down Young green plants, such as buckwheat and red clover, incorporated into the soil to improve fertility. Usually grown only to improve the soil. Plowing down green crops: when a crop such as winter wheat, fall rye, buckwheat or red clover is planted but "plowed under" before it can be harvested.
Gross Farm Receipts
Farm receipts measure the gross revenue generated by agricultural holdings. They are not a direct measure of profit since operating expenses have not been deducted. The data for receipts were collected for the previous calendar year, or for the last complete accounting (fiscal) year. Gross Receipts include:
receipts from all agricultural products sold marketing board payments received program and rebate payments received GST refunds received dividends received from co-operatives receipts from maple syrup and Christmas tree sales custom work and all other farm receipts
Gross Receipts do not include: receipts from the sale of capital items (e.g. land, buildings or machinery) receipts from the sale of goods bought only for retail sales receipts from the sale of forest products (firewood, pulpwood, logs, fence posts,
pilings and standing timber) NOTE: Farm receipts data from the Census of Agriculture are not directly comparable with other Statistics Canada sources such as the Taxation Data Program (TDP), the Farm Financial Survey (FFS) and the Agriculture Economics Statistics (AES) series, which are affected by differences in concepts, methods and coverage.
Herbicide A chemical used to control, suppress, or kill plants or severely interrupt their normal growth.
Hired Paid Labour Paid farm work done on the operation during the previous calendar year, either on a year-round, or seasonal or temporary basis. This includes work done by family members who were paid a salary or wage. The total value of wages and salaries paid are included in Farm Operating Expenses.
Insecticide A substance or mixture of substances intended to prevent, destroy, repel or minimize the effect of any insects that may be present.
Interest Expenses Refers to interest on operating debt and on all other debts (e.g., machinery or mortgage debt) for the previous calendar year or for the last complete accounting (fiscal) year. Interest expenses do not include payment of principal or amount of debt outstanding. Interest expenses as a percent of total expenses is used as a proxy for debt since actual debt levels are not reported in the census. Land Use The sum of the following classifications of land use is equal to the total land area of Alberta farms:
Total Land in Crops: all areas reported for field crops, including grains and oilseeds, fruits, vegetables, nursery products and sod.
Summerfallow: land on which no crops will be grown during the year but on which weeds will be controlled by cultivation or application of chemicals.

ix
Tame or Seeded Pasture: land that has been cultivated and seeded, or drained, irrigated, fertilized or controlled for brush or weeds; does not include areas to be harvested for hay, silage or seed. Natural Land for Pasture: areas used for pasture that have not been cultivated and seeded, drained, irrigated or fertilized. Christmas Trees, Woodlands and Wetlands: area of Christmas tree grown for sale include naturally established or planted areas, regardless of stage of growth, that are pruned or managed with the use of fertilizer or pesticides. Woodlands include non-workable land such as woodlots, sugarbushes, tree windbreaks and bush that is not used for grazing. Wetlands include ponds, bogs, marshes, sloughs, etc.
All other land: land on which farm buildings, barnyards, lanes, home gardens, greenhouses and mushroom houses are located; idle land. In 2011, land that was reported as “too wet to seed” has been classified as “other land” instead of cropland or summerfallow.
Livestock Inventory Includes all animals on the farm, regardless of ownership, and any animals owned but pastured on a community pasture, grazing co-op or public land. Livestock on farms exclude animals owned but kept on a farm, ranch, or feedlot operated by someone else. Livestock data from the census are used as the basis for annual estimates and for estimating inventories, production and future supplies of animals and animal products for domestic consumption and export. Farmers use census estimates to make production and marketing decisions while government departments, private companies and farm media use census information in market analysis and formulation of agricultural outlooks.
Natural Land for Pasture Areas used for pasture that have not been cultivated and seeded, or drained, irrigated or fertilized. Includes native pasture/hay (indigenous grass suitable as feed for livestock and game); rangeland (land with natural plant cover, principally native grasses or shrubs valuable for forage); grazeable bush (forest land and bushy areas used for grazing, not land cultivated for crops or with dense forest), etc.
Non-workable land Includes land such as natural pastureland, woodland, wetlands, ponds, bogs, sloughs, barnyards, lanes, and land on which farm buildings are located.
Organic Certifying Agency This is a co-operative association or incorporated entity with the authority to give accreditation to organic agricultural operators. Organic certification is based on the Organic Agriculture Standard put out by the Canadian General Standards Board.
Organic Products Products from farm operations operated according to a set of organic production principles.
Certified organic product: an agricultural product that meets organic standards at each production/processing stage and is certified by a recognized certifying agency. Transitional: commonly used by certifying agencies to indicate fields in transition to becoming certified organic. It means the operator is actively adopting practices that comply with organic standards. Certification can take up to four years
Paid on a Year-Round Basis An employee who is paid on a year-round basis is employed either part time or full time twelve months of the year.
Paid on a Seasonal or Temporary Basis An employee who is paid on a seasonal or temporary basis is employed part time or full time for only part of the year. Partnership With or Without a Written Agreement A partnership with or without a written agreement is an agricultural operation where the business is owned and operated jointly by two or more persons with or without a written agreement and where risks and profits are shared. The partners may or may not own the land, buildings, machinery, etc.
Pesticide Any chemical used for controlling, suppressing or killing insects, weeds or fungi. Includes fungicides, herbicides, and insecticides.
Present Market Value The present market value is the amount of money a property should bring in if it were sold in today’s market.
Rotational Grazing A practice allowing forages to recover after each grazing period. Includes alternating two or more pastures at regular intervals or using temporary fences within pastures to prevent overgrazing.

x
Silage A crop, such as corn and sorghum or other green crops with sufficient moisture, that has been preserved by partial fermentation in a silo, pit, stack, plastic bag or wrap for animal feed, and is usually chopped. Often called "hay crop silage" or "haylage" when made from forage crops such as hay or alfalfa. This is also referred to as ensilage and baleage.
Sole Proprietorship Operation A sole proprietorship operation is an agricultural operation where one person owns the non-incorporated business. The person who owns the business may or may not own the land, buildings, machinery, etc. There may be multiple operators (persons responsible for the day-to-day management decisions) such as husband and wife, father and son, etc.
Summerfallow Land Involves keeping normally cultivated land free of vegetation throughout one growing season by cultivating (plowing, discing, etc.) and/or applying chemicals to destroy weeds, insects and soil-borne diseases and allow a buildup of soil moisture reserves for the next crop year. Includes chemfallow, tillage, and/or a combination of chemical and tillage weed control on the same land.
Tame or Seeded Pasture
Grazeable land that has been improved from its natural state by seeding, draining, irrigating, fertilizing or weed control. Does not include areas of land harvested for hay, silage or seed.
Tillage
Tillage is the practice of working the soil for the purpose of bringing about the more favourable conditions for plant growth. Conventional tillage incorporates most of the crop residue into the soil while minimum-till retains most of the crop residue on the surface. No-till or zero-till includes direct seeding into stubble or sod.
Value of Farm Land and Buildings
Refers to the present market value of land and buildings on the operation on Census Day. It includes the value of all houses that are part of the operation; the value of fixed equipment/machinery such as bulk tanks, farrowing pens, etc., found in farm buildings on the operation. It includes land and buildings that are rented or leased from others, but does not include the value of any land and buildings rented or leased to others.
Value of Farm Machinery and Equipment
Refers to the present market value of all farm machinery and equipment that was owned or leased on Census Day.
Windbreaks or Shelterbelts
Rows of natural or planted trees or hedges along field edges that stop prevailing winds from eroding the soil. Used more frequently in Western Canada where farmland is more susceptible to wind action and where trapping snow for moisture is important.
Winter Cover Crops
A crop, such as red clover, fall rye, etc., seeded in the fall to protect the soil from water and wind erosion during the winter and from heavy rains and run-off in the spring.
Woodlands and Wetlands Woodlands include non-workable land such as woodlots, sugarbushes, tree windbreaks and bush that is not used for grazing. Wetlands include ponds, bogs, marshes, sloughs, etc.
Workable Land All arable or cleared lands including area in hay, crops, summerfallow, and tame or seeded pasture land.
Notes on 2011 Census Data
Wheat
Spring Wheat (including utility and prairie spring wheats).
Winter Wheat/Fall Rye
Winter wheat or fall rye to be harvested in 2011.
Vegetables Grown for Sale
Excludes greenhouse vegetables.
Livestock
Chicks and poultry hatched refers to those hatched in commercial poultry hatcheries in the calendar year prior to the census.
Poultry production (broilers, roasters and Cornish) and Egg production (table eggs and hatching eggs) refers to production for the calendar year prior to the census.
Other poultry includes geese, ducks, roosters, ostriches, emus, pheasants, quail, wild turkey, etc.

xi
Herbicide/Insecticide/Fungicide Use
The area of land that has been treated with herbicides, insecticides and fungicides is under-reported. However, the data are comparable with previous censuses.
Operators
Up to three operators can be reported per farm. This is a count of distinct operators; hence, operators of two or more separate farms are included only once in the total.
Tenure
Includes land used through arrangements other than renting, leasing or crop sharing, such as land trading or rent free.
Source: Statistics Canada Prepared by: Alberta Agriculture and Rural Development Economics and Competitiveness Division Statistics and Data Development Branch

xii

No. of No. of No. of
Farms** C.D. Farms** C.D. Farms** C.D.
Mackenzie No.23 626 17 Beaver County 677 10 Bighorn No. 8 44 15
Northern Lights No.22 446 17 Brazeau County 487 11 Calgary 55 6
Northern Sunrise County 181 17 Camrose County 999 10 Cardston County 497 3
Clearwater County 1,096 9 Cypress County 827 1
Edmonton 73 11 Foothills No. 31 1,224 6
No. of Flagstaff County 650 7 Forty Mile County No. 8 524 1
Farms** C.D. Lamont County 753 10 Lethbridge County 933 2
Bonnyville No. 87 739 12 Leduc County 1,255 11 Newell County No. 4 717 2
Lac la Biche County 239 12 Minburn County No. 27 604 10 Pincher Creek No. 9 448 3
Parkland County 782 11 Ranchland No. 66 78 14
Provost No. 52 425 7 Rocky View County 1,271 6
No. of Smoky Lake County 454 12 Taber 652 2
Farms** C.D. St. Paul County No. 19 788 12 Vulcan County 603 5
Birch Hills County 295 19 Strathcona County 658 11 Warner County No. 5 488 2
Clear Hills 443 17 Sturgeon County 823 11 Wheatland County 782 5
Fairview No. 136 225 19 Thorhild County No. 7 462 13 Willow Creek No. 26 772 3
Grande Prairie County No. 1 1,206 19 Two Hills County No. 21 554 10
Greenview No. 16 639 18 Vermilion River County 1,029 10
Peace No. 135 166 19 Wainwright No. 61 501 7
Saddle Hills County 463 19 Wetaskiwin County No. 10 956 11
Smoky River No. 130 310 19
Spirit River No. 133 69 19 No. of C.D. - Census DivisionFarms** C.D.
Kneehill County 686 5
No. of Lacombe County 1,045 8
Farms** C.D. Mountain View County 1,636 6
Athabasca County 697 13 Paintearth County No. 18 420 7
Barrhead County No. 11 667 13 Ponoka County 1,106 8
Big Lakes 375 17 Red Deer County 1,531 8
Lac Ste. Anne County 936 13 Special Area No. 2 473 4
Lesser Slave River No.124 160 17 Special Area No. 3 464 4
Westlock County 777 13 Special Area No. 4 279 4 ** 2011 Census of Agriculture
Woodlands County 294 13 Starland County 300 5
Yellowhead County 695 14 Stettler County No. 6 705 7
Alberta Municipalities Classified by Land-use Region
Lower Peace* North Saskatchewan* South Saskatchewan*
Upper Peace*
Upper Athabasca*
Red Deer*
Lower Athabasca*
* Land-use regions were created by the
Government of Alberta for the Land-use
Framework. The seven regions are based on the
major watersheds, with boundaries aligned to
best fit with existing municipal boundaries and
the natural regions.
xiii

Number of Census Farms, 1941 - 2011
Source: Statistics Canada, Census of Agriculture, 1941 - 2011.
Prepared by Alberta Agriculture and Rural Development, Economics and Competitiveness Division, Statistics and Data Development Branch.
xiv
0
30,000
60,000
90,000
120,000
150,000
1941 1951 1956 1961 1966 1971 1976 1981 1986 1991 1996 2001 2006 20110
30,000
60,000
90,000
120,000
1941 1951 1956 1961 1966 1971 1976 1981 1986 1991 1996 2001 2006 2011
Alberta Saskatchewan
0
15,000
30,000
45,000
60,000
1941 1951 1956 1961 1966 1971 1976 1981 1986 1991 1996 2001 2006 2011
Manitoba
0
10,000
20,000
30,000
1941 1951 1956 1961 1966 1971 1976 1981 1986 1991 1996 2001 2006 2011
British Columbia
HIGHLIGHTS

Number of Census Farms, 1941 - 2011
Source: Statistics Canada, Census of Agriculture, 1941 - 2011.
Prepared by Alberta Agriculture and Rural Development, Economics and Competitiveness Division, Statistics and Data Development Branch.
xv
0
20,000
40,000
60,000
80,000
100,000
1941 1951 1956 1961 1966 1971 1976 1981 1986 1991 1996 2001 2006 2011
0
40,000
80,000
120,000
160,000
1941 1951 1956 1961 1966 1971 1976 1981 1986 1991 1996 2001 2006 2011
0
150,000
300,000
450,000
600,000
750,000
900,000
1941 1951 1956 1961 1966 1971 1976 1981 1986 1991 1996 2001 2006 2011
HIGHLIGHTS CONT'D
0
50,000
100,000
150,000
200,000
1941 1951 1956 1961 1966 1971 1976 1981 1986 1991 1996 2001 2006 2011
Ontario Quebec
Atlantic Provinces Canada

Number of Farms by Farm Size, 2011
Total # Under 10-129 130-239 240-399 400-559 560-759 760-1,119 1,120-1,599 1,600-2,239 2,240-2,879 2,880-3,519 3,520 Acres
of Farms 10 Acres Acres Acres Acres Acres Acres Acres Acres Acres Acres Acres and Over
Alberta 43,234 879 6,668 7,917 5,395 3,653 3,258 3,997 3,335 2,694 1,575 1,025 2,838
Lower Peace 1,253 6 67 224 173 145 134 134 121 95 55 27 72
Lower Athabasca 978 10 95 185 142 89 75 101 101 74 33 25 48
Upper Peace 3,816 26 271 718 503 362 288 424 362 304 175 120 263
Upper Athabasca 4,601 63 606 925 664 491 396 522 402 218 140 59 115
North Saskatchewan 14,026 304 2,404 2,719 1,810 1,216 1,115 1,303 1,041 786 453 290 585
Red Deer 8,645 189 1,205 1,639 1,013 703 639 750 651 601 317 212 726
South Saskatchewan 9,915 281 2,020 1,507 1,090 647 611 763 657 616 402 292 1,029
Source: Statistics Canada, 2011 Census of Agriculture. Prepared by Alberta Agriculture and Rural Development, Economics and Competitiveness Division, Statistics and Data Development Branch.
Refer to census definitions and notes for more information.
Source: Statistics Canada, 2011 Census of Agriculture. Prepared by Alberta Agriculture and Rural Development, Economics and Competitiveness Division, Statistics and Data Development Branch.
Distribution of Farms by Farm Size, 2011
HIGHLIGHTS CONT'D
1,600 & More Acres
Alberta 17.5%
30.8%
25.2%
7.7%
18.8%
5.8%
31.7%
33.0%
9.7%
19.9%
Lower Peace
10.7%
33.4%
27.1%
10.3%
18.4%
Lower Athabasca 7.8%
32.0%
28.1%
9.5%
22.6%
Upper Peace
14.5%
34.5%
30.6%
8.7%
11.6%
Upper Atabasca
19.3%
32.3%
25.9%
7.4%
15.1%
North Saskachewan
Under 130 Acres
130-399 Acres
400-1,119 Acres
1,120-1,599 Acres
1,600/More Acres
16.1%
30.7%
24.2%
7.5%
21.5%
23.2%
26.2%
20.4%
6.6%
23.6%
Red Deer South Saskatchewan
xvi

Distribution of Farms by Selected Farm Types*, 2011
Source: Statistics Canada, 2011 Census of Agriculture. Prepared by Alberta Agriculture and Rural Development, Economics and Competitiveness Division, Statistics and Data Development Branch.
*Farm types are derived based on the North American Industrial Classification System (NAICS). Refer to census definitions and notes for more information.
Greenhouse, Nursery, Floriculture, Mushroom
Source: Statistics Canada, 2011 Census of Agriculture. Prepared by Alberta Agriculture and Rural Development, Economics and Competitiveness Division, Statistics and Data Development Branch.
*Farm types are derived based on the North American Industrial Classification System (NAICS). Refer to census definitions and notes for more information.
Number of Farms by Farm Type*, 2011
1%
1%
1%
10%
30%
40%
18%
Dairy Farms
Lower Peace
Cattle (beef) Farms Poultry & Egg Farms Hog Farms
HIGHLIGHTS CONT'D
485
12,022
193
339
6,864
12,692
151
277
826
9,385
Alberta
4
136
3
5
143
611
5
6
7
333
Lower Peace
Per Cent of Alberta
Dairy
Cattle (beef)
Hog
Poultry & Egg
Grain & Oilseed
Fruit and Tree-nut
Vegetable
Greenhouse, Nursery,
Floriculture, Mushroom
Other Crops
Other Livestock
Lower Athabasca
Lower Athabasca
3
317
0
5
158
108
3
3
11
370
Upper Peace
3
586
9
10
547
1,291
9
10
41
1,310
49
1,349
21
31
871
865
13
18
63
1,321
147
3,660
53
121
2,231
4,460
54
90
297
2,913
North Saskatchwan
192
2,871
58
96
1,279
2,381
35
35
150
1,548
Red Deer
87
3,103
49
71
1,635
2,976
32
115
257
1,590
South Saskatchwan
Upper Peace
Upper Athabasca
North Saskatchwan
Red Deer
South Saskatchwan
Upper Athabasca
1%
3%
5%
11%
30%
24%
26%
2%
0%
5%
11%
27%
30%
25%
1%
1%
3%
9%
36%
28%
21%
`
5%
1%
10%
7%
35%
19%
23%
4%
4%
14%
14%
31%
16%
17%
Grain & Oilseed Farms Other Crops Farms
xvii

Land Use by Region, 2011
# Farms Acres # Farms Acres # Farms Acres # Farms Acres # Farms Acres # Farms Acres
Alberta 43,234 50,498,834 36,662 24,102,289 5,336 1,263,051 19,036 5,920,507 23,855 15,903,273 46,961 3,309,714
Lower Peace 1,253 1,452,205 1,149 844,270 261 39,448 458 127,171 416 191,572 1,644 249,744
Lower Athabasca 978 1,021,157 837 337,746 143 12,151 509 152,866 653 383,920 1,217 134,474
Upper Peace 3,816 4,716,859 3,419 2,756,579 651 95,647 1,549 489,276 1,716 881,555 4,668 493,802
Upper Athabasca 4,601 3,513,316 3,910 1,629,535 483 41,064 2,419 617,437 2,696 796,208 5,862 429,072
North Saskatchewan 14,026 12,449,222 11,926 6,811,587 1,290 142,558 6,285 1,735,142 7,892 2,785,830 16,215 974,105
Red Deer 8,645 11,197,827 7,301 4,737,855 1,134 412,363 4,063 1,413,585 5,329 4,127,161 9,153 506,863
South Saskatchewan 9,915 16,148,248 8,120 6,984,717 1,374 519,820 3,753 1,385,030 5,153 6,737,027 8,202 521,654
(1) Includes Woodlands and Wetlands, Christmas Tree Area and All Other Land
Source: Statistics Canada, 2011 Census of Agriculture. Prepared by Alberta Agriculture and Rural Development, Economics and Competitiveness Division, Statistics and Data Development Branch.
Source: Statistics Canada, 2011 Census of Agriculture. Prepared by Alberta Agriculture and Rural Development, Economics and Competitiveness Division, Statistics and Data Development Branch.
Distribution of Farms and Land Use by Region, 2011
Natural Land for Pasture All Other Land(1)Total Area of Farms Land in Crops Summerfallow Tame/Seeded Pasture
2.9%
2.0%
9.3%
7.0%
24.7%
22.2%
32.0%
HIGHLIGHTS CONT'D
2.9%
2.3%
8.8%
10.6%
32.4%
20.0%
22.9%
Total No. of Farms
Per Cent of Alberta
Lower Peace
North Saskatchewan
Upper Athabasca
South Saskatchewan
Lower Athabasca
Upper Peace
Red Deer
Total Area of Farms
2.9%
2.0%
9.3%
7.0%
24.7%
22.2%
32.0%
3.5%
1.4%
11.4%
6.8%
28.3%
19.7%
29.0%
Land in Crops
3.1%
1.0%
7.6%
3.3%
11.3%
32.6%
41.2%
Summerfallow Tame/Seeded Pasture
2.1%
2.6%
8.3%
10.4%
29.3%
23.9%
23.4%
Natural Land for Pasture
1.2%
2.4%
5.5%
5.0%
17.5%
26.0%
42.4%
xviii

Source: Statistics Canada, 2011 Census of Agriculture. Prepared by Alberta Agriculture and Rural Development, Economics and Competitiveness Division, Statistics and Data Development Branch.
Refer to census definitions and notes for more information.
Source: Statistics Canada, 2011 Census of Agriculture. Prepared by Alberta Agriculture and Rural Development, Economics and Competitiveness Division, Statistics and Data Development Branch.
Refer to census definitions and notes for more information.
Average Per Reporting Farm - Land Use (Acres), 2011
Average Per Reporting Farm - Farm Capital ($'000), 2011
HIGHLIGHTS CONT'D
Alberta 2,211
1,252
1,312
1,520
1,339
1,893
2,279
3,481
Total
Farm Capital Value of Farm
Machinery/Equipment
253
232
164
240
179
229
246
345
Value of Farm
Livestock/Poultry
144
61
89
90
99
99
143
259
735
404
806
417
571
1,859
987
1,083
1,229
1,087
1,597
1,928
2,957
Total Value of
Farm Land/Buildings
151
85
147
85
111
364
378
278
300
316
255
276
348
369
1,159
1,044
1,236
764
888
1,295
1,629
Total Farm Area Land in Crops Summerfallow
461
588
514
295
353
774
1,307
Natural Land
for Pasture
152
110
106
73
60
55
64
735
404
806
417
571
649
860
All Other Land Tame/Seeded
Pasture
Lower Peace
North Saskatchewan
Upper Athabasca
South Saskatchewan
Lower Athabasca
Upper Peace
Red Deer
Lower Peace
North Saskatchewan
Upper Athabasca
South Saskatchewan
Lower Athabasca
Upper Peace
Red Deer
1,370
789
834
957
835
1,133
1,396
2,240
Value of Farm
Land/Buildings Owned Value of Farm
Land/Buildings Rented
1,103
470
482
613
551
1,028
1,172
1,745
xix

Number of Farms by Gross Farm Receipts, 2010
Total
# Farms
Total Gross
Farm Receipts
Average Gross
Farm Receipts
per Farm
Under
$10,000
$10,000-
$24,999
$25,000-
$49,999
$50,000-
$99,999
$100,000-
$249,999
$250,000-
$499,999
$500,000
and over
($'000) ($'000)
Alberta 43,234 11,436,181 265 7,707 7,862 6,051 5,934 7,015 4,211 4,454
Lower Peace 1,253 204,990 164 215 243 193 187 216 115 84
Lower Athabasca 978 89,438 91 243 226 144 153 134 43 35
Upper Peace 3,816 687,849 180 779 727 561 504 568 321 356
Upper Athabasca 4,601 714,857 155 1,102 975 720 633 591 310 270
North Saskatchewan 14,026 2,629,972 188 2,690 2,719 2,045 1,909 2,172 1,288 1,203
Red Deer 8,645 2,206,195 255 1,143 1,479 1,208 1,255 1,656 931 973
South Saskatchewan 9,915 4,902,880 494 1,535 1,493 1,180 1,293 1,678 1,203 1,533
Source: Statistics Canada, 2011 Census of Agriculture. Prepared by Alberta Agriculture and Rural Development, Economics and Competitiveness Division, Statistics and Data Development Branch.
Refer to census definitions and notes for more information.
Source: Statistics Canada, 2011 Census of Agriculture. Prepared by Alberta Agriculture and Rural Development, Economics and Competitiveness Division, Statistics and Data Development Branch.
Refer to census definitions and notes for more information.
Distribution of Farms by Gross Farm Receipts, 2010
17.8%
18.2%
14.0%
13.7%
16.2%
9.7%
10.3%
HIGHLIGHTS CONT'D
Under $10,000
$10,000-$24,999
$25,000-$49,999
$50,000-$99,999
$100,000-$249,999
$250,000-$449,999
$500,000 and Over
17.8%
18.2%
14.0%
13.7%
16.2%
9.7%
10.3%
Alberta Lower Peace
17.2%
19.4%
15.4%
14.9%
17.2%
9.2%
6.7%
24.8%
23.1%
14.7%
15.6%
13.7%
4.4%
3.6%
Lower Athabasca
20.4%
19.1%
14.7%
13.2%
14.9%
8.4%
9.3%
Upper Peace
24.0%
21.2%
15.6%
13.8%
12.8%
6.7%
5.9%
Upper Athabasca
19.2%
19.4%
14.6%
13.6%
15.5%
9.2%
8.6%
North Saskatchewan
13.2%
17.1%
14.0%
14.5%
19.2%
10.8%
11.3%
Red Deer
15.5%
15.1%
11.9%
13.0%
16.9%
12.1%
15.5%
South Saskatchewan
xx

Table 1.1: Farms Classified by Operating Arrangements, 2011
Non-Written Written Family Non-family Other
Alberta 43,234 24,459 9,708 1,239 6,821 771 236
Lower Peace 1,253 848 229 23 134 13 6
Mackenzie County 626 445 107 11 57 5 1
Northern Lights County 446 298 84 10 47 4 3
Northern Sunrise County 181 105 38 2 30 4 2
Lower Athabasca 978 605 260 19 76 9 9
Bonnyville No. 87 739 461 203 13 49 7 6
Lac La Biche County 239 144 57 6 27 2 3
Upper Peace 3,816 2,266 835 123 506 63 23
Birch Hills County 295 172 51 11 47 10 4
Clear Hills 443 289 94 7 45 6 2
Fairview No. 136 225 124 45 8 43 3 2
Grande Prairie County No. 1 1,206 729 280 34 139 18 6
Greenview No. 16 639 378 169 26 54 7 5
Peace No. 135 166 100 37 7 19 2 1
Saddle Hills County 463 283 99 11 62 6 2
Smoky River No. 130 310 154 42 19 85 9 1
Spirit River No. 133 69 37 18 0 12 2 0
Upper Athabasca 4,601 2,680 1,236 123 511 40 11
Athabasca County 697 432 194 10 52 6 3
Barrhead County No. 11 667 344 179 19 121 3 1
Big Lakes 375 240 77 14 41 1 2
Lac Ste. Anne County 936 577 251 23 77 7 1
Lesser Slave River No.124 160 96 45 7 12 0 0
Westlock County 777 395 229 26 111 16 0
Woodlands County 294 181 81 6 25 1 0
Yellowhead County 695 415 180 18 72 6 4
Source: Statistics Canada, 2011 Census of Agriculture. Prepared by Alberta Agriculture and Rural Development, Economics and Competitiveness Division, Statistics and Data Development Branch.
0 - True zero or a value rounded to zero. Refer to census definitions and notes for more information.
Total Number
of Farms
Sole
Proprietorship
Partnership Agreement Corporation
1

Table 1.1: Farms Classified by Operating Arrangements, 2011
Non-Written Written Family Non-family Other
North Saskatchewan 14,026 8,406 3,228 322 1,821 197 52
Beaver County 677 407 164 12 81 8 5
Brazeau County 487 274 150 15 38 8 2
Camrose County 999 567 237 36 143 14 2
Clearwater County 1,096 634 319 32 86 13 12
Edmonton 73 40 16 2 8 5 2
Flagstaff County 650 361 113 17 150 8 1
Lamont County 753 516 149 8 71 7 2
Leduc County 1,255 726 330 27 159 13 0
Minburn County No. 27 604 381 106 12 94 10 1
Parkland County 782 469 186 13 91 20 3
Provost No. 52 425 253 72 10 85 2 3
Smoky Lake County 454 301 103 14 30 3 3
St. Paul County No. 19 788 529 167 17 60 12 3
Strathcona County 658 378 159 21 84 15 1
Sturgeon County 823 479 184 16 131 12 1
Thorhild County No. 7 462 307 108 10 28 9 0
Two Hills County No. 21 554 388 101 10 46 4 5
Vermilion River County 1,029 562 205 14 235 12 1
Wainwright No. 61 501 277 95 10 107 8 4
Wetaskiwin County No. 10 956 557 264 26 94 14 1
Red Deer 8,645 4,696 2,055 304 1,418 148 24
Kneehill County 686 325 149 29 164 18 1
Lacombe County 1,045 559 222 33 217 11 3
Mountain View County 1,636 910 436 42 219 27 2
Paintearth County No. 18 420 256 84 16 58 6 0
Ponoka County 1,106 636 254 48 150 18 0
Red Deer County 1,531 807 410 78 216 18 2
Special Area No. 2 473 239 101 13 101 14 5
Special Area No. 3 464 267 81 8 97 10 1
Special Area No. 4 279 143 52 8 68 8 0
Starland County 300 140 80 13 54 8 5
Stettler County No. 6 705 414 186 16 74 10 5
Source: Statistics Canada, 2011 Census of Agriculture. Prepared by Alberta Agriculture and Rural Development, Economics and Competitiveness Division, Statistics and Data Development Branch.
0 - True zero or a value rounded to zero. Refer to census definitions and notes for more information.
Partnership Agreement CorporationTotal Number
of Farms
Sole
Proprietorship
2

Table 1.1: Farms Classified by Operating Arrangements, 2011
Non-Written Written Family Non-family Other
South Saskatchewan 9,915 4,958 1,865 325 2,355 301 111
Bighorn No. 8 44 19 13 2 7 2 1
Calgary 55 36 7 1 7 4 0
Cardston County 497 279 103 14 76 20 5
Cypress County 827 433 153 29 171 26 15
Foothills No. 31 1,224 638 279 33 238 33 3
Forty Mile County No. 8 524 209 67 34 183 23 8
Lethbridge County 933 426 149 30 300 22 6
Newell County No. 4 717 336 153 21 169 20 18
Pincher Creek No. 9 448 261 95 18 60 8 6
Ranchland No. 66 78 26 12 3 13 4 20
Rocky View County 1,271 702 287 38 213 28 3
Taber 652 295 97 20 212 20 8
Vulcan County 603 287 81 15 184 25 11
Warner County No. 5 488 264 63 8 126 26 1
Wheatland County 782 370 147 29 213 21 2
Willow Creek No. 26 772 377 159 30 183 19 4
Source: Statistics Canada, 2011 Census of Agriculture. Prepared by Alberta Agriculture and Rural Development, Economics and Competitiveness Division, Statistics and Data Development Branch.
0 - True zero or a value rounded to zero. Refer to census definitions and notes for more information.
Total Number
of Farms
Sole
Proprietorship
Partnership Agreement Corporation
3
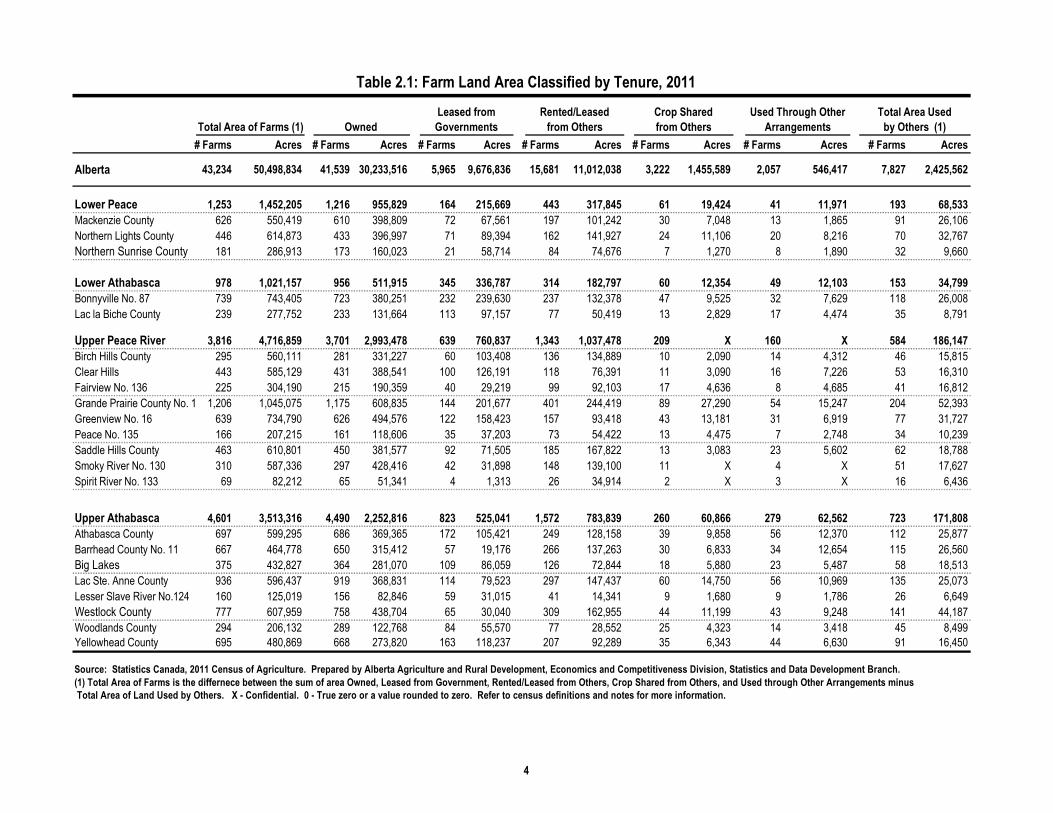
Table 2.1: Farm Land Area Classified by Tenure, 2011
# Farms Acres # Farms Acres # Farms Acres # Farms Acres # Farms Acres # Farms Acres # Farms Acres
Alberta 43,234 50,498,834 41,539 30,233,516 5,965 9,676,836 15,681 11,012,038 3,222 1,455,589 2,057 546,417 7,827 2,425,562
Lower Peace 1,253 1,452,205 1,216 955,829 164 215,669 443 317,845 61 19,424 41 11,971 193 68,533
Mackenzie County 626 550,419 610 398,809 72 67,561 197 101,242 30 7,048 13 1,865 91 26,106
Northern Lights County 446 614,873 433 396,997 71 89,394 162 141,927 24 11,106 20 8,216 70 32,767
Northern Sunrise County 181 286,913 173 160,023 21 58,714 84 74,676 7 1,270 8 1,890 32 9,660
Lower Athabasca 978 1,021,157 956 511,915 345 336,787 314 182,797 60 12,354 49 12,103 153 34,799
Bonnyville No. 87 739 743,405 723 380,251 232 239,630 237 132,378 47 9,525 32 7,629 118 26,008
Lac la Biche County 239 277,752 233 131,664 113 97,157 77 50,419 13 2,829 17 4,474 35 8,791
Upper Peace River 3,816 4,716,859 3,701 2,993,478 639 760,837 1,343 1,037,478 209 X 160 X 584 186,147
Birch Hills County 295 560,111 281 331,227 60 103,408 136 134,889 10 2,090 14 4,312 46 15,815
Clear Hills 443 585,129 431 388,541 100 126,191 118 76,391 11 3,090 16 7,226 53 16,310
Fairview No. 136 225 304,190 215 190,359 40 29,219 99 92,103 17 4,636 8 4,685 41 16,812
Grande Prairie County No. 1 1,206 1,045,075 1,175 608,835 144 201,677 401 244,419 89 27,290 54 15,247 204 52,393
Greenview No. 16 639 734,790 626 494,576 122 158,423 157 93,418 43 13,181 31 6,919 77 31,727
Peace No. 135 166 207,215 161 118,606 35 37,203 73 54,422 13 4,475 7 2,748 34 10,239
Saddle Hills County 463 610,801 450 381,577 92 71,505 185 167,822 13 3,083 23 5,602 62 18,788
Smoky River No. 130 310 587,336 297 428,416 42 31,898 148 139,100 11 X 4 X 51 17,627
Spirit River No. 133 69 82,212 65 51,341 4 1,313 26 34,914 2 X 3 X 16 6,436
Upper Athabasca 4,601 3,513,316 4,490 2,252,816 823 525,041 1,572 783,839 260 60,866 279 62,562 723 171,808
Athabasca County 697 599,295 686 369,365 172 105,421 249 128,158 39 9,858 56 12,370 112 25,877
Barrhead County No. 11 667 464,778 650 315,412 57 19,176 266 137,263 30 6,833 34 12,654 115 26,560
Big Lakes 375 432,827 364 281,070 109 86,059 126 72,844 18 5,880 23 5,487 58 18,513
Lac Ste. Anne County 936 596,437 919 368,831 114 79,523 297 147,437 60 14,750 56 10,969 135 25,073
Lesser Slave River No.124 160 125,019 156 82,846 59 31,015 41 14,341 9 1,680 9 1,786 26 6,649
Westlock County 777 607,959 758 438,704 65 30,040 309 162,955 44 11,199 43 9,248 141 44,187
Woodlands County 294 206,132 289 122,768 84 55,570 77 28,552 25 4,323 14 3,418 45 8,499
Yellowhead County 695 480,869 668 273,820 163 118,237 207 92,289 35 6,343 44 6,630 91 16,450
Source: Statistics Canada, 2011 Census of Agriculture. Prepared by Alberta Agriculture and Rural Development, Economics and Competitiveness Division, Statistics and Data Development Branch.
(1) Total Area of Farms is the differnece between the sum of area Owned, Leased from Government, Rented/Leased from Others, Crop Shared from Others, and Used through Other Arrangements minus
Total Area of Land Used by Others. X - Confidential. 0 - True zero or a value rounded to zero. Refer to census definitions and notes for more information.
Total Area of Farms (1)
Crop Shared
from OthersOwned
Leased from
Governments
Used Through Other
Arrangements
Total Area Used
by Others (1)
Rented/Leased
from Others
4

Table 2.1: Farm Land Area Classified by Tenure, 2011
# Farms Acres # Farms Acres # Farms Acres # Farms Acres # Farms Acres # Farms Acres # Farms Acres
North Saskatchewan 14,026 12,449,222 13,536 7,731,810 1,479 1,441,541 5,387 3,491,087 1,105 X 687 X 2,671 749,693
Beaver County 677 704,437 659 491,824 59 28,684 291 204,423 69 31,131 25 2,590 171 54,215
Brazeau County 487 289,674 480 185,880 76 59,252 132 56,668 27 X 19 X 67 19,757
Camrose County 999 820,147 967 569,016 49 14,723 398 237,446 111 43,516 46 8,236 213 52,790
Clearwater County 1,096 715,023 1,044 352,537 202 248,929 324 110,530 94 18,574 56 9,580 171 25,127
Edmonton 73 13,011 57 6,416 3 790 28 7,638 1 X 6 X 12 1,929
Flagstaff County 650 929,814 630 637,734 53 19,655 323 282,410 76 46,883 28 9,899 148 66,767
Lamont County 753 571,740 724 327,909 48 61,427 296 179,792 72 21,441 30 7,407 139 26,236
Leduc County 1,255 564,865 1,214 358,297 46 7,753 450 210,633 83 16,488 67 6,587 241 34,893
Minburn County No. 27 604 717,764 575 457,696 37 25,481 290 258,028 43 19,272 27 5,559 143 48,272
Parkland County 782 401,863 752 237,461 54 33,939 287 135,563 46 8,968 52 6,692 113 20,760
Provost No. 52 425 885,276 406 596,346 140 134,016 175 165,792 52 33,472 19 8,087 80 52,437
Smoky Lake County 454 497,649 442 248,105 97 150,109 170 102,583 24 11,231 32 14,832 78 29,211
St. Paul County No. 19 788 800,307 770 473,274 160 176,884 274 163,428 52 16,794 30 8,112 125 38,185
Strathcona County 658 220,184 630 122,711 33 3,438 175 87,695 49 10,987 46 6,974 95 11,621
Sturgeon County 823 467,464 782 262,328 48 14,927 320 201,711 60 17,626 49 7,975 173 37,103
Thorhild County No. 7 462 361,476 456 221,239 54 45,496 179 101,456 29 7,080 19 2,765 73 16,560
Two Hills County No. 21 554 647,951 533 334,813 28 126,633 230 191,683 47 18,877 24 4,156 122 28,211
Vermilion River County 1,029 1,363,540 998 923,506 132 90,173 473 406,239 69 25,296 49 15,877 237 97,551
Wainwright No. 61 501 865,627 487 562,212 97 140,657 234 195,311 32 26,761 17 3,754 110 63,068
Wetaskiwin County No. 10 956 611,410 930 362,506 63 58,575 338 192,058 69 13,025 46 10,246 160 25,000
Red Deer 8,645 11,197,827 8,301 6,766,566 1,148 2,198,435 3,217 2,319,021 684 339,473 397 121,331 1,756 546,999
Kneehill County 686 832,411 652 486,638 34 37,275 314 274,120 104 84,335 41 9,868 167 59,825
Lacombe County 1,045 668,102 1,000 448,069 63 27,971 406 214,960 75 24,980 43 8,697 232 56,575
Mountain View County 1,636 933,882 1,557 544,050 99 115,352 576 285,548 137 45,751 75 12,986 353 69,805
Paintearth County No. 18 420 772,990 410 604,432 60 30,803 171 164,016 22 10,543 22 9,260 86 46,064
Ponoka County 1,106 643,219 1,074 460,259 62 23,615 394 180,298 48 12,780 56 10,789 201 44,522
Red Deer County 1,531 973,968 1,477 620,388 74 26,977 568 364,271 116 33,546 72 16,363 386 87,577
Special Area No. 2 473 2,166,924 450 1,100,839 226 920,395 118 131,970 31 29,825 21 12,715 47 28,820
Special Area No. 3 464 1,616,411 450 863,542 236 602,809 147 131,877 38 36,539 13 14,963 49 33,319
Special Area No. 4 279 1,023,312 271 586,458 160 295,750 94 149,833 13 6,219 11 6,721 28 21,669
Starland County 300 578,749 288 399,616 59 31,726 134 159,089 36 21,119 18 9,880 76 42,681
Stettler County No. 6 705 987,859 672 652,275 75 85,762 295 263,039 64 33,836 25 9,089 131 56,142
Source: Statistics Canada, 2011 Census of Agriculture. Prepared by Alberta Agriculture and Rural Development, Economics and Competitiveness Division, Statistics and Data Development Branch.
(1) Total Area of Farms is the differnece between the sum of area Owned, Leased from Government, Rented/Leased from Others, Crop Shared from Others, and Used through Other Arrangements minus Total Area of Land Used by Others. X - Confidential. 0 - True zero or a value rounded to zero. Refer to census definitions and notes for more information.
Total Area of Farms
Leased from
Governments
Used Through Other
Arrangements
Crop Shared
from Others
Rented/Leased
from Others Owned
Total Area Used
by Others (1)
5

Table 2.1: Farm Land Area Classified by Tenure, 2011
# Farms Acres # Farms Acres # Farms Acres # Farms Acres # Farms Acres # Farms Acres # Farms Acres
South Saskatchewan 9,915 16,148,248 9,339 9,021,102 1,367 4,198,526 3,405 2,879,971 843 X 444 X 1,747 X
Bighorn No. 8 44 203,627 41 20,469 20 160,067 14 22,956 1 X 2 X 6 X
Calgary 55 31,062 42 7,677 5 1,904 19 18,185 5 4,809 6 27 10 1,540
Cardston County 497 842,994 476 529,504 75 90,885 219 240,896 21 4,903 31 6,020 93 29,214
Cypress County 827 2,335,795 789 1,070,924 258 1,090,205 194 183,568 55 43,296 25 10,319 112 62,517
Foothills No. 31 1,224 892,342 1,172 464,241 97 189,372 341 240,768 107 41,908 61 15,428 223 59,375
Forty Mile County No. 8 524 1,703,217 492 913,852 148 537,297 204 205,573 61 91,873 18 10,695 106 56,073
Lethbridge County 933 701,095 867 513,149 49 24,025 290 140,512 58 34,437 41 27,253 151 38,281
Newell County No. 4 717 1,458,695 666 640,409 59 652,110 277 177,269 32 20,420 24 7,566 104 39,079
Pincher Creek No. 9 448 800,070 422 425,318 105 203,831 168 179,686 28 7,101 25 10,760 68 26,626
Ranchland No. 66 78 465,727 50 46,586 42 404,674 16 12,050 3 X 5 X 2 X
Rocky View County 1,271 967,828 1,205 623,655 76 80,868 408 272,322 101 42,561 70 12,939 215 64,517
Taber 652 1,031,225 608 606,073 89 242,803 277 207,098 43 22,085 28 8,567 168 55,401
Vulcan County 603 1,354,405 566 822,136 91 192,445 247 291,745 112 108,780 19 6,901 124 67,602
Warner County No. 5 488 1,112,336 470 802,324 98 135,784 182 169,790 68 48,415 13 1,848 78 45,825
Wheatland County 782 1,121,462 741 811,811 22 16,490 312 284,127 90 66,215 22 7,730 152 64,911
Willow Creek No. 26 772 1,126,368 732 722,974 133 175,766 237 233,426 58 30,248 54 19,811 135 55,857
Source: Statistics Canada, 2011 Census of Agriculture. Prepared by Alberta Agriculture and Rural Development, Economics and Competitiveness Division, Statistics and Data Development Branch.
(1) Total Area of Farms is the differnece between the sum of area Owned, Leased from Government, Rented/Leased from Others, Crop Shared from Others, and Used through Other Arrangements minus
Total Area of Land Used by Others. X - Confidential. 0 - True zero or a value rounded to zero. Refer to census definitions and notes for more information.
Used Through Other
Arrangements
Total Area Used
by Others (1)Total Area of Farms Owned
Leased from
Governments
Rented/Leased
from Others
Crop Shared
from Others
6

Table 3.1: Farms Classified by Total Farm Area, 2011
Total # Under 10-69 70-129 130-179 180-239 240-399 400-559 560-759 760-1,119 1,120-1,599 1,600-2,239 2,240-2,879 2,880-3,519 3,520 Acres
of Farms 10 Acres Acres Acres Acres Acres Acres Acres Acres Acres Acres Acres Acres Acres and Over
Alberta 43,234 879 3,638 3,030 6,581 1,336 5,395 3,653 3,258 3,997 3,335 2,694 1,575 1,025 2,838
Lower Peace 1,253 6 37 30 194 30 173 145 134 134 121 95 55 27 72
Mackenzie County 626 3 20 16 111 15 97 79 73 70 51 44 19 8 20
Northern Lights County 446 1 12 10 63 8 46 53 48 49 46 36 27 12 35
Northern Sunrise County 181 2 5 4 20 7 30 13 13 15 24 15 9 7 17
Lower Athabasca 978 10 44 51 156 29 142 89 75 101 101 74 33 25 48
Bonnyville No. 87 739 7 36 42 126 20 108 71 59 73 75 51 22 12 37
Lac la Biche County 239 3 8 9 30 9 34 18 16 28 26 23 11 13 11
Upper Peace 3,816 26 127 144 625 93 503 362 288 424 362 304 175 120 263
Birch Hills County 295 0 9 15 34 6 15 23 24 29 35 33 19 15 38
Clear Hills 443 1 5 7 76 3 72 46 36 45 45 37 31 9 30
Fairview No. 136 225 3 4 9 28 8 24 18 9 25 25 29 11 11 21
Grande Prairie County No. 1 1,206 13 49 64 266 41 162 131 89 113 97 72 46 24 39
Greenview No. 16 639 2 21 25 106 17 104 60 53 85 58 43 18 10 37
Peace No. 135 166 3 8 3 19 7 19 17 10 20 17 16 5 9 13
Saddle Hills County 463 0 12 7 60 8 67 45 39 68 53 32 21 16 35
Smoky River No. 130 310 4 14 9 27 2 30 15 22 32 27 40 23 23 42
Spirit River No. 133 69 0 5 5 9 1 10 7 6 7 5 2 1 3 8
Upper Athabasca 4,601 63 287 319 773 152 664 491 396 522 402 218 140 59 115
Athabasca County 697 5 31 48 103 28 96 79 52 83 63 48 22 18 21
Barrhead County No. 11 667 9 43 37 120 18 97 70 57 90 70 29 13 3 11
Big Lakes 375 3 7 15 48 10 39 50 34 50 47 23 15 10 24
Lac Ste. Anne County 936 12 75 68 194 34 142 100 75 103 63 26 20 10 14
Lesser Slave River No.124 160 1 4 9 25 5 21 23 14 21 17 8 9 1 2
Westlock County 777 19 55 46 112 28 109 79 68 90 72 43 24 9 23
Woodlands County 294 1 16 29 49 6 49 40 23 25 19 17 11 3 6
Yellowhead County 695 13 56 67 122 23 111 50 73 60 51 24 26 5 14
Source: Statistics Canada, 2011 Census of Agriculture. Prepared by Alberta Agriculture and Rural Development, Economics and Competitiveness Division, Statistics and Data Development Branch.
0 - True zero or a value rounded to zero. Refer to census definitions and notes for more information.
7

Table 3.1: Farms Classified by Total Farm Area, 2011
Total # Under 10-69 70-129 130-179 180-239 240-399 400-559 560-759 760-1,119 1,120-1,599 1,600-2,239 2,240-2,879 2,880-3,519 3,520 Acres
of Farms 10 Acres Acres Acres Acres Acres Acres Acres Acres Acres Acres Acres Acres Acres and Over
North Saskatchewan 14,026 304 1,215 1,189 2,237 482 1,810 1,216 1,115 1,303 1,041 786 453 290 585
Beaver County 677 5 51 50 79 20 94 58 59 70 56 40 30 29 36
Brazeau County 487 9 32 37 118 14 92 42 37 49 26 11 9 3 8
Camrose County 999 25 94 71 163 38 122 60 93 99 83 70 34 18 29
Clearwater County 1,096 27 51 71 308 42 164 115 77 92 59 42 18 7 23
Edmonton 73 23 19 14 3 1 6 2 1 1 0 2 1 0 0
Flagstaff County 650 13 31 15 60 9 62 43 52 88 78 71 39 31 58
Lamont County 753 12 47 92 115 35 121 71 59 79 48 30 11 12 21
Leduc County 1,255 34 136 186 227 52 191 138 102 78 48 33 12 12 6
Minburn County No. 27 604 7 30 34 63 21 71 67 54 65 61 39 33 18 41
Parkland County 782 30 133 100 147 32 91 59 46 55 44 19 11 4 11
Provost No. 52 425 3 11 8 26 9 36 32 21 45 43 62 41 27 61
Smoky Lake County 454 4 20 25 66 15 64 55 38 54 31 26 13 13 30
St. Paul County No. 19 788 9 17 53 97 24 122 92 76 97 81 43 18 14 45
Strathcona County 658 34 210 105 91 41 66 30 22 21 13 12 2 1 10
Sturgeon County 823 30 118 129 118 37 96 70 54 51 44 32 15 9 20
Thorhild County No. 7 462 2 19 28 95 9 66 50 39 63 43 20 7 9 12
Two Hills County No. 21 554 3 36 34 92 13 57 46 61 65 60 43 18 7 19
Vermilion River County 1,029 7 45 36 130 24 108 77 86 89 117 102 87 48 73
Wainwright No. 61 501 7 27 20 44 11 53 25 30 57 45 58 38 24 62
Wetaskiwin County No. 10 956 20 88 81 195 35 128 84 108 85 61 31 16 4 20
Red Deer 8,645 189 677 528 1,395 244 1,013 703 639 750 651 601 317 212 726
Kneehill County 686 15 68 30 83 27 70 45 50 63 62 75 23 30 45
Lacombe County 1,045 39 111 84 191 28 151 100 87 93 57 45 25 11 23
Mountain View County 1,636 44 158 167 396 57 210 136 113 120 106 69 25 11 24
Paintearth County No. 18 420 5 8 8 38 8 46 19 36 39 45 62 33 21 52
Ponoka County 1,106 22 103 77 196 48 157 135 95 115 83 40 20 3 12
Red Deer County 1,531 49 171 125 297 57 203 130 125 124 92 69 40 14 35
Special Area No. 2 473 2 12 4 31 4 32 21 9 37 35 44 29 27 186
Special Area No. 3 464 3 4 4 21 2 34 21 25 26 45 71 34 29 145
Special Area No. 4 279 2 4 1 20 1 10 8 13 24 18 27 26 22 103
Starland County 300 2 5 4 35 2 17 21 20 34 39 39 28 14 40
Stettler County No. 6 705 6 33 24 87 10 83 67 66 75 69 60 34 30 61
Source: Statistics Canada, 2011 Census of Agriculture. Prepared by Alberta Agriculture and Rural Development, Economics and Competitiveness Division, Statistics and Data Development Branch.
0 - True zero or a value rounded to zero. Refer to census definitions and notes for more information.
8

Table 3.1: Farms Classified by Total Farm Area, 2011
Total # Under 10-69 70-129 130-179 180-239 240-399 400-559 560-759 760-1,119 1,120-1,599 1,600-2,239 2,240-2,879 2,880-3,519 3,520 Acres
of Farms 10 Acres Acres Acres Acres Acres Acres Acres Acres Acres Acres Acres Acres Acres and Over
South Saskatchewan 9,915 281 1,251 769 1,201 306 1,090 647 611 763 657 616 402 292 1,029
Bighorn No. 8 44 2 2 1 10 1 4 3 2 4 1 0 1 1 12
Calgary 55 16 19 3 5 0 5 0 0 0 2 0 1 1 3
Cardston County 497 10 56 39 37 17 56 38 32 43 45 38 20 18 48
Cypress County 827 33 59 48 91 18 71 43 50 60 62 60 49 45 138
Foothills No. 31 1,224 38 304 132 190 55 128 61 64 68 52 37 20 17 58
Forty Mile County No. 8 524 11 12 15 37 7 49 21 29 45 45 40 59 31 123
Lethbridge County 933 47 146 104 134 31 117 76 57 76 45 37 22 12 29
Newell County No. 4 717 15 49 54 66 27 116 80 76 67 36 36 13 13 69
Pincher Creek No. 9 448 10 28 30 60 11 53 28 36 41 34 35 18 14 50
Ranchland No. 66 78 3 7 3 8 0 8 0 3 9 4 4 1 4 24
Rocky View County 1,271 27 267 140 213 50 150 71 50 81 62 54 27 23 56
Taber 652 12 56 55 66 20 74 62 50 69 41 38 30 14 65
Vulcan County 603 11 35 15 50 9 57 34 31 49 63 64 47 28 110
Warner County No. 5 488 9 56 34 26 15 38 38 23 27 35 53 30 22 82
Wheatland County 782 17 102 56 73 24 67 42 55 69 62 73 34 29 79
Willow Creek No. 26 772 20 53 40 135 21 97 50 53 55 68 47 30 20 83
Source: Statistics Canada, 2011 Census of Agriculture. Prepared by Alberta Agriculture and Rural Development, Economics and Competitiveness Division, Statistics and Data Development Branch.
0 - True zero or a value rounded to zero. Refer to census definitions and notes for more information.
9
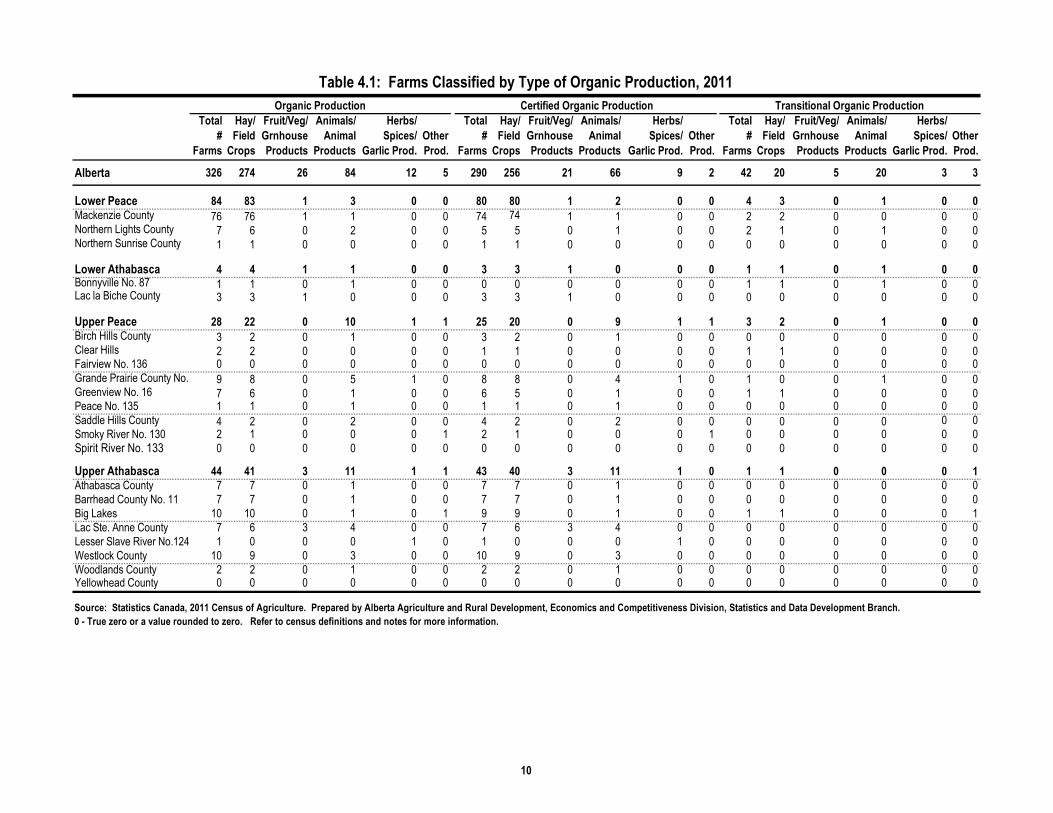
Table 4.1: Farms Classified by Type of Organic Production, 2011
Total
#
Farms
Hay/
Field
Crops
Fruit/Veg/
Grnhouse
Products
Animals/
Animal
Products
Herbs/
Spices/
Garlic Prod.
Other
Prod.
Total
#
Farms
Hay/
Field
Crops
Fruit/Veg/
Grnhouse
Products
Animals/
Animal
Products
Herbs/
Spices/
Garlic Prod.
Other
Prod.
Total
#
Farms
Hay/
Field
Crops
Fruit/Veg/
Grnhouse
Products
Animals/
Animal
Products
Herbs/
Spices/
Garlic Prod.
Other
Prod.
Alberta 326 274 26 84 12 5 290 256 21 66 9 2 42 20 5 20 3 3
Lower Peace 84 83 1 3 0 0 80 80 1 2 0 0 4 3 0 1 0 0
Mackenzie County 76 76 1 1 0 0 74 74 1 1 0 0 2 2 0 0 0 0Northern Lights County 7 6 0 2 0 0 5 5 0 1 0 0 2 1 0 1 0 0Northern Sunrise County 1 1 0 0 0 0 1 1 0 0 0 0 0 0 0 0 0 0
Lower Athabasca 4 4 1 1 0 0 3 3 1 0 0 0 1 1 0 1 0 0Bonnyville No. 87 1 1 0 1 0 0 0 0 0 0 0 0 1 1 0 1 0 0Lac la Biche County 3 3 1 0 0 0 3 3 1 0 0 0 0 0 0 0 0 0
Upper Peace 28 22 0 10 1 1 25 20 0 9 1 1 3 2 0 1 0 0
Birch Hills County 3 2 0 1 0 0 3 2 0 1 0 0 0 0 0 0 0 0Clear Hills 2 2 0 0 0 0 1 1 0 0 0 0 1 1 0 0 0 0Fairview No. 136 0 0 0 0 0 0 0 0 0 0 0 0 0 0 0 0 0 0
Grande Prairie County No. 1 9 8 0 5 1 0 8 8 0 4 1 0 1 0 0 1 0 0Greenview No. 16 7 6 0 1 0 0 6 5 0 1 0 0 1 1 0 0 0 0Peace No. 135 1 1 0 1 0 0 1 1 0 1 0 0 0 0 0 0 0 0
Saddle Hills County 4 2 0 2 0 0 4 2 0 2 0 0 0 0 0 0 0 0
Smoky River No. 130 2 1 0 0 0 1 2 1 0 0 0 1 0 0 0 0 0 0
Spirit River No. 133 0 0 0 0 0 0 0 0 0 0 0 0 0 0 0 0 0 0
Upper Athabasca 44 41 3 11 1 1 43 40 3 11 1 0 1 1 0 0 0 1
Athabasca County 7 7 0 1 0 0 7 7 0 1 0 0 0 0 0 0 0 0
Barrhead County No. 11 7 7 0 1 0 0 7 7 0 1 0 0 0 0 0 0 0 0
Big Lakes 10 10 0 1 0 1 9 9 0 1 0 0 1 1 0 0 0 1
Lac Ste. Anne County 7 6 3 4 0 0 7 6 3 4 0 0 0 0 0 0 0 0
Lesser Slave River No.124 1 0 0 0 1 0 1 0 0 0 1 0 0 0 0 0 0 0
Westlock County 10 9 0 3 0 0 10 9 0 3 0 0 0 0 0 0 0 0
Woodlands County 2 2 0 1 0 0 2 2 0 1 0 0 0 0 0 0 0 0Yellowhead County 0 0 0 0 0 0 0 0 0 0 0 0 0 0 0 0 0 0
Source: Statistics Canada, 2011 Census of Agriculture. Prepared by Alberta Agriculture and Rural Development, Economics and Competitiveness Division, Statistics and Data Development Branch.
0 - True zero or a value rounded to zero. Refer to census definitions and notes for more information.
Organic Production Certified Organic Production Transitional Organic Production
10

Table 4.1: Farms Classified by Type of Organic Production, 2011
Total
#
Farms
Hay/
Field
Crops
Fruit/Veg/
Grnhouse
Products
Animals/
Animal
Products
Herbs/
Spices/
Garlic Prod.
Other
Prod.
Total
#
Farms
Hay/
Field
Crops
Fruit/Veg/
Grnhouse
Products
Animals/
Animal
Products
Herbs/
Spices/
Garlic Prod.
Other
Prod.
Total
#
Farms
Hay/
Field
Crops
Fruit/Veg/
Grnhouse
Products
Animals/
Animal
Products
Herbs/
Spices/
Garlic Prod.
Other
Prod.
North Saskatchewan 54 36 5 20 5 0 45 33 5 13 4 0 12 4 0 8 1 0
Beaver County 2 1 1 1 2 0 1 1 1 0 1 0 2 0 0 1 1 0Brazeau County 1 0 0 1 0 0 1 0 0 1 0 0 0 0 0 0 0 0Camrose County 6 4 0 4 0 0 5 4 0 3 0 0 1 0 0 1 0 0
Clearwater County 1 0 0 1 0 0 1 0 0 1 0 0 0 0 0 0 0 0Edmonton 1 0 0 0 1 0 1 0 0 0 1 0 0 0 0 0 0 0Flagstaff County 1 0 0 1 0 0 1 0 0 1 0 0 0 0 0 0 0 0
Lamont County 5 4 0 3 0 0 4 4 0 2 0 0 1 0 0 1 0 0Leduc County 3 2 1 1 0 0 3 2 1 1 0 0 0 0 0 0 0 0Minburn County No. 27 3 3 0 0 0 0 3 3 0 0 0 0 0 0 0 0 0 0
Parkland County 3 2 1 0 1 0 3 2 1 0 1 0 0 0 0 0 0 0Provost No. 52 0 0 0 0 0 0 0 0 0 0 0 0 0 0 0 0 0 0Smoky Lake County 5 3 0 3 1 0 3 2 0 1 1 0 2 1 0 2 0 0
St. Paul County No. 19 1 1 0 0 0 0 1 1 0 0 0 0 0 0 0 0 0 0Strathcona County 0 0 0 0 0 0 0 0 0 0 0 0 0 0 0 0 0 0Sturgeon County 5 3 1 1 0 0 4 3 1 0 0 0 1 0 0 1 0 0
Thorhild County No. 7 6 4 1 1 0 0 5 4 1 0 0 0 1 0 0 1 0 0Two Hills County No. 21 3 3 0 0 0 0 1 1 0 0 0 0 2 2 0 0 0 0Vermilion River County 3 2 0 2 0 0 3 2 0 2 0 0 1 0 0 1 0 0
Wainwright No. 61 0 0 0 0 0 0 0 0 0 0 0 0 0 0 0 0 0 0Wetaskiwin County No. 10 5 4 0 1 0 0 5 4 0 1 0 0 1 1 0 0 0 0
Red Deer 51 41 6 18 3 1 42 38 4 12 2 0 9 3 2 6 1 1
Kneehill County 3 1 0 2 1 0 2 1 0 1 1 0 1 0 0 1 0 0Lacombe County 5 3 2 4 1 0 3 2 1 2 0 0 2 1 1 2 1 0Mountain View County 4 0 1 2 0 1 1 0 0 1 0 0 3 0 1 1 0 1
Paintearth County No. 18 5 5 1 1 0 0 5 5 1 1 0 0 0 0 0 0 0 0Ponoka County 4 3 1 1 1 0 4 3 1 1 1 0 0 0 0 0 0 0Red Deer County 4 3 1 1 0 0 3 3 1 0 0 0 1 0 0 1 0 0
Special Area No. 2 3 3 0 0 0 0 3 3 0 0 0 0 0 0 0 0 0 0Special Area No. 3 9 9 0 2 0 0 9 9 0 2 0 0 0 0 0 0 0 0Special Area No. 4 7 7 0 4 0 0 6 6 0 3 0 0 1 1 0 1 0 0
Starland County 3 3 0 0 0 0 3 3 0 0 0 0 0 0 0 0 0 0Stettler County No. 6 4 4 0 1 0 0 3 3 0 1 0 0 1 1 0 0 0 0
0 - True zero or a value rounded to zero. Refer to census definitions and notes for more information.
Certified Organic ProductionOrganic Production
Source: Statistics Canada, 2011 Census of Agriculture 2011 Census of Agriculture, Farm and Farm Operator Data, catalogue no. 95-640-XWE. Prepared by Alberta Agriculture and Rural Development, Economics and
Competitiveness Division, Statistics and Data Development Branch.
Transitional Organic Production
11

Table 4.1: Farms Classified by Type of Organic Production, 2011
Total
#
Farms
Hay/
Field
Crops
Fruit/Veg/
Grnhouse
Products
Animals/
Animal
Products
Herbs/
Spices/
Garlic Prod.
Other
Prod.
Total
#
Farms
Hay/
Field
Crops
Fruit/Veg/
Grnhouse
Products
Animals/
Animal
Products
Herbs/
Spices/
Garlic Prod.
Other
Prod.
Total
#
Farms
Hay/
Field
Crops
Fruit/Veg/
Grnhouse
Products
Animals/
Animal
Products
Herbs/
Spices/
Garlic Prod.
Other
Prod.
South Saskatchewan 61 47 10 21 2 2 52 42 7 19 1 1 12 6 3 3 1 1
Bighorn No. 8 0 0 0 0 0 0 0 0 0 0 0 0 0 0 0 0 0 0Calgary 2 2 0 1 0 0 1 1 0 1 0 0 1 1 0 0 0 0Cardston County 1 1 0 0 0 0 1 1 0 0 0 0 0 0 0 0 0 0
Cypress County 9 5 1 6 1 0 8 5 0 5 1 0 2 0 1 1 0 0Foothills No. 31 4 3 1 0 1 1 2 2 0 0 0 0 3 2 1 0 1 1Forty Mile County No. 8 3 3 0 0 0 0 3 3 0 0 0 0 0 0 0 0 0 0
Lethbridge County 5 4 3 1 0 0 3 3 2 1 0 0 2 1 1 0 0 0Newell County No. 4 0 0 0 0 0 0 0 0 0 0 0 0 0 0 0 0 0 0Pincher Creek No. 9 7 5 0 5 0 0 7 5 0 5 0 0 1 0 0 1 0 0
Ranchland No. 66 0 0 0 0 0 0 0 0 0 0 0 0 0 0 0 0 0 0Rocky View County 3 1 0 2 0 0 2 0 0 2 0 0 1 1 0 0 0 0Taber 9 9 3 2 0 0 9 9 3 2 0 0 0 0 0 0 0 0
Vulcan County 2 2 0 1 0 0 2 2 0 1 0 0 0 0 0 0 0 0Warner County No. 5 2 1 0 1 0 0 1 1 0 0 0 0 1 0 0 1 0 0Wheatland County 8 7 1 0 0 1 7 6 1 0 0 1 1 1 0 0 0 0Willow Creek No. 26 6 4 1 2 0 0 6 4 1 2 0 0 0 0 0 0 0 0
Source: Statistics Canada, 2011 Census of Agriculture. Prepared by Alberta Agriculture and Rural Development, Economics and Competitiveness Division, Statistics and Data Development Branch.
0 - True zero or a value rounded to zero. Refer to census definitions and notes for more information.
Organic Production Certified Organic Production Transitional Organic Production
12

Table 5.1: Field Crops Grown, 2011
# Farms Acres # Farms Acres # Farms Acres # Farms Acres # Farms Acres # Farms Acres
Alberta 11,127 6,703,703 10,538 5,971,359 1,121 536,018 535 196,326 7,378 891,580 11,473 3,610,111
Lower Peace 411 203,678 398 199,865 13 X 5 X 309 54,253 187 47,652
Mackenzie County 212 58,127 205 57,031 7 1,096 0 0 187 38,396 82 13,129
Northern Lights County 125 90,798 119 89,511 5 X 1 X 107 13,607 88 27,939
Northern Sunrise County 74 54,753 74 53,323 1 X 4 X 15 2,250 17 6,584
Lower Athabasca 79 25,924 78 X 1 X 2 X 228 28,069 151 31,739
Bonnyville No. 87 60 19,175 60 X 0 0 2 X 160 17,842 126 26,761
Lac la Biche County 19 6,749 18 X 1 X 0 0 68 10,227 25 4,978
Upper Peace 1,036 732,688 996 X 32 X 46 X 908 157,315 620 190,095
Birch Hills County 140 111,723 139 X 1 X 8 X 56 10,731 54 31,167
Clear Hills 66 44,228 63 X 4 1,038 2 X 156 34,905 107 32,646
Fairview No. 136 103 72,895 99 71,306 5 X 3 X 45 8,709 43 10,304
Grande Prairie County No. 1 224 107,074 212 104,474 7 1,351 9 1,249 228 25,751 234 63,127
Greenview No. 16 84 61,159 75 57,183 6 2,802 5 1,174 183 26,683 59 18,101
Peace No. 135 58 37,092 57 X 1 X 0 0 38 4,398 23 4,399
Saddle Hills County 130 89,725 127 85,248 3 960 8 3,517 153 32,767 66 18,170
Smoky River No. 130 205 181,499 200 180,176 5 X 2 X 34 9,387 26 9,539
Spirit River No. 133 26 27,293 24 22,260 0 0 9 5,033 15 3,984 8 2,642
Upper Athabasca 652 229,797 627 X 22 X 13 X 1,199 119,394 1,026 195,371
Athabasca County 105 40,571 102 40,451 1 X 2 X 208 25,432 120 20,262
Barrhead County No. 11 150 47,690 145 46,862 5 491 3 337 147 13,018 215 41,461
Big Lakes 46 24,938 44 X 1 X 1 X 89 11,060 54 10,901
Lac Ste. Anne County 48 13,849 43 13,265 3 320 3 264 253 23,230 180 30,636
Lesser Slave River No.124 16 3,231 16 3,231 0 0 0 0 49 5,112 18 2,779
Westlock County 239 86,344 232 83,743 9 X 2 X 175 17,701 295 65,044
Woodlands County 17 3,315 15 X 2 X 0 0 71 5,105 62 8,498
Yellowhead County 31 9,859 30 8,769 1 X 2 X 207 18,736 82 15,790
Source: Statistics Canada, 2011 Census of Agriculture. Prepared by Alberta Agriculture and Rural Development, Economics and Competitiveness Division, Statistics and Data Development Branch.
X - Confidential. 0 - True zero or a value rounded to zero. Refer to census definitions and notes for more information.
Oats BarleyTotal Wheat Spring Wheat Durum Wheat Winter Wheat
13

Table 5.1: Field Crops Grown, 2011
# Farms Acres # Farms Acres # Farms Acres # Farms Acres # Farms Acres # Farms Acres
North Saskatchewan 3,758 1,842,421 3,645 X 120 X 48 X 2,626 X 3,718 905,209
Beaver County 286 157,863 278 155,599 8 X 1 X 106 14,389 165 36,791
Brazeau County 11 1,245 11 1,245 0 0 0 0 160 16,484 39 4,369
Camrose County 409 189,336 399 183,298 12 4,655 9 1,383 105 8,684 322 82,276
Clearwater County 22 6,924 19 6,101 0 0 4 823 253 17,074 207 29,209
Edmonton 9 3,944 8 X 1 X 0 0 2 X 6 662
Flagstaff County 395 275,221 392 X 3 X 6 X 108 11,590 271 81,926
Lamont County 266 98,972 260 97,422 6 X 2 X 127 14,089 246 58,110
Leduc County 259 74,621 243 72,037 14 1,943 5 641 217 17,982 338 58,694
Minburn County No. 27 288 146,595 283 145,633 5 X 1 X 119 14,495 203 56,768
Parkland County 67 20,976 64 X 3 X 0 0 145 12,106 146 28,335
Provost No. 52 160 100,275 156 96,980 7 2,570 4 725 132 23,306 132 48,908
Smoky Lake County 83 29,269 78 28,884 7 385 0 0 109 13,240 103 22,299
St. Paul County No. 19 117 39,446 114 39,236 3 210 0 0 174 21,780 200 48,671
Strathcona County 82 43,456 77 42,317 4 X 3 X 47 X 76 13,602
Sturgeon County 240 97,666 229 94,465 14 3,022 4 179 115 12,318 192 44,883
Thorhild County No. 7 107 33,815 102 X 4 470 2 X 110 11,280 130 29,643
Two Hills County No. 21 207 108,032 203 107,317 6 X 1 X 114 14,212 185 50,189
Vermilion River County 377 210,801 362 205,819 16 X 2 X 175 23,031 356 99,221
Wainwright No. 61 204 147,456 203 X 2 X 2 X 107 18,288 141 52,567
Wetaskiwin County No. 10 169 56,508 164 54,913 5 X 2 X 201 13,744 260 58,086
Red Deer 2,164 1,243,929 2,072 1,144,886 164 X 69 X 1,371 167,453 3,006 948,567
Kneehill County 357 216,522 352 212,140 13 X 1 X 57 7,049 315 131,926
Lacombe County 202 74,864 194 72,911 7 1,249 6 704 96 8,625 395 111,902
Mountain View County 196 68,096 188 66,069 8 1,269 7 758 226 15,691 562 160,852
Paintearth County No. 18 136 97,291 134 92,711 3 1,210 6 3,370 154 28,986 124 43,339
Ponoka County 127 36,116 119 34,671 7 1,105 4 340 196 14,315 385 81,853
Red Deer County 294 92,761 285 90,214 10 881 8 1,666 169 11,484 573 163,446
Special Area No. 2 114 81,391 105 64,626 20 13,873 9 2,892 114 21,663 91 37,815
Special Area No. 3 265 214,275 234 156,380 79 54,979 10 2,916 85 18,285 113 45,941
Special Area No. 4 124 98,006 120 95,493 7 2,002 4 511 105 20,736 90 34,874
Starland County 166 149,241 165 147,156 2 X 9 X 38 3,906 140 58,694
Stettler County No. 6 183 115,366 176 112,515 8 1,717 5 1,134 131 16,713 218 77,925
Source: Statistics Canada, 2011 Census of Agriculture. Prepared by Alberta Agriculture and Rural Development, Economics and Competitiveness Division, Statistics and Data Development Branch.
X - Confidential. 0 - True zero or a value rounded to zero. Refer to census definitions and notes for more information.
Oats BarleyTotal Wheat Spring Wheat Durum Wheat Winter Wheat
14
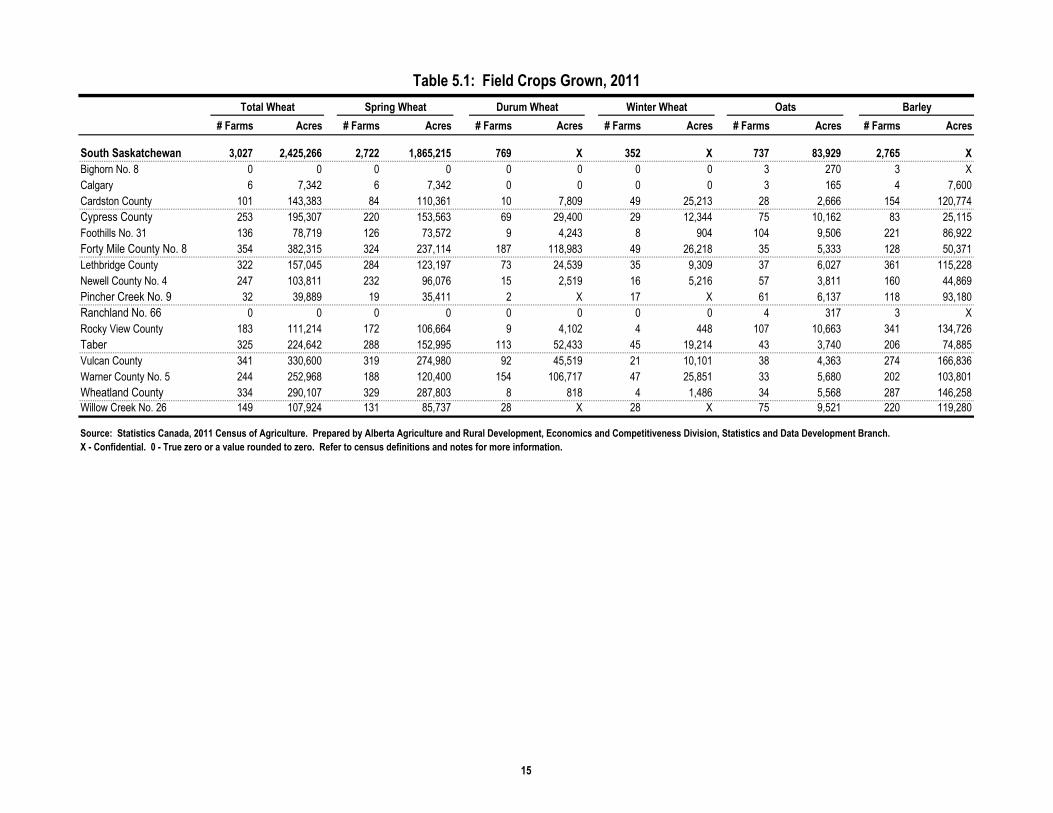
Table 5.1: Field Crops Grown, 2011
# Farms Acres # Farms Acres # Farms Acres # Farms Acres # Farms Acres # Farms Acres
South Saskatchewan 3,027 2,425,266 2,722 1,865,215 769 X 352 X 737 83,929 2,765 X
Bighorn No. 8 0 0 0 0 0 0 0 0 3 270 3 X
Calgary 6 7,342 6 7,342 0 0 0 0 3 165 4 7,600
Cardston County 101 143,383 84 110,361 10 7,809 49 25,213 28 2,666 154 120,774
Cypress County 253 195,307 220 153,563 69 29,400 29 12,344 75 10,162 83 25,115
Foothills No. 31 136 78,719 126 73,572 9 4,243 8 904 104 9,506 221 86,922
Forty Mile County No. 8 354 382,315 324 237,114 187 118,983 49 26,218 35 5,333 128 50,371
Lethbridge County 322 157,045 284 123,197 73 24,539 35 9,309 37 6,027 361 115,228
Newell County No. 4 247 103,811 232 96,076 15 2,519 16 5,216 57 3,811 160 44,869
Pincher Creek No. 9 32 39,889 19 35,411 2 X 17 X 61 6,137 118 93,180
Ranchland No. 66 0 0 0 0 0 0 0 0 4 317 3 X
Rocky View County 183 111,214 172 106,664 9 4,102 4 448 107 10,663 341 134,726
Taber 325 224,642 288 152,995 113 52,433 45 19,214 43 3,740 206 74,885
Vulcan County 341 330,600 319 274,980 92 45,519 21 10,101 38 4,363 274 166,836
Warner County No. 5 244 252,968 188 120,400 154 106,717 47 25,851 33 5,680 202 103,801
Wheatland County 334 290,107 329 287,803 8 818 4 1,486 34 5,568 287 146,258
Willow Creek No. 26 149 107,924 131 85,737 28 X 28 X 75 9,521 220 119,280
Source: Statistics Canada, 2011 Census of Agriculture. Prepared by Alberta Agriculture and Rural Development, Economics and Competitiveness Division, Statistics and Data Development Branch.
X - Confidential. 0 - True zero or a value rounded to zero. Refer to census definitions and notes for more information.
Total Wheat Spring Wheat Durum Wheat Winter Wheat Oats Barley
15

Table 5.2: Field Crops Grown, 2011
# Farms Acres # Farms Acres # Farms Acres # Farms Acres # Farms Acres # Farms Acres
Alberta 1,289 201,511 92 17,148 4 349 416 59,935 371 50,616 48 9,319
Lower Peace 7 X 1 X 0 0 7 X 5 X 2 X
Mackenzie County 3 X 0 0 0 0 1 X 0 0 1 X
Northern Lights County 2 X 1 X 0 0 5 1,124 4 X 1 X
Northern Sunrise County 2 X 0 0 0 0 1 X 1 X 0 0
Lower Athabasca 33 3,431 1 X 0 0 7 X 7 X 0 0
Bonnyville No. 87 26 2,594 1 X 0 0 5 305 5 305 0 0
Lac la Biche County 7 837 0 0 0 0 2 X 2 X 0 0
Upper Peace 37 X 3 0 1 0 17 X 17 X 0 0
Birch Hills County 1 X 0 0 0 0 1 X 1 X 0 0
Clear Hills 11 2,198 0 0 0 0 0 0 0 0 0 0
Fairview No. 136 1 X 0 0 0 0 0 0 0 0 0 0
Grande Prairie County No. 1 11 5,303 1 X 0 0 8 X 8 X 0 0
Greenview No. 16 6 1,273 1 X 0 0 4 419 4 419 0 0
Peace No. 135 2 X 0 0 0 0 0 0 0 0 0 0
Saddle Hills County 3 1,540 1 X 1 X 4 1,293 4 1,293 0 0
Smoky River No. 130 2 X 0 0 0 0 0 0 0 0 0 0
Spirit River No. 133 0 0 0 0 0 0 0 0 0 0 0 0
Upper Athabasca 137 18,257 4 X 0 0 32 X 30 X 2 X
Athabasca County 13 1,595 0 0 0 0 9 460 8 X 1 X
Barrhead County No. 11 21 2,019 0 0 0 0 3 X 3 X 0 0
Big Lakes 6 468 1 X 0 0 2 X 2 X 0 0
Lac Ste. Anne County 40 5,734 2 X 0 0 7 296 7 296 0 0
Lesser Slave River No.124 3 805 0 0 0 0 0 0 0 0 0 0
Westlock County 19 1,979 0 0 0 0 6 320 5 X 1 X
Woodlands County 14 1,487 1 X 0 0 1 X 1 X 0 0
Yellowhead County 21 4,170 0 0 0 0 4 185 4 185 0 0
Source: Statistics Canada, 2011 Census of Agriculture. Prepared by Alberta Agriculture and Rural Development, Economics and Competitiveness Division, Statistics and Data Development Branch.
X - Confidential. 0 - True zero or a value rounded to zero. Refer to census definitions and notes for more information.
Buckwheat Total Rye Fall Rye Spring RyeMixed Grains Corn for Grain
16

Table 5.2: Field Crops Grown, 2011
# Farms Acres # Farms Acres # Farms Acres # Farms Acres # Farms Acres # Farms Acres
North Saskatchewan 450 69,371 19 X 1 X 102 X 81 X 22 X
Beaver County 17 1,572 1 X 0 0 3 595 3 595 0 0
Brazeau County 6 438 0 0 0 0 0 0 0 0 0 0
Camrose County 35 5,755 0 0 0 0 9 733 7 X 2 X
Clearwater County 45 3,647 0 0 0 0 6 126 3 71 3 55
Edmonton 0 0 0 0 0 0 0 0 0 0 0 0
Flagstaff County 24 5,254 0 0 0 0 4 576 4 576 0 0
Lamont County 14 2,109 0 0 0 0 8 487 8 487 0 0
Leduc County 23 2,616 0 0 0 0 2 X 2 X 0 0
Minburn County No. 27 23 3,085 1 X 0 0 4 159 2 X 2 X
Parkland County 18 1,317 3 X 0 0 5 X 4 163 1 X
Provost No. 52 26 5,729 1 X 0 0 29 3,973 20 X 9 X
Smoky Lake County 13 2,193 0 0 0 0 1 X 0 0 1 X
St. Paul County No. 19 31 4,759 1 X 0 0 1 X 1 X 0 0
Strathcona County 7 1,147 0 0 0 0 0 0 0 0 0 0
Sturgeon County 12 2,244 0 0 0 0 0 0 0 0 0 0
Thorhild County No. 7 9 1,233 0 0 0 0 4 X 4 X 0 0
Two Hills County No. 21 14 919 1 X 0 0 5 1,029 4 X 1 X
Vermilion River County 58 12,051 7 X 0 0 6 223 5 X 1 X
Wainwright No. 61 27 7,891 3 X 1 X 9 1,787 8 X 2 X
Wetaskiwin County No. 10 48 5,412 1 X 0 0 6 340 6 340 0 0
Red Deer 456 64,764 11 X 0 0 127 X 115 X 14 X
Kneehill County 29 3,382 2 X 0 0 10 1,710 9 X 1 X
Lacombe County 39 4,924 2 X 0 0 11 705 11 705 0 0
Mountain View County 78 7,442 1 X 0 0 13 762 10 702 3 60
Paintearth County No. 18 34 6,364 2 X 0 0 14 1,600 13 X 1 X
Ponoka County 71 9,323 1 X 0 0 14 1,499 13 X 1 X
Red Deer County 99 12,193 0 0 0 0 7 355 6 X 1 X
Special Area No. 2 11 1,810 1 X 0 0 27 5,645 24 5,289 4 356
Special Area No. 3 12 2,408 0 0 0 0 13 1,896 12 X 1 X
Special Area No. 4 27 7,604 0 0 0 0 12 2,318 11 X 2 X
Starland County 9 1,326 2 X 0 0 2 X 2 X 0 0
Stettler County No. 6 47 7,988 0 0 0 0 4 365 4 365 0 0
Source: Statistics Canada, 2011 Census of Agriculture. Prepared by Alberta Agriculture and Rural Development, Economics and Competitiveness Division, Statistics and Data Development Branch.
X - Confidential. 0 - True zero or a value rounded to zero. Refer to census definitions and notes for more information.
Mixed Grains Corn for Grain Buckwheat Total Rye Fall Rye Spring Rye
17

Table 5.2: Field Crops Grown, 2011
# Farms Acres # Farms Acres # Farms Acres # Farms Acres # Farms Acres # Farms Acres
South Saskatchewan 169 X 53 X 2 X 124 X 116 X 8 X
Bighorn No. 8 0 0 0 0 0 0 0 0 0 0 0 0
Calgary 0 0 0 0 0 0 0 0 0 0 0 0
Cardston County 14 1,558 0 0 0 0 4 X 3 X 1 X
Cypress County 17 2,255 3 X 0 0 28 8,893 27 X 1 X
Foothills No. 31 20 3,213 0 0 0 0 10 1,328 10 1,328 0 0
Forty Mile County No. 8 7 1,245 2 X 1 X 9 1,693 8 X 1 X
Lethbridge County 6 X 8 961 0 0 12 1,830 12 1,830 0 0
Newell County No. 4 8 1,253 6 450 0 0 7 2,632 7 2,632 0 0
Pincher Creek No. 9 9 X 0 0 0 0 2 X 2 X 0 0
Ranchland No. 66 1 X 0 0 0 0 0 0 0 0 0 0
Rocky View County 52 11,157 2 X 0 0 18 4,257 16 X 2 X
Taber 11 5,723 32 8,868 1 X 5 1,524 4 X 1 X
Vulcan County 6 666 0 0 0 0 18 2,777 17 X 1 X
Warner County No. 5 1 X 0 0 0 0 0 0 0 0 0 0
Wheatland County 4 243 0 0 0 0 4 X 3 138 1 X
Willow Creek No. 26 13 4,824 0 0 0 0 7 935 7 935 0 0
Source: Statistics Canada, 2011 Census of Agriculture. Prepared by Alberta Agriculture and Rural Development, Economics and Competitiveness Division, Statistics and Data Development Branch.
X - Confidential. 0 - True zero or a value rounded to zero. Refer to census definitions and notes for more information.
Fall Rye Spring RyeMixed Grains Corn for Grain Buckwheat Total Rye
18

Table 5.3: Field Crops Grown, 2011
# Farms Acres # Farms Acres # Farms Acres # Farms Acres # Farms Acres # Farms Acres
Alberta 629 95,861 20,141 3,657,114 9,394 1,466,557 11,889 6,071,744 332 69,743 30 3,693
Lower Peace 9 X 523 125,062 256 54,312 537 312,859 6 X 0 0
Mackenzie County 4 65 225 38,410 99 12,582 319 141,523 5 X 0 0
Northern Lights County 5 X 225 65,903 122 32,133 138 109,714 0 0 0 0
Northern Sunrise County 0 0 73 20,749 35 9,597 80 61,622 1 X 0 0
Lower Athabasca 7 X 627 148,622 198 36,674 162 57,540 0 0 0 0
Bonnyville No. 87 5 331 467 108,934 148 28,213 119 42,233 0 0 0 0
Lac la Biche County 2 X 160 39,688 50 8,461 43 15,307 0 0 0 0
Upper Peace 18 X 1,710 392,322 928 203,206 1,084 869,661 14 X 0 0
Birch Hills County 2 X 133 34,733 38 10,963 146 148,882 3 845 0 0
Clear Hills 1 X 198 49,776 160 34,108 94 60,658 0 0 0 0
Fairview No. 136 1 X 76 16,698 47 6,745 99 84,072 1 X 0 0
Grande Prairie County No. 1 4 X 613 141,396 264 45,891 268 131,961 0 0 0 0
Greenview No. 16 3 75 324 68,187 206 47,543 78 58,023 3 74 0 0
Peace No. 135 4 390 77 14,591 35 6,763 56 37,768 0 0 0 0
Saddle Hills County 1 X 218 53,546 142 44,064 103 83,799 3 X 0 0
Smoky River No. 130 2 X 48 8,767 24 5,399 212 242,057 4 1,070 0 0
Spirit River No. 133 0 0 23 4,628 12 1,730 28 22,441 0 0 0 0
Upper Athabasca 53 X 2,367 412,766 1,383 212,913 1,001 403,644 4 X 1 X
Athabasca County 4 148 424 79,118 201 29,216 165 75,721 1 X 0 0
Barrhead County No. 11 22 2,788 330 48,967 162 18,593 239 88,349 0 0 1 X
Big Lakes 0 0 169 38,681 142 41,559 76 43,606 0 0 0 0
Lac Ste. Anne County 9 700 570 107,610 207 31,231 95 33,114 1 X 0 0
Lesser Slave River No.124 0 0 77 13,906 67 11,972 17 4,337 0 0 0 0
Westlock County 10 940 367 56,184 208 23,484 330 133,101 1 X 0 0
Woodlands County 1 X 157 25,283 95 12,854 25 8,818 0 0 0 0
Yellowhead County 7 1,588 273 43,017 301 44,004 54 16,598 1 X 0 0
Source: Statistics Canada, 2011 Census of Agriculture. Prepared by Alberta Agriculture and Rural Development, Economics and Competitiveness Division, Statistics and Data Development Branch.
X - Confidential. 0 - True zero or a value rounded to zero. Refer to census definitions and notes for more information.
Flaxseed SoybeansCorn for Silage Alfalfa and Alfalfa Mixtures All Other Tame Hay and Fodder Canola
19
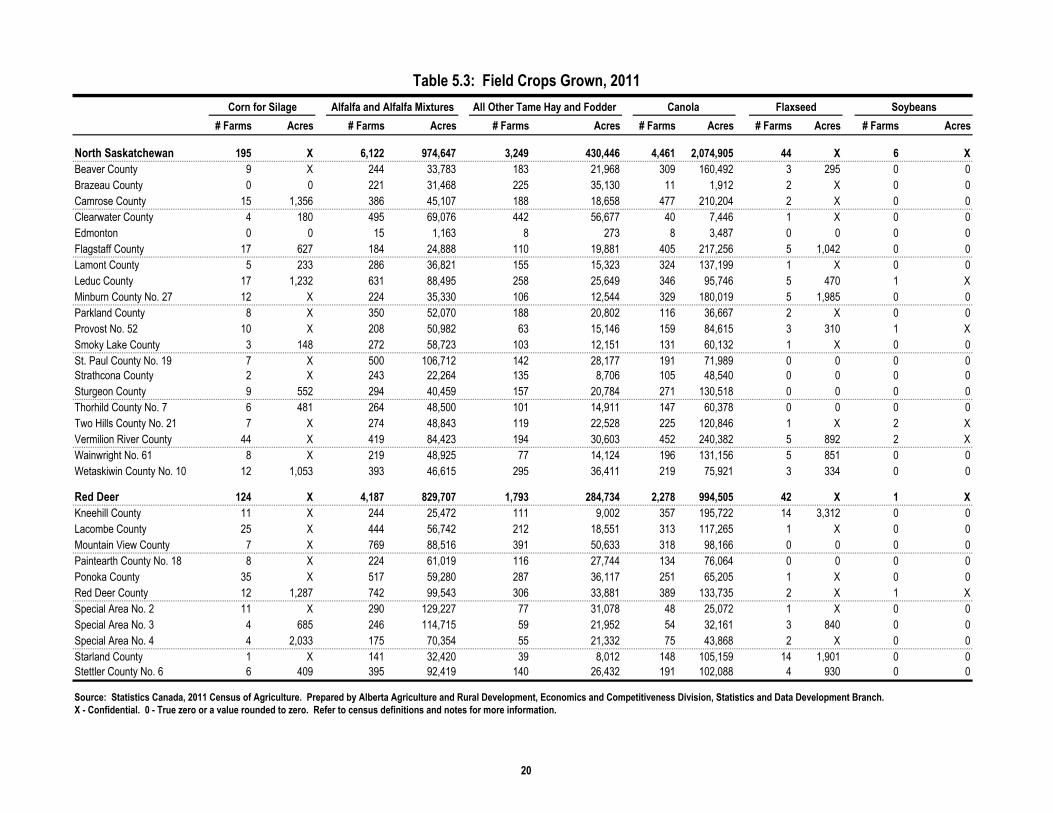
Table 5.3: Field Crops Grown, 2011
# Farms Acres # Farms Acres # Farms Acres # Farms Acres # Farms Acres # Farms Acres
North Saskatchewan 195 X 6,122 974,647 3,249 430,446 4,461 2,074,905 44 X 6 X
Beaver County 9 X 244 33,783 183 21,968 309 160,492 3 295 0 0
Brazeau County 0 0 221 31,468 225 35,130 11 1,912 2 X 0 0
Camrose County 15 1,356 386 45,107 188 18,658 477 210,204 2 X 0 0
Clearwater County 4 180 495 69,076 442 56,677 40 7,446 1 X 0 0
Edmonton 0 0 15 1,163 8 273 8 3,487 0 0 0 0
Flagstaff County 17 627 184 24,888 110 19,881 405 217,256 5 1,042 0 0
Lamont County 5 233 286 36,821 155 15,323 324 137,199 1 X 0 0
Leduc County 17 1,232 631 88,495 258 25,649 346 95,746 5 470 1 X
Minburn County No. 27 12 X 224 35,330 106 12,544 329 180,019 5 1,985 0 0
Parkland County 8 X 350 52,070 188 20,802 116 36,667 2 X 0 0
Provost No. 52 10 X 208 50,982 63 15,146 159 84,615 3 310 1 X
Smoky Lake County 3 148 272 58,723 103 12,151 131 60,132 1 X 0 0
St. Paul County No. 19 7 X 500 106,712 142 28,177 191 71,989 0 0 0 0
Strathcona County 2 X 243 22,264 135 8,706 105 48,540 0 0 0 0
Sturgeon County 9 552 294 40,459 157 20,784 271 130,518 0 0 0 0
Thorhild County No. 7 6 481 264 48,500 101 14,911 147 60,378 0 0 0 0
Two Hills County No. 21 7 X 274 48,843 119 22,528 225 120,846 1 X 2 X
Vermilion River County 44 X 419 84,423 194 30,603 452 240,382 5 892 2 X
Wainwright No. 61 8 X 219 48,925 77 14,124 196 131,156 5 851 0 0
Wetaskiwin County No. 10 12 1,053 393 46,615 295 36,411 219 75,921 3 334 0 0
Red Deer 124 X 4,187 829,707 1,793 284,734 2,278 994,505 42 X 1 X
Kneehill County 11 X 244 25,472 111 9,002 357 195,722 14 3,312 0 0
Lacombe County 25 X 444 56,742 212 18,551 313 117,265 1 X 0 0
Mountain View County 7 X 769 88,516 391 50,633 318 98,166 0 0 0 0
Paintearth County No. 18 8 X 224 61,019 116 27,744 134 76,064 0 0 0 0
Ponoka County 35 X 517 59,280 287 36,117 251 65,205 1 X 0 0
Red Deer County 12 1,287 742 99,543 306 33,881 389 133,735 2 X 1 X
Special Area No. 2 11 X 290 129,227 77 31,078 48 25,072 1 X 0 0
Special Area No. 3 4 685 246 114,715 59 21,952 54 32,161 3 840 0 0
Special Area No. 4 4 2,033 175 70,354 55 21,332 75 43,868 2 X 0 0
Starland County 1 X 141 32,420 39 8,012 148 105,159 14 1,901 0 0
Stettler County No. 6 6 409 395 92,419 140 26,432 191 102,088 4 930 0 0
Source: Statistics Canada, 2011 Census of Agriculture. Prepared by Alberta Agriculture and Rural Development, Economics and Competitiveness Division, Statistics and Data Development Branch.
X - Confidential. 0 - True zero or a value rounded to zero. Refer to census definitions and notes for more information.
All Other Tame Hay and Fodder Canola Flaxseed SoybeansCorn for Silage Alfalfa and Alfalfa Mixtures
20
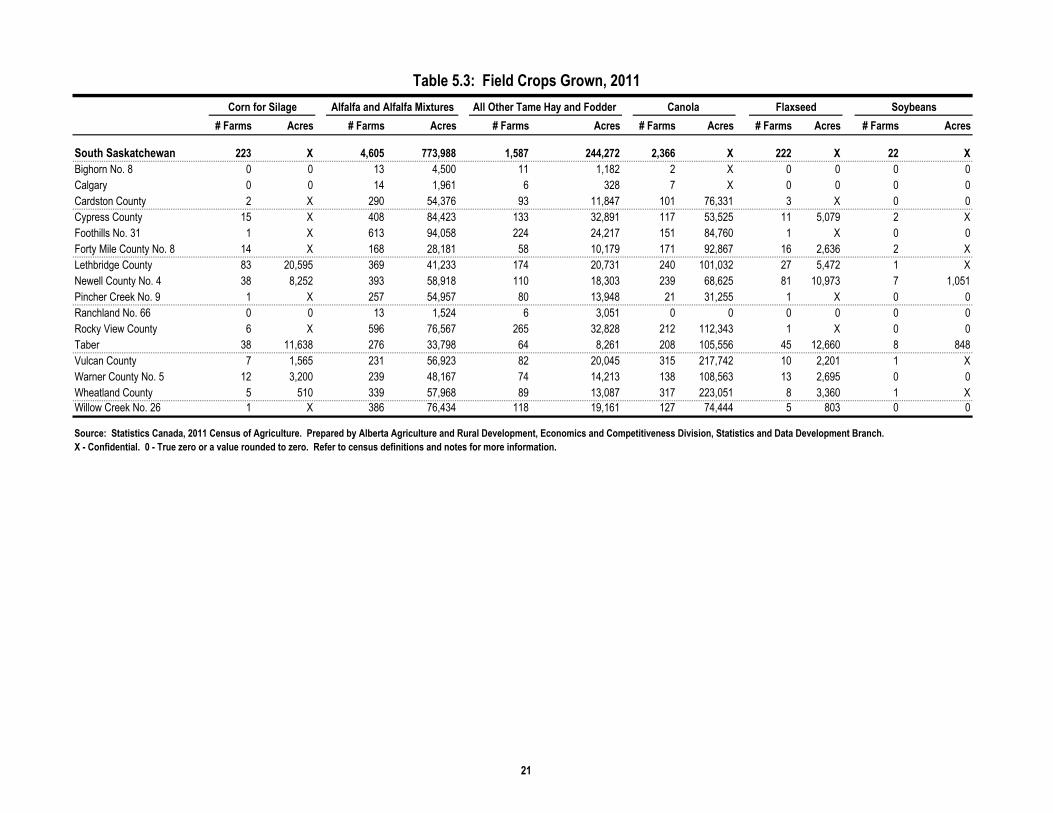
Table 5.3: Field Crops Grown, 2011
# Farms Acres # Farms Acres # Farms Acres # Farms Acres # Farms Acres # Farms Acres
South Saskatchewan 223 X 4,605 773,988 1,587 244,272 2,366 X 222 X 22 X
Bighorn No. 8 0 0 13 4,500 11 1,182 2 X 0 0 0 0
Calgary 0 0 14 1,961 6 328 7 X 0 0 0 0
Cardston County 2 X 290 54,376 93 11,847 101 76,331 3 X 0 0
Cypress County 15 X 408 84,423 133 32,891 117 53,525 11 5,079 2 X
Foothills No. 31 1 X 613 94,058 224 24,217 151 84,760 1 X 0 0
Forty Mile County No. 8 14 X 168 28,181 58 10,179 171 92,867 16 2,636 2 X
Lethbridge County 83 20,595 369 41,233 174 20,731 240 101,032 27 5,472 1 X
Newell County No. 4 38 8,252 393 58,918 110 18,303 239 68,625 81 10,973 7 1,051
Pincher Creek No. 9 1 X 257 54,957 80 13,948 21 31,255 1 X 0 0
Ranchland No. 66 0 0 13 1,524 6 3,051 0 0 0 0 0 0
Rocky View County 6 X 596 76,567 265 32,828 212 112,343 1 X 0 0
Taber 38 11,638 276 33,798 64 8,261 208 105,556 45 12,660 8 848
Vulcan County 7 1,565 231 56,923 82 20,045 315 217,742 10 2,201 1 X
Warner County No. 5 12 3,200 239 48,167 74 14,213 138 108,563 13 2,695 0 0
Wheatland County 5 510 339 57,968 89 13,087 317 223,051 8 3,360 1 X
Willow Creek No. 26 1 X 386 76,434 118 19,161 127 74,444 5 803 0 0
Source: Statistics Canada, 2011 Census of Agriculture. Prepared by Alberta Agriculture and Rural Development, Economics and Competitiveness Division, Statistics and Data Development Branch.
X - Confidential. 0 - True zero or a value rounded to zero. Refer to census definitions and notes for more information.
Flaxseed SoybeansCorn for Silage Alfalfa and Alfalfa Mixtures All Other Tame Hay and Fodder Canola
21

Table 5.4: Field Crops Grown, 2011
# Farms Acres # Farms Acres # Farms Acres # Farms Acres # Farms Acres # Farms Acres
Alberta 183 62,958 39 6,035 398 53,440 2,063 706,726 187 97,775 57 10,627
Lower Peace 0 0 0 0 8 X 122 32,890 1 X 0 0
Mackenzie County 0 0 0 0 4 X 74 17,234 0 0 0 0
Northern Lights County 0 0 0 0 3 10 31 6,923 1 X 0 0
Northern Sunrise County 0 0 0 0 1 X 17 8,733 0 0 0 0
Lower Athabasca 0 0 0 0 7 14 13 3,412 1 X 0 0
Bonnyville No. 87 0 0 0 0 3 6 13 3,412 1 X 0 0
Lac la Biche County 0 0 0 0 4 8 0 0 0 0 0 0
Upper Peace 0 0 1 X 23 X 299 112,797 6 X 5 X
Birch Hills County 0 0 0 0 3 X 30 11,673 1 X 0 0
Clear Hills 0 0 0 0 2 X 44 17,679 0 0 2 X
Fairview No. 136 0 0 1 X 2 X 22 9,490 1 X 0 0
Grande Prairie County No. 1 0 0 0 0 5 12 56 16,148 1 X 1 X
Greenview No. 16 0 0 0 0 5 11 21 7,221 2 X 0 0
Peace No. 135 0 0 0 0 3 6 32 10,326 0 0 0 0
Saddle Hills County 0 0 0 0 2 X 40 13,935 0 0 1 X
Smoky River No. 130 0 0 0 0 0 0 47 21,647 0 0 1 X
Spirit River No. 133 0 0 0 0 1 X 7 4,678 1 X 0 0
Upper Athabasca 0 0 2 X 28 X 93 X 4 X 0 0
Athabasca County 0 0 1 X 4 4 9 826 1 X 0 0
Barrhead County No. 11 0 0 0 0 2 X 25 4,353 2 X 0 0
Big Lakes 0 0 0 0 3 X 23 X 0 0 0 0
Lac Ste. Anne County 0 0 1 X 5 10 4 945 1 X 0 0
Lesser Slave River No.124 0 0 0 0 0 0 1 X 0 0 0 0
Westlock County 0 0 0 0 7 99 24 5,695 0 0 0 0
Woodlands County 0 0 0 0 2 X 3 270 0 0 0 0
Yellowhead County 0 0 0 0 5 X 4 575 0 0 0 0
Source: Statistics Canada, 2011 Census of Agriculture. Prepared by Alberta Agriculture and Rural Development, Economics and Competitiveness Division, Statistics and Data Development Branch.
X - Confidential. 0 - True zero or a value rounded to zero. Refer to census definitions and notes for more information.
Dry White BeansPotatoes Dry Field Peas LentilsMustard Seed Sunflowers
22

Table 5.4: Field Crops Grown, 2011
# Farms Acres # Farms Acres # Farms Acres # Farms Acres # Farms Acres # Farms Acres
North Saskatchewan 3 X 4 X 123 X 583 X 17 X 4 X
Beaver County 0 0 0 0 6 65 38 12,154 0 0 0 0
Brazeau County 0 0 0 0 2 X 1 X 0 0 0 0
Camrose County 1 X 0 0 10 31 61 17,581 0 0 0 0
Clearwater County 0 0 1 X 3 4 9 1,361 0 0 0 0
Edmonton 0 0 0 0 6 57 1 X 0 0 0 0
Flagstaff County 0 0 0 0 5 12 79 24,971 4 X 1 X
Lamont County 0 0 0 0 2 X 29 7,870 0 0 0 0
Leduc County 0 0 0 0 14 357 26 4,247 0 0 0 0
Minburn County No. 27 1 X 0 0 5 27 46 12,760 0 0 0 0
Parkland County 0 0 1 X 20 2,642 8 X 1 X 0 0
Provost No. 52 1 X 0 0 0 0 21 7,838 1 X 1 X
Smoky Lake County 0 0 0 0 4 17 11 6,406 0 0 0 0
St. Paul County No. 19 0 0 0 0 0 0 18 5,839 2 X 0 0
Strathcona County 0 0 0 0 5 X 18 4,357 1 X 0 0
Sturgeon County 0 0 0 0 18 1,294 41 8,400 2 X 1 X
Thorhild County No. 7 0 0 0 0 3 13 12 1,660 0 0 0 0
Two Hills County No. 21 0 0 0 0 6 X 17 3,989 0 0 1 X
Vermilion River County 0 0 0 0 3 X 88 20,473 4 158 0 0
Wainwright No. 61 0 0 0 0 2 X 32 6,583 0 0 0 0
Wetaskiwin County No. 10 0 0 2 X 9 692 27 5,855 2 X 0 0
Red Deer 50 X 1 X 54 X 354 102,468 29 X 1 X
Kneehill County 0 0 0 0 3 21 79 19,768 0 0 0 0
Lacombe County 0 0 0 0 19 2,067 22 4,407 1 X 0 0
Mountain View County 1 X 0 0 9 56 31 6,733 1 X 0 0
Paintearth County No. 18 1 X 1 X 2 X 21 5,500 0 0 0 0
Ponoka County 0 0 0 0 4 568 12 2,516 1 X 0 0
Red Deer County 1 X 0 0 6 36 41 7,293 2 X 1 X
Special Area No. 2 6 X 0 0 1 X 12 3,562 4 X 0 0
Special Area No. 3 34 12,540 0 0 2 X 23 14,523 18 8,430 0 0
Special Area No. 4 2 X 0 0 2 X 30 12,312 1 X 0 0
Starland County 5 830 0 0 4 11 47 16,975 1 X 0 0
Stettler County No. 6 0 0 0 0 2 X 36 8,879 0 0 0 0
Source: Statistics Canada, 2011 Census of Agriculture. Prepared by Alberta Agriculture and Rural Development, Economics and Competitiveness Division, Statistics and Data Development Branch.
X - Confidential. 0 - True zero or a value rounded to zero. Refer to census definitions and notes for more information.
Dry White BeansPotatoes Dry Field Peas LentilsMustard Seed Sunflowers
23

Table 5.4: Field Crops Grown, 2011
# Farms Acres # Farms Acres # Farms Acres # Farms Acres # Farms Acres # Farms Acres
South Saskatchewan 130 X 31 X 155 X 599 283,537 129 X 47 X
Bighorn No. 8 0 0 0 0 0 0 0 0 0 0 0 0
Calgary 0 0 0 0 3 6 0 0 0 0 0 0
Cardston County 1 X 0 0 10 X 9 4,128 0 0 0 0
Cypress County 11 3,600 1 X 5 274 53 24,829 14 5,715 1 X
Foothills No. 31 0 0 0 0 5 6 20 5,467 1 X 0 0
Forty Mile County No. 8 18 6,987 0 0 17 3,107 118 61,517 44 32,257 12 X
Lethbridge County 12 X 0 0 7 1,366 44 16,045 11 3,263 4 202
Newell County No. 4 2 X 18 2,141 11 1,107 22 10,715 6 3,566 4 694
Pincher Creek No. 9 1 X 0 0 3 X 3 1,008 1 X 0 0
Ranchland No. 66 0 0 0 0 0 0 0 0 0 0 0 0
Rocky View County 0 0 0 0 9 572 15 3,244 1 X 0 0
Taber 12 3,550 12 2,788 61 36,705 41 21,194 14 13,050 24 4,680
Vulcan County 15 4,580 0 0 5 185 132 66,161 8 X 0 0
Warner County No. 5 39 12,230 0 0 7 21 54 30,430 23 16,794 0 0
Wheatland County 7 2,693 0 0 9 107 52 19,441 3 X 1 X
Willow Creek No. 26 12 X 0 0 3 34 36 19,358 3 X 1 X
Source: Statistics Canada, 2011 Census of Agriculture. Prepared by Alberta Agriculture and Rural Development, Economics and Competitiveness Division, Statistics and Data Development Branch.
X - Confidential. 0 - True zero or a value rounded to zero. Refer to census definitions and notes for more information.
Dry White BeansDry Field Peas LentilsMustard Seed Sunflowers Potatoes
24

Table 5.5: Field Crops Grown, 2011
# Farms Acres # Farms Acres # Farms Acres # Farms Acres # Farms Acres # Farms Acres
Alberta 45 12,538 195 34,646 29 6,997 173 33,314 0 0 3 305
Lower Peace 1 X 1 X 0 0 0 0 0 0 0 0
Mackenzie County 1 X 0 0 0 0 0 0 0 0 0 0
Northern Lights County 0 0 1 X 0 0 0 0 0 0 0 0
Northern Sunrise County 0 0 0 0 0 0 0 0 0 0 0 0
Lower Athabasca 0 0 1 X 0 0 0 0 0 0 0 0
Bonnyville No. 87 0 0 1 X 0 0 0 0 0 0 0 0
Lac la Biche County 0 0 0 0 0 0 0 0 0 0 0 0
Upper Peace 2 X 0 0 1 X 0 0 0 0 1 X
Birch Hills County 0 0 0 0 0 0 0 0 0 0 0 0
Clear Hills 0 0 0 0 0 0 0 0 0 0 0 0
Fairview No. 136 1 X 0 0 1 X 0 0 0 0 0 0
Grande Prairie County No. 1 0 0 0 0 0 0 0 0 0 0 0 0
Greenview No. 16 1 X 0 0 0 0 0 0 0 0 1 X
Peace No. 135 0 0 0 0 0 0 0 0 0 0 0 0
Saddle Hills County 0 0 0 0 0 0 0 0 0 0 0 0
Smoky River No. 130 0 0 0 0 0 0 0 0 0 0 0 0
Spirit River No. 133 0 0 0 0 0 0 0 0 0 0 0 0
Upper Athabasca 2 X 8 X 0 0 0 0 0 0 0 0
Athabasca County 2 X 1 X 0 0 0 0 0 0 0 0
Barrhead County No. 11 0 0 0 0 0 0 0 0 0 0 0 0
Big Lakes 0 0 1 X 0 0 0 0 0 0 0 0
Lac Ste. Anne County 0 0 2 X 0 0 0 0 0 0 0 0
Lesser Slave River No.124 0 0 0 0 0 0 0 0 0 0 0 0
Westlock County 0 0 3 355 0 0 0 0 0 0 0 0
Woodlands County 0 0 1 X 0 0 0 0 0 0 0 0
Yellowhead County 0 0 0 0 0 0 0 0 0 0 0 0
Source: Statistics Canada, 2011 Census of Agriculture. Prepared by Alberta Agriculture and Rural Development, Economics and Competitiveness Division, Statistics and Data Development Branch.
X - Confidential. 0 - True zero or a value rounded to zero. Refer to census definitions and notes for more information.
Caraway SeedGinsengSugar Beets for SugarChick Peas Other Dry Beans Canary Seed
25

Table 5.5: Field Crops Grown, 2011
# Farms Acres # Farms Acres # Farms Acres # Farms Acres # Farms Acres # Farms Acres
North Saskatchewan 3 X 16 X 4 X 0 0 0 0 1 0
Beaver County 0 0 0 0 1 X 0 0 0 0 0 0
Brazeau County 0 0 0 0 0 0 0 0 0 0 0 0
Camrose County 0 0 3 X 0 0 0 0 0 0 0 0
Clearwater County 0 0 2 X 0 0 0 0 0 0 0 0
Edmonton 0 0 0 0 0 0 0 0 0 0 0 0
Flagstaff County 0 0 1 X 0 0 0 0 0 0 0 0
Lamont County 0 0 1 X 0 0 0 0 0 0 0 0
Leduc County 1 X 2 X 0 0 0 0 0 0 1 X
Minburn County No. 27 0 0 0 0 0 0 0 0 0 0 0 0
Parkland County 0 0 0 0 0 0 0 0 0 0 0 0
Provost No. 52 0 0 1 X 3 X 0 0 0 0 0 0
Smoky Lake County 0 0 0 0 0 0 0 0 0 0 0 0
St. Paul County No. 19 0 0 1 X 0 0 0 0 0 0 0 0
Strathcona County 0 0 0 0 0 0 0 0 0 0 0 0
Sturgeon County 0 0 3 X 0 0 0 0 0 0 0 0
Thorhild County No. 7 0 0 0 0 0 0 0 0 0 0 0 0
Two Hills County No. 21 1 X 0 0 0 0 0 0 0 0 0 0
Vermilion River County 1 X 1 X 0 0 0 0 0 0 0 0
Wainwright No. 61 0 0 0 0 0 0 0 0 0 0 0 0
Wetaskiwin County No. 10 0 0 1 X 0 0 0 0 0 0 0 0
Red Deer 8 X 8 X 19 X 0 0 0 0 0 0
Kneehill County 0 0 1 X 1 X 0 0 0 0 0 0
Lacombe County 0 0 1 X 0 0 0 0 0 0 0 0
Mountain View County 1 X 2 X 0 0 0 0 0 0 0 0
Paintearth County No. 18 0 0 1 X 0 0 0 0 0 0 0 0
Ponoka County 0 0 0 0 0 0 0 0 0 0 0 0
Red Deer County 2 X 1 X 0 0 0 0 0 0 0 0
Special Area No. 2 2 X 0 0 0 0 0 0 0 0 0 0
Special Area No. 3 2 X 1 X 15 4,702 0 0 0 0 0 0
Special Area No. 4 1 X 1 X 0 0 0 0 0 0 0 0
Starland County 0 0 0 0 2 X 0 0 0 0 0 0Stettler County No. 6 0 0 0 0 1 X 0 0 0 0 0 0
Source: Statistics Canada, 2011 Census of Agriculture. Prepared by Alberta Agriculture and Rural Development, Economics and Competitiveness Division, Statistics and Data Development Branch.
X - Confidential. 0 - True zero or a value rounded to zero. Refer to census definitions and notes for more information.
Caraway SeedGinsengSugar Beets for SugarCanary SeedChick Peas Other Dry Beans
26

Table 5.5: Field Crops Grown, 2011
# Farms Acres # Farms Acres # Farms Acres # Farms Acres # Farms Acres # Farms Acres
South Saskatchewan 29 X 161 X 5 X 173 X 0 0 1 X
Bighorn No. 8 0 0 0 0 0 0 0 0 0 0 0 0
Calgary 0 0 0 0 0 0 0 0 0 0 0 0
Cardston County 1 X 0 0 0 0 0 0 0 0 0 0
Cypress County 1 X 3 1,325 3 530 2 X 0 0 0 0
Foothills No. 31 2 X 0 0 2 X 0 0 0 0 0 0
Forty Mile County No. 8 10 X 50 11,026 0 0 21 X 0 0 0 0
Lethbridge County 2 X 13 2,159 0 0 37 6,079 0 0 0 0
Newell County No. 4 3 X 12 X 0 0 8 X 0 0 0 0
Pincher Creek No. 9 0 0 0 0 0 0 0 0 0 0 0 0
Ranchland No. 66 0 0 0 0 0 0 0 0 0 0 0 0
Rocky View County 1 X 1 X 0 0 0 0 0 0 0 0
Taber 4 2,125 70 13,654 0 0 101 19,195 0 0 1 X
Vulcan County 2 X 6 X 0 0 2 X 0 0 0 0
Warner County No. 5 3 1,475 3 X 0 0 1 X 0 0 0 0
Wheatland County 0 0 1 X 0 0 1 X 0 0 0 0
Willow Creek No. 26 0 0 2 X 0 0 0 0 0 0 0 0
Source: Statistics Canada, 2011 Census of Agriculture. Prepared by Alberta Agriculture and Rural Development, Economics and Competitiveness Division, Statistics and Data Development Branch.
X - Confidential. 0 - True zero or a value rounded to zero. Refer to census definitions and notes for more information.
Caraway SeedOther Dry Beans Canary Seed Sugar Beets for Sugar GinsengChick Peas
27

Table 5.6: Field Crops Grown, 2011
# Farms Acres # Farms Acres # Farms Acres
Alberta 312 40,762 609 131,933 77 21,994
Lower Peace 0 X 42 X 4 X
Mackenzie County 0 0 12 X 2 X
Northern Lights County 0 0 14 2,794 2 X
Northern Sunrise County 0 0 16 3,921 0 0
Lower Athabasca 1 0 9 835 0 0
Bonnyville No. 87 0 0 6 835 0 0
Lac la Biche County 1 X 3 X 0 0
Upper Peace 8 X 261 73,936 1 X
Birch Hills County 0 0 13 1,817 0 0
Clear Hills 0 0 34 8,240 0 0
Fairview No. 136 0 0 16 3,737 0 0
Grande Prairie County No. 1 0 0 82 19,932 1 X
Greenview No. 16 5 342 24 13,933 0 0
Peace No. 135 0 0 7 1,355 0 0
Saddle Hills County 2 X 52 16,646 0 0
Smoky River No. 130 0 0 30 7,988 0 0
Spirit River No. 133 1 X 3 288 0 0
Upper Athabasca 4 299 46 X 9 X
Athabasca County 0 0 13 1,806 3 X
Barrhead County No. 11 0 0 1 X 1 X
Big Lakes 0 0 8 1,990 0 0
Lac Ste. Anne County 4 299 7 X 2 X
Lesser Slave River No.124 0 0 2 X 1 X
Westlock County 0 0 9 1,183 1 X
Woodlands County 0 0 2 X 1 X
Yellowhead County 0 0 4 361 0 0
Source: Statistics Canada, 2011 Census of Agriculture. Prepared by Alberta Agriculture and Rural Development, Economics and Competitiveness Division, Statistics and Data Development Branch.
X - Confidential. 0 - True zero or a value rounded to zero. Refer to census definitions and notes for more information.
All Other Field CropsTriticale Forage Seed for Seed
28

Table 5.6: Field Crops Grown, 2011
# Farms Acres # Farms Acres # Farms Acres
North Saskatchewan 55 X 52 X 22 X
Beaver County 2 X 1 X 0 0
Brazeau County 1 X 3 121 0 0
Camrose County 2 X 6 810 1 X
Clearwater County 3 115 7 1,273 0 0
Edmonton 0 0 0 0 1 X
Flagstaff County 1 X 1 X 0 0
Lamont County 5 208 4 92 0 0
Leduc County 6 489 3 440 6 635
Minburn County No. 27 3 727 3 X 0 0
Parkland County 4 X 0 0 2 X
Provost No. 52 4 X 1 X 2 X
Smoky Lake County 0 0 4 430 1 X
St. Paul County No. 19 0 0 3 X 2 X
Strathcona County 1 X 1 X 1 X
Sturgeon County 1 X 2 X 1 X
Thorhild County No. 7 2 X 0 0 0 0
Two Hills County No. 21 2 X 3 540 3 X
Vermilion River County 2 X 5 670 0 0
Wainwright No. 61 8 1,150 2 X 1 X
Wetaskiwin County No. 10 8 691 3 X 1 X
Red Deer 95 X 34 X 13 X
Kneehill County 3 X 3 390 0 0
Lacombe County 16 1,596 4 322 1 X
Mountain View County 4 190 5 313 2 X
Paintearth County No. 18 6 696 1 X 5 465
Ponoka County 1 X 10 815 0 0
Red Deer County 6 X 6 335 0 0
Special Area No. 2 27 4,058 1 X 1 X
Special Area No. 3 12 1,725 0 0 1 X
Special Area No. 4 7 1,277 3 787 0 0
Starland County 7 775 0 0 2 X
Stettler County No. 6 6 601 1 X 1 X
Source: Statistics Canada, 2011 Census of Agriculture. Prepared by Alberta Agriculture and Rural Development, Economics and Competitiveness Division, Statistics and Data Development Branch.
X - Confidential. 0 - True zero or a value rounded to zero. Refer to census definitions and notes for more information.
Forage Seed for Seed All Other Field CropsTriticale
29

Table 5.6: Field Crops Grown, 2011
# Farms Acres # Farms Acres # Farms Acres
South Saskatchewan 149 X 165 X 28 X
Bighorn No. 8 0 0 0 0 0 0
Calgary 0 0 0 0 0 0
Cardston County 6 740 2 X 0 0
Cypress County 45 5,695 2 X 1 X
Foothills No. 31 7 1,309 0 0 0 0
Forty Mile County No. 8 16 2,236 0 0 8 8,294
Lethbridge County 14 4,716 14 4,373 1 X
Newell County No. 4 13 2,220 101 15,741 5 X
Pincher Creek No. 9 3 X 2 X 1 X
Ranchland No. 66 1 X 0 0 0 0
Rocky View County 15 2,406 3 1,214 1 X
Taber 7 843 16 3,774 4 4,850
Vulcan County 8 1,725 7 1,321 3 X
Warner County No. 5 5 414 10 2,215 3 835
Wheatland County 2 X 5 825 1 X
Willow Creek No. 26 7 538 3 620 0 0
Source: Statistics Canada, 2011 Census of Agriculture. Prepared by Alberta Agriculture and Rural Development, Economics and Competitiveness Division, Statistics and Data Development Branch.
X - Confidential. 0 - True zero or a value rounded to zero. Refer to census definitions and notes for more information.
All Other Field CropsTriticale Forage Seed for Seed
30

Table 6.1: Fruits, Berries and Nuts Grown for Sale, 2011
# Farms Acres # Farms Acres # Farms Acres # Farms Acres # Farms Acres
Alberta 532 2,610 373 1,622 146 234 198 186 57 80
Lower Peace 18 45 10 X 8 X 3 1 0 0
Mackenzie County 10 9 4 6 7 3 3 1 0 0
Northern Lights County 4 17 3 X 1 X 0 0 0 0
Northern Sunrise County 4 19 3 X 0 0 0 0 0 0
Lower Athabasca 14 X 8 X 4 X 7 X 1 X
Bonnyville No. 87 12 40 7 5 3 7 5 5 1 X
Lac la Biche County 2 X 1 X 1 X 2 X 0 0
Upper Peace 31 X 25 X 5 X 6 X 2 X
Birch Hills County 1 X 1 X 0 0 1 X 0 0
Clear Hills 2 X 2 X 1 X 0 0 0 0
Fairview No. 136 2 X 1 X 1 X 1 X 0 0
Grande Prairie County No. 1 7 54 6 46 0 0 0 0 1 X
Greenview No. 16 7 51 6 38 1 X 2 X 1 X
Peace No. 135 4 X 2 X 1 X 1 X 0 0
Saddle Hills County 3 5 3 5 0 0 0 0 0 0
Smoky River No. 130 5 49 4 X 1 X 1 X 0 0
Spirit River No. 133 0 0 0 0 0 0 0 0 0 0
Upper Athabasca 60 X 43 X 20 X 26 X 7 X
Athabasca County 14 49 10 18 7 9 9 15 2 X
Barrhead County No. 11 9 39 7 9 3 13 1 X 1 X
Big Lakes 1 X 1 X 0 0 0 0 0 0
Lac Ste. Anne County 13 43 12 22 4 3 8 9 3 7
Lesser Slave River No.124 0 0 0 0 0 0 0 0 0 0
Westlock County 6 15 4 X 4 X 2 X 0 0
Woodlands County 6 11 3 7 1 X 1 X 0 0
Yellowhead County 11 20 6 17 1 X 5 2 1 X
Source: Statistics Canada, 2011 Census of Agriculture. Prepared by Alberta Agriculture and Rural Development, Economics and Competitiveness Division, Statistics and Data Development Branch.
X - Confidential. 0 - True zero or a value rounded to zero. Refer to census definitions and notes for more information.
StrawberriesSaskatoonsTotal Fruits, Berries & Nuts ApplesRaspberries
31

Table 6.1: Fruits, Berries and Nuts Grown for Sale, 2011
# Farms Acres # Farms Acres # Farms Acres # Farms Acres # Farms Acres
North Saskatchewan 187 X 135 X 54 X 85 X 28 X
Beaver County 7 25 7 X 0 0 2 X 0 0
Brazeau County 5 X 4 X 1 X 3 X 3 2
Camrose County 11 39 8 31 2 X 5 3 3 1
Clearwater County 7 32 4 18 2 X 1 X 2 X
Edmonton 3 X 2 X 2 X 3 X 1 X
Flagstaff County 5 61 3 33 1 X 1 X 0 0
Lamont County 9 55 7 47 3 3 3 1 2 X
Leduc County 28 163 18 128 8 16 11 9 1 X
Minburn County No. 27 5 24 4 15 3 5 4 4 0 0
Parkland County 19 104 16 55 7 12 14 30 4 X
Provost No. 52 3 X 3 X 1 X 1 X 0 0
Smoky Lake County 7 25 6 X 1 X 2 X 0 0
St. Paul County No. 19 4 X 2 X 1 X 2 X 1 X
Strathcona County 16 57 11 37 3 X 7 5 4 5
Sturgeon County 25 191 17 133 10 18 12 8 2 X
Thorhild County No. 7 4 3 3 X 1 X 1 X 0 0
Two Hills County No. 21 5 30 5 17 1 X 3 X 2 X
Vermilion River County 6 17 4 X 1 X 2 X 1 X
Wainwright No. 61 2 X 2 X 1 X 1 X 0 0
Wetaskiwin County No. 10 16 48 9 23 5 8 7 3 2 X
Red Deer 100 X 70 X 18 X 36 X 8 X
Kneehill County 5 12 4 8 1 X 3 X 0 0
Lacombe County 17 88 10 26 3 8 7 X 2 X
Mountain View County 18 109 16 90 3 X 7 6 1 X
Paintearth County No. 18 6 16 4 11 0 0 2 X 0 0
Ponoka County 9 134 7 126 2 X 2 X 0 0
Red Deer County 31 227 18 46 8 7 13 9 4 X
Special Area No. 2 3 X 3 X 0 0 0 0 0 0
Special Area No. 3 2 X 2 X 0 0 0 0 0 0
Special Area No. 4 0 0 0 0 0 0 0 0 0 0
Starland County 2 X 0 0 0 0 1 X 0 0
Stettler County No. 6 7 14 6 X 1 X 1 X 1 X
Source: Statistics Canada, 2011 Census of Agriculture. Prepared by Alberta Agriculture and Rural Development, Economics and Competitiveness Division, Statistics and Data Development Branch.
X - Confidential. 0 - True zero or a value rounded to zero. Refer to census definitions and notes for more information.
Saskatoons StrawberriesTotal Fruits, Berries & Nuts ApplesRaspberries
32

Table 6.1: Fruits, Berries and Nuts Grown for Sale, 2011
# Farms Acres # Farms Acres # Farms Acres # Farms Acres # Farms Acres
South Saskatchewan 122 X 82 X 37 X 35 X 11 X
Bighorn No. 8 0 0 0 0 0 0 0 0 0 0
Calgary 3 12 0 0 0 0 1 X 2 X
Cardston County 5 28 5 17 3 X 2 X 0 0
Cypress County 14 52 10 X 3 X 4 2 3 1
Foothills No. 31 20 167 16 125 3 X 3 X 0 0
Forty Mile County No. 8 5 10 1 X 2 X 2 X 0 0
Lethbridge County 14 64 5 31 6 9 4 X 2 X
Newell County No. 4 9 17 5 9 5 5 5 2 0 0
Pincher Creek No. 9 4 20 4 X 1 X 1 X 1 X
Ranchland No. 66 1 X 0 0 0 0 0 0 1 X
Rocky View County 12 48 12 40 1 X 2 X 1 X
Taber 7 13 5 X 2 X 2 X 1 X
Vulcan County 5 X 3 7 2 X 1 X 0 0
Warner County No. 5 7 16 4 X 3 X 4 3 0 0
Wheatland County 12 83 8 57 5 4 3 X 0 0
Willow Creek No. 26 4 X 4 X 1 X 1 X 0 0
Source: Statistics Canada, 2011 Census of Agriculture. Prepared by Alberta Agriculture and Rural Development, Economics and Competitiveness Division, Statistics and Data Development Branch.
X - Confidential. 0 - True zero or a value rounded to zero. Refer to census definitions and notes for more information.
Total Fruits, Berries & Nuts ApplesSaskatoons Strawberries Raspberries
33

Table 6.2: Fruits, Berries and Nuts Grown for Sale, 2011
# Farms Acres # Farms Acres # Farms Acres # Farms Acres # Farms Acres
Alberta 80 99 19 6 8 19 9 21 7 3
Lower Peace 1 X 0 0 0 0 0 0 0 0
Mackenzie County 0 0 0 0 0 0 0 0 0 0
Northern Lights County 0 0 0 0 0 0 0 0 0 0
Northern Sunrise County 1 X 0 0 0 0 0 0 0 0
Lower Athabasca 3 X 0 0 1 X 2 X 1 X
Bonnyville No. 87 2 X 0 0 1 X 2 X 1 X
Lac la Biche County 1 X 0 0 0 0 0 0 0 0
Upper Peace 4 X 0 0 0 0 0 0 1 X
Birch Hills County 0 0 0 0 0 0 0 0 0 0
Clear Hills 0 0 0 0 0 0 0 0 0 0
Fairview No. 136 0 0 0 0 0 0 0 0 0 0
Grande Prairie County No. 1 2 X 0 0 0 0 0 0 0 0
Greenview No. 16 0 0 0 0 0 0 0 0 1 X
Peace No. 135 1 X 0 0 0 0 0 0 0 0
Saddle Hills County 0 0 0 0 0 0 0 0 0 0
Smoky River No. 130 1 X 0 0 0 0 0 0 0 0
Spirit River No. 133 0 0 0 0 0 0 0 0 0 0
Upper Athabasca 4 X 1 X 1 X 1 X 0 0
Athabasca County 1 X 0 0 0 0 0 0 0 0
Barrhead County No. 11 2 X 0 0 1 X 0 0 0 0
Big Lakes 0 0 0 0 0 0 0 0 0 0
Lac Ste. Anne County 1 X 1 X 0 0 1 X 0 0
Lesser Slave River No.124 0 0 0 0 0 0 0 0 0 0
Westlock County 0 0 0 0 0 0 0 0 0 0
Woodlands County 0 0 0 0 0 0 0 0 0 0
Yellowhead County 0 0 0 0 0 0 0 0 0 0
Source: Statistics Canada, 2011 Census of Agriculture. Prepared by Alberta Agriculture and Rural Development, Economics and Competitiveness Division, Statistics and Data Development Branch.
X - Confidential. 0 - True zero or a value rounded to zero. Refer to census definitions and notes for more information.
Cherries (sour) BlueberriesCherries (sweet) Cranberries Plums and Prunes
34

Table 6.2: Fruits, Berries and Nuts Grown for Sale, 2011
# Farms Acres # Farms Acres # Farms Acres # Farms Acres # Farms Acres
North Saskatchewan 23 X 10 X 5 X 4 X 4 X
Beaver County 0 0 0 0 0 0 0 0 0 0
Brazeau County 1 X 0 0 0 0 0 0 0 0
Camrose County 2 X 2 X 0 0 1 X 0 0
Clearwater County 0 0 1 X 1 X 1 X 0 0
Edmonton 1 X 1 X 1 X 0 0 0 0
Flagstaff County 0 0 0 0 0 0 0 0 0 0
Lamont County 1 X 0 0 1 X 0 0 0 0
Leduc County 4 X 1 X 0 0 1 X 1 X
Minburn County No. 27 0 0 0 0 0 0 0 0 0 0
Parkland County 4 3 1 X 0 0 1 X 0 0
Provost No. 52 0 0 0 0 0 0 0 0 0 0
Smoky Lake County 1 X 0 0 0 0 0 0 0 0
St. Paul County No. 19 2 X 1 X 0 0 0 0 1 X
Strathcona County 2 X 2 X 0 0 0 0 1 X
Sturgeon County 0 0 1 X 1 X 0 0 0 0
Thorhild County No. 7 0 0 0 0 0 0 0 0 0 0
Two Hills County No. 21 2 X 0 0 0 0 0 0 0 0
Vermilion River County 0 0 0 0 0 0 0 0 0 0
Wainwright No. 61 1 X 0 0 0 0 0 0 0 0
Wetaskiwin County No. 10 2 X 0 0 1 X 0 0 1 X
Red Deer 26 X 5 X 0 0 2 X 1 X
Kneehill County 1 X 1 X 0 0 0 0 0 0
Lacombe County 5 4 0 0 0 0 0 0 1 X
Mountain View County 6 8 0 0 0 0 0 0 0 0
Paintearth County No. 18 1 X 0 0 0 0 0 0 0 0
Ponoka County 0 0 1 X 0 0 0 0 0 0
Red Deer County 11 18 3 X 0 0 2 X 0 0
Special Area No. 2 0 0 0 0 0 0 0 0 0 0
Special Area No. 3 0 0 0 0 0 0 0 0 0 0
Special Area No. 4 0 0 0 0 0 0 0 0 0 0
Starland County 1 X 0 0 0 0 0 0 0 0
Stettler County No. 6 1 X 0 0 0 0 0 0 0 0
Source: Statistics Canada, 2011 Census of Agriculture. Prepared by Alberta Agriculture and Rural Development, Economics and Competitiveness Division, Statistics and Data Development Branch.
X - Confidential. 0 - True zero or a value rounded to zero. Refer to census definitions and notes for more information.
Cherries (sour) BlueberriesCherries (sweet) Plums and PrunesCranberries
35

Table 6.2: Fruits, Berries and Nuts Grown for Sale, 2011
# Farms Acres # Farms Acres # Farms Acres # Farms Acres # Farms Acres
South Saskatchewan 19 X 3 X 1 X 0 0 0 0
Bighorn No. 8 0 0 0 0 0 0 0 0 0 0
Calgary 0 0 0 0 0 0 0 0 0 0
Cardston County 1 X 0 0 0 0 0 0 0 0
Cypress County 4 5 0 0 0 0 0 0 0 0
Foothills No. 31 1 X 1 X 0 0 0 0 0 0
Forty Mile County No. 8 0 0 0 0 0 0 0 0 0 0
Lethbridge County 3 X 0 0 0 0 0 0 0 0
Newell County No. 4 3 1 0 0 0 0 0 0 0 0
Pincher Creek No. 9 0 0 1 X 0 0 0 0 0 0
Ranchland No. 66 1 X 0 0 0 0 0 0 0 0
Rocky View County 1 X 0 0 0 0 0 0 0 0
Taber 1 X 0 0 0 0 0 0 0 0
Vulcan County 0 0 0 0 0 0 0 0 0 0
Warner County No. 5 1 X 0 0 0 0 0 0 0 0
Wheatland County 3 X 1 X 0 0 0 0 0 0
Willow Creek No. 26 0 0 0 0 1 X 0 0 0 0
Source: Statistics Canada, 2011 Census of Agriculture. Prepared by Alberta Agriculture and Rural Development, Economics and Competitiveness Division, Statistics and Data Development Branch.
X - Confidential. 0 - True zero or a value rounded to zero. Refer to census definitions and notes for more information.
Cherries (sour) Cherries (sweet) Blueberries Plums and PrunesCranberries
36

Table 6.3: Fruits, Berries and Nuts Grown for Sale, 2011
# Farms Acres # Farms Acres # Farms Acres # Farms Acres # Farms Acres
Alberta 6 2 0 0 0 0 9 2 92 337
Lower Peace 0 0 0 0 0 0 0 0 2 X
Mackenzie County 0 0 0 0 0 0 0 0 0 0
Northern Lights County 0 0 0 0 0 0 0 0 1 X
Northern Sunrise County 0 0 0 0 0 0 0 0 1 X
Lower Athabasca 1 X 0 0 0 0 1 X 2 X
Bonnyville No. 87 1 X 0 0 0 0 1 X 2 X
Lac la Biche County 0 0 0 0 0 0 0 0 0 0
Upper Peace 0 0 0 0 0 0 0 0 3 X
Birch Hills County 0 0 0 0 0 0 0 0 0 0
Clear Hills 0 0 0 0 0 0 0 0 0 0
Fairview No. 136 0 0 0 0 0 0 0 0 1 X
Grande Prairie County No. 1 0 0 0 0 0 0 0 0 0 0
Greenview No. 16 0 0 0 0 0 0 0 0 1 X
Peace No. 135 0 0 0 0 0 0 0 0 1 X
Saddle Hills County 0 0 0 0 0 0 0 0 0 0
Smoky River No. 130 0 0 0 0 0 0 0 0 0 0
Spirit River No. 133 0 0 0 0 0 0 0 0 0 0
Upper Athabasca 0 0 0 0 0 0 2 X 9 X
Athabasca County 0 0 0 0 0 0 1 X 3 4
Barrhead County No. 11 0 0 0 0 0 0 0 0 2 X
Big Lakes 0 0 0 0 0 0 0 0 0 0
Lac Ste. Anne County 0 0 0 0 0 0 1 X 1 X
Lesser Slave River No.124 0 0 0 0 0 0 0 0 0 0
Westlock County 0 0 0 0 0 0 0 0 0 0
Woodlands County 0 0 0 0 0 0 0 0 2 X
Yellowhead County 0 0 0 0 0 0 0 0 1 X
Source: Statistics Canada, 2011 Census of Agriculture. Prepared by Alberta Agriculture and Rural Development, Economics and Competitiveness Division, Statistics and Data Development Branch.
X - Confidential. 0 - True zero or a value rounded to zero. Refer to census definitions and notes for more information.
Other Fruits, Berries and NutsPeachesPears Apricots Grapes
37
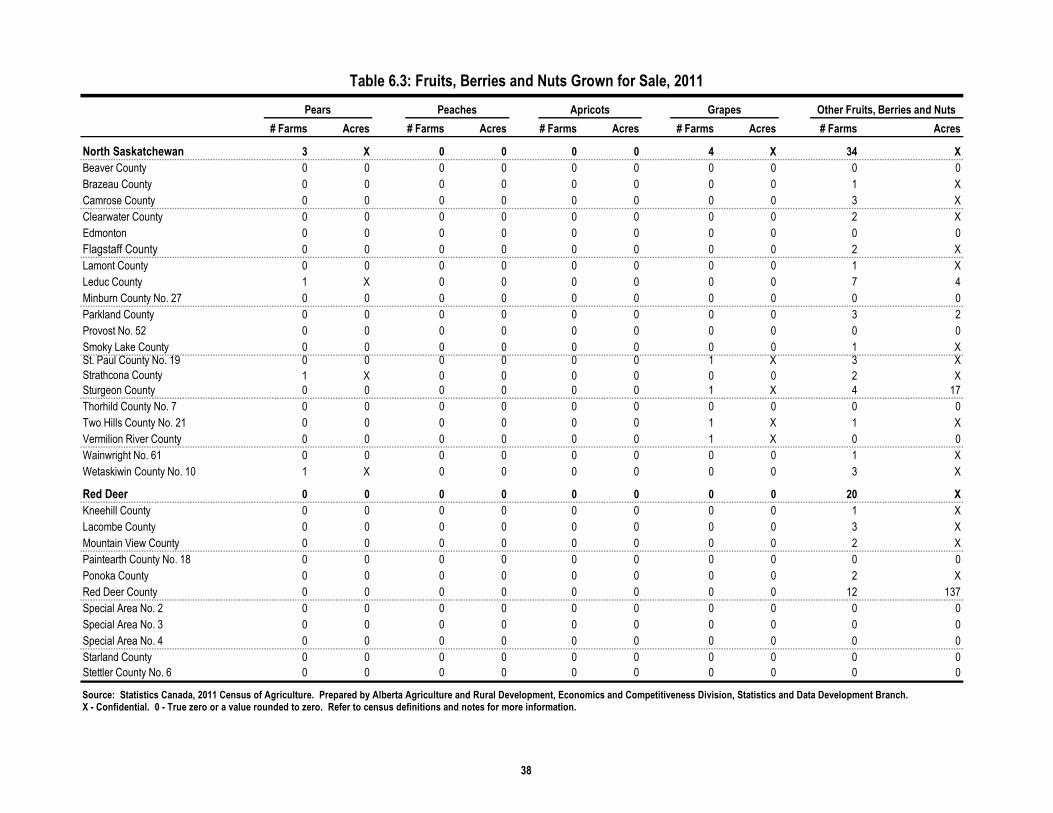
Table 6.3: Fruits, Berries and Nuts Grown for Sale, 2011
# Farms Acres # Farms Acres # Farms Acres # Farms Acres # Farms Acres
North Saskatchewan 3 X 0 0 0 0 4 X 34 X
Beaver County 0 0 0 0 0 0 0 0 0 0
Brazeau County 0 0 0 0 0 0 0 0 1 X
Camrose County 0 0 0 0 0 0 0 0 3 X
Clearwater County 0 0 0 0 0 0 0 0 2 X
Edmonton 0 0 0 0 0 0 0 0 0 0
Flagstaff County 0 0 0 0 0 0 0 0 2 X
Lamont County 0 0 0 0 0 0 0 0 1 X
Leduc County 1 X 0 0 0 0 0 0 7 4
Minburn County No. 27 0 0 0 0 0 0 0 0 0 0
Parkland County 0 0 0 0 0 0 0 0 3 2
Provost No. 52 0 0 0 0 0 0 0 0 0 0
Smoky Lake County 0 0 0 0 0 0 0 0 1 XSt. Paul County No. 19 0 0 0 0 0 0 1 X 3 X
Strathcona County 1 X 0 0 0 0 0 0 2 X
Sturgeon County 0 0 0 0 0 0 1 X 4 17
Thorhild County No. 7 0 0 0 0 0 0 0 0 0 0
Two Hills County No. 21 0 0 0 0 0 0 1 X 1 X
Vermilion River County 0 0 0 0 0 0 1 X 0 0
Wainwright No. 61 0 0 0 0 0 0 0 0 1 X
Wetaskiwin County No. 10 1 X 0 0 0 0 0 0 3 X
Red Deer 0 0 0 0 0 0 0 0 20 X
Kneehill County 0 0 0 0 0 0 0 0 1 X
Lacombe County 0 0 0 0 0 0 0 0 3 X
Mountain View County 0 0 0 0 0 0 0 0 2 X
Paintearth County No. 18 0 0 0 0 0 0 0 0 0 0
Ponoka County 0 0 0 0 0 0 0 0 2 X
Red Deer County 0 0 0 0 0 0 0 0 12 137
Special Area No. 2 0 0 0 0 0 0 0 0 0 0
Special Area No. 3 0 0 0 0 0 0 0 0 0 0
Special Area No. 4 0 0 0 0 0 0 0 0 0 0
Starland County 0 0 0 0 0 0 0 0 0 0
Stettler County No. 6 0 0 0 0 0 0 0 0 0 0
Source: Statistics Canada, 2011 Census of Agriculture. Prepared by Alberta Agriculture and Rural Development, Economics and Competitiveness Division, Statistics and Data Development Branch.X - Confidential. 0 - True zero or a value rounded to zero. Refer to census definitions and notes for more information.
Other Fruits, Berries and NutsPeachesPears Apricots Grapes
38

Table 6.3: Fruits, Berries and Nuts Grown for Sale, 2011
# Farms Acres # Farms Acres # Farms Acres # Farms Acres # Farms Acres
South Saskatchewan 2 X 0 0 0 0 2 X 22 X
Bighorn No. 8 0 0 0 0 0 0 0 0 0 0
Calgary 0 0 0 0 0 0 1 X 0 0
Cardston County 0 0 0 0 0 0 0 0 1 X
Cypress County 0 0 0 0 0 0 0 0 0 0
Foothills No. 31 0 0 0 0 0 0 0 0 6 25
Forty Mile County No. 8 0 0 0 0 0 0 0 0 1 X
Lethbridge County 0 0 0 0 0 0 0 0 2 X
Newell County No. 4 0 0 0 0 0 0 0 0 3 1
Pincher Creek No. 9 1 X 0 0 0 0 1 X 1 X
Ranchland No. 66 1 X 0 0 0 0 0 0 0 0
Rocky View County 0 0 0 0 0 0 0 0 2 X
Taber 0 0 0 0 0 0 0 0 1 X
Vulcan County 0 0 0 0 0 0 0 0 1 X
Warner County No. 5 0 0 0 0 0 0 0 0 1 X
Wheatland County 0 0 0 0 0 0 0 0 3 4
Willow Creek No. 26 0 0 0 0 0 0 0 0 0 0
Source: Statistics Canada, 2011 Census of Agriculture. Prepared by Alberta Agriculture and Rural Development, Economics and Competitiveness Division, Statistics and Data Development Branch.
X - Confidential. 0 - True zero or a value rounded to zero. Refer to census definitions and notes for more information.
Pears Apricots GrapesPeaches Other Fruits, Berries and Nuts
39

Table 7.1: Vegetables Grown for Sale (excluding greenhouse vegetables), 2011
# Farms Acres # Farms Acres # Farms Acres # Farms Acres # Farms Acres # Farms Acres
Alberta 445 10,716 172 4,019 117 32 158 104 172 3,092 147 157
Lower Peace 7 X 0 0 1 X 0 0 0 0 0 0
Mackenzie County 1 X 0 0 0 0 0 0 0 0 0 0
Northern Lights County 4 5 0 0 1 X 0 0 0 0 0 0
Northern Sunrise County 2 X 0 0 0 0 0 0 0 0 0 0
Lower Athabasca 11 17 3 X 4 X 6 1 7 1 5 X
Bonnyville No. 87 7 7 1 X 3 0 3 0 3 0 3 1
Lac la Biche County 4 10 2 X 1 X 3 1 4 1 2 X
Upper Peace 23 X 12 X 8 X 10 X 7 X 5 X
Birch Hills County 2 X 2 X 1 X 1 X 2 X 1 X
Clear Hills 2 X 1 X 1 X 1 X 1 X 1 X
Fairview No. 136 4 23 4 15 3 X 4 3 1 X 1 X
Grande Prairie County No. 1 7 102 1 X 0 0 1 X 1 X 0 0
Greenview No. 16 4 19 2 X 2 X 2 X 1 X 1 X
Peace No. 135 2 X 2 X 1 X 1 X 1 X 1 X
Saddle Hills County 0 0 0 0 0 0 0 0 0 0 0 0
Smoky River No. 130 1 X 0 0 0 0 0 0 0 0 0 0
Spirit River No. 133 1 X 0 0 0 0 0 0 0 0 0 0
Upper Athabasca 50 X 16 X 11 X 17 X 18 X 19 X
Athabasca County 8 20 2 X 2 X 2 X 3 0 4 1
Barrhead County No. 11 7 13 1 X 1 X 1 X 0 0 2 X
Big Lakes 4 7 1 X 0 0 1 X 1 X 1 X
Lac Ste. Anne County 9 X 5 1 4 0 3 1 5 1 4 0
Lesser Slave River No.124 4 37 0 0 0 0 0 0 0 0 0 0
Westlock County 10 75 6 9 0 0 6 7 7 13 6 6
Woodlands County 2 X 1 X 2 X 1 X 1 X 1 X
Yellowhead County 6 X 0 0 2 X 3 X 1 X 1 X
Source: Statistics Canada, 2011 Census of Agriculture. Prepared by Alberta Agriculture and Rural Development, Economics and Competitiveness Division, Statistics and Data Development Branch.
X - Confidential. 0 - True zero or a value rounded to zero. Refer to census definitions and notes for more information.
Green Peas Green and Wax BeansTotal Vegetables Sweet Corn Tomatoes Cucumbers
40

Table 7.1: Vegetables Grown for Sale (excluding greenhouse vegetables), 2011
# Farms Acres # Farms Acres # Farms Acres # Farms Acres # Farms Acres # Farms Acres
North Saskatchewan 147 X 52 X 36 X 58 X 57 X 60 X
Beaver County 6 22 2 X 1 X 2 X 1 X 2 X
Brazeau County 3 5 0 0 0 0 0 0 1 X 0 0
Camrose County 11 96 6 X 3 1 5 2 4 X 6 1
Clearwater County 4 16 0 0 0 0 0 0 2 X 2 X
Edmonton 8 210 4 16 0 0 4 16 4 27 4 X
Flagstaff County 6 9 3 1 2 X 3 1 2 X 1 X
Lamont County 8 17 3 0 2 X 4 1 1 X 3 0
Leduc County 14 159 5 1 2 X 4 3 4 X 5 4
Minburn County No. 27 3 2 1 X 0 0 1 X 1 X 1 X
Parkland County 20 47 4 2 6 2 5 3 9 4 9 3
Provost No. 52 0 0 0 0 0 0 0 0 0 0 0 0
Smoky Lake County 7 37 3 X 4 1 5 12 3 X 3 1
St. Paul County No. 19 2 X 0 0 0 0 0 0 0 0 0 0
Strathcona County 7 76 3 3 1 X 3 3 3 4 3 X
Sturgeon County 18 89 10 15 6 1 12 5 10 3 9 2
Thorhild County No. 7 3 16 1 X 2 X 2 X 2 X 2 X
Two Hills County No. 21 7 15 0 0 0 0 2 X 2 X 2 X
Vermilion River County 6 16 2 X 2 X 2 X 1 X 1 X
Wainwright No. 61 0 0 0 0 0 0 0 0 0 0 0 0
Wetaskiwin County No. 10 14 46 5 1 5 1 4 1 7 3 7 1
Red Deer 66 X 16 X 15 X 18 X 23 X 21 X
Kneehill County 4 X 3 X 2 X 2 X 2 X 2 X
Lacombe County 16 34 3 0 4 X 4 X 7 1 7 1
Mountain View County 15 38 3 X 1 X 1 X 2 X 1 X
Paintearth County No. 18 1 X 0 0 0 0 1 X 0 0 1 X
Ponoka County 5 19 1 X 1 X 2 X 1 X 1 X
Red Deer County 20 122 2 X 4 X 5 2 8 13 7 3
Special Area No. 2 0 0 0 0 0 0 0 0 0 0 0 0
Special Area No. 3 2 X 2 X 2 X 2 X 2 X 1 X
Special Area No. 4 0 0 0 0 0 0 0 0 0 0 0 0
Starland County 1 X 1 X 0 0 0 0 0 0 0 0
Stettler County No. 6 2 X 1 X 1 X 1 X 1 X 1 X
Source: Statistics Canada, 2011 Census of Agriculture. Prepared by Alberta Agriculture and Rural Development, Economics and Competitiveness Division, Statistics and Data Development Branch.
X - Confidential. 0 - True zero or a value rounded to zero. Refer to census definitions and notes for more information.
Total Vegetables Sweet Corn Green Peas Green and Wax BeansTomatoes Cucumbers
41

Table 7.1: Vegetables Grown for Sale (excluding greenhouse vegetables), 2011
# Farms Acres # Farms Acres # Farms Acres # Farms Acres # Farms Acres # Farms Acres
South Saskatchewan 141 X 73 X 42 X 49 X 60 X 37 X
Bighorn No. 8 0 0 0 0 0 0 0 0 0 0 0 0
Calgary 2 X 0 0 0 0 0 0 0 0 0 0
Cardston County 5 17 4 4 3 X 4 X 4 X 3 1
Cypress County 14 X 4 X 4 X 7 X 1 X 2 X
Foothills No. 31 5 16 1 X 1 X 0 0 1 X 1 X
Forty Mile County No. 8 8 X 5 X 2 X 3 2 2 X 2 X
Lethbridge County 21 807 7 33 4 X 4 0 8 591 6 X
Newell County No. 4 10 300 7 16 4 X 5 4 5 13 3 X
Pincher Creek No. 9 3 X 1 X 1 X 0 0 0 0 0 0
Ranchland No. 66 0 0 0 0 0 0 0 0 0 0 0 0
Rocky View County 7 X 1 X 1 X 1 X 3 1 1 X
Taber 30 6,228 22 3,054 3 X 3 X 15 2,327 2 X
Vulcan County 7 21 4 1 5 1 5 X 5 X 6 X
Warner County No. 5 12 77 10 10 8 X 11 X 10 9 7 3
Wheatland County 13 44 6 7 5 2 5 3 5 2 4 2
Willow Creek No. 26 4 X 1 X 1 X 1 X 1 X 0 0
Source: Statistics Canada, 2011 Census of Agriculture. Prepared by Alberta Agriculture and Rural Development, Economics and Competitiveness Division, Statistics and Data Development Branch.
X - Confidential. 0 - True zero or a value rounded to zero. Refer to census definitions and notes for more information.
Total Vegetables Sweet Corn Green Peas Green and Wax BeansTomatoes Cucumbers
42

Table 7.2: Vegetables Grown for Sale (excluding greenhouse vegetables), 2011
# Farms Acres # Farms Acres # Farms Acres # Farms Acres # Farms Acres # Farms Acres
Alberta 112 504 17 17 75 102 73 28 17 4 213 388
Lower Peace 2 X 0 0 0 0 1 X 0 0 2 X
Mackenzie County 0 0 0 0 0 0 0 0 0 0 1 X
Northern Lights County 2 X 0 0 0 0 1 X 0 0 1 X
Northern Sunrise County 0 0 0 0 0 0 0 0 0 0 0 0
Lower Athabasca 5 X 0 0 3 X 2 X 0 0 7 X
Bonnyville No. 87 3 1 0 0 2 X 2 X 0 0 4 X
Lac la Biche County 2 X 0 0 1 X 0 0 0 0 3 1
Upper Peace 5 X 0 0 6 X 5 X 0 0 11 X
Birch Hills County 0 0 0 0 0 0 0 0 0 0 2 X
Clear Hills 1 X 0 0 1 X 1 X 0 0 2 X
Fairview No. 136 1 X 0 0 1 X 1 X 0 0 2 X
Grande Prairie County No. 1 0 0 0 0 1 X 0 0 0 0 2 X
Greenview No. 16 2 X 0 0 2 X 2 X 0 0 2 X
Peace No. 135 1 X 0 0 1 X 1 X 0 0 1 X
Saddle Hills County 0 0 0 0 0 0 0 0 0 0 0 0
Smoky River No. 130 0 0 0 0 0 0 0 0 0 0 0 0
Spirit River No. 133 0 0 0 0 0 0 0 0 0 0 0 0
Upper Athabasca 8 X 0 0 4 X 5 X 2 X 25 X
Athabasca County 1 X 0 0 0 0 1 X 0 0 4 1
Barrhead County No. 11 0 0 0 0 0 0 0 0 0 0 2 X
Big Lakes 0 0 0 0 0 0 0 0 0 0 1 X
Lac Ste. Anne County 2 X 0 0 1 X 2 X 1 X 6 1
Lesser Slave River No.124 0 0 0 0 0 0 0 0 0 0 0 0
Westlock County 5 4 0 0 2 X 2 X 1 X 8 12
Woodlands County 0 0 0 0 1 X 0 0 0 0 1 X
Yellowhead County 0 0 0 0 0 0 0 0 0 0 3 X
Source: Statistics Canada, 2011 Census of Agriculture. Prepared by Alberta Agriculture and Rural Development, Economics and Competitiveness Division, Statistics and Data Development Branch.
X - Confidential. 0 - True zero or a value rounded to zero. Refer to census definitions and notes for more information.
Brussel Sprouts CarrotsCabbage Chinese Cabbage Cauliflower Broccoli
43

Table 7.2: Vegetables Grown for Sale (excluding greenhouse vegetables), 2011
# Farms Acres # Farms Acres # Farms Acres # Farms Acres # Farms Acres # Farms Acres
North Saskatchewan 39 X 7 X 24 X 23 X 7 X 82 X
Beaver County 1 X 0 0 1 X 1 X 0 0 3 X
Brazeau County 0 0 0 0 0 0 0 0 0 0 2 X
Camrose County 4 X 2 X 2 X 2 X 1 X 5 3
Clearwater County 0 0 0 0 0 0 0 0 0 0 2 X
Edmonton 2 X 0 0 2 X 2 X 1 X 4 X
Flagstaff County 1 X 0 0 1 X 1 X 0 0 3 X
Lamont County 0 0 1 X 0 0 0 0 0 0 4 1
Leduc County 6 11 2 X 5 X 3 1 3 X 7 9
Minburn County No. 27 0 0 0 0 0 0 0 0 0 0 2 X
Parkland County 7 1 1 X 2 X 3 0 0 0 8 5
Provost No. 52 0 0 0 0 0 0 0 0 0 0 0 0
Smoky Lake County 4 4 0 0 4 1 1 X 0 0 6 1
St. Paul County No. 19 0 0 0 0 0 0 0 0 0 0 1 X
Strathcona County 2 X 0 0 2 X 1 X 1 X 3 X
Sturgeon County 6 2 1 X 2 X 5 2 0 0 13 7
Thorhild County No. 7 3 2 0 0 2 X 2 X 1 X 3 2
Two Hills County No. 21 2 X 0 0 0 0 0 0 0 0 4 2
Vermilion River County 0 0 0 0 0 0 0 0 0 0 2 X
Wainwright No. 61 0 0 0 0 0 0 0 0 0 0 0 0
Wetaskiwin County No. 10 1 X 0 0 1 X 2 X 0 0 10 5
Red Deer 14 X 7 X 11 X 12 X 4 X 30 X
Kneehill County 1 X 1 X 1 X 1 X 1 X 2 X
Lacombe County 3 X 4 1 3 2 3 X 1 X 9 X
Mountain View County 1 X 0 0 1 X 1 X 0 0 3 2
Paintearth County No. 18 0 0 0 0 0 0 0 0 0 0 1 X
Ponoka County 1 X 0 0 1 X 1 X 0 0 1 X
Red Deer County 5 6 2 X 2 X 3 3 1 X 11 43
Special Area No. 2 0 0 0 0 0 0 0 0 0 0 0 0
Special Area No. 3 2 X 0 0 2 X 2 X 0 0 2 X
Special Area No. 4 0 0 0 0 0 0 0 0 0 0 0 0
Starland County 0 0 0 0 0 0 0 0 0 0 0 0
Stettler County No. 6 1 X 0 0 1 X 1 X 1 X 1 X
Source: Statistics Canada, 2011 Census of Agriculture. Prepared by Alberta Agriculture and Rural Development, Economics and Competitiveness Division, Statistics and Data Development Branch.
X - Confidential. 0 - True zero or a value rounded to zero. Refer to census definitions and notes for more information.
Cauliflower Broccoli Brussel Sprouts CarrotsCabbage Chinese Cabbage
44

Table 7.2: Vegetables Grown for Sale (excluding greenhouse vegetables), 2011
# Farms Acres # Farms Acres # Farms Acres # Farms Acres # Farms Acres # Farms Acres
South Saskatchewan 39 X 3 X 27 X 25 X 4 X 56 X
Bighorn No. 8 0 0 0 0 0 0 0 0 0 0 0 0
Calgary 0 0 0 0 0 0 0 0 0 0 1 X
Cardston County 2 X 0 0 2 X 2 X 0 0 3 1
Cypress County 3 X 0 0 1 X 1 X 0 0 2 X
Foothills No. 31 0 0 0 0 0 0 0 0 0 0 2 X
Forty Mile County No. 8 2 X 0 0 1 X 1 X 0 0 2 X
Lethbridge County 7 27 2 X 3 X 3 X 0 0 6 X
Newell County No. 4 3 X 0 0 2 X 2 X 0 0 5 X
Pincher Creek No. 9 0 0 0 0 0 0 0 0 0 0 1 X
Ranchland No. 66 0 0 0 0 0 0 0 0 0 0 0 0
Rocky View County 1 X 0 0 1 X 1 X 0 0 4 1
Taber 3 X 0 0 2 X 3 X 0 0 4 X
Vulcan County 5 1 1 X 4 X 4 1 2 X 6 X
Warner County No. 5 10 4 0 0 7 2 6 1 1 X 11 X
Wheatland County 2 X 0 0 4 1 2 X 1 X 8 6
Willow Creek No. 26 1 X 0 0 0 0 0 0 0 0 1 X
Source: Statistics Canada, 2011 Census of Agriculture. Prepared by Alberta Agriculture and Rural Development, Economics and Competitiveness Division, Statistics and Data Development Branch.
X - Confidential. 0 - True zero or a value rounded to zero. Refer to census definitions and notes for more information.
Cauliflower Broccoli Cabbage Chinese Cabbage Brussel Sprouts Carrots
45

Table 7.3: Vegetables Grown for Sale (excluding greenhouse vegetables), 2011
# Farms Acres # Farms Acres # Farms Acres # Farms Acres # Farms Acres # Farms Acres
Alberta 61 154 182 83 91 120 128 931 78 76 26 4
Lower Peace 2 X 2 X 0 0 1 X 0 0 0 0
Mackenzie County 1 X 1 X 0 0 0 0 0 0 0 0
Northern Lights County 1 X 1 X 0 0 1 X 0 0 0 0
Northern Sunrise County 0 0 0 0 0 0 0 0 0 0 0 0
Lower Athabasca 1 X 6 0 3 0 3 X 1 X 1 X
Bonnyville No. 87 1 X 3 0 3 0 2 X 1 X 1 X
Lac la Biche County 0 0 3 0 0 0 1 X 0 0 0 0
Upper Peace 2 X 7 X 3 X 6 X 3 X 0 0
Birch Hills County 0 0 0 0 0 0 0 0 0 0 0 0
Clear Hills 0 0 1 X 0 0 1 X 0 0 0 0
Fairview No. 136 1 X 1 X 0 0 0 0 0 0 0 0
Grande Prairie County No. 1 0 0 1 X 1 X 2 X 1 X 0 0
Greenview No. 16 1 X 3 1 2 X 2 X 1 X 0 0
Peace No. 135 0 0 1 X 0 0 1 X 1 X 0 0
Saddle Hills County 0 0 0 0 0 0 0 0 0 0 0 0
Smoky River No. 130 0 0 0 0 0 0 0 0 0 0 0 0
Spirit River No. 133 0 0 0 0 0 0 0 0 0 0 0 0
Upper Athabasca 7 X 20 X 10 X 12 X 8 X 4 X
Athabasca County 1 X 3 1 2 X 2 X 2 X 1 X
Barrhead County No. 11 0 0 2 X 1 X 1 X 0 0 0 0
Big Lakes 0 0 1 X 0 0 1 X 0 0 0 0
Lac Ste. Anne County 2 X 4 0 2 X 3 1 2 X 2 X
Lesser Slave River No.124 0 0 0 0 0 0 0 0 0 0 0 0
Westlock County 2 X 7 4 5 2 5 4 2 X 1 X
Woodlands County 0 0 1 X 0 0 0 0 0 0 0 0
Yellowhead County 2 X 2 X 0 0 0 0 2 X 0 0
Source: Statistics Canada, 2011 Census of Agriculture. Prepared by Alberta Agriculture and Rural Development, Economics and Competitiveness Division, Statistics and Data Development Branch.
X - Confidential. 0 - True zero or a value rounded to zero. Refer to census definitions and notes for more information.
Shallots and
Green Onions Celery
Rutabagas
and Turnips Beets Radishes Dry Onions
46

Table 7.3: Vegetables Grown for Sale (excluding greenhouse vegetables), 2011
# Farms Acres # Farms Acres # Farms Acres # Farms Acres # Farms Acres # Farms Acres
North Saskatchewan 22 X 70 X 29 X 50 X 33 X 11 X
Beaver County 1 X 3 2 1 X 3 1 1 X 1 X
Brazeau County 0 0 1 X 0 0 0 0 0 0 0 0
Camrose County 3 1 4 1 3 X 5 2 3 0 1 X
Clearwater County 1 X 1 X 1 X 2 X 1 X 0 0
Edmonton 0 0 4 16 1 X 4 X 2 X 0 0
Flagstaff County 0 0 3 1 2 X 0 0 2 X 1 X
Lamont County 1 X 3 X 1 X 2 X 2 X 0 0
Leduc County 5 X 8 4 2 X 3 1 2 X 2 X
Minburn County No. 27 0 0 1 X 0 0 2 X 0 0 0 0
Parkland County 4 1 11 3 3 2 6 2 5 3 2 X
Provost No. 52 0 0 0 0 0 0 0 0 0 0 0 0
Smoky Lake County 1 X 5 X 4 1 2 X 2 X 0 0
St. Paul County No. 19 0 0 0 0 0 0 0 0 0 0 0 0
Strathcona County 0 0 3 3 2 X 3 X 0 0 0 0
Sturgeon County 3 X 12 3 5 3 8 3 6 2 1 X
Thorhild County No. 7 1 X 2 X 2 X 2 X 1 X 1 X
Two Hills County No. 21 0 0 4 2 0 0 1 X 1 X 0 0
Vermilion River County 1 X 1 X 0 0 1 X 0 0 0 0
Wainwright No. 61 0 0 0 0 0 0 0 0 0 0 0 0
Wetaskiwin County No. 10 1 X 4 X 2 X 6 1 5 1 2 X
Red Deer 14 X 25 X 14 X 14 X 17 X 4 X
Kneehill County 1 X 2 X 1 X 1 X 2 X 1 X
Lacombe County 5 X 9 2 5 1 3 0 5 1 1 X
Mountain View County 1 X 2 X 0 0 1 X 1 X 1 X
Paintearth County No. 18 0 0 0 0 0 0 1 X 1 X 1 X
Ponoka County 1 X 1 X 1 X 1 X 1 X 0 0
Red Deer County 4 X 8 4 4 1 5 2 5 1 0 0
Special Area No. 2 0 0 0 0 0 0 0 0 0 0 0 0
Special Area No. 3 0 0 2 X 2 X 1 X 2 X 0 0
Special Area No. 4 0 0 0 0 0 0 0 0 0 0 0 0
Starland County 0 0 0 0 0 0 0 0 0 0 0 0
Stettler County No. 6 2 X 1 X 1 X 1 X 0 0 0 0
Source: Statistics Canada, 2011 Census of Agriculture. Prepared by Alberta Agriculture and Rural Development, Economics and Competitiveness Division, Statistics and Data Development Branch.
X - Confidential. 0 - True zero or a value rounded to zero. Refer to census definitions and notes for more information.
Shallots and
Green Onions Celery
Rutabagas
and Turnips Beets Radishes Dry Onions
47

Table 7.3: Vegetables Grown for Sale (excluding greenhouse vegetables), 2011
# Farms Acres # Farms Acres # Farms Acres # Farms Acres # Farms Acres # Farms Acres
South Saskatchewan 13 X 52 X 32 X 42 X 16 X 6 X
Bighorn No. 8 0 0 0 0 0 0 0 0 0 0 0 0
Calgary 1 X 2 X 0 0 1 X 0 0 0 0
Cardston County 0 0 3 X 3 1 3 1 2 X 0 0
Cypress County 1 X 2 X 1 X 2 X 1 X 0 0
Foothills No. 31 1 X 3 2 0 0 0 0 0 0 0 0
Forty Mile County No. 8 0 0 2 X 2 X 2 X 0 0 1 X
Lethbridge County 0 0 5 2 2 X 6 X 3 X 1 X
Newell County No. 4 0 0 4 1 3 1 3 X 2 X 1 X
Pincher Creek No. 9 1 X 1 X 1 X 2 X 0 0 0 0
Ranchland No. 66 0 0 0 0 0 0 0 0 0 0 0 0
Rocky View County 0 0 3 1 1 X 2 X 0 0 0 0
Taber 2 X 3 1 2 X 4 X 0 0 0 0
Vulcan County 2 X 6 X 4 X 4 X 3 0 2 X
Warner County No. 5 3 X 10 4 8 6 7 X 1 X 1 X
Wheatland County 2 X 7 5 4 2 4 2 3 X 0 0
Willow Creek No. 26 0 0 1 X 1 X 2 X 1 X 0 0
Source: Statistics Canada, 2011 Census of Agriculture. Prepared by Alberta Agriculture and Rural Development, Economics and Competitiveness Division, Statistics and Data Development Branch.
X - Confidential. 0 - True zero or a value rounded to zero. Refer to census definitions and notes for more information.
Shallots and
Green Onions Celery
Rutabagas
and Turnips Beets Radishes Dry Onions
48

Table 7.4: Vegetables Grown for Sale (excluding greenhouse vegetables), 2011
# Farms Acres # Farms Acres # Farms Acres # Farms Acres # Farms Acres
Alberta 122 37 74 23 34 5 91 205 114 155
Lower Peace 0 0 0 0 0 0 0 0 0 0
Mackenzie County 0 0 0 0 0 0 0 0 0 0
Northern Lights County 0 0 0 0 0 0 0 0 0 0
Northern Sunrise County 0 0 0 0 0 0 0 0 0 0
Lower Athabasca 5 X 1 X 1 X 5 X 3 X
Bonnyville No. 87 3 0 1 X 1 X 3 2 2 X
Lac la Biche County 2 X 0 0 0 0 2 X 1 X
Upper Peace 5 X 1 X 0 0 3 X 5 X
Birch Hills County 0 0 0 0 0 0 0 0 0 0
Clear Hills 1 X 0 0 0 0 0 0 1 X
Fairview No. 136 0 0 0 0 0 0 1 X 2 X
Grande Prairie County No. 1 1 X 0 0 0 0 0 0 0 0
Greenview No. 16 2 X 1 X 0 0 2 X 2 X
Peace No. 135 1 X 0 0 0 0 0 0 0 0
Saddle Hills County 0 0 0 0 0 0 0 0 0 0
Smoky River No. 130 0 0 0 0 0 0 0 0 0 0
Spirit River No. 133 0 0 0 0 0 0 0 0 0 0
Upper Athabasca 12 X 7 X 1 X 7 X 6 X
Athabasca County 2 X 1 X 0 0 2 X 2 X
Barrhead County No. 11 1 X 1 X 0 0 1 X 0 0
Big Lakes 0 0 1 X 0 0 0 0 0 0
Lac Ste. Anne County 3 0 2 X 1 X 1 X 1 X
Lesser Slave River No.124 0 0 0 0 0 0 0 0 0 0
Westlock County 3 1 2 X 0 0 3 2 3 1
Woodlands County 1 X 0 0 0 0 0 0 0 0
Yellowhead County 2 X 0 0 0 0 0 0 0 0
Source: Statistics Canada, 2011 Census of Agriculture. Prepared by Alberta Agriculture and Rural Development, Economics and Competitiveness Division, Statistics and Data Development Branch.
X - Confidential. 0 - True zero or a value rounded to zero. Refer to census definitions and notes for more information.
Pumpkins Squash and ZucchiniLettuce Spinach Peppers
49

Table 7.4: Vegetables Grown for Sale (excluding greenhouse vegetables), 2011
# Farms Acres # Farms Acres # Farms Acres # Farms Acres # Farms Acres
North Saskatchewan 48 X 33 X 13 X 35 X 47 X
Beaver County 1 X 1 X 1 X 1 X 1 X
Brazeau County 0 0 0 0 0 0 0 0 0 0
Camrose County 5 1 2 X 1 X 2 X 5 2
Clearwater County 1 X 1 X 0 0 1 X 0 0
Edmonton 2 X 3 X 0 0 2 X 4 X
Flagstaff County 2 X 0 0 1 X 3 X 2 X
Lamont County 2 X 1 X 1 X 2 X 1 X
Leduc County 5 3 4 2 0 0 4 1 5 4
Minburn County No. 27 0 0 1 X 0 0 1 X 0 0
Parkland County 7 2 5 2 4 0 5 1 7 X
Provost No. 52 0 0 0 0 0 0 0 0 0 0
Smoky Lake County 4 1 2 X 0 0 2 X 3 1
St. Paul County No. 19 0 0 0 0 0 0 0 0 0 0Strathcona County 1 X 1 X 1 X 1 X 1 XSturgeon County 8 4 4 2 1 X 5 15 9 8
Thorhild County No. 7 2 X 2 X 0 0 2 X 2 X
Two Hills County No. 21 0 0 1 X 0 0 0 0 2 X
Vermilion River County 1 X 0 0 0 0 1 X 1 X
Wainwright No. 61 0 0 0 0 0 0 0 0 0 0
Wetaskiwin County No. 10 7 3 5 4 3 0 3 1 4 1
Red Deer 21 X 15 X 8 X 9 X 17 X
Kneehill County 1 X 1 X 1 X 1 X 1 X
Lacombe County 6 1 5 1 2 X 1 X 6 X
Mountain View County 2 X 2 X 1 X 1 X 1 X
Paintearth County No. 18 1 X 1 X 1 X 1 X 1 X
Ponoka County 2 X 1 X 0 0 0 0 1 X
Red Deer County 6 1 4 1 2 X 4 X 5 1
Special Area No. 2 0 0 0 0 0 0 0 0 0 0
Special Area No. 3 2 X 0 0 1 X 1 X 1 X
Special Area No. 4 0 0 0 0 0 0 0 0 0 0
Starland County 0 0 0 0 0 0 0 0 0 0
Stettler County No. 6 1 X 1 X 0 0 0 0 1 X
Source: Statistics Canada, 2011 Census of Agriculture. Prepared by Alberta Agriculture and Rural Development, Economics and Competitiveness Division, Statistics and Data Development Branch.
X - Confidential. 0 - True zero or a value rounded to zero. Refer to census definitions and notes for more information.
Lettuce Spinach Squash and ZucchiniPeppers Pumpkins
50

Table 7.4: Vegetables Grown for Sale (excluding greenhouse vegetables), 2011
# Farms Acres # Farms Acres # Farms Acres # Farms Acres # Farms Acres
South Saskatchewan 31 X 17 X 11 X 32 X 36 X
Bighorn No. 8 0 0 0 0 0 0 0 0 0 0
Calgary 1 X 1 X 0 0 0 0 1 X
Cardston County 2 X 2 X 0 0 1 X 1 X
Cypress County 0 0 0 0 0 0 1 X 1 X
Foothills No. 31 2 X 1 X 1 X 0 0 2 X
Forty Mile County No. 8 1 X 0 0 1 X 2 X 1 X
Lethbridge County 2 X 3 X 2 X 5 X 7 X
Newell County No. 4 3 X 1 X 1 X 6 X 5 X
Pincher Creek No. 9 1 X 0 0 0 0 0 0 0 0
Ranchland No. 66 0 0 0 0 0 0 0 0 0 0
Rocky View County 2 X 1 X 0 0 1 X 2 X
Taber 1 X 1 X 1 X 5 X 3 X
Vulcan County 5 1 3 0 2 X 4 X 4 X
Warner County No. 5 6 X 4 X 3 X 5 X 6 1
Wheatland County 4 X 0 0 0 0 1 X 3 1
Willow Creek No. 26 1 X 0 0 0 0 1 X 0 0
Source: Statistics Canada, 2011 Census of Agriculture. Prepared by Alberta Agriculture and Rural Development, Economics and Competitiveness Division, Statistics and Data Development Branch.
X - Confidential. 0 - True zero or a value rounded to zero. Refer to census definitions and notes for more information.
Peppers PumpkinsLettuce Spinach Squash and Zucchini
51

Table 7.5: Vegetables Grown for Sale (excluding greenhouse vegetables), 2011
# Farms Acres # Farms Acres # Farms Acres
Alberta 36 39 11 8 196 430
Lower Peace 0 0 0 0 5 X
Mackenzie County 0 0 0 0 0 0
Northern Lights County 0 0 0 0 3 X
Northern Sunrise County 0 0 0 0 2 X
Lower Athabasca 0 0 0 0 1 X
Bonnyville No. 87 0 0 0 0 0 0
Lac la Biche County 0 0 0 0 1 X
Upper Peace 2 X 0 0 9 X
Birch Hills County 0 0 0 0 0 0
Clear Hills 0 0 0 0 1 X
Fairview No. 136 0 0 0 0 0 0
Grande Prairie County No. 1 1 X 0 0 4 36
Greenview No. 16 0 0 0 0 1 X
Peace No. 135 1 X 0 0 1 X
Saddle Hills County 0 0 0 0 0 0
Smoky River No. 130 0 0 0 0 1 X
Spirit River No. 133 0 0 0 0 1 X
Upper Athabasca 3 X 0 0 23 X
Athabasca County 2 X 0 0 6 12
Barrhead County No. 11 0 0 0 0 4 10
Big Lakes 0 0 0 0 2 X
Lac Ste. Anne County 1 X 0 0 2 X
Lesser Slave River No.124 0 0 0 0 4 37
Westlock County 0 0 0 0 2 X
Woodlands County 0 0 0 0 0 0
Yellowhead County 0 0 0 0 3 X
Source: Statistics Canada, 2011 Census of Agriculture. Prepared by Alberta Agriculture and Rural Development, Economics and Competitiveness Division, Statistics and Data Development Branch.
X - Confidential. 0 - True zero or a value rounded to zero. Refer to census definitions and notes for more information.
Asparagus, Non-producingAsparagus, Producing Other Vegetables
52

Table 7.5: Vegetables Grown for Sale (excluding greenhouse vegetables), 2011
# Farms Acres # Farms Acres # Farms Acres
North Saskatchewan 13 X 5 X 76 X
Beaver County 1 X 0 0 5 8
Brazeau County 0 0 0 0 1 X
Camrose County 0 0 1 X 5 26
Clearwater County 0 0 1 X 2 X
Edmonton 0 0 0 0 4 X
Flagstaff County 0 0 0 0 3 X
Lamont County 1 X 2 X 7 12
Leduc County 2 X 0 0 8 25
Minburn County No. 27 1 X 0 0 1 X
Parkland County 2 X 0 0 7 8
Provost No. 52 0 0 0 0 0 0
Smoky Lake County 1 X 0 0 1 X
St. Paul County No. 19 0 0 0 0 1 XStrathcona County 1 X 0 0 5 19Sturgeon County 2 X 0 0 8 11
Thorhild County No. 7 0 0 0 0 1 X
Two Hills County No. 21 1 X 0 0 4 5
Vermilion River County 0 0 0 0 5 X
Wainwright No. 61 0 0 0 0 0 0
Wetaskiwin County No. 10 1 X 1 X 8 20
Red Deer 7 X 3 X 34 X
Kneehill County 1 X 0 0 2 X
Lacombe County 2 X 1 X 9 14
Mountain View County 2 X 0 0 10 18
Paintearth County No. 18 0 0 1 X 1 X
Ponoka County 0 0 0 0 3 X
Red Deer County 1 X 1 X 8 6
Special Area No. 2 0 0 0 0 0 0
Special Area No. 3 0 0 0 0 0 0
Special Area No. 4 0 0 0 0 0 0
Starland County 0 0 0 0 0 0
Stettler County No. 6 1 X 0 0 1 X
Source: Statistics Canada, 2011 Census of Agriculture. Prepared by Alberta Agriculture and Rural Development, Economics and Competitiveness Division, Statistics and Data Development Branch.
X - Confidential. 0 - True zero or a value rounded to zero. Refer to census definitions and notes for more information.
Other VegetablesAsparagus, Producing Asparagus, Non-producing
53

Table 7.5: Vegetables Grown for Sale (excluding greenhouse vegetables), 2011
# Farms Acres # Farms Acres # Farms Acres
South Saskatchewan 11 X 3 X 48 X
Bighorn No. 8 0 0 0 0 0 0
Calgary 0 0 0 0 1 X
Cardston County 1 X 0 0 1 X
Cypress County 0 0 0 0 4 X
Foothills No. 31 1 X 0 0 2 X
Forty Mile County No. 8 0 0 0 0 3 X
Lethbridge County 1 X 1 X 6 12
Newell County No. 4 1 X 1 X 5 3
Pincher Creek No. 9 0 0 0 0 2 X
Ranchland No. 66 0 0 0 0 0 0
Rocky View County 0 0 0 0 4 X
Taber 2 X 0 0 0 0
Vulcan County 2 X 1 X 4 X
Warner County No. 5 2 X 0 0 4 9
Wheatland County 1 X 0 0 9 8
Willow Creek No. 26 0 0 0 0 3 3
Source: Statistics Canada, 2011 Census of Agriculture. Prepared by Alberta Agriculture and Rural Development, Economics and Competitiveness Division, Statistics and Data Development Branch.
X - Confidential. 0 - True zero or a value rounded to zero. Refer to census definitions and notes for more information.
Other VegetablesAsparagus, Producing Asparagus, Non-producing
54

Table 8.1: Nursery, Sod and Forest Products Grown for Sale, 2011
# Farms Acres # Farms Acres # Farms Acres # Farms # Taps # Farms Dollars
Alberta 502 9,755 42 10,063 105 1,395 7 X 275 2,606,032
Lower Peace 1 X 0 0 4 X 0 0 21 X
Mackenzie County 0 0 0 0 0 0 0 0 8 98,543
Northern Lights County 1 X 0 0 2 X 0 0 9 187,279
Northern Sunrise County 0 0 0 0 2 X 0 0 4 X
Lower Athabasca 5 X 1 X 2 X 0 0 10 X
Bonnyville No. 87 4 52 1 X 2 X 0 0 8 145,084
Lac la Biche County 1 X 0 0 0 0 0 0 2 X
Upper Peace 23 X 3 X 7 X 0 0 31 X
Birch Hills County 0 0 1 X 0 0 0 0 0 0
Clear Hills 0 0 0 0 0 0 0 0 6 X
Fairview No. 136 1 X 0 0 1 X 0 0 0 0
Grande Prairie County No. 1 10 288 1 X 2 X 0 0 11 23,304
Greenview No. 16 2 X 0 0 2 X 0 0 4 15,677
Peace No. 135 4 X 1 X 1 X 0 0 1 X
Saddle Hills County 3 28 0 0 1 X 0 0 7 X
Smoky River No. 130 2 X 0 0 0 0 0 0 2 X
Spirit River No. 133 1 X 0 0 0 0 0 0 0 0
Upper Athabasca 29 X 3 X 17 X 0 0 45 X
Athabasca County 6 60 0 0 2 X 0 0 4 X
Barrhead County No. 11 4 X 0 0 3 87 0 0 5 33,915
Big Lakes 2 X 0 0 2 X 0 0 10 145,079
Lac Ste. Anne County 3 12 0 0 4 31 0 0 4 42,686
Lesser Slave River No.124 1 X 1 X 0 0 0 0 2 X
Westlock County 9 48 0 0 2 X 0 0 4 X
Woodlands County 0 0 1 X 1 X 0 0 3 X
Yellowhead County 4 X 1 X 3 X 0 0 13 54,864
Source: Statistics Canada, 2011 Census of Agriculture. Prepared by Alberta Agriculture and Rural Development, Economics and Competitiveness Division, Statistics and Data Development Branch.
*Some respondents may have reported taps made on birch trees. X - Confidential. 0 - True zero or a value rounded to zero. Refer to census definitions and notes for more information.
Total Nursery Products Total Sod Total Area of Christmas Trees Taps on Maple Trees* Sales of Forest Products
55

Table 8.1: Nursery, Sod and Forest Products Grown for Sale, 2011
# Farms Acres # Farms Acres # Farms Acres # Farms # Taps # Farms Dollars
North Saskatchewan 188 X 18 X 26 X 4 X 91 X
Beaver County 3 73 0 0 1 X 0 0 6 X
Brazeau County 3 17 0 0 0 0 0 0 3 X
Camrose County 9 44 0 0 1 X 0 0 4 5,150
Clearwater County 11 134 2 X 3 20 0 0 9 51,399
Edmonton 12 174 0 0 0 0 0 0 0 0
Flagstaff County 0 0 0 0 0 0 0 0 1 X
Lamont County 7 146 0 0 0 0 0 0 3 X
Leduc County 34 800 2 X 5 15 0 0 6 26,134
Minburn County No. 27 2 X 0 0 0 0 0 0 2 X
Parkland County 22 376 2 X 2 X 0 0 10 49,393
Provost No. 52 0 0 0 0 0 0 2 X 1 X
Smoky Lake County 2 X 0 0 0 0 2 X 5 9,646
St. Paul County No. 19 1 X 0 0 0 0 0 0 7 X
Strathcona County 32 406 3 X 5 X 0 0 3 X
Sturgeon County 26 909 6 810 4 28 0 0 5 10,508
Thorhild County No. 7 3 X 0 0 0 0 0 0 9 81,517
Two Hills County No. 21 2 X 0 0 0 0 0 0 4 X
Vermilion River County 3 28 1 X 0 0 0 0 3 X
Wainwright No. 61 0 0 0 0 0 0 0 0 1 X
Wetaskiwin County No. 10 16 327 2 X 5 98 0 0 9 21,878
Red Deer 102 X 5 X 21 X 2 X 39 X
Kneehill County 7 X 0 0 0 0 0 0 3 X
Lacombe County 21 198 0 0 5 X 1 X 2 X
Mountain View County 34 555 1 X 3 13 1 X 5 X
Paintearth County No. 18 0 0 0 0 1 X 0 0 0 0
Ponoka County 10 89 1 X 1 X 0 0 9 X
Red Deer County 26 412 3 X 10 135 0 0 13 47,697
Special Area No. 2 2 X 0 0 0 0 0 0 2 X
Special Area No. 3 0 0 0 0 0 0 0 0 0 0
Special Area No. 4 0 0 0 0 0 0 0 0 0 0
Starland County 0 0 0 0 0 0 0 0 0 0
Stettler County No. 6 2 X 0 0 1 X 0 0 5 3,706
Source: Statistics Canada, 2011 Census of Agriculture. Prepared by Alberta Agriculture and Rural Development, Economics and Competitiveness Division, Statistics and Data Development Branch.
*Some respondents may have reported taps made on birch trees. X - Confidential. 0 - True zero or a value rounded to zero. Refer to census definitions and notes for more information.
Total Nursery Products Total Sod Total Area of Christmas Trees Taps on Maple Trees* Sales of Forest Products
56

Table 8.1: Nursery, Sod and Forest Products Grown for Sale, 2011
# Farms Acres # Farms Acres # Farms Acres # Farms # Taps # Farms Dollars
South Saskatchewan 151 X 12 X 28 X 1 X 35 X
Bighorn No. 8 0 0 0 0 0 0 0 0 1 X
Calgary 3 39 0 0 0 0 0 0 0 0
Cardston County 1 X 0 0 1 X 0 0 1 X
Cypress County 4 13 2 X 1 X 0 0 2 X
Foothills No. 31 49 620 2 X 10 40 0 0 2 X
Forty Mile County No. 8 2 X 1 X 0 0 0 0 0 0
Lethbridge County 11 401 2 X 4 12 0 0 4 X
Newell County No. 4 6 61 0 0 0 0 0 0 5 14,190
Pincher Creek No. 9 4 8 0 0 0 0 0 0 4 15,911
Ranchland No. 66 1 X 0 0 1 X 0 0 1 X
Rocky View County 40 1,065 2 X 9 X 1 X 8 X
Taber 5 44 2 X 0 0 0 0 3 X
Vulcan County 1 X 0 0 1 X 0 0 0 0
Warner County No. 5 5 63 0 0 0 0 0 0 0 0
Wheatland County 19 1,079 1 X 1 X 0 0 4 X
Source: Statistics Canada, 2011 Census of Agriculture. Prepared by Alberta Agriculture and Rural Development, Economics and Competitiveness Division, Statistics and Data Development Branch.
*Some respondents may have reported taps made on birch trees. X - Confidential. 0 - True zero or a value rounded to zero. Refer to census definitions and notes for more information.
Total Nursery Products Total Sod Total Area of Christmas Trees Taps on Maple Trees* Sales of Forest Products
57
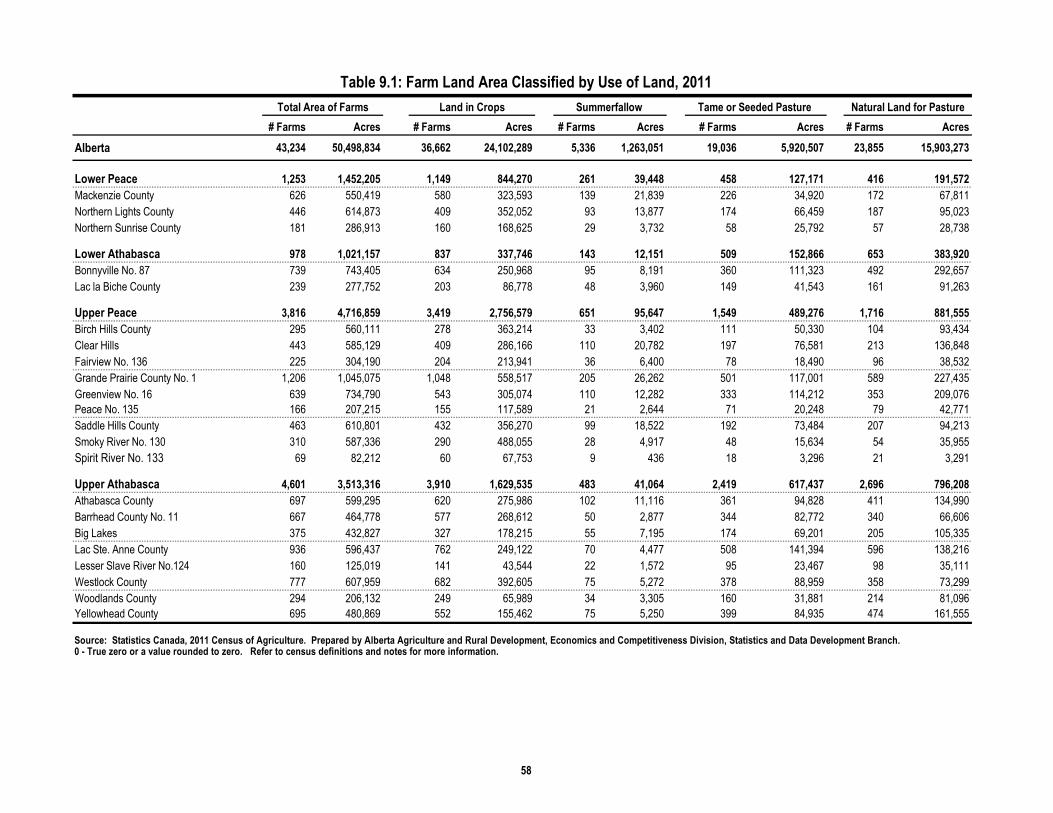
Table 9.1: Farm Land Area Classified by Use of Land, 2011
# Farms Acres # Farms Acres # Farms Acres # Farms Acres # Farms Acres
Alberta 43,234 50,498,834 36,662 24,102,289 5,336 1,263,051 19,036 5,920,507 23,855 15,903,273
Lower Peace 1,253 1,452,205 1,149 844,270 261 39,448 458 127,171 416 191,572
Mackenzie County 626 550,419 580 323,593 139 21,839 226 34,920 172 67,811
Northern Lights County 446 614,873 409 352,052 93 13,877 174 66,459 187 95,023
Northern Sunrise County 181 286,913 160 168,625 29 3,732 58 25,792 57 28,738
Lower Athabasca 978 1,021,157 837 337,746 143 12,151 509 152,866 653 383,920
Bonnyville No. 87 739 743,405 634 250,968 95 8,191 360 111,323 492 292,657
Lac la Biche County 239 277,752 203 86,778 48 3,960 149 41,543 161 91,263
Upper Peace 3,816 4,716,859 3,419 2,756,579 651 95,647 1,549 489,276 1,716 881,555
Birch Hills County 295 560,111 278 363,214 33 3,402 111 50,330 104 93,434
Clear Hills 443 585,129 409 286,166 110 20,782 197 76,581 213 136,848
Fairview No. 136 225 304,190 204 213,941 36 6,400 78 18,490 96 38,532
Grande Prairie County No. 1 1,206 1,045,075 1,048 558,517 205 26,262 501 117,001 589 227,435
Greenview No. 16 639 734,790 543 305,074 110 12,282 333 114,212 353 209,076
Peace No. 135 166 207,215 155 117,589 21 2,644 71 20,248 79 42,771
Saddle Hills County 463 610,801 432 356,270 99 18,522 192 73,484 207 94,213
Smoky River No. 130 310 587,336 290 488,055 28 4,917 48 15,634 54 35,955
Spirit River No. 133 69 82,212 60 67,753 9 436 18 3,296 21 3,291
Upper Athabasca 4,601 3,513,316 3,910 1,629,535 483 41,064 2,419 617,437 2,696 796,208
Athabasca County 697 599,295 620 275,986 102 11,116 361 94,828 411 134,990
Barrhead County No. 11 667 464,778 577 268,612 50 2,877 344 82,772 340 66,606
Big Lakes 375 432,827 327 178,215 55 7,195 174 69,201 205 105,335
Lac Ste. Anne County 936 596,437 762 249,122 70 4,477 508 141,394 596 138,216
Lesser Slave River No.124 160 125,019 141 43,544 22 1,572 95 23,467 98 35,111
Westlock County 777 607,959 682 392,605 75 5,272 378 88,959 358 73,299
Woodlands County 294 206,132 249 65,989 34 3,305 160 31,881 214 81,096
Yellowhead County 695 480,869 552 155,462 75 5,250 399 84,935 474 161,555
Source: Statistics Canada, 2011 Census of Agriculture. Prepared by Alberta Agriculture and Rural Development, Economics and Competitiveness Division, Statistics and Data Development Branch.0 - True zero or a value rounded to zero. Refer to census definitions and notes for more information.
Total Area of Farms Land in Crops Natural Land for PastureSummerfallow Tame or Seeded Pasture
58

Table 9.1: Farm Land Area Classified by Use of Land, 2011
# Farms Acres # Farms Acres # Farms Acres # Farms Acres # Farms Acres
North Saskatchewan 14,026 12,449,222 11,926 6,811,587 1,290 142,558 6,285 1,735,142 7,892 2,785,830
Beaver County 677 704,437 583 442,298 63 6,024 267 66,395 423 141,839
Brazeau County 487 289,674 402 91,345 34 3,874 270 67,652 313 84,838
Camrose County 999 820,147 886 581,794 59 4,421 396 76,754 476 95,750
Clearwater County 1,096 715,023 875 193,439 79 5,116 649 129,048 773 308,598
Edmonton 73 13,011 49 10,012 10 431 12 385 20 1,051
Flagstaff County 650 929,814 604 666,095 45 7,573 224 70,658 323 122,184
Lamont County 753 571,740 676 371,871 81 6,816 283 48,400 389 106,095
Leduc County 1,255 564,865 1,075 373,077 96 7,785 550 70,792 632 66,828
Minburn County No. 27 604 717,764 553 467,317 61 6,923 245 79,999 333 110,650
Parkland County 782 401,863 582 180,512 58 3,640 404 87,395 433 86,445
Provost No. 52 425 885,276 380 343,362 91 25,873 216 119,361 307 344,421
Smoky Lake County 454 497,649 400 205,180 67 6,084 194 71,667 277 172,126
St. Paul County No. 19 788 800,307 695 330,077 80 8,524 403 137,882 499 253,116
Strathcona County 658 220,184 478 150,138 37 2,958 226 19,555 344 33,002
Sturgeon County 823 467,464 675 362,846 60 3,454 300 35,029 320 37,929
Thorhild County No. 7 462 361,476 415 202,273 61 3,834 199 52,622 251 65,906
Two Hills County No. 21 554 647,951 493 376,027 69 8,824 232 110,269 319 115,059
Vermilion River County 1,029 1,363,540 892 728,723 121 17,242 495 231,200 617 291,485
Wainwright No. 61 501 865,627 425 432,157 59 9,875 234 128,172 289 235,088
Wetaskiwin County No. 10 956 611,410 788 303,044 59 3,287 486 131,907 554 113,420
Red Deer 8,645 11,197,827 7,301 4,737,855 1,134 412,363 4,063 1,413,585 5,329 4,127,161
Kneehill County 686 832,411 609 616,637 52 7,859 214 48,244 347 129,810
Lacombe County 1,045 668,102 845 405,150 60 2,911 493 99,310 542 111,801
Mountain View County 1,636 933,882 1,340 498,731 96 5,165 731 118,077 1,033 250,195
Paintearth County No. 18 420 772,990 380 351,297 57 14,295 226 121,294 314 249,929
Ponoka County 1,106 643,219 900 311,715 66 3,207 599 129,608 687 147,014
Red Deer County 1,531 973,968 1,267 559,816 94 8,114 734 149,266 842 190,486
Special Area No. 2 473 2,166,924 404 348,136 167 90,135 244 280,796 382 1,402,483
Special Area No. 3 464 1,616,411 427 496,069 294 211,488 188 149,399 306 714,942
Special Area No. 4 279 1,023,312 251 318,365 98 35,758 137 127,976 230 508,182
Starland County 300 578,749 274 380,270 78 20,531 114 46,289 171 108,127
Stettler County No. 6 705 987,859 604 451,669 72 12,900 383 143,326 475 314,192
Source: Statistics Canada, 2011 Census of Agriculture. Prepared by Alberta Agriculture and Rural Development, Economics and Competitiveness Division, Statistics and Data Development Branch.
0 - True zero or a value rounded to zero. Refer to census definitions and notes for more information.
Tame or Seeded Pasture Total Area of Farms Land in Crops Natural Land for PastureSummerfallow
59

Table 9.1: Farm Land Area Classified by Use of Land, 2011
# Farms Acres # Farms Acres # Farms Acres # Farms Acres # Farms Acres
South Saskatchewan 9,915 16,148,248 8,120 6,984,717 1,374 519,820 3,753 1,385,030 5,153 6,737,027
Bighorn No. 8 44 203,627 22 7,653 0 0 17 7,687 40 145,423
Calgary 55 31,062 30 25,634 3 400 11 1,263 20 2,150
Cardston County 497 842,994 413 418,242 31 10,108 201 65,700 334 321,855
Cypress County 827 2,335,795 674 467,946 181 77,375 342 190,446 513 1,555,681
Foothills No. 31 1,224 892,342 937 391,636 61 6,956 476 87,117 707 354,585
Forty Mile County No. 8 524 1,703,217 481 716,985 262 156,028 145 56,309 251 733,853
Lethbridge County 933 701,095 798 514,337 91 20,333 248 60,873 228 79,393
Newell County No. 4 717 1,458,695 596 363,551 69 25,487 359 166,762 322 879,841
Pincher Creek No. 9 448 800,070 342 248,996 19 2,225 151 115,389 360 395,169
Ranchland No. 66 78 465,727 19 5,307 0 0 20 5,882 68 449,094
Rocky View County 1,271 967,828 992 503,427 79 8,520 473 95,764 721 327,269
Taber 652 1,031,225 573 625,186 128 38,403 245 100,208 237 238,420
Vulcan County 603 1,354,405 546 885,191 154 69,337 210 92,015 268 276,110
Warner County No. 5 488 1,112,336 433 604,180 156 73,609 195 94,559 240 315,090
Wheatland County 782 1,121,462 675 769,153 87 21,162 292 81,398 402 178,707
Willow Creek No. 26 772 1,126,368 589 437,293 53 9,877 368 163,658 442 484,387
Source: Statistics Canada, 2011 Census of Agriculture. Prepared by Alberta Agriculture and Rural Development, Economics and Competitiveness Division, Statistics and Data Development Branch.
0 - True zero or a value rounded to zero. Refer to census definitions and notes for more information.
Land in CropsTotal Area of Farms Natural Land for PastureSummerfallow Tame or Seeded Pasture
60

Table 9.2: Farm Land Area Classified by Use of Land, 2011
# Farms Acres # Farms Acres
Alberta 16,097 2,209,124 30,864 1,100,590
Lower Peace 726 202,399 918 47,345
Mackenzie County 382 83,434 476 18,822
Northern Lights County 251 69,390 325 18,072
Northern Sunrise County 93 49,575 117 10,451
Lower Athabasca 504 111,750 713 22,724
Bonnyville No. 87 353 65,398 527 14,868
Lac la Biche County 151 46,352 186 7,856
Upper Peace 1,928 374,339 2,740 119,463
Birch Hills County 147 35,360 200 14,371
Clear Hills 235 48,421 322 16,331
Fairview No. 136 112 19,778 156 7,049
Grande Prairie County No. 1 550 85,686 891 30,174
Greenview No. 16 383 76,267 479 17,879
Peace No. 135 83 18,347 112 5,616
Saddle Hills County 241 51,729 325 16,583
Smoky River No. 130 145 33,461 206 9,314
Spirit River No. 133 32 5,290 49 2,146
Upper Athabasca 2,322 319,698 3,540 109,374
Athabasca County 369 64,376 522 17,999
Barrhead County No. 11 324 32,000 503 11,911
Big Lakes 225 48,373 288 24,508
Lac Ste. Anne County 436 45,778 723 17,450
Lesser Slave River No.124 88 18,428 118 2,897
Westlock County 359 32,217 600 15,607
Woodlands County 158 18,407 245 5,454
Yellowhead County 363 60,119 541 13,548
Source: Statistics Canada, 2011 Census of Agriculture. Prepared by Alberta Agriculture and Rural Development, Economics and Competitiveness Division, Statistics and Data Development Branch.X - Confidential. 0 - True zero or a value rounded to zero. Refer to census definitions and notes for more information.
Woodland and Wetland
Including Christmas Tree Area All Other Land
61

Table 9.2: Farm Land Area Classified by Use of Land, 2011
# Farms Acres # Farms Acres
North Saskatchewan 6,038 662,131 10,177 311,974
Beaver County 275 29,727 496 18,154
Brazeau County 242 34,382 367 7,583
Camrose County 466 36,595 758 24,833
Clearwater County 531 62,978 838 15,844
Edmonton 20 722 50 410
Flagstaff County 289 37,067 448 26,237
Lamont County 340 23,868 529 14,690
Leduc County 463 25,128 924 21,255
Minburn County No. 27 258 33,749 422 19,126
Parkland County 337 29,955 557 13,916
Provost No. 52 161 35,449 283 16,810
Smoky Lake County 204 32,821 322 9,771
St. Paul County No. 19 352 53,504 549 17,204
Strathcona County 274 8,439 494 6,092
Sturgeon County 290 14,147 587 14,059
Thorhild County No. 7 209 27,250 348 9,591
Two Hills County No. 21 248 25,339 378 12,433
Vermilion River County 438 65,642 712 29,248
Wainwright No. 61 218 40,795 364 19,540
Wetaskiwin County No. 10 423 44,574 751 15,178
Red Deer 2,920 291,322 6,233 215,541
Kneehill County 121 8,983 482 20,878
Lacombe County 404 28,116 772 20,814
Mountain View County 499 41,100 1,182 20,614
Paintearth County No. 18 144 22,518 294 13,657
Ponoka County 478 35,053 846 16,622
Red Deer County 655 39,925 1,127 26,361
Special Area No. 2 96 22,114 308 23,260
Special Area No. 3 106 18,857 317 25,656
Special Area No. 4 73 18,917 193 14,114
Starland County 80 11,222 203 12,310
Stettler County No. 6 264 44,517 509 21,255
Source: Statistics Canada, 2011 Census of Agriculture. Prepared by Alberta Agriculture and Rural Development, Economics and Competitiveness Division, Statistics and Data Development Branch.X - Confidential. 0 - True zero or a value rounded to zero. Refer to census definitions and notes for more information.
Woodland and Wetland
Including Christmas Tree Area All Other Land
62

Table 9.2: Farm Land Area Classified by Use of Land, 2011
# Farms Acres # Farms Acres
South Saskatchewan 1,659 247,485 6,543 274,169
Bighorn No. 8 17 42,550 27 314
Calgary 14 932 37 683
Cardston County 72 8,165 320 18,924
Cypress County 100 20,180 520 24,167
Foothills No. 31 286 34,395 849 17,653
Forty Mile County No. 8 75 21,857 346 18,185
Lethbridge County 85 4,425 618 21,734
Newell County No. 4 102 8,439 472 14,615
Pincher Creek No. 9 94 21,577 277 16,714
Ranchland No. 66 20 4,838 37 606
Rocky View County 253 17,091 876 15,757
Taber 67 6,998 438 22,010
Vulcan County 115 12,537 375 19,215
Warner County No. 5 56 8,782 319 16,116
Wheatland County 160 18,742 511 52,300
Willow Creek No. 26 143 15,977 521 15,176
Source: Statistics Canada, 2011 Census of Agriculture. Prepared by Alberta Agriculture and Rural Development, Economics and Competitiveness Division, Statistics and Data Development Branch.
X - Confidential. 0 - True zero or a value rounded to zero. Refer to census definitions and notes for more information.
Woodland and Wetland
Including Christmas Tree Area All Other Land
63

Table 10.1: Farms Classified by Area in Crops and Summerfallow, 2011
Total
# Farms
Under
10 Acres
10-69
Acres
70-129
Acres
130-179
Acres
180-239
Acres
240-399
Acres
400-559
Acres
560-759
Acres
760-1,119
Acres
1,120-1,999
Acres
2,000-3,499
Acres
3,500 Acres
and Over
Alberta 36,955 875 5,178 5,308 3,787 2,418 4,968 3,094 2,606 2,757 3,074 1,749 1,141
Lower Peace 1,168 14 87 128 125 87 172 147 103 98 117 52 38
Mackenzie County 587 5 44 73 63 49 88 78 59 48 56 17 7
Northern Lights County 417 4 33 39 49 23 64 50 34 34 45 25 17
Northern Sunrise County 164 5 10 16 13 15 20 19 10 16 16 10 14
Lower Athabasca 843 13 109 143 94 73 141 82 60 58 49 16 5
Bonnyville No. 87 638 12 84 116 71 53 99 61 45 42 40 12 3
Lac la Biche County 205 1 25 27 23 20 42 21 15 16 9 4 2
Upper Peace 3,471 27 283 534 309 238 504 316 285 285 344 210 136
Birch Hills County 278 0 21 29 23 10 27 23 20 33 37 33 22
Clear Hills 412 1 21 72 34 36 64 39 40 29 42 20 14
Fairview No. 136 205 0 14 27 15 14 25 10 17 16 34 18 15
Grande Prairie County No. 1 1,069 15 105 199 106 75 164 101 74 88 86 46 10
Greenview No. 16 557 2 62 101 56 53 97 55 47 33 27 14 10
Peace No. 135 158 3 14 19 15 14 22 12 15 12 17 9 6
Saddle Hills County 438 3 24 58 35 29 69 56 44 43 42 15 20
Smoky River No. 130 292 3 14 22 23 3 24 15 20 28 58 50 32
Spirit River No. 133 62 0 8 7 2 4 12 5 8 3 1 5 7
Upper Athabasca 3,951 89 623 652 396 335 614 375 294 260 195 81 37
Athabasca County 631 13 117 76 66 50 105 65 44 37 31 18 9
Barrhead County No. 11 581 17 69 88 53 37 94 65 54 42 48 8 6
Big Lakes 329 2 29 55 23 25 61 33 29 33 23 12 4
Lac Ste. Anne County 769 14 126 151 81 85 115 85 47 34 19 7 5
Lesser Slave River No.124 144 3 20 28 12 22 20 16 13 6 3 1 0
Westlock County 687 16 72 89 83 44 104 59 62 69 49 29 11
Woodlands County 251 10 49 53 27 25 29 23 14 12 9 0 0
Yellowhead County 559 14 141 112 51 47 86 29 31 27 13 6 2
Source: Statistics Canada, 2011 Census of Agriculture. Prepared by Alberta Agriculture and Rural Development, Economics and Competitiveness Division, Statistics and Data Development Branch.
0 - True zero or a value rounded to zero. Refer to census definitions and notes for more information.
64

Table 10.1: Farms Classified by Area in Crops and Summerfallow, 2011
Total
# Farms
Under
10 Acres
10-69
Acres
70-129
Acres
130-179
Acres
180-239
Acres
240-399
Acres
400-559
Acres
560-759
Acres
760-1,119
Acres
1,120-1,999
Acres
2,000-3,499
Acres
3,500 Acres
and Over
North Saskatchewan 12,009 302 1,781 1,835 1,290 807 1,647 995 831 856 912 498 255
Beaver County 588 5 73 88 47 27 93 45 29 53 65 47 16
Brazeau County 404 7 92 92 52 29 71 26 16 12 5 1 1
Camrose County 890 20 117 136 78 50 95 73 74 84 92 50 21
Clearwater County 880 10 180 226 129 68 141 56 35 25 6 3 1
Edmonton 50 11 17 8 2 1 8 0 0 0 1 2 0
Flagstaff County 607 13 35 43 41 33 64 57 56 73 97 54 41
Lamont County 679 19 90 93 81 62 99 64 40 46 44 28 13
Leduc County 1,085 33 206 199 145 89 151 85 54 51 45 23 4
Minburn County No. 27 555 9 50 59 48 35 77 51 49 56 57 41 23
Parkland County 590 40 146 105 53 36 81 38 36 24 17 10 4
Provost No. 52 381 3 21 20 26 26 58 39 48 34 59 32 15
Smoky Lake County 404 6 44 62 41 29 75 34 34 36 24 15 4
St. Paul County No. 19 699 6 80 100 70 70 119 76 50 61 43 15 9
Strathcona County 482 35 166 84 59 33 29 24 12 10 19 4 7
Sturgeon County 682 34 137 94 80 36 77 50 50 32 48 26 18
Thorhild County No. 7 418 7 40 63 55 29 75 37 45 30 23 9 5
Two Hills County No. 21 495 7 45 77 55 23 65 51 47 50 42 23 10
Vermilion River County 897 13 65 98 97 50 113 79 67 91 131 64 29
Wainwright No. 61 428 4 41 37 34 20 41 34 40 49 67 34 27
Wetaskiwin County No. 10 795 20 136 151 97 61 115 76 49 39 27 17 7
Red Deer 7,346 174 989 992 764 431 954 608 528 598 711 374 223
Kneehill County 611 13 73 48 59 29 58 47 51 50 91 59 33
Lacombe County 853 34 160 118 103 55 105 79 49 55 63 20 12
Mountain View County 1,348 37 278 270 148 97 154 90 90 79 74 22 9
Paintearth County No. 18 380 7 22 38 30 20 53 37 35 46 50 27 15
Ponoka County 906 25 160 148 105 72 162 81 47 61 33 7 5
Red Deer County 1,273 44 210 218 160 82 176 97 85 82 62 45 12
Special Area No. 2 407 2 16 29 33 15 56 42 39 50 70 30 25
Special Area No. 3 431 2 9 9 21 6 47 30 34 50 108 73 42
Special Area No. 4 253 1 2 11 9 5 30 19 29 37 54 34 22
Starland County 275 1 5 15 30 10 32 26 25 30 47 27 27
Stettler County No. 6 609 8 54 88 66 40 81 60 44 58 59 30 21
Source: Statistics Canada, 2011 Census of Agriculture. Prepared by Alberta Agriculture and Rural Development, Economics and Competitiveness Division, Statistics and Data Development Branch.
0 - True zero or a value rounded to zero. Refer to census definitions and notes for more information.
65
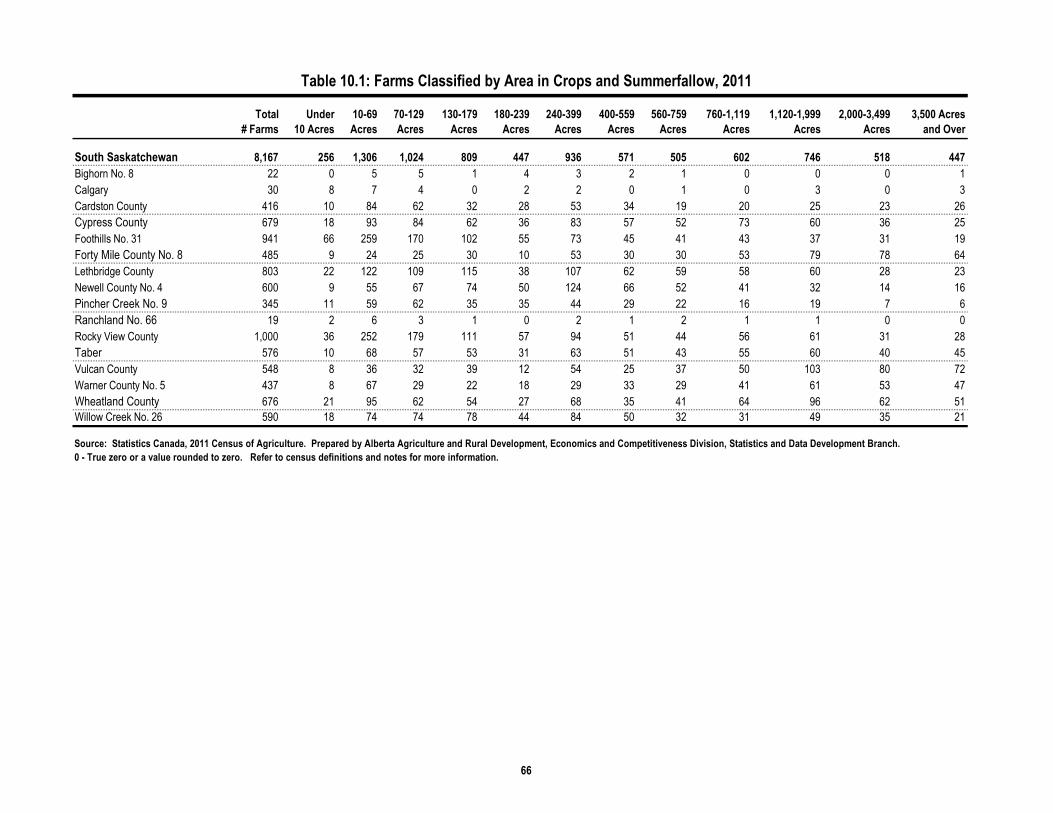
Table 10.1: Farms Classified by Area in Crops and Summerfallow, 2011
Total
# Farms
Under
10 Acres
10-69
Acres
70-129
Acres
130-179
Acres
180-239
Acres
240-399
Acres
400-559
Acres
560-759
Acres
760-1,119
Acres
1,120-1,999
Acres
2,000-3,499
Acres
3,500 Acres
and Over
South Saskatchewan 8,167 256 1,306 1,024 809 447 936 571 505 602 746 518 447
Bighorn No. 8 22 0 5 5 1 4 3 2 1 0 0 0 1
Calgary 30 8 7 4 0 2 2 0 1 0 3 0 3
Cardston County 416 10 84 62 32 28 53 34 19 20 25 23 26
Cypress County 679 18 93 84 62 36 83 57 52 73 60 36 25
Foothills No. 31 941 66 259 170 102 55 73 45 41 43 37 31 19
Forty Mile County No. 8 485 9 24 25 30 10 53 30 30 53 79 78 64
Lethbridge County 803 22 122 109 115 38 107 62 59 58 60 28 23
Newell County No. 4 600 9 55 67 74 50 124 66 52 41 32 14 16
Pincher Creek No. 9 345 11 59 62 35 35 44 29 22 16 19 7 6
Ranchland No. 66 19 2 6 3 1 0 2 1 2 1 1 0 0
Rocky View County 1,000 36 252 179 111 57 94 51 44 56 61 31 28
Taber 576 10 68 57 53 31 63 51 43 55 60 40 45
Vulcan County 548 8 36 32 39 12 54 25 37 50 103 80 72
Warner County No. 5 437 8 67 29 22 18 29 33 29 41 61 53 47
Wheatland County 676 21 95 62 54 27 68 35 41 64 96 62 51
Willow Creek No. 26 590 18 74 74 78 44 84 50 32 31 49 35 21
Source: Statistics Canada, 2011 Census of Agriculture. Prepared by Alberta Agriculture and Rural Development, Economics and Competitiveness Division, Statistics and Data Development Branch.
0 - True zero or a value rounded to zero. Refer to census definitions and notes for more information.
66

Table 11.1: Greenhouse Products Grown for Sale, May 10, 2011
# Farms Sq. feet # Farms Sq. feet # Farms Sq. feet # Farms Sq. feet # Farms Sq. feet
Alberta 441 12,986,416 441 12,861,869 297 4,785,343 185 6,281,029 68 1,795,497
Lower Peace 9 X 9 X 5 X 4 X 1 X
Mackenzie County 6 X 6 X 4 X 2 X 1 X
Northern Lights County 3 4,200 3 4,200 1 X 2 X 0 0
Northern Sunrise County 0 0 0 0 0 0 0 0 0 0
Lower Athabasca 8 448,904 8 448,904 5 X 4 X 2 X
Bonnyville No. 87 5 444,000 5 444,000 4 X 2 X 2 X
Lac la Biche County 3 4,904 3 4,904 1 X 2 X 0 0
Upper Peace 20 X 20 X 14 X 6 X 7 X
Birch Hills County 0 0 0 0 0 0 0 0 0 0
Clear Hills 1 X 1 X 0 0 1 X 0 0
Fairview No. 136 2 X 2 X 2 X 1 X 0 0
Grande Prairie County No. 1 10 389,418 10 388,218 6 X 2 X 4 X
Greenview No. 16 1 X 1 X 1 X 0 0 0 0
Peace No. 135 1 X 1 X 1 X 1 X 1 X
Saddle Hills County 3 6,497 3 5,529 2 X 0 0 1 X
Smoky River No. 130 1 X 1 X 1 X 0 0 1 X
Spirit River No. 133 1 X 1 X 1 X 1 X 0 0
Upper Athabasca 47 X 47 X 40 X 22 X 6 X
Athabasca County 7 43,040 7 41,240 6 34,275 4 6,965 0 0
Barrhead County No. 11 4 X 4 X 4 5,520 2 X 1 X
Big Lakes 2 X 2 X 1 X 1 X 0 0
Lac Ste. Anne County 13 106,923 13 106,923 10 96,164 4 1,694 4 9,065
Lesser Slave River No.124 1 X 1 X 1 X 1 X 0 0
Westlock County 6 33,710 6 33,710 5 29,950 4 X 1 X
Woodlands County 3 X 3 X 3 X 1 X 0 0
Yellowhead County 11 51,280 11 50,980 10 48,900 5 2,080 0 0
Source: Statistics Canada, 2011 Census of Agriculture. Prepared by Alberta Agriculture and Rural Development, Economics and Competitiveness Division, Statistics and Data Development Branch.
X - Confidential. 0 - True zero or a value rounded to zero. Refer to census definitions and notes for more information.
Total Greenhouse Area
Under Protection In Use Greenhouse Flowers Greenhouse Vegetables Other Greenhouse Products
67

Table 11.1: Greenhouse Products Grown for Sale, May 10, 2011
# Farms Sq. feet # Farms Sq. feet # Farms Sq. feet # Farms Sq. feet # Farms Sq. feet
North Saskatchewan 165 X 165 X 118 X 58 X 27 X
Beaver County 3 X 3 X 2 X 1 X 0 0
Brazeau County 4 17,400 4 17,400 3 X 1 X 0 0
Camrose County 10 97,136 10 97,136 8 X 2 X 3 30,910
Clearwater County 8 74,806 8 74,806 5 59,416 4 X 1 X
Edmonton 11 451,856 11 390,856 10 300,856 4 90,000 0 0
Flagstaff County 7 63,270 7 63,270 7 X 2 X 0 0
Lamont County 7 116,430 7 116,230 6 42,880 4 73,350 0 0
Leduc County 13 119,076 13 117,685 8 95,799 5 X 2 X
Minburn County No. 27 3 37,500 3 X 1 X 2 X 0 0
Parkland County 23 197,553 23 197,465 14 159,250 9 23,355 8 14,860
Provost No. 52 1 X 1 X 1 X 1 X 0 0
Smoky Lake County 6 452,720 6 452,720 2 X 2 X 2 X
St. Paul County No. 19 4 67,597 4 67,597 3 X 2 X 1 X
Strathcona County 23 506,071 23 500,756 14 429,030 6 12,776 6 58,950
Sturgeon County 18 358,904 18 344,904 15 317,454 7 X 1 X
Thorhild County No. 7 4 15,740 4 13,640 2 X 2 X 1 X
Two Hills County No. 21 1 X 1 X 0 0 1 X 0 0
Vermilion River County 5 54,800 5 54,800 5 54,800 0 0 0 0
Wainwright No. 61 5 28,775 5 26,775 4 X 1 X 0 0
Wetaskiwin County No. 10 9 79,308 9 79,308 8 X 2 X 2 X
Red Deer 73 X 73 X 54 X 25 X 10 X
Kneehill County 6 X 6 X 6 X 0 0 0 0
Lacombe County 17 1,169,345 17 1,168,245 8 X 6 720,089 5 X
Mountain View County 16 118,693 16 115,723 13 X 9 X 1 X
Paintearth County No. 18 4 45,000 4 45,000 4 X 0 0 1 X
Ponoka County 8 57,606 8 57,606 6 X 2 X 1 X
Red Deer County 19 675,800 19 675,710 14 637,870 8 X 1 X
Special Area No. 2 0 0 0 0 0 0 0 0 0 0
Special Area No. 3 1 X 1 X 1 X 0 0 0 0
Special Area No. 4 0 0 0 0 0 0 0 0 0 0
Starland County 0 0 0 0 0 0 0 0 0 0
Stettler County No. 6 2 X 2 X 2 X 0 0 1 X
Source: Statistics Canada, 2011 Census of Agriculture. Prepared by Alberta Agriculture and Rural Development, Economics and Competitiveness Division, Statistics and Data Development Branch.X - Confidential. 0 - True zero or a value rounded to zero. Refer to census definitions and notes for more information.
Total Greenhouse Area
Under Protection In Use Greenhouse Flowers Greenhouse Vegetables Other Greenhouse Products
68

Table 11.1: Greenhouse Products Grown for Sale, May 10, 2011
# Farms Sq. feet # Farms Sq. feet # Farms Sq. feet # Farms Sq. feet # Farms Sq. feet
South Saskatchewan 119 X 119 X 61 X 66 X 15 X
Bighorn No. 8 1 X 1 X 1 X 1 X 1 X
Calgary 5 4,972 5 4,972 4 X 1 X 0 0
Cardston County 3 4,236 3 4,236 2 X 2 X 0 0
Cypress County 34 4,809,927 34 4,795,927 2 X 30 X 2 X
Foothills No. 31 16 469,180 16 467,680 12 449,230 5 X 3 X
Forty Mile County No. 8 3 X 3 X 1 X 3 X 0 0
Lethbridge County 9 719,058 9 719,058 5 X 4 X 2 X
Newell County No. 4 4 14,744 4 X 3 1,120 1 X 0 0
Pincher Creek No. 9 3 41,750 3 40,250 3 X 1 X 0 0
Ranchland No. 66 1 X 1 X 1 X 1 X 0 0
Rocky View County 18 281,988 18 280,988 14 186,400 7 41,288 4 53,300
Taber 2 X 2 X 1 X 1 X 0 0
Vulcan County 5 X 5 X 3 X 1 X 1 X
Warner County No. 5 2 X 2 X 1 X 1 X 0 0
Wheatland County 11 183,746 11 183,746 7 X 6 X 2 X
Willow Creek No. 26 2 X 2 X 1 X 1 X 0 0
Source: Statistics Canada, 2011 Census of Agriculture. Prepared by Alberta Agriculture and Rural Development, Economics and Competitiveness Division, Statistics and Data Development Branch.
X - Confidential. 0 - True zero or a value rounded to zero. Refer to census definitions and notes for more information.
Greenhouse Vegetables Other Greenhouse Products
Total Greenhouse Area
Under Protection In Use Greenhouse Flowers
69

Table 11.2: Mushrooms Grown for Sale, 2011
# Farms Sq. Feet
Alberta 3 X
Lower Peace
Mackenzie County 0 0
Northern Lights County 0 0
Northern Sunrise County 0 0
Lower Athabasca 0 0
Bonnyville No. 87 0 0
Lac la Biche County 0 0
Upper Peace
Birch Hills County 0 0
Clear Hills 0 0
Fairview No. 136 0 0
Grande Prairie County No. 1 0 0
Greenview No. 16 0 0
Peace No. 135 0 0
Saddle Hills County 0 0
Smoky River No. 130 0 0
Spirit River No. 133 0 0
Upper Athabasca 0 0
Athabasca County 0 0
Barrhead County No. 11 0 0
Big Lakes 0 0
Lac Ste. Anne County 0 0
Lesser Slave River No.124 0 0
Westlock County 0 0
Woodlands County 0 0
Yellowhead County 0 0
Source: Statistics Canada, 2011 Census of Agriculture. Prepared by Alberta Agriculture and Rural Development, Economics and Competitiveness Division, Statistics and Data Development Branch.
X - Confidential. 0 - True zero or a value rounded to zero. Refer to census definitions and notes for more information.
Total Growing Area for Mushrooms
70

Table 11.2: Mushrooms Grown for Sale, 2011
# Farms Sq. Feet
North Saskatchewan 1 X
Beaver County 0 0
Brazeau County 0 0
Camrose County 0 0
Clearwater County 0 0
Edmonton 0 0
Flagstaff County 0 0
Lamont County 0 0
Leduc County 0 0
Minburn County No. 27 0 0
Parkland County 0 0
Provost No. 52 0 0
Smoky Lake County 0 0
St. Paul County No. 19 0 0
Strathcona County 1 X
Sturgeon County 0 0
Thorhild County No. 7 0 0
Two Hills County No. 21 0 0
Vermilion River County 0 0
Wainwright No. 61 0 0
Wetaskiwin County No. 10 0 0
Red Deer 1 X
Kneehill County 0 0
Lacombe County 1 X
Mountain View County 0 0
Paintearth County No. 18 0 0
Ponoka County 0 0
Red Deer County 0 0
Special Area No. 2 0 0
Special Area No. 3 0 0
Special Area No. 4 0 0
Starland County 0 0
Stettler County No. 6 0 0
Source: Statistics Canada, 2011 Census of Agriculture. Prepared by Alberta Agriculture and Rural Development, Economics and Competitiveness Division, Statistics and Data Development Branch.
X - Confidential. 0 - True zero or a value rounded to zero. Refer to census definitions and notes for more information.
Total Growing Area for Mushrooms
71

Table 11.2: Mushrooms Grown for Sale, 2011
# Farms Sq. Feet
South Saskatchewan 1 X
Bighorn No. 8 0 0
Calgary 0 0
Cardston County 0 0
Cypress County 0 0
Foothills No. 31 0 0
Forty Mile County No. 8 0 0
Lethbridge County 0 0
Newell County No. 4 0 0
Pincher Creek No. 9 0 0
Ranchland No. 66 0 0
Rocky View County 0 0
Taber 0 0
Vulcan County 0 0
Warner County No. 5 0 0
Wheatland County 0 0
Willow Creek No. 26 1 X
Source: Statistics Canada, 2011 Census of Agriculture. Prepared by Alberta Agriculture and Rural Development, Economics and Competitiveness Division, Statistics and Data Development Branch.
X - Confidential. 0 - True zero or a value rounded to zero. Refer to census definitions and notes for more information.
Total Growing Area for Mushrooms
72

Table 12.1: Use of Irrigation, Commercial Fertilizer, Herbicides, Insecticides, Fungicides and Lime, 2010
# Farms Acres # Farms Acres # Farms Acres # Farms Acres # Farms Acres # Farms Acres
Alberta 3,027 1,241,411 19,730 17,571,243 19,774 17,658,829 2,967 1,860,344 2,978 2,619,924 143 25,757
Lower Peace 5 X 601 594,054 603 585,750 277 152,922 76 X 2 X
Mackenzie County 1 X 330 221,117 336 226,294 205 86,489 41 24,893 1 X
Northern Lights County 2 X 177 239,201 177 226,652 39 40,477 32 58,390 1 X
Northern Sunrise County 2 X 94 133,736 90 132,804 33 25,956 3 X 0 0
Lower Athabasca 13 1,077 258 140,712 260 129,973 20 10,549 23 X 1 X
Bonnyville No. 87 9 1,061 207 109,191 204 98,188 15 9,720 22 X 0 0
Lac la Biche County 4 16 51 31,521 56 31,785 5 829 1 X 1 X
Upper Peace 32 X 1,598 1,985,097 1,648 1,959,761 408 380,048 112 96,486 12 X
Birch Hills County 1 X 179 301,855 186 297,046 69 60,643 20 20,519 1 X
Clear Hills 1 X 162 176,656 169 172,321 49 46,691 6 3,142 1 X
Fairview No. 136 2 X 128 176,047 133 176,568 54 52,074 5 5,082 1 X
Grande Prairie County No. 1 13 255 447 349,617 447 334,765 67 35,869 27 16,407 4 993
Greenview No. 16 4 215 137 145,054 157 147,659 21 18,642 9 10,120 0 0
Peace No. 135 8 1,003 81 86,130 83 90,133 19 14,366 12 5,816 1 X
Saddle Hills County 0 0 192 238,621 194 225,763 35 33,451 7 6,879 1 X
Smoky River No. 130 3 17 234 455,192 243 454,709 81 104,994 23 24,016 3 553
Spirit River No. 133 0 0 38 55,925 36 60,797 13 13,318 3 4,505 0 0
Upper Athabasca 34 X 1,521 896,565 1,572 820,523 179 63,158 200 X 18 X
Athabasca County 3 77 202 142,311 224 136,448 17 7,175 17 15,152 2 X
Barrhead County No. 11 6 14 322 186,832 317 173,684 49 11,038 70 45,584 2 X
Big Lakes 1 X 84 74,982 96 76,196 8 8,370 10 11,261 1 X
Lac Ste. Anne County 4 17 200 86,083 226 76,540 10 2,059 5 5,650 3 598
Lesser Slave River No.124 2 X 32 13,463 49 12,053 4 785 3 X 0 0
Westlock County 7 167 435 295,295 425 285,081 78 31,921 83 55,446 5 715
Woodlands County 3 636 70 23,811 59 17,452 5 1,106 4 820 0 0
Yellowhead County 8 270 176 73,788 176 43,069 8 704 8 1,978 5 141
Source: Statistics Canada, 2011 Census of Agriculture. Prepared by Alberta Agriculture and Rural Development, Economics and Competitiveness Division, Statistics and Data Development Branch.X - Confidential. 0 - True zero or a value rounded to zero. Refer to census definitions and notes for more information.
Irrigation Commercial Fertilizer Herbicides Insecticides Fungicides Lime
73

Table 12.1: Use of Irrigation, Commercial Fertilizer, Herbicides, Insecticides, Fungicides and Lime, 2010
# Farms Acres # Farms Acres # Farms Acres # Farms Acres # Farms Acres # Farms Acres
North Saskatchewan 144 X 6,495 5,089,187 6,527 5,020,612 521 263,794 846 652,934 47 X
Beaver County 6 545 375 374,276 365 363,775 27 14,203 61 34,405 2 X
Brazeau County 1 X 66 17,623 100 13,888 6 1,034 3 656 0 0
Camrose County 9 418 602 491,161 613 493,063 34 12,595 98 75,692 7 973
Clearwater County 2 X 374 91,838 314 55,935 8 2,807 12 5,750 2 X
Edmonton 5 80 19 7,786 24 8,007 6 245 5 184 0 0
Flagstaff County 4 X 482 609,889 469 600,477 48 26,719 80 81,513 1 X
Lamont County 5 X 432 301,116 443 303,115 30 16,843 57 43,589 4 21
Leduc County 17 185 499 229,687 538 221,579 47 7,143 57 27,232 0 0
Minburn County No. 27 6 X 404 398,016 392 402,047 31 10,273 60 48,104 3 150
Parkland County 14 344 212 86,585 242 87,740 27 6,010 31 9,353 4 82
Provost No. 52 1 X 249 256,685 246 259,395 8 10,923 24 28,805 0 0
Smoky Lake County 5 119 170 121,858 173 118,025 16 17,441 25 13,148 1 X
St. Paul County No. 19 4 119 277 177,131 261 172,489 23 14,639 28 22,824 3 X
Strathcona County 16 4,002 171 107,683 192 106,595 22 2,926 20 14,419 5 162
Sturgeon County 24 1,334 390 287,415 371 287,408 56 20,325 56 39,464 1 X
Thorhild County No. 7 5 690 214 127,758 205 123,375 20 10,237 16 13,433 1 X
Two Hills County No. 21 4 X 307 248,957 310 258,219 22 22,944 25 17,329 2 X
Vermilion River County 5 331 591 588,547 595 588,251 47 31,773 105 99,966 5 3,785
Wainwright No. 61 1 X 297 357,082 285 359,344 16 26,088 27 29,859 0 0
Wetaskiwin County No. 10 10 346 364 208,094 389 197,885 27 8,626 56 47,209 6 1,131
Red Deer 141 X 4,300 3,352,422 4,338 3,458,783 418 216,199 610 459,842 32 X
Kneehill County 17 7,133 463 549,668 472 552,808 55 29,570 123 103,532 2 X
Lacombe County 15 3,153 550 319,007 514 300,572 55 23,144 73 54,250 10 679
Mountain View County 19 2,558 812 392,140 722 337,108 99 31,201 101 52,895 2 X
Paintearth County No. 18 2 X 213 249,773 231 249,950 7 1,663 17 11,910 1 X
Ponoka County 8 1,466 537 213,746 482 192,121 34 8,159 54 29,621 4 392
Red Deer County 14 2,524 792 441,967 742 402,198 93 44,047 132 76,724 7 1,390
Special Area No. 2 42 16,858 110 125,517 176 180,836 11 9,378 22 30,363 1 X
Special Area No. 3 12 6,754 189 251,903 288 389,011 18 10,861 22 27,946 1 X
Special Area No. 4 0 0 137 180,960 170 202,760 4 2,280 6 6,180 1 X
Starland County 7 473 200 320,518 208 332,314 19 26,237 38 41,429 0 0
Stettler County No. 6 5 58 297 307,223 333 319,105 23 29,659 22 24,992 3 X
Source: Statistics Canada, 2011 Census of Agriculture. Prepared by Alberta Agriculture and Rural Development, Economics and Competitiveness Division, Statistics and Data Development Branch.X - Confidential. 0 - True zero or a value rounded to zero. Refer to census definitions and notes for more information.
Irrigation Commercial Fertilizer Herbicides Insecticides LimeFungicides
74

Table 12.1: Use of Irrigation, Commercial Fertilizer, Herbicides, Insecticides, Fungicides and Lime, 2010
# Farms Acres # Farms Acres # Farms Acres # Farms Acres # Farms Acres # Farms Acres
South Saskatchewan 2,658 X 4,957 5,513,206 4,826 5,683,427 1,144 X 1,111 X 31 X
Bighorn No. 8 1 X 11 3,830 6 2,618 0 0 1 X 0 0
Calgary 7 X 11 24,250 11 23,021 3 X 2 X 1 X
Cardston County 111 33,590 233 327,229 186 328,716 47 41,815 24 35,976 0 0
Cypress County 206 69,187 301 281,051 311 324,113 41 29,422 39 66,402 1 X
Foothills No. 31 41 5,360 454 283,410 368 257,052 39 X 34 X 4 165
Forty Mile County No. 8 171 101,341 353 558,755 363 664,168 109 73,999 124 125,276 2 X
Lethbridge County 558 215,201 538 386,176 554 428,944 153 48,860 142 84,554 2 X
Newell County No. 4 527 218,444 391 265,002 384 263,901 149 43,210 149 75,485 3 161
Pincher Creek No. 9 32 10,996 176 181,931 164 167,390 13 32,077 9 3,671 2 X
Ranchland No. 66 0 0 9 3,027 14 1,197 2 X 1 X 0 0
Rocky View County 52 7,253 533 392,839 515 384,060 89 52,526 76 75,189 7 3,168
Taber 463 309,381 434 506,003 434 520,943 200 146,603 193 197,563 2 X
Vulcan County 118 80,721 409 777,316 416 805,639 109 97,640 93 151,577 4 X
Warner County No. 5 118 43,401 293 504,430 294 514,166 59 61,405 59 95,161 0 0
Wheatland County 155 46,822 438 674,264 459 674,887 71 65,367 120 173,908 3 X
Willow Creek No. 26 98 37,330 373 343,693 347 322,612 60 47,372 45 43,758 0 0
Source: Statistics Canada, 2011 Census of Agriculture. Prepared by Alberta Agriculture and Rural Development, Economics and Competitiveness Division, Statistics and Data Development Branch.
X - Confidential. 0 - True zero or a value rounded to zero. Refer to census definitions and notes for more information.
Irrigation Commercial Fertilizer Herbicides LimeFungicidesInsecticides
75

Table 13.1: Farms Producing or Using Manure, 2010
On Farm
On Land
Rented to Others
# Farms # Farms # Farms # Farms # Farms # Farms
Alberta 24,482 21,494 599 1,064 448 5,611
Lower Peace 468 377 4 31 3 153
Mackenzie County 223 170 2 12 0 81
Northern Lights County 176 151 2 14 1 47
Northern Sunrise County 69 56 0 5 2 25
Lower Athabasca 584 488 3 17 1 175
Bonnyville No. 87 447 375 3 9 0 129
Lac la Biche County 137 113 0 8 1 46
Upper Peace 1,663 1,422 22 63 10 502
Birch Hills County 106 93 1 5 0 28
Clear Hills 212 178 4 6 0 72
Fairview No. 136 86 75 2 3 0 24
Grande Prairie County No. 1 568 494 8 23 3 161
Greenview No. 16 355 301 4 15 2 119
Peace No. 135 71 61 1 4 1 22
Saddle Hills County 192 162 2 3 1 58
Smoky River No. 130 50 39 0 4 2 13
Spirit River No. 133 23 19 0 0 1 5
Upper Athabasca 2,778 2,446 55 86 37 684
Athabasca County 382 333 7 14 3 103
Barrhead County No. 11 420 383 10 15 14 80
Big Lakes 205 171 5 8 1 67
Lac Ste. Anne County 605 521 15 15 5 166
Lesser Slave River No.124 103 89 1 3 0 26
Westlock County 435 387 10 15 11 91
Woodlands County 186 167 1 4 1 45
Yellowhead County 442 395 6 12 2 106
Source: Statistics Canada, 2011 Census of Agriculture. Prepared by Alberta Agriculture and Rural Development, Economics and Competitiveness Division, Statistics and Data Development Branch.
(1) Other manure on the operation, including composted, dried, processed, stored, etc. 0 - True zero or a value rounded to zero. Refer to census definitions and notes for more information.
Total Farms Producing
or Using Manure
Manure Applied Manure Sold
or Given
to Others
Manure Bought
or Received
From Others Other Manure (1)
76

Table 13.1: Farms Producing or Using Manure, 2010
On Farm
On Land
Rented to Others
# Farms # Farms # Farms # Farms # Farms # Farms
North Saskatchewan 7,753 6,776 207 287 87 1,825
Beaver County 366 318 9 15 2 80
Brazeau County 317 266 4 6 1 104
Camrose County 501 443 26 24 10 101
Clearwater County 748 662 15 22 9 191
Edmonton 15 13 0 3 0 1
Flagstaff County 315 283 10 6 3 55
Lamont County 327 276 10 5 0 83
Leduc County 677 586 10 30 10 182
Minburn County No. 27 287 257 6 8 0 67
Parkland County 483 424 8 22 4 118
Provost No. 52 274 256 5 10 6 38
Smoky Lake County 251 220 4 7 2 66
St. Paul County No. 19 462 404 15 9 1 97
Strathcona County 350 307 6 29 4 89
Sturgeon County 363 299 21 30 6 99
Thorhild County No. 7 231 195 4 2 2 62
Two Hills County No. 21 286 243 10 7 2 77
Vermilion River County 617 563 19 18 10 115
Wainwright No. 61 296 258 10 12 7 56
Wetaskiwin County No. 10 587 503 15 22 8 144
Red Deer 5,481 4,911 152 246 116 1,116
Kneehill County 359 303 20 37 14 69
Lacombe County 660 588 15 48 26 134
Mountain View County 1,024 920 32 39 14 202
Paintearth County No. 18 285 248 8 4 1 64
Ponoka County 792 722 20 32 26 153
Red Deer County 935 845 35 43 20 195
Special Area No. 2 340 311 4 11 4 85
Special Area No. 3 253 230 3 10 1 52
Special Area No. 4 199 184 1 3 1 36
Starland County 150 134 4 6 0 33
Stettler County No. 6 484 426 10 13 9 93
Source: Statistics Canada, 2011 Census of Agriculture. Prepared by Alberta Agriculture and Rural Development, Economics and Competitiveness Division, Statistics and Data Development Branch.
(1) Other manure on the operation, including composted, dried, processed, stored, etc. 0 - True zero or a value rounded to zero. Refer to census definitions and notes for more information.
Total Farms Producing
or Using Manure
Manure Applied Manure Sold
or Given
to Others
Manure Bought
or Received
From Others Other Manure (1)
77

Table 13.1: Farms Producing or Using Manure, 2010
On Farm
On Land
Rented to Others
# Farms # Farms # Farms # Farms # Farms # Farms
South Saskatchewan 5,755 5,074 156 334 194 1,156
Bighorn No. 8 32 27 2 3 0 5
Calgary 23 19 1 2 3 5
Cardston County 333 306 5 7 5 65
Cypress County 455 402 14 17 4 94
Foothills No. 31 751 682 22 28 22 146
Forty Mile County No. 8 210 181 6 13 2 50
Lethbridge County 533 462 15 66 57 82
Newell County No. 4 420 363 12 18 14 88
Pincher Creek No. 9 335 304 7 16 4 61
Ranchland No. 66 46 40 1 1 0 10
Rocky View County 797 703 22 58 19 168
Taber 335 278 12 27 23 80
Vulcan County 289 252 8 14 5 63
Warner County No. 5 271 232 5 16 5 64
Wheatland County 401 354 10 26 13 79
Willow Creek No. 26 524 469 14 22 18 96
Source: Statistics Canada, 2011 Census of Agriculture. Prepared by Alberta Agriculture and Rural Development, Economics and Competitiveness Division, Statistics and Data Development Branch.
(1) Other manure on the operation, including composted, dried, processed, stored, etc. 0 - True zero or a value rounded to zero. Refer to census definitions and notes for more information.
Total Farms Producing
or Using Manure
Manure Applied Manure Sold
or Given
to Others
Manure Bought
or Received
From Others Other Manure (1)
78

Table 13.2: Manure Application Methods, 2010
# Farms Acres # Farms Acres # Farms Acres # Farms Acres # Farms Acres
Alberta 17,661 10,190,515 6,835 681,328 4,049 320,774 721 199,173 249 49,864
Lower Peace 330 131,860 89 5,968 49 X 4 X 3 X
Mackenzie County 146 33,014 40 1,471 27 742 0 0 1 X
Northern Lights County 136 79,170 37 4,047 20 2,061 1 X 1 X
Northern Sunrise County 48 19,676 12 450 2 X 3 X 1 X
Lower Athabasca 412 178,163 129 8,503 90 9,059 5 X 1 X
Bonnyville No. 87 320 135,940 98 6,235 69 7,390 3 1,310 0 0
Lac la Biche County 92 42,223 31 2,268 21 1,669 2 X 1 X
Upper Peace 1,278 535,987 298 X 197 15,246 23 X 7 X
Birch Hills County 82 30,772 16 2,305 13 701 5 1,240 0 0
Clear Hills 164 81,180 34 2,264 27 3,208 0 0 1 X
Fairview No. 136 66 29,653 16 1,495 12 2,107 3 X 0 0
Grande Prairie County No. 1 434 135,989 116 8,962 67 3,918 5 755 2 X
Greenview No. 16 274 125,694 66 3,879 40 1,929 4 957 1 X
Peace No. 135 58 28,184 13 1,260 3 110 0 0 0 0
Saddle Hills County 149 82,340 27 2,521 27 2,846 3 X 3 176
Smoky River No. 130 32 18,416 8 X 4 285 3 1,420 0 0
Spirit River No. 133 19 3,759 2 X 4 142 0 0 0 0
Upper Athabasca 2,053 670,810 791 66,459 408 X 73 X 26 X
Athabasca County 281 82,100 109 7,253 52 2,530 4 883 0 0
Barrhead County No. 11 290 67,132 155 13,825 51 4,344 35 8,525 19 3,203
Big Lakes 152 90,034 29 6,275 21 1,754 1 X 1 X
Lac Ste. Anne County 443 159,067 165 11,829 115 6,107 8 1,274 1 X
Lesser Slave River No.124 84 27,795 18 1,440 10 X 0 0 1 X
Westlock County 301 74,001 156 12,600 81 5,750 15 3,928 1 X
Woodlands County 150 59,495 41 2,741 28 1,491 4 580 1 X
Yellowhead County 352 111,186 118 10,496 50 2,164 6 1,235 2 X
Source: Statistics Canada, 2011 Census of Agriculture. Prepared by Alberta Agriculture and Rural Development, Economics and Competitiveness Division, Statistics and Data Development Branch.
X - Confidential. 0 - True zero or a value rounded to zero. Refer to census definitions and notes for more information.
Manure Spread Naturally
by Grazing Animals
Incorporated
Into Soil Not Incorporated
Solid or Composted Manure Liquid Manure
Not Incorporated
Injected or
Incorporated Into Soil
79

Table 13.2: Manure Application Methods, 2010
# Farms Acres # Farms Acres # Farms Acres # Farms Acres # Farms Acres
North Saskatchewan 5,628 2,158,243 2,222 169,239 1,324 X 161 X 72 X
Beaver County 264 84,504 101 6,627 64 5,875 8 1,575 3 465
Brazeau County 247 65,918 53 2,821 36 X 2 X 3 468
Camrose County 348 94,929 177 12,891 118 7,215 10 2,150 6 566
Clearwater County 590 204,024 180 10,267 122 6,408 19 3,970 13 1,483
Edmonton 11 350 4 60 1 X 0 0 0 0
Flagstaff County 227 97,041 104 11,355 58 5,249 7 1,823 3 X
Lamont County 220 44,701 104 5,657 44 2,097 1 X 4 78
Leduc County 441 58,687 233 15,599 101 6,101 29 4,658 11 1,597
Minburn County No. 27 216 102,703 84 8,689 56 4,483 5 1,241 3 520
Parkland County 363 85,427 133 8,935 85 5,586 8 3,011 5 640
Provost No. 52 212 206,544 80 9,576 46 4,315 6 906 1 X
Smoky Lake County 179 108,547 80 4,708 39 3,149 4 347 0 0
St. Paul County No. 19 337 119,261 134 11,070 73 5,748 3 X 4 624
Strathcona County 262 23,584 90 3,111 68 2,650 5 X 3 X
Sturgeon County 246 43,629 111 8,304 47 2,086 11 2,928 2 X
Thorhild County No. 7 165 64,581 72 4,272 36 2,252 3 895 1 X
Two Hills County No. 21 202 101,994 80 8,150 55 2,821 2 X 2 X
Vermilion River County 481 300,620 154 15,675 135 14,203 9 1,329 1 X
Wainwright No. 61 208 211,665 83 8,412 47 4,463 17 6,600 1 X
Wetaskiwin County No. 10 409 139,534 165 13,060 93 6,543 12 2,652 6 516
Red Deer 3,977 2,609,639 1,719 161,091 957 97,646 250 X 73 X
Kneehill County 232 106,182 98 8,680 93 14,338 11 5,833 3 255
Lacombe County 459 119,966 197 15,677 109 9,763 67 16,593 16 3,181
Mountain View County 758 173,314 334 25,547 178 14,683 27 4,731 7 727
Paintearth County No. 18 215 187,427 73 7,310 45 4,346 6 1,202 3 3,200
Ponoka County 573 141,946 276 27,769 115 12,420 64 16,365 22 3,424
Red Deer County 681 163,629 301 25,860 177 13,532 40 8,133 13 1,914
Special Area No. 2 262 747,214 97 12,023 56 5,062 6 4,489 2 X
Special Area No. 3 189 381,220 77 9,948 42 3,858 3 X 1 X
Special Area No. 4 150 296,094 75 10,552 30 2,949 4 X 0 0
Starland County 113 79,152 46 2,703 25 3,065 5 2,827 2 X
Stettler County No. 6 345 213,495 145 15,022 87 13,630 17 3,630 4 2,200
Source: Statistics Canada, 2011 Census of Agriculture. Prepared by Alberta Agriculture and Rural Development, Economics and Competitiveness Division, Statistics and Data Development Branch.
X - Confidential. 0 - True zero or a value rounded to zero. Refer to census definitions and notes for more information.
Not Incorporated Not Incorporated
Manure Spread Naturally
by Grazing Animals
Incorporated
Into Soil
Injected or
Incorporated Into Soil
Solid or Composted Manure Liquid Manure
80

Table 13.2: Manure Application Methods, 2010
# Farms Acres # Farms Acres # Farms Acres # Farms Acres # Farms Acres
South Saskatchewan 3,983 3,905,813 1,587 X 1,024 78,688 205 72,085 67 X
Bighorn No. 8 25 28,010 3 X 6 139 0 0 0 0
Calgary 12 3,733 7 782 4 70 0 0 0 0
Cardston County 252 256,581 94 9,495 66 4,180 11 4,734 5 600
Cypress County 339 831,682 70 15,818 80 6,672 7 3,332 1 X
Foothills No. 31 578 309,430 177 19,096 147 8,732 4 1,790 1 X
Forty Mile County No. 8 132 419,903 62 9,304 34 3,293 12 5,626 2 X
Lethbridge County 226 90,062 254 48,603 88 5,424 59 8,843 24 3,632
Newell County No. 4 301 243,383 120 14,649 51 4,403 9 2,560 3 X
Pincher Creek No. 9 270 317,090 65 6,750 58 4,264 3 1,500 0 0
Ranchland No. 66 35 86,664 7 X 9 372 0 0 0 0
Rocky View County 596 235,584 202 19,206 155 11,010 13 3,875 5 X
Taber 185 141,785 132 29,339 36 3,326 24 6,977 8 10,679
Vulcan County 180 123,618 80 15,720 62 6,498 21 10,038 2 X
Warner County No. 5 176 216,772 80 18,683 38 4,762 19 12,940 2 X
Wheatland County 278 131,433 107 15,826 75 6,351 10 4,890 5 763
Willow Creek No. 26 398 470,083 127 21,611 115 9,192 13 4,980 9 1,275
Source: Statistics Canada, 2011 Census of Agriculture. Prepared by Alberta Agriculture and Rural Development, Economics and Competitiveness Division, Statistics and Data Development Branch.
X - Confidential. 0 - True zero or a value rounded to zero. Refer to census definitions and notes for more information.
Not Incorporated
Injected or
Incorporated Into Soil Not Incorporated
Incorporated
Into Soil
Manure Spread Naturally
by Grazing Animals
Solid or Composted Manure Liquid Manure
81

Table 14.1: Farms Classified by Conservation Practices and Features, 2011
Crop
Rotation
In-field Winter
Grazing or Feeding
Rotational
Grazing
Plowing Down
Green Crops
Winter
Cover Crops
Nutrient Management
Planning
Windbreaks or
Shelterbelts
Buffer Zones Around
Water Bodies
Alberta 43,234 24,455 11,118 15,195 2,333 1,173 7,268 16,985 8,236
Lower Peace 1,253 871 168 280 152 21 206 583 289
Mackenzie County 626 480 55 113 102 10 103 324 132
Northern Lights County 446 284 83 125 34 7 79 190 117
Northern Sunrise County 181 107 30 42 16 4 24 69 40
Lower Athabasca 978 457 275 403 58 15 112 409 195
Bonnyville No. 87 739 337 212 299 38 8 78 309 140
Lac la Biche County 239 120 63 104 20 7 34 100 55
Upper Peace 3,816 2,256 739 1,155 357 92 555 1,663 848
Birch Hills County 295 215 41 69 16 6 60 143 67
Clear Hills 443 276 86 140 44 10 64 191 101
Fairview No. 136 225 161 31 59 11 5 40 87 54
Grande Prairie County No. 1 1,206 609 243 399 123 26 152 533 269
Greenview No. 16 639 302 175 263 71 18 68 302 175
Peace No. 135 166 92 40 40 6 0 30 63 28
Saddle Hills County 463 302 93 136 69 17 71 217 102
Smoky River No. 130 310 254 21 33 13 6 57 98 37
Spirit River No. 133 69 45 9 16 4 4 13 29 15
Upper Athabasca 4,601 2,624 1,080 1,788 445 97 707 2,055 1,085
Athabasca County 697 429 145 256 77 16 77 299 153
Barrhead County No. 11 667 451 129 231 49 14 145 300 153
Big Lakes 375 173 77 127 48 9 60 182 125
Lac Ste. Anne County 936 482 232 415 85 19 110 383 187
Lesser Slave River No.124 160 81 55 72 16 3 26 72 45
Westlock County 777 555 154 251 63 15 164 367 174
Woodlands County 294 140 71 124 31 5 33 131 77
Yellowhead County 695 313 217 312 76 16 92 321 171
Source: Statistics Canada, 2011 Census of Agriculture. Prepared by Alberta Agriculture and Rural Development, Economics and Competitiveness Division, Statistics and Data Development Branch.
0 - True zero or a value rounded to zero. Refer to census definitions and notes for more information.
Number of Farms ReportingTotal
Farms
82

Table 14.1: Farms Classified by Conservation Practices and Features, 2011
Crop
Rotation
In-field Winter
Grazing or Feeding
Rotational
Grazing
Plowing Down
Green Crops
Winter
Cover Crops
Nutrient Management
Planning
Windbreaks or
Shelterbelts
Buffer Zones Around
Water Bodies
North Saskatchewan 14,026 8,197 3,213 4,814 738 243 2,104 5,684 2,589
Beaver County 677 438 142 215 20 8 118 249 134
Brazeau County 487 212 138 248 55 13 49 216 115
Camrose County 999 691 172 279 32 11 210 433 189
Clearwater County 1,096 494 378 538 105 24 152 503 250
Edmonton 73 26 2 6 7 0 5 18 1
Flagstaff County 650 503 140 154 6 11 128 282 106
Lamont County 753 516 117 188 27 12 115 270 105
Leduc County 1,255 775 219 390 102 16 191 494 193
Minburn County No. 27 604 443 125 174 13 7 110 260 118
Parkland County 782 345 165 278 58 8 78 281 118
Provost No. 52 425 268 140 162 8 20 78 169 79
Smoky Lake County 454 268 105 166 34 8 60 168 77
St. Paul County No. 19 788 414 194 292 43 15 94 284 167
Strathcona County 658 222 126 221 21 3 50 248 105
Sturgeon County 823 472 131 216 45 11 116 328 132
Thorhild County No. 7 462 308 90 146 55 7 54 195 76
Two Hills County No. 21 554 347 112 165 15 10 60 193 92
Vermilion River County 1,029 631 313 399 21 25 195 428 227
Wainwright No. 61 501 294 146 182 5 8 96 202 78
Wetaskiwin County No. 10 956 530 258 395 66 26 145 463 227
Red Deer 8,645 4,995 2,668 3,408 340 266 1,660 3,678 1,752
Kneehill County 686 479 155 167 5 12 138 210 102
Lacombe County 1,045 585 280 412 32 25 211 489 227
Mountain View County 1,636 896 511 680 81 49 285 688 339
Paintearth County No. 18 420 245 181 178 11 26 86 200 86
Ponoka County 1,106 625 353 508 79 29 242 542 252
Red Deer County 1,531 854 434 638 70 32 304 739 371
Special Area No. 2 473 232 183 224 13 26 67 163 77
Special Area No. 3 464 319 136 139 11 21 83 129 78
Special Area No. 4 279 195 116 115 10 16 66 112 37
Starland County 300 218 76 77 9 9 61 92 56
Stettler County No. 6 705 347 243 270 19 21 117 314 127
Source: Statistics Canada, 2011 Census of Agriculture. Prepared by Alberta Agriculture and Rural Development, Economics and Competitiveness Division, Statistics and Data Development Branch.
0 - True zero or a value rounded to zero. Refer to census definitions and notes for more information.
Number of Farms ReportingTotal
Farms
83

Table 14.1: Farms Classified by Conservation Practices and Features, 2011
Crop
Rotation
In-field Winter
Grazing or Feeding
Rotational
Grazing
Plowing Down
Green Crops
Winter
Cover Crops
Nutrient Management
Planning
Windbreaks or
Shelterbelts
Buffer Zones Around
Water Bodies
South Saskatchewan 9,915 5,055 2,975 3,347 243 439 1,924 2,913 1,478
Bighorn No. 8 44 5 19 24 1 0 8 20 15
Calgary 55 14 15 9 2 2 8 19 6
Cardston County 497 217 193 216 11 31 78 143 58
Cypress County 827 381 250 279 20 40 98 223 98
Foothills No. 31 1,224 352 458 537 30 34 169 410 204
Forty Mile County No. 8 524 412 87 109 17 40 114 107 56
Lethbridge County 933 604 151 167 29 50 247 178 96
Newell County No. 4 717 449 251 250 24 27 180 214 105
Pincher Creek No. 9 448 156 199 239 15 18 78 189 118
Ranchland No. 66 78 8 23 41 0 2 7 22 15
Rocky View County 1,271 479 443 497 26 39 233 492 215
Taber 652 485 133 119 24 64 154 113 81
Vulcan County 603 431 145 145 9 20 136 151 88
Warner County No. 5 488 311 139 129 5 15 110 112 64
Wheatland County 782 450 167 223 12 17 158 239 114
Willow Creek No. 26 772 301 302 363 18 40 146 281 145
Source: Statistics Canada, 2011 Census of Agriculture. Prepared by Alberta Agriculture and Rural Development, Economics and Competitiveness Division, Statistics and Data Development Branch.
0 - True zero or a value rounded to zero. Refer to census definitions and notes for more information.
Number of Farms ReportingTotal
Farms
84

Table 15.1: Tillage Practices Used to Prepare Land for Seeding, 2011
# Farms Acres # Farms Acres # Farms Acres # Farms Acres # Farms Acres
Alberta 26,341 19,945,813 10,100 2,543,229 7,884 4,477,959 11,528 12,924,625 11,164 2,236,814
Lower Peace 917 698,413 353 80,613 250 205,889 409 411,911 209 26,607
Mackenzie County 503 282,966 184 46,030 129 53,319 243 183,617 109 10,573
Northern Lights County 300 270,380 130 26,139 77 88,254 117 155,987 81 11,673
Northern Sunrise County 114 145,067 39 8,444 44 64,316 49 72,307 19 4,361
Lower Athabasca 498 181,335 256 44,900 96 27,511 178 108,924 278 45,787
Bonnyville No. 87 364 133,740 187 34,919 74 20,341 127 78,480 204 32,020
Lac la Biche County 134 47,595 69 9,981 22 7,170 51 30,444 74 13,767
Upper Peace 2,421 2,226,169 1,001 264,821 769 667,995 922 1,293,353 689 141,317
Birch Hills County 221 326,955 67 17,031 81 110,707 110 199,217 53 11,663
Clear Hills 287 219,438 134 47,368 88 65,789 93 106,281 101 23,172
Fairview No. 136 173 193,764 41 10,079 56 45,512 96 138,173 33 4,606
Grande Prairie County No. 1 659 383,403 299 61,213 228 155,131 203 167,059 215 34,823
Greenview No. 16 350 201,195 218 52,597 96 86,040 68 62,558 127 28,284
Peace No. 135 105 97,206 32 7,130 34 27,872 53 62,204 34 6,891
Saddle Hills County 320 268,824 157 51,399 106 88,605 95 128,820 80 20,580
Smoky River No. 130 257 473,000 37 15,063 67 74,796 180 383,141 31 8,200
Spirit River No. 133 49 62,384 16 2,941 13 13,543 24 45,900 15 3,098
Upper Athabasca 2,712 1,111,117 1,566 304,554 796 364,327 677 442,236 1,332 202,368
Athabasca County 416 186,954 235 42,949 114 49,824 116 94,181 197 26,224
Barrhead County No. 11 461 214,758 232 56,699 179 88,262 120 69,797 249 40,215
Big Lakes 198 108,272 100 19,059 58 26,787 67 62,426 79 16,494
Lac Ste. Anne County 477 125,271 302 48,192 111 31,632 98 45,447 248 31,998
Lesser Slave River No.124 84 20,764 58 8,447 22 5,692 14 6,625 46 6,145
Westlock County 561 334,805 266 67,600 203 135,533 175 131,672 286 52,654
Woodlands County 147 35,082 109 21,169 32 6,522 24 7,391 81 9,103
Yellowhead County 368 85,211 264 40,439 77 20,075 63 24,697 146 19,535
Source: Statistics Canada, 2011 Census of Agriculture. Prepared by Alberta Agriculture and Rural Development, Economics and Competitiveness Division, Statistics and Data Development Branch.
0 - True zero or a value rounded to zero. Refer to census definitions and notes for more information.
Total Area Prepared for Seeding
Area Where Crop Residue
was BaledNo-till seeding
Tillage Incorporating
Residue into Soil
Tillage Retaining
Residue on the Surface
85

Table 15.1: Tillage Practices Used to Prepare Land for Seeding, 2011
# Farms Acres # Farms Acres # Farms Acres # Farms Acres # Farms Acres
North Saskatchewan 8,680 5,692,801 3,005 581,687 2,391 1,116,454 4,169 3,994,660 3,839 687,966
Beaver County 463 399,278 90 15,084 123 53,618 295 330,576 196 32,312
Brazeau County 231 32,047 171 22,186 32 3,851 37 6,010 105 11,639
Camrose County 719 533,685 128 19,797 208 98,458 462 415,430 311 50,986
Clearwater County 516 82,905 380 45,301 93 19,153 76 18,451 234 23,656
Edmonton 29 8,614 16 919 4 805 11 6,890 6 310
Flagstaff County 529 633,297 68 24,092 136 142,475 362 466,730 205 42,022
Lamont County 541 332,322 136 22,168 129 40,104 337 270,050 208 35,263
Leduc County 786 281,498 404 73,654 252 90,694 220 117,150 360 50,355
Minburn County No. 27 470 435,195 78 28,069 111 51,872 316 355,254 185 40,080
Parkland County 371 124,282 222 40,507 100 50,307 84 33,468 168 22,985
Provost No. 52 312 298,420 79 23,763 116 72,705 171 201,952 140 35,441
Smoky Lake County 273 142,355 102 17,338 59 15,754 129 109,263 140 24,595
St. Paul County No. 19 440 216,198 182 34,609 107 45,985 189 135,604 245 47,155
Strathcona County 251 120,458 98 12,944 55 17,467 117 90,047 87 14,381
Sturgeon County 496 316,339 192 48,335 185 91,615 176 176,389 164 25,993
Thorhild County No. 7 304 149,108 149 41,462 92 49,840 95 57,806 135 20,693
Two Hills County No. 21 378 319,547 68 13,164 99 45,840 240 260,543 183 38,696
Vermilion River County 687 639,294 103 28,413 206 101,067 456 509,814 326 88,376
Wainwright No. 61 327 386,494 54 21,182 116 77,991 201 287,321 145 36,630
Wetaskiwin County No. 10 557 241,465 285 48,700 168 46,853 195 145,912 296 46,398
Red Deer 5,417 3,847,283 2,000 534,798 1,725 854,221 2,387 2,458,264 2,574 515,096
Kneehill County 505 591,184 57 18,174 90 49,820 402 523,190 191 44,477
Lacombe County 634 349,081 265 65,318 224 105,904 245 177,859 306 60,866
Mountain View County 942 385,082 454 89,084 322 126,531 269 169,467 458 76,994
Paintearth County No. 18 286 283,740 54 14,018 82 37,460 188 232,262 156 38,207
Ponoka County 668 236,513 357 85,038 205 59,295 216 92,180 366 68,752
Red Deer County 919 456,525 401 96,038 356 165,011 304 195,476 486 90,159
Special Area No. 2 266 214,192 108 43,602 83 47,002 107 123,588 104 21,569
Special Area No. 3 350 384,072 95 55,698 98 61,030 189 267,344 106 19,542
Special Area No. 4 216 245,573 54 19,054 71 54,608 114 171,911 107 28,395
Starland County 226 350,175 41 15,239 64 62,639 155 272,297 73 18,352
Stettler County No. 6 405 351,146 114 33,535 130 84,921 198 232,690 221 47,783
Source: Statistics Canada, 2011 Census of Agriculture. Prepared by Alberta Agriculture and Rural Development, Economics and Competitiveness Division, Statistics and Data Development Branch.
0 - True zero or a value rounded to zero. Refer to census definitions and notes for more information.
Total Area Prepared for Seeding
Tillage Incorporating
Residue into Soil
Tillage Retaining
Residue on the Surface No-till seeding
Area Where Crop Residue
was Baled
86

Table 15.1: Tillage Practices Used to Prepare Land for Seeding, 2011
# Farms Acres # Farms Acres # Farms Acres # Farms Acres # Farms Acres
South Saskatchewan 5,696 6,188,695 1,919 X 1,857 X 2,786 X 2,243 617,673
Bighorn No. 8 5 2,021 4 X 1 X 0 0 3 370
Calgary 16 23,797 8 X 8 X 1 X 4 494
Cardston County 249 363,500 85 38,149 86 108,924 110 216,427 131 41,337
Cypress County 449 374,769 150 57,210 124 60,957 216 256,602 123 22,117
Foothills No. 31 457 294,094 148 X 157 79,429 195 X 175 30,431
Forty Mile County No. 8 433 687,439 127 75,944 137 111,099 263 500,396 110 21,290
Lethbridge County 646 475,123 280 82,486 221 97,666 268 294,971 330 113,214
Newell County No. 4 465 295,573 245 81,329 158 65,525 169 148,719 206 30,474
Pincher Creek No. 9 213 189,268 75 10,267 79 48,153 79 130,848 82 25,356
Ranchland No. 66 6 895 4 X 1 X 2 X 3 165
Rocky View County 596 423,582 194 41,887 215 114,147 258 267,548 224 40,138
Taber 507 600,386 284 174,988 176 126,949 157 298,449 225 78,244
Vulcan County 458 831,344 66 33,339 135 117,596 309 680,409 151 65,820
Warner County No. 5 341 560,869 87 44,241 105 99,529 217 417,099 141 51,120
Wheatland County 484 711,443 68 34,484 107 103,950 359 573,009 167 52,439
Willow Creek No. 26 371 354,592 94 25,048 147 89,135 183 240,409 168 44,664
Source: Statistics Canada, 2011 Census of Agriculture. Prepared by Alberta Agriculture and Rural Development, Economics and Competitiveness Division, Statistics and Data Development Branch.
X - Confidential. 0 - True zero or a value rounded to zero. Refer to census definitions and notes for more information.
Area Where Crop Residue
was BaledTotal Area Prepared for Seeding
Tillage Incorporating
Residue into Soil
Tillage Retaining
Residue on the Surface No-till seeding
87

Table 16.1: Forms of Weed Control Used on Summerfallow Land, 2011
# Farms Acres # Farms Acres # Farms Acres # Farms Acres
Alberta 5,336 1,263,051 1,478 672,279 2,592 297,954 1,501 292,818
Lower Peace 261 39,448 25 3,637 170 23,456 70 12,355
Mackenzie County 139 21,839 6 948 110 16,196 26 4,695
Northern Lights County 93 13,877 15 2,414 47 6,369 31 5,094
Northern Sunrise County 29 3,732 4 275 13 891 13 2,566
Lower Athabasca 143 12,151 11 1,061 113 8,502 24 2,588
Bonnyville No. 87 95 8,191 6 431 79 6,317 14 1,443
Lac la Biche County 48 3,960 5 630 34 2,185 10 1,145
Upper Peace 651 95,647 80 X 384 46,081 204 X
Birch Hills County 33 3,402 3 X 19 2,027 12 X
Clear Hills 110 20,782 11 2,671 70 10,252 34 7,859
Fairview No. 136 36 6,400 8 2,270 24 3,728 5 402
Grande Prairie County No. 1 205 26,262 24 4,297 120 11,493 68 10,472
Greenview No. 16 110 12,282 6 735 72 6,656 32 4,891
Peace No. 135 21 2,644 5 937 8 764 9 943
Saddle Hills County 99 18,522 13 5,586 53 8,558 34 4,378
Smoky River No. 130 28 4,917 9 2,285 11 2,256 8 376
Spirit River No. 133 9 436 1 X 7 347 2 X
Upper Athabasca 483 41,064 52 X 330 22,733 115 X
Athabasca County 102 11,116 10 2,106 65 4,359 31 4,651
Barrhead County No. 11 50 2,877 9 534 28 1,490 14 853
Big Lakes 55 7,195 7 1,455 39 3,883 12 1,857
Lac Ste. Anne County 70 4,477 9 485 48 2,767 15 1,225
Lesser Slave River No.124 22 1,572 4 295 15 1,002 5 275
Westlock County 75 5,272 6 700 50 2,912 20 1,660
Woodlands County 34 3,305 2 X 27 2,123 6 X
Yellowhead County 75 5,250 5 123 58 4,197 12 930
Source: Statistics Canada, 2011 Census of Agriculture. Prepared by Alberta Agriculture and Rural Development, Economics and Competitiveness Division, Statistics and Data Development Branch.
X - Confidential. 0 - True zero or a value rounded to zero. Refer to census definitions and notes for more information.
Total Summerfallow Land Chemical only Tillage only Tillage and Chemical Combined
88
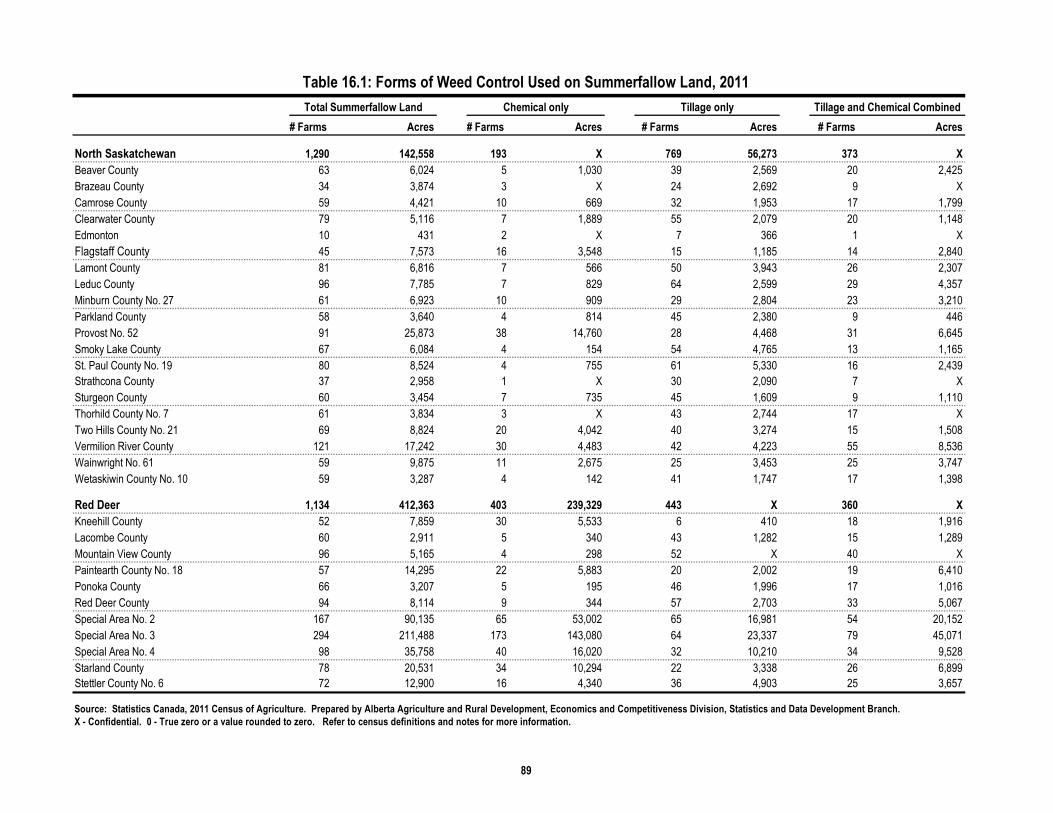
Table 16.1: Forms of Weed Control Used on Summerfallow Land, 2011
# Farms Acres # Farms Acres # Farms Acres # Farms Acres
North Saskatchewan 1,290 142,558 193 X 769 56,273 373 X
Beaver County 63 6,024 5 1,030 39 2,569 20 2,425
Brazeau County 34 3,874 3 X 24 2,692 9 X
Camrose County 59 4,421 10 669 32 1,953 17 1,799
Clearwater County 79 5,116 7 1,889 55 2,079 20 1,148
Edmonton 10 431 2 X 7 366 1 X
Flagstaff County 45 7,573 16 3,548 15 1,185 14 2,840
Lamont County 81 6,816 7 566 50 3,943 26 2,307
Leduc County 96 7,785 7 829 64 2,599 29 4,357
Minburn County No. 27 61 6,923 10 909 29 2,804 23 3,210
Parkland County 58 3,640 4 814 45 2,380 9 446
Provost No. 52 91 25,873 38 14,760 28 4,468 31 6,645
Smoky Lake County 67 6,084 4 154 54 4,765 13 1,165
St. Paul County No. 19 80 8,524 4 755 61 5,330 16 2,439
Strathcona County 37 2,958 1 X 30 2,090 7 X
Sturgeon County 60 3,454 7 735 45 1,609 9 1,110
Thorhild County No. 7 61 3,834 3 X 43 2,744 17 X
Two Hills County No. 21 69 8,824 20 4,042 40 3,274 15 1,508
Vermilion River County 121 17,242 30 4,483 42 4,223 55 8,536
Wainwright No. 61 59 9,875 11 2,675 25 3,453 25 3,747
Wetaskiwin County No. 10 59 3,287 4 142 41 1,747 17 1,398
Red Deer 1,134 412,363 403 239,329 443 X 360 X
Kneehill County 52 7,859 30 5,533 6 410 18 1,916
Lacombe County 60 2,911 5 340 43 1,282 15 1,289
Mountain View County 96 5,165 4 298 52 X 40 X
Paintearth County No. 18 57 14,295 22 5,883 20 2,002 19 6,410
Ponoka County 66 3,207 5 195 46 1,996 17 1,016
Red Deer County 94 8,114 9 344 57 2,703 33 5,067
Special Area No. 2 167 90,135 65 53,002 65 16,981 54 20,152
Special Area No. 3 294 211,488 173 143,080 64 23,337 79 45,071
Special Area No. 4 98 35,758 40 16,020 32 10,210 34 9,528
Starland County 78 20,531 34 10,294 22 3,338 26 6,899
Stettler County No. 6 72 12,900 16 4,340 36 4,903 25 3,657
Source: Statistics Canada, 2011 Census of Agriculture. Prepared by Alberta Agriculture and Rural Development, Economics and Competitiveness Division, Statistics and Data Development Branch.
X - Confidential. 0 - True zero or a value rounded to zero. Refer to census definitions and notes for more information.
Total Summerfallow Land Chemical only Tillage only Tillage and Chemical Combined
89

Table 16.1: Forms of Weed Control Used on Summerfallow Land, 2011
# Farms Acres # Farms Acres # Farms Acres # Farms Acres
South Saskatchewan 1,374 519,820 714 364,460 383 X 355 X
Bighorn No. 8 0 0 0 0 0 0 0 0
Calgary 3 400 0 0 2 X 1 X
Cardston County 31 10,108 8 5,515 9 617 14 3,976
Cypress County 181 77,375 91 50,208 63 16,087 36 11,080
Foothills No. 31 61 6,956 8 1,613 33 1,910 21 3,433
Forty Mile County No. 8 262 156,028 165 120,625 76 25,026 41 10,377
Lethbridge County 91 20,333 48 14,817 22 2,102 29 3,414
Newell County No. 4 69 25,487 32 18,890 25 2,539 16 4,058
Pincher Creek No. 9 19 2,225 6 1,793 11 370 3 62
Ranchland No. 66 0 0 0 0 0 0 0 0
Rocky View County 79 8,520 19 2,655 33 2,235 30 3,630
Taber 128 38,403 58 23,336 32 4,064 45 11,003
Vulcan County 154 69,337 102 49,269 22 6,340 38 13,728
Warner County No. 5 156 73,609 108 56,716 25 5,994 34 10,899
Wheatland County 87 21,162 45 12,230 13 2,811 31 6,121
Willow Creek No. 26 53 9,877 24 6,793 17 899 16 2,185
Source: Statistics Canada, 2011 Census of Agriculture. Prepared by Alberta Agriculture and Rural Development, Economics and Competitiveness Division, Statistics and Data Development Branch.
X - Confidential. 0 - True zero or a value rounded to zero. Refer to census definitions and notes for more information.
Total Summerfallow Land Chemical only Tillage only Tillage and Chemical Combined
90
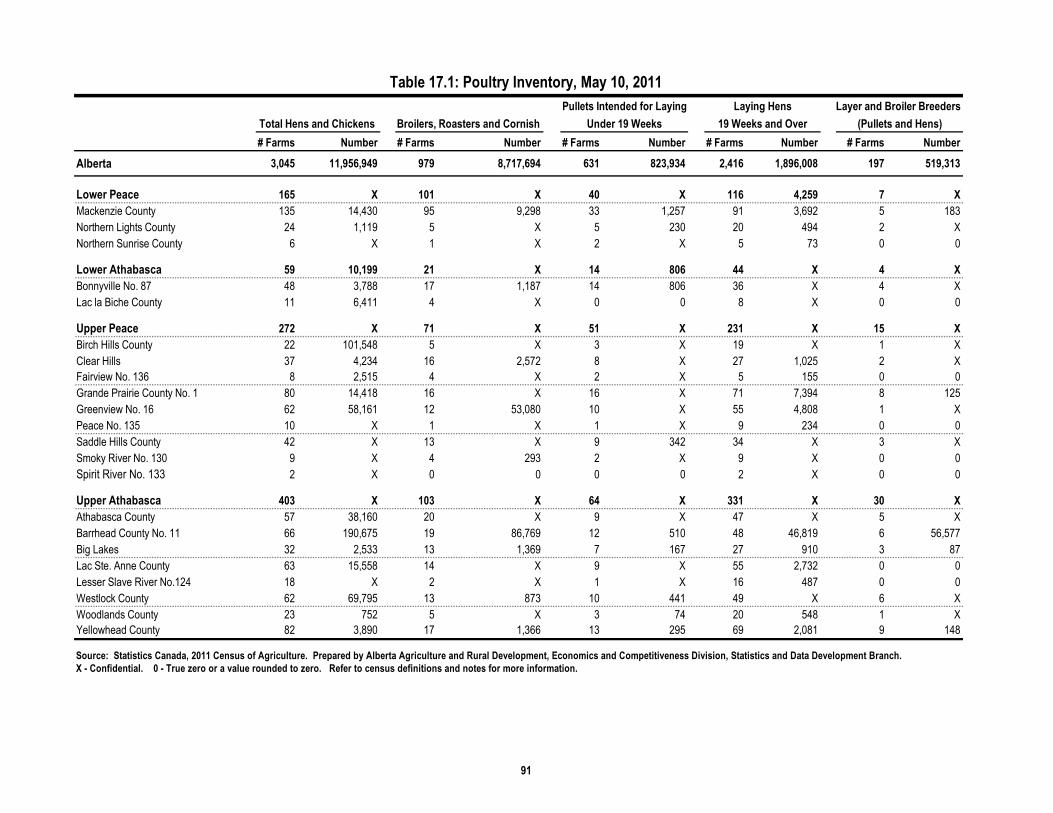
Table 17.1: Poultry Inventory, May 10, 2011
# Farms Number # Farms Number # Farms Number # Farms Number # Farms Number
Alberta 3,045 11,956,949 979 8,717,694 631 823,934 2,416 1,896,008 197 519,313
Lower Peace 165 X 101 X 40 X 116 4,259 7 X
Mackenzie County 135 14,430 95 9,298 33 1,257 91 3,692 5 183
Northern Lights County 24 1,119 5 X 5 230 20 494 2 X
Northern Sunrise County 6 X 1 X 2 X 5 73 0 0
Lower Athabasca 59 10,199 21 X 14 806 44 X 4 X
Bonnyville No. 87 48 3,788 17 1,187 14 806 36 X 4 X
Lac la Biche County 11 6,411 4 X 0 0 8 X 0 0
Upper Peace 272 X 71 X 51 X 231 X 15 X
Birch Hills County 22 101,548 5 X 3 X 19 X 1 X
Clear Hills 37 4,234 16 2,572 8 X 27 1,025 2 X
Fairview No. 136 8 2,515 4 X 2 X 5 155 0 0
Grande Prairie County No. 1 80 14,418 16 X 16 X 71 7,394 8 125
Greenview No. 16 62 58,161 12 53,080 10 X 55 4,808 1 X
Peace No. 135 10 X 1 X 1 X 9 234 0 0
Saddle Hills County 42 X 13 X 9 342 34 X 3 X
Smoky River No. 130 9 X 4 293 2 X 9 X 0 0
Spirit River No. 133 2 X 0 0 0 0 2 X 0 0
Upper Athabasca 403 X 103 X 64 X 331 X 30 X
Athabasca County 57 38,160 20 X 9 X 47 X 5 X
Barrhead County No. 11 66 190,675 19 86,769 12 510 48 46,819 6 56,577
Big Lakes 32 2,533 13 1,369 7 167 27 910 3 87
Lac Ste. Anne County 63 15,558 14 X 9 X 55 2,732 0 0
Lesser Slave River No.124 18 X 2 X 1 X 16 487 0 0
Westlock County 62 69,795 13 873 10 441 49 X 6 X
Woodlands County 23 752 5 X 3 74 20 548 1 X
Yellowhead County 82 3,890 17 1,366 13 295 69 2,081 9 148
Source: Statistics Canada, 2011 Census of Agriculture. Prepared by Alberta Agriculture and Rural Development, Economics and Competitiveness Division, Statistics and Data Development Branch.
X - Confidential. 0 - True zero or a value rounded to zero. Refer to census definitions and notes for more information.
Pullets Intended for Laying Laying Hens Layer and Broiler Breeders
Total Hens and Chickens Broilers, Roasters and Cornish Under 19 Weeks 19 Weeks and Over (Pullets and Hens)
91

Table 17.1: Poultry Inventory, May 10, 2011
# Farms Number # Farms Number # Farms Number # Farms Number # Farms Number
North Saskatchewan 895 X 314 X 190 X 683 X 70 X
Beaver County 46 156,906 17 134,855 13 3,314 31 17,150 7 1,587
Brazeau County 34 2,456 4 X 9 719 31 1,589 2 X
Camrose County 70 860,979 39 734,673 11 X 36 26,822 11 X
Clearwater County 85 32,798 16 4,563 17 X 76 X 4 17
Edmonton 1 X 1 X 0 0 0 0 0 0
Flagstaff County 27 24,386 10 X 8 X 22 X 0 0
Lamont County 33 23,794 8 X 8 X 27 1,239 5 X
Leduc County 88 193,486 32 140,002 23 X 70 42,606 5 X
Minburn County No. 27 29 74,358 10 X 7 X 23 25,375 1 X
Parkland County 67 X 16 1,877 16 X 54 9,496 3 66
Provost No. 52 21 10,954 8 3,916 6 X 16 X 1 X
Smoky Lake County 31 28,203 11 X 6 X 23 X 2 X
St. Paul County No. 19 36 32,630 13 31,833 1 X 28 X 2 X
Strathcona County 49 X 8 X 9 X 42 13,483 4 68
Sturgeon County 70 1,270,204 34 1,113,848 9 X 39 X 8 X
Thorhild County No. 7 31 25,027 12 X 7 X 25 13,250 5 247
Two Hills County No. 21 39 74,449 14 57,407 7 X 30 12,202 4 X
Vermilion River County 40 83,043 14 77,368 11 X 32 3,186 1 X
Wainwright No. 61 23 204,345 13 X 7 X 17 30,825 2 X
Wetaskiwin County No. 10 75 274,877 34 230,305 15 374 61 X 3 X
Red Deer 587 X 181 X 117 X 453 X 35 X
Kneehill County 63 885,242 27 583,705 11 103,307 29 79,443 8 118,787
Lacombe County 90 752,156 25 678,364 16 17,592 71 55,970 5 230
Mountain View County 118 475,298 30 470,407 24 1,112 99 3,634 4 145
Paintearth County No. 18 27 80,208 13 X 6 21,125 20 44,953 1 X
Ponoka County 100 730,712 31 727,732 16 342 80 2,533 7 105
Red Deer County 91 139,443 17 79,775 20 925 75 X 6 X
Special Area No. 2 17 X 6 2,478 5 X 14 X 0 0
Special Area No. 3 14 X 8 6,493 1 X 9 X 1 X
Special Area No. 4 11 X 3 X 2 X 10 X 0 0
Starland County 14 194,258 5 107,828 5 X 13 56,305 1 X
Stettler County No. 6 42 119,021 16 52,627 11 X 33 47,197 2 X
Source: Statistics Canada, 2011 Census of Agriculture. Prepared by Alberta Agriculture and Rural Development, Economics and Competitiveness Division, Statistics and Data Development Branch.
X - Confidential. 0 - True zero or a value rounded to zero. Refer to census definitions and notes for more information.
Pullets Intended for Laying Laying Hens Layer and Broiler Breeders
Total Hens and Chickens Broilers, Roasters and Cornish Under 19 Weeks 19 Weeks and Over (Pullets and Hens)
92

Table 17.1: Poultry Inventory, May 10, 2011
# Farms Number # Farms Number # Farms Number # Farms Number # Farms Number
South Saskatchewan 664 X 188 X 155 X 558 X 36 X
Bighorn No. 8 3 153 0 0 2 X 2 X 0 0
Calgary 7 165 1 X 0 0 5 X 2 X
Cardston County 40 196,639 16 37,239 16 X 36 109,057 1 X
Cypress County 33 X 6 X 5 X 28 X 3 6
Foothills No. 31 79 243,019 12 228,171 15 954 72 13,851 3 43
Forty Mile County No. 8 35 X 12 X 12 X 29 X 2 X
Lethbridge County 89 1,329,855 32 1,284,993 13 1,382 60 11,147 5 32,333
Newell County No. 4 45 242,164 12 115,312 12 47,331 38 79,446 5 75
Pincher Creek No. 9 40 65,957 8 46,641 7 X 37 16,165 1 X
Ranchland No. 66 4 124 0 0 1 X 4 X 0 0
Rocky View County 62 172,633 15 13,687 13 X 54 88,224 3 X
Taber 33 363,495 8 299,447 5 X 28 58,301 3 X
Vulcan County 39 169,667 16 40,495 11 X 33 94,278 1 X
Warner County No. 5 46 524,481 18 229,212 23 X 42 194,963 3 X
Wheatland County 45 253,097 19 163,370 8 X 37 66,961 2 X
Willow Creek No. 26 64 227,314 13 X 12 X 53 X 2 X
Source: Statistics Canada, 2011 Census of Agriculture. Prepared by Alberta Agriculture and Rural Development, Economics and Competitiveness Division, Statistics and Data Development Branch.
X - Confidential. 0 - True zero or a value rounded to zero. Refer to census definitions and notes for more information.
Pullets Intended for Laying Laying Hens Layer and Broiler Breeders
Total Hens and Chickens Broilers, Roasters and Cornish Under 19 Weeks 19 Weeks and Over (Pullets and Hens)
93

Table 17.2: Poultry Inventory, May 10, 2011
# Farms Number # Farms Number
Alberta 449 706,902 737 204,148
Lower Peace 28 X 19 X
Mackenzie County 22 628 13 101
Northern Lights County 5 59 6 409
Northern Sunrise County 1 X 0 0
Lower Athabasca 13 X 12 X
Bonnyville No. 87 11 173 11 354
Lac la Biche County 2 X 1 X
Upper Peace 42 X 65 X
Birch Hills County 3 X 3 X
Clear Hills 7 170 6 X
Fairview No. 136 2 X 3 X
Grande Prairie County No. 1 13 X 24 2,138
Greenview No. 16 5 X 17 1,656
Peace No. 135 1 X 3 X
Saddle Hills County 8 138 8 58
Smoky River No. 130 2 X 1 X
Spirit River No. 133 1 X 0 0
Upper Athabasca 61 X 87 X
Athabasca County 8 X 10 X
Barrhead County No. 11 7 157 15 208
Big Lakes 6 X 5 49
Lac Ste. Anne County 11 46 12 400
Lesser Slave River No.124 1 X 1 X
Westlock County 14 824 9 177
Woodlands County 5 25 8 28
Yellowhead County 9 79 27 344
Source: Statistics Canada, 2011 Census of Agriculture. Prepared by Alberta Agriculture and Rural Development, Economics and Competitiveness Division, Statistics and Data Development Branch.
X - Confidential. 0 - True zero or a value rounded to zero. Refer to census definitions and notes for more information.
Turkeys Other Poultry
94

Table 17.2: Poultry Inventory, May 10, 2011
# Farms Number # Farms Number
North Saskatchewan 149 X 207 X
Beaver County 9 X 14 4,612
Brazeau County 4 18 6 25
Camrose County 10 X 11 3,249
Clearwater County 13 X 24 108
Edmonton 0 0 0 0
Flagstaff County 3 X 4 30
Lamont County 5 362 10 X
Leduc County 20 1,442 24 5,465
Minburn County No. 27 7 X 7 5,831
Parkland County 12 X 14 750
Provost No. 52 6 458 5 X
Smoky Lake County 4 248 5 X
St. Paul County No. 19 5 71 8 107
Strathcona County 10 X 22 11,612
Sturgeon County 9 148,026 10 885
Thorhild County No. 7 4 84 4 X
Two Hills County No. 21 5 X 7 X
Vermilion River County 5 356 9 X
Wainwright No. 61 6 1,581 4 X
Wetaskiwin County No. 10 12 48,160 19 1,686
Red Deer 79 X 152 X
Kneehill County 3 X 8 4,031
Lacombe County 10 X 20 4,094
Mountain View County 13 X 28 X
Paintearth County No. 18 7 X 9 4,127
Ponoka County 12 X 31 1,602
Red Deer County 14 X 28 6,007
Special Area No. 2 2 X 4 X
Special Area No. 3 4 228 3 X
Special Area No. 4 2 X 2 X
Starland County 6 26,550 6 5,085
Stettler County No. 6 6 X 13 1,846
Source: Statistics Canada, 2011 Census of Agriculture. Prepared by Alberta Agriculture and Rural Development, Economics and Competitiveness Division, Statistics and Data Development Branch.
X - Confidential. 0 - True zero or a value rounded to zero. Refer to census definitions and notes for more information.
Turkeys Other Poultry
95

Table 17.2: Poultry Inventory, May 10, 2011
# Farms Number # Farms Number
South Saskatchewan 77 X 195 X
Bighorn No. 8 0 0 0 0
Calgary 0 0 1 X
Cardston County 5 X 19 12,963
Cypress County 2 X 12 2,411
Foothills No. 31 11 X 20 2,564
Forty Mile County No. 8 5 X 7 4,566
Lethbridge County 7 X 19 6,905
Newell County No. 4 4 X 13 29,215
Pincher Creek No. 9 5 X 12 4,578
Ranchland No. 66 0 0 1 X
Rocky View County 8 X 21 5,033
Taber 4 X 11 4,213
Vulcan County 9 X 13 8,373
Warner County No. 5 8 1,421 17 11,283
Wheatland County 7 810 12 7,372
Willow Creek No. 26 2 X 17 5,489
Source: Statistics Canada, 2011 Census of Agriculture. Prepared by Alberta Agriculture and Rural Development, Economics and Competitiveness Division, Statistics and Data Development Branch.
X - Confidential. 0 - True zero or a value rounded to zero. Refer to census definitions and notes for more information.
Turkeys Other Poultry
96

Table 18.1: Poultry Production, Egg Production and Birds Hatched in Commercial Hatcheries, 2010
# Farms Kilograms # Farms Kilograms # Farms Dozens # Farms Dozens # Farms Number
Alberta 534 124,468,680 208 16,958,259 932 46,285,342 85 4,808,175 9 68,224,440
Lower Peace 24 X 10 5,296 54 X 2 X 0 0
Mackenzie County 23 23,259 10 5,296 47 61,957 1 X 0 0
Northern Lights County 0 0 0 0 5 X 1 X 0 0
Northern Sunrise County 1 X 0 0 2 X 0 0 0 0
Lower Athabasca 7 X 3 X 15 17,204 4 X 0 0
Bonnyville No. 87 6 1,429 3 X 11 16,328 3 X 0 0
Lac la Biche County 1 X 0 0 4 876 1 X 0 0
Upper Peace 24 X 13 X 82 X 4 30 0 0
Birch Hills County 2 X 0 0 3 X 0 0 0 0
Clear Hills 6 X 2 X 9 5,339 0 0 0 0
Fairview No. 136 1 X 1 X 2 X 0 0 0 0
Grande Prairie County No. 1 8 X 5 4,870 30 137,152 4 30 0 0
Greenview No. 16 4 651,011 1 X 19 70,358 0 0 0 0
Peace No. 135 0 0 0 0 3 434 0 0 0 0
Saddle Hills County 3 X 3 241 12 3,439 0 0 0 0
Smoky River No. 130 0 0 1 X 4 X 0 0 0 0
Spirit River No. 133 0 0 0 0 0 0 0 0 0 0
Upper Athabasca 42 X 15 X 103 2,463,170 13 X 2 X
Athabasca County 4 X 2 X 11 12,702 1 X 0 0
Barrhead County No. 11 9 1,259,111 1 X 9 1,100,951 4 565,060 0 0
Big Lakes 3 X 3 X 9 6,645 0 0 0 0
Lac Ste. Anne County 2 X 0 0 20 23,856 2 X 0 0
Lesser Slave River No.124 0 0 0 0 6 3,361 0 0 0 0
Westlock County 10 X 6 2,947 15 1,297,754 3 X 2 X
Woodlands County 3 3,692 0 0 9 3,096 0 0 0 0
Yellowhead County 11 7,157 3 X 24 14,805 3 X 0 0
Source: Statistics Canada, 2011 Census of Agriculture. Prepared by Alberta Agriculture and Rural Development, Economics and Competitiveness Division, Statistics and Data Development Branch.
X - Confidential. 0 - True zero or a value rounded to zero. Refer to census definitions and notes for more information.
Hatching Egg Production
Chicks or
Other Poultry HatchedTable Egg ProductionTurkey Production
Broilers, Roasters
and Cornish Production
97

Table 18.1: Poultry Production, Egg Production and Birds Hatched in Commercial Hatcheries, 2010
# Farms Kilograms # Farms Kilograms # Farms Dozens # Farms Dozens # Farms Number
North Saskatchewan 198 X 77 X 258 X 28 X 5 X
Beaver County 11 1,721,393 6 X 17 442,039 2 X 1 X
Brazeau County 2 X 1 X 13 26,422 0 0 0 0
Camrose County 33 11,612,224 3 X 13 552,385 6 X 0 0
Clearwater County 5 10,720 2 X 18 X 2 X 0 0
Edmonton 1 X 0 0 0 0 0 0 1 X
Flagstaff County 5 X 5 2,322 8 X 0 0 0 0
Lamont County 3 X 3 X 7 4,793 2 X 0 0
Leduc County 18 1,537,828 8 21,389 36 1,062,016 3 17 1 X
Minburn County No. 27 6 X 4 X 9 645,899 2 X 0 0
Parkland County 9 11,570 6 X 25 178,912 1 X 0 0
Provost No. 52 2 X 1 X 5 X 0 0 0 0
Smoky Lake County 6 15,985 2 X 10 X 0 0 0 0
St. Paul County No. 19 9 X 4 1,104 5 5,952 0 0 0 0
Strathcona County 5 X 5 1,758,234 18 X 2 X 1 X
Sturgeon County 28 15,144,251 8 3,567,304 14 X 1 X 0 0
Thorhild County No. 7 5 X 1 X 8 X 1 X 0 0
Two Hills County No. 21 10 1,528,614 2 X 12 X 1 X 0 0
Vermilion River County 18 1,335,649 4 6,530 12 X 1 X 0 0
Wainwright No. 61 9 2,760,711 3 X 6 X 0 0 0 0
Wetaskiwin County No. 10 13 3,253,289 9 895,321 22 X 4 X 1 X
Red Deer 121 X 40 X 159 X 17 X 0 0
Kneehill County 30 7,702,481 5 X 17 1,514,030 9 X 0 0
Lacombe County 22 X 4 939 23 1,246,509 0 0 0 0
Mountain View County 18 7,909,340 7 X 37 X 3 X 0 0
Paintearth County No. 18 7 36,867 3 X 7 1,109,636 0 0 0 0
Ponoka County 15 10,880,843 4 X 27 17,462 1 X 0 0
Red Deer County 11 X 7 X 22 X 4 X 0 0
Special Area No. 2 3 X 1 X 3 X 0 0 0 0
Special Area No. 3 1 X 0 0 3 X 0 0 0 0
Special Area No. 4 0 0 0 0 1 X 0 0 0 0
Starland County 4 X 4 596,845 5 1,427,785 0 0 0 0
Stettler County No. 6 10 645,294 5 X 14 1,292,794 0 0 0 0
Source: Statistics Canada, 2011 Census of Agriculture. Prepared by Alberta Agriculture and Rural Development, Economics and Competitiveness Division, Statistics and Data Development Branch.
X - Confidential. 0 - True zero or a value rounded to zero. Refer to census definitions and notes for more information.
Table Egg Production Hatching Egg Production
Chicks or
Other Poultry Hatched
Broilers, Roasters
and Cornish Production Turkey Production
98

Table 18.1: Poultry Production, Egg Production and Birds Hatched in Commercial Hatcheries, 2010
# Farms Kilograms # Farms Kilograms # Farms Dozens # Farms Dozens # Farms Number
South Saskatchewan 118 X 50 X 261 X 17 X 2 X
Bighorn No. 8 0 0 0 0 2 X 0 0 0 0
Calgary 0 0 0 0 1 X 0 0 0 0
Cardston County 8 335,416 5 X 22 2,676,094 1 X 0 0
Cypress County 2 X 1 X 10 X 0 0 0 0
Foothills No. 31 5 2,544,388 4 X 34 302,618 3 50 0 0
Forty Mile County No. 8 5 X 1 X 17 X 1 X 0 0
Lethbridge County 30 18,833,087 9 X 27 174,218 3 X 1 X
Newell County No. 4 4 X 2 X 17 1,908,027 1 X 1 X
Pincher Creek No. 9 6 838,577 3 X 14 360,519 0 0 0 0
Ranchland No. 66 0 0 0 0 2 X 0 0 0 0
Rocky View County 15 112,929 8 X 33 2,264,875 2 X 0 0
Taber 7 3,955,700 2 X 11 1,525,120 1 X 0 0
Vulcan County 7 X 8 X 17 2,427,998 1 X 0 0
Warner County No. 5 9 X 4 14,787 22 4,896,313 1 X 0 0
Wheatland County 13 2,030,269 3 6,538 15 1,750,644 1 X 0 0
Willow Creek No. 26 7 1,414,438 0 0 17 1,736,388 2 X 0 0
Source: Statistics Canada, 2011 Census of Agriculture. Prepared by Alberta Agriculture and Rural Development, Economics and Competitiveness Division, Statistics and Data Development Branch.
X - Confidential. 0 - True zero or a value rounded to zero. Refer to census definitions and notes for more information.
Table Egg Production Hatching Egg Production
Chicks or
Other Poultry HatchedTurkey Production
Broilers, Roasters
and Cornish Production
99

Table 19.1: Cattle and Calves, May 10, 2011
# Farms Head # Farms Head # Farms Head # Farms Head # Farms Head # Farms Head # Farms Head
Alberta 21,888 5,104,605 16,457 90,813 19,168 1,611,085 947 80,694 18,618 1,530,391 13,741 989,230 10,623 264,372
Lower Peace 460 44,293 338 1,247 413 19,911 46 X 397 X 304 5,126 239 3,056
Mackenzie County 247 16,701 172 443 222 7,545 35 X 210 X 170 1,890 125 1,263
Northern Lights County 161 18,662 125 599 144 8,750 8 10 142 8,740 105 1,852 88 1,378
Northern Sunrise County 52 8,930 41 205 47 3,616 3 X 45 X 29 1,384 26 415
Lower Athabasca 564 81,436 440 1,963 499 35,077 11 X 496 X 372 10,771 298 6,064
Bonnyville No. 87 423 63,418 326 1,492 370 26,619 7 111 368 26,508 290 9,146 233 4,769
Lac la Biche County 141 18,018 114 471 129 8,458 4 X 128 X 82 1,625 65 1,295
Upper Peace 1,441 205,335 1,125 X 1,289 82,058 51 X 1,265 X 893 27,487 688 X
Birch Hills County 99 20,432 83 574 86 8,361 5 X 84 X 63 3,169 51 X
Clear Hills 198 22,149 160 589 177 9,570 8 101 172 9,469 118 3,115 79 1,725
Fairview No. 136 80 7,393 66 X 74 3,339 2 X 73 X 56 1,065 45 744
Grande Prairie County No. 1 462 65,055 333 1,233 404 23,391 12 31 396 23,360 275 9,118 220 X
Greenview No. 16 309 43,505 244 971 276 17,093 12 173 272 16,920 193 4,798 143 2,732
Peace No. 135 73 8,511 60 206 68 3,563 1 X 68 X 43 1,236 35 750
Saddle Hills County 165 27,673 136 622 155 12,744 10 116 152 12,628 107 2,815 87 1,930
Smoky River No. 130 42 8,939 31 147 36 3,191 1 X 35 X 28 2,046 19 X
Spirit River No. 133 13 1,678 12 X 13 806 0 0 13 806 10 125 9 X
Upper Athabasca 2,505 397,406 1,918 7,783 2,229 148,661 79 X 2,184 X 1,610 61,373 1,293 24,926
Athabasca County 348 49,362 285 1,078 308 21,062 9 485 306 20,577 211 5,942 172 2,893
Barrhead County No. 11 384 79,631 281 1,194 332 24,514 26 3,568 313 20,946 239 15,038 178 3,604
Big Lakes 189 31,362 152 677 173 12,833 2 X 173 X 136 5,405 115 3,265
Lac Ste. Anne County 543 70,511 428 1,579 495 30,572 11 358 488 30,214 354 7,377 290 4,964
Lesser Slave River No.124 86 11,757 74 316 77 5,679 1 X 77 X 60 1,048 50 729
Westlock County 411 76,996 300 1,487 364 25,679 14 1,310 354 24,369 256 14,322 199 4,574
Woodlands County 168 21,676 127 468 145 8,494 3 X 143 X 122 3,599 104 1,533
Yellowhead County 376 56,111 271 984 335 19,828 13 859 330 18,969 232 8,642 185 3,364
Source: Statistics Canada, 2011 Census of Agriculture. Prepared by Alberta Agriculture and Rural Development, Economics and Competitiveness Division, Statistics and Data Development Branch.
(1) 1 Year & Over. X - Confidential. 0 - True zero or a value rounded to zero. Refer to census definitions and notes for more information.
Beef Cows Total Heifers(1) Beef Replacement Heifers(1)Total Cattle and Calves Bulls(1) Total Cows Dairy Cows
100

Table 19.1: Cattle and Calves, May 10, 2011
# Farms Head # Farms Head # Farms Head # Farms Head # Farms Head # Farms Head # Farms Head
North Saskatchewan 6,929 1,128,420 5,260 25,060 6,149 435,579 262 X 5,998 X 4,401 160,328 3,417 X
Beaver County 343 47,803 279 1,143 313 18,823 12 615 305 18,208 231 5,871 184 2,574
Brazeau County 266 28,738 204 699 232 12,579 7 227 228 12,352 165 4,741 124 1,846
Camrose County 428 62,128 324 1,430 385 24,234 18 1,463 375 22,771 282 9,351 222 3,962
Clearwater County 657 78,471 507 2,007 605 35,099 23 1,073 594 34,026 405 8,610 317 4,538
Edmonton 6 185 4 5 5 75 0 0 5 75 6 24 2 X
Flagstaff County 320 57,095 260 1,292 283 22,764 12 393 277 22,371 210 8,299 167 X
Lamont County 312 35,703 241 867 282 15,186 8 232 278 14,954 201 5,340 151 X
Leduc County 573 60,388 388 1,229 501 26,843 71 5,706 450 21,137 362 8,806 245 2,837
Minburn County No. 27 276 88,953 226 1,068 249 19,833 11 386 247 19,447 180 12,207 148 3,341
Parkland County 380 45,353 262 1,100 328 19,262 13 1,661 317 17,601 247 6,272 165 3,155
Provost No. 52 284 95,383 229 2,004 256 32,845 3 23 256 32,822 176 16,007 145 X
Smoky Lake County 256 41,371 216 891 239 17,872 2 X 238 X 161 5,631 134 2,702
St. Paul County No. 19 460 87,338 350 1,876 409 33,535 7 213 404 33,322 290 13,255 228 4,027
Strathcona County 207 14,781 123 364 154 5,714 9 587 152 5,127 135 2,489 91 893
Sturgeon County 263 27,184 196 663 228 11,012 16 1,719 218 9,293 169 2,941 129 X
Thorhild County No. 7 212 28,723 177 672 194 12,831 3 X 194 X 126 2,650 106 1,879
Two Hills County No. 21 299 40,311 246 1,074 271 18,862 6 204 269 18,658 166 3,945 136 X
Vermilion River County 602 145,407 445 3,342 533 52,604 9 212 531 52,392 393 22,388 332 10,566
Wainwright No. 61 289 67,453 235 1,738 260 27,791 6 744 256 27,047 181 8,767 149 4,099
Wetaskiwin County No. 10 496 75,652 348 1,596 422 27,815 26 2,499 404 25,316 315 12,734 242 4,956
Red Deer 4,959 1,097,930 3,830 23,637 4,413 416,738 264 X 4,235 X 3,165 176,070 2,476 X
Kneehill County 289 81,577 208 1,143 257 22,282 8 872 254 21,410 152 15,220 130 4,387
Lacombe County 549 105,531 411 1,825 494 41,322 65 9,720 440 31,602 367 17,401 241 5,650
Mountain View County 873 120,108 646 2,710 753 46,815 38 3,086 727 43,729 500 14,009 387 X
Paintearth County No. 18 295 70,016 252 1,525 279 28,895 6 457 279 28,438 188 9,000 166 4,498
Ponoka County 671 123,530 492 2,896 593 50,935 67 8,698 541 42,237 455 20,448 323 6,496
Red Deer County 794 145,351 593 3,038 690 52,539 44 5,294 659 47,245 499 24,531 381 8,151
Special Area No. 2 363 143,357 298 3,040 332 54,979 4 350 332 54,629 260 24,580 218 10,696
Special Area No. 3 265 76,075 228 1,854 242 31,835 3 X 241 X 179 9,204 155 5,248
Special Area No. 4 219 87,622 197 2,093 199 33,340 1 X 199 X 156 13,456 141 7,134
Starland County 163 35,178 129 813 149 14,345 10 425 147 13,920 98 7,285 80 1,695
Stettler County No. 6 478 109,585 376 2,700 425 39,451 18 1,905 416 37,546 311 20,936 254 6,779
Source: Statistics Canada, 2011 Census of Agriculture. Prepared by Alberta Agriculture and Rural Development, Economics and Competitiveness Division, Statistics and Data Development Branch.
(1) 1 Year & Over. X - Confidential. 0 - True zero or a value rounded to zero. Refer to census definitions and notes for more information.
Beef Cows Total Heifers(1) Beef Replacement Heifers(1)Total Cattle and Calves Bulls(1) Total Cows Dairy Cows
101

Table 19.1: Cattle and Calves, May 10, 2011
# Farms Head # Farms Head # Farms Head # Farms Head # Farms Head # Farms Head # Farms Head
South Saskatchewan 5,030 2,149,785 3,546 26,534 4,176 473,061 234 22,717 4,043 450,344 2,996 548,075 2,212 X
Bighorn No. 8 26 7,516 21 228 21 2,907 0 0 21 2,907 15 649 15 613
Calgary 10 634 4 15 5 326 0 0 5 326 6 63 2 X
Cardston County 322 87,868 250 2,020 290 34,742 22 1,654 282 33,088 186 11,682 152 6,031
Cypress County 490 150,008 368 3,111 413 55,738 5 407 410 55,331 334 26,636 276 9,959
Foothills No. 31 522 122,852 339 2,229 427 34,198 8 251 422 33,947 299 30,791 216 5,011
Forty Mile County No. 8 227 61,778 165 1,229 195 21,596 15 1,842 188 19,754 141 10,824 106 2,947
Lethbridge County 413 427,602 216 926 272 24,906 67 8,840 216 16,066 243 191,457 92 8,487
Newell County No. 4 404 146,139 312 2,893 357 48,754 13 1,164 351 47,590 253 21,366 204 10,294
Pincher Creek No. 9 308 100,249 219 1,806 261 33,096 7 406 259 32,690 185 22,318 149 5,578
Ranchland No. 66 36 14,364 27 217 31 5,342 0 0 31 5,342 23 2,077 18 772
Rocky View County 585 134,798 403 3,313 485 42,480 14 700 478 41,780 362 22,157 282 7,563
Taber 306 268,135 207 1,061 253 31,266 17 1,884 246 29,382 159 52,098 115 4,085
Vulcan County 277 197,851 198 1,333 234 27,590 19 1,478 224 26,112 137 75,128 95 2,638
Warner County No. 5 255 91,109 187 1,633 212 29,547 21 1,954 199 27,593 148 15,534 104 4,665
Wheatland County 347 162,218 270 1,838 301 33,199 9 1,012 299 32,187 203 22,468 161 4,670
Willow Creek No. 26 502 176,664 360 2,682 419 47,374 17 1,125 412 46,249 302 42,827 225 8,765
Source: Statistics Canada, 2011 Census of Agriculture. Prepared by Alberta Agriculture and Rural Development, Economics and Competitiveness Division, Statistics and Data Development Branch.
(1) 1 Year & Over. X - Confidential. 0 - True zero or a value rounded to zero. Refer to census definitions and notes for more information.
Beef Cows Total Heifers(1) Beef Replacement Heifers(1)Total Cattle and Calves Bulls(1) Total Cows Dairy Cows
102

Table 19.2: Cattle and Calves, May 10, 2011
# Farms Head # Farms Head # Farms Head # Farms Head
Alberta 766 40,388 4,910 684,470 7,387 819,409 19,154 1,594,068
Lower Peace 20 X 103 X 171 2,667 397 15,342
Mackenzie County 12 17 69 610 92 458 216 6,365
Northern Lights County 6 19 26 455 64 749 135 6,712
Northern Sunrise County 2 X 8 X 15 1,460 46 2,265
Lower Athabasca 6 X 133 X 195 4,498 503 29,127
Bonnyville No. 87 4 X 107 X 148 4,081 374 22,080
Lac la Biche County 2 X 26 X 47 417 129 7,047
Upper Peace 20 X 315 X 512 X 1,251 68,115
Birch Hills County 3 X 28 X 36 2,243 84 6,085
Clear Hills 3 11 51 1,379 70 1,643 177 7,232
Fairview No. 136 0 0 19 321 31 X 73 2,500
Grande Prairie County No. 1 3 X 84 4,880 160 8,630 392 22,683
Greenview No. 16 6 X 69 X 108 5,937 268 14,706
Peace No. 135 0 0 13 486 22 1,068 62 2,438
Saddle Hills County 4 44 38 841 66 1,424 149 10,068
Smoky River No. 130 1 X 11 1,593 17 1,836 34 1,719
Spirit River No. 133 0 0 2 X 2 X 12 684
Upper Athabasca 65 X 565 X 808 45,497 2,228 134,092
Athabasca County 5 211 79 2,838 106 3,971 309 17,309
Barrhead County No. 11 28 1,552 79 9,882 124 19,321 340 19,564
Big Lakes 1 X 44 X 64 2,018 168 10,429
Lac Ste. Anne County 11 228 128 2,185 174 4,061 502 26,922
Lesser Slave River No.124 0 0 18 319 31 210 74 4,504
Westlock County 11 856 92 8,892 121 10,791 363 24,717
Woodlands County 4 X 42 X 61 1,195 149 7,920
Yellowhead County 5 377 83 4,901 127 3,930 323 22,727
Source: Statistics Canada, 2011 Census of Agriculture. Prepared by Alberta Agriculture and Rural Development, Economics and Competitiveness Division, Statistics and Data Development Branch.
(1) 1 Year & Over. X - Confidential. 0 - True zero or a value rounded to zero. Refer to census definitions and notes for more information.
Slaughter or Feeder Heifers(1) Steers (1) Calves - Under 1 YearDairy Replacement Heifers(1)
103

Table 19.2: Cattle and Calves, May 10, 2011
# Farms Head # Farms Head # Farms Head # Farms Head
North Saskatchewan 217 X 1,588 X 2,316 102,722 6,145 404,731
Beaver County 7 155 90 3,142 123 3,562 317 18,404
Brazeau County 3 149 62 2,746 88 1,678 224 9,041
Camrose County 16 656 93 4,733 144 6,369 386 20,744
Clearwater County 17 531 154 3,541 232 4,493 594 28,262
Edmonton 0 0 5 X 4 25 6 56
Flagstaff County 11 X 70 4,591 95 4,052 291 20,688
Lamont County 3 X 87 3,241 111 3,600 278 10,710
Leduc County 66 3,255 113 2,714 187 3,029 502 20,481
Minburn County No. 27 10 192 59 8,674 82 13,599 254 42,246
Parkland County 13 701 113 2,416 127 1,579 327 17,140
Provost No. 52 2 X 64 9,868 95 12,686 255 31,841
Smoky Lake County 5 52 43 2,877 64 2,484 225 14,493
St. Paul County No. 19 6 91 89 9,137 143 6,303 403 32,369
Strathcona County 10 235 62 1,361 88 1,302 157 4,912
Sturgeon County 10 823 62 X 97 1,436 237 11,132
Thorhild County No. 7 3 X 45 X 69 834 194 11,736
Two Hills County No. 21 4 X 61 1,747 90 2,672 274 13,758
Vermilion River County 5 78 148 11,744 209 20,103 528 46,970
Wainwright No. 61 5 392 61 4,276 98 4,983 258 24,174
Wetaskiwin County No. 10 21 1,123 107 6,655 170 7,933 435 25,574
Red Deer 239 X 1,027 X 1,552 107,944 4,400 373,541
Kneehill County 7 365 59 10,468 94 16,561 261 26,371
Lacombe County 63 4,913 117 6,838 164 9,249 488 35,734
Mountain View County 32 1,537 150 X 248 17,262 768 39,312
Paintearth County No. 18 5 348 57 4,154 103 6,977 271 23,619
Ponoka County 64 4,451 144 9,501 211 7,693 584 41,558
Red Deer County 40 2,852 160 13,528 263 14,006 692 51,237
Special Area No. 2 4 180 100 13,704 125 15,232 329 45,526
Special Area No. 3 2 X 52 X 84 4,010 239 29,172
Special Area No. 4 2 X 47 X 57 5,402 196 33,331
Starland County 8 216 25 5,374 51 403 148 12,332
Stettler County No. 6 12 681 116 13,476 152 11,149 424 35,349
Source: Statistics Canada, 2011 Census of Agriculture. Prepared by Alberta Agriculture and Rural Development, Economics and Competitiveness Division, Statistics and Data Development Branch.
(1) 1 Year & Over. X - Confidential. 0 - True zero or a value rounded to zero. Refer to census definitions and notes for more information.
Dairy Replacement Heifers(1) Slaughter or Feeder Heifers(1) Steers (1) Calves - Under 1 Year
104
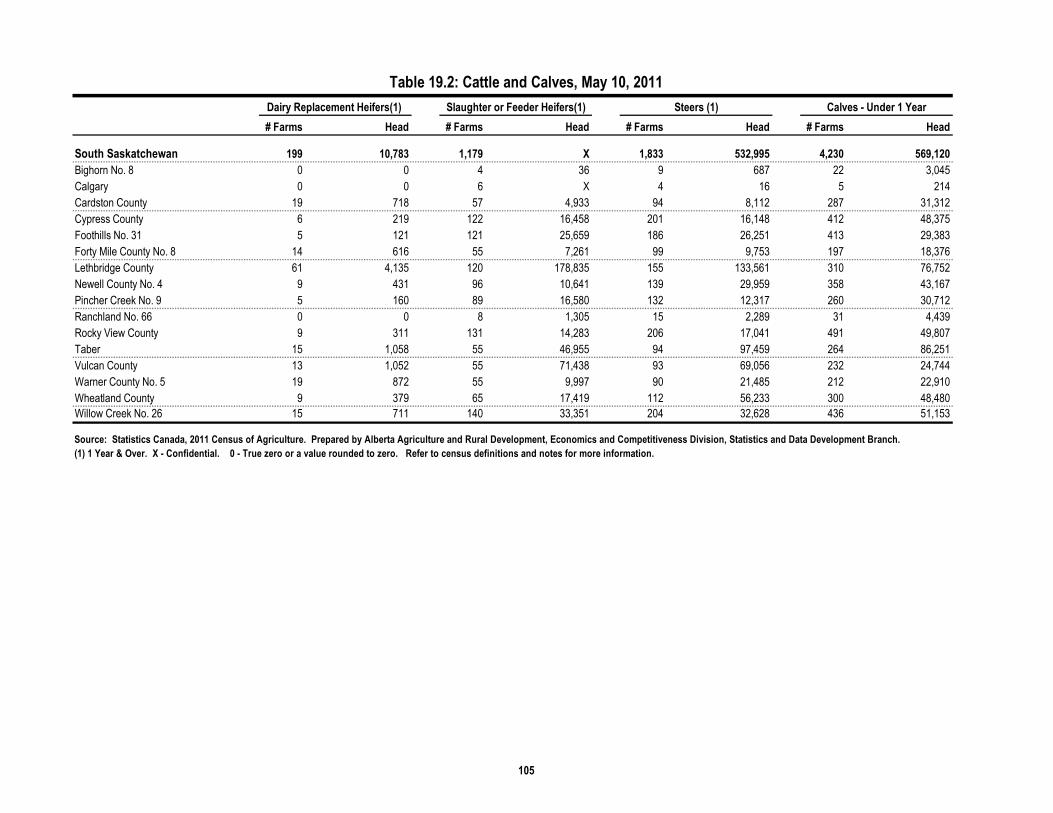
Table 19.2: Cattle and Calves, May 10, 2011
# Farms Head # Farms Head # Farms Head # Farms Head
South Saskatchewan 199 10,783 1,179 X 1,833 532,995 4,230 569,120
Bighorn No. 8 0 0 4 36 9 687 22 3,045
Calgary 0 0 6 X 4 16 5 214
Cardston County 19 718 57 4,933 94 8,112 287 31,312
Cypress County 6 219 122 16,458 201 16,148 412 48,375
Foothills No. 31 5 121 121 25,659 186 26,251 413 29,383
Forty Mile County No. 8 14 616 55 7,261 99 9,753 197 18,376
Lethbridge County 61 4,135 120 178,835 155 133,561 310 76,752
Newell County No. 4 9 431 96 10,641 139 29,959 358 43,167
Pincher Creek No. 9 5 160 89 16,580 132 12,317 260 30,712
Ranchland No. 66 0 0 8 1,305 15 2,289 31 4,439
Rocky View County 9 311 131 14,283 206 17,041 491 49,807
Taber 15 1,058 55 46,955 94 97,459 264 86,251
Vulcan County 13 1,052 55 71,438 93 69,056 232 24,744
Warner County No. 5 19 872 55 9,997 90 21,485 212 22,910
Wheatland County 9 379 65 17,419 112 56,233 300 48,480
Willow Creek No. 26 15 711 140 33,351 204 32,628 436 51,153
Source: Statistics Canada, 2011 Census of Agriculture. Prepared by Alberta Agriculture and Rural Development, Economics and Competitiveness Division, Statistics and Data Development Branch.
(1) 1 Year & Over. X - Confidential. 0 - True zero or a value rounded to zero. Refer to census definitions and notes for more information.
Slaughter or Feeder Heifers(1) Steers (1) Calves - Under 1 YearDairy Replacement Heifers(1)
105

Table 20.1: Pigs, May 10, 2011
# Farms Head # Farms Head # Farms Head # Farms Head # Farms Head # Farms Head # Farms Head
Alberta 857 1,397,534 456 4,543 507 108,322 438 500,526 303 205,372 393 295,154 603 784,143
Lower Peace 66 X 21 X 34 X 32 X 10 X 29 X 37 X
Mackenzie County 57 1,067 18 24 26 106 29 563 8 185 27 378 32 374
Northern Lights County 7 82 2 X 6 24 3 X 2 X 2 X 4 34
Northern Sunrise County 2 X 1 X 2 X 0 0 0 0 0 0 1 X
Lower Athabasca 21 142 11 9 12 31 8 48 3 29 6 19 10 X
Bonnyville No. 87 15 113 9 9 11 31 6 48 3 29 4 19 7 25
Lac la Biche County 6 29 2 X 1 X 2 X 0 0 2 X 3 18
Upper Peace 79 X 39 X 49 X 38 X 25 X 32 X 55 X
Birch Hills County 8 23,621 5 82 6 1,400 7 7,929 6 2,926 5 5,003 7 14,210
Clear Hills 18 306 10 20 12 47 8 131 5 40 7 91 16 108
Fairview No. 136 4 X 1 X 1 X 2 X 1 X 2 X 4 X
Grande Prairie County No. 1 17 8,340 11 53 12 694 10 2,659 7 1,174 8 1,485 9 4,934
Greenview No. 16 13 284 5 7 6 32 4 116 2 X 4 X 9 129
Peace No. 135 1 X 1 X 1 X 1 X 1 X 0 0 0 0
Saddle Hills County 13 634 5 8 9 X 4 X 2 X 4 158 7 302
Smoky River No. 130 5 X 1 X 2 X 2 X 1 X 2 X 3 X
Spirit River No. 133 0 0 0 0 0 0 0 0 0 0 0 0 0 0
Upper Athabasca 117 X 62 X 72 X 50 X 25 X 41 X 68 X
Athabasca County 12 X 7 32 8 X 3 X 2 X 2 X 6 X
Barrhead County No. 11 28 31,029 11 99 13 2,548 14 10,609 8 4,923 13 5,686 21 17,773
Big Lakes 11 2,855 5 15 7 170 7 1,494 3 736 7 758 7 1,176
Lac Ste. Anne County 23 X 13 36 15 318 9 X 4 X 6 X 9 X
Lesser Slave River No.124 2 X 1 X 2 X 2 X 1 X 1 X 2 X
Westlock County 20 31,621 11 90 14 3,344 7 17,291 4 9,562 6 7,729 15 10,896
Woodlands County 6 X 6 23 5 252 5 X 3 X 3 X 3 X
Yellowhead County 15 65 8 11 8 25 3 15 0 0 3 15 5 14
Source: Statistics Canada, 2011 Census of Agriculture. Prepared by Alberta Agriculture and Rural Development, Economics and Competitiveness Division, Statistics and Data Development Branch.
X - Confidential. 0 - True zero or a value rounded to zero. Refer to census definitions and notes for more information.
Nursing and Weaner PigsBoarsTotal Pigs Grower and Finishing PigsSows and Gilts - Breeding Nursing Pigs Weaner Pigs
106

Table 20.1: Pigs, May 10, 2011
# Farms Head # Farms Head # Farms Head # Farms Head # Farms Head # Farms Head # Farms Head
North Saskatchewan 227 X 115 X 124 X 98 X 63 X 85 X 151 X
Beaver County 13 38,826 8 165 7 2,856 8 11,128 7 3,750 8 7,378 11 24,677
Brazeau County 12 817 7 9 6 X 4 X 3 X 2 X 9 X
Camrose County 16 15,387 7 26 9 X 6 X 6 X 2 X 11 X
Clearwater County 16 19,646 12 57 12 1,670 10 7,931 7 3,149 10 4,782 14 9,988
Edmonton 0 0 0 0 0 0 0 0 0 0 0 0 0 0
Flagstaff County 9 X 2 X 4 X 4 X 2 X 4 X 6 X
Lamont County 11 X 8 66 8 658 7 X 6 X 7 X 8 X
Leduc County 22 16,274 12 199 14 1,385 10 6,671 7 2,432 9 4,239 9 8,019
Minburn County No. 27 7 8,159 5 65 5 1,005 6 3,471 4 1,600 5 1,871 4 3,618
Parkland County 14 X 9 X 7 X 4 10 0 0 4 10 6 83
Provost No. 52 4 X 2 X 2 X 3 X 2 X 3 X 4 X
Smoky Lake County 6 X 4 4 3 X 4 X 1 X 3 X 4 X
St. Paul County No. 19 12 X 5 X 5 24 3 X 3 X 1 X 9 X
Strathcona County 6 X 2 X 3 X 3 X 1 X 3 X 2 X
Sturgeon County 17 16,979 8 58 9 1,104 7 3,737 6 1,615 6 2,122 10 12,080
Thorhild County No. 7 7 X 4 4 4 X 1 X 0 0 1 X 3 X
Two Hills County No. 21 7 X 3 12 4 X 0 0 0 0 0 0 6 21
Vermilion River County 12 19,480 3 13 3 X 3 X 1 X 3 X 12 X
Wainwright No. 61 11 55,785 5 67 6 4,066 5 20,383 5 7,558 5 12,825 9 31,269
Wetaskiwin County No. 10 25 X 9 14 13 112 10 X 2 X 9 X 14 X
Red Deer 152 X 81 X 89 X 85 X 71 X 78 X 123 X
Kneehill County 15 46,591 11 120 11 3,598 11 17,174 11 6,757 10 10,417 14 25,699
Lacombe County 27 93,684 18 172 17 8,347 20 33,878 17 10,290 18 23,588 24 51,287
Mountain View County 18 X 6 11 8 X 7 X 4 X 4 X 13 X
Paintearth County No. 18 9 25,837 6 105 6 1,813 6 9,413 5 5,015 6 4,398 7 14,506
Ponoka County 27 57,583 11 65 15 4,091 14 15,935 8 7,068 13 8,867 16 37,492
Red Deer County 26 87,015 11 134 12 6,912 12 42,395 11 14,899 12 27,496 23 37,574
Special Area No. 2 3 X 2 X 2 X 1 X 1 X 1 X 3 X
Special Area No. 3 4 X 2 X 2 X 2 X 2 X 2 X 4 X
Special Area No. 4 1 X 1 X 1 X 1 X 1 X 1 X 1 X
Starland County 7 29,348 7 166 7 2,651 6 10,520 6 4,321 6 6,199 7 16,011
Stettler County No. 6 15 50,158 6 88 8 3,247 5 9,878 5 5,331 5 4,547 11 36,945
Source: Statistics Canada, 2011 Census of Agriculture. Prepared by Alberta Agriculture and Rural Development, Economics and Competitiveness Division, Statistics and Data Development Branch.
X - Confidential. 0 - True zero or a value rounded to zero. Refer to census definitions and notes for more information.
Nursing and Weaner Pigs Weaner PigsBoars Nursing PigsTotal Pigs Sows and Gilts - Breeding Grower and Finishing Pigs
107

Table 20.1: Pigs, May 10, 2011
# Farms Head # Farms Head # Farms Head # Farms Head # Farms Head # Farms Head # Farms Head
South Saskatchewan 195 X 127 X 127 X 127 X 106 X 122 X 159 X
Bighorn No. 8 0 0 0 0 0 0 0 0 0 0 0 0 0 0
Calgary 0 0 0 0 0 0 0 0 0 0 0 0 0 0
Cardston County 18 63,489 15 230 13 4,385 12 19,006 12 7,886 12 11,120 17 39,868
Cypress County 6 14,497 2 X 2 X 3 X 2 X 2 X 5 X
Foothills No. 31 9 X 5 22 4 X 4 X 2 X 3 X 6 X
Forty Mile County No. 8 8 31,023 8 X 8 X 8 X 8 X 8 X 8 X
Lethbridge County 27 65,673 13 91 14 4,535 12 16,370 10 6,052 12 10,318 22 44,677
Newell County No. 4 11 23,656 6 123 7 1,939 6 8,862 4 3,514 6 5,348 8 12,732
Pincher Creek No. 9 6 54,909 3 98 3 1,613 4 32,753 3 15,852 4 16,901 5 20,445
Ranchland No. 66 0 0 0 0 0 0 0 0 0 0 0 0 0 0
Rocky View County 10 17,182 4 37 4 587 7 8,056 5 4,121 6 3,935 8 8,502
Taber 22 82,928 12 149 13 5,544 14 25,202 11 9,822 14 15,380 20 52,033
Vulcan County 21 57,764 15 281 15 4,882 13 21,486 12 8,196 13 13,290 16 31,115
Warner County No. 5 22 88,368 18 438 20 8,087 18 29,462 16 11,111 17 18,351 17 50,381
Wheatland County 14 26,765 11 124 10 2,159 10 10,399 8 4,561 10 5,838 11 14,083
Willow Creek No. 26 21 32,653 15 294 14 2,502 16 15,382 13 5,887 15 9,495 16 14,475
Source: Statistics Canada, 2011 Census of Agriculture. Prepared by Alberta Agriculture and Rural Development, Economics and Competitiveness Division, Statistics and Data Development Branch.
X - Confidential. 0 - True zero or a value rounded to zero. Refer to census definitions and notes for more information.
Sows and Gilts - BreedingTotal Pigs Weaner Pigs Grower and Finishing PigsBoars Nursing and Weaner Pigs Nursing Pigs
108

Table 21.1: Sheep and Lambs, May 10, 2011
# Farms Number # Farms Number # Farms Number # Farms Number
Alberta 1,747 202,903 1,275 4,995 1,625 92,427 1,333 105,481
Lower Peace 48 3,605 33 94 43 1,781 39 1,730
Mackenzie County 29 1,434 20 41 28 622 24 771
Northern Lights County 14 1,940 9 41 11 982 10 917
Northern Sunrise County 5 231 4 12 4 177 5 42
Lower Athabasca 29 1,189 20 53 25 565 21 571
Bonnyville No. 87 24 920 17 46 21 409 18 465
Lac la Biche County 5 269 3 7 4 156 3 106
Upper Peace 133 X 99 353 117 X 92 X
Birch Hills County 10 2,523 9 43 9 1,416 6 1,064
Clear Hills 17 605 11 22 12 318 13 265
Fairview No. 136 9 1,093 8 28 9 X 6 X
Grande Prairie County No. 1 34 2,396 24 62 27 1,041 25 1,293
Greenview No. 16 35 3,524 27 121 32 1,747 25 1,656
Peace No. 135 7 X 5 22 7 386 5 X
Saddle Hills County 16 1,212 12 44 16 553 10 615
Smoky River No. 130 5 X 3 11 5 X 2 X
Spirit River No. 133 0 0 0 0 0 0 0 0
Upper Athabasca 229 24,120 183 599 213 12,287 185 11,234
Athabasca County 33 3,529 27 61 30 1,545 28 1,923
Barrhead County No. 11 48 6,143 37 121 46 3,513 34 2,509
Big Lakes 6 1,677 6 41 6 966 6 670
Lac Ste. Anne County 48 5,818 42 126 46 2,546 41 3,146
Lesser Slave River No.124 5 273 4 36 4 136 4 101
Westlock County 42 3,334 32 93 39 1,838 33 1,403
Woodlands County 12 753 9 27 9 450 9 276
Yellowhead County 35 2,593 26 94 33 1,293 30 1,206
Source: Statistics Canada, 2011 Census of Agriculture. Prepared by Alberta Agriculture and Rural Development, Economics and Competitiveness Division, Statistics and Data Development Branch.
X - Confidential. 0 - True zero or a value rounded to zero. Refer to census definitions and notes for more information.
Total Sheep and Lambs Rams Ewes Lambs
109

Table 21.1: Sheep and Lambs, May 10, 2011
# Farms Number # Farms Number # Farms Number # Farms Number
North Saskatchewan 505 X 361 X 481 X 377 X
Beaver County 18 515 11 22 18 346 12 147
Brazeau County 23 X 18 X 22 X 16 X
Camrose County 40 4,270 32 189 38 1,887 27 2,194
Clearwater County 38 2,655 27 62 37 1,171 34 1,422
Edmonton 1 X 1 X 1 X 1 X
Flagstaff County 12 859 7 19 11 452 5 388
Lamont County 20 460 14 18 19 281 12 161
Leduc County 57 2,688 42 89 53 1,155 42 1,444
Minburn County No. 27 27 4,770 20 86 26 2,309 19 2,375
Parkland County 41 10,422 29 123 38 2,975 38 7,324
Provost No. 52 9 585 7 16 9 248 8 321
Smoky Lake County 10 582 7 16 9 362 7 204
St. Paul County No. 19 17 1,306 10 27 16 582 11 697
Strathcona County 32 1,126 23 97 32 509 22 520
Sturgeon County 23 3,187 13 70 19 1,316 16 1,801
Thorhild County No. 7 8 539 8 14 8 369 6 156
Two Hills County No. 21 25 2,034 20 55 25 948 19 1,031
Vermilion River County 37 3,504 26 103 37 1,629 31 1,772
Wainwright No. 61 11 1,272 8 11 10 638 8 623
Wetaskiwin County No. 10 56 8,691 38 208 53 4,030 43 4,453
Red Deer 368 35,270 263 1,034 340 16,950 276 17,286
Kneehill County 21 2,687 15 79 17 1,094 16 1,514
Lacombe County 57 5,929 42 170 51 2,586 42 3,173
Mountain View County 78 6,350 55 206 73 2,982 56 3,162
Paintearth County No. 18 9 1,627 8 36 8 663 6 928
Ponoka County 62 4,475 48 123 57 1,959 50 2,393
Red Deer County 63 5,328 43 175 61 2,667 46 2,486
Special Area No. 2 10 448 8 19 9 242 6 187
Special Area No. 3 7 548 5 11 6 338 5 199
Special Area No. 4 6 1,921 4 25 6 814 4 1,082
Starland County 13 2,517 11 53 13 1,490 10 974
Stettler County No. 6 42 3,440 24 137 39 2,115 35 1,188
Source: Statistics Canada, 2011 Census of Agriculture. Prepared by Alberta Agriculture and Rural Development, Economics and Competitiveness Division, Statistics and Data Development Branch.
X - Confidential. 0 - True zero or a value rounded to zero. Refer to census definitions and notes for more information.
LambsTotal Sheep and Lambs Rams Ewes
110

Table 21.1: Sheep and Lambs, May 10, 2011
# Farms Number # Farms Number # Farms Number # Farms Number
South Saskatchewan 435 X 316 X 406 X 343 X
Bighorn No. 8 4 X 3 X 4 X 3 X
Calgary 0 0 0 0 0 0 0 0
Cardston County 29 13,106 24 220 28 5,305 25 7,581
Cypress County 24 2,262 20 61 21 1,106 20 1,095
Foothills No. 31 48 5,248 34 X 45 X 36 3,108
Forty Mile County No. 8 7 328 7 20 6 154 5 154
Lethbridge County 68 13,853 51 275 63 6,265 61 7,313
Newell County No. 4 35 1,883 19 44 27 917 29 922
Pincher Creek No. 9 17 4,489 10 77 17 1,916 15 2,496
Ranchland No. 66 1 X 1 X 1 X 1 X
Rocky View County 64 4,463 43 170 61 2,151 46 2,142
Taber 27 6,819 24 143 26 2,573 25 4,103
Vulcan County 20 4,388 14 62 19 1,789 15 2,537
Warner County No. 5 16 1,440 11 51 15 1,046 9 343
Wheatland County 36 4,772 27 96 36 2,037 24 2,639
Willow Creek No. 26 39 9,295 28 237 37 3,937 29 5,121
Source: Statistics Canada, 2011 Census of Agriculture. Prepared by Alberta Agriculture and Rural Development, Economics and Competitiveness Division, Statistics and Data Development Branch.
X - Confidential. 0 - True zero or a value rounded to zero. Refer to census definitions and notes for more information.
Total Sheep and Lambs Rams Ewes Lambs
111

Table 22.1: Other Livestock and Bees, May 10, 2011
# Farms Number # Farms Number # Farms Number # Farms Number # Farms Number # Farms Number
Alberta 15,001 139,410 933 28,920 39 1,859 3 X 571 57,483 445 8,129
Lower Peace 345 2,562 40 X 3 X 0 0 28 2,057 21 122
Mackenzie County 165 888 28 1,053 0 0 0 0 7 67 15 79
Northern Lights County 135 1,068 11 395 2 X 0 0 12 1,386 6 43
Northern Sunrise County 45 606 1 X 1 X 0 0 9 604 0 0
Lower Athabasca 352 3,724 22 330 0 0 0 0 14 1,522 10 X
Bonnyville No. 87 268 2,220 18 234 0 0 0 0 11 1,429 10 X
Lac la Biche County 84 1,504 4 96 0 0 0 0 3 93 0 0
Upper Peace 1,227 10,471 78 X 9 X 1 0 112 X 53 X
Birch Hills County 85 606 4 87 0 0 0 0 3 X 4 X
Clear Hills 169 1,555 11 X 2 X 0 0 11 882 12 87
Fairview No. 136 55 326 4 X 0 0 0 0 5 X 1 X
Grande Prairie County No. 1 426 3,865 24 1,266 4 26 1 X 52 5,823 11 116
Greenview No. 16 265 2,287 21 1,197 2 X 0 0 20 2,054 12 399
Peace No. 135 46 295 4 21 0 0 0 0 3 122 3 20
Saddle Hills County 134 922 8 366 0 0 0 0 11 2,031 10 65
Smoky River No. 130 31 327 2 X 0 0 0 0 7 588 0 0
Spirit River No. 133 16 288 0 0 1 X 0 0 0 0 0 0
Upper Athabasca 1,521 14,803 146 2,669 6 X 1 X 64 4,660 61 X
Athabasca County 204 2,360 21 330 1 X 0 0 10 881 10 65
Barrhead County No. 11 172 1,196 22 692 0 0 1 X 12 460 6 X
Big Lakes 141 1,084 8 154 0 0 0 0 4 380 4 6
Lac Ste. Anne County 374 3,698 29 407 3 X 0 0 12 588 11 139
Lesser Slave River No.124 49 369 7 343 0 0 0 0 4 425 3 31
Westlock County 184 1,421 18 353 0 0 0 0 9 1,026 9 45
Woodlands County 102 850 9 102 1 X 0 0 4 512 7 36
Yellowhead County 295 3,825 32 288 1 X 0 0 9 388 11 32
Source: Statistics Canada, 2011 Census of Agriculture. Prepared by Alberta Agriculture and Rural Development, Economics and Competitiveness Division, Statistics and Data Development Branch.
X - Confidential. 0 - True zero or a value rounded to zero. Refer to census definitions and notes for more information.
Bison (Buffalo)Horses and Ponies Goats Wild Boars Mink Rabbits
112

Table 22.1: Other Livestock and Bees, May 10, 2011
# Farms Number # Farms Number # Farms Number # Farms Number # Farms Number # Farms Number
North Saskatchewan 4,618 42,413 301 8,125 11 X 0 0 194 18,733 150 X
Beaver County 209 1,542 10 196 0 0 0 0 7 298 8 318
Brazeau County 209 2,069 13 179 0 0 0 0 16 1,252 5 46
Camrose County 287 2,095 18 270 0 0 0 0 3 502 13 201
Clearwater County 518 5,125 29 352 2 X 0 0 16 1,094 23 125
Edmonton 12 107 0 0 0 0 0 0 0 0 0 0
Flagstaff County 170 1,320 7 75 0 0 0 0 3 144 4 16
Lamont County 165 1,182 18 699 2 X 0 0 12 1,521 4 44
Leduc County 370 3,702 36 1,329 0 0 0 0 13 683 18 180
Minburn County No. 27 166 1,120 6 44 2 X 0 0 9 2,178 6 77
Parkland County 321 3,923 27 736 1 X 0 0 13 1,360 7 43
Provost No. 52 147 919 8 38 0 0 0 0 3 53 4 26
Smoky Lake County 130 981 11 320 0 0 0 0 7 892 5 137
St. Paul County No. 19 232 1,933 18 914 2 X 0 0 7 1,220 2 X
Strathcona County 268 2,859 17 150 1 X 0 0 6 130 9 64
Sturgeon County 238 2,444 20 718 0 0 0 0 14 654 13 164
Thorhild County No. 7 127 1,470 6 396 0 0 0 0 8 324 2 X
Two Hills County No. 21 126 1,083 10 538 0 0 0 0 5 371 7 97
Vermilion River County 381 2,803 18 520 1 X 0 0 13 3,268 6 20
Wainwright No. 61 172 1,285 9 312 0 0 0 0 6 878 2 X
Wetaskiwin County No. 10 370 4,451 20 339 0 0 0 0 33 1,911 12 106
Red Deer 3,119 27,821 188 X 5 X 1 X 95 X 75 X
Kneehill County 191 1,283 10 641 0 0 0 0 10 418 2 X
Lacombe County 340 3,627 28 844 1 X 0 0 17 3,112 10 62
Mountain View County 705 6,160 44 991 1 X 0 0 11 1,002 14 102
Paintearth County No. 18 151 1,177 7 221 1 X 0 0 5 158 6 X
Ponoka County 390 3,860 29 1,000 0 0 1 X 19 2,690 19 69
Red Deer County 580 4,885 35 970 0 0 0 0 17 1,136 11 84
Special Area No. 2 207 1,936 4 111 0 0 0 0 0 0 1 X
Special Area No. 3 110 742 7 X 0 0 0 0 3 1,042 2 X
Special Area No. 4 93 866 5 X 1 X 0 0 1 X 1 X
Starland County 78 554 5 X 0 0 0 0 3 X 3 17
Stettler County No. 6 274 2,731 14 682 1 X 0 0 9 1,775 6 31
Source: Statistics Canada, 2011 Census of Agriculture. Prepared by Alberta Agriculture and Rural Development, Economics and Competitiveness Division, Statistics and Data Development Branch.
X - Confidential. 0 - True zero or a value rounded to zero. Refer to census definitions and notes for more information.
Bison (Buffalo)Horses and Ponies Goats Wild Boars Mink Rabbits
113

Table 22.1: Other Livestock and Bees, May 10, 2011
# Farms Number # Farms Number # Farms Number # Farms Number # Farms Number # Farms Number
South Saskatchewan 3,819 37,616 158 X 5 X 0 0 64 X 75 X
Bighorn No. 8 30 863 1 X 0 0 0 0 0 0 0 0
Calgary 22 288 0 0 0 0 0 0 0 0 0 0
Cardston County 231 2,435 6 X 0 0 0 0 0 0 4 37
Cypress County 305 1,790 10 63 0 0 0 0 3 X 4 X
Foothills No. 31 652 6,831 20 167 1 X 0 0 22 675 7 40
Forty Mile County No. 8 115 744 6 14 0 0 0 0 2 X 2 X
Lethbridge County 218 1,876 22 3,606 0 0 0 0 3 X 22 X
Newell County No. 4 246 1,909 7 405 0 0 0 0 2 X 1 X
Pincher Creek No. 9 249 3,321 6 78 0 0 0 0 6 326 2 X
Ranchland No. 66 40 599 1 X 0 0 0 0 1 X 0 0
Rocky View County 630 6,078 30 397 1 X 0 0 8 X 7 104
Taber 146 899 6 469 0 0 0 0 1 X 8 20
Vulcan County 159 1,314 12 363 1 X 0 0 6 434 4 X
Warner County No. 5 147 999 6 58 1 X 0 0 0 0 4 31
Wheatland County 271 2,123 11 X 1 X 0 0 2 X 6 35
Willow Creek No. 26 358 5,547 14 1,525 0 0 0 0 8 3,885 4 X
Source: Statistics Canada, 2011 Census of Agriculture. Prepared by Alberta Agriculture and Rural Development, Economics and Competitiveness Division, Statistics and Data Development Branch.
X - Confidential. 0 - True zero or a value rounded to zero. Refer to census definitions and notes for more information.
Bison (Buffalo)Horses and Ponies Goats Wild Boars Mink Rabbits
114

Table 22.2: Other Livestock and Bees, May 10, 2011
# Farms Number # Farms Number # Farms Number # Farms Number # Farms Number
Alberta 43 2,344 244 16,286 1,376 11,740 386 235,951 111 189,510
Lower Peace 0 0 14 X 23 151 9 X 3 X
Mackenzie County 0 0 3 353 6 29 2 X 2 X
Northern Lights County 0 0 10 892 11 97 2 X 0 0
Northern Sunrise County 0 0 1 X 6 25 5 3,650 1 X
Lower Athabasca 4 174 4 X 41 230 8 X 1 X
Bonnyville No. 87 4 174 3 X 34 182 7 X 0 0
Lac la Biche County 0 0 1 X 7 48 1 X 1 X
Upper Peace 6 119 44 X 114 X 47 X 6 X
Birch Hills County 0 0 2 X 2 X 3 X 1 X
Clear Hills 0 0 6 182 7 67 2 X 0 0
Fairview No. 136 0 0 0 0 8 35 3 X 2 X
Grande Prairie County No. 1 3 96 21 1,149 41 399 13 10,419 1 X
Greenview No. 16 3 23 6 432 23 241 5 X 0 0
Peace No. 135 0 0 0 0 5 X 4 2,542 1 X
Saddle Hills County 0 0 6 633 20 96 6 4,126 0 0
Smoky River No. 130 0 0 1 X 7 92 10 21,870 1 X
Spirit River No. 133 0 0 2 X 1 X 1 X 0 0
Upper Athabasca 4 X 46 X 203 1,315 50 X 2 X
Athabasca County 3 X 2 X 29 141 5 X 0 0
Barrhead County No. 11 0 0 3 67 28 200 6 7,343 0 0
Big Lakes 0 0 1 X 4 12 11 4,921 0 0
Lac Ste. Anne County 1 X 8 371 57 381 9 5,152 1 X
Lesser Slave River No.124 0 0 1 X 4 9 0 0 0 0
Westlock County 0 0 1 X 38 180 11 10,316 1 X
Woodlands County 0 0 4 252 18 98 0 0 0 0
Yellowhead County 0 0 26 1,323 25 294 8 479 0 0
Source: Statistics Canada, 2011 Census of Agriculture. Prepared by Alberta Agriculture and Rural Development, Economics and Competitiveness Division, Statistics and Data Development Branch.
X - Confidential. 0 - True zero or a value rounded to zero. Refer to census definitions and notes for more information.
Deer (excl. wild deer) Elk Gallons of Other Pollinating BeesLlamas and Alpacas Colonies of Honey Bees
115

Table 22.2: Other Livestock and Bees, May 10, 2011
# Farms Number # Farms Number # Farms Number # Farms Number # Farms Number
North Saskatchewan 13 X 77 X 459 3,998 140 X 9 X
Beaver County 0 0 3 X 19 328 4 418 0 0
Brazeau County 0 0 3 X 22 158 6 1,050 0 0
Camrose County 0 0 2 X 18 42 9 X 0 0
Clearwater County 3 80 7 151 49 476 6 122 0 0
Edmonton 0 0 0 0 0 0 10 X 0 0
Flagstaff County 0 0 1 X 9 65 2 X 1 X
Lamont County 1 X 5 89 27 121 11 4,243 0 0
Leduc County 1 X 10 1,240 44 280 10 X 0 0
Minburn County No. 27 1 X 6 391 18 219 5 X 2 X
Parkland County 0 0 5 167 37 550 12 11,742 1 X
Provost No. 52 0 0 1 X 6 53 1 X 0 0
Smoky Lake County 0 0 0 0 16 102 6 4,036 0 0
St. Paul County No. 19 0 0 5 263 24 81 10 9,450 1 X
Strathcona County 2 X 3 123 25 254 12 897 0 0
Sturgeon County 0 0 1 X 37 317 11 11,111 0 0
Thorhild County No. 7 1 X 2 X 16 72 3 X 0 0
Two Hills County No. 21 0 0 2 X 18 399 5 X 1 X
Vermilion River County 2 X 12 1,623 30 165 4 21 1 X
Wainwright No. 61 0 0 2 X 7 37 3 X 0 0
Wetaskiwin County No. 10 2 X 7 763 37 279 10 1,119 2 X
Red Deer 9 X 42 X 289 2,295 55 X 5 X
Kneehill County 1 X 5 X 8 322 6 X 0 0
Lacombe County 2 X 14 678 44 193 8 1,555 2 X
Mountain View County 1 X 4 59 64 530 10 460 0 0
Paintearth County No. 18 0 0 0 0 14 59 5 50 0 0
Ponoka County 1 X 5 442 35 370 8 464 1 X
Red Deer County 3 28 13 778 71 554 10 4,510 0 0
Special Area No. 2 0 0 0 0 15 95 0 0 0 0
Special Area No. 3 0 0 1 X 3 X 0 0 0 0
Special Area No. 4 0 0 0 0 2 X 1 X 1 X
Starland County 0 0 0 0 8 9 4 X 0 0
Stettler County No. 6 1 X 0 0 25 163 3 X 1 X
Source: Statistics Canada, 2011 Census of Agriculture. Prepared by Alberta Agriculture and Rural Development, Economics and Competitiveness Division, Statistics and Data Development Branch.
X - Confidential. 0 - True zero or a value rounded to zero. Refer to census definitions and notes for more information.
Colonies of Honey Bees Gallons of Other Pollinating BeesDeer (excl. wild deer) Elk Llamas and Alpacas
116

Table 22.2: Other Livestock and Bees, May 10, 2011
# Farms Number # Farms Number # Farms Number # Farms Number # Farms Number
South Saskatchewan 7 X 17 X 247 X 77 X 85 X
Bighorn No. 8 0 0 0 0 2 X 0 0 0 0
Calgary 0 0 0 0 1 X 7 70 0 0
Cardston County 1 X 1 X 12 61 6 73 3 X
Cypress County 1 X 0 0 15 60 3 X 0 0
Foothills No. 31 0 0 6 851 35 X 10 13,768 2 X
Forty Mile County No. 8 0 0 0 0 8 20 1 X 0 0
Lethbridge County 0 0 1 X 32 175 7 X 2 X
Newell County No. 4 0 0 1 X 16 115 6 24,960 62 57,393
Pincher Creek No. 9 0 0 0 0 12 91 2 X 0 0
Ranchland No. 66 0 0 0 0 2 X 1 X 0 0
Rocky View County 2 X 3 151 41 812 10 286 1 X
Taber 1 X 2 X 18 460 2 X 9 103,946
Vulcan County 0 0 1 X 13 195 7 472 4 X
Warner County No. 5 1 X 1 X 10 35 2 X 1 X
Wheatland County 1 X 0 0 20 185 5 140 0 0
Willow Creek No. 26 0 0 1 X 10 163 8 23,010 1 X
Source: Statistics Canada, 2011 Census of Agriculture. Prepared by Alberta Agriculture and Rural Development, Economics and Competitiveness Division, Statistics and Data Development Branch.
X - Confidential. 0 - True zero or a value rounded to zero. Refer to census definitions and notes for more information.
Llamas and Alpacas Colonies of Honey Bees Gallons of Other Pollinating BeesDeer (excl. wild deer) Elk
117

Table 23.1: Farm Machinery Inventory and Market Value, 2011
Market Value Market Value Market Value Market Value
# Farms # Tractors ($'000) # Farms # Tractors ($'000) # Farms # Tractors ($'000) # Farms # Tractors ($'000)
Alberta 40,223 151,466 3,316,528 28,136 65,779 350,831 19,996 27,851 410,330 21,953 33,218 973,787
Lower Peace 1,194 4,526 82,282 836 1,942 10,901 564 752 8,656 665 925 19,486
Mackenzie County 597 2,114 34,525 434 956 5,991 276 345 4,348 309 411 8,586
Northern Lights County 427 1,686 32,643 287 689 3,234 199 279 2,632 254 369 8,210
Northern Sunrise County 170 726 15,114 115 297 1,676 89 128 1,676 102 145 2,690
Lower Athabasca 921 3,456 56,692 613 1,480 7,488 522 740 9,564 519 840 22,250
Bonnyville No. 87 695 2,626 41,685 472 1,139 5,866 393 554 6,705 390 624 15,703
Lac la Biche County 226 830 15,007 141 341 1,622 129 186 2,859 129 216 6,547
Upper Peace 3,575 13,481 266,959 2,371 5,633 28,017 1,675 2,259 29,035 2,041 2,988 72,506
Birch Hills County 280 1,184 30,303 180 458 2,668 127 178 1,860 177 263 6,979
Clear Hills 414 1,469 26,432 249 549 2,654 183 241 2,651 258 368 7,787
Fairview No. 136 215 847 17,573 141 349 1,567 93 135 1,877 125 172 4,002
Grande Prairie County No. 1 1,123 3,920 71,595 766 1,751 8,736 530 699 10,461 608 859 22,271
Greenview No. 16 603 2,150 37,608 376 904 4,325 306 416 5,085 333 505 13,751
Peace No. 135 152 577 10,367 99 223 1,026 83 106 1,539 85 131 2,944
Saddle Hills County 433 1,766 33,009 286 736 3,170 202 282 3,071 252 402 9,282
Smoky River No. 130 290 1,322 33,957 228 558 3,372 123 169 2,019 164 243 4,221
Spirit River No. 133 65 246 6,116 46 105 499 28 33 473 39 45 1,269
Upper Athabasca 4,369 16,669 281,988 3,005 7,208 33,437 2,481 3,640 47,878 2,458 3,835 101,263
Athabasca County 670 2,685 42,524 464 1,174 5,461 378 565 6,488 407 644 15,703
Barrhead County No. 11 640 2,502 48,174 443 1,016 4,237 370 598 8,592 356 528 15,295
Big Lakes 359 1,279 22,115 214 499 2,563 164 228 2,692 222 364 8,802
Lac Ste. Anne County 877 3,272 47,802 620 1,464 6,660 509 731 9,658 477 785 20,445
Lesser Slave River No.124 155 615 8,499 102 240 997 93 143 1,812 98 160 3,425
Westlock County 729 2,894 64,719 521 1,230 6,153 391 547 7,634 433 646 19,306
Woodlands County 286 1,029 13,894 200 486 2,341 184 262 3,475 132 197 4,994
Yellowhead County 653 2,393 34,262 441 1,099 5,025 392 566 7,527 333 511 13,294
Source: Statistics Canada, 2011 Census of Agriculture. Prepared by Alberta Agriculture and Rural Development, Economics and Competitiveness Division, Statistics and Data Development Branch.
0 - True zero or a value rounded to zero. Total may not add up due to rounding. Refer to census definitions and notes for more information.
Total Tractors Tractors Under 60 hp Tractors 60 to 99 hp Tractors 100 to 149 hp
118

Table 23.1: Farm Machinery Inventory and Market Value, 2011
Market Value Market Value Market Value Market Value
# Farms # Tractors ($'000) # Farms # Tractors ($'000) # Farms # Tractors ($'000) # Farms # Tractors ($'000)
North Saskatchewan 13,189 49,296 990,950 9,336 21,844 114,476 6,762 9,618 134,438 7,123 10,658 300,990
Beaver County 641 2,389 52,233 438 953 4,761 313 438 5,828 386 567 15,031
Brazeau County 472 1,738 22,787 329 790 3,772 293 447 5,812 255 392 9,980
Camrose County 945 3,572 77,738 681 1,567 8,275 487 652 9,221 507 731 18,618
Clearwater County 1,007 3,812 51,476 715 1,787 8,023 625 966 13,748 525 796 20,139
Edmonton 52 174 2,623 43 106 713 23 37 720 12 16 474
Flagstaff County 604 2,366 69,397 436 970 5,256 265 350 5,789 352 470 13,614
Lamont County 710 2,640 52,905 487 1,138 6,168 370 525 6,224 398 570 15,847
Leduc County 1,214 4,656 83,360 901 2,157 11,919 667 985 13,935 632 977 28,519
Minburn County No. 27 559 2,169 52,882 379 901 4,555 251 344 4,179 316 455 13,402
Parkland County 735 2,576 41,884 553 1,224 6,817 397 586 8,810 322 511 14,349
Provost No. 52 385 1,574 41,594 270 610 3,212 164 224 3,892 276 434 14,147
Smoky Lake County 422 1,536 28,523 264 651 2,974 215 298 3,819 257 391 10,651
St. Paul County No. 19 732 2,710 47,151 478 1,165 5,651 346 480 5,434 439 683 18,845
Strathcona County 616 1,933 30,547 474 1,070 6,375 326 447 6,751 189 290 7,750
Sturgeon County 774 2,761 61,234 589 1,362 8,898 391 535 8,862 321 476 14,471
Thorhild County No. 7 445 1,875 30,980 313 807 3,592 246 376 4,629 263 422 9,609
Two Hills County No. 21 527 1,941 41,190 355 788 3,682 256 354 3,979 323 461 11,868
Vermilion River County 979 3,637 92,571 643 1,469 8,116 397 519 6,939 607 910 30,661
Wainwright No. 61 472 1,754 50,277 315 681 3,643 195 255 4,178 285 432 14,530
Wetaskiwin County No. 10 898 3,483 59,601 673 1,648 8,074 535 800 11,691 458 674 18,486
Red Deer 8,041 30,465 709,650 5,726 13,323 70,892 3,879 5,299 83,576 4,532 6,836 213,550
Kneehill County 637 2,572 77,938 476 1,115 7,259 305 407 6,754 350 483 15,914
Lacombe County 981 3,447 84,409 706 1,608 9,721 491 654 12,099 467 625 21,407
Mountain View County 1,509 5,337 102,204 1,073 2,497 13,565 762 1,037 15,617 778 1,148 33,626
Paintearth County No. 18 391 1,454 29,224 265 582 2,652 153 215 3,039 250 371 9,795
Ponoka County 1,041 3,870 78,409 728 1,664 7,926 563 815 11,395 589 895 27,783
Red Deer County 1,433 5,128 115,895 1,045 2,342 12,341 699 937 14,791 752 1,119 36,286
Special Area No. 2 430 1,913 49,548 296 798 4,552 223 316 5,789 278 476 16,449
Special Area No. 3 431 1,748 45,178 275 602 2,934 162 216 2,996 299 480 14,450
Special Area No. 4 260 1,187 30,483 195 486 2,420 96 131 1,973 193 327 10,445
Starland County 284 1,324 37,648 205 539 2,381 137 188 2,815 173 297 7,837
Stettler County No. 6 644 2,485 58,713 462 1,090 5,139 288 383 6,308 403 615 19,558
Source: Statistics Canada, 2011 Census of Agriculture. Prepared by Alberta Agriculture and Rural Development, Economics and Competitiveness Division, Statistics and Data Development Branch.
0 - True zero or a value rounded to zero. Total may not add up due to rounding. Refer to census definitions and notes for more information.
Tractors 100 to 149 hpTotal Tractors Tractors Under 60 hp Tractors 60 to 99 hp
119

Table 23.1: Farm Machinery Inventory and Market Value, 2011
Market Value Market Value Market Value Market Value
# Farms # Tractors ($'000) # Farms # Tractors ($'000) # Farms # Tractors ($'000) # Farms # Tractors ($'000)
South Saskatchewan 8,934 33,575 928,008 6,249 14,353 85,620 4,113 5,551 97,184 4,615 7,143 243,743
Bighorn No. 8 37 118 2,120 26 59 273 21 35 573 13 17 839
Calgary 36 130 4,106 29 72 527 13 16 309 11 23 968
Cardston County 455 1,696 45,928 276 667 3,613 227 313 5,157 246 407 13,570
Cypress County 732 2,689 63,706 500 1,135 6,422 323 450 7,541 416 658 23,137
Foothills No. 31 1,100 3,362 67,587 810 1,758 11,648 483 624 11,369 427 629 20,584
Forty Mile County No. 8 487 2,139 74,480 350 782 4,318 209 284 6,062 304 461 14,884
Lethbridge County 832 3,546 91,996 606 1,490 8,223 425 623 10,093 448 736 23,199
Newell County No. 4 650 2,571 56,590 434 1,065 5,331 306 424 6,805 411 643 20,010
Pincher Creek No. 9 395 1,230 32,706 250 556 3,342 209 278 6,420 176 262 11,576
Ranchland No. 66 52 117 2,313 32 62 624 20 27 536 18 22 773
Rocky View County 1,151 3,932 87,395 869 1,990 12,215 516 682 12,027 491 741 25,228
Taber 601 2,658 114,012 369 850 5,856 263 349 5,688 359 565 18,121
Vulcan County 550 2,286 83,855 372 835 5,404 245 322 5,674 316 485 17,550
Warner County No. 5 451 1,883 53,802 325 755 4,777 207 278 4,809 250 391 13,080
Wheatland County 709 2,802 90,356 506 1,183 7,187 290 405 6,150 390 595 21,743
Willow Creek No. 26 696 2,416 57,056 495 1,094 5,859 356 441 7,972 339 508 18,482
Source: Statistics Canada, 2011 Census of Agriculture. Prepared by Alberta Agriculture and Rural Development, Economics and Competitiveness Division, Statistics and Data Development Branch.
0 - True zero or a value rounded to zero. Total may not add up due to rounding. Refer to census definitions and notes for more information.
Total Tractors Tractors Under 60 hp Tractors 60 to 99 hp Tractors 100 to 149 hp
120

Table 23.2: Farm Machinery Inventory and Market Value, 2011
Market Value Total Total Market Value Total Total Market Value Market Value
# Farms # Tractors ($'000) # Farms # Vehicles ($'000) # Farms # Trucks ($'000) # Farms # Vehicles ($'000)
Alberta 15,202 24,618 1,581,580 19,332 23,765 318,976 40,450 132,014 1,811,640 38,041 78,975 1,011,265
Lower Peace 598 910 43,239 569 702 7,665 1,191 4,071 47,586 1,135 2,294 25,164
Mackenzie County 297 403 15,600 320 386 3,515 596 1,869 21,348 569 1,054 10,752
Northern Lights County 215 350 18,566 181 224 2,891 425 1,567 18,112 405 899 10,442
Northern Sunrise County 86 157 9,073 68 92 1,259 170 635 8,126 161 341 3,970
Lower Athabasca 279 397 17,390 382 468 5,556 907 2,576 31,489 840 1,590 20,923
Bonnyville No. 87 219 309 13,411 284 346 4,261 685 1,950 23,576 632 1,205 15,481
Lac la Biche County 60 88 3,979 98 122 1,295 222 626 7,913 208 385 5,442
Upper Peace 1,602 2,605 137,401 1,623 1,956 27,155 3,559 11,821 155,432 3,367 6,762 88,545
Birch Hills County 168 285 18,797 129 159 2,071 280 1,208 17,475 264 651 8,265
Clear Hills 191 311 13,340 196 240 3,055 414 1,355 15,848 397 787 9,843
Fairview No. 136 115 192 10,127 101 124 1,582 211 767 10,087 200 400 4,964
Grande Prairie County No. 1 401 611 30,127 490 583 8,467 1,113 3,084 40,907 1,048 1,843 25,499
Greenview No. 16 205 326 14,447 263 309 4,349 580 1,639 21,358 538 1,041 14,562
Peace No. 135 72 118 4,858 70 80 914 154 564 6,095 142 304 3,451
Saddle Hills County 212 347 17,485 197 229 2,775 442 1,507 19,372 425 878 10,944
Smoky River No. 130 203 352 24,344 148 197 3,440 300 1,445 20,323 289 717 8,952
Spirit River No. 133 35 63 3,875 29 35 503 65 252 3,966 64 141 2,066
Upper Athabasca 1,355 1,988 99,410 2,042 2,428 29,134 4,320 12,194 144,987 4,107 7,464 91,011
Athabasca County 204 302 14,873 297 352 4,661 648 1,935 22,987 611 1,160 14,831
Barrhead County No. 11 245 360 20,049 299 353 3,989 632 1,823 21,236 607 1,063 12,118
Big Lakes 131 188 8,059 153 184 2,376 359 1,033 12,510 338 629 8,268
Lac Ste. Anne County 205 293 11,039 426 515 5,346 881 2,340 26,072 841 1,493 18,296
Lesser Slave River No.124 48 72 2,265 88 103 1,175 152 451 4,701 146 293 3,299
Westlock County 309 471 31,626 361 431 5,616 748 2,415 31,533 714 1,324 15,500
Woodlands County 64 85 3,084 107 123 1,508 267 638 7,256 254 434 5,459
Yellowhead County 149 217 8,416 311 367 4,464 633 1,559 18,691 596 1,068 13,240
Source: Statistics Canada, 2011 Census of Agriculture. Prepared by Alberta Agriculture and Rural Development, Economics and Competitiveness Division, Statistics and Data Development Branch.
0 - True zero or a value rounded to zero. Total may not add up due to rounding. Refer to census definitions and notes for more information.
Tractors Over 149 hp Pick-ups and Cargo VansCars and Other Passenger Vehicles Total Farm Trucks
121

Table 23.2: Farm Machinery Inventory and Market Value, 2011
Market Value Total Total Market Value Total Total Market Value Market Value
# Farms # Tractors ($'000) # Farms # Vehicles ($'000) # Farms # Trucks ($'000) # Farms # Vehicles ($'000)
North Saskatchewan 4,793 7,180 441,046 6,354 7,709 99,820 13,106 40,817 544,316 12,277 24,205 304,246
Beaver County 296 430 26,614 307 384 4,838 643 2,289 28,929 615 1,328 15,747
Brazeau County 81 110 3,223 213 256 2,861 444 1,089 12,645 403 691 8,673
Camrose County 422 622 41,625 484 587 7,571 957 3,097 42,260 912 1,769 22,092
Clearwater County 194 264 9,565 478 573 6,867 1,000 2,507 27,688 925 1,634 19,709
Edmonton 6 15 716 25 36 516 58 154 1,952 51 102 1,155
Flagstaff County 378 576 44,738 353 414 6,650 625 2,284 33,681 594 1,288 15,906
Lamont County 278 406 24,666 336 422 5,004 713 2,402 31,464 668 1,357 15,746
Leduc County 353 536 28,987 564 673 8,183 1,153 3,333 42,358 1,080 1,965 24,417
Minburn County No. 27 308 469 30,746 272 345 5,384 582 2,164 32,362 555 1,213 15,291
Parkland County 178 256 11,907 329 395 4,869 708 1,845 22,926 646 1,126 14,191
Provost No. 52 190 306 20,343 213 256 3,407 416 1,589 20,882 396 947 11,422
Smoky Lake County 139 196 11,078 202 252 2,727 436 1,375 16,433 399 830 10,211
St. Paul County No. 19 256 382 17,221 359 428 6,098 743 2,184 26,930 692 1,346 16,215
Strathcona County 90 127 9,671 254 318 3,963 560 1,351 19,471 515 855 11,252
Sturgeon County 258 387 29,004 354 431 5,280 741 2,244 34,251 689 1,243 17,220
Thorhild County No. 7 187 272 13,150 198 241 2,840 447 1,454 17,189 435 886 10,164
Two Hills County No. 21 223 339 21,662 250 313 3,844 527 1,834 25,548 498 1,080 13,029
Vermilion River County 462 739 46,855 479 586 8,050 985 3,405 49,451 928 2,012 28,063
Wainwright No. 61 249 386 27,926 233 265 4,190 471 1,712 26,221 440 1,021 14,274
Wetaskiwin County No. 10 245 362 21,350 451 534 6,680 897 2,505 31,675 836 1,512 19,471
Red Deer 3,068 5,011 341,632 4,051 4,963 68,154 8,156 26,085 357,731 7,662 15,837 205,180
Kneehill County 343 568 48,011 361 444 6,723 662 2,524 43,098 639 1,444 20,037
Lacombe County 323 561 41,181 474 579 8,193 968 2,818 40,118 898 1,686 22,330
Mountain View County 430 655 39,396 734 906 11,086 1,517 4,103 52,488 1,411 2,571 32,471
Paintearth County No. 18 171 286 13,738 209 258 3,345 409 1,435 16,066 390 903 9,805
Ponoka County 323 497 31,306 505 601 7,602 1,047 2,947 37,873 989 1,874 23,527
Red Deer County 461 730 52,477 722 880 11,867 1,417 4,126 54,130 1,324 2,522 32,282
Special Area No. 2 189 323 22,759 219 280 4,799 452 1,737 26,707 418 1,093 15,803
Special Area No. 3 275 451 24,798 215 266 3,986 446 1,837 24,009 421 1,060 13,917
Special Area No. 4 145 243 15,644 127 156 2,322 274 1,181 15,779 257 707 8,794
Starland County 166 300 24,616 148 207 2,835 290 1,274 18,182 277 681 8,177
Stettler County No. 6 242 397 27,708 337 386 5,395 674 2,103 29,280 638 1,296 18,036
Source: Statistics Canada, 2011 Census of Agriculture. Prepared by Alberta Agriculture and Rural Development, Economics and Competitiveness Division, Statistics and Data Development Branch.
0 - True zero or a value rounded to zero. Total may not add up due to rounding. Refer to census definitions and notes for more information.
Cars and Other Passenger Vehicles Total Farm TrucksTractors Over 149 hp Pick-ups and Cargo Vans
122

Table 23.2: Farm Machinery Inventory and Market Value, 2011
Market Value Total Total Market Value Total Total Market Value Market Value
# Farms # Tractors ($'000) # Farms # Vehicles ($'000) # Farms # Trucks ($'000) # Farms # Vehicles ($'000)
South Saskatchewan 3,507 6,530 501,461 4,311 5,548 81,493 9,211 34,457 530,099 8,653 20,832 276,196
Bighorn No. 8 5 7 436 12 16 214 38 119 1,509 36 85 1,077
Calgary 8 19 2,302 19 22 275 39 95 1,993 34 54 1,135
Cardston County 154 310 23,587 240 307 4,119 475 1,698 24,078 449 1,066 14,152
Cypress County 273 446 26,607 325 399 5,996 772 2,633 38,482 720 1,688 24,205
Foothills No. 31 221 352 23,986 430 532 7,579 1,096 2,963 42,537 1,017 1,949 27,888
Forty Mile County No. 8 327 612 49,216 246 350 6,257 496 2,464 38,265 475 1,348 17,848
Lethbridge County 374 697 50,480 388 508 7,006 877 3,572 54,151 820 2,053 23,072
Newell County No. 4 275 439 24,444 357 454 6,820 673 2,517 36,125 648 1,589 20,104
Pincher Creek No. 9 64 134 11,368 213 278 3,481 424 1,242 17,997 383 814 10,854
Ranchland No. 66 6 6 380 18 24 246 52 115 2,048 45 82 1,488
Rocky View County 298 520 37,925 511 648 9,210 1,142 3,362 50,910 1,057 2,153 30,910
Taber 366 893 84,347 297 388 6,293 622 3,310 58,067 587 1,808 22,304
Vulcan County 345 644 55,226 290 369 6,008 573 2,886 44,458 548 1,628 20,252
Warner County No. 5 243 459 31,136 219 291 3,559 472 2,113 30,917 457 1,236 14,495
Wheatland County 330 618 55,276 377 486 7,918 721 2,864 50,442 677 1,662 23,730
Willow Creek No. 26 218 374 24,744 369 476 6,512 739 2,504 38,122 700 1,617 22,683
Source: Statistics Canada, 2011 Census of Agriculture. Prepared by Alberta Agriculture and Rural Development, Economics and Competitiveness Division, Statistics and Data Development Branch.
0 - True zero or a value rounded to zero. Total may not add up due to rounding. Refer to census definitions and notes for more information.
Tractors Over 149 hp Pick-ups and Cargo VansCars and Other Passenger Vehicles Total Farm Trucks
123

Table 23.3: Farm Machinery Inventory and Market Value, 2011
Market Value Market Value Market Value Market Value
# Farms # Trucks ($'000) # Farms # Combines ($'000) # Farms # Total ($'000) # Farms # Balers ($'000)
Alberta 25,578 53,040 800,375 18,395 25,348 1,520,450 26,527 39,854 615,695 22,557 30,697 300,243
Lower Peace 846 1,777 22,422 757 1,106 47,324 839 1,146 14,888 527 702 5,699
Mackenzie County 422 815 10,596 392 563 18,809 389 507 5,951 229 283 1,908
Northern Lights County 300 668 7,670 269 391 19,183 327 457 5,232 225 319 2,270
Northern Sunrise County 124 294 4,156 96 152 9,331 123 182 3,705 73 100 1,521
Lower Athabasca 536 986 10,566 402 532 11,922 628 896 10,456 656 892 7,745
Bonnyville No. 87 404 745 8,095 294 386 8,694 470 658 7,917 497 678 5,806
Lac la Biche County 132 241 2,471 108 146 3,228 158 238 2,539 159 214 1,939
Upper Peace 2,349 5,059 66,886 1,929 2,720 135,702 2,603 3,621 55,066 1,899 2,492 21,179
Birch Hills County 211 557 9,211 195 300 20,737 225 337 7,389 132 173 1,717
Clear Hills 265 568 6,005 233 313 10,441 315 437 5,088 257 337 2,327
Fairview No. 136 158 367 5,123 131 183 11,244 156 210 4,069 109 146 1,127
Grande Prairie County No. 1 679 1,240 15,408 518 688 25,442 777 1,080 13,459 597 779 6,720
Greenview No. 16 334 598 6,796 251 335 11,159 409 567 6,131 388 493 4,469
Peace No. 135 106 260 2,644 86 137 5,660 119 164 1,732 88 123 944
Saddle Hills County 302 629 8,428 252 361 16,354 325 465 6,305 233 311 2,638
Smoky River No. 130 245 729 11,372 219 339 29,986 224 296 9,476 67 96 960
Spirit River No. 133 49 111 1,900 44 64 4,681 53 65 1,415 28 34 278
Upper Athabasca 2,554 4,733 53,976 2,029 2,630 89,194 2,945 4,331 47,936 2,874 3,905 30,822
Athabasca County 408 776 8,155 356 493 16,168 470 716 7,974 463 639 5,149
Barrhead County No. 11 411 761 9,118 356 446 20,434 459 639 8,320 414 517 4,793
Big Lakes 203 405 4,243 163 217 7,531 250 351 3,948 216 287 2,545
Lac Ste. Anne County 500 847 7,776 356 449 7,641 553 857 7,264 581 812 6,012
Lesser Slave River No.124 89 158 1,402 71 92 1,501 113 171 1,256 121 171 1,046
Westlock County 512 1,091 16,033 417 526 30,210 520 731 12,687 435 580 5,536
Woodlands County 126 204 1,797 107 137 1,760 177 256 2,197 201 272 1,657
Yellowhead County 305 491 5,452 203 270 3,949 403 610 4,288 443 627 4,085
Source: Statistics Canada, 2011 Census of Agriculture. Prepared by Alberta Agriculture and Rural Development, Economics and Competitiveness Division, Statistics and Data Development Branch.
0 - True zero or a value rounded to zero. Total may not add up due to rounding. Refer to census definitions and notes for more information.
BalersSwathers and Mower-ConditionersOther Farm Trucks Combines
124

Table 23.3: Farm Machinery Inventory and Market Value, 2011
Market Value Market Value Market Value Market Value
# Farms # Trucks ($'000) # Farms # Combines ($'000) # Farms # Total ($'000) # Farms # Balers ($'000)
North Saskatchewan 8,457 16,615 240,070 6,297 8,513 482,428 8,825 12,919 202,157 7,569 10,299 90,285
Beaver County 454 962 13,183 376 544 33,985 476 731 11,815 396 519 4,224
Brazeau County 248 398 3,972 154 195 1,544 300 444 3,017 313 453 3,026
Camrose County 658 1,327 20,168 518 682 47,766 655 969 16,967 485 666 5,247
Clearwater County 553 873 7,980 298 368 4,492 593 880 5,864 671 952 6,779
Edmonton 29 53 797 10 13 671 22 27 282 14 20 113
Flagstaff County 473 996 17,775 413 601 53,432 465 714 15,853 298 378 3,809
Lamont County 506 1,045 15,718 419 615 32,492 516 731 11,893 390 536 4,574
Leduc County 704 1,369 17,941 545 691 26,648 780 1,171 15,104 722 1,059 10,033
Minburn County No. 27 432 951 17,071 377 541 39,600 428 587 14,960 310 397 3,895
Parkland County 408 719 8,735 242 301 9,613 409 578 7,308 416 605 4,906
Provost No. 52 300 643 9,460 217 319 17,386 296 503 8,235 249 305 3,341
Smoky Lake County 294 545 6,222 219 299 11,192 306 430 6,351 281 383 3,934
St. Paul County No. 19 463 838 10,716 342 451 16,099 514 702 10,243 482 617 5,795
Strathcona County 273 495 8,219 143 175 13,059 295 386 4,491 273 403 2,472
Sturgeon County 467 1,001 17,031 313 411 33,465 447 609 12,548 329 458 4,237
Thorhild County No. 7 294 568 7,025 267 362 14,231 347 517 5,821 294 404 2,897
Two Hills County No. 21 375 754 12,520 307 438 26,310 391 558 9,925 338 452 4,316
Vermilion River County 665 1,393 21,389 531 717 52,374 702 1,045 19,900 541 661 7,041
Wainwright No. 61 319 692 11,947 245 331 27,875 327 492 11,481 247 309 3,814
Wetaskiwin County No. 10 542 993 12,205 361 459 20,197 556 845 10,101 520 722 5,832
Red Deer 5,092 10,247 152,551 3,484 4,729 290,760 5,218 8,236 127,172 4,582 6,156 65,998
Kneehill County 459 1,080 23,061 365 550 59,090 433 723 16,800 288 356 3,943
Lacombe County 552 1,132 17,789 362 480 35,586 559 807 14,722 496 684 6,701
Mountain View County 851 1,532 20,017 516 660 31,591 886 1,361 18,613 807 1,196 12,036
Paintearth County No. 18 269 532 6,261 202 266 11,493 297 504 6,613 263 335 3,286
Ponoka County 576 1,073 14,346 383 480 17,000 627 955 10,449 597 806 7,232
Red Deer County 875 1,604 21,848 563 725 43,368 855 1,228 18,659 780 1,036 11,056
Special Area No. 2 302 644 10,904 176 233 10,592 333 565 9,288 317 430 6,515
Special Area No. 3 357 777 10,093 291 422 19,268 358 629 7,890 265 328 4,137
Special Area No. 4 204 474 6,985 154 208 11,495 213 378 5,357 196 239 3,422
Starland County 226 593 10,005 189 306 25,578 221 406 7,055 159 212 2,168
Stettler County No. 6 421 806 11,244 283 399 25,700 436 680 11,726 414 534 5,503
Source: Statistics Canada, 2011 Census of Agriculture. Prepared by Alberta Agriculture and Rural Development, Economics and Competitiveness Division, Statistics and Data Development Branch.
0 - True zero or a value rounded to zero. Total may not add up due to rounding. Refer to census definitions and notes for more information.
BalersSwathers and Mower-ConditionersOther Farm Trucks Combines
125

Table 23.3: Farm Machinery Inventory and Market Value, 2011
Market Value Market Value Market Value Market Value
# Farms # Trucks ($'000) # Farms # Combines ($'000) # Farms # Total ($'000) # Farms # Balers ($'000)
South Saskatchewan 5,744 13,629 253,904 3,497 5,123 X 5,469 8,706 X 4,450 6,256 78,515
Bighorn No. 8 20 34 432 3 4 X 16 22 X 14 24 269
Calgary 17 41 859 6 15 X 15 22 X 11 19 123
Cardston County 268 632 9,926 136 244 27,574 291 535 10,772 278 365 4,362
Cypress County 475 945 14,277 255 353 22,859 502 802 10,174 431 604 7,018
Foothills No. 31 540 1,015 14,649 227 307 20,445 508 784 12,578 496 721 7,318
Forty Mile County No. 8 403 1,116 20,417 320 474 46,700 340 517 8,805 213 282 3,506
Lethbridge County 591 1,519 31,080 354 457 31,312 524 773 15,184 369 567 8,090
Newell County No. 4 435 928 16,021 287 424 24,349 453 623 11,911 417 586 7,723
Pincher Creek No. 9 225 429 7,143 85 114 7,178 218 345 5,102 224 298 3,675
Ranchland No. 66 23 33 560 3 4 4 15 18 X 15 24 170
Rocky View County 588 1,209 20,000 299 426 40,316 583 948 14,667 522 748 8,030
Taber 468 1,502 35,763 350 536 47,638 414 647 13,876 302 433 6,757
Vulcan County 437 1,258 24,205 351 511 58,685 416 721 16,814 260 364 5,839
Warner County No. 5 344 877 16,423 248 376 36,454 318 555 11,632 229 316 4,938
Wheatland County 480 1,203 26,712 350 558 71,749 456 726 15,826 320 419 5,161
Willow Creek No. 26 430 888 15,439 223 320 24,052 400 668 9,421 349 486 5,536
Source: Statistics Canada, 2011 Census of Agriculture. Prepared by Alberta Agriculture and Rural Development, Economics and Competitiveness Division, Statistics and Data Development Branch.
X - Confidential. 0 - True zero or a value rounded to zero. Total may not add up due to rounding. Refer to census definitions and notes for more information.
BalersSwathers and Mower-ConditionersOther Farm Trucks Combines
126

Table 23.4: Farm Machinery Inventory and Market Value, 2011
Market Value Market Value Market Value Market Value
# Farms # Harvesters ($'000) # Farms ($'000) # Farms ($'000) # Farms ($'000)
Alberta 3,100 3,490 82,442 26,756 1,082,835 3,571 455,920 31,964 1,428,479
Lower Peace 73 78 1,100 920 38,846 17 230 921 45,246
Mackenzie County 42 44 417 444 13,764 7 152 452 18,471
Northern Lights County 24 27 516 344 15,782 6 24 324 18,568
Northern Sunrise County 7 7 167 132 9,300 4 55 145 8,206
Lower Athabasca 86 95 X 622 14,890 10 X 687 20,124
Bonnyville No. 87 70 78 X 460 10,631 4 X 517 15,453
Lac la Biche County 16 17 157 162 4,259 6 53 170 4,671
Upper Peace 228 273 X 2,732 116,720 72 X 2,826 129,719
Birch Hills County 21 22 X 223 15,441 6 X 233 13,515
Clear Hills 30 36 354 335 10,205 7 62 317 10,790
Fairview No. 136 8 8 120 171 9,078 4 278 172 8,908
Grande Prairie County No. 1 64 78 902 813 26,450 29 1,253 883 27,653
Greenview No. 16 39 46 972 440 10,489 7 23 442 12,594
Peace No. 135 18 21 115 124 4,299 9 609 125 5,286
Saddle Hills County 35 44 X 348 15,369 3 X 351 18,970
Smoky River No. 130 9 12 434 224 21,916 5 12 249 28,633
Spirit River No. 133 4 6 X 54 3,472 2 X 54 3,369
Upper Athabasca 429 499 X 3,121 81,183 67 X 3,416 105,898
Athabasca County 51 61 640 504 12,829 9 56 520 18,898
Barrhead County No. 11 82 95 2,068 477 16,437 13 220 503 18,499
Big Lakes 29 34 260 246 6,337 5 113 277 8,903
Lac Ste. Anne County 65 80 1,231 586 10,404 6 250 703 15,478
Lesser Slave River No.124 17 21 180 114 2,328 3 17 111 2,151
Westlock County 84 90 2,640 552 23,125 18 1,241 604 26,274
Woodlands County 22 25 X 197 2,870 2 X 215 4,683
Yellowhead County 79 93 1,385 445 6,853 11 169 483 11,011
Source: Statistics Canada, 2011 Census of Agriculture. Prepared by Alberta Agriculture and Rural Development, Economics and Competitiveness Division, Statistics and Data Development Branch.
X - Confidential. 0 - True zero or a value rounded to zero. Total may not add up due to rounding. Refer to census definitions and notes for more information.
Forage Harvesters
All Other Farm Machinery and
Equipment
Tillage, Cultivation, Seeding
and Planting Equipment Irrigation Equipment
127

Table 23.4: Farm Machinery Inventory and Market Value, 2011
Market Value Market Value Market Value Market Value
# Farms # Harvesters ($'000) # Farms ($'000) # Farms ($'000) # Farms ($'000)
North Saskatchewan 957 X X 8,873 326,317 287 X 10,402 438,882
Beaver County 44 47 760 451 20,328 14 840 524 24,580
Brazeau County 30 40 X 316 3,628 3 X 336 6,496
Camrose County 64 70 1,399 653 30,104 18 244 768 41,761
Clearwater County 102 122 1,161 645 7,558 8 485 797 17,019
Edmonton 2 X X 30 940 7 X 43 1,856
Flagstaff County 50 49 620 437 35,162 13 343 489 34,123
Lamont County 38 44 501 514 20,492 16 463 562 23,154
Leduc County 90 98 2,948 801 21,799 31 517 945 31,690
Minburn County No. 27 43 44 1,512 413 22,341 10 116 492 27,946
Parkland County 47 57 630 450 10,069 20 237 577 18,100
Provost No. 52 39 38 1,855 273 11,857 11 1,119 317 14,780
Smoky Lake County 18 19 X 305 9,622 5 X 332 9,986
St. Paul County No. 19 65 66 1,349 509 14,131 10 188 548 17,514
Strathcona County 17 X 298 321 10,362 27 1,640 455 17,901
Sturgeon County 37 46 564 499 21,794 34 2,247 597 28,888
Thorhild County No. 7 26 35 X 336 9,934 8 X 349 11,004
Two Hills County No. 21 26 28 255 371 14,641 8 61 421 21,609
Vermilion River County 93 102 1,713 648 30,711 16 540 763 39,672
Wainwright No. 61 42 45 1,426 301 16,543 8 54 376 23,843
Wetaskiwin County No. 10 84 100 1,821 600 14,301 20 1,404 711 26,958
Red Deer 782 855 X 5,091 194,250 230 X 6,466 270,568
Kneehill County 50 51 1,442 399 32,752 38 3,812 541 32,847
Lacombe County 102 109 4,124 610 20,844 18 627 813 39,243
Mountain View County 113 122 2,069 924 25,339 31 1,902 1,177 35,732
Paintearth County No. 18 45 55 945 251 7,470 10 633 302 11,587
Ponoka County 133 151 3,182 676 16,464 8 312 825 27,169
Red Deer County 152 168 3,508 876 31,158 35 1,476 1,145 40,033
Special Area No. 2 29 33 1,018 270 10,065 50 6,804 346 18,968
Special Area No. 3 19 18 X 310 11,423 11 X 368 17,032
Special Area No. 4 37 37 X 184 7,453 3 X 209 11,157
Starland County 23 26 274 205 14,545 13 628 230 16,359
Stettler County No. 6 79 85 1,450 386 16,737 13 617 510 20,440
Source: Statistics Canada, 2011 Census of Agriculture. Prepared by Alberta Agriculture and Rural Development, Economics and Competitiveness Division, Statistics and Data Development Branch.
X - Confidential. 0 - True zero or a value rounded to zero. Total may not add up due to rounding. Refer to census definitions and notes for more information.
Forage Harvesters
All Other Farm Machinery and
Equipment
Tillage, Cultivation, Seeding
and Planting Equipment Irrigation Equipment
128

Table 23.4: Farm Machinery Inventory and Market Value, 2011
Market Value Market Value Market Value Market Value
# Farms # Harvesters ($'000) # Farms ($'000) # Farms ($'000) # Farms ($'000)
South Saskatchewan 545 X X 5,397 X 2,888 X 7,246 418,042
Bighorn No. 8 0 0 0 13 X 2 X 32 708
Calgary 2 X X 15 1,620 5 X 42 1,960
Cardston County 30 35 762 277 14,262 169 13,728 351 16,632
Cypress County 28 33 804 449 14,460 217 22,986 580 20,998
Foothills No. 31 31 35 944 487 16,864 56 1,923 846 28,568
Forty Mile County No. 8 27 34 1,297 388 32,709 172 26,150 427 33,104
Lethbridge County 102 117 7,810 569 26,686 631 82,305 707 42,515
Newell County No. 4 46 48 1,748 433 16,654 477 67,870 536 32,220
Pincher Creek No. 9 23 25 1,178 198 6,623 41 4,821 310 10,234
Ranchland No. 66 1 X X 9 X 0 0 60 1,120
Rocky View County 58 64 1,822 558 24,218 69 4,072 888 36,518
Taber 50 66 3,573 475 42,175 449 100,123 510 47,981
Vulcan County 31 34 1,888 401 38,536 121 30,610 472 50,478
Warner County No. 5 28 29 1,209 314 23,306 150 17,782 357 26,714
Wheatland County 45 48 2,354 438 35,668 206 26,995 576 44,122
Willow Creek No. 26 43 49 2,399 373 16,077 123 20,639 552 24,170
Source: Statistics Canada, 2011 Census of Agriculture. Prepared by Alberta Agriculture and Rural Development, Economics and Competitiveness Division, Statistics and Data Development Branch.
X - Confidential. 0 - True zero or a value rounded to zero. Total may not add up due to rounding. Refer to census definitions and notes for more information.
Forage Harvesters
All Other Farm Machinery and
Equipment
Tillage, Cultivation, Seeding
and Planting Equipment Irrigation Equipment
129

Table 24.1: Farm Capital, 2011
Market Value Market Value Market Value Market Value Market Value Market Value
# Farms ($ '000) # Farms ($ '000) # Farms ($ '000) # Farms ($ '000) # Farms ($ '000) # Farms ($ '000)
Alberta 43,234 95,571,931 43,234 80,371,125 41,647 57,050,547 21,149 23,320,578 29,666 4,267,598 43,234 10,933,208
Lower Peace 1,253 1,568,804 1,253 1,236,939 1,222 964,523 579 272,416 674 41,000 1,253 290,865
Mackenzie County 626 673,182 626 540,328 613 446,706 262 93,621 360 13,994 626 118,861
Northern Lights County 446 568,799 446 437,051 435 333,796 216 103,254 232 16,528 446 115,220
Northern Sunrise County 181 326,823 181 259,560 174 184,020 101 75,540 82 10,479 181 56,784
Lower Athabasca 978 1,283,569 978 1,058,863 954 795,450 546 263,413 726 64,282 978 160,423
Bonnyville No. 87 739 967,873 739 799,873 722 604,767 396 195,106 550 48,638 739 119,362
Lac la Biche County 239 315,696 239 258,990 232 190,683 150 68,308 176 15,644 239 41,061
Upper Peace 3,816 5,800,438 3,816 4,688,278 3,708 3,549,932 1,856 1,138,346 2,188 197,813 3,816 914,347
Birch Hills County 295 665,392 295 536,338 284 399,650 174 136,688 142 19,578 295 109,476
Clear Hills 443 427,450 443 323,863 431 258,354 205 65,509 278 18,985 443 84,602
Fairview No. 136 225 387,647 225 314,442 216 225,199 129 89,243 113 9,140 225 64,065
Grande Prairie County No. 1 1,206 1,680,574 1,206 1,397,117 1,175 1,050,188 548 346,928 766 60,609 1,206 222,848
Greenview No. 16 639 768,889 639 621,590 627 509,484 263 112,106 440 38,148 639 109,152
Peace No. 135 166 220,584 166 176,731 161 122,050 91 54,681 98 7,834 166 36,019
Saddle Hills County 463 616,543 463 477,912 450 343,995 235 133,917 246 23,455 463 115,176
Smoky River No. 130 310 910,633 310 743,900 299 574,788 179 169,112 79 17,595 310 149,137
Spirit River No. 133 69 122,726 69 96,385 65 66,224 32 30,161 26 2,469 69 23,872
Upper Athabasca 4,601 6,160,231 4,601 5,003,277 4,503 3,759,888 2,258 1,243,390 3,370 334,846 4,601 822,108
Athabasca County 697 912,307 697 738,755 687 554,691 370 184,064 476 41,669 697 131,883
Barrhead County No. 11 667 1,066,883 667 849,733 651 635,052 319 214,681 487 72,981 667 144,170
Big Lakes 375 403,659 375 311,273 367 236,551 212 74,722 255 25,748 375 66,638
Lac Ste. Anne County 936 1,070,937 936 885,906 922 680,831 420 205,076 735 57,530 936 127,500
Lesser Slave River No.124 160 155,634 160 124,019 157 95,276 85 28,742 118 8,762 160 22,854
Westlock County 777 1,420,832 777 1,151,937 761 864,035 376 287,902 516 65,313 777 203,582
Woodlands County 294 317,610 294 264,234 289 200,456 145 63,778 233 17,054 294 36,323
Yellowhead County 695 812,367 695 677,421 669 492,995 331 184,425 550 45,789 695 89,158
Source: Statistics Canada, 2011 Census of Agriculture. Prepared by Alberta Agriculture and Rural Development, Economics and Competitiveness Division, Statistics and Data Development Branch.
0 - True zero or a value rounded to zero. Totals may not add up due to rounding. Refer to census definitions and notes for more information.
Total Farm Capital
Land and Buildings
Owned Rented
Total Value of Farm
Total Machinery and EquipmentLivestock and Poultry
130

Table 24.1: Farm Capital, 2011
Market Value Market Value Market Value Market Value Market Value Market Value
# Farms ($ '000) # Farms ($ '000) # Farms ($ '000) # Farms ($ '000) # Farms ($ '000) # Farms ($ '000)
North Saskatchewan 14,026 26,545,083 14,026 22,398,133 13,570 15,380,117 6,826 7,018,016 9,464 940,739 14,026 3,206,211
Beaver County 677 1,326,507 677 1,104,429 662 809,233 343 295,196 445 39,545 677 182,533
Brazeau County 487 630,565 487 548,639 480 409,845 204 138,794 391 25,439 487 56,487
Camrose County 999 2,009,242 999 1,681,691 971 1,243,142 474 438,549 604 56,494 999 271,057
Clearwater County 1,096 1,553,653 1,096 1,357,892 1,044 975,016 508 382,876 893 66,372 1,096 129,389
Edmonton 73 196,942 73 187,214 58 111,383 36 75,831 29 619 73 9,108
Flagstaff County 650 1,662,179 650 1,366,945 629 975,201 381 391,744 385 42,164 650 253,070
Lamont County 753 1,253,723 753 1,039,699 725 695,528 350 344,171 423 31,081 753 182,942
Leduc County 1,255 2,540,144 1,255 2,236,401 1,218 1,570,760 543 665,642 845 61,104 1,255 242,639
Minburn County No. 27 604 1,317,378 604 1,055,911 580 688,936 334 366,976 354 60,470 604 200,997
Parkland County 782 1,465,804 782 1,298,096 754 813,174 343 484,923 596 47,165 782 120,542
Provost No. 52 425 874,950 425 682,674 410 487,450 272 195,224 315 67,820 425 124,456
Smoky Lake County 454 676,320 454 554,867 442 336,608 243 218,259 318 32,014 454 89,439
St. Paul County No. 19 788 1,068,007 788 856,181 770 670,483 394 185,698 559 66,329 788 145,497
Strathcona County 658 1,369,036 658 1,245,651 631 796,898 234 448,753 436 19,182 658 104,203
Sturgeon County 823 2,168,369 823 1,927,068 785 1,112,158 389 814,910 460 36,793 823 204,508
Thorhild County No. 7 462 604,302 462 486,928 456 348,162 226 138,766 295 22,041 462 95,332
Two Hills County No. 21 554 873,947 554 694,826 536 447,650 266 247,175 355 31,424 554 147,698
Vermilion River County 1,029 2,116,740 1,029 1,702,682 999 1,210,809 568 491,873 716 112,035 1,029 302,023
Wainwright No. 61 501 1,166,796 501 946,512 486 676,103 298 270,408 342 54,562 501 165,722
Wetaskiwin County No. 10 956 1,670,482 956 1,423,827 934 1,001,577 420 422,249 703 68,085 956 178,570
Red Deer 8,645 19,700,642 8,645 16,668,011 8,329 11,628,720 4,301 5,039,291 6,377 909,355 8,645 2,123,276
Kneehill County 686 2,202,782 686 1,856,041 651 1,176,448 372 679,593 416 68,295 686 278,445
Lacombe County 1,045 2,495,871 1,045 2,137,083 1,004 1,524,690 481 612,394 757 104,220 1,045 254,567
Mountain View County 1,636 3,577,180 1,636 3,181,046 1,567 2,150,486 711 1,030,560 1,214 103,076 1,636 293,059
Paintearth County No. 18 420 751,101 420 606,908 410 493,066 217 113,841 339 53,532 420 90,661
Ponoka County 1,106 2,057,566 1,106 1,739,294 1,081 1,303,263 466 436,030 882 112,581 1,106 205,692
Red Deer County 1,531 3,477,622 1,531 3,021,887 1,477 2,065,322 670 956,565 1,108 124,583 1,531 331,152
Special Area No. 2 473 1,237,907 473 986,227 451 692,708 314 293,519 388 107,375 473 144,305
Special Area No. 3 464 926,880 464 737,520 449 512,027 316 225,492 281 53,660 464 135,700
Special Area No. 4 279 653,183 279 503,708 272 355,509 205 148,200 233 60,612 279 88,863
Starland County 300 930,729 300 774,766 289 556,959 184 217,807 192 30,691 300 125,272
Stettler County No. 6 705 1,389,821 705 1,123,532 678 798,241 365 325,290 567 90,730 705 175,560
Source: Statistics Canada, 2011 Census of Agriculture. Prepared by Alberta Agriculture and Rural Development, Economics and Competitiveness Division, Statistics and Data Development Branch.
0 - True zero or a value rounded to zero. Totals may not add up due to rounding. Refer to census definitions and notes for more information.
Total Farm Capital OwnedTotal Rented
Land and Buildings
Livestock and Poultry Machinery and Equipment
Total Value of Farm
131

Table 24.1: Farm Capital, 2011
Market Value Market Value Market Value Market Value Market Value Market Value
# Farms ($ '000) # Farms ($ '000) # Farms ($ '000) # Farms ($ '000) # Farms ($ '000) # Farms ($ '000)
South Saskatchewan 9,915 34,513,164 9,915 29,317,624 9,361 20,971,918 4,783 8,345,706 6,867 1,779,563 9,915 3,415,977
Bighorn No. 8 44 257,637 44 244,742 41 106,952 20 137,790 40 6,628 44 6,267
Calgary 55 181,416 55 165,905 42 84,108 27 81,797 34 972 55 14,538
Cardston County 497 1,624,626 497 1,388,544 476 1,000,443 273 388,101 397 73,866 497 162,216
Cypress County 827 1,858,793 827 1,542,394 788 1,122,099 426 420,296 572 108,916 827 207,483
Foothills No. 31 1,224 3,955,712 1,224 3,637,542 1,174 2,414,669 461 1,222,874 926 111,826 1,224 206,343
Forty Mile County No. 8 524 1,890,276 524 1,568,004 492 1,118,634 330 449,370 268 51,001 524 271,272
Lethbridge County 933 3,162,074 933 2,436,706 874 1,903,120 368 533,586 575 358,312 933 367,056
Newell County No. 4 717 1,991,152 717 1,603,213 670 1,113,830 340 489,383 528 125,930 717 262,008
Pincher Creek No. 9 448 1,464,263 448 1,290,821 422 892,939 234 397,882 383 80,447 448 92,995
Ranchland No. 66 78 334,463 78 317,304 50 136,625 53 180,679 52 11,066 78 6,093
Rocky View County 1,271 5,318,550 1,271 4,934,908 1,205 3,426,829 527 1,508,078 947 106,484 1,271 277,159
Taber 652 2,844,460 652 2,192,887 615 1,689,537 361 503,350 378 211,079 652 440,494
Vulcan County 603 2,689,959 603 2,181,146 565 1,532,514 354 648,632 341 171,645 603 337,169
Warner County No. 5 488 1,857,824 488 1,566,156 471 1,267,683 273 298,473 325 81,355 488 210,313
Wheatland County 782 2,667,345 782 2,189,632 740 1,643,174 365 546,459 483 127,123 782 350,590
Willow Creek No. 26 772 2,414,615 772 2,057,719 736 1,518,762 371 538,957 618 152,913 772 203,983
Source: Statistics Canada, 2011 Census of Agriculture. Prepared by Alberta Agriculture and Rural Development, Economics and Competitiveness Division, Statistics and Data Development Branch.
0 - True zero or a value rounded to zero. Totals may not add up due to rounding. Refer to census definitions and notes for more information.
Owned Rented
Land and Buildings
Livestock and Poultry Machinery and EquipmentTotal Farm Capital Total
Total Value of Farm
132

Table 25.1: Farms Classified by Total Farm Capital, 2011
Total
# Farms
Under
$100,000
$100,000-
$199,999'
$200,000-
$349,999'
$350,000-
$499,999'
$500,000-
$999,999'
$1,000,000-
$1,499,999'
$1,500,000-
$1,999,999'
$2,000,000-
$3,499,999
$3,500,000
and Over
Alberta 43,234 361 1,032 3,101 4,203 11,966 6,459 3,762 5,894 6,456
Lower Peace 1,253 11 55 195 182 366 171 85 110 78
Mackenzie County 626 4 25 106 101 198 74 38 58 22
Northern Lights County 446 5 21 69 65 123 69 28 31 35
Northern Sunrise County 181 2 9 20 16 45 28 19 21 21
Lower Athabasca 978 10 29 91 115 326 175 67 107 58
Bonnyville No. 87 739 9 22 65 93 242 136 50 75 47
Lac la Biche County 239 1 7 26 22 84 39 17 32 11
Upper Peace 3,816 54 155 384 505 1,174 519 286 417 322
Birch Hills County 295 7 6 25 37 69 31 29 52 39
Clear Hills 443 7 40 71 85 114 56 26 26 18
Fairview No. 136 225 1 10 18 26 62 25 18 36 29
Grande Prairie County No. 1 1,206 13 27 89 141 432 185 100 139 80
Greenview No. 16 639 11 27 83 114 206 91 40 41 26
Peace No. 135 166 3 6 16 17 59 21 11 22 11
Saddle Hills County 463 6 26 55 63 152 59 36 37 29
Smoky River No. 130 310 5 10 23 17 52 43 20 61 79
Spirit River No. 133 69 1 3 4 5 28 8 6 3 11
Upper Athabasca 4,601 40 153 504 663 1,464 660 363 443 311
Athabasca County 697 6 24 61 99 242 105 55 56 49
Barrhead County No. 11 667 5 13 69 93 172 101 57 91 66
Big Lakes 375 6 17 60 48 115 57 31 30 11
Lac Ste. Anne County 936 6 36 115 143 311 135 76 73 41
Lesser Slave River No.124 160 1 11 22 34 42 24 9 13 4
Westlock County 777 4 15 62 95 221 112 70 100 98
Woodlands County 294 4 12 39 40 110 34 17 27 11
Yellowhead County 695 8 25 76 111 251 92 48 53 31
Source: Statistics Canada, 2011 Census of Agriculture. Prepared by Alberta Agriculture and Rural Development, Economics and Competitiveness Division, Statistics and Data Development Branch.
0 - True zero or a value rounded to zero. Refer to census definitions and notes for more information.
133
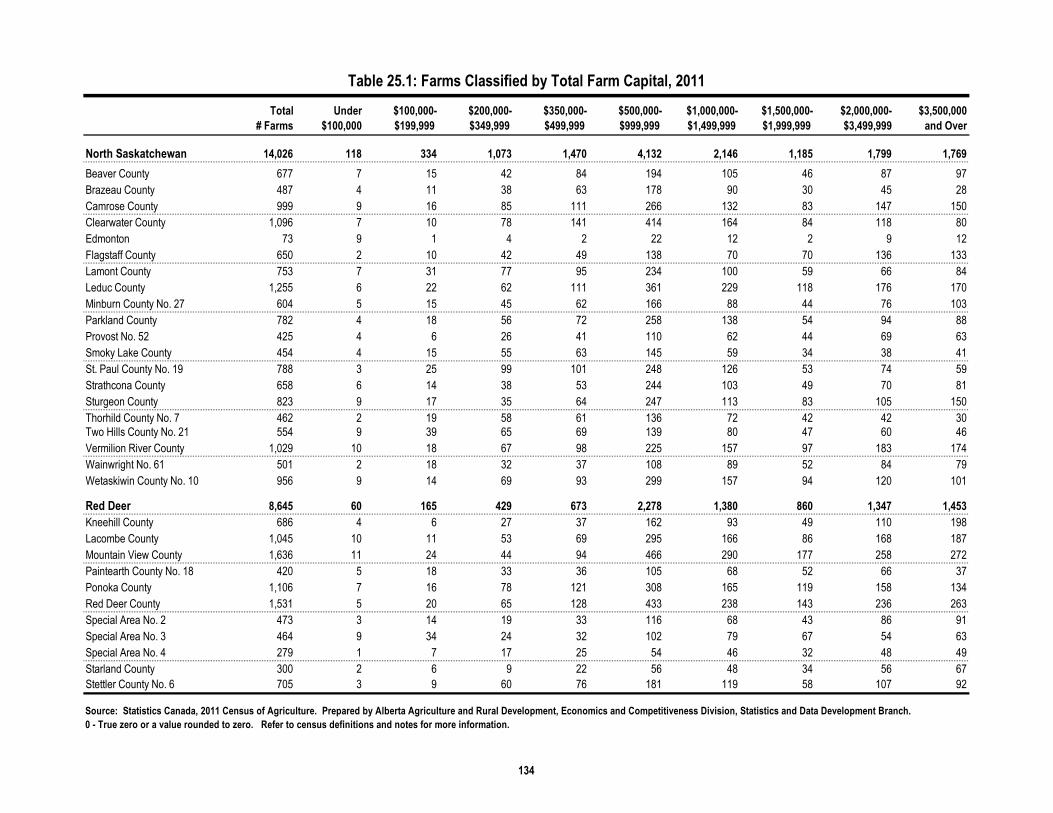
Table 25.1: Farms Classified by Total Farm Capital, 2011
Total
# Farms
Under
$100,000
$100,000-
$199,999'
$200,000-
$349,999'
$350,000-
$499,999'
$500,000-
$999,999'
$1,000,000-
$1,499,999'
$1,500,000-
$1,999,999'
$2,000,000-
$3,499,999
$3,500,000
and Over
North Saskatchewan 14,026 118 334 1,073 1,470 4,132 2,146 1,185 1,799 1,769
Beaver County 677 7 15 42 84 194 105 46 87 97
Brazeau County 487 4 11 38 63 178 90 30 45 28
Camrose County 999 9 16 85 111 266 132 83 147 150
Clearwater County 1,096 7 10 78 141 414 164 84 118 80
Edmonton 73 9 1 4 2 22 12 2 9 12
Flagstaff County 650 2 10 42 49 138 70 70 136 133
Lamont County 753 7 31 77 95 234 100 59 66 84
Leduc County 1,255 6 22 62 111 361 229 118 176 170
Minburn County No. 27 604 5 15 45 62 166 88 44 76 103
Parkland County 782 4 18 56 72 258 138 54 94 88
Provost No. 52 425 4 6 26 41 110 62 44 69 63
Smoky Lake County 454 4 15 55 63 145 59 34 38 41
St. Paul County No. 19 788 3 25 99 101 248 126 53 74 59
Strathcona County 658 6 14 38 53 244 103 49 70 81
Sturgeon County 823 9 17 35 64 247 113 83 105 150
Thorhild County No. 7 462 2 19 58 61 136 72 42 42 30
Two Hills County No. 21 554 9 39 65 69 139 80 47 60 46
Vermilion River County 1,029 10 18 67 98 225 157 97 183 174
Wainwright No. 61 501 2 18 32 37 108 89 52 84 79
Wetaskiwin County No. 10 956 9 14 69 93 299 157 94 120 101
Red Deer 8,645 60 165 429 673 2,278 1,380 860 1,347 1,453
Kneehill County 686 4 6 27 37 162 93 49 110 198
Lacombe County 1,045 10 11 53 69 295 166 86 168 187
Mountain View County 1,636 11 24 44 94 466 290 177 258 272
Paintearth County No. 18 420 5 18 33 36 105 68 52 66 37
Ponoka County 1,106 7 16 78 121 308 165 119 158 134
Red Deer County 1,531 5 20 65 128 433 238 143 236 263
Special Area No. 2 473 3 14 19 33 116 68 43 86 91
Special Area No. 3 464 9 34 24 32 102 79 67 54 63
Special Area No. 4 279 1 7 17 25 54 46 32 48 49
Starland County 300 2 6 9 22 56 48 34 56 67
Stettler County No. 6 705 3 9 60 76 181 119 58 107 92
Source: Statistics Canada, 2011 Census of Agriculture. Prepared by Alberta Agriculture and Rural Development, Economics and Competitiveness Division, Statistics and Data Development Branch.
0 - True zero or a value rounded to zero. Refer to census definitions and notes for more information.
134

Table 25.1: Farms Classified by Total Farm Capital, 2011
Total
# Farms
Under
$100,000
$100,000-
$199,999'
$200,000-
$349,999'
$350,000-
$499,999'
$500,000-
$999,999'
$1,000,000-
$1,499,999'
$1,500,000-
$1,999,999'
$2,000,000-
$3,499,999
$3,500,000
and Over
South Saskatchewan 9,915 68 141 425 595 2,226 1,408 916 1,671 2,465
Bighorn No. 8 44 0 1 2 1 10 6 3 8 13
Calgary 55 7 2 4 5 12 5 0 8 12
Cardston County 497 4 17 31 43 127 61 40 73 101
Cypress County 827 4 15 47 58 242 116 86 136 123
Foothills No. 31 1,224 7 9 33 56 271 224 123 207 294
Forty Mile County No. 8 524 5 8 21 26 90 57 57 118 142
Lethbridge County 933 6 15 40 58 209 139 82 154 230
Newell County No. 4 717 5 6 43 59 161 104 72 140 127
Pincher Creek No. 9 448 2 6 23 26 114 61 42 64 110
Ranchland No. 66 78 1 0 3 5 22 10 4 9 24
Rocky View County 1,271 14 17 30 35 256 200 137 205 377
Taber 652 1 9 34 50 125 72 51 113 197
Vulcan County 603 3 7 21 36 97 65 58 104 212
Warner County No. 5 488 3 12 28 45 104 71 37 76 112
Wheatland County 782 1 9 34 45 177 104 63 148 201
Willow Creek No. 26 772 5 8 31 47 209 113 61 108 190
Source: Statistics Canada, 2011 Census of Agriculture. Prepared by Alberta Agriculture and Rural Development, Economics and Competitiveness Division, Statistics and Data Development Branch.
0 - True zero or a value rounded to zero. Refer to census definitions and notes for more information.
135

Table 26.1: Farm Business Operating Expenses, 2010
# Farms $'000 # Farms $'000 # Farms $'000 # Farms $'000 # Farms $'000
Alberta 43,234 9,710,680 24,249 402,870 16,956 343,440 12,801 600,068 9,228 287,938
Lower Peace 1,253 167,751 727 8,710 447 7,463 371 10,966 261 5,045
Mackenzie County 626 64,181 386 3,287 207 2,833 182 3,349 124 1,697
Northern Lights County 446 69,657 243 4,051 163 3,200 127 4,974 92 1,945
Northern Sunrise County 181 33,913 98 1,372 77 1,431 62 2,644 45 1,403
Lower Athabasca 978 79,974 505 4,800 410 2,881 219 5,353 154 2,519
Bonnyville No. 87 739 62,670 384 3,779 308 2,172 166 4,383 117 1,897
Lac la Biche County 239 17,304 121 1,021 102 710 53 970 37 622
Upper Peace 3,816 569,882 2,081 29,331 1,411 24,792 1,024 31,475 696 16,483
Birch Hills County 295 81,950 188 4,198 143 3,382 92 2,625 69 1,954
Clear Hills 443 41,848 233 2,412 139 1,275 114 2,179 77 1,140
Fairview No. 136 225 44,294 133 1,757 94 2,524 91 3,272 61 1,663
Grande Prairie County No. 1 1,206 133,049 600 5,477 404 4,891 265 8,636 183 4,681
Greenview No. 16 639 59,395 302 4,044 183 1,785 124 3,333 77 1,262
Peace No. 135 166 20,799 90 1,253 70 1,107 53 1,352 34 805
Saddle Hills County 463 62,068 270 3,936 194 2,817 127 3,403 87 1,724
Smoky River No. 130 310 112,192 228 5,499 158 6,181 139 5,574 96 2,690
Spirit River No. 133 69 14,288 37 754 26 830 19 1,102 12 564
Upper Athabasca 4,601 624,558 2,377 30,262 1,748 19,480 1,069 31,581 720 18,188
Athabasca County 697 71,615 351 3,657 274 2,830 153 3,322 103 1,861
Barrhead County No. 11 667 141,045 382 7,621 263 4,178 187 6,817 139 3,782
Big Lakes 375 34,562 182 1,712 150 1,480 96 2,139 66 1,231
Lac Ste. Anne County 936 63,840 472 4,007 305 2,273 174 3,324 112 1,794
Lesser Slave River No.124 160 8,174 69 442 66 288 37 423 23 193
Westlock County 777 202,496 485 8,734 326 6,431 231 8,686 154 4,310
Woodlands County 294 19,945 132 1,077 99 495 64 950 47 612
Yellowhead County 695 82,881 304 3,011 265 1,506 127 5,922 76 4,405
Source: Statistics Canada, 2011 Census of Agriculture. Prepared by Alberta Agriculture and Rural Development, Economics and Competitiveness Division, Statistics and Data Development Branch.
0 - True zero or a value rounded to zero. Totals may not add up due to rouding. Refer to census definitions and notes for more information.
Total Farm Interest
Expenses
Wages and Salaries Paid
to Family MembersTotal Expenses
Rent and Leasing Expenses
Land and Buildings Total Wages and Salaries
136
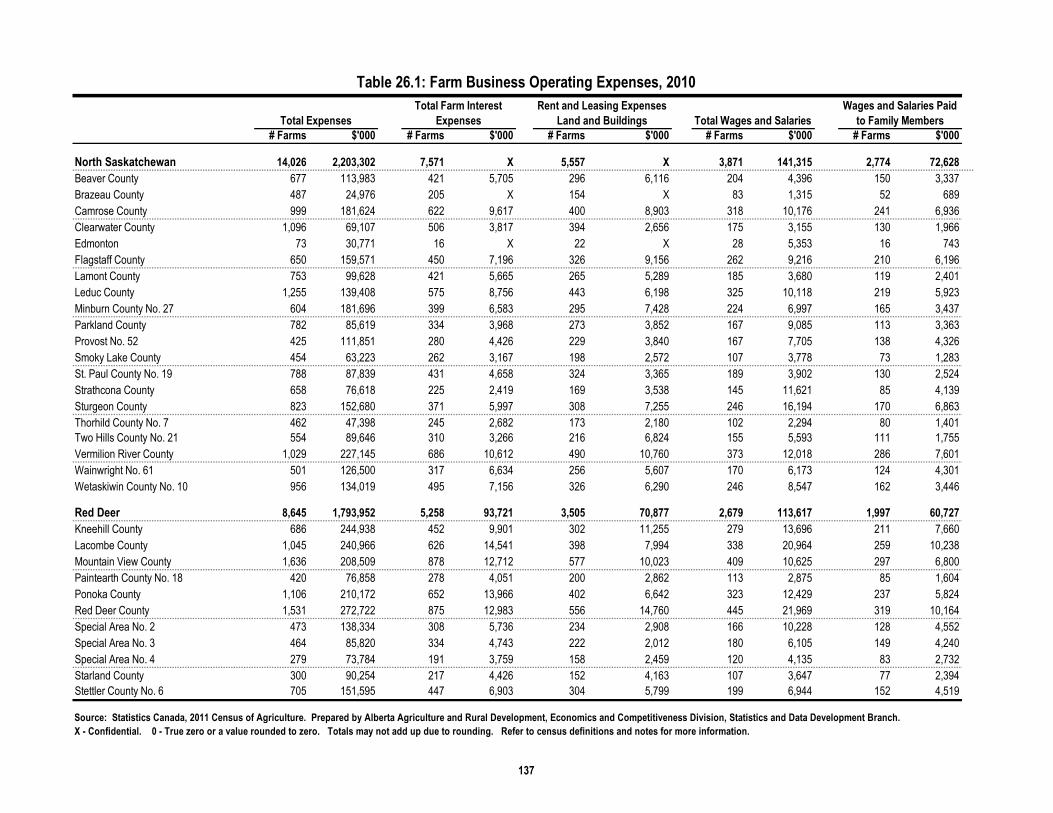
Table 26.1: Farm Business Operating Expenses, 2010
# Farms $'000 # Farms $'000 # Farms $'000 # Farms $'000 # Farms $'000
North Saskatchewan 14,026 2,203,302 7,571 X 5,557 X 3,871 141,315 2,774 72,628
Beaver County 677 113,983 421 5,705 296 6,116 204 4,396 150 3,337
Brazeau County 487 24,976 205 X 154 X 83 1,315 52 689
Camrose County 999 181,624 622 9,617 400 8,903 318 10,176 241 6,936
Clearwater County 1,096 69,107 506 3,817 394 2,656 175 3,155 130 1,966
Edmonton 73 30,771 16 X 22 X 28 5,353 16 743
Flagstaff County 650 159,571 450 7,196 326 9,156 262 9,216 210 6,196
Lamont County 753 99,628 421 5,665 265 5,289 185 3,680 119 2,401
Leduc County 1,255 139,408 575 8,756 443 6,198 325 10,118 219 5,923
Minburn County No. 27 604 181,696 399 6,583 295 7,428 224 6,997 165 3,437
Parkland County 782 85,619 334 3,968 273 3,852 167 9,085 113 3,363
Provost No. 52 425 111,851 280 4,426 229 3,840 167 7,705 138 4,326
Smoky Lake County 454 63,223 262 3,167 198 2,572 107 3,778 73 1,283
St. Paul County No. 19 788 87,839 431 4,658 324 3,365 189 3,902 130 2,524
Strathcona County 658 76,618 225 2,419 169 3,538 145 11,621 85 4,139
Sturgeon County 823 152,680 371 5,997 308 7,255 246 16,194 170 6,863
Thorhild County No. 7 462 47,398 245 2,682 173 2,180 102 2,294 80 1,401
Two Hills County No. 21 554 89,646 310 3,266 216 6,824 155 5,593 111 1,755
Vermilion River County 1,029 227,145 686 10,612 490 10,760 373 12,018 286 7,601
Wainwright No. 61 501 126,500 317 6,634 256 5,607 170 6,173 124 4,301
Wetaskiwin County No. 10 956 134,019 495 7,156 326 6,290 246 8,547 162 3,446
Red Deer 8,645 1,793,952 5,258 93,721 3,505 70,877 2,679 113,617 1,997 60,727
Kneehill County 686 244,938 452 9,901 302 11,255 279 13,696 211 7,660
Lacombe County 1,045 240,966 626 14,541 398 7,994 338 20,964 259 10,238
Mountain View County 1,636 208,509 878 12,712 577 10,023 409 10,625 297 6,800
Paintearth County No. 18 420 76,858 278 4,051 200 2,862 113 2,875 85 1,604
Ponoka County 1,106 210,172 652 13,966 402 6,642 323 12,429 237 5,824
Red Deer County 1,531 272,722 875 12,983 556 14,760 445 21,969 319 10,164
Special Area No. 2 473 138,334 308 5,736 234 2,908 166 10,228 128 4,552
Special Area No. 3 464 85,820 334 4,743 222 2,012 180 6,105 149 4,240
Special Area No. 4 279 73,784 191 3,759 158 2,459 120 4,135 83 2,732
Starland County 300 90,254 217 4,426 152 4,163 107 3,647 77 2,394
Stettler County No. 6 705 151,595 447 6,903 304 5,799 199 6,944 152 4,519
Source: Statistics Canada, 2011 Census of Agriculture. Prepared by Alberta Agriculture and Rural Development, Economics and Competitiveness Division, Statistics and Data Development Branch.
X - Confidential. 0 - True zero or a value rounded to zero. Totals may not add up due to rounding. Refer to census definitions and notes for more information.
Total Expenses
Total Farm Interest
Expenses
Rent and Leasing Expenses
Land and Buildings Total Wages and Salaries
Wages and Salaries Paid
to Family Members
137
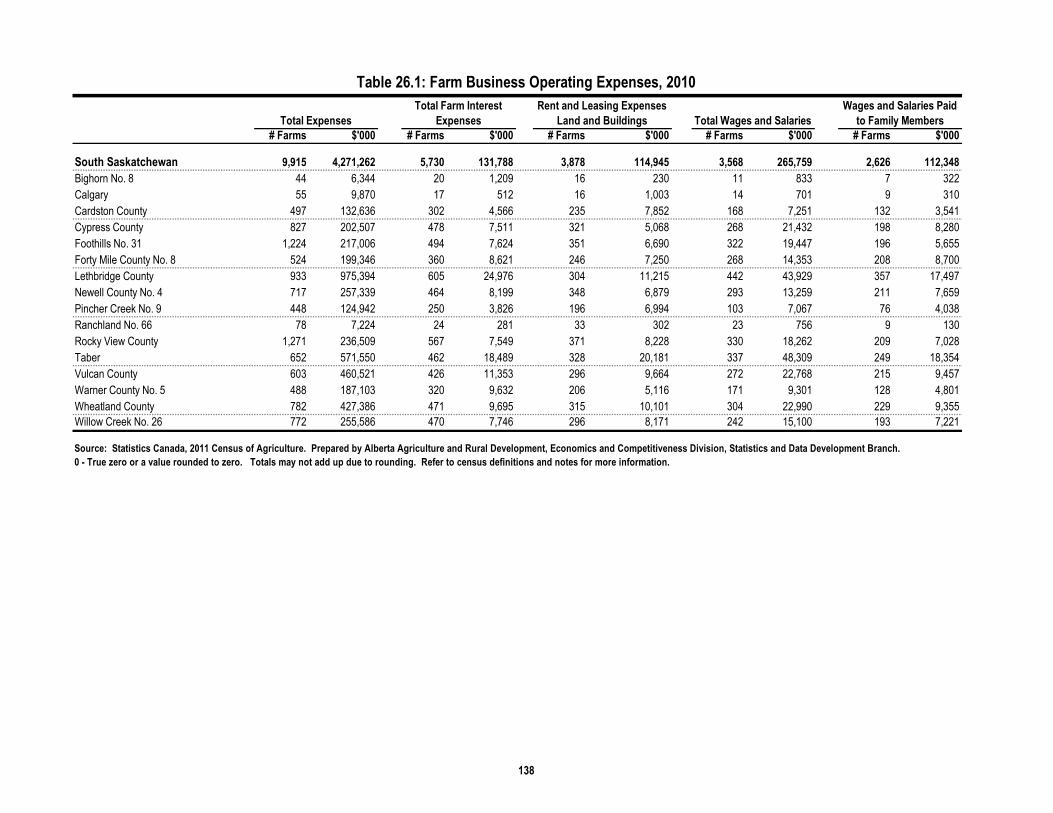
Table 26.1: Farm Business Operating Expenses, 2010
# Farms $'000 # Farms $'000 # Farms $'000 # Farms $'000 # Farms $'000
South Saskatchewan 9,915 4,271,262 5,730 131,788 3,878 114,945 3,568 265,759 2,626 112,348
Bighorn No. 8 44 6,344 20 1,209 16 230 11 833 7 322
Calgary 55 9,870 17 512 16 1,003 14 701 9 310
Cardston County 497 132,636 302 4,566 235 7,852 168 7,251 132 3,541
Cypress County 827 202,507 478 7,511 321 5,068 268 21,432 198 8,280
Foothills No. 31 1,224 217,006 494 7,624 351 6,690 322 19,447 196 5,655
Forty Mile County No. 8 524 199,346 360 8,621 246 7,250 268 14,353 208 8,700
Lethbridge County 933 975,394 605 24,976 304 11,215 442 43,929 357 17,497
Newell County No. 4 717 257,339 464 8,199 348 6,879 293 13,259 211 7,659
Pincher Creek No. 9 448 124,942 250 3,826 196 6,994 103 7,067 76 4,038
Ranchland No. 66 78 7,224 24 281 33 302 23 756 9 130
Rocky View County 1,271 236,509 567 7,549 371 8,228 330 18,262 209 7,028
Taber 652 571,550 462 18,489 328 20,181 337 48,309 249 18,354
Vulcan County 603 460,521 426 11,353 296 9,664 272 22,768 215 9,457
Warner County No. 5 488 187,103 320 9,632 206 5,116 171 9,301 128 4,801
Wheatland County 782 427,386 471 9,695 315 10,101 304 22,990 229 9,355
Willow Creek No. 26 772 255,586 470 7,746 296 8,171 242 15,100 193 7,221
Source: Statistics Canada, 2011 Census of Agriculture. Prepared by Alberta Agriculture and Rural Development, Economics and Competitiveness Division, Statistics and Data Development Branch.
0 - True zero or a value rounded to zero. Totals may not add up due to rounding. Refer to census definitions and notes for more information.
Wages and Salaries Paid
to Family MembersTotal Expenses
Total Farm Interest
Expenses
Rent and Leasing Expenses
Land and Buildings Total Wages and Salaries
138

Table 26.2: Farm Business Operating Expenses, 2010
# Farms $'000 # Farms $'000 # Farms $'000 # Farms $'000 # Farms $'000
Alberta 6,814 312,129 23,703 491,149 38,616 222,266 41,162 564,002 21,249 900,789
Lower Peace 186 5,921 695 10,286 1,134 4,220 1,219 16,478 657 30,470
Mackenzie County 94 1,651 392 4,506 562 1,713 607 7,637 364 11,557
Northern Lights County 62 3,029 210 4,577 411 1,868 433 6,353 193 12,110
Northern Sunrise County 30 1,240 93 1,203 161 640 179 2,488 100 6,803
Lower Athabasca 97 2,834 455 4,381 891 3,006 939 8,862 300 7,621
Bonnyville No. 87 72 2,486 347 3,550 673 2,178 715 6,811 233 5,821
Lac la Biche County 25 349 108 831 218 828 224 2,050 67 1,800
Upper Peace 571 14,992 1,873 22,028 3,372 13,683 3,654 48,393 1,742 101,896
Birch Hills County 49 671 182 2,234 274 1,848 280 5,827 182 17,477
Clear Hills 60 1,040 230 2,207 387 1,227 426 5,270 186 6,761
Fairview No. 136 47 1,609 125 1,811 204 1,023 221 3,131 138 8,671
Grande Prairie County No. 1 140 3,955 515 5,024 1,034 3,559 1,142 11,280 494 17,827
Greenview No. 16 71 2,070 283 2,678 567 2,085 611 6,957 165 6,676
Peace No. 135 31 547 80 656 143 435 158 1,645 87 3,582
Saddle Hills County 75 1,679 239 2,993 417 1,374 451 5,974 219 11,688
Smoky River No. 130 82 2,884 182 3,851 281 1,889 298 7,011 230 25,968
Spirit River No. 133 16 538 37 574 65 242 67 1,298 41 3,245
Upper Athabasca 585 13,393 2,220 29,607 4,173 16,247 4,417 44,125 1,696 60,526
Athabasca County 82 1,461 338 3,764 641 2,538 674 6,779 235 9,617
Barrhead County No. 11 90 3,035 374 9,049 609 2,976 640 7,548 342 13,604
Big Lakes 56 908 156 1,854 332 1,096 359 3,785 107 4,716
Lac Ste. Anne County 92 1,530 426 3,677 859 2,753 894 7,400 241 5,325
Lesser Slave River No.124 26 230 69 398 148 481 157 1,371 42 755
Westlock County 129 4,376 430 6,038 718 3,560 754 9,754 442 21,984
Woodlands County 27 338 126 915 256 804 285 2,216 81 1,375
Yellowhead County 83 1,517 301 3,913 610 2,039 654 5,272 206 3,148
Source: Statistics Canada, 2011 Census of Agriculture. Prepared by Alberta Agriculture and Rural Development, Economics and Competitiveness Division, Statistics and Data Development Branch.
(1) Includes diesel, gasoline, oil, wood, natural gas, propane, etc. 0 - True zero or a value rounded to zero. Totals may not add up due to rounding. Refer to census definitions and notes for more information.
Fertilizer and Lime
PurchasesAll Fuel Expenses (1)
Wages and Salaries Paid to
All Other Persons
Custom, Contract Work
and Hired Trucking
Electricity, Telephone and
Other Telecommunications
139

Table 26.2: Farm Business Operating Expenses, 2010
# Farms $'000 # Farms $'000 # Farms $'000 # Farms $'000 # Farms $'000
North Saskatchewan 2,015 68,688 7,313 99,044 12,568 56,467 13,388 157,296 6,992 268,645
Beaver County 91 1,060 398 4,194 627 3,212 650 8,851 391 17,707
Brazeau County 47 626 163 1,328 435 1,272 468 2,915 97 849
Camrose County 161 3,240 594 9,443 888 4,004 967 11,663 633 24,899
Clearwater County 78 1,189 488 3,793 979 3,092 1,037 6,816 423 3,640
Edmonton 19 4,610 25 1,038 62 484 67 963 27 683
Flagstaff County 137 3,020 437 8,273 596 2,946 618 10,336 489 25,610
Lamont County 102 1,280 403 4,579 677 2,567 717 8,194 452 16,751
Leduc County 182 4,195 569 6,722 1,107 5,060 1,201 11,111 564 14,513
Minburn County No. 27 117 3,560 364 7,080 561 2,704 580 10,167 416 20,591
Parkland County 108 5,722 297 4,414 682 3,074 733 6,224 262 8,564
Provost No. 52 62 3,379 274 5,111 395 2,141 405 6,263 254 10,250
Smoky Lake County 52 2,495 268 2,579 418 1,785 441 5,282 175 8,063
St. Paul County No. 19 111 1,378 445 4,128 708 2,304 763 7,806 316 10,070
Strathcona County 89 7,482 216 2,755 545 3,071 611 5,193 205 8,515
Sturgeon County 147 9,330 358 5,112 715 4,262 780 9,463 425 20,331
Thorhild County No. 7 39 893 240 2,025 423 1,560 452 5,181 219 8,722
Two Hills County No. 21 77 3,839 305 3,264 495 1,988 530 7,157 318 13,387
Vermilion River County 171 4,417 670 9,628 933 4,265 983 15,773 607 26,337
Wainwright No. 61 82 1,871 326 7,340 458 3,139 474 8,702 315 17,203
Wetaskiwin County No. 10 143 5,101 473 6,238 864 3,536 911 9,237 404 11,959
Red Deer 1,386 52,890 5,220 98,722 7,808 45,516 8,217 111,641 4,508 155,797
Kneehill County 156 6,037 449 14,839 622 4,165 649 11,855 480 30,512
Lacombe County 182 10,726 621 12,424 929 7,707 987 13,150 585 19,973
Mountain View County 220 3,824 911 12,398 1,453 6,042 1,527 14,245 850 21,754
Paintearth County No. 18 51 1,272 265 3,498 379 2,076 408 6,162 216 7,029
Ponoka County 180 6,605 674 13,466 1,005 5,344 1,063 11,504 583 11,119
Red Deer County 240 11,805 861 13,129 1,348 6,687 1,446 17,290 835 25,937
Special Area No. 2 74 5,676 292 7,941 444 3,082 452 7,972 119 3,966
Special Area No. 3 72 1,865 312 5,021 426 2,459 444 7,826 195 5,713
Special Area No. 4 65 1,403 195 3,707 264 1,667 269 5,504 140 4,682
Starland County 52 1,253 208 3,785 284 2,554 294 6,441 191 12,603
Stettler County No. 6 94 2,425 432 8,515 654 3,733 678 9,692 314 12,508
Source: Statistics Canada, 2011 Census of Agriculture. Prepared by Alberta Agriculture and Rural Development, Economics and Competitiveness Division, Statistics and Data Development Branch.
(1) Includes diesel, gasoline, oil, wood, natural gas, propane, etc. 0 - True zero or a value rounded to zero. Totals may not add up due to rounding. Refer to census definitions and notes for more information.
Fertilizer and Lime
Purchases
Electricity, Telephone and
Other Telecommunications
Wages and Salaries Paid to
All Other Persons
Custom, Contract Work
and Hired Trucking All Fuel Expenses (1)
140

Table 26.2: Farm Business Operating Expenses, 2010
# Farms $'000 # Farms $'000 # Farms $'000 # Farms $'000 # Farms $'000
South Saskatchewan 1,974 153,411 5,927 227,080 8,670 83,128 9,328 177,208 5,354 275,834
Bighorn No. 8 5 511 21 178 37 198 42 401 14 249
Calgary 11 391 19 615 39 180 47 654 17 1,957
Cardston County 81 3,710 281 5,636 433 4,331 475 9,975 247 19,282
Cypress County 134 13,152 475 7,754 748 6,610 788 15,659 360 12,378
Foothills No. 31 205 13,792 607 17,510 982 5,692 1,103 10,673 511 12,753
Forty Mile County No. 8 129 5,653 358 9,570 482 5,143 508 13,870 369 22,963
Lethbridge County 229 26,433 636 53,606 830 11,920 885 20,402 603 23,054
Newell County No. 4 174 5,600 481 29,750 652 5,624 677 12,036 429 14,640
Pincher Creek No. 9 54 3,029 265 12,262 384 2,261 410 5,799 202 9,430
Ranchland No. 66 18 626 31 442 50 218 60 437 13 100
Rocky View County 219 11,234 635 11,557 1,051 5,601 1,187 12,769 581 19,794
Taber 208 29,955 439 30,573 604 12,408 632 20,667 452 35,827
Vulcan County 135 13,311 415 14,483 552 6,102 574 17,277 435 34,891
Warner County No. 5 92 4,500 311 7,821 442 5,643 466 11,079 299 19,207
Wheatland County 162 13,635 479 14,502 697 5,860 747 14,671 448 33,206
Willow Creek No. 26 118 7,879 474 10,820 687 5,336 727 10,840 374 16,103
Source: Statistics Canada, 2011 Census of Agriculture. Prepared by Alberta Agriculture and Rural Development, Economics and Competitiveness Division, Statistics and Data Development Branch.
(1) Includes diesel, gasoline, oil, wood, natural gas, propane, etc. 0 - True zero or a value rounded to zero. Totals may not add up due to rounding. Refer to census definitions and notes for more information.
Fertilizer and Lime
Purchases
Electricity, Telephone and
Other Telecommunications All Fuel Expenses (1)
Wages and Salaries Paid to
All Other Persons
Custom, Contract Work
and Hired Trucking
141

Table 26.3: Farm Business Operating Expenses, 2010
# Farms $'000 # Farms $'000 # Farms $'000 # Farms $'000 # Farms $'000
Alberta 20,846 474,746 21,379 345,112 24,592 1,376,917 15,063 2,000,901 24,647 143,401
Lower Peace 659 15,152 704 12,906 499 3,603 284 3,456 437 734
Mackenzie County 368 5,873 399 5,363 260 1,158 154 687 196 190
Northern Lights County 194 6,314 205 4,840 174 1,007 103 1,354 174 334
Northern Sunrise County 97 2,964 100 2,703 65 1,439 27 1,414 67 210
Lower Athabasca 304 2,669 393 3,177 587 4,288 350 10,067 580 1,183
Bonnyville No. 87 239 2,036 299 2,445 455 3,596 269 8,616 433 919
Lac la Biche County 65 633 94 732 132 692 81 1,451 147 265
Upper Peace 1,820 43,731 1,904 40,110 1,847 30,597 959 48,175 1,626 4,215
Birch Hills County 196 7,478 180 6,904 111 5,390 67 7,846 108 470
Clear Hills 212 2,645 231 2,469 228 1,799 122 2,655 204 427
Fairview No. 136 136 3,741 128 3,133 97 2,676 44 2,783 101 206
Grande Prairie County No. 1 504 8,067 521 7,269 623 8,826 333 20,587 527 1,480
Greenview No. 16 179 2,796 243 2,753 393 3,952 193 5,997 339 784
Peace No. 135 91 1,794 91 1,505 79 516 43 1,314 84 131
Saddle Hills County 229 4,351 242 4,609 222 2,332 110 2,729 192 450
Smoky River No. 130 239 11,356 233 10,349 68 4,853 36 4,092 48 204
Spirit River No. 133 34 1,503 35 1,119 26 254 11 174 23 64
Upper Athabasca 1,707 22,062 2,160 22,269 2,818 78,835 1,526 132,459 2,797 9,105
Athabasca County 250 3,543 303 4,062 377 6,957 197 4,873 371 917
Barrhead County No. 11 334 4,585 381 4,857 402 22,982 258 30,562 417 2,453
Big Lakes 106 1,842 154 1,801 209 1,835 114 3,187 191 467
Lac Ste. Anne County 255 1,887 379 2,306 625 6,195 307 5,339 619 1,355
Lesser Slave River No.124 55 360 72 321 95 592 46 372 94 136
Westlock County 435 8,697 476 6,782 463 26,559 273 59,948 468 2,004
Woodlands County 70 238 112 601 193 2,508 98 3,198 184 382
Yellowhead County 202 910 283 1,539 454 11,206 233 24,980 453 1,391
Source: Statistics Canada, 2011 Census of Agriculture. Prepared by Alberta Agriculture and Rural Development, Economics and Competitiveness Division, Statistics and Data Development Branch.
0 - True zero or a value rounded to zero. Totals may not add up due to rounding. Refer to census definitions and notes for more information.
Feed and Supplement
Purchases Veterinary Services
Herbicide/Insecticide/
Fungicide Purchases
Seed and Seedling
Purchases
Livestock and Poultry
Purchases
142

Table 26.3: Farm Business Operating Expenses, 2010
# Farms $'000 # Farms $'000 # Farms $'000 # Farms $'000 # Farms $'000
North Saskatchewan 6,870 X 7,213 X 7,889 X 4,555 X 7,907 X
Beaver County 384 9,131 372 6,902 382 8,276 230 11,055 377 1,236
Brazeau County 125 X 168 X 331 X 160 X 309 X
Camrose County 621 13,540 622 9,889 517 17,412 311 19,078 505 2,281
Clearwater County 343 1,095 434 1,373 750 10,144 392 9,461 744 1,654
Edmonton 30 X 31 X 25 X 7 X 22 X
Flagstaff County 462 14,474 451 8,982 323 10,105 216 15,663 343 1,292
Lamont County 453 8,221 441 6,314 356 4,777 172 9,424 350 842
Leduc County 545 6,233 612 5,911 693 15,979 391 10,656 681 3,004
Minburn County No. 27 415 11,152 383 7,679 296 19,291 201 48,446 309 2,926
Parkland County 290 3,584 332 4,672 501 7,227 251 9,580 455 1,692
Provost No. 52 246 5,921 226 3,272 261 16,174 195 23,961 276 1,759
Smoky Lake County 185 3,014 218 3,124 252 4,511 144 9,531 280 806
St. Paul County No. 19 297 3,819 353 3,480 465 5,660 274 17,775 485 1,116
Strathcona County 225 2,940 246 4,054 368 7,309 174 6,181 342 1,184
Sturgeon County 403 8,749 446 9,211 390 19,381 192 12,454 350 1,703
Thorhild County No. 7 210 2,566 243 2,954 243 2,232 114 2,329 248 537
Two Hills County No. 21 318 6,596 284 4,881 280 5,802 158 4,911 311 919
Vermilion River County 603 17,252 597 11,024 601 17,097 435 40,142 640 2,886
Wainwright No. 61 292 8,689 286 6,641 275 12,731 208 11,932 306 1,915
Wetaskiwin County No. 10 423 5,647 468 4,895 580 13,663 330 25,499 574 2,195
Red Deer 4,446 86,826 4,376 56,419 5,372 259,427 3,571 292,535 5,524 31,605
Kneehill County 468 16,034 424 9,621 353 35,791 242 40,320 368 3,274
Lacombe County 534 9,195 586 8,171 675 44,412 394 29,899 658 4,601
Mountain View County 730 9,527 774 6,978 1,019 21,289 600 29,622 1,008 3,422
Paintearth County No. 18 231 4,953 217 3,191 273 9,849 206 10,530 297 1,585
Ponoka County 486 4,853 617 4,214 768 40,417 468 42,577 774 5,152
Red Deer County 777 11,352 778 9,609 926 36,140 566 35,373 918 5,098
Special Area No. 2 190 3,768 168 1,845 307 25,968 267 35,818 340 2,855
Special Area No. 3 298 6,986 189 2,193 238 7,389 196 10,415 271 1,128
Special Area No. 4 176 3,324 148 1,699 180 10,440 171 16,416 208 1,320
Starland County 204 9,048 152 3,985 161 8,423 121 9,183 176 724
Stettler County No. 6 352 7,785 323 4,914 472 19,310 340 32,382 506 2,446
Source: Statistics Canada, 2011 Census of Agriculture. Prepared by Alberta Agriculture and Rural Development, Economics and Competitiveness Division, Statistics and Data Development Branch.
X - Confidential. 0 - True zero or a value rounded to zero. Totals may not add up due to rounding. Refer to census definitions and notes for more information.
Feed and Supplement
Purchases
Seed and Seedling
Purchases
Herbicide/Insecticide/
Fungicide Purchases Veterinary Services
Livestock and Poultry
Purchases
143

Table 26.3: Farm Business Operating Expenses, 2010
# Farms $'000 # Farms $'000 # Farms $'000 # Farms $'000 # Farms $'000
South Saskatchewan 5,040 X 4,629 X 5,580 799,648 3,818 1,206,853 5,776 X
Bighorn No. 8 8 X 7 X 32 711 18 321 28 X
Calgary 14 836 20 599 29 214 21 263 30 X
Cardston County 203 10,344 199 4,619 333 18,544 222 10,375 345 1,730
Cypress County 359 8,759 333 6,355 451 18,466 344 45,309 491 2,075
Foothills No. 31 459 6,879 398 5,700 757 26,424 379 53,307 735 5,025
Forty Mile County No. 8 360 20,519 309 7,352 217 21,364 174 18,240 220 1,700
Lethbridge County 550 12,101 559 10,888 518 256,817 388 409,230 467 15,149
Newell County No. 4 398 7,846 389 4,899 397 38,661 324 75,064 458 3,123
Pincher Creek No. 9 167 5,667 159 2,553 304 15,332 202 29,146 302 1,722
Ranchland No. 66 16 X 10 X 54 1,071 31 1,751 49 X
Rocky View County 539 11,058 463 8,171 782 29,748 417 39,499 798 7,486
Taber 447 24,730 441 18,739 272 96,496 235 162,154 327 7,903
Vulcan County 409 19,981 384 11,163 296 93,829 227 147,744 302 5,846
Warner County No. 5 308 13,837 262 5,451 232 39,557 183 21,511 268 3,028
Wheatland County 456 20,120 401 12,860 385 89,002 272 120,228 404 5,743
Willow Creek No. 26 347 8,259 295 4,237 521 53,411 381 72,711 552 4,744
Source: Statistics Canada, 2011 Census of Agriculture. Prepared by Alberta Agriculture and Rural Development, Economics and Competitiveness Division, Statistics and Data Development Branch.
X - Confidential. 0 - True zero or a value rounded to zero. Totals may not add up due to rounding. Refer to census definitions and notes for more information.
Seed and Seedling
Purchases Veterinary Services
Livestock and Poultry
Purchases
Herbicide/Insecticide/
Fungicide Purchases
Feed and Supplement
Purchases
144

Table 26.4: Farm Business Operating Expenses, 2010
# Farms $'000 # Farms $'000 # Farms $'000 # Farms $'000
Alberta 38,982 514,473 7,583 84,714 31,571 164,202 38,893 1,081,631
Lower Peace 1,154 14,215 184 3,134 803 2,617 1,146 23,342
Mackenzie County 577 5,892 92 998 392 1,195 576 7,944
Northern Lights County 408 5,887 65 1,788 310 1,065 404 9,935
Northern Sunrise County 169 2,436 27 348 101 357 166 5,462
Lower Athabasca 866 7,555 147 709 695 2,265 874 11,157
Bonnyville No. 87 656 5,633 103 438 524 1,697 661 8,596
Lac la Biche County 210 1,922 44 271 171 568 213 2,560
Upper Peace 3,476 42,729 624 5,399 2,632 10,735 3,435 72,593
Birch Hills County 272 5,057 58 501 219 1,040 263 9,673
Clear Hills 403 3,606 72 392 307 1,010 387 5,514
Fairview No. 136 211 3,001 43 529 162 735 199 5,300
Grande Prairie County No. 1 1,092 9,794 151 1,104 819 3,376 1,071 15,851
Greenview No. 16 572 5,448 102 429 448 1,552 588 8,127
Peace No. 135 155 1,410 28 168 107 363 156 3,569
Saddle Hills County 424 5,307 70 1,309 331 1,190 420 7,605
Smoky River No. 130 284 8,156 87 808 196 1,290 285 15,110
Spirit River No. 133 63 951 13 159 43 178 66 1,844
Upper Athabasca 4,154 38,720 769 4,365 3,335 10,828 4,147 74,086
Athabasca County 632 6,482 106 763 504 1,660 628 9,850
Barrhead County No. 11 614 6,888 148 761 489 1,994 604 14,169
Big Lakes 332 2,923 66 470 265 738 340 4,515
Lac Ste. Anne County 852 6,078 143 461 675 1,796 829 9,665
Lesser Slave River No.124 144 908 17 14 122 301 140 1,012
Westlock County 715 9,308 149 1,450 572 2,222 724 20,340
Woodlands County 262 1,822 48 175 212 508 253 2,682
Yellowhead County 603 4,311 92 271 496 1,609 629 11,852
Source: Statistics Canada, 2011 Census of Agriculture. Prepared by Alberta Agriculture and Rural Development, Economics and Competitiveness Division, Statistics and Data Development Branch.
0 - True zero or a value rounded to zero. Totals may not add up due to rounding. Refer to census definitions and notes for more information.
Repairs and Maintenance
Machinery, Equipment and Vehicles
Rental and Leasing of
Machinery, Equipment and Vehicles
Repairs and Maintenance
Farm Buildings and Fences
All Other Farm
Operating Expenses
145

Table 26.4: Farm Business Operating Expenses, 2010
# Farms $'000 # Farms $'000 # Farms $'000 # Farms $'000
North Saskatchewan 12,711 143,291 2,247 18,381 10,295 X 12,623 288,715
Beaver County 625 8,239 111 687 511 2,260 634 16,016
Brazeau County 428 2,746 48 231 348 X 437 4,085
Camrose County 921 10,840 205 1,107 768 3,507 908 25,263
Clearwater County 967 5,674 132 345 811 1,952 989 10,440
Edmonton 59 451 9 23 40 X 65 2,638
Flagstaff County 600 9,319 127 1,378 476 2,523 586 23,104
Lamont County 690 8,426 110 991 536 1,942 690 11,965
Leduc County 1,130 10,189 205 862 898 3,476 1,130 20,620
Minburn County No. 27 556 9,546 132 1,377 468 2,534 550 17,195
Parkland County 699 5,816 98 350 564 2,188 681 11,328
Provost No. 52 387 5,951 77 588 322 1,876 380 12,613
Smoky Lake County 421 4,712 70 714 334 1,234 410 8,351
St. Paul County No. 19 733 7,017 120 627 592 1,818 697 10,293
Strathcona County 548 4,498 60 771 445 2,385 571 10,183
Sturgeon County 744 8,938 118 1,690 557 3,035 720 18,905
Thorhild County No. 7 422 4,442 79 731 333 1,118 407 5,846
Two Hills County No. 21 511 6,374 76 1,643 407 2,204 504 14,839
Vermilion River County 943 13,613 207 2,137 781 3,739 939 29,861
Wainwright No. 61 465 8,282 85 1,009 382 2,039 461 18,464
Wetaskiwin County No. 10 862 8,214 178 1,119 722 3,118 864 16,705
Red Deer 7,850 101,841 1,621 17,070 6,633 36,213 7,810 222,126
Kneehill County 627 11,013 146 2,506 530 3,807 620 26,350
Lacombe County 934 12,439 165 3,183 798 4,984 936 27,329
Mountain View County 1,433 13,033 318 2,415 1,233 5,242 1,450 29,182
Paintearth County No. 18 392 5,537 70 340 328 2,166 385 10,154
Ponoka County 1,010 9,969 215 1,355 860 4,161 1,017 23,005
Red Deer County 1,372 14,592 282 2,875 1,162 5,046 1,382 39,881
Special Area No. 2 442 8,321 88 685 372 2,824 425 14,416
Special Area No. 3 441 6,815 109 1,128 347 1,884 425 14,003
Special Area No. 4 259 4,380 48 651 214 1,243 252 8,398
Starland County 281 5,947 57 604 220 1,857 276 12,865
Stettler County No. 6 659 9,796 123 1,325 569 2,999 642 16,542
Source: Statistics Canada, 2011 Census of Agriculture. Prepared by Alberta Agriculture and Rural Development, Economics and Competitiveness Division, Statistics and Data Development Branch.
X - Confidential. 0 - True zero or a value rounded to zero. Totals may not add up due to rounding. Refer to census definitions and notes for more information.
All Other Farm
Operating Expenses
Repairs and Maintenance
Machinery, Equipment and Vehicles
Rental and Leasing of
Machinery, Equipment and Vehicles
Repairs and Maintenance
Farm Buildings and Fences
146

Table 26.4: Farm Business Operating Expenses, 2010
# Farms $'000 # Farms $'000 # Farms $'000 # Farms $'000
South Saskatchewan 8,771 166,124 1,991 X 7,178 57,140 8,858 389,612
Bighorn No. 8 39 337 5 X 28 158 39 848
Calgary 40 312 7 X 33 96 48 1,705
Cardston County 436 8,688 118 1,680 366 2,716 433 15,048
Cypress County 751 10,901 122 1,945 606 3,970 736 28,314
Foothills No. 31 1,023 10,214 152 1,866 863 5,457 1,089 21,744
Forty Mile County No. 8 485 12,896 133 1,796 368 2,975 479 30,732
Lethbridge County 850 20,363 181 3,746 621 7,319 835 50,681
Newell County No. 4 645 12,056 222 1,679 544 3,522 639 20,105
Pincher Creek No. 9 391 4,746 85 1,245 359 1,770 407 15,121
Ranchland No. 66 55 337 4 37 52 264 62 943
Rocky View County 1,078 11,693 195 3,638 921 6,752 1,120 34,703
Taber 596 22,514 177 6,584 442 4,869 603 41,107
Vulcan County 545 14,847 174 4,409 446 5,812 553 40,352
Warner County No. 5 436 10,656 92 1,740 343 3,287 428 20,238
Wheatland County 713 15,536 155 3,284 573 4,589 706 45,000
Willow Creek No. 26 688 10,027 169 1,524 613 3,582 681 22,972
Source: Statistics Canada, 2011 Census of Agriculture. Prepared by Alberta Agriculture and Rural Development, Economics and Competitiveness Division, Statistics and Data Development Branch.
X - Confidential. 0 - True zero or a value rounded to zero. Totals may not add up due to rounding. Refer to census definitions and notes for more information.
All Other Farm
Operating Expenses
Repairs and Maintenance
Machinery, Equipment and Vehicles
Rental and Leasing of
Machinery, Equipment and Vehicles
Repairs and Maintenance
Farm Buildings and Fences
147

Table 27.1: Farms Classified by Total Gross Farm Receipts, 2010
Total
# Farms
Total Gross
Farm Receipts
($'000)
Under
$10,000
$10,000-
$24,999-
$25,000-
$49,999-
$50,000-
$99,999-
$100,000-
$249,999-
$250,000-
$499,999-
$500,000-
$999,999-
$1,000,000-
$1,999,999-
$2,000,000
and Over
Alberta 43,234 11,436,181 7,707 7,862 6,051 5,934 7,015 4,211 2,494 1,175 785
Lower Peace 1,253 204,990 215 243 193 187 216 115 46 28 10
Mackenzie County 626 79,318 89 105 108 121 116 59 22 5 1
Northern Lights County 446 83,235 91 112 61 45 67 35 16 13 6
Northern Sunrise County 181 42,437 35 26 24 21 33 21 8 10 3
Lower Athabasca 978 89,438 243 226 144 153 134 43 26 7 2
Bonnyville No. 87 739 69,017 188 172 106 114 99 32 21 5 2
Lac la Biche County 239 20,421 55 54 38 39 35 11 5 2 0
Upper Peace 3,816 687,849 779 727 561 504 568 321 239 82 35
Birch Hills County 295 103,057 41 38 31 39 47 43 33 18 5
Clear Hills 443 47,058 92 94 82 58 71 31 8 5 2
Fairview No. 136 225 52,404 30 37 39 25 32 27 27 6 2
Grande Prairie County No. 1 1,206 149,929 286 262 188 158 165 79 54 8 6
Greenview No. 16 639 67,987 167 162 93 96 71 24 17 4 5
Peace No. 135 166 27,172 35 23 21 21 32 17 13 4 0
Saddle Hills County 463 72,718 88 78 75 68 87 33 22 7 5
Smoky River No. 130 310 148,988 30 20 26 26 52 63 61 23 9
Spirit River No. 133 69 18,536 10 13 6 13 11 4 4 7 1
Upper Athabasca 4,601 714,857 1,102 975 720 633 591 310 149 92 29
Athabasca County 697 84,438 165 162 116 98 79 39 21 13 4
Barrhead County No. 11 667 166,203 114 116 88 90 112 69 35 37 6
Big Lakes 375 41,558 85 73 53 66 62 18 12 4 2
Lac Ste. Anne County 936 70,358 242 229 169 133 98 43 15 6 1
Lesser Slave River No.124 160 9,496 40 42 20 25 28 4 1 0 0
Westlock County 777 230,609 134 125 98 104 130 99 51 25 11
Woodlands County 294 20,924 104 65 57 22 25 13 5 3 0
Yellowhead County 695 91,271 218 163 119 95 57 25 9 4 5
Source: Statistics Canada, 2011 Census of Agriculture. Prepared by Alberta Agriculture and Rural Development, Economics and Competitiveness Division, Statistics and Data Development Branch.
0 - True zero or a value rounded to zero. Totals may not add up due to rounding. Refer to census definitions and notes for more information.
148

Table 27.1: Farms Classified by Total Gross Farm Receipts, 2010
Total
# Farms
Total Gross
Farm Receipts
($'000)
Under
$10,000
$10,000-
$24,999-
$25,000-
$49,999-
$50,000-
$99,999-
$100,000-
$249,999-
$250,000-
$499,999-
$500,000-
$999,999-
$1,000,000-
$1,999,999-
$2,000,000
and Over
North Saskatchewan 14,026 2,629,972 2,690 2,719 2,045 1,909 2,172 1,288 740 316 147
Beaver County 677 145,499 107 118 85 90 120 78 56 16 7
Brazeau County 487 26,140 124 131 103 67 51 5 5 0 1
Camrose County 999 224,399 132 181 138 106 172 152 71 37 10
Clearwater County 1,096 76,888 285 269 212 150 130 30 17 1 2
Edmonton 73 35,356 29 4 13 10 7 4 3 0 3
Flagstaff County 650 198,672 55 51 77 84 157 127 59 27 13
Lamont County 753 116,938 151 153 122 97 122 56 31 16 5
Leduc County 1,255 162,680 276 289 194 175 152 87 59 21 2
Minburn County No. 27 604 212,292 75 83 83 82 134 67 45 27 8
Parkland County 782 97,975 228 197 114 74 88 34 25 14 8
Provost No. 52 425 127,712 28 60 50 77 97 62 30 12 9
Smoky Lake County 454 73,171 73 107 81 68 59 35 18 9 4
St. Paul County No. 19 788 107,680 151 156 122 135 112 57 41 8 6
Strathcona County 658 90,895 246 155 72 52 63 37 18 7 8
Sturgeon County 823 185,794 192 159 103 91 114 69 46 33 16
Thorhild County No. 7 462 58,070 86 85 82 86 69 32 12 8 2
Two Hills County No. 21 554 99,241 103 98 72 93 94 52 30 7 5
Vermilion River County 1,029 278,186 100 153 114 160 198 160 90 37 17
Wainwright No. 61 501 153,169 46 70 59 66 112 77 43 16 12
Wetaskiwin County No. 10 956 159,214 203 200 149 146 121 67 41 20 9
Red Deer 8,645 2,206,195 1,143 1,479 1,208 1,255 1,656 931 534 278 161
Kneehill County 686 301,741 51 75 82 91 128 102 98 36 23
Lacombe County 1,045 311,828 145 185 153 136 175 108 58 54 31
Mountain View County 1,636 245,142 328 334 244 223 254 148 68 27 10
Paintearth County No. 18 420 93,780 43 61 65 63 109 49 17 6 7
Ponoka County 1,106 248,892 160 231 161 161 183 89 62 42 17
Red Deer County 1,531 331,093 230 312 234 215 263 125 74 54 24
Special Area No. 2 473 162,537 38 63 54 84 113 77 23 12 9
Special Area No. 3 464 111,947 25 44 64 72 150 62 33 8 6
Special Area No. 4 279 90,137 15 31 25 42 74 49 32 8 3
Starland County 300 123,776 23 29 32 37 76 50 26 14 13
Stettler County No. 6 705 185,321 85 114 94 131 131 72 43 17 18
Source: Statistics Canada, 2011 Census of Agriculture. Prepared by Alberta Agriculture and Rural Development, Economics and Competitiveness Division, Statistics and Data Development Branch.
0 - True zero or a value rounded to zero. Totals may not add up due to rounding. Refer to census definitions and notes for more information.
149

Table 27.1: Farms Classified by Total Gross Farm Receipts, 2010
Total
# Farms
Total Gross
Farm Receipts
($'000)
Under
$10,000
$10,000-
$24,999-
$25,000-
$49,999-
$50,000-
$99,999-
$100,000-
$249,999-
$250,000-
$499,999-
$500,000-
$999,999-
$1,000,000-
$1,999,999-
$2,000,000
and Over
South Saskatchewan 9,915 4,902,880 1,535 1,493 1,180 1,293 1,678 1,203 760 372 401
Bighorn No. 8 44 7,900 14 7 1 5 13 2 1 0 1
Calgary 55 12,514 27 11 2 5 4 3 0 1 2
Cardston County 497 162,733 77 89 71 74 79 51 26 9 21
Cypress County 827 236,366 89 143 117 127 151 109 52 23 16
Foothills No. 31 1,224 236,854 352 257 154 140 149 81 48 27 16
Forty Mile County No. 8 524 253,907 38 33 47 54 120 104 75 25 28
Lethbridge County 933 1,058,080 97 115 94 123 154 107 89 77 77
Newell County No. 4 717 286,987 60 61 91 113 176 115 58 18 25
Pincher Creek No. 9 448 145,458 88 81 68 69 71 39 16 6 10
Ranchland No. 66 78 7,071 25 19 7 7 11 7 2 0 0
Rocky View County 1,271 269,454 306 276 168 168 148 95 60 31 19
Taber 652 674,104 50 62 60 70 141 97 67 41 64
Vulcan County 603 534,826 44 51 59 71 99 122 78 43 36
Warner County No. 5 488 243,167 62 55 55 65 97 78 39 11 26
Wheatland County 782 485,025 102 96 84 89 133 118 83 40 37
Willow Creek No. 26 772 288,433 104 137 102 113 132 75 66 20 23
Source: Statistics Canada, 2011 Census of Agriculture. Prepared by Alberta Agriculture and Rural Development, Economics and Competitiveness Division, Statistics and Data Development Branch.
0 - True zero or a value rounded to zero. Totals may not add up due to rounding. Refer to census definitions and notes for more information.
150

Table 28.1: Farms Classified by Type, Based on NAICS*, 2011
Total
# Farms Dairy
Cattle
(beef) Hog
Poultry
and Egg
Sheep
and Goat
Other
Livestock Wheat
Grain and
Oilseed(excl. wheat) Hay
Fruit and
Tree-nut
Vegetable
and Melon
Greenhouse,
Nursery,
Floriculture,
Mushroom Other Crops
Alberta 43,234 485 12,022 193 339 490 6,374 2,083 10,609 7,799 151 277 826 1,586
Lower Peace 1,253 4 136 3 5 10 133 48 563 290 5 6 7 43
Mackenzie County 626 2 59 1 5 5 62 25 345 91 2 3 2 24
Northern Lights County 446 0 52 1 0 4 51 17 143 154 2 1 4 17
Northern Sunrise County 181 2 25 1 0 1 20 6 75 45 1 2 1 2
Lower Athabasca 978 3 317 0 5 10 148 4 104 333 3 3 11 37
Bonnyville No. 87 739 2 248 0 4 7 107 1 79 251 2 3 9 26
Lac la Biche County 239 1 69 0 1 3 41 3 25 82 1 0 2 11
Upper Peace 3,816 3 586 9 10 28 519 165 1,126 1,098 9 10 41 212
Birch Hills County 295 1 45 0 0 0 29 20 134 53 0 1 0 12
Clear Hills 443 1 60 2 2 0 59 9 119 148 0 0 0 43
Fairview No. 136 225 0 28 3 0 5 14 17 97 45 0 1 4 11
Grande Prairie County No. 1 1,206 0 193 2 3 8 211 30 282 402 3 3 18 51
Greenview No. 16 639 1 133 1 3 12 111 17 78 232 2 1 4 44
Peace No. 135 166 0 23 0 1 1 16 7 58 44 1 1 6 8
Saddle Hills County 463 0 79 0 1 1 44 30 124 143 1 1 5 34
Smoky River No. 130 310 0 20 1 0 1 24 27 206 18 2 1 2 8
Spirit River No. 133 69 0 5 0 0 0 11 8 28 13 0 1 2 1
Upper Athabasca 4,601 49 1,349 21 31 61 810 60 805 1,115 13 18 63 206
Athabasca County 697 3 188 2 4 7 100 7 134 204 2 4 9 33
Barrhead County No. 11 667 22 192 11 9 14 80 13 170 107 4 2 6 37
Big Lakes 375 0 97 1 0 3 59 4 69 120 0 3 4 15
Lac Ste. Anne County 936 5 320 2 3 17 193 10 82 251 1 1 13 38
Lesser Slave River No.124 160 1 54 0 0 2 29 2 13 51 0 2 1 5
Westlock County 777 10 194 4 9 8 96 18 277 106 2 2 13 38
Woodlands County 294 2 99 1 2 3 56 2 19 93 0 1 4 12
Yellowhead County 695 6 205 0 4 7 197 4 41 183 4 3 13 28
Source: Statistics Canada, 2011 Census of Agriculture. Prepared by Alberta Agriculture and Rural Development, Economics and Competitiveness Division, Statistics and Data Development Branch.
*Farms classified by the commodity or group of commodities that make up the majority of total receipts; based on the North American Industry Classification System (NAICS).
0 - True zero or a value rounded to zero. Refer to census definitions and notes for more information.
151

Table 28.1: Farms Classified by Type, Based on NAICS*, 2011
Total
# Farms Dairy
Cattle
(beef) Hog
Poultry
and Egg
Sheep
and Goat
Other
Livestock Wheat
Grain and
Oilseed(excl. wheat) Hay
Fruit and
Tree-nut
Vegetable
and Melon
Greenhouse,
Nursery,
Floriculture,
Mushroom Other Crops
North Saskatchewan 14,026 147 3,660 53 121 156 2,075 574 3,886 2,442 54 90 297 471
Beaver County 677 4 149 5 5 4 93 46 259 89 0 2 5 16
Brazeau County 487 3 154 2 2 8 117 1 18 158 4 2 4 14
Camrose County 999 13 198 6 28 19 104 61 414 106 0 5 16 29
Clearwater County 1,096 14 469 6 3 6 221 1 47 272 1 1 16 39
Edmonton 73 0 3 0 2 0 20 3 8 12 1 4 20 0
Flagstaff County 650 3 124 1 1 3 52 72 334 36 2 2 5 15
Lamont County 753 2 132 0 2 9 80 54 314 109 2 4 11 34
Leduc County 1,255 57 258 4 12 17 215 48 291 242 8 11 39 53
Minburn County No. 27 604 4 124 0 2 8 52 40 293 55 4 3 4 15
Parkland County 782 10 219 0 9 13 198 4 102 148 8 15 30 26
Provost No. 52 425 0 169 1 3 2 27 32 119 48 1 0 1 22
Smoky Lake County 454 0 133 1 2 3 47 7 119 103 1 2 6 30
St. Paul County No. 19 788 3 267 3 2 7 88 11 149 221 1 2 5 29
Strathcona County 658 5 106 0 6 11 182 22 103 154 8 4 52 5
Sturgeon County 823 7 132 6 23 6 151 32 263 122 10 12 41 18
Thorhild County No. 7 462 0 97 2 2 5 64 10 138 113 0 2 4 25
Two Hills County No. 21 554 1 139 1 5 9 41 31 195 100 0 4 2 26
Vermilion River County 1,029 1 336 6 2 3 101 43 373 125 1 1 6 31
Wainwright No. 61 501 1 165 6 3 4 48 37 156 63 0 0 5 13
Wetaskiwin County No. 10 956 19 286 3 7 19 174 19 191 166 2 14 25 31
Red Deer 8,645 192 2,871 58 96 104 1,175 414 1,967 1,227 35 35 150 321
Kneehill County 686 3 141 6 31 10 66 63 291 51 3 0 11 10
Lacombe County 1,045 54 330 14 15 19 161 15 245 115 5 17 32 23
Mountain View County 1,636 28 527 0 16 19 303 18 351 269 6 5 41 53
Paintearth County No. 18 420 0 150 1 1 2 43 23 90 78 3 0 3 26
Ponoka County 1,106 61 421 13 18 18 186 10 169 145 4 6 14 41
Red Deer County 1,531 37 485 16 11 25 250 28 365 203 10 6 43 52
Special Area No. 2 473 0 237 2 1 1 34 35 48 93 0 0 2 20
Special Area No. 3 464 1 107 0 0 0 20 144 75 78 1 0 1 37
Special Area No. 4 279 0 130 0 0 0 15 21 58 37 0 0 0 18
Starland County 300 1 66 0 1 5 21 36 130 29 0 1 0 10
Stettler County No. 6 705 7 277 6 2 5 76 21 145 129 3 0 3 31
Source: Statistics Canada, 2011 Census of Agriculture. Prepared by Alberta Agriculture and Rural Development, Economics and Competitiveness Division, Statistics and Data Development Branch.
*Farms classified by the commodity or group of commodities that make up the majority of total receipts; based on the North American Industry Classification System (NAICS).
0 - True zero or a value rounded to zero. Refer to census definitions and notes for more information.
152

Table 28.1: Farms Classified by Type, Based on NAICS*, 2011
Total
# Farms Dairy
Cattle
(beef) Hog
Poultry
and Egg
Sheep
and Goat
Other
Livestock Wheat
Grain and
Oilseed(excl. wheat) Hay
Fruit and
Tree-nut
Vegetable
and Melon
Greenhouse,
Nursery,
Floriculture,
Mushroom Other Crops
South Saskatchewan 9,915 87 3,103 49 71 121 1,514 818 2,158 1,294 32 115 257 296
Bighorn No. 8 44 0 21 0 0 1 16 0 2 4 0 0 0 0
Calgary 55 0 5 0 0 0 23 0 7 6 3 2 8 1
Cardston County 497 3 223 4 0 6 75 23 76 71 2 1 3 10
Cypress County 827 1 346 2 1 3 70 118 96 128 4 4 39 15
Foothills No. 31 1,224 2 318 3 7 16 348 18 180 234 4 2 59 33
Forty Mile County No. 8 524 2 105 0 2 2 25 157 164 34 2 12 5 14
Lethbridge County 933 55 230 11 24 23 95 88 237 94 4 11 24 37
Newell County No. 4 717 3 309 1 2 11 82 32 163 72 1 7 9 25
Pincher Creek No. 9 448 2 244 1 6 2 62 1 37 73 2 1 5 12
Ranchland No. 66 78 0 51 0 2 0 19 0 0 4 1 0 1 0
Rocky View County 1,271 5 355 1 5 19 315 35 219 221 2 5 56 33
Taber 652 6 175 11 3 8 45 66 176 32 0 62 8 60
Vulcan County 603 2 105 3 1 6 61 71 284 51 0 1 5 13
Warner County No. 5 488 0 106 3 3 6 59 100 130 59 1 0 7 14
Wheatland County 782 1 173 2 6 8 105 83 263 101 6 4 23 7
Willow Creek No. 26 772 5 337 7 9 10 114 26 124 110 0 3 5 22
Source: Statistics Canada, 2011 Census of Agriculture. Prepared by Alberta Agriculture and Rural Development, Economics and Competitiveness Division, Statistics and Data Development Branch.
*Farms classified by the commodity or group of commodities that make up the majority of total receipts; based on the North American Industry Classification System (NAICS).
0 - True zero or a value rounded to zero. Refer to census definitions and notes for more information.
153

Table 29.1: Paid Agricultural Labour, 2010
# Farms # Employees Weeks # Farms # Employees Weeks # Farms # Employees Weeks
Alberta 12,798 37,852 898,452 6,467 15,598 657,073 8,687 22,254 241,379
Lower Peace 371 963 17,207 133 244 9,497 291 719 7,710
Mackenzie County 182 362 5,750 61 99 3,433 146 263 2,317
Northern Lights County 127 430 7,818 44 81 3,356 102 349 4,462
Northern Sunrise County 62 171 3,639 28 64 2,708 43 107 931
Lower Athabasca 219 585 9,519 84 156 6,396 153 429 3,123
Bonnyville No. 87 166 443 7,901 68 127 5,522 115 316 2,379
Lac la Biche County 53 142 1,618 16 29 874 38 113 744
Upper Peace 1,024 2,433 48,463 429 806 31,482 765 1,627 16,981
Birch Hills County 92 196 4,197 34 57 2,302 76 139 1,895
Clear Hills 114 218 4,175 42 71 2,581 88 147 1,594
Fairview No. 136 91 223 4,931 35 77 3,306 65 146 1,625
Grande Prairie County No. 1 265 660 12,791 114 211 8,634 192 449 4,157
Greenview No. 16 124 268 5,117 55 103 3,648 86 165 1,469
Peace No. 135 53 117 2,480 25 42 1,664 39 75 816
Saddle Hills County 127 290 5,414 57 93 3,372 94 197 2,042
Smoky River No. 130 139 406 7,922 58 131 5,090 110 275 2,832
Spirit River No. 133 19 55 1,436 9 21 885 15 34 551
Upper Athabasca 1,069 2,724 50,255 435 811 32,402 788 1,913 17,853
Athabasca County 153 404 6,311 54 90 3,600 123 314 2,711
Barrhead County No. 11 187 460 10,259 96 187 7,766 122 273 2,493
Big Lakes 96 185 3,503 39 53 2,344 73 132 1,159
Lac Ste. Anne County 174 367 6,258 72 103 4,019 122 264 2,239
Lesser Slave River No.124 37 87 772 9 17 339 30 70 433
Westlock County 231 699 12,445 86 203 8,591 182 496 3,854
Woodlands County 64 163 1,848 26 44 1,325 42 119 523
Yellowhead County 127 359 8,859 53 114 4,418 94 245 4,441
Source: Statistics Canada, 2011 Census of Agriculture. Prepared by Alberta Agriculture and Rural Development, Economics and Competitiveness Division, Statistics and Data Development Branch.
(1) Full-time or part-time. 0 - True zero or a value rounded to zero. Refer to census definitions and notes for more information.
Total Paid Labour Paid Work, Year Round (1) Paid Work, Seasonal or Temporary
154

Table 29.1: Paid Agricultural Labour, 2010
# Farms # Employees Weeks # Farms # Employees Weeks # Farms # Employees Weeks
North Saskatchewan 3,870 10,585 219,921 1,814 3,873 155,907 2,670 6,712 64,014
Beaver County 204 401 7,979 89 157 6,246 143 244 1,733
Brazeau County 83 189 2,522 29 43 1,629 63 146 893
Camrose County 318 766 16520 159 341 13220 202 425 3300
Clearwater County 175 372 7,350 80 140 5,835 122 232 1,515
Edmonton 28 241 6,717 15 76 3,709 23 165 3,008
Flagstaff County 262 623 14,721 132 256 11,253 177 367 3,468
Lamont County 185 411 6,836 83 145 4,579 129 266 2,257
Leduc County 325 875 17,697 158 350 13,378 216 525 4,319
Minburn County No. 27 224 516 10,281 85 173 7,341 166 343 2,940
Parkland County 167 686 13,352 78 207 8,813 121 479 4,539
Provost No. 52 167 435 10,449 93 203 7,815 108 232 2,634
Smoky Lake County 107 347 6,673 45 88 3,554 77 259 3,119
St. Paul County No. 19 189 478 7,073 83 128 4,546 132 350 2,527
Strathcona County 145 692 15,569 75 207 8,590 104 485 6,979
Sturgeon County 246 966 22,580 135 376 15,463 168 590 7,117
Thorhild County No. 7 102 223 4,418 48 93 3,539 65 130 879
Two Hills County No. 21 154 418 6,868 50 121 4,226 123 297 2,642
Vermilion River County 373 819 19,011 189 357 14,887 232 462 4,124
Wainwright No. 61 170 433 9,827 86 182 8,021 115 251 1,806
Wetaskiwin County No. 10 246 694 13,478 102 230 9,263 184 464 4,215
Red Deer 2,678 7,387 176,763 1,440 3,202 134,704 1,731 4,185 42,059
Kneehill County 279 817 20,165 142 339 15,248 198 478 4,917
Lacombe County 338 1,198 32,493 196 601 26,849 209 597 5,644
Mountain View County 409 965 19,298 199 370 14,389 278 595 4,909
Paintearth County No. 18 113 242 5,544 64 114 4,442 67 128 1,102
Ponoka County 322 809 19,344 169 378 15,264 200 431 4,080
Red Deer County 445 1,487 33,474 246 538 22,123 295 949 11,351
Special Area No. 2 166 446 13,328 103 256 10,993 86 190 2,335
Special Area No. 3 180 423 10,456 96 184 7,419 109 239 3,037
Special Area No. 4 120 272 6,255 63 124 5,052 81 148 1,203
Starland County 107 249 5,448 51 89 3,940 79 160 1,508
Stettler County No. 6 199 479 10,958 111 209 8,985 129 270 1,973
Source: Statistics Canada, 2011 Census of Agriculture. Prepared by Alberta Agriculture and Rural Development, Economics and Competitiveness Division, Statistics and Data Development Branch.
(1) Full-time or part-time. 0 - True zero or a value rounded to zero. Refer to census definitions and notes for more information.
Paid Work, Year Round(1) Paid Work, Seasonal or TemporaryTotal Paid Labour
155

Table 29.1: Paid Agricultural Labour, 2010
# Farms # Employees Weeks # Farms # Employees Weeks # Farms # Employees Weeks
South Saskatchewan 3,567 13,175 376,324 2,132 6,506 286,685 2,289 6,669 89,639
Bighorn No. 8 11 32 1,193 7 21 988 6 11 205
Calgary 14 51 836 6 16 502 11 35 334
Cardston County 168 442 11,329 94 168 7,556 110 274 3,773
Cypress County 268 1,090 34,943 166 543 24,317 156 547 10,626
Foothills No. 31 322 1,138 30,847 173 562 23,779 219 576 7,068
Forty Mile County No. 8 268 770 21,535 166 384 16,541 160 386 4,994
Lethbridge County 441 1,763 58,789 299 1,100 50,563 253 663 8,226
Newell County No. 4 293 780 19,189 161 329 13,849 199 451 5,340
Pincher Creek No. 9 103 350 10,211 50 180 8,134 72 170 2,077
Ranchland No. 66 23 58 1,413 11 20 1,011 16 38 402
Rocky View County 330 1,060 25,593 175 459 19,320 241 601 6,273
Taber 337 2,313 62,266 220 949 42,195 224 1,364 20,071
Vulcan County 272 926 29,574 175 533 24,941 165 393 4,633
Warner County No. 5 171 518 13,395 96 260 10,478 122 258 2,917
Wheatland County 304 1,111 31,374 176 550 23,555 198 561 7,819
Willow Creek No. 26 242 773 23,837 157 432 18,956 137 341 4,881
Source: Statistics Canada, 2011 Census of Agriculture. Prepared by Alberta Agriculture and Rural Development, Economics and Competitiveness Division, Statistics and Data Development Branch.
(1) Full-time or part-time. 0 - True zero or a value rounded to zero. Refer to Census definitions and notes for more information.
Paid Work, Year Round (1) Paid Work, Seasonal or TemporaryTotal Paid Labour
156

Table 30.1: Farms Using Computers and Internet for Farm Business, 2011
Farms Using Computer
for Farm Business
Farms Using Internet
for Farm Business
Farms With Access to
High-speed Internet
Alberta 26,673 24,928 20,097
Lower Peace 600 521 389
Mackenzie County 210 158 111
Northern Lights County 274 253 197
Northern Sunrise County 116 110 81
Lower Athabasca 513 484 414
Bonnyville No. 87 390 371 316
Lac la Biche County 123 113 98
Upper Peace 2,258 2,109 1,657
Birch Hills County 181 169 135
Clear Hills 202 181 114
Fairview No. 136 137 131 105
Grande Prairie County No. 1 732 686 578
Greenview No. 16 362 334 211
Peace No. 135 99 94 75
Saddle Hills County 281 266 212
Smoky River No. 130 220 206 189
Spirit River No. 133 44 42 38
Upper Athabasca 2,511 2,341 1,722
Athabasca County 382 360 315
Barrhead County No. 11 380 364 276
Big Lakes 183 173 119
Lac Ste. Anne County 494 458 324
Lesser Slave River No.124 77 69 38
Westlock County 458 432 358
Woodlands County 156 144 81
Yellowhead County 381 341 211
Source: Statistics Canada, 2011 Census of Agriculture. Prepared by Alberta Agriculture and Rural Development, Economics and Competitiveness Division, Statistics and Data Development Branch.
0 - True zero or a value rounded to zero. Refer to census definitions and notes for more information.
157

Table 30.1: Farms Using Computers and Internet for Farm Business, 2011
Farms Using Computer
for Farm Business
Farms Using Internet
for Farm Business
Farms With Access to
High-speed Internet
North Saskatchewan 8,233 7,716 6,067
Beaver County 409 379 312
Brazeau County 264 239 145
Camrose County 647 617 527
Clearwater County 606 561 344
Edmonton 43 41 34
Flagstaff County 439 418 331
Lamont County 403 380 317
Leduc County 733 686 547
Minburn County No. 27 365 339 285
Parkland County 446 415 315
Provost No. 52 267 253 189
Smoky Lake County 223 216 162
St. Paul County No. 19 416 397 329
Strathcona County 411 381 305
Sturgeon County 510 473 414
Thorhild County No. 7 250 233 168
Two Hills County No. 21 269 250 197
Vermilion River County 641 593 504
Wainwright No. 61 301 282 210
Wetaskiwin County No. 10 590 563 432
Red Deer 5,720 5,354 4,397
Kneehill County 512 487 430
Lacombe County 693 648 532
Mountain View County 1,056 978 769
Paintearth County No. 18 283 268 232
Ponoka County 686 622 500
Red Deer County 1,025 966 772
Special Area No. 2 318 299 260
Special Area No. 3 316 305 265
Special Area No. 4 166 159 148
Starland County 221 205 167
Stettler County No. 6 444 417 322
Source: Statistics Canada, 2011 Census of Agriculture. Prepared by Alberta Agriculture and Rural Development, Economics and Competitiveness Division, Statistics and Data Development Branch.
0 - True zero or a value rounded to zero. Refer to census definitions and notes for more information.
158

Table 30.1: Farms Using Computers and Internet for Farm Business, 2011
Farms Using Computer
for Farm Business
Farms Using Internet
for Farm Business
Farms With Access to
High-speed Internet
South Saskatchewan 6,838 6,403 5,451
Bighorn No. 8 26 22 13
Calgary 29 28 24
Cardston County 321 302 249
Cypress County 512 483 402
Foothills No. 31 822 759 619
Forty Mile County No. 8 381 361 313
Lethbridge County 651 609 531
Newell County No. 4 483 453 413
Pincher Creek No. 9 299 279 231
Ranchland No. 66 42 40 27
Rocky View County 865 812 712
Taber 471 439 386
Vulcan County 436 407 347
Warner County No. 5 357 326 275
Wheatland County 584 555 478
Willow Creek No. 26 559 528 431
Source: Statistics Canada, 2011 Census of Agriculture. Prepared by Alberta Agriculture and Rural Development, Economics and Competitiveness Division, Statistics and Data Development Branch.
0 - True zero or a value rounded to zero. Refer to census definitions and notes for more information.
159
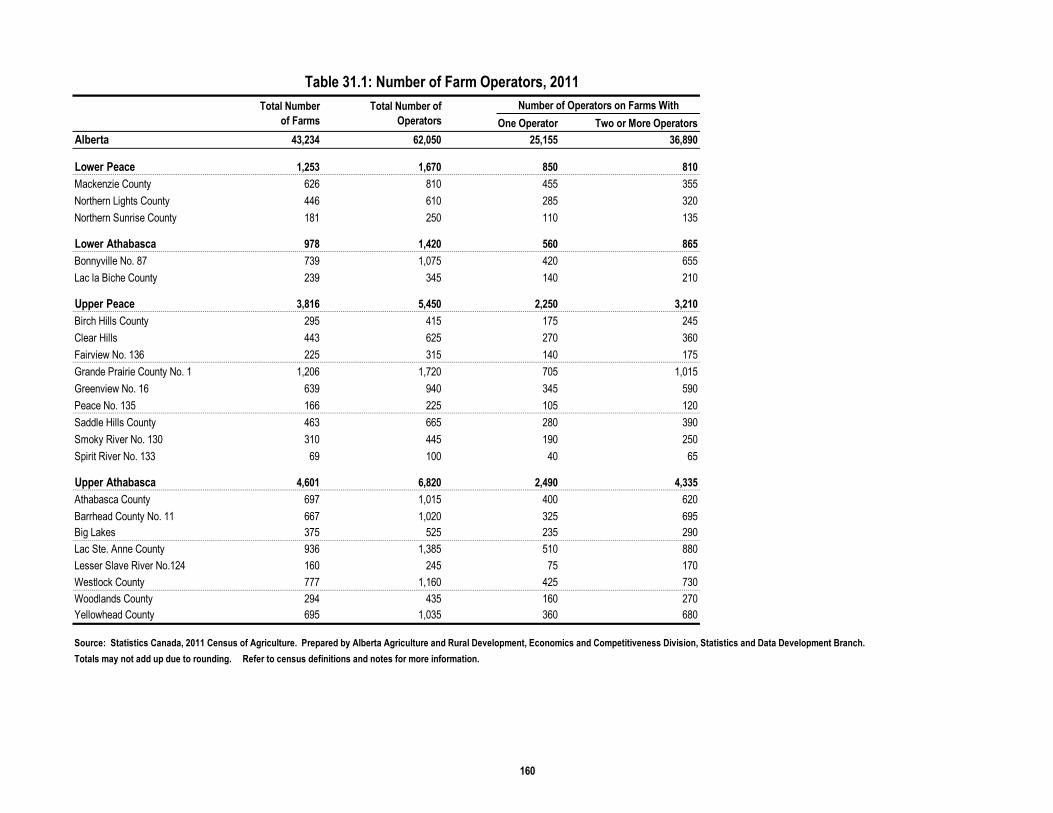
Table 31.1: Number of Farm Operators, 2011
One Operator Two or More Operators
Alberta 43,234 62,050 25,155 36,890
Lower Peace 1,253 1,670 850 810
Mackenzie County 626 810 455 355
Northern Lights County 446 610 285 320
Northern Sunrise County 181 250 110 135
Lower Athabasca 978 1,420 560 865
Bonnyville No. 87 739 1,075 420 655
Lac la Biche County 239 345 140 210
Upper Peace 3,816 5,450 2,250 3,210
Birch Hills County 295 415 175 245
Clear Hills 443 625 270 360
Fairview No. 136 225 315 140 175
Grande Prairie County No. 1 1,206 1,720 705 1,015
Greenview No. 16 639 940 345 590
Peace No. 135 166 225 105 120
Saddle Hills County 463 665 280 390
Smoky River No. 130 310 445 190 250
Spirit River No. 133 69 100 40 65
Upper Athabasca 4,601 6,820 2,490 4,335
Athabasca County 697 1,015 400 620
Barrhead County No. 11 667 1,020 325 695
Big Lakes 375 525 235 290
Lac Ste. Anne County 936 1,385 510 880
Lesser Slave River No.124 160 245 75 170
Westlock County 777 1,160 425 730
Woodlands County 294 435 160 270
Yellowhead County 695 1,035 360 680
Source: Statistics Canada, 2011 Census of Agriculture. Prepared by Alberta Agriculture and Rural Development, Economics and Competitiveness Division, Statistics and Data Development Branch.
Totals may not add up due to rounding. Refer to census definitions and notes for more information.
Total Number
of Farms
Total Number of
Operators
Number of Operators on Farms With
160

Table 31.1: Number of Farm Operators, 2011
One Operator Two or More Operators
North Saskatchewan 14,026 20,065 8,260 11,785
Beaver County 677 980 395 580
Brazeau County 487 745 235 510
Camrose County 999 1,445 580 860
Clearwater County 1,096 1,655 565 1,090
Edmonton 73 95 55 40
Flagstaff County 650 900 415 485
Lamont County 753 1,010 505 500
Leduc County 1,255 1,850 700 1,150
Minburn County No. 27 604 835 390 445
Parkland County 782 1,145 430 705
Provost No. 52 425 580 275 310
Smoky Lake County 454 620 295 325
St. Paul County No. 19 788 1,085 500 585
Strathcona County 658 990 345 640
Sturgeon County 823 1,190 460 735
Thorhild County No. 7 462 660 280 380
Two Hills County No. 21 554 730 385 340
Vermilion River County 1,029 1,455 620 830
Wainwright No. 61 501 690 310 390
Wetaskiwin County No. 10 956 1,405 520 885
Red Deer 8,645 12,540 4,900 7,620
Kneehill County 686 980 395 590
Lacombe County 1,045 1,520 585 935
Mountain View County 1,636 2,400 885 1,510
Paintearth County No. 18 420 585 260 320
Ponoka County 1,106 1,610 630 985
Red Deer County 1,531 2,270 830 1,430
Special Area No. 2 473 685 260 430
Special Area No. 3 464 620 315 305
Special Area No. 4 279 395 175 215
Starland County 300 450 165 280
Stettler County No. 6 705 1,025 400 620
Source: Statistics Canada, 2011 Census of Agriculture. Prepared by Alberta Agriculture and Rural Development, Economics and Competitiveness Division, Statistics and Data Development Branch.
Totals may not add up due to rounding. Refer to census definitions and notes for more information.
Total Number
of Farms
Total Number of
Operators
Number of Operators on Farms With
161

Table 31.1: Number of Farm Operators, 2011
One Operator Two or More Operators
South Saskatchewan 9,915 14,160 5,835 8,315
Bighorn No. 8 44 55 35 30
Calgary 55 70 35 30
Cardston County 497 715 295 425
Cypress County 827 1,175 485 690
Foothills No. 31 1,224 1,765 700 1,060
Forty Mile County No. 8 524 730 335 405
Lethbridge County 933 1,315 565 745
Newell County No. 4 717 1,065 375 685
Pincher Creek No. 9 448 650 255 385
Ranchland No. 66 78 100 50 55
Rocky View County 1,271 1,850 720 1,130
Taber 652 900 415 485
Vulcan County 603 835 385 455
Warner County No. 5 488 680 300 375
Wheatland County 782 1,120 460 655
Willow Creek No. 26 772 1,135 425 705
Source: Statistics Canada, 2011 Census of Agriculture. Prepared by Alberta Agriculture and Rural Development, Economics and Competitiveness Division, Statistics and Data Development Branch.
Totals may not add up due to rounding. Refer to census definitions and notes for more information.
Total Number
of Farms
Total Number of
Operators
Number of Operators on Farms With
162

Table 32.1: Farm Operators Classified by Sex, 2011
Total Number
of Operators Total Male Total Female Male Female Male Female
Alberta 62,050 44,075 17,975 23,010 2,145 21,065 15,830
Lower Peace 1,670 1,290 395 825 40 455 350
Mackenzie County 810 640 175 440 20 200 150
Northern Lights County 610 455 160 280 10 170 150
Northern Sunrise County 250 195 60 105 10 85 50
Lower Athabasca 1,420 985 440 505 60 485 385
Bonnyville No. 87 1,075 745 335 375 50 370 290
Lac la Biche County 345 240 105 130 10 115 95
Upper Peace 5,450 3,860 1,585 2,085 170 1,765 1,440
Birch Hills County 415 305 110 170 10 140 100
Clear Hills 625 455 170 250 20 200 160
Fairview No. 136 315 225 90 125 10 95 75
Grande Prairie County No. 1 1,720 1,200 520 650 60 555 465
Greenview No. 16 940 635 310 320 35 315 280
Peace No. 135 225 160 65 95 5 60 60
Saddle Hills County 665 470 195 255 20 210 175
Smoky River No. 130 445 340 100 185 10 150 95
Spirit River No. 133 100 70 25 35 0 40 30
Upper Athabasca 6,820 4,630 2,185 2,235 260 2,395 1,915
Athabasca County 1,015 710 300 360 35 355 265
Barrhead County No. 11 1,020 680 335 295 25 385 310
Big Lakes 525 375 150 220 15 160 135
Lac Ste. Anne County 1,385 920 460 445 60 480 395
Lesser Slave River No.124 245 165 80 70 10 90 70
Westlock County 1,160 800 360 390 40 410 315
Woodlands County 435 285 150 135 30 150 120
Yellowhead County 1,035 695 350 320 45 365 305
Source: Statistics Canada, 2011 Census of Agriculture. Prepared by Alberta Agriculture and Rural Development, Economics and Competitiveness Division, Statistics and Data Development Branch.
0 - True zero or a value rounded to zero. Totals may not add up due to rounding. Refer to census definitions and notes for more information.
Operators on All Farms Operators on
Farms with One Operator
Operators on
Farms with Two or More Operators
163

Table 32.1: Farm Operators Classified by Sex, 2011
Total Number
of Operators Total Male Total Female Male Female Male Female
North Saskatchewan 20,065 14,320 5,740 7,605 680 6,700 5,105
Beaver County 980 725 260 375 25 345 240
Brazeau County 745 485 265 205 25 270 240
Camrose County 1,445 1,030 410 540 45 490 370
Clearwater County 1,655 1,085 575 500 75 590 500
Edmonton 95 70 15 45 10 25 15
Flagstaff County 900 680 220 400 15 280 200
Lamont County 1,010 760 250 485 20 285 220
Leduc County 1,850 1,295 560 645 50 650 505
Minburn County No. 27 835 625 200 370 20 260 180
Parkland County 1,145 785 355 375 60 405 300
Provost No. 52 580 445 130 255 20 190 115
Smoky Lake County 620 450 165 270 20 180 150
St. Paul County No. 19 1,085 795 295 465 45 330 260
Strathcona County 990 665 330 305 45 355 290
Sturgeon County 1,190 850 350 415 45 430 300
Thorhild County No. 7 660 475 175 260 25 220 160
Two Hills County No. 21 730 545 185 350 30 185 155
Vermilion River County 1,455 1,065 395 575 35 480 355
Wainwright No. 61 690 515 180 290 20 225 165
Wetaskiwin County No. 10 1,405 975 425 480 50 505 385
Red Deer 12,540 8,780 3,750 4,455 460 4,345 3,300
Kneehill County 980 700 280 365 25 335 255
Lacombe County 1,520 1,055 465 535 55 530 405
Mountain View County 2,400 1,625 765 790 100 840 670
Paintearth County No. 18 585 430 155 240 15 190 140
Ponoka County 1,610 1,115 495 565 70 560 425
Red Deer County 2,270 1,555 710 750 90 810 630
Special Area No. 2 685 490 205 240 20 250 185
Special Area No. 3 620 475 145 285 30 185 125
Special Area No. 4 395 290 105 160 10 130 85
Starland County 450 325 120 155 15 170 105
Stettler County No. 6 1,025 720 305 370 30 345 275
Source: Statistics Canada, 2011 Census of Agriculture. Prepared by Alberta Agriculture and Rural Development, Economics and Competitiveness Division, Statistics and Data Development Branch.
0 - True zero or a value rounded to zero. Totals may not add up due to rounding. Refer to census definitions and notes for more information.
Farms with One Operator Farms with Two or More Operators
Operators on All Farms Operators on Operators on
164

Table 32.1: Farm Operators Classified by Sex, 2011
Total Number
of Operators Total Male Total Female Male Female Male Female
South Saskatchewan 14,160 10,260 3,905 5,290 540 4,960 3,370
Bighorn No. 8 55 50 10 25 5 15 15
Calgary 70 55 20 35 5 20 15
Cardston County 715 540 175 275 20 260 155
Cypress County 1,175 855 320 450 35 400 290
Foothills No. 31 1,765 1,175 585 595 100 585 480
Forty Mile County No. 8 730 580 150 315 15 265 140
Lethbridge County 1,315 1,000 305 535 30 470 280
Newell County No. 4 1,065 755 310 355 20 400 285
Pincher Creek No. 9 650 460 185 240 25 225 165
Ranchland No. 66 100 75 30 50 0 25 20
Rocky View County 1,850 1,225 630 590 125 630 505
Taber 900 710 190 390 30 325 170
Vulcan County 835 645 190 355 25 285 165
Warner County No. 5 680 535 150 280 20 245 125
Wheatland County 1,120 805 315 420 45 390 265
Willow Creek No. 26 1,135 795 340 380 40 420 295
Source: Statistics Canada, 2011 Census of Agriculture. Prepared by Alberta Agriculture and Rural Development, Economics and Competitiveness Division, Statistics and Data Development Branch.
0 - True zero or a value rounded to zero. Totals may not add up due to rounding. Refer to census definitions and notes for more information.
Farms with One Operator Farms with Two or More Operators
Operators on All Farms Operators on Operators on
165

Table 33.1: Farm Operators Classified by Age Groups, 2011
Under 35
Years
35-54
Years
55 Years
and Over
Average Age
(years)
Under 35
Years
35-54
Years
55 Years
and Over
Average Age
(years)
Under 35
Years
35-54
Years
55 Years
and Over
Average Age
(years)
Alberta 62,050 4,550 26,720 30,785 54.5 1,370 10,125 13,665 56.2 3,180 16,595 17,120 53.3
Lower Peace 1,670 250 810 615 … 125 410 335 … 120 390 290 …
Mackenzie County 810 195 440 170 44.8 95 240 120 46.5 100 195 60 42.6
Northern Lights County 610 40 265 310 54.7 25 120 155 55.3 10 145 160 54.2
Northern Sunrise County 250 15 105 135 54.4 5 50 60 54.9 10 50 70 54.0
Lower Athabasca 1,420 95 615 720 20 220 315 … 70 385 405 …
Bonnyville No. 87 1,075 75 475 535 54.9 20 165 230 57.3 55 300 300 53.4
Lac la Biche County 345 20 140 185 55.7 0 55 85 57.4 15 85 105 54.5
Upper Peace 5,450 460 2,385 2,625 … 140 905 1,185 … 305 1,485 1,430 …
Birch Hills County 415 30 215 180 52.1 10 80 85 54.8 20 135 85 50.2
Clear Hills 625 70 260 295 53.2 25 105 135 55.3 45 150 165 51.7
Fairview No. 136 315 20 140 160 54.5 5 55 75 55.8 15 85 85 53.4
Grande Prairie County No. 1 1,720 140 740 835 53.9 50 270 390 55.6 90 465 450 52.7
Greenview No. 16 940 70 390 485 54.5 15 120 215 57.3 55 270 275 52.9
Peace No. 135 225 10 95 125 56.3 0 45 50 55.8 5 45 70 56.7
Saddle Hills County 665 70 265 330 53.9 20 115 140 55.8 45 160 180 52.5
Smoky River No. 130 445 40 240 165 51.3 10 95 80 53.2 20 150 85 49.9
Spirit River No. 133 100 10 40 50 54.2 5 20 15 54.3 10 25 35 54.1
Upper Athabasca 6,820 450 2,895 3,465 … 110 975 1,425 … 330 1,935 2,060 …
Athabasca County 1,015 55 435 520 55.6 10 170 210 57.0 40 265 310 54.7
Barrhead County No. 11 1,020 90 445 490 53.2 15 125 190 56.0 70 325 295 51.8
Big Lakes 525 30 225 265 54.9 10 95 130 57.0 20 130 135 53.1
Lac Ste. Anne County 1,385 80 585 725 55.1 25 190 300 57.2 55 390 435 53.9
Lesser Slave River No.124 245 10 95 140 57.6 5 30 45 57.9 5 65 100 57.5
Westlock County 1,160 105 480 570 54.5 25 170 235 56.7 75 320 335 53.2
Woodlands County 435 25 185 215 54.1 10 55 95 56.0 20 130 125 53.0
Yellowhead County 1,035 55 445 540 55.6 10 140 220 58.8 45 310 325 53.9
Source: Statistics Canada, 2011 Census of Agriculture. Prepared by Alberta Agriculture and Rural Development, Economics and Competitiveness Division, Statistics and Data Development Branch.
… Not available. 0 - True zero or a value rounded to zero. Totals may not add up due to rounding. Refer to census definitions and notes for more information.
Operators on
Farms with One Operator
Operators on
Farms with Two or More OperatorsTotal Number
of Operators
Operators on All Farms
166

Table 33.1: Farm Operators Classified by Age Groups, 2011
Under 35
Years
35-54
Years
55 Years
and Over
Average Age
(years)
Under 35
Years
35-54
Years
55 Years
and Over
Average Age
(years)
Under 35
Years
35-54
Years
55 Years
and Over
Average Age
(years)
North Saskatchewan 20,065 1,330 8,445 10,285 … 400 3,205 4,660 … 940 5,255 5,620 …
Beaver County 980 75 430 475 54.5 20 175 215 56.5 60 260 265 53.1
Brazeau County 745 20 315 405 56.5 0 80 145 58.9 20 235 260 55.3
Camrose County 1,445 120 650 680 53.7 35 250 295 55.1 80 405 390 52.8
Clearwater County 1,655 90 680 890 55.9 15 205 345 58.2 75 470 545 54.6
Edmonton 95 10 30 50 58.0 5 20 35 60.3 5 15 15 54.8
Flagstaff County 900 70 355 470 54.6 30 165 220 54.6 40 185 250 54.7
Lamont County 1,010 60 375 575 57.1 25 175 305 58.1 30 200 275 56.0
Leduc County 1,850 105 770 975 55.5 25 265 410 57.5 80 510 560 54.3
Minburn County No. 27 835 65 360 400 54.4 20 160 200 56.1 45 195 200 52.8
Parkland County 1,145 45 495 600 56.0 15 150 270 58.6 35 345 330 54.5
Provost No. 52 580 45 265 265 54.1 20 130 125 55.0 30 140 140 53.3
Smoky Lake County 620 40 275 305 54.5 10 130 155 56.5 25 155 140 52.8
St. Paul County No. 19 1,085 80 500 510 54.2 30 190 275 56.6 50 300 235 52.1
Strathcona County 990 45 385 560 56.3 10 130 215 59.3 45 265 345 54.7
Sturgeon County 1,190 60 500 640 55.9 10 160 285 58.0 45 335 360 54.6
Thorhild County No. 7 660 40 275 345 55.2 10 115 150 57.2 30 155 195 53.6
Two Hills County No. 21 730 70 305 360 53.9 15 150 215 57.2 55 150 135 50.2
Vermilion River County 1,455 130 595 725 53.7 50 240 330 55.4 90 355 390 52.5
Wainwright No. 61 690 65 300 330 53.3 25 125 160 55.1 35 185 170 51.9
Wetaskiwin County No. 10 1,405 95 585 725 55.2 30 190 310 57.5 65 395 420 53.8
Red Deer 12,540 995 5,500 6,030 … 295 2,010 2,675 … 715 3,530 3,395 …
Kneehill County 980 80 460 440 53.2 25 180 195 54.1 50 285 255 52.6
Lacombe County 1,520 130 660 730 54.0 35 220 345 57.1 95 440 395 52.1
Mountain View County 2,400 155 1,040 1,205 54.8 50 355 490 56.5 105 695 715 53.9
Paintearth County No. 18 585 50 280 255 52.7 15 115 135 54.6 35 165 125 51.2
Ponoka County 1,610 120 710 780 54.2 30 240 360 56.7 90 470 420 52.6
Red Deer County 2,270 135 1,025 1,110 54.7 35 340 460 57.0 105 680 645 53.4
Special Area No. 2 685 70 300 315 52.8 20 110 130 54.7 50 195 190 51.6
Special Area No. 3 620 70 270 285 52.9 25 135 160 54.2 45 135 130 51.6
Special Area No. 4 395 40 155 190 53.4 15 80 90 54.6 30 80 105 52.5
Starland County 450 50 165 230 53.4 15 70 95 55.5 40 105 135 52.2
Stettler County No. 6 1,025 95 435 490 53.7 30 165 215 55.8 70 280 280 52.4
Source: Statistics Canada, 2011 Census of Agriculture. Prepared by Alberta Agriculture and Rural Development, Economics and Competitiveness Division, Statistics and Data Development Branch.
… Not available. 0 - True zero or a value rounded to zero. Totals may not add up due to rounding. Refer to census definitions and notes for more information.
Operators on
Farms with One Operator
Operators on
Farms with Two or More OperatorsTotal Number
of Operators
Operators on All Farms
167

Table 33.1: Farm Operators Classified by Age Groups, 2011
Under 35
Years
35-54
Years
55 Years
and Over
Average Age
(years)
Under 35
Years
35-54
Years
55 Years
and Over
Average Age
(years)
Under 35
Years
35-54
Years
55 Years
and Over
Average Age
(years)
South Saskatchewan 14,160 1,045 6,095 7,065 … 340 2,415 3,130 … 710 3,670 3,940 …
Bighorn No. 8 55 0 25 35 58.0 0 5 25 62.7 5 20 10 53.2
Calgary 70 10 30 45 57.6 5 20 25 56.7 0 10 25 58.7
Cardston County 715 40 275 405 56.4 20 95 180 57.4 15 185 220 55.8
Cypress County 1,175 115 505 560 53.4 40 200 250 55.3 75 305 310 52.2
Foothills No. 31 1,765 90 640 1,035 57.2 20 225 450 59.0 70 405 585 56.0
Forty Mile County No. 8 730 75 350 310 52.3 25 170 135 52.9 45 185 175 51.8
Lethbridge County 1,315 125 650 535 52.4 50 265 250 54.1 80 375 290 51.1
Newell County No. 4 1,065 80 525 465 53.2 25 190 165 53.6 55 335 300 53.0
Pincher Creek No. 9 650 25 245 380 56.9 5 95 160 58.0 20 155 220 56.2
Ranchland No. 66 100 10 50 45 56.6 5 40 20 55.6 5 15 30 57.6
Rocky View County 1,850 90 730 1,025 56.5 20 265 440 58.5 75 470 585 55.2
Taber 900 85 445 375 52.7 30 215 170 53.5 50 225 205 52.1
Vulcan County 835 80 360 405 53.5 25 160 195 55.4 55 195 205 52.0
Warner County No. 5 680 65 285 335 53.7 20 115 170 56.1 45 160 165 51.8
Wheatland County 1,120 80 480 560 54.5 30 185 255 56.0 55 295 305 53.5
Willow Creek No. 26 1,135 75 500 550 54.3 20 170 240 56.7 60 335 310 52.9
Source: Statistics Canada, 2011 Census of Agriculture. Prepared by Alberta Agriculture and Rural Development, Economics and Competitiveness Division, Statistics and Data Development Branch.
… Not available. 0 - True zero or a value rounded to zero. Totals may not add up due to rounding. Refer to census definitions and notes for more information.
Operators on
Farms with One Operator
Operators on
Farms with Two or More OperatorsTotal Number
of Operators
Operators on All Farms
168

Table 34.1: Farm Operators Classified by On Farm and Non-Farm Work, 2011
Less than 20
Hours
20-29
Hours
30-40
Hours
20-40
Hours
More than 40
Hours
No Paid Non-
Farm Work
Less than 20
Hours
20-29
Hours
30-40
Hours
20-40
Hours
More than 40
Hours
Alberta 62,050 19,660 10,195 8,710 18,905 23,480 29,805 5,860 4,680 8,840 13,520 12,865
Lower Peace 1,670 535 270 255 525 605 605 195 155 260 415 430
Mackenzie County 810 260 140 130 270 285 270 105 85 115 200 230
Northern Lights County 610 195 100 75 175 235 230 70 55 105 160 140
Northern Sunrise County 250 80 30 50 80 85 105 20 15 40 55 60
Lower Athabasca 1,420 485 250 230 480 455 600 145 95 230 325 375
Bonnyville No. 87 1,075 375 185 180 365 340 445 95 70 175 245 295
Lac la Biche County 345 110 65 50 115 115 155 50 25 55 80 80
Upper Peace 5,450 1,875 935 775 1,710 1,870 2,325 565 450 805 1,255 1,325
Birch Hills County 415 105 50 80 130 180 205 50 40 55 95 85
Clear Hills 625 195 110 85 195 230 250 60 60 95 155 155
Fairview No. 136 315 100 45 40 85 130 140 25 25 50 75 75
Grande Prairie County No. 1 1,720 675 330 220 550 495 650 185 145 280 425 460
Greenview No. 16 940 355 165 135 300 280 380 95 70 140 210 245
Peace No. 135 225 65 55 25 80 80 105 25 20 30 50 50
Saddle Hills County 665 215 110 105 215 240 295 75 50 100 150 155
Smoky River No. 130 445 120 60 65 125 205 255 40 35 45 80 65
Spirit River No. 133 100 45 10 20 30 30 45 10 5 10 15 35
Upper Athabasca 6,820 2,235 1,205 1,000 2,205 2,375 3,085 630 520 1,100 1,620 1,480
Athabasca County 1,015 345 175 155 330 335 420 95 90 190 280 220
Barrhead County No. 11 1,020 315 150 165 315 390 515 105 70 135 205 190
Big Lakes 525 185 85 90 175 170 235 50 50 95 145 100
Lac Ste. Anne County 1,385 450 240 185 425 505 600 115 100 235 335 335
Lesser Slave River No.124 245 75 40 40 80 85 115 30 25 30 55 45
Westlock County 1,160 325 200 180 380 450 595 95 75 185 260 215
Woodlands County 435 165 105 50 155 115 170 40 25 85 110 100
Yellowhead County 1,035 375 210 135 345 325 435 100 85 145 230 275
Source: Statistics Canada, 2011 Census of Agriculture. Prepared by Alberta Agriculture and Rural Development, Economics and Competitiveness Division, Statistics and Data Development Branch.
(1) Average number of hours per week. 0 - True zero or a value rounded to zero. Totals may not add up due to rounding. Refer to census definitions and notes for more information.
Total
Number of
Operators
Paid Non-Farm Work (1)On Farm Work (1)
169

Table 34.1: Farm Operators Classified by On Farm and Non-Farm Work, 2011
Less than 20
Hours
20-29
Hours
30-40
Hours
20-40
Hours
More than 40
Hours
No Paid Non-
Farm Work
Less than 20
Hours
20-29
Hours
30-40
Hours
20-40
Hours
More than 40
Hours
North Saskatchewan 20,065 6,370 3,485 3,000 6,485 7,230 9,320 1,820 1,520 3,080 4,600 4,290
Beaver County 980 275 170 180 350 360 455 95 75 160 235 195
Brazeau County 745 280 160 110 270 200 320 70 70 120 190 185
Camrose County 1,445 460 245 225 470 510 665 145 105 240 345 285
Clearwater County 1,655 550 335 230 565 550 745 175 140 225 365 365
Edmonton 95 45 15 10 25 25 55 10 10 5 15 15
Flagstaff County 900 210 130 135 265 415 495 75 65 110 175 150
Lamont County 1,010 310 190 170 360 340 470 75 55 175 230 235
Leduc County 1,850 645 335 255 590 620 810 180 160 295 455 400
Minburn County No. 27 835 230 130 140 270 335 395 60 75 110 185 190
Parkland County 1,145 385 235 165 400 355 490 120 95 180 275 260
Provost No. 52 580 160 60 80 140 275 300 55 40 70 110 125
Smoky Lake County 620 165 120 90 210 250 285 55 55 95 150 130
St. Paul County No. 19 1,085 325 180 150 330 440 480 100 65 180 245 260
Strathcona County 990 460 180 145 325 205 420 90 75 185 260 215
Sturgeon County 1,190 470 200 150 350 385 520 110 105 195 300 265
Thorhild County No. 7 660 205 110 105 215 230 290 60 45 120 165 140
Two Hills County No. 21 730 235 115 95 210 290 340 55 60 110 170 150
Vermilion River County 1,455 360 210 235 445 645 760 115 85 205 290 295
Wainwright No. 61 690 170 105 105 210 310 345 55 30 90 120 160
Wetaskiwin County No. 10 1,405 430 260 225 485 490 680 120 110 210 320 270
Red Deer 12,540 3,740 1,965 1,715 3,680 5,145 6,260 1,250 990 1,635 2,625 2,425
Kneehill County 980 285 125 150 275 415 520 100 85 105 190 170
Lacombe County 1,520 490 245 200 445 590 795 140 120 205 325 265
Mountain View County 2,400 855 415 320 735 820 1,100 260 205 325 530 505
Paintearth County No. 18 585 155 85 85 170 260 245 65 55 80 135 140
Ponoka County 1,610 460 270 240 510 645 835 155 120 210 330 295
Red Deer County 2,270 760 375 300 675 830 1,085 225 180 320 500 465
Special Area No. 2 685 135 100 95 195 365 380 60 45 85 130 130
Special Area No. 3 620 140 85 80 165 320 325 55 50 75 125 125
Special Area No. 4 395 90 35 40 75 225 220 15 30 45 75 75
Starland County 450 110 60 60 120 225 255 55 25 55 80 55
Stettler County No. 6 1,025 260 170 145 315 450 500 120 75 130 205 200
Source: Statistics Canada, 2011 Census of Agriculture. Prepared by Alberta Agriculture and Rural Development, Economics and Competitiveness Division, Statistics and Data Development Branch.
(1) Average number of hours per week. 0 - True zero or a value rounded to zero. Totals may not add up due to rounding. Refer to census definitions and notes for more information.
Paid Non-Farm Work (1)Total
Number of
Operators
On Farm Work (1)
170

Table 34.1: Farm Operators Classified by On Farm and Non-Farm Work, 2011
Less than 20
Hours
20-29
Hours
30-40
Hours
20-40
Hours
More than 40
Hours
No Paid Non-
Farm Work
Less than 20
Hours
20-29
Hours
30-40
Hours
20-40
Hours
More than 40
Hours
South Saskatchewan 14,160 4,440 2,150 1,780 3,930 5,825 7,615 1,235 980 1,795 2,775 2,525
Bighorn No. 8 55 20 15 0 15 25 35 10 10 5 15 10
Calgary 70 35 10 15 25 20 40 0 5 10 15 20
Cardston County 715 230 105 90 195 295 365 60 45 125 170 120
Cypress County 1,175 335 170 160 330 515 645 85 90 145 235 220
Foothills No. 31 1,765 775 295 215 510 480 800 165 165 245 410 380
Forty Mile County No. 8 730 155 70 90 160 420 475 65 50 50 100 90
Lethbridge County 1,315 425 160 150 310 580 730 125 75 155 230 225
Newell County No. 4 1,065 235 155 160 315 510 605 100 60 125 185 185
Pincher Creek No. 9 650 225 120 80 200 235 315 45 45 110 155 115
Ranchland No. 66 100 30 10 5 15 50 60 5 5 15 20 10
Rocky View County 1,850 735 340 230 570 545 885 160 135 265 400 405
Taber 900 185 115 120 235 490 570 65 60 85 145 135
Vulcan County 835 210 120 95 215 405 535 65 40 70 110 120
Warner County No. 5 680 170 105 90 195 320 395 55 40 85 125 100
Wheatland County 1,120 340 170 130 300 480 580 115 75 155 230 195
Willow Creek No. 26 1,135 335 190 150 340 455 580 115 80 150 230 195
Source: Statistics Canada, 2011 Census of Agriculture. Prepared by Alberta Agriculture and Rural Development, Economics and Competitiveness Division, Statistics and Data Development Branch.
(1) Average number of hours per week. 0 - True zero or a value rounded to zero. Totals may not add up due to rounding. Refer to census definitions and notes for more information.
Total
Number of
Operators
Paid Non-Farm Work (1)On Farm Work (1)
171

Table 35.1: Farm Operators Living On and Off the Farm
On the Farm (1) Off the Farm
Alberta 55,515 6,535
Lower Peace 1,520 140
Mackenzie County 750 50
Northern Lights County 550 60
Northern Sunrise County 220 30
Lower Athabasca 1,310 110
Bonnyville No. 87 990 85
Lac la Biche County 320 25
Upper Peace 4,935 535
Birch Hills County 375 40
Clear Hills 580 50
Fairview No. 136 280 40
Grande Prairie County No. 1 1,550 175
Greenview No. 16 870 75
Peace No. 135 195 30
Saddle Hills County 610 55
Smoky River No. 130 390 50
Spirit River No. 133 85 20
Upper Athabasca 6,320 485
Athabasca County 935 75
Barrhead County No. 11 950 70
Big Lakes 465 55
Lac Ste. Anne County 1,285 100
Lesser Slave River No.124 235 10
Westlock County 1,080 80
Woodlands County 395 35
Yellowhead County 975 60
Source: Statistics Canada, 2011 Census of Agriculture. Prepared by Alberta Agriculture and Rural Development, Economics and Competitiveness Division, Statistics and Data Development Branch.
(1) Lived on the farms at any time during the 12 month prior to the census. Totals may not add up due to rounding. Refer to census definitions and notes for more information.
Number of Operators Living
172

Table 35.1: Farm Operators Living On and Off the Farm
On the Farm (1) Off the Farm
North Saskatchewan 17,955 2,090
Beaver County 885 95
Brazeau County 700 50
Camrose County 1,285 165
Clearwater County 1,545 105
Edmonton 55 35
Flagstaff County 805 90
Lamont County 825 175
Leduc County 1,690 155
Minburn County No. 27 720 115
Parkland County 1,030 115
Provost No. 52 500 70
Smoky Lake County 550 75
St. Paul County No. 19 995 100
Strathcona County 875 115
Sturgeon County 1,050 145
Thorhild County No. 7 595 60
Two Hills County No. 21 615 115
Vermilion River County 1,310 145
Wainwright No. 61 610 80
Wetaskiwin County No. 10 1,315 85
Red Deer 11,320 1,200
Kneehill County 855 125
Lacombe County 1,410 105
Mountain View County 2,190 210
Paintearth County No. 18 515 65
Ponoka County 1,475 135
Red Deer County 2,090 180
Special Area No. 2 605 85
Special Area No. 3 485 135
Special Area No. 4 345 45
Starland County 400 45
Stettler County No. 6 950 70
Source: Statistics Canada, 2011 Census of Agriculture. Prepared by Alberta Agriculture and Rural Development, Economics and Competitiveness Division, Statistics and Data Development Branch.
(1) Lived on the farms at any time during the 12 month prior to the census. Totals may not add up due to rounding. Refer to census definitions and notes for more information.
Number of Operators Living
173

Table 35.1: Farm Operators Living On and Off the Farm
On the Farm (1) Off the Farm
South Saskatchewan 12,180 1,985
Bighorn No. 8 55 5
Calgary 45 30
Cardston County 630 85
Cypress County 945 230
Foothills No. 31 1,540 225
Forty Mile County No. 8 605 135
Lethbridge County 1,095 215
Newell County No. 4 945 115
Pincher Creek No. 9 580 65
Ranchland No. 66 70 30
Rocky View County 1,615 230
Taber 765 135
Vulcan County 705 135
Warner County No. 5 575 100
Wheatland County 980 140
Willow Creek No. 26 1,030 110
Source: Statistics Canada, 2011 Census of Agriculture. Prepared by Alberta Agriculture and Rural Development, Economics and Competitiveness Division, Statistics and Data Development Branch.
(1) Lived on the farms at any time during the 12 month prior to the census. Totals may not add up due to rounding. Refer to census definitions and notes for more information.
Number of Operators Living
174

APPENDIX 1


