164
CENSUS OF INDIA 2001 SERIES-11 BIHAR PAPER 2 OF 2001 PROVISIONAL POPULATION TOTALS Rural-urban Distribution of Population SUDHIR KUMAR RAKESH Director of Census Operations, Bihar ,

CENSUS OF INDIA 2001
SERIES-11
BIHAR
PAPER 2 OF 2001 PROVISIONAL POPULATION TOTALS
Rural-urban Distribution of Population
SUDHIR KUMAR RAKESH Director of Census Operations, Bihar ,

CONTENTS
PARTICULARS
Preface
Acknowledgement
Figures at a gl~nce
State Highlights
Map showing Administrative Division of State, 2001 Census ...
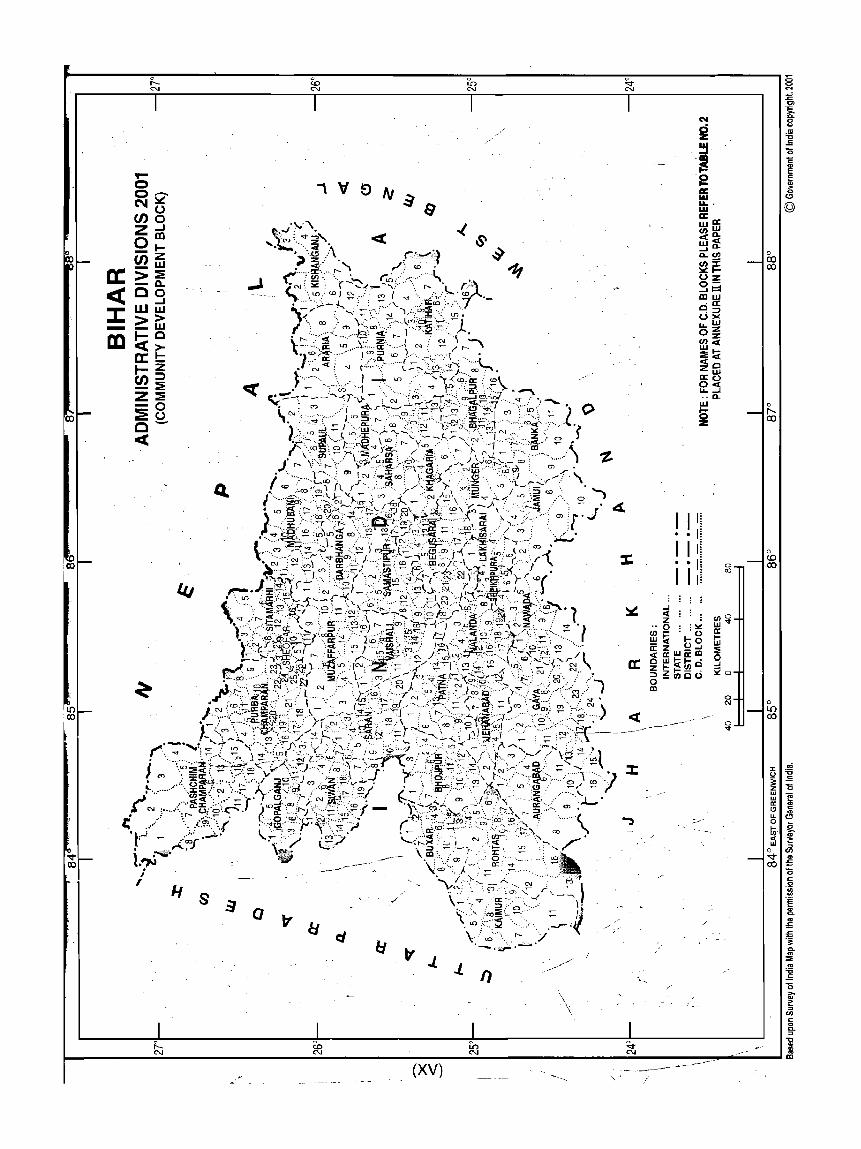
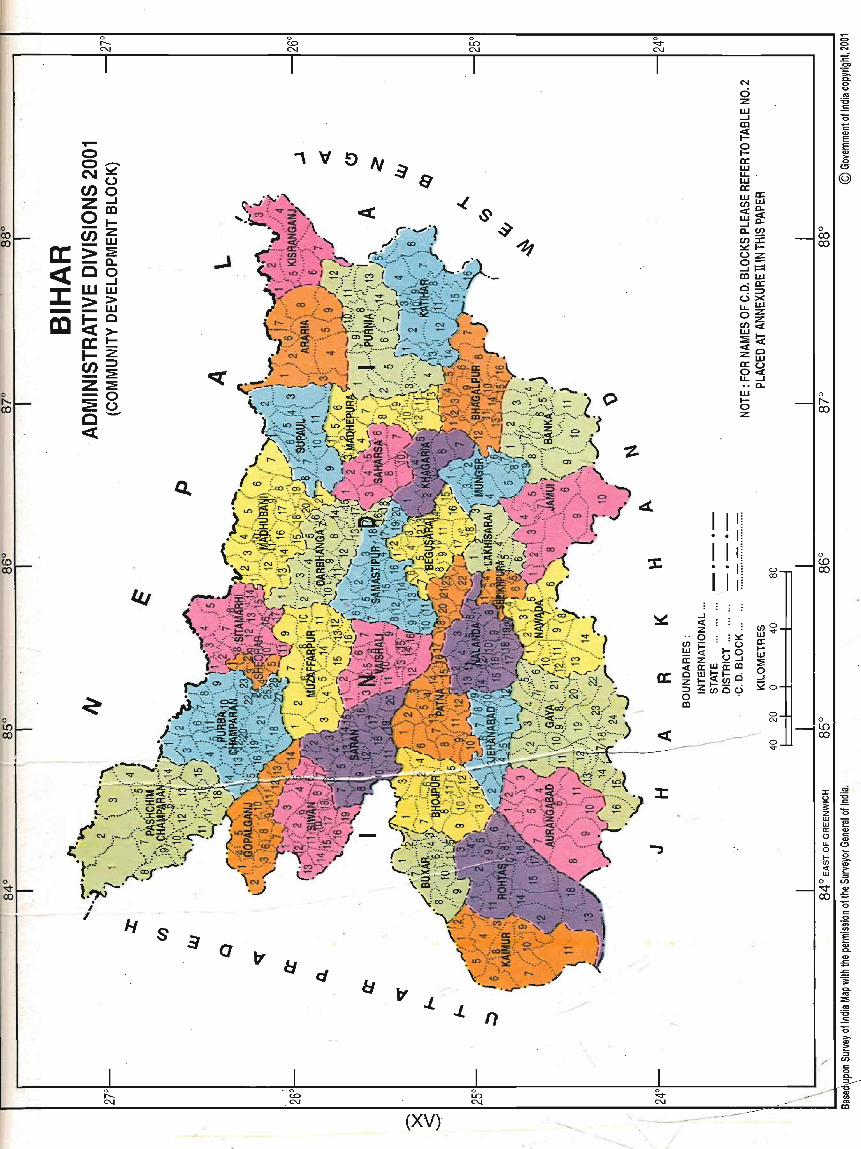
Map showing Administrative Division (C.D. Block) of State, 2001 Census
Introduction
ANALYSIS OF RESULT
Urbanisation-Rural and Urban Composition
Sex ratio in Districts and C.D. Blocks
Literacy rates by Sex and Rural-Urban break up in District and C.D. Blocks
City (having one million plus population) ...
TABLES
Table 1 - Population, child population in the age-group 0-6 and literates by residence and Sex - State, District, UAlCity/Town, 2001
Table 2 - Population, child population in the age-group ,0-6 and literates by residence and Sex - State, District, C.D. Block, 2001
Table 3 - Percentage decadal growth, percentage of child population in the age-group 0-6 by residence and percentage of urban population to total population - State and District, 2001
Table 4 - Sex ratio of population and Sex ratio of child population in the age-group 0-6' - State,' District, C.D. Block, 2001
Table .5 - Literacy rates by residence and Sex - State, District, C.D. Block, 2001
Table 6 - Population, percentage decadal growth 1991-2001, Sex ratio, literacy by Sex - UAs, cities and towns by size class in the State, 2001
Appendix 1 to Table 6 -
Population, child population in the age-group 0-6 and literates by Sex -independent Cities and Towns arranged in alphabetical order, 2001
PAGE NO.
v
vii
ix
xi
xiii
xv
3
7
19
23
33
39
49
75
79
97
113
117
PARTICULARS
Appendix 2 to Table 6 -
List of towns of i 991 declassified in 2001 and towns of 1991 merged with other towns in 2001
Table 7 - Growth of urban population, 1981-2001
STATEMENTS
Statement - Rural-Urban distribution of population - India and States/ Union Territories, 2001
Statement 2 - Number of statutory and Census towns. 1991 and 2001
Statement 3 - Ranking of districts by percentage of urban population, ... 1991 and 2001
Statement 4 - Trends in urbanization, 1991-2001 ...
MAPS
Decadal growth rate of rural population 1991-2001
Percentage decadal ~rowth rate of urban populatin 1991-2001
Percentage of urban population 2001
Growth rate of UAs/Cities 1991-2001 (Class I)
DIAGRAMS
Distribution of rural-urban population 1901-2001
Percentage decadal growth in urban population, 1901-1911 to 1991-2001
Distribution of population of UAs/Cities!fowns in different size classes 1901-2001
Distribution of rural-urban population 2001 (Districts)
PAGE NO.
121
122
125
129
130
131
135
137
139
141
145
146
147
148

PREFACE
The second phase of Census of India, 2001 viz., the population enumeration work was undertaken between 9
th and 28
th February, 2001 (both days inclusive) with
a revisional round from 15t
to 5th
March, 2001. The reference date at which the snapshot of the population is taken, was 00.00 hours of 1
5t March, 2001. Maintaining the past
tradition of releasing the population data on a provisional basis within a short time after the completion of population enumeration, the provisional population figures were compiled at the Census Directorate based on various abstracts built up at different administrative levels such as the Enumeration block, Rural/Urban Charge (Community Development BlockfTown) and the District. The entire exercise of aggregation of provisional data up to the state level was completed within a very short span of time. On the basis of these abstracts, the proVisional population figures of this state were released on 2ih March, 2001 in the form of paper-I containing provisional figures with regard to Total population, Population in the age-group 0-6 and Literate population. The provisional population figures presented in paper-1 were for State and
District levels only.
The present paper-2 of 2001,' which is second in the series of publications on provisional population totals, mainly includes provisional data on rural-urban distribution of population and its characteristics, population totals for urban agglomerations and their constituents and totals for individual cities and towns. The provisional population of outgrowths have also been shown separately as constituents
of urban agglomerations.
Since the release of final population figures may take some more time, it is hoped that the provisional data being presented in this pap,er would be useful for the planners, govemment and non-govemm~nt organisations and researchers etc.
I would like to express my deep sense of gratitude to the Registrar General and Census Commissioner, India and his team of dedicated officers for the able guidance and encouragement provided by them in giving final shape to this paper.
I am personally grateful to officers and staff of my own directorate for all the strain they took i,n preparing this paper in the shortest possible time. It is only because of their untiring effort and dedication that it has been possible to bring out this paper within such a short span of time.
Patna The 21
5t July, 2001
Sudhir Kumar Rakesh Director of Census Operations, Bihar


ACKNOWLEDGEMENT
List of Officers/Officials involved in preparation of Provisiona~ Population Totals
SI.No. Name
1.
2.
3.
4.
5.
6.
7.
8.
9.
10.
11.
12.
13.
14.
15.
16.
17.
18.
19.
20.
21.
22.
23.
24.
25.
26.
27.
28.
29.
30.
Sri Phool Singh
Sri M.M.A. Beg
Sri S.K. Sinha
Sri K.K. Verma
Sri M. Guria
Sri B.K. Shrivastava
Sri P.M. Prasad
Sri T.N. Rukhaiyar
Sri K.N.P. Shrivastava
Sri Ganesh Pd. Singh
Sri S.K. Singh
Sri M.K.P. Sharma
Sri Shyam Pd. Singh
Sri Shailendra kr. Sinha
Smt. Bina Kujur
Smt. Usha Kumari
Sri Kishori Sharan
Sri Birendra Pd. Singh
Sri Rajiv Kr. Sinha
Sri Deepak Kr. Mishra
Sri G.K. Labh
Sri Ashok Kr. Sharma
Sri Amar Chandra Sinha
Smt. Rojalia Kujur
Sri Sheo Balak Prasad
Sri Ashish Kr. Singh
Smt. Puja Shrivastava
Sri Anup Kr. Verma
Sri S.S.· Srivastava
Sri N .K. Srivastava
C. T.U. Section
Computer Cell
vii
Designation
Joint Director
Deputy Director
Deputy Director
Assistant Director
Research Officer (Map)
Printing Officer
Investigator
Investigator
Investigator
Investigator
Investigator
Statistical Investigator Gr. III
Statistical Investigator Gr. III
Statistical Investigator Gr. III
Statistical Investigator Gr. III
Statistical Investigator Gr. 111
Computor
Computor
Computor
Computor
Computor
Computor
Computor
Computor
Computor
Computor
Assistant Compiler
D.E.O. "8"
D.E.O. "'B"
D.E.O. "8"

SI,No. Name
31. Sri Suresh Ravidas
32. Sri Md. Ashraful Hoda
33. Sri Indra Kant Mishra
34. Sri Ratan K~. Roy
35. Sri M.N. Khan
Confidential Section
Map Section
viii
Designation
Confidential Assistant
L.D.C.
Sr. Drawing Assistant·
Draftsman
Draftsman

CENSUS OF INDIA 2001 FIGURES AT A GLANCE
BIHAR
i) Total Population Persons Males Females T 82878796 43153964 39724832 R 74199596 38510686 35688910 U 8679200 4643278 4035922
ii) Decadal Population Absolute Percentage Growth 1991-2001 T 18348242 28.43
R 16380827 28.33 U 1967415 29.31
iii) Average annual exponential T 2.50 growth rate 1991-2001 R 2.49
U 2.57
iv) Area in sq. km. * T 94163.00 R 92358.40 U 1804.60
v) Population Density T 880 R 803 U 4809
vi) Sex Ratio T 921 R 927 U 869
vii) Child Population in the Persons Males Females Age-group 0-6 (with per- T 16234539 8375532 7859007 centage to Total/Rural! (19.59) (19.41 ) (19.78) Urban population shown R 14883794 7673648 7210146 in parenthesis) (20.06) (19.93) (20.20)
u 1350745 701884 648861 (15.56) (15.12) (16.08)
viii) Literacy Rate Persons Males Females T 47.53 60.32 33.57 R 44.42 57.70 30.03 U 72.71 80.80 63.30
* Provisional
ix


CENSUS OF INDIA 2001
STATE HIGHLIGHTS
1. Number of Divisions
2. Number of Districts
3. Number of Subdivisions
4. Number of C.D. Blocks
5. Number of Urban Agglomerations
6. Number of Toyvns i) Statutory Towns ii) Census Towns (Non-statutory)
7. Number of UAsl I 7 UAs/12 Towns 2 UAs/14 Towns
65 Towns 17.Towns
3 Towns
8.
9.
10.
11.
12.
13.
Independent Towns II by size class III
IV V VI Nil
Most populous town - Patna M.Corp. (including OGs) Least Populous town - Raghunathpur CT (Katihar)
Town with highest decadal growth - Koilwar NA (Bhojpur) Town with lowest decadal growth - Mokameh M (Patna)
Most densely populated town - Col gong M (Bhagalpur) Least densely populated town - Rajgir NA (Nalanda)
Town having highest Sex ratio - Barauli NA (Gopalganj) Town having lowest Sex ratio - Paharpur CT (Gaya)
Town having highest literacy rate- Paharpur CT (Gaya) Town having lowest literacy rate- Belsand NA,(Sitamarhi)
Town having highest female literacy rate- Dumra NA (Sitamarhi)
Town having lowest female literacy rate- Bahadurganj NA (Kishanganj)
xi
9
37
101
533
9
130 125
5
1442932 5601
94.14 -5.25
35095 671
1026 471
89.02 41.45
83.52
28.23
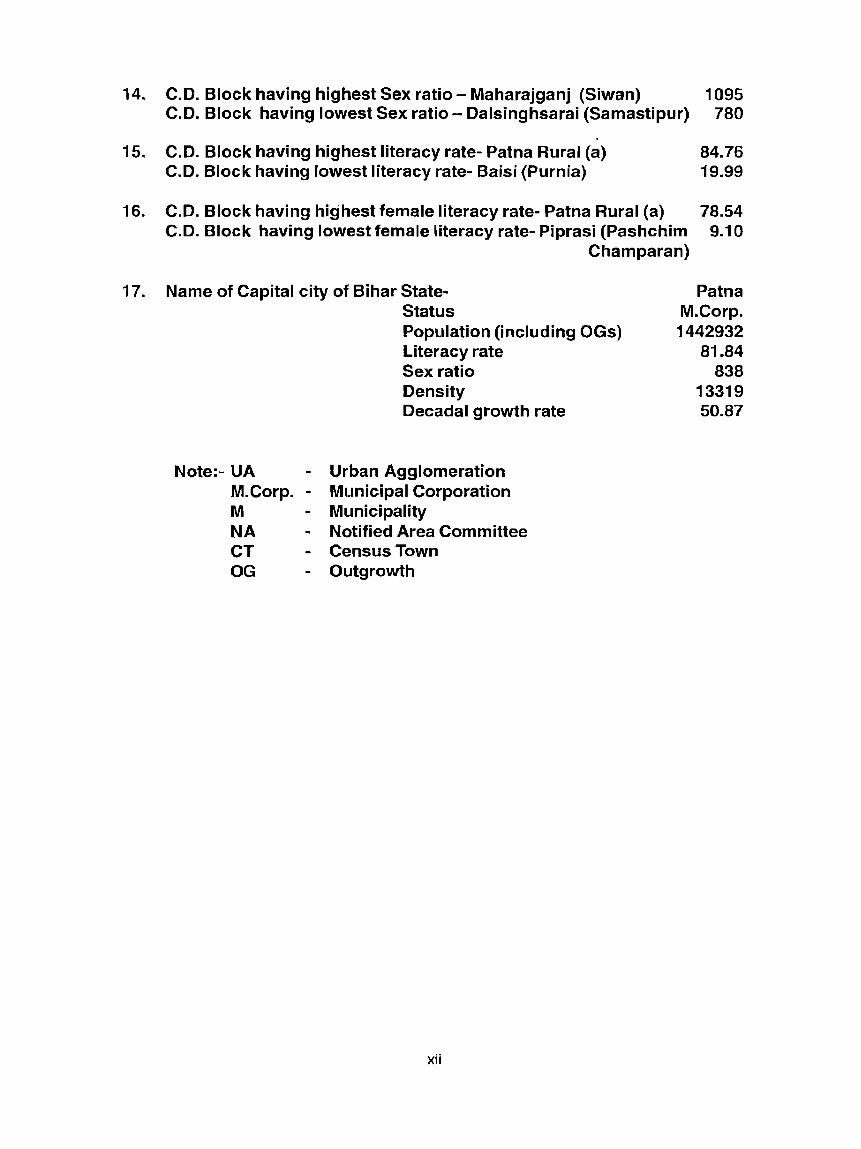
14. C.D. Block having highest Sex ratio - Maharajganj (Siwan) 1095 C.D. Block having lowest Sex ratio - Dalsinghsarai (Samastipur) 780
15. C.D. Block having highest literacy rate- Patna Rural (a) 84.76 C.D. Block having lowest literacy rate- Baisi (Purnia) 19.99
16. C.D. Block having highest female literacy rate- Patna Rural (a) 78.54 C.D. Block having lowest female literacy rate- Piprasi (Pashchim 9.10
Champaran)
17. Name of Capital city of Bihar StateStatus Population (including OGs) Literacy rate Sex ratio Density Decadal growth rate
Note:- UA - Urban Agglomeration M.Corp. - Municipal Corporation M - Municipality NA - Notified Area Committee CT - Census Town OG - Outgrowth
xii
Patna M.Corp. 1442932
81.84 838
13319 50.87

a:: « J: -OJ
'II"'" C C N
en Z o en :> o w >
~ Ien z :::!! o <C
s
..J
o
'" '"
d
o
I )
..,
«
:r
* •
I'-'
I-a: <lI- III ,,,is
I/) .... u a: .... I/)~
08 ON lJJ I
.... ~ <en Wen a::~
u >-I.!> _jZ ~-wO:: z5
I
I I : I . I . I I
Ii:
~ w
~ (f) 0:: W
tr: « :::l 0 0 « W ::c
~ :::. 0 0:: LL en 0:: W LL ~CI) 01-wW :::.:.::: «0 Z~ I-al S:1Z 0::-I- Z
~~ O-we> ::cCI) 1--wO:: o::W w::;: ::co:: s:~
o <Xl
'" '"
r-
'"
:r; u :;: Z UJ UJ 0:: (!l
"-0 >-(f) <t UJ
... '"
g N
:i '" ~ .~
~ '5
w E E ~ > a
(!l
@
. jj .E
'5
1 (!l
f [fJ
~ '0 c Q
~
i

' co co
I
0:: « ::I: -m
/
N
"If"""
0 0 N
en z 0 en ~ 0
w > !;: a::: t-en z :!E 0 <C
\
s
1
·v"\ ~~..r •
... :~ .> ~
_,
.f I
l . )
o
~ :z ~ .... ¥
~
,. \ •
0<0 N
° CD N
D IV 3
~
& ..(
.$\ ~
V J. J. 11
. ID N
xiii ---
'" N
~
(
,.
'I )
t )
" «
* •
Uj w a: <{ a z ::> 0 Q)
(/) a:: w I-
~ a : o <C w I
I I .. I I .. J I
-' <{ z Q f- f-<{
(_) z w -IX f- a:: ::!~~ ~ en q
------
Vl IU ir I-~o 00 ON UJ I
I-~ < (7)' w (7) o::~
U
:>-C:> __.z 3:ir UJ::> zo
--
o 00
cn O w""" 0:: t--w :::!: 0 __. :;20
0 N
0 '<t
· co co
0
<D co
:I: (_)
3: z w w a:: (!l lL 0 f- ' en <t . w ..... co
I
'" ~ '0
~ ~ e (!l
" >-" '" " (J)
~ '0 c
.~
'~
'" '" = .r: oj Q_ <0 ::;;
.!!!
" oS
'0 >-~.
" en
& :>
" ~ ., .-' II,!P
(0-
I
I
~-I
a:: <C J: -m
,.... o 0-N~ (/)g Z...J OlD -I-(/)Z _w >::ii5 - c. Co wLrl » _w t;tc a:~ t-- Z (/):::::1 -~ Z~ -0 :li:u Cc:(
,
('II
Ii ~ ..
I II
j! e II: II!. w a: wa: tn W <a. ~~ a.tJ'J
~~ g~ _.~
IIJW
q~ 0)( u. W OZ tn
Z w< ::;:!;i <0 Zw
~~ U. ...J .. a. w
i
• • I I I I ~ •• I; I I I ~
1/10 WV a: t;i g 520
o _CO
CO
a
-fl)
~.., 0
1_ l() ~.l CO
0 0 0 r-. ceo LD C'-I C'l C'-I
,.... 0 0-
., 'rJ N::':::
D IV (J)g
3 & Z"'" Om
0
_ .... <C ..(
<Xl (J)Z OJ
S'
a: _w >:E
.iJ
<C - Il. -' Co wu1 ::L » - _w
CD ~e a::!:: ..... Z en:::l _:E Z:E
0
....... -0 to ~u
C-«
o (0 co
f)
(XV)
0 '<:t" C'\J
~
-z.
:r.
<C
..,
N
d Z W ...J III
~ ~ 0:: w u_ -w 0:: wa: cnu.l «D-~~ c.. en cn:x: :10::: t-(,)z 0-...Jl=I llluJ
c:!~ 0>< u_uJ OZ cn Z wet: ::iE!d: «0 Zw 0::0 0« u_ ...J __ D-W
15 Z
I I q •• H I I d • • 1; I I d
:-
we:> 11l""" a: ti:i :;: g S2e:>
0 eo eo
0
I'--eo
o c.o eo
:I: u ~ z w w a: C!l u. 0 I-"'-« w
0
~ eo
/"
C; C> .... :E .g> =-... 0 <> _!!! -0 .5 (5
1: Q)
E E Q)
> 0
CJ
@
..; '0 .5 (5
~ Q) c: Q)
CJ (5 =-Q)
<!: :::>
(I) ... -= (5 c: 0 u;
'" E ;;; D.. Q)
-= -= ~ D.. ... == ... '0 .5 (5
=-... <!: :::>
(I)

INTRODUCTION


INTRODUCTION
The first publication related with Census of India 2001, based on provisional population totals, was brought out in the shape of Paper 1 of 2001 immediately after the population enumeration work was over. The following tables, showing figures relating to the size of population, population in the age group (0-6), growth rate, sex ratio, literacy and density of population for the state and its districts have been presented in this paper 1 :-
(i)
(ii)
(iii)
(iv)
Table 1
Table 2
Table 3
Table 4
Population distribution, Percentage decadal growth rate, Sex ratio and Density of population. .
Percentage Decapal Variation in Population since 1901 for State and Districts.
Sex ratio since 1901 for State and Districts.
Population in the age-group 0-6, Number of literates and Literacy rate for State and Districts.
Apart from the above main tables, five statements, based on the above tables, maps, charts and diaQrams were also prepared, presented and dealt with in th~ portion pertaining to analysis of results in Paper 1 ~ 2001. .
The state of Bihar was bifurcated and a new state of Jharkhand came into existence with effect from 15th November, 2000. Hence Paper 1 of 2001 has been compiled and published separately for the states of Bihar (the left over portio!!) and Jharkhand. .
Since the release of· final population figures may take some more time, a further attempt has been made to present some more information on rural-urban distribution of population, based on provisional population data, through the present Paper - 2 of 2001. The detailed analysis in any of the fields must await the generation of final population figures and preparation of tables based thereon. The' present paper mainly deals with rural and urban distribution of population for the state, its districts, urban agglomerations (UAs), cities, towns and community development blocks. The trends in urbanisation in the state and districts have also been dealt with through these tables.
The following tables are presented in this paper :
(i) Table 1
(ii) Table 2
(iii) Table 3
(iv) Table 4
(v) Table 5
(vi) Table 6
Population, Child population in the age - group 0 - 6, Literates by residence and sex - State, District. UA/Cityrrown, 2001.
Population, Child popuiation in the age- group 0 - 6 and Literates by residence and sex - State, Districts, Community Development Blocks, 2001.
Percentage decadal growth, percentage of child population in the age- group 0-6 by residence and Percentage of urban population to total population - State and Districts, 2001.
Sex ratio of population and Sex ratio of child population in the age group 0-6 - State, Districts, Community Development Blocks, 2001.
Literacy rates by residence and sex - State, Districts, Community Development Blocks, 2001
Population, percentage decadal growth rate 1991-2001, Sex ratio, literacy by sex - UAs,Cities and Towns by size class in the state, 2001.

(vi)
(viii)
(ix)
Appendix-1 to Table-6
Appendix-2 to Table-6
Table-7
Population, Child population in the age-group 0-6 and Literates by sexindependent Cities and Towns arranged in alphabetical order, 2001.
List of Towns of 1991 declassified in 2001 and Towns of 1991 merged with other Towns in India, 2001.
Gr;owth of urban population, 1981-2001.
A few statements, based on tho above tables, have also been prepared and presented in this paper in the portion pertaining to analysis of results.
ANALYSIS OF RESULT


URBANISATION - RURAL AND URBAN COMPOSITION
It is customary to classify the population of the State and Country as rural and urban at every census. This becomes necessary in order to assess the differences in the social, economic, cultural and demographic characteristics of the population. At every census, it is usual for the Census Directorate to prepare a list of towns for the forthcoming census. For determining a place as 'urban' the criteria adopted in the 2001 Census was more or less the same as that used in the 1991 and 1981 Censuses. While all Municipal corporations, Municipalities, Notified Areas, Cantonment Boards, etc. are automatically considered as 'urban' irrespective of any other consideration, some non-municipal areas (or say villages) have been recognised as 'urban' provid~d such places satisfy the following criteria :
(i) A minimum population of 5,000
(ii) At least 75 percent of the male working population being engaged in non - agricultural pursuits, and
(iii) A density of population of at least 400 persons per sq. km.,
Places satisfying the above three criteria are identified as Census Towns or non-statutory towns by the Director of Census Operations in each State/Union Territory after approval of the Registrar General and Census Commissioner, India. The places which were treated as census towns for the first time in 1991 Census and did not satisfy the ab?ve demographic criteria this time, were declassified in 2001 Census. All such areas which have neither been notified by the State Government nor identified by the Director of Census Operations as u'rban. are rural. During the Census of India 2001, the total number of towns in the State (postdivision Bihar) stood at 130. There were 271 towns in the composite state of Bihar (or pre-division Bihar) during 1991 Census.
Urban Agglomeration
An Urban Agglomeration (UA) has been defined as a continuous urban spread compriSing a town and its adjoining urban outgrowths or two or more physically contiguous towns together with continuous, well organised urban outgrowths, if any, of such town/towns. There is considerable socio-economic inter-relationship between such physically contiguous urban units and it has been considered purposeful to group them under an urban agglomeration. During 2001 Census two more conqitions have been added for the classification of an urban area as an Urban Agglomeration:
(a) The core town or at least one of the constituent towns should necessarily be a statutory town; and
(b) The total population of all the constituents (i.e, towns and outgrowths) of an Urban Agglomeration should not be less than 20,000 (as per the 1991 Census data).
In Bihar there are 9 urban agglomerations and 111 independent'towns (109 statutory towns and 2 census towns) which means that out of the total of 130 towns, as stated above, 19 towns (16 statutory and 3 census towns) have been grouped under 9 Urban Agglomerations. The list of Urban Agglomerations with their constituents is given below:

Name of district Name of U.A. Constituents
Purba Champaran Motihari U.A. (a) Motihari (M) (b) Lauthaha (NA)
Sitamarni Sitamarhi U.A. (a) Sitamarhi (M) (b) Rajopatti Dumra-Talkhapur- Dumra (OG) (c) Dumra (NA)
Purnia Purnia U.A. (a) Purnia (M) (b) Kasba (NA)
Katihar Katihar U .A. (a) Katihar (M) (b) Katihar Rly. Colony (OG)
Samastipur Samastipur UA (a) Samastipur (M) (b) Samastipur Rly. Colony (OG)
Begusarai Begusarai U.A. (a) 8egusarai (M) (b) Barauni 10C Township (CT)
Bhagalpur Bhagalpur U.A. (a) Bhagalpur (M.Corp.) (b) Habibpur (CT)
Patna Patna U.A. ._ (a) Patna (M. Corp.) (b) Pataliputra Housing Colony (OG) (c) Digha-Mainpura (OG) (d) Sabazpura (OG) (e) Khalilpura (OG) (f) 8adalpura (OG) (g) Phulwari Sharif (NA) (h) Dinapur Nizamat (M) (i) Dinapur Cantt. (C8) (j) Khagaul (M) (k) Saidpura (OG)
Gaya Gaya U.A. (a) Gaya (M.Corp.) (b) Kaler (OG) (c) Paharpur (CT)
The number of Community Development Blocks in the state is 533, contained in 101 Subdivisions of 37 Districts. During the just concluded census gperations, each of these C.D. Block was treated as an independent rural charge. Similarly, each Statutory Town/Census Town was treated as an independent urban charge.
Degree of urbanisation among States and Union Territories
The urban population of India as per the 2001 provisional population totals is 285,354,954 out of which 150,135,894 are males and 135,219,060 are females. The urban population of the country as per 1991 Census was 217,611,012 of which 114,908,844 were males and 102,702.168 females. The undivided state of Bihar. in 1991, had an urban population of 11,353,012 out of which 6,156,996 were males and 5,196,016 were females. 2001 Census figures reveal that after the separation of Jharkhand, the post-division state of Bihar has an urban population of 8,679,200 compristng 4,643,278 males and 4,035,922 females.
8

Bihar, which has a rural population of 74,199,596 and an urban population of 8,679,200, continues to be predominantly rural even now. The level of urbanisation in the post-division state, as measured by percentage of population living in urban areas, is of the order of 10.47 percent as against 13.14 percent for the erstwhile composite Bihar (before creation of Jharkhand state). As per the recast figures of urban population of Bihar for 1991 Census on the present jurisdiction of the state, the percentage of urban population works out to 10.40 which is almost equal to the percentage of urban population returned during 2001 Census.
Among all the States and Union Territories of India the only state having lower degree of urbanisation than that of Bihar (10.47) is Himachal Pradesh (9.79). All other states and union territories of the country have shown higher degree of urbanisation as compared to Bihar during Census of India 2001. The degree of urbanisation in Bihar in 2001 Census is also much lower compared to the all India average of 27.78. All these will be evident from the Statement-1, placed at Annexure-X, showing Rural - Urban distribution of population - India and States/Union Territories: 2001. The degree of urbanisation among various States/UTs in the country is arranged below in descending order of their percentage urban popUlation:
Sl.No.
1
2
3
4
5
6
7
8
9
10
11
12
13
14
15
16
17
18
19
20
21
22
23
24
Name of State/U.T.
2
Delhi
Chandigarh
Pondicherry
Goa
Mijoram
Lakshadweep
Tamil Nadu
Maharashtra
Gujarat
Daman & Diu
Karnataka
Punjab
Andaman & Nicobar Island
Haryana
West Bengal
Andhra Pradesh
Madhya Pradesh
Kerala
UUaranchal
Jammu & Kashmir
Manipur
Rajasthan
Dadra & Nagar Haveli
Jharkhand
9
Percent urban population
3
93.01
89.78
66.57
49.77
49.50
44.47
43.86
42.40
37.35
36.26
33.98
33.95
32.67
29.00
28.03
27.08
26.67
25.97
25.59
24.48
23.88
23.38
22.89
22.25
1 2 3
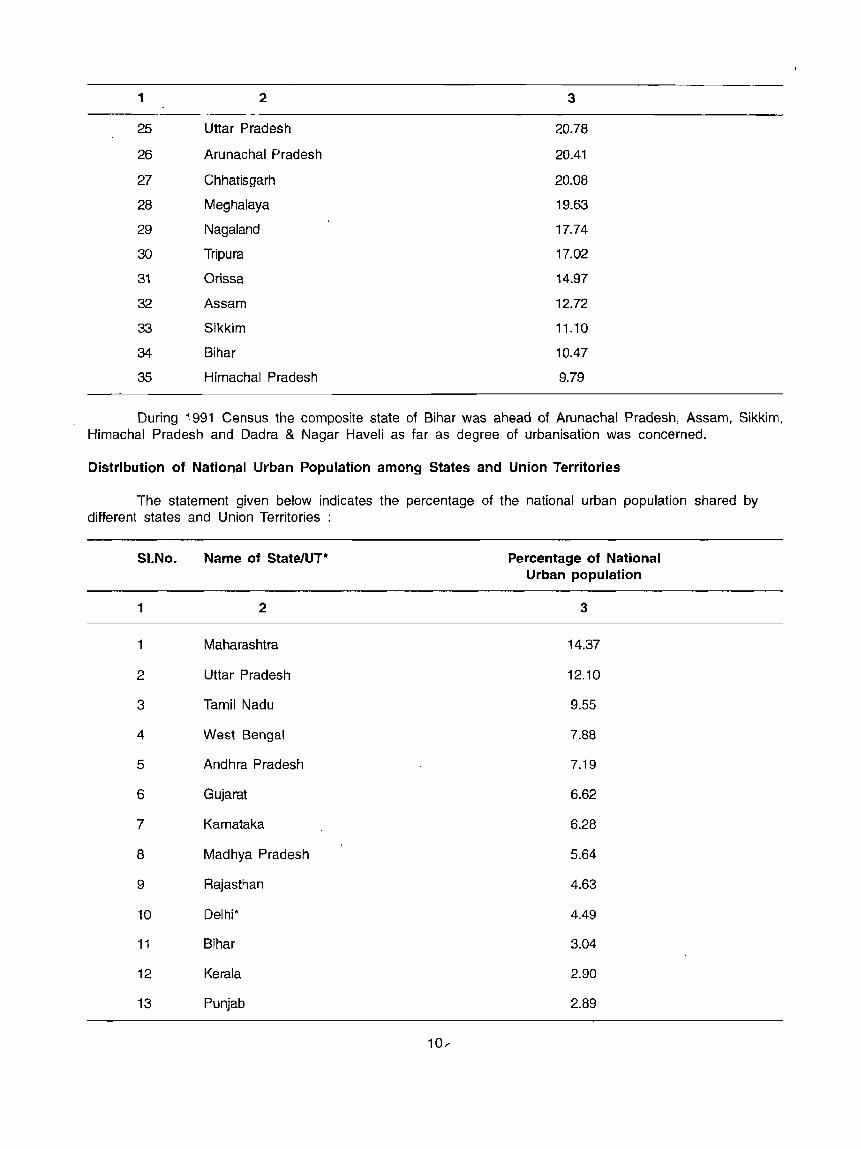
25 Uttar Pradesh 20.78
26 Arunachal Pradesh 20.41
27 Chhatisgarh 20.08
28 Meghalaya 19.63
29 Nagaland 17.74
30 Tripura 17.02
31 Orissa 14.97
32 Assam 12.72
33 Sikkim 11.10
34 Bihar 10.47
35 Himachal Pradesh 9.79
During i 991 Census the composite state of Bihar was ahead of Arunachal Pradesh, Assam, Sikkim, Himachal Pradesh and Dadra & Nagar Haveli as far as degree of urbanisation was concerned.
Distribution of National Urban Population among States and Union Territories
The statement given below indicates the percentage of the national urban population shared by different states and Union Territories :
SI.No. Name of State/UP Percentage of National Urban population
1 2 3
1 Maharashtra 14.37
2 Uttar Pradesh 12.10
3 Tamil Nadu 9.55
4 West Bengal 7.88
5 Andhra Pradesh 7.19
6 Gujarat 6.62
7 Karnataka 6.28
8 Madhya Pradesh 5.64
9 Rajasthan 4.63
10 Delhi* 4.49
1 i Bihar 3.04
12 Kerala 2.90
13 Punjab 2.89
10 ....
1 2 3
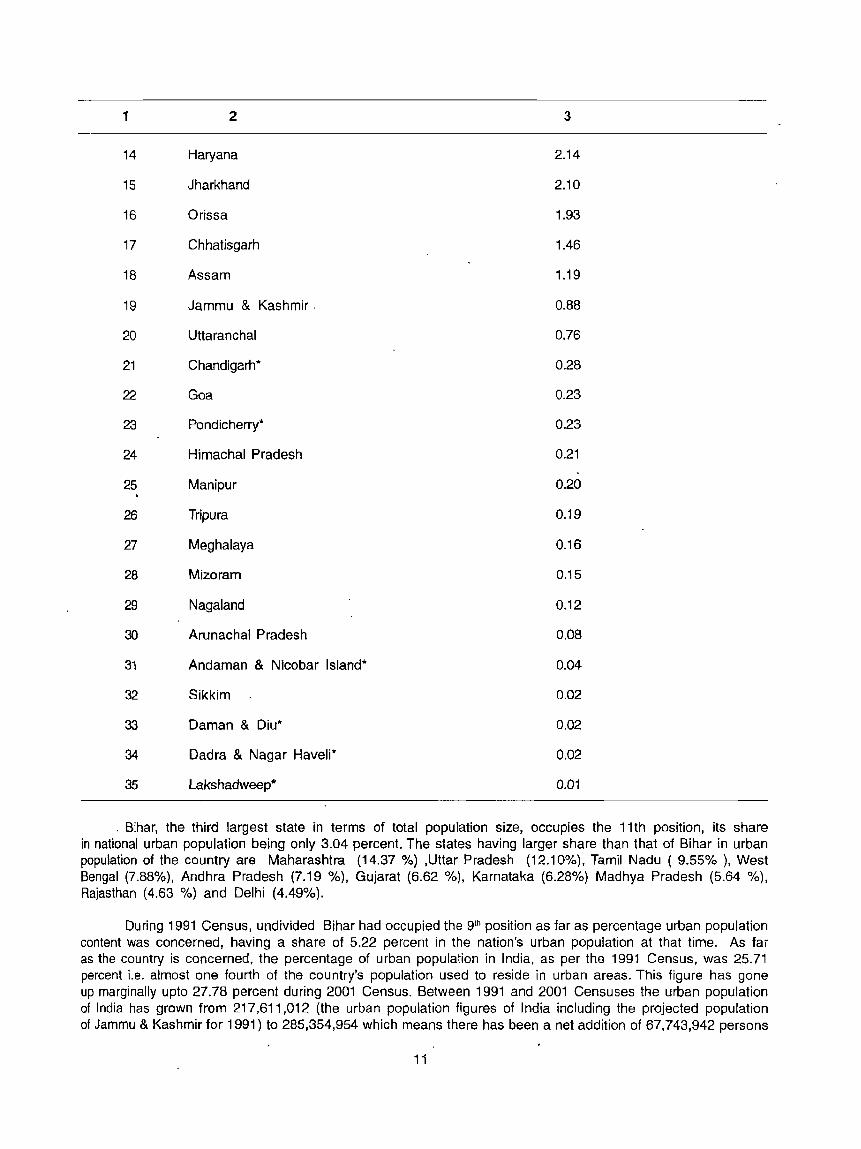
14 Haryana 2.14
15 Jharkhand 2.10
16 Orissa 1.93
17 Chhatisgarh 1.46
18 Assam 1:19
19 Jammu & Kashmir. 0.88
20 UUaranchal 0.76
21 Chandigarh* 0.28
22 Goa 0.23
23 Pondicherry* 0.23
24 Himachal Pradesh 0.21
25 Manipur 0.20
26 Tripura 0.19
27 Meghalaya 0.16
28 Mizoram 0.15
29 Nagaland 0.12
30 Arunachal Pradesh 0.08
31 Andaman & Nicobar Island'" 0.04
32 Sikkim 0.02
33 Daman & Diu" 0.02
34 Dadra & Nagar Haveli* 0.02
35 Lakshadweep* 0.01
. Bihar, the third largest state in terms of total population size, occupies the 11th position, its share in national urban population being only 3.04 percent. The states having larger share than that of Bihar in urban population of the country are Maharashtra (14.37 %) ,Uttar Pradesh (12.10%), Tamil Nadu ( 9.55% ), West Bengal (7.88%), Andhra Pradesh (7.19 'Yo), Gujarat (6.62 %), Karnataka (6.28%) Madhya Pradesh (5.64 %), Rajasthan (4.63 %) and Delhi (4.49%).
During 1991 Census, undivided Bihar had occupied the 9th position as far as percentage urban population content was concerned, having a share of 5.22 percent in the nation's urban population at that time. As far as the country is concerned, the percentage of urban popUlation in India, as per the 1991 Census, was 25.71 percent i.e. almost one fourth of the country's population used to reside in urban areas. This figure has gone up marginally upto 27.78 percent during 2001 Census. Between 1991 and 2001 Censuses the urban population of India has grown from 217,611,012 (the urban population figures of India including the projected population of Jammu & Kashmir for 1991) to 285,354,954 which means there has been a net addition of 67,743,942 persons
1 i

in the urban population of the country during the last decade. During the same period the total number of
people living in urban areas of Bihar has gone down from 11,353,012 to 8,679,200 on account of the division of Bihar on 15th November, 2000 (between 1991 Census and 2001 Census). On the other hand, if we recast
the urban population of Bihar in 1991 on the basis of the present territorial jurisdiction of Bihar, it would come to 6,711,785. It means that the geographical area comprising the state of Bihar in 2001 Census had an urban population of 6,711.785 in 1991. Based on this calculation the net addition to the urban population of present day Bihar between 1991 and 2001 Censuses is of the order of 1,967,415.
Degree of urbanisation among districts
Table-I at Annexure-I and Table-3 at Annexure-III show the Rural - Urban composition, percentage of
urban population to total population and decennial growth rate for the state and its 37 districts. A map of Bihar depicting rural and urban share of population among the districts is also being presented in this paper. It will be seen from Table-3 and Statement-3, placed at Annexures-III and XII respectively, that in 2001 Census the district of Patna with 41.80% urban populati<?n is the most urbanised district, followed by Munger with 27.88%. The districts of Bhagalpur with 18.59% and Sheikhpura with 15.48% occupy the 3rd and the 4th places respectively. During 1991 Census Purbi Singhbhum district with 52.69% urban population was the most urbanised district
in the composite state of Bihar, followed by Dhanbad which had 51.26% of its population living in urban areas. These two districts now form part of Jharkhand state. After the creation of Jharkhand, Patna is now the only
district in Bihar which has an urban population of more than 40 percent and can somewhat be compared to the degree of urbanisation of Purbi Singhbhum and Dhanbad districts of erstwhile Bihar state during 1991 Census. There are a few districts such as Madhubani, Banka, Kaimur, Sheohar and Samastipur where the degree of urbanisation is very low, the proportion of urban population b9ing less than even 5 percent.
Statement - 4 placed at Annexure-XIII shows the trend of urbanisation in the form of annual exponential growth rate at which the urban population is growing. While the annual exponential growth rate had declined
from 4.27 percent to 2.66 percent during 1981-91, during the same period the level of urbanisation in the state increased by 0.56 percentage points from 9.84 to 10.40. However, during 1991-2001 the annual exponential growth rate has come down from 2.66 to 2.57 and increase in urbanisation has been of the order of 0.07
perc~ntage points only. This indicates that the trend of urbanisation in the state has slowed down during the
decade 1991-2001 as compared to the previous decade 1981 - 1991.
Distribution of State's urban population in the districts
As far as the distribution of urban population of the state among its districts is concerned, it can be seen that Patna district takes the largest share i.e. 22.69%. Patna has maintained its position with regard to degree of urbanisation (41.80%) as well as share in the distribution of State's urban population. Munger district occupies second position so far degree of urbanisation is concerned (27.88%), although it is much
behind Patna and its share in urban population of the state is only 3.65 percent. The districtwise share of the State's urban population among other districts varies from 1.01 percent in Supaul to 5.47 percent in Gaya. There are a total of six districts which do not have even one percent share in the state's urban population.
These are - Sheikhpura, Khagaria, Madhepura, Banka, Kaimur and Sheohar. On the basis of 1991 Census figures also, the present day districts of Sheikhpura, Khagaria, Banka, Kaimur and Sheohar would have had less than 1 percent share each of the state's total urban population while the share of Madhepura district would have been just more than 1 percent
The districtwise share of state's urban population rn terms of p'ercentage can be seen from the statement
given pelow:
1<:::

Rank in 2001 District 2001 1991 Rank in 1991
1 2 3 4 5
1 Patna 22.69 20.51 1
2 Gaya 5.47 5.30 2
3 Bhagalpur 5.21 5.12 3
4 NaJanda 4.07 4.41 4
5 Muzaffarpur 4.01 4.10 6
6 Rohtas 3.76 3.98 7
7 Munger 3.65 4.22 5
8 Bhojpur 3.60 3.51 8
9 Pashchim Champaran 3.57 3.51 9
10 Saran 3.43 3.49 10
11 Darbhanga 3.07 3.25 11
12 Purba Champaran 2.90 2.58 13
13 Purnia 2.56 2.36 15
14 Katihar 2.51 2.56 14
15 Vaishali 2.15 2.14 16
16 Aurangabad 1.95 1.76 19
17 Sitamarhi 1.77 1.78 18
18 Siwan 1.70 1.72 20
19 Nawada 1.60 1.41 25
20 Araria 1.53 1.52 22
21 Gopalganj 1.50 1.44 24
22 Kishanganj 1.49 1.48 23
23 Buxar 1.48 1.35 27
24 Madhubani 1.43 1.53 21
25 Saharsa 1.43 1.19 29
26 Samastipur 1.42 2.01 17
27 Lakhisarai 1.35 1.27 28
28 Jehanabad 1.29 1.11 32
29 Begusarai 1.24 2.65 12
30 Jamui 1.19 1.11 31
31 Supaul 1.01 1.36 26
32 Sheikhpura 0.94 0.96 33
33 Khagaria 0.88 0.88 34
34 Madhepura 0.78 1.14 30
35 Banka 0.65 0.67 35
36 Kaimur 0.48 0.40 36
37. Sheohar 0.25 0.21 37
13

Urban decadal growth rate
The growth rates for the total population of the state and districts have already been discussed at length in Paper-I of 2001. In this paper, column 6 of Table-3, placed at Annexure-III, shows the decennial growth rates of the population (Total, Rural & Urban) during 1991-2001 in respect of the state and its 37 districts. A look at this column reveals that during the decade 1991-2001 the total, rural and urban populations of the state have registered decadal growth rates of 28.43%, 28.33% and 29.31% respectively. The corresponding growth rates in total, rural and urban populations during the decade 1981-91 were 23.38%, 22.61 % and 30.45% respectively. There has not been any significant difference in decadal growth rate of urban population of the state during the last two decades. It further transpires from the table that some .of the districts viz., Purba Champaran (45.04%), Purnia (40.34%), Saharsa (54.73%), Patna (43.02%), Buxar (41.79%), Kaimur (53.50%), Jehanabad (50.25%), Aurangabad (43.02%) and Nawada (46.65%) have recorded decadal growth rates of urban population of more than 40% during the decade 1991-01. On the other hand there are also a few districts such as Supaul, Madhepura, Samastipur and Begusarai which have registered negative growth rate for urban population. This has resulted also on account of the fact that a few towns of these districts have been declassified during 2001 Census as they did not satisfy the laid down criteria for being treated and continued as census towns during the present census.
The districts having higher urban growth rates as compared to the state average (29.31 %) are the following:
District
Saharsa
Kaimur
Jehanabad
Nawada
Purba Champaran
Patna
Aurangabad
Buxar
Purnia
Jamui
Lakhisarai
Gopalganj
Gaya
Bhojpur
Bhagalpur
Pashchim Champaran
Vaishali
Kishanganj
Khagaria
Araria
Urban growth rate in percent (1991~2001)
54.73
53.50
50.25
46.65
45.04
43.02
43.02
41.79
40.34
38.37
37.78
34.76
33.48
32.62
31.58
31.49
30.08
29.94
29.62
29.59
The probable reasons for higher growth rates in the above districts may be influx of population from rural to urban areas and expansion in territorial jUrisdiction of a few old towns. In certain cases like Buxar, Kaimur. Lakhisarai & JamuL the creation of new districts may also have added to the urban component of the population. It is well known that immediately after creation of a new district or division a number of offices are established and other related activities such as transport, communication and general trade and commerce get a boost. These may be the probable reasons for higher urban growth rates in the districts which have been created between 1991 and 2001 Censuses.
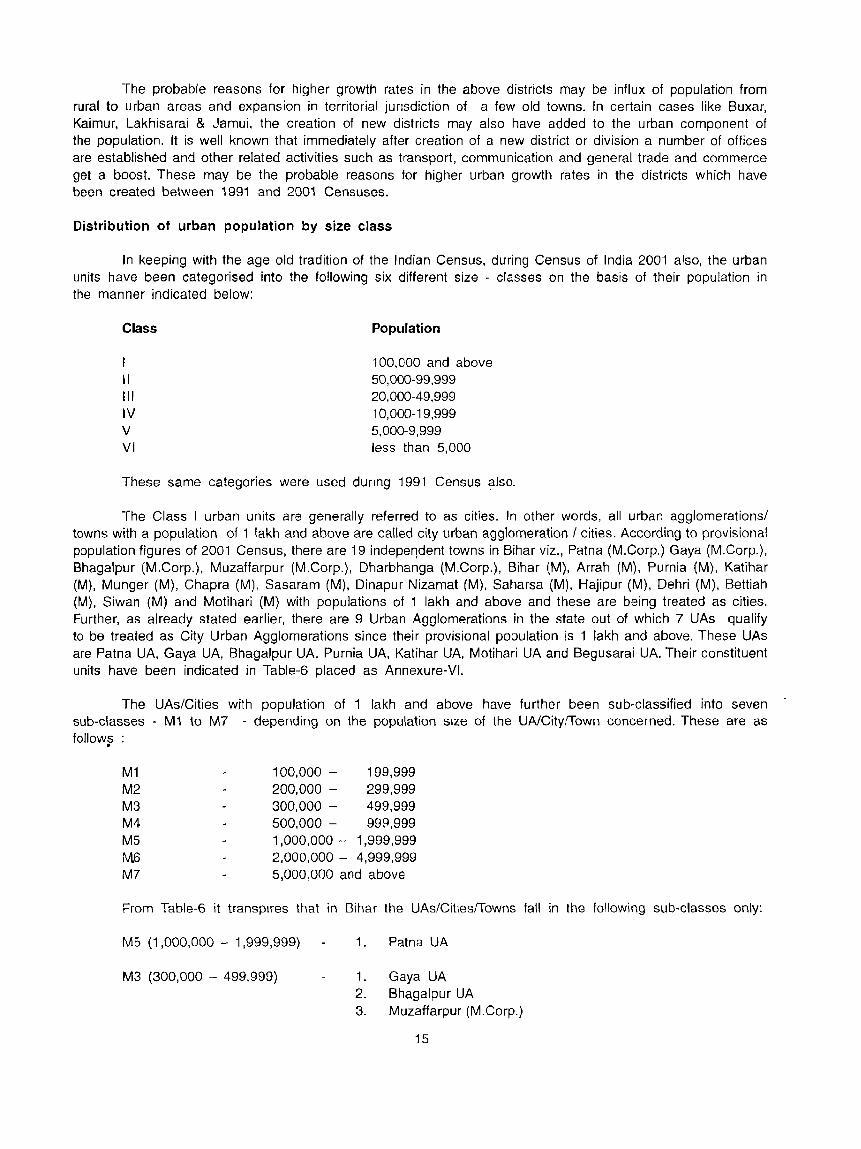
Distribution of urban population by size class
In keeping with the age old tradition of the Indian Census, during Census of India 2001 also, the urban units have been categorised into the following six different size - classes on the basis of their population in the manner indicated below;
Class
II III IV V VI
Population
"100,000 and above 50,000-99,999 20,000-49,999 10,000-19,999 5,000-9,999 less than 5,000
These same categories were used dUring 1991 Census also.
The Class I urban units are generally referred to as cities. In other words, all urban agglomerations/ towns with a population of 1 lakh and above are called city urban agglomeration / cities. According to provisional population figures of 2001 Census, there are 19 indeper]dent towns in Bihar viz., Patna (M.Corp.) Gaya (M.Corp.), Bhagalpur (M.Corp.), Muzaffarpur (M.Corp.), Dharbhanga (M.Corp.), Bihar (M), Arrah (M), Purnia (M), Katihar (M), Munger (M), Chapra (M), Sasaram (M). Dinapur Nizamat (M), Saharsa (M), Hajipur (M), Dehri (M), Bettiah (M), Siwan (M) and Motihari (M) with populations of "1 lakh and above and these are being treated as cities. Further, as already stated earlier, there are 9 Urban Agglomerations in the state out of which 7 UAs qualify to be treated as City Urban Agglomerations since their provisional population is 1 lakh and above. These UAs are Patna UA, Gaya UA, Bhagalpur UA, Purnia UA, Katihar UA, Motihari UA and Begusarai UA. Their constituent units have been indicated in Table-6 placed as Annexure-VI.
The UAs/Cities with population of 1 lakh and above have further been sub-classified into seven sub-classes - M1 to M7 - depending on the population size of the UA/City/Town concerned. These are as follows .
M1 M2 M3 M4 M5 M6 M7
100,000 - 199,999 200,000 - 299,999 300,000 - 499,999 500,000 - 99Sl,999 1,000,000 - 1,999,999 2,000,000 - 4,999,999 5,000,000 and above
From Table-6 it transpires that in Bihar the UAs/Cities/Towns fall in the following sub-classes only:
M5 (1,000,000 - 1,999,999) 1. Patna UA
M3 (300,000 - 499,999) 1. Gaya UA 2. Bhagalpur UA 3. Muzaffarpur (M.Corp.)
15
M2 (200,000 - 299,999) 1. Dharbhanga (M.Corp.). 2. Bihar (M) 3. Arrah (M)
M1 (100,000 - 199,999) 1. Purnia UA 2. Katihar UA 3. Motihari UA 4. Begusarai UA 5. Munger (M) 6. Chapra (M) 7. Sasaram (M) 8. Saharsa (M) 9. Hajipur (M) 10. Dehri (M) 11 . Bettiah (M) 12. Siwan (M)
None of the UAs/Cities in Bihar belongs to M7, M6 or M4 category.
In Table-6, the UAs and independent cities and towns are arranged by descending order of their population in each size-class. Within UAs, however, the constituent units (including outgrowths) have been arranged in their regular order and not in descending order of population of these constituent units. Figures in respect of constituent units have also been presented along with the respective Urban Agglomeration. The constituent units of such UAs have not been repeated in other size-class in which they may independently fall according to their population. In case the constituent unit (s) of an UA tall (s) in different districts, the name of the district was to be indicated in column 3 against the consituent unit (s). However, in the state of Bihar, such a situation does not exist. The items on which data has been presented in this table are Population by sex, Percentage decadal growth rate for 1991-2001, Sex ratio and Literacy rate by sex. The growth rate of a size class or of towns refers to the growth of population according to the size-class of the towns in the 1991 Census in respect of the decade 1991-2001.
It will also be seen from the Table - 6 that the size class I towns registered higher decadal growth rate in population (68.75%) as compared to other size class towns. In tact, among class I towns, the sub class M5 (population between 1,000,000-1,999,999) has registered a growth rate of 55.27 percent. This sub class consists of only one Urban Agglomeration viz., Patna UA comprising 5 constituent towns and 6 urban outgrowths. Further, due to upgradation of some cla~s II towns of 1991 Census to class I towns (as a result of increase in their population) during 2001 Census. the decadal growth rate of M1 sub class towns (population between 100,000-199,999) has risen substantially (129.61%). Negative growth rate in sub class M2 (population between 200,000-299,999) may be attributed to the fact that some of the towns belonging to this category in 1991 Census have subsequently been upgraded in higher sub classes during 2001 Census. In fact, apart from size class I towns, only size class III towns have shown a positive decadal growth rate (23.73%). The other three size class towns - size class II, IV and V - have registered negative decadal growth rates. The plausible reasons for negative growth rates have already been discussed above. The size class III contains as many as 65 towns. There is no size class VI town in the state of Bihar.
Sex ratio, as returned in the present census, is the lowest (861 females per thousand males) in size class I towns', while it is highest (888 females per thousand males) in size class V towns. The sex ratio is, however, adverse to females in all size class of towns. So far literacy rate in various size class of towns is concerned, it IS evident from Table-6 that the literacy rate is highest (77".38%) in towns belonging to size class I while the literacy rate is lowest (62.16%) in towns belonging to size class IV. The same trend is observed in case of male and female literacy rates separately also. The male literacy rates are comparatively much higher than female literacy rates in all size class of towns, the difference varying between 15 percentage points (size class I) to 22 percentage points (size class IV).
" 16

Table-7 placed at Annexure-IX shows the growth of urban population during the decades 1981-91 and
1991-01. After bifurcation of erstwhile Bihar state and creation of the new state of Jharkhand, the number
of urban agglomerations, statutory towns and census towns, according to the Census of India 2001, is as
shown below :
Urban Agglomerations
Statutory Towns
Census Towns
Bihar
9
125
5
Jharkhand
In the post-division Bi~ar, the number of statutory towns is comparatively much more than in the newly
created state of Jharkhand. On the other hand, number of census towns (non-statutory towns) is much higher
in Jharkhand as compared to Bihar. The number of urban agglomerations is slightly more in Jharkhand as
compared to the state of Bihar.
From Table-7, it can be seen that the number of UAs has risen from 7 in 1991 (recast figures for
Bihar according to present territorial jurisdiction) to 9 in 2001 Census. The number of independent towns has
registered a decrease. There are19 such towns in Bihar which are constituent units of Urban Agglom,:rations
in 2001 Census. While Class I and III UAsfTowns have shown an increase in their numbers, the numbers of
class II UAsfTowns and Class IV, V and VI towns have gone down. 10 fact, there is no class VI town in
the State of Bihar during 2001 Census.
It will further be seen from Table-7 that class I Towns/UAs account for 59.31 percent of the total urban
population of the state as against their share of 45.45 percent in state's urban population during 1991 Census.
The percentage share of Class II UAsfTowns and Class III, IV, V and VI towns In state's urban population has
registered a decrease during the decade. The population in class I Urban Agglomerations/Cities has shown increase
at a faster rate (35.95%) than the towns in other size classes. The comparatively low growth rates in some size
class of towns may be partly due to movement of towns from lower size class to higher size class.
For the convenience of data users the Total population, Child population in the age-group 0-6 and
Literate population by sex for all independent cities and towns, arranged in alphabetical order, have been presented
in Appendix-1 to Table-S, placed at Annexure-VII.
It would be evident from Appendix-2 to Table-5, placed at Annexure-VIII, that 11 towns (3 statutory
and 8 census towns) of 1991 Census no longer continue as towns during 2001 Census. Three statutory ·towns
have been denotified by the state Govt. authorities. Eight census towns have been declassified by the
Censu~ organisation since they did not fulfill the three laid down criteria for being continued as census towns
during 2001 Census. None of the towns of 1991 Census has been merged with any other town during the
present Census.
Further, statement - 2 placed at Annexure - XI reveals that there are 130 towns (125 statutory
towns and 5 census towns) in Bihar during 2001 Census as against 138 (127 statutory towns and 11 census
towns) at the time of 1991 Census (on ~he basis of recast figures for Bihar according to the present territorial
jurisdiction).
17

SEX RATIO IN DISTRICTS AND COMMUNITY DEVELOPMENT BLOCKS
Table - 1, placed at Annexure - I, presents data for population, child population in the age group 0-6 and literate population by sex for state, district, UAicity/town for 2001 Census.
Table - 2 at Annexure - II also presents the same data items as in Table - 1 mentioned above but for the total, rural and urban areas at the district and community development block level. The community development block is a very important administrative unit in the state and, as practiced during the earlier Censuses, the community development blocks have been treated as rural Charges at the time of Census of India 2001 also. There are two types of community development blocks in the state - first, which contain some urban area also within their territory and second, which contain only rural areas within their jurisdiction. For those community development blocks which contain urban components also, the data for total, rural and urban areas at the C.D. Block level have been furnished in Table - 2 along with similar data for the district. For those C.D. Blocks which do not have any urban component, the relevant data have been presented only for rural areas and no mention has been made of either urban area or total area against their names .
Sex ratio, which is defined as number of females per thousand males, is one of the important social parameters of the society and it indicates balance between males and females in the society.
If we recast the sex ratio figures on the basis of the present day territorial jurisdiction of the state of Bihar, it will be found that sex ratio has generally been adverse to women since 1961. The pattern of sex ratio among the total population and in the population of 0-6 age-group in various districts and C.D. Blocks within the districts can be seen from Table - 4 placed at Annexure-IV. Generally. the sex ratio of child population in the age-group 0-6 is found to be comparatively higher than the sex ratio of total population. However, in 9 out of 37 districts viz., Madhubani, Saharsa, Darbhanga, Muzaffarpur, Gopalganj, Siwan, Saran. Jehanabad and Aurangabad, the sex ratio of population in the age-group 0-6 is observed to be less than the sex-ratio of the total population. In 374 out of 533 C.D. Blocks (roughly 70% of the total no. of C.D. Blocks in the State) the sex ratio of child population in the age-group 0-6 is observed to be higher than the sex ratio of general population. In the remaining 159 C.D. Blocks situation is otherwise i.e. sex ratio is higher in the general population vis-a-vis sex ratio of child population in the age-group 0-6. Most of these C. D. Blocks are situated in the aforesaid 9 districts where, sex ratio for the district as a whole has been found to be higher in the general population vis-a-vis the child population in the age-group 0-6.
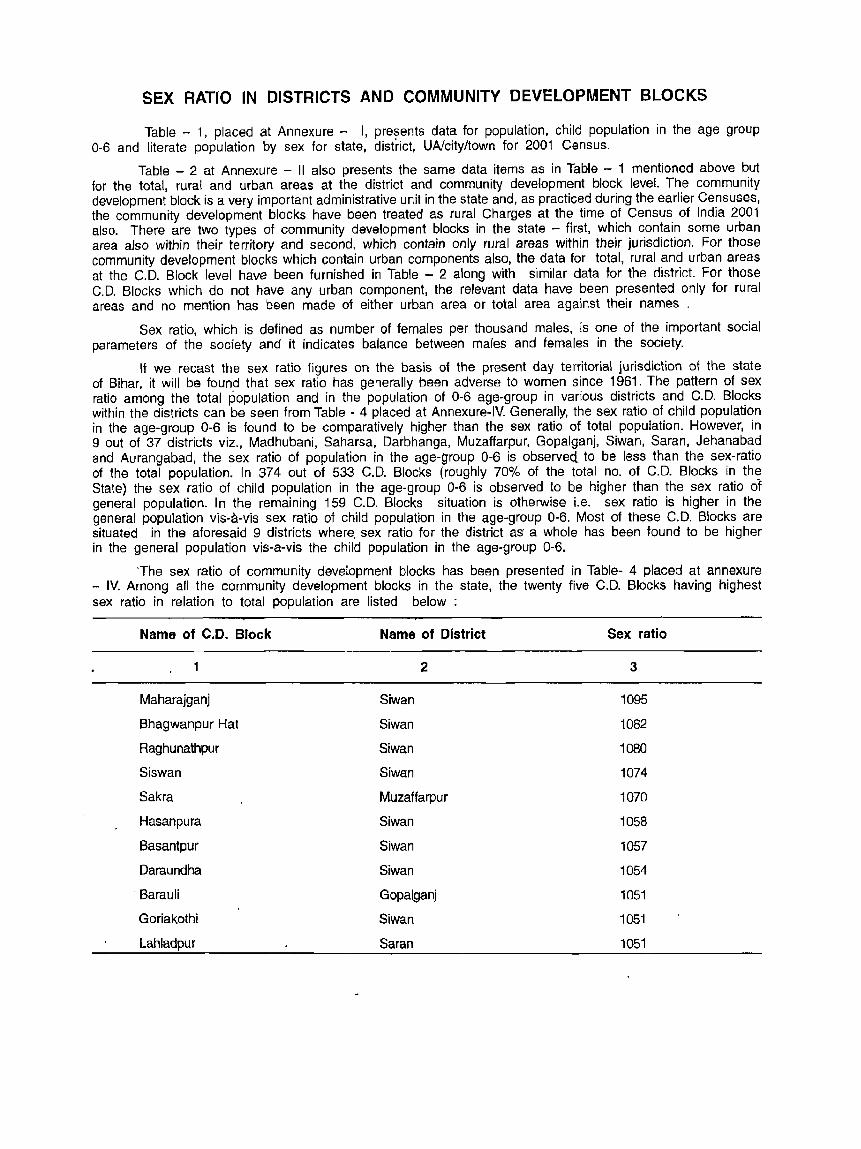
The sex ratio of community development blocks has been presented in Table- 4 placed at annexure - IV. Among all the community development blocks in the state, the twenty five C.D. Blocks having highest sex ratio in relation to total popUlation are listed below:
Name of C.D. Block Name of District Sex ratio
1 2 3
Maharajganj Siwan 1095
Bhagwanpur Hat Siwan 1082
Raghunathpur Siwan 1080
Siswan Siwan 1074
Sakra Muzaffarpur 1070
Hasanpura Siwan 1058
Basantpur Siwan 1057
Daraundha Siwan 1054
. Barauli Gopalganj 1051
Goriakothi Siwan 1051
Lahladpur Saran 1051
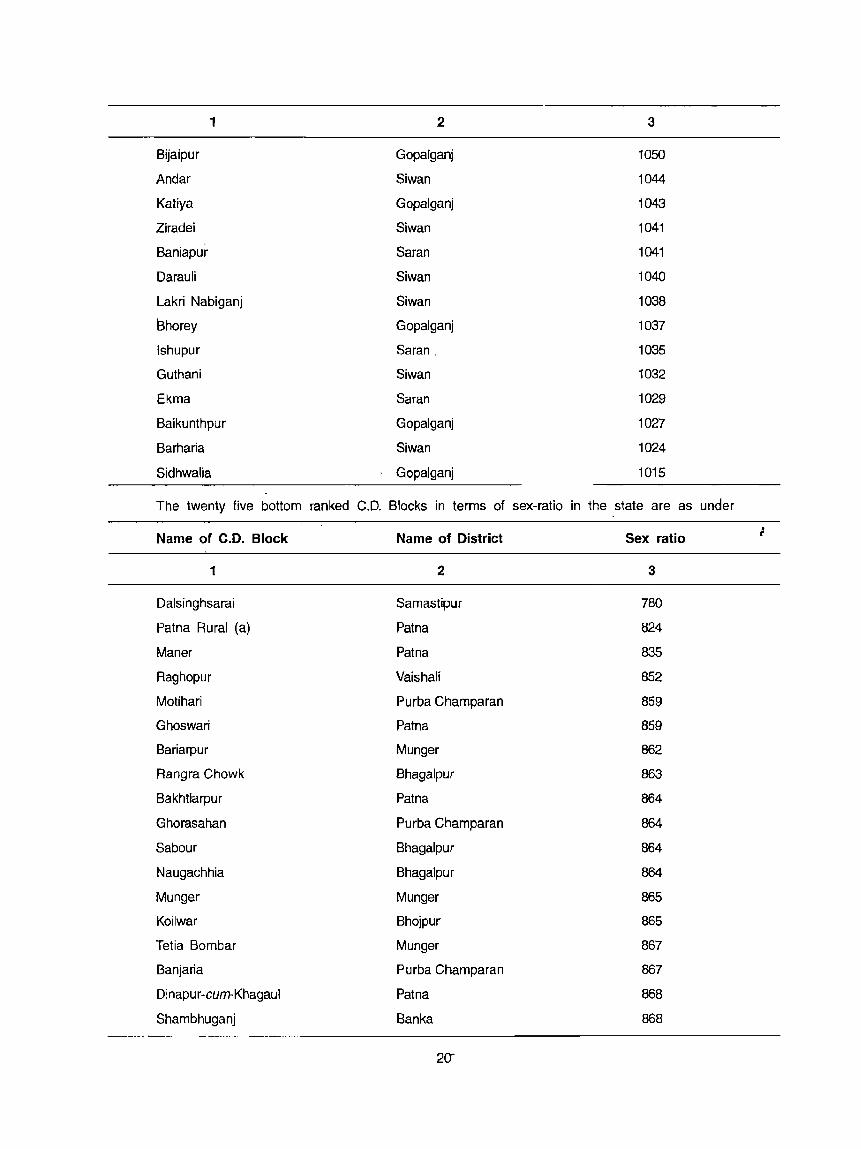
1 2 3
Bijaipur Gopalganj 1050
Andar Siwan 1044
Kaliya Gopalganj 1043
Ziradei Siwan 1041
Baniapur Saran 1041
Darauli Siwan 1040
Lakri Nabiganj Siwan 1038
Shorey Gopalganj 1037
lshupur Saran. 1035
Guthani Siwan 1032
Ekma Saran 1029
Baikunthpur Gopalganj 1027
Barharia Siwan 1024
Sidhwalia Gopalganj 1015
The twenty five bottom ranked C.D. Blocks in terms of sex-ratio in the state are as under
Name of C.D. Block Name of District Sex ratio ,
1 2 3
Dalsinghsarai Samastipur 780
Patna Rural (a) Patna 824
Maner Patna 835
Raghopur Vaishafi 852
Motihari Purba Champaran 859
Ghoswari Patna 859
Bariarpur Munger 862
Rangra Chowk Bhagalpur 863
Bakhtiarpur Patna 864
Ghorasahan Purba Champaran 864
Sabour Bhagalpur 864
Naugachhia Bhagalpur 864
Munger Munger 865
Koilwar Bhojpur 865
Tetia Bombar Munger 867
Banjaria Purba Champaran 867
Dinapur-cum-Khagaul Patna 868
Shambhuganj Banka 868
20"'"

1 2 3
Arrah Bhojpur 869
Musahri Muzaffarpur 869
Raxaul Purba Champaran 870
Athmalgola Patna 870
Bihpur Bhagalpur 871
Gogri Khagaria 872
Jagdishpur Bhojpur 872
If one takes into account only urban areas of the state i.e. Municipal Corporations, Municipalities, Notified Area Committees, Cantt. Boards and Census Towns etc., the overall position with regard to sex ratio, as returned during 2001 Census, can be viewed from Table-6 placed at Annexure - VI. The twenty five top ranking towns of the state in terms of sex ratio are listed below :
Name of Town Name of District Sex ratio
1 2 3
Barauli (NA) Gopalganj 1026
Maharajganj (NA) Siwan 983
Nabinagar (NA) Aurangabad 950
Ghoghardiha (NA) Madhubani 943
Hisua (NA) Nawada 941
Marhaura (NA) Saran 937
Revelganj (M) Saran 934
Jhanjharpur (NA) Madhubani 933
Mohiuddinagar (NA) Samastipur 929
Koath (NA) Rohtas 929
Kataiya (NA) Gopalganj 928
Mahnar Bazar (M) Vaishali 927
Mirganj (NA) Gopalganj 925
Chanpatia (NA) Pashchim Champaran 925
Silao (NA) Nalanda 925
Jagdishpur (M) Bhojpur 924
Nokha (NA) Rohtas 922
Jamhaur (NA) Aurangabad 920
Warisaliganj (NA) Nawada 919
Tikari (M) Gaya 916
Makhdumpur (NA) Jehanabad 916
Lalganj (M) Vaishali 916
Dighwara (NA) Saran 912
Shahpur (NA) Bhojpur 912
Daudnagar (M) Aurangabad 910
21
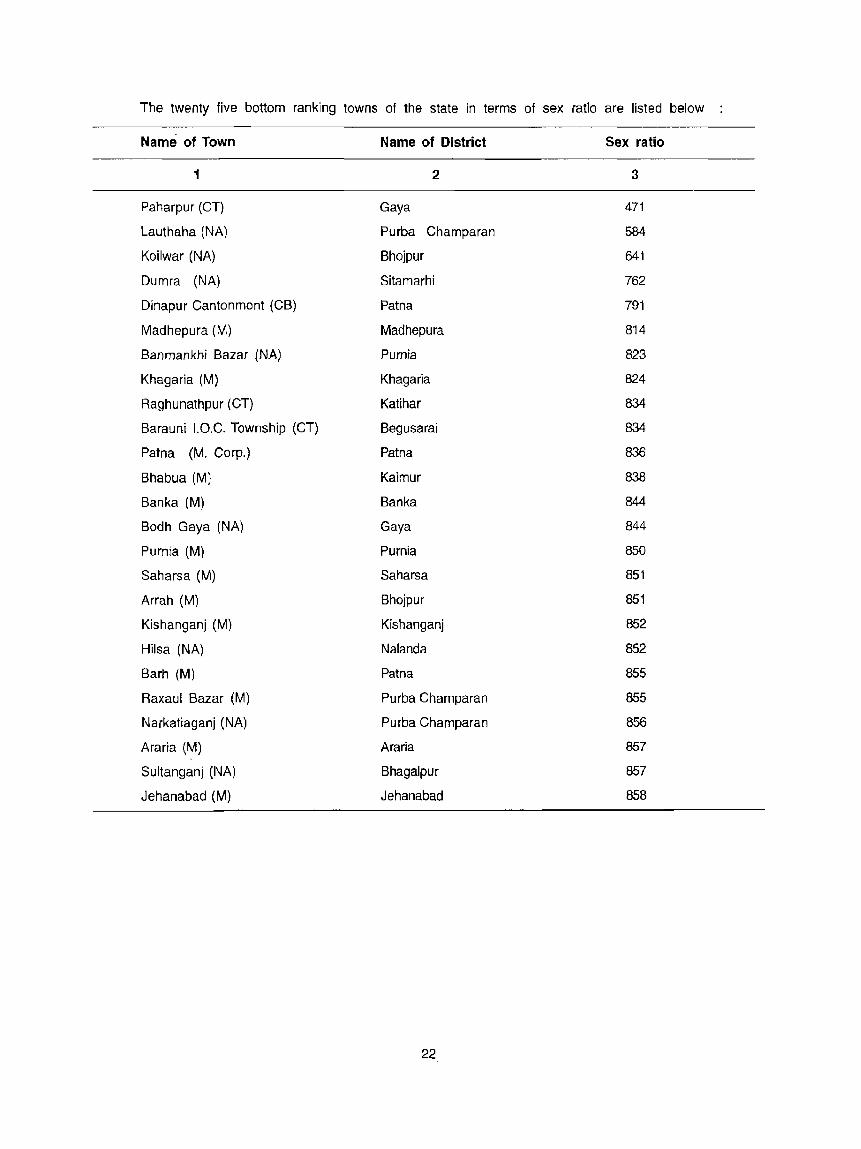
The twenty five bottom ranking towns of the state in terms of sex ratio are listed below
Name of Town Name of District Sex ratio
1 2 3
Paharpur (CT) Gaya 471
Lauthaha (NA) Purba Champaran 584
Koilwar (NA) Bhojpur 641
Dumra (NA) Sitamarhi 762
Dinapur Cantonment (CB) Patna 791
Madhepura (M) Madhepura 814
Banmankhi Bazar (NA) Pumia 823
Khagaria (M) Khagaria 824
Raghunathpur (CT) Katihar 834
Barauni I.O.C. Township (CT) Begusarai 834
Patna (M. Corp.) Patna 836
Bhabua (M) Kaimur 838
Banka (M) Banka 844
Bodh Gaya (NA) Gaya 844
Purnia (M) Purnia 850
Saharsa (M) Saharsa 851
Arrah (M) Bhojpur 851
Kishanganj (M) Kishanganj 852
Hilsa (NA) Nalanda 852
Barh (M) Patna 855
Raxaul Bazar (M) Purba Champaran 855
Narkatiaganj (NA) Purba Champaran 856
Araria (M) Araria 857
Sultanganj (NA) Bhagalpur 857
Jehanabad (M) Jehanabad 858
22

LITERACY RATES 'BY SEX AND RURAL-URBAN BREAK UP IN DISTRICT AND COMMUNITY DEVELOPMENT BLOCKS
The literacy rates of the state and its districts, according to provisional population figures of 2001 Census, have been presented and discussed in detail in paper - 1 of 2001.
In this paper, the literacy rates by sex and residential status at the district and community development block level have been presented in Table-5 placed at Annexure-V.
The overall literacy rate for the state of Bihar is 47.53 percent , while the literacy for the country as a whole in 2001 Census is 65.38 percent. Out of 37 district~ in the state, there are as many as 19 districts where literacy rates have been found to be higher than the state average of 47.53. The district of Patna has a literacy rate as high as 63.82 percent, close[y followed by Rohtas (62.36%) and Munger (60.11 %) districts. The lowest literacy rate of 31.02 percent has been registered in Kishanganj district during 2001 Census. [f the rural-urban composition of the population with reference to literacy is considered, it can be seen from Table - 5, placed at Annexure - V, that 72.71 percent population has been returned as literate in urban areas of Bihar while only 44.42 percent has been found to be literate in the rural areas.
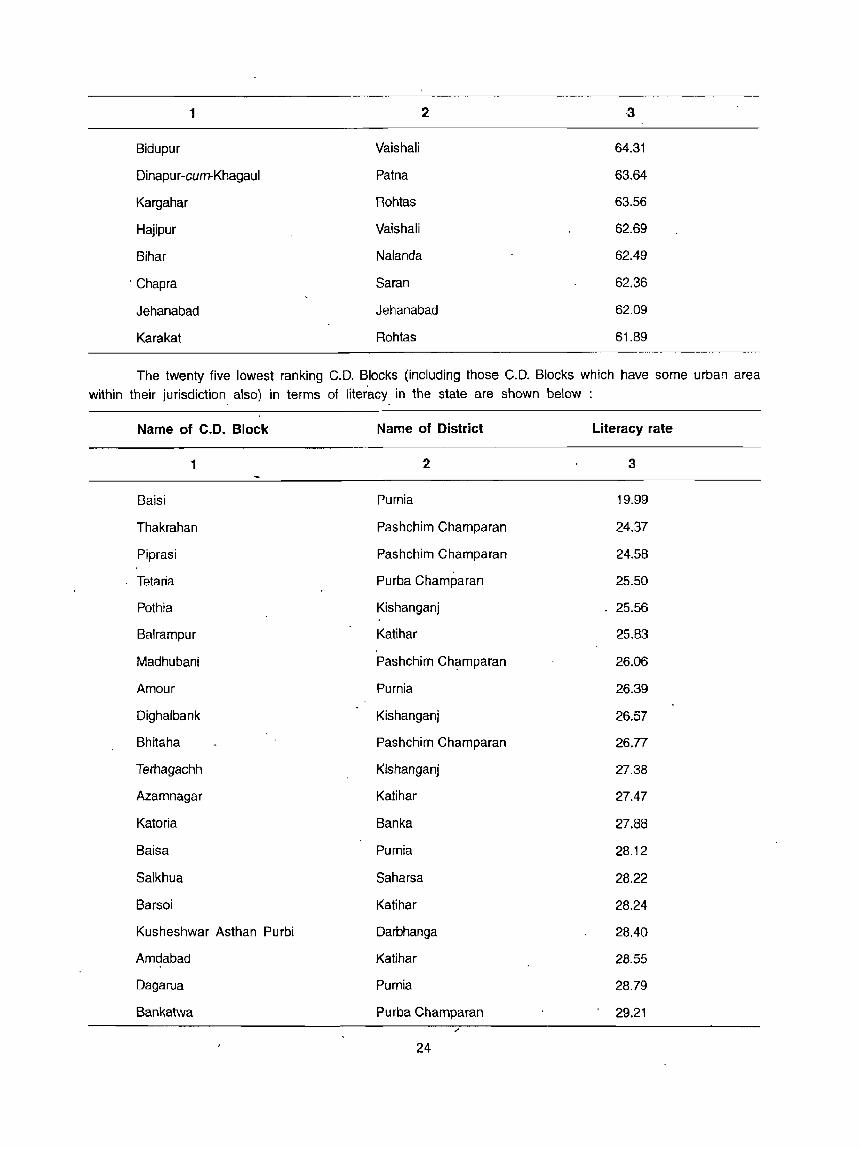
The twenty five best performing C.D. Blocks (inc[uding those C.D. Blocks which have some urban area within their jurisdiction also) of the state in terms of literacy rates are listed below :
Name of C.D. Block Name of District Percentage of literacy
1 2 3 .
Patna Rural (a) Patna ,'.
84.76
Jamalpur . Munger 75.09
Gaya Town C.D.Block Gaya 72.41
Dehri Rohtas 71.10
Arrah Bhojpur 70.33
Patna Rural (b) Patna 68.96
Musahri Muzaffa.tpur 68.61
Aurangabad Aurangabad 68.23
Sasaram Rohtas 68.21
Munger Munger 67.97
Sanjhauli Rohtas 67.65
Bettiah . Pashchim Champaran 67.27
Jagdishpur Bhagfllpur 67.10
Phulwari Patna 65.56
Katihar Katihar 65.47
Bikramganj Rohtas 65.10
·Dumraon Buxar 64.38
1 2 ,3
Bidupur Vaishali 64.31
Dinapur-cum-Khagaul Patna 63.64
Kargahar Rohtas 63.56
Hajipur Vaishali 62.69
Bihar Nalanda 62.49
. Chapra Saran 62.36
Jehanabad Jehanabad 62.09
Karakat Rohtas 61.89
The twenty five lowest ranking C.D. Blocks (including those C.D. Blocks which have some urban area
within their jurisdiction also) in terms of literacy in the state are shown below
Name of C.D. Block
1
Baisi
Thakrahan
Piprasi
Tetaria
Pothia
Balrampur
Madhubani
Amour
Dighalbank
Bhitaha
Terhagachh
Azamnagar
Katoria
Baisa
Salkhua
Barsoi
Kusheshwar Asthan Purbi
Amdabad
Dagarua
Bankatwa
Name of District
2
Purnia
Pashchim Champaran
Pashchim Champaran
Purba Champaran
Kishanganj
Katihar
Pashchim Ch?mparan
Purnia
Kishanganj
Pashchim Champaran
Kishanganj
Katihar
Banka
Purnia
Saharsa
Katihar
Darbhanga
Katihar
Purnia
Purba Champaran
24
Literacy rate
3
19.99
24.37
24.58
25.50
25.56
25.83
26.06
26.39
26.57
26.77
27.38
27.47
27.88
28.12
28.22
28.24
28.40
28.55
28.79
29.21

1 2 3
Bithan Samastipur 29.31
Kochadhamin Kishanganj 29.44
Sri nagar Purnia 29.58
Tariani Chowk Sheohar 30.18
Palasi Araria 30.30
As has been mentioned earlier also, if the rural-urban composition of the population in relation to literacy is. considered, it can be seen from Table-S that in the state of Bihar, 72.71 percent of population has been returned as literate in urban areas, while only'44.42 percent of population has been found to be literate In rural areas.
If only rural areas of the state ar~ taken into consideration, the twenty five best performing C.D. Blocks
are listed below :
Name of C.O. Block Name of District Percentage of literacy
"I 2 3
Sanjhauli Rohtas 67.65
Bidupur Vaishali 64.31
Jamalpur Munger 63.93
Dehri Rohtas 63.58
Kargahar Rohtas 63.56
Bikramganj Rohtas 62.73
Phulwari Patna 61.93
Karakat Rohtas 61.89
Akorhi Gola Rohtas 61.61
Nasriganj Rohtas 6;.36
Mohania Kaimur 6; .35
Tarari Bhojpur 61.07
Kudra Kaimur 60.99
Kochas Rohtas 60.74
Sampatchak Patna 60.74
Sasaram Rohtas 60.72
Bihta Patna 60.70
Barun Al!rangabad 60.64
ohtas 60.53
60.45
25

1 2 3
Udwant Nagar Bhojpur 60.43
Rajpur Rohtas 60.34
Ramgarh Kaimur 60.29
Buxar Buxar 60.28
Kaler Jehanabad 60.27
While the twenty five lowest ranking C.D. Blocks are indicated as under:
Name of C.D. Block Name of District Percentage of literacy
1 2 3
Baisi Purnia 19.99
Thakrahan Pashchim Champaran 24.37
Piprasi Pashchim Champaran 24.58
Tetaria Pu rba Champaran 25.50
Pothia Kishanganj 25.56
Balrampur Katihar 25.83
Madhubani Pashchim Champaran 26.06
Amour Purnia 26.39
Dighalbank Kishanganj 26.57
Bhitaha Pashchim Champaran 26.77
Terhagachh Kishanganj 27.38
Barsoi Katihar 27.40
Azamnagar Katihar 27.47
Thakurganj Kishanganj 27.75
Katoria Banka 27.88
Kishanganj Kishanganj 27.91
Baisa Purnia 28.12
Salkhua Saharsa 28.22
Kusheshwar Asthan Purbi Darbhanga 28.40
Amdabad Katihar 28.55
Bahadurganj Kishanganj 28.78
Dagarua Purnia 28.79
Bankatwa Purba Champa ran -29.;21 t·
Bithan Samastipur 29.31
Kochadhamin Kishanganj 29.4.4
26

Similarly, the twenty five best performing C.D. Blocks in the urban areas of the state are as follows:
Name of C.D. Block Name of District Percentage of literacy
1 2 3
Samastipur Samastipur 85.24
Patna Rural (a) Patna 85.10
Jamalpur Munger 84.39
Asarganj Munger 81.44
Musahri Muzaffarpur 80.97
Motihari Purba Champaran SO.59
Aurangabad Aurangabad SO.46
Dumraon Buxar 80.45
Tikari Gaya 79.15
Begusarai Begusari 78.79
Gaya Town C.D. Block Gaya 7S.72
Arrah Bhojpur 78.02
Dehri Rohtas 77.94
Bhabua Kaimur 77.74
Nawada Nawada 77.54
Bettiah Pashchim Champaran 77.27
Pupri Sitamarhi 77.15
Sasaram Rohtas 77.11
Khagaria Khagaria 77.01
Darbhanga Darbhanga 75.63
Dumra Sitamarhi 75.54
Munger Munger 75.44
Katihar Katihar 75.30
Jehanabad Jehanbad 75.26
Purnia East Purnia 74.80
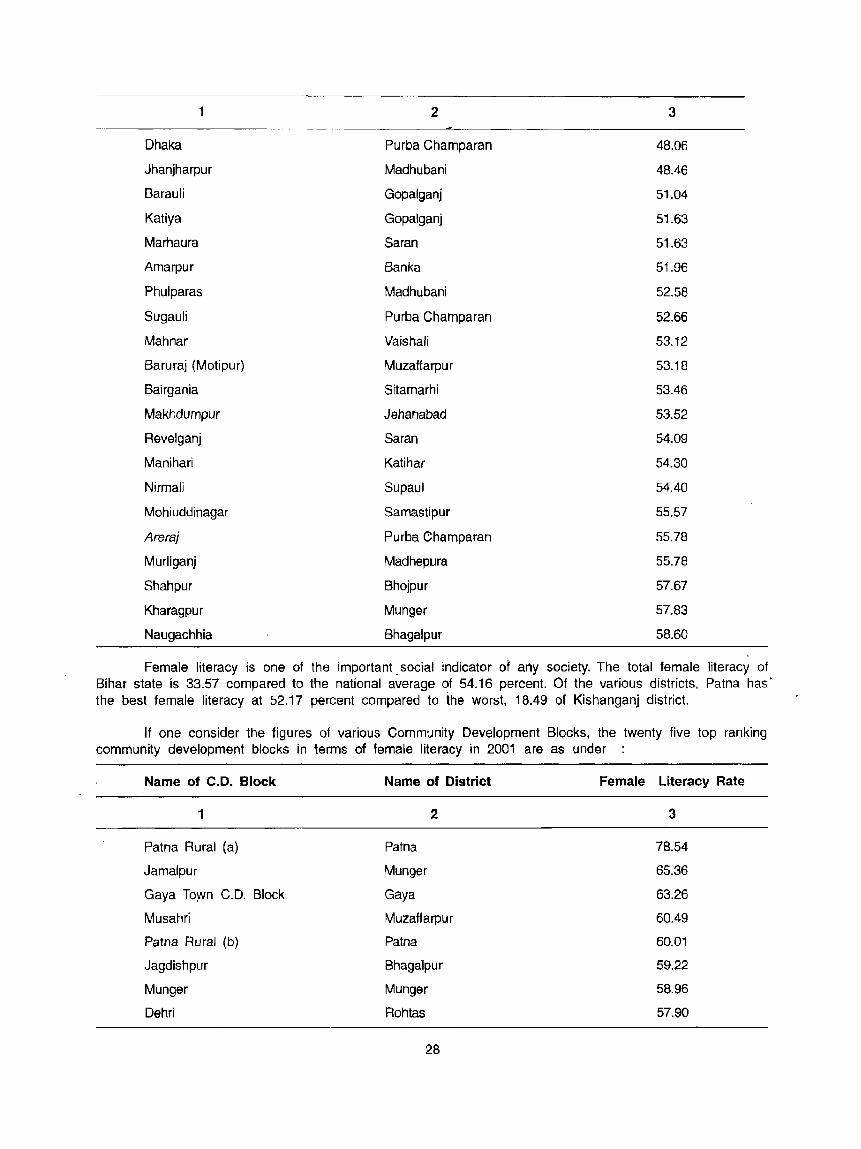
On the other hand the twenty five lowest ranking C.D. Blocks in the urban areas of the state are listed below:
Name of C.D. Block Name of District Percentage of literacy
1 2 3
Belsand Sitamarhi 41.45
Bahadurganj Kishanganj 42.40
Sheohar Sheohar 43.93
Bagaha Pashchim Champaran 47.31
27
1 2 3
Dhaka Purba Champaran 48.06
Jhanjharpur Madhubani 48.46
Barauli Gopalganj 51.04
Katiya Gopalganj 51.63
Marhaura Saran 51.63
Amarpur Banka 51.96
Phulparas Madhubani 52.58
Sugauli Purba Charnparan 52.66
Mahnar Vaishali 53.12
Baruraj (Motipur) Muzaffarpur 53.18
Bairgania Sitamarhi 53.46
Makhdumpur Jehanabad 53.52
Revelganj Saran 54.09
Manihari Katihar 54.30
Nirmali SupauJ 54.40
Mohiuddinagar Samastipur 55.57
Areraj Purba Champaran 55.78
Murliganj Madhepura 55.78
Shahpur Bhojpur 57.67
Kharagpur Munger 57.83
Naugachhia Bhagalpur 58.60
Female literacy is one of the important. social indicator of any society. The total female literacy of Bihar state is 33.57 compared to the national average of 54.16 percent. Of the various districts, Patna has' the best female literacy at 52.17 percent compared to the worst, 18.49 of Kishanganj district.
If one consider the figures of various Community Development Blocks, the twenty five top ranking community development blocks in terms of female literacy in 2001 are as under :
Name of C.D. Block Name of District Female Literacy Rate
1 2 3
Patna Rural (a) Patna 78.54
Jamalpur Munger 65.36
Gaya TOyJn C.D. Block Gaya 63.26
Musahri Muzaffarpur 60.49
Patna Rural (b) Patna 60.01
Jagdishpur Bhagalpur 59.22
Munger Munger 58.96
Dehri Rohtas 57.90
2B
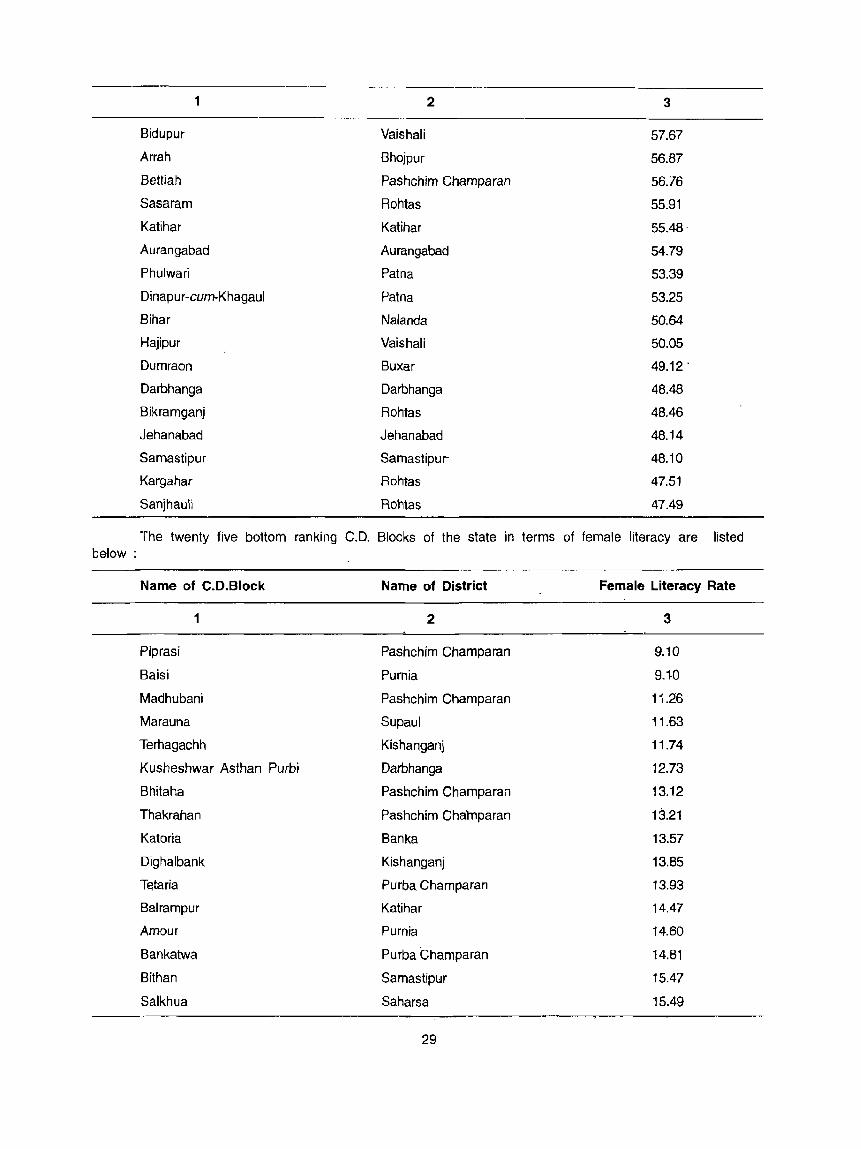
1 2 3
Bidupur Vaishali 57.67
Arrah Bhojpur 56.87
Bettiah Pas he him Champa ran 56.76
Sasaram Rohtas 55.91
Katihar Katihar 55.48·
Aurangabad Aurangabad 54.79
Phulwari Patna 53.39
Dinapur-cum-Khagaul Patna 53.25
Bihar Nalanda 50.64
Hajipur Vaishali 50.05
Dumraon Buxar 49.12 .
Oarbhanga Oarbhanga 48.48
Bikramganj Rohtas 48.46
jehanabad jehanabad 48.14
Samastipur Samastipur- 48.10
Kargahar Rohtas 47.51
Sanjhauli Rotltas 47.49
The twenty five bottom ranking C.O. Blocks of the state in terms of female literacy are listed below:
Name of C.D.Block Name of District Female Literacy Rate
1 2 3
Piprasi Pashehim Champa ran 9.10
Baisi Purnia 9.1-0
Madhubani Pashehim Champa ran 11.26
Marauna Supaul 11.63
Terhagachh Kishanganj 11.74
Kusheshwar Asthan Purbi Oarbhanga 12.73
Bhitaha Pashchim Champaran 13.12
Thakrahan Pashchim Cha'tnparan 13.21
Katoria Banka 13.57
Dighalbank Kishanganj 13.85
T~taria Purba. Champaran 13.93
Balrampur Katihar 14.47
Amour Purnia 14.60
Bankatwa Purba Champaran 14.81
Bithan Samastipur 15.47
Salkhua Saharsa 15.49
29
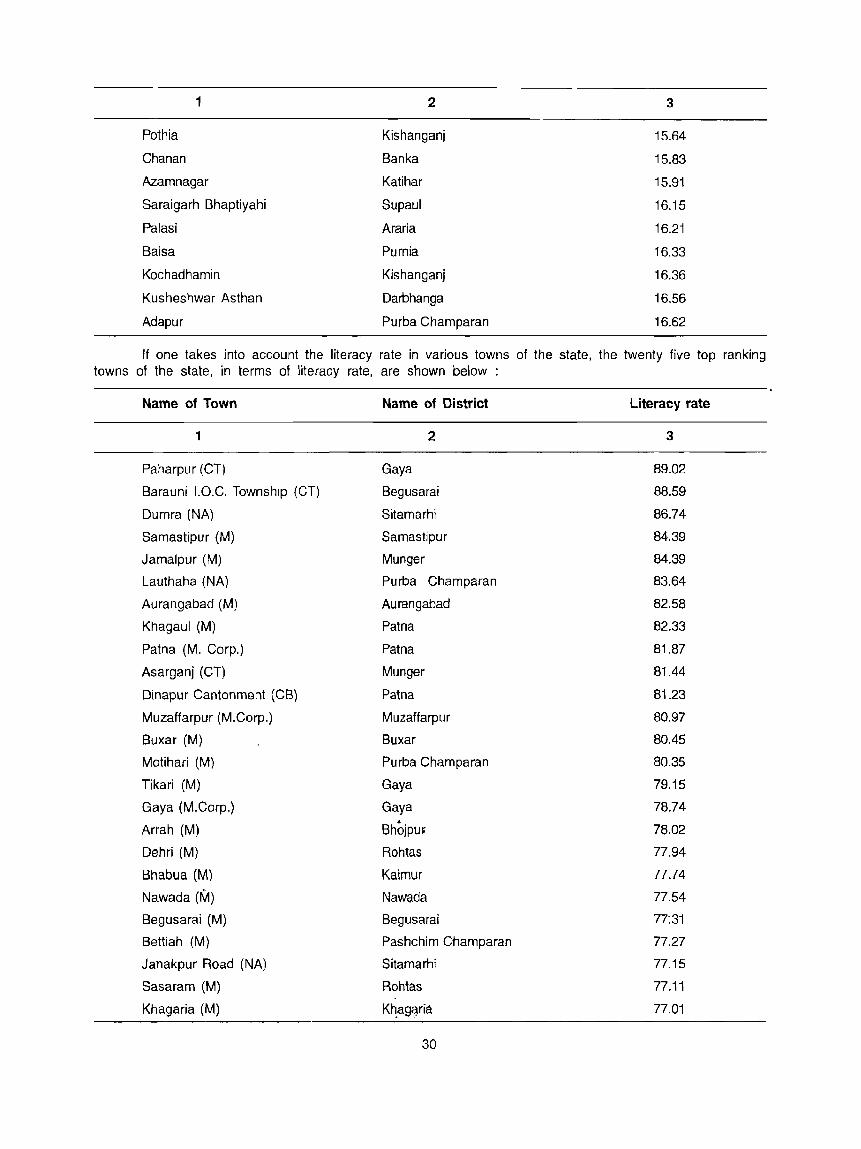
1 2 3
Pothia Kishanganj 15.64
Ghanan Banka 15.83
Azamnagar Katihar 15.91
Saraigarh Bhaptiyahi Supaul 16.15
Palasi Araria 16.21
Baisa Purnia 16.33
Kochadharnin Kishanganj 16.36
Kusheshwar Asthan Darbhanga 16.56
Adapur Purba Champaran 16.62
If one takes into account the literacy rate in various towns of the state, the twenty five top ranking towns of the state, in terms of literacy rate, are shown below :
Name of Town Name of District Literacy rate
1 2 3
Paharpur (GT) Gaya 89.02
Barauni I.O.C. Township (GT) Begusarai 88.59
Dumra (NA) Sitamarhi 86.74
Samastipur (M) Samastipur 84.39
Jamalpur (M) Munger 84.39
Lauthaha (NA) Purba Champaran 83.64
Aurangabad (M) Aurangabad 82.58
Khagaul (M) Patna 82.33
Patna (M. Corp.) Patna 81.87
Asarganj (CT) Munger 81.44
Dinapur Cantonment (CB) Patna 81.23
Muzaffarpur (M.Gorp.) Muzaffarpur 80.97
Buxar (M) Buxar 80.45
Motihari (M) Purba Champaran 80.35
Tikari (M) Gaya 79.15
Gaya (M.Gorp.) Gaya 78.74
Arrah (M) Bhojpu~ 78.02
Dehri (M) Rohtas 77.94
Bhabua (M) Kaimur 77.74
Nawada (M) Nawada 77.54
Begusarai (M) Begusarai 77:31
Bettiah (M) Pashchim Champaran 77.27
Janakpur Road (NA) Sitamarhi 77.15
Sasaram (M) Rohtas 77.11
Khagaria (M) K~ag~ria 77.01
30
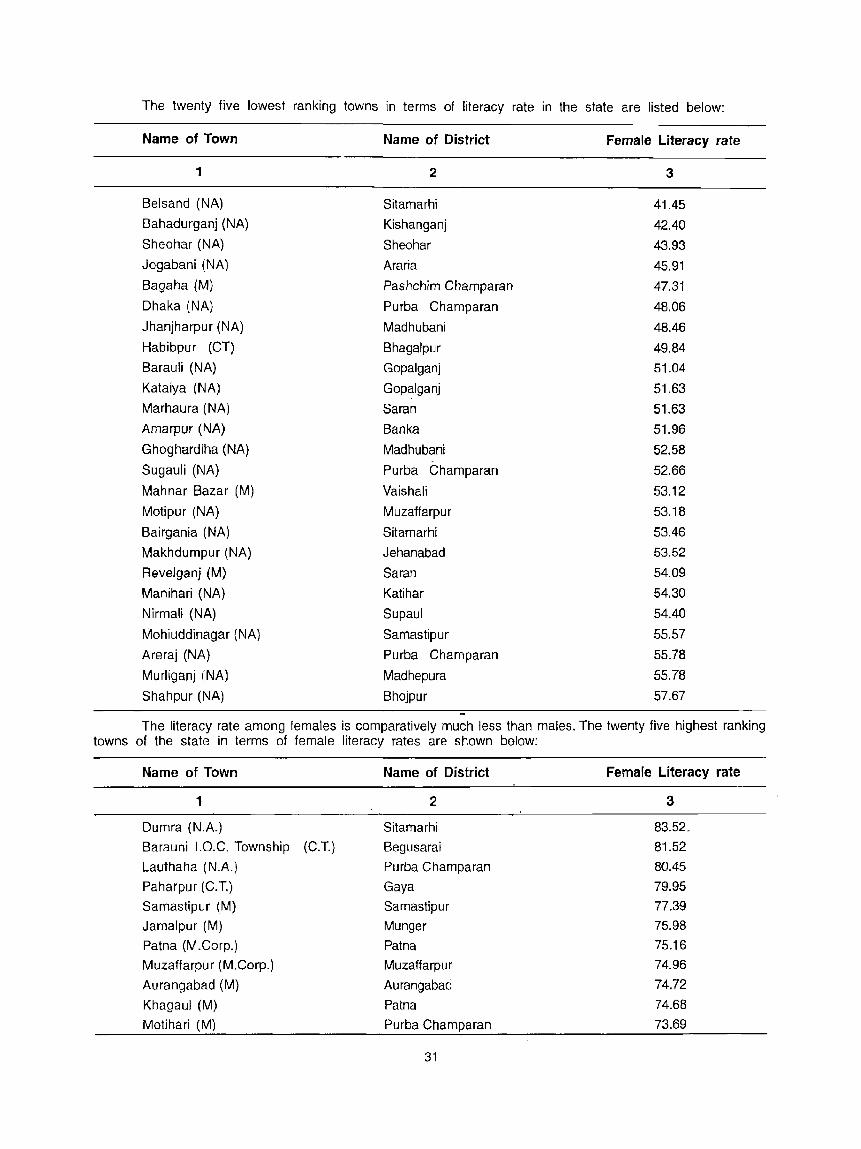
The twenty five lowest ranking towns in terms of literacy rate in the state are listed below:
Name of Town Name of District Female Literacy rate
1 2 3
Belsand (NA) Sitamarhi 41.45
Bahadurganj (NA) Kishanganj 42.40
Sheohar (NA) Sheohar 43.93
Jogabani (NA) Araria 45.91
Bagaha (M) Pashchim Champaran 47.31
Dhaka (NA) Purba Champaran 48.66
Jhanjharpur (NA) Madhubani 48.46
Habibpur (CT) Bhagalpur 49.84
Barauli (NA) Gopalganj 51.04
Kataiya (NA) Gopalganj 51.63
Marhaura (NA) Saran 51.63
Amarpur (NA) Banka 51.96
Ghoghardiha (NA) Madhubani 52.58
Sugauli (NA) Purba Champaran 52.66
Mahnar Bazar (M) Vaishali 53.12
Motipur (NA) Muzaffarpur 53.18
Bairgania (NA) Sitamarhi 53.46
Makhdumpur (NA) Jehanabad 53.52
Revelganj (M) Saran 54.09
Manihari (NA) Katihar 54.30
Nirmali (NA) Supaul 54.40
Mohiuddinagar (NA) Samastipur 55.57
Are raj (NA) Purba Champaran 55.78
Murliganj (NA) Madhepura 55.78
Shahpur (NA) Bhojpur 57.67
The literacy rate among females is comparatively much less than males. The twenty five highest ranking towns of the state in terms of female literacy rates are shown below:
Name of Town Name of District Female Literacy rate
1 2 3
Dumra (N.A.) Sitamarhi 83.52_
Barauni I.O.C. Township (C.T.) Begusarai 81.52
Lauthaha (N.A.) Purba Champaran 80.45
Paharpur (C.T.) Gaya 79.95
Samastipur (M) Samastipur 77.39
Jamalpur (M) Munger 75.98
Patna (M.Corp.) Patna 75.16
Muzaffarpur (M.Corp.) Muzaffarpur 74.96
Aurangabad (M) Aurangabad 74.72
Khagaul (M) Patna 74.68
Motihari (M) Purba Champaran 73.69
31
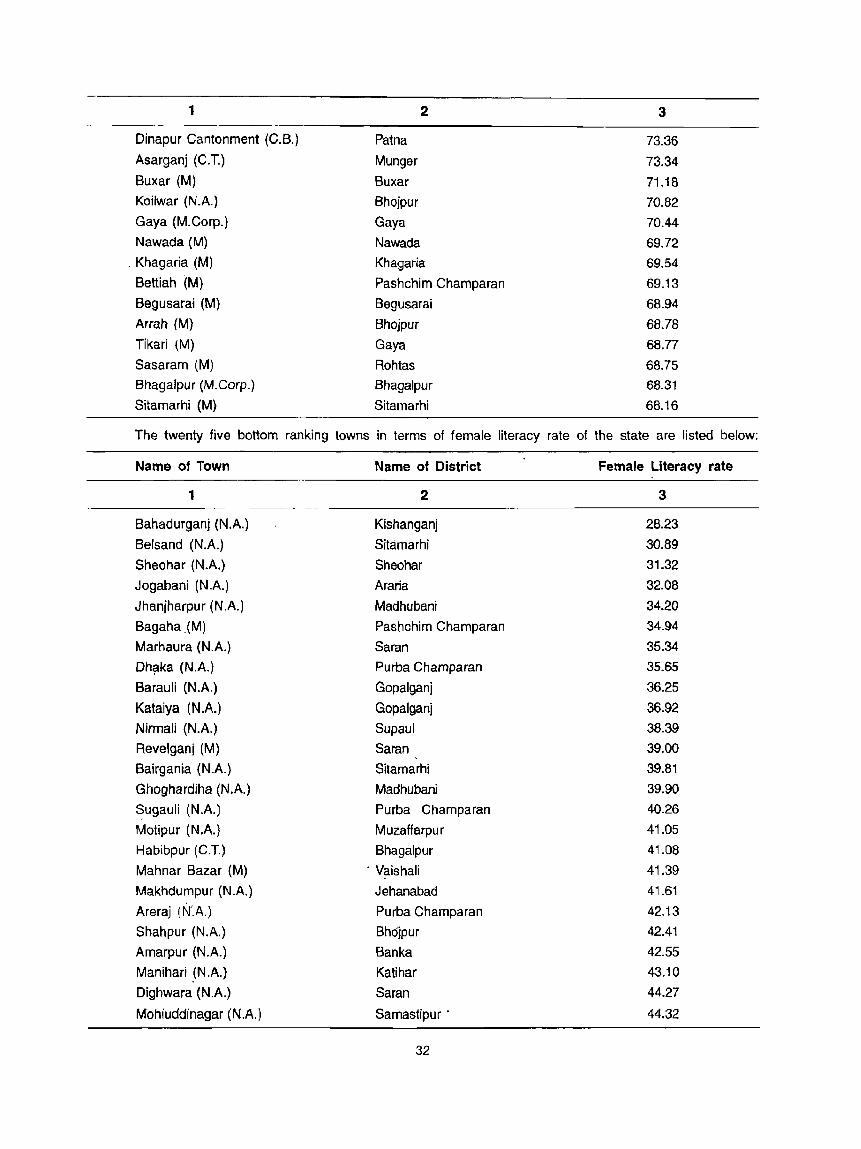
1 2 3
Dinapur Cantonment (C.B.) Pa1na 73.36
Asarganj (C.T.) Munger 73.34
Buxar (M) Buxar 71.18 Koilwar (N.A.) Bhojpur 70.82
Gaya (M.Corp.) Gaya 70.44
Nawada (M) Nawada 69.72
. Khagaria (M) Khagaria 69.54
Bettiah (M) Pashchim Champa ran 69.13
Begusarai (M) Begusarai 68.94
Armh (M) Bhojpur 68.78
Tikari (M) Gaya 68.77
Sasaram (M) Rohtas 68.75
Bhagalpur (M.Corp.) Bhagalpur 68.31
Sitamarhi (M) Sitamarhi 68.16
The twenty five bottom ranking towns in terms of female literacy rate of the state are listed below:
Name of Town Name of District Female Literacy rate
1 2 3
Bahadurganj (N.A.) Kishanganj 28.23
Belsand (N.A.) Sitamarhi 30.89
Sheohar (N.A.) Sheohar 31.32
Jogabani (N.A.) Araria 32.08
Jhanjharpur (N.A.) Madhubani 34.20
Bagaha.(M) Pashchim Champa ran 34.94
Marhaura (N.A.) Saran 35.34
Dh~ka (N.A.) Purba Champaran 35.65
Barauli (N.A.) Gopalganj 36.25
Kataiya (N .A.) Gopalganj 36.92
Nirmali (NA) Supaul 38.39
Revelganj (M) Saran 39.00
Bairgania (N.A.) Sitamarhi 39.81
Ghoghardiha (N.A.) Madhubani 39.90
~ugauli (N.A.) Purba Champaran 40.26
Motipur (N.A.) Muzaffarpur 41.05
Habibpur (C.T.) Bhagalpur 41.08
Mahnar Bazar (M) . Vaishali 41.39
Makhdumpur (N.A.) Jehanabad 41.61
Areraj (r\J'.A.) Purba Champaran 42.13
Shahpur (N.A.) Bh6jpur 42.41
Amarpur (N.A.) Banka 42.55
Manihari (N.A.) Katihar 43.10
Dighwara (N.A.) Saran 44.27
Mohiuddinagar (N.A.) Samastipur . 44.32
32

CITY (HAVING ONE MILLION PLUS POPULATION)
Patna, the headquarters of the district as well as the capital of the state, is the largest city in Bihar, having a population of million plus (more than 10 lakhs) as per the provisional population figures of 2001 Census. The position of Patna among the cities of India, so far as population is concerned, is quite low. The city has a glorious past and can boast of a very rich cultural heritage. In the early nineteenth century Buchanan Hamilton (1807-14) estimated its population at 312,000. At the Census of 1872, however, the population actually returned was 158,900 only. It seems that there were large omissions at this Census and the actual number was perhaps more. At the next Census (1881) also. the population returned was 170,654 only. Between 1881 and 1921 the population of Patna was almost continuously on the decline mainly due to decrease in the riverborne trade and. perhaps, due to repeated epidemics of plague. The population recorded during the Census of 1911 was 136.153 which marked a slight increase over the 1901 population of 134,785. but the 1901 figure waS admittedly low because of the virulent plague which was raging at the time of Census. A recount made six months later disclosed the population of this town as 153,739. In 1921 the population of Patna was at its lowest (119,976). It had continued to fall in the decade 1911-21 inspite of the fact that the New Capital area had been set up consequent upon designation of the city as the capital of the newly created Bihar Province. Perhaps the figures of 1921 were, to some extent. affected by the Non-Co-operation Movement also. Since 1921. however. the city has witnessed a steady growh In 1931 its population stood at 159,690, an increase of over 33 percent, attributable mainly to the rapid development of the New Capital area and Bankipur area, extension of the University and large influx of immigrants. In the following decade (1931-41) also, the increase continued uninterrupted but at a slower pace (23 per cent). High decadal increase occurred in 1941-51 when the population increased by 44.33 percent. This naturally reflected the rapid expansion of several Government departments and semi-Government agencies no less than the beginnings of a developing urban economy and expansion of trade and commerce in the post-war and post,independence era. A~ sizeable population of displaced persons from West Punjab and East Bengal must have contributed substantially to the high rate of increase. In the decade 1951-61. the trend had been maintained though the rate of percentage increase had gone down to 28.61. In absolute numbers, however, the increase in the decade 1951-61 was not much less than in 1941-51 (source: General Report, Bihar, 1961 Census). The rate of growth of population in the decade 1961-71 was more or less the same as in the previous decade ~hough Patna City was upgraded to the status of Municipal Corporation. However, the decade 1971-81 had shown highest decadal increase in the 20th century when population of Patna City increased by 64.14 percent. This reflected the rapid extension of the Municipal jurisdiction as many rural areas got merged in the city area. The percentage decadal variation during 1981-91 was significantly low. That the rate was not higher is presumably due to the fact that Patna owed its importance mainly to its being an administrative and educational town. It 9an hardly bo~st of any significant development in industrial or commercial sector during the deca,de.
During the present decade i.e. in 1991-2001, the city of Patna has again shown comparativ~ly higher decadal growth rate (50.12%). In 1911. the geographical area of Patna was mentioned as only 23.04 km2 while it has increased to 99.45 km2 in 2001 Census.
At the 1961 Census •. the concept of Town Group was adopted to obtain a broad picture relating to urban spread. This was defined in 1971 with the concept of 'Urban Agglomeration' to obtain better feed back in regard to urban contiguity, processes and trends of urbanisation and other related matters. This concept, without any modification or change, has remained operative in all successive Censuses as already explained in beginning paragraphs of this paper.
In several areas around a core city or statutory town. fairly large and well recognised railway colony, university campus, military camp etc. would have come up. Even if such places are lying outside the statutory limits of the Corporation, Municipality or Cantonment ~tc., in most ot the cases they fall within the revenue limits of the village(s) which is (or are) contiguous to the town. Each such individual area by itself may not satisfy the minimum population limit to qualify it to be treated as an independent urban unit but may deserve to be clubbed with the town as a continuous urban spread. Such areas have been termed as 'Outgrowths' (OGs)

and reckoned alognwith the town. As already defined earlier, such town, together with its outgrowth(s), is treated as integrated urban area and is designated as an 'Urban Agglomeration'.
Patna Urban Agglomeration is the mqst important agglomeration in the state ot Bihar and its population
is more than 10 lakhs (million plus) according to provisional population figures of Census of India 2001.
The population of Patna Urban Agglomeration and its decadal growth ra,te during various decades (on the present jurisdiction) have be~n shown in the statement presented below :
Name of UA Year Persons Oecadal variation Decadal variation '(absolute) (percentage)
Patna Urban 1901 180025 Agglomeration
1911 176688 - 3337 - 1.85
1921 158048 - 18640 - 10.55
1931 201540 + 43492 + 27.52
1941 245267 + 43727 + 21.70
1951 341911 + 96644 + 39.40
1961 435360 + 93449 + 27.33
1971 575476 + 140116 + 32.18
1981 953064 + 377588 + 65.61
1991 1140100 + 187036 + 19.62
2001 1707429 + 567329 + 49.76
Patna Urban Agglomeration consists of 5 statutory Towns and 6 Outgrowths as per 2001 Census. puring
present Census one Municipal town and 4 'outgrowths have been included in Patna Urban Agglomeration . It can be seen from the statement above that during the decade 1991-2001, the growth rate of Patna Urban
Agglomeration is 49.76 percent and the population recorded at the 2001 Census is 1,707,429.
The constituent units of Patna Town Group in 1961 and Patna Urban Agglomeration since 1971 Census
are indicated below :
(i) 1961 Census a) i. Patna (M. Corp.) ii. Pataliputra Housing Colony (OG)
(ii) 1971 Census a) i. Patna (M. Corp.) ii. Pataliputra Housing Colony (OG)
b) Phulwarisharif Town
(iii) 1981 Census a) i. Patna (M. Corp.) ii. Pataliputra Housing Colony (OG) iii. Digha - Mainpura (OG)
b) Dinapur Nizamat (M)
c) Dinapur Cantt. (C8) d) Phulwarisnarif (NA) _
34 _-
(iv) 1991 Census a) i. Patna (M. Corp.) ii. Pataliputra Housing Colony (OG) iii. Digha - Mainpura (OG)
b) Dinapur Nizamat (M) c) Oinapur Cantt. (CB) d) Phulwarisharif (NA)
(v) 2001 Census a) i. Patna (M. Corp.) . ii. Pataliputra Housing Colony (OG) iii. Digha - Mainpura (OG) iv. Sabazpura (OG v. Khalilpura (OG) vi. 8adalpura (OG)
b) Dinapur Nizamat (M) c) Dinapur Cantt. (CB) d) Phulwarisharif (NA) e) i. Khagaul (M)
ii. Saidpura (OG)
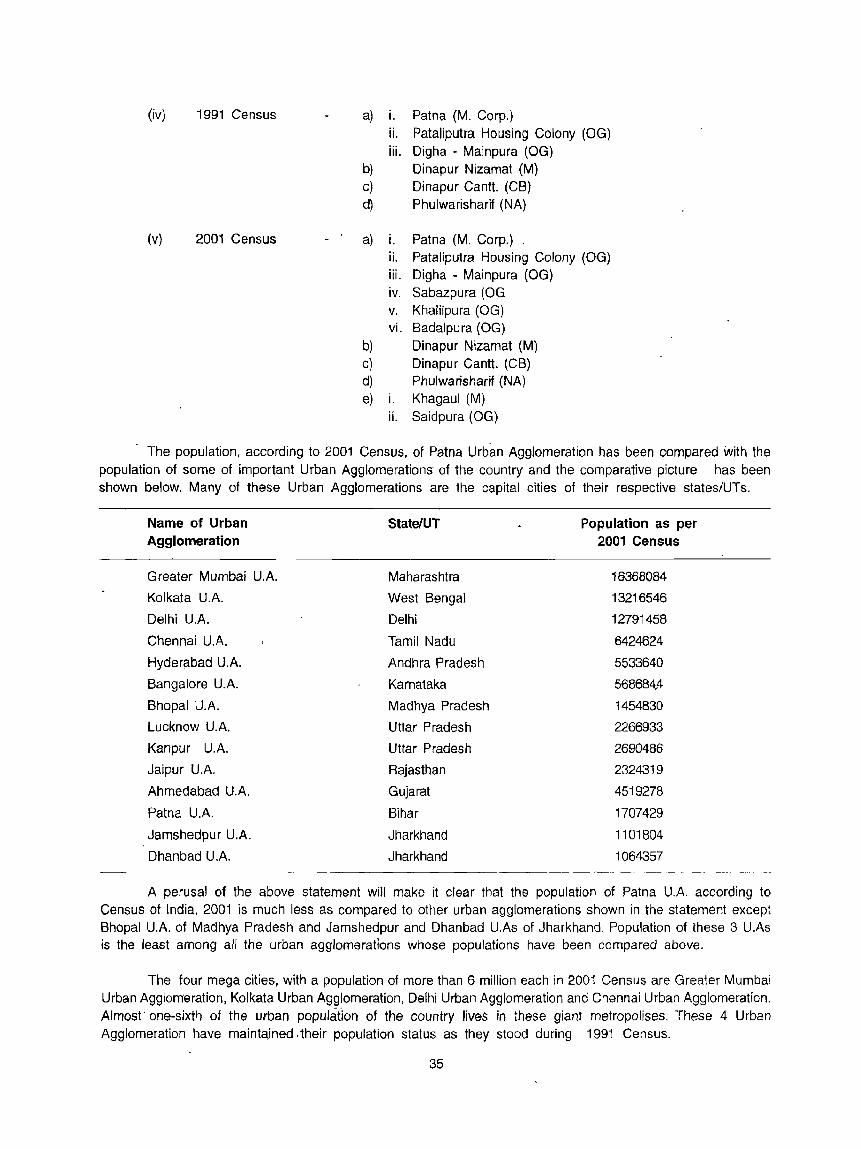
The population, according to 2001 Census, of Patna Urban Agglomeration has been compared with the population of some of important Urban Agglomerations of the country and the comparative picture has been shown below. Many of these Urban Agglomerations are the capital cities of their respective states/UTs.
Name of Urban Agglomeration
Greater Mumbai U.A.
Kolkata U.A.
Delhi U.A.
Chennai U.A.
Hyder!lbad U.A.
Bangalore U.A.
Bhopal U.A.
Lucknow U.A.
Kanpur U.A.
Jaipur U.A.
Ahmedabad U.A.
Patna U.A.
Jamshedpur U.A.
Dhanbad U.A.
StatelUT
Maharashtra
West Bengal
Delhi
Tamil Nadu
Andhra Pradesh
Karnataka
Madhya Pradesh
Uttar Pradesh
Uttar Pradesh
Rajasthan
Gujarat
Bihar
Jharkhand
Jharkhand
Population as per 2001 Census
16368084
13216546
12791458
6424624
5533640
568684,4
1454830
2266933
2690486
2324319
4519278
1707429
1101804
1064357
A perusal of the above statement will make it clear that the population of Patna UA according to Census of India, 2001 is much less as compared to other urban agglomerations shown in the statement except Bhopal U.A. of Madhya Pradesh and Jamshedpur and Dhanbad U.As of Jharkhand. Population of these 3 U.As is the least among all the urban agglomerations whose populations have been compared above.
The tour mega cities, with a population of more than 6 million each in 2001 Census are Greater Mumbai Urban Agglomeration, Kolkata Urban Agglomeration, Delhi Urban Agglomeration and Chennai Urban Agglomeration. Almost" one-sixth of the urban populcifion of the country lives in ~hese giant metropolises. These 4 Urban Agglomeration have maintajned. their population status as they stood during 1991 Census.
35


TABLES


Annexure-I
Table -1 Population, child population in the age-group 0-6 and literates by
-- resl encean sex- tate, Istnct Ity) own, 'd d S O' UAiC' rr 2001 SlatefDlstrictlUA/Cityl Civic Total! Population Child population in the Literates
Town status Rural{ age- group 0-6 of the Urban
Cityl
Town Persons Males Females Persons Males Females Persons Males Females
1 2 3 4 5 6 7 8 9 10 11 12
BIHAR STATE Total 82878796 43153964 39724632 16234539 8375532 7859007 31675607 20978955 10696652
Rural 74199596 38510686 35688910 14883794 7673648 7210146 26346880 17794140 8552740
Urban 8679200 4643278 4035922 1350745 701884 648861 5328727 3184815 2143912
PASHCHIM CHAMPARAN Total 3043044 1600853 1442191 631412 325203 306209 955828 662131 293697
DISTRICT Rural 2733561 1436667 1296894 576084 296590 279494 791904 562208 229696
Urban 309483 164186 145297 55328 28613 26715 163924 99923 64001
8agaha M Urban 91383 48455 42928 17280 8962 8318 35058 22966 12092
Ramnagar NA Urban 38549 20489 18060 7469 3891 3578 18631 11731 6900
Narkatiaganj NA Urban 40830 21994 18836 7059 3612 3447 24197 14878 9319
Chanpatia NA Urban 22029 11445 10584 4255 2115 2140 10757 6629 4128
Bettiah M Urban 116692 61803 54889 19265 10033 9232 75281 43719 31562
PURBA CHAMPARAN Total 3933636 2072350 1861286 805238 416279 388959 1193315 830346 362969
DISTRICT Rural 3682196 1937024 1745172 762442 39393:> 368507 1050833 743781 307052
Urban 251440 135326 116114 42796 22344 20452 142482 86565 55917
Motihari U. A. Urban 109250 59517 49733 15704 8230 7474 75389 44082 31307
(a) Molihari M Urban 101506 54629 46877 14910 lSi 1 7099 69576 40265 2931i
(b) Lauthaha NA Urban 7744 4888 2856 794 419 375 5813 3817 1996
R8)(aul Bazar M Urban 41347 22284 19063 7373 3863 3510 23844 14610 9234
Sugauli NA Urban 31362 16827 14535 6242 3244 2998 13228 8583 4645
Dhaka NA Urban 32618 17212 15406 6580 3441 3139 12513 8140 4373
Areraj NA Urban 20245 10618 9627 3980 2008 1972 9073 5848 3225
Chakia NA Urban 16618 8868 7750 2917 1558 1359 8435 5302 3133
SHEOHAR DISTRICT Total 514288 271261 243027 101630 52954 48676 152726 99407 53319
Rural 492961 259907 233054 97294 50699 46595 145262 94415 50847
Urban 21327 11354 9973 4336 2255 2081 7464 4992 2472
Sheohar NA Urban 21327 11354 9973 4336 2255 2081 7464 4992 2472
SITAMARHI DISTRICT Total 2669887 1410149 1259738 539288 284369 254919 839086 574344 264742
Rural 2516636 1327819 1188817 513265 270766 242499 753888 522446 231442
Urban 153251 82330 70921 26023 13603 12420 85198 51898 33300
39

State/DistricWAlCltyl Civic Totall Population Child population in the Literates
Town status Rural! age- group 0-6 01 the Urban
Cityl
Town Persons Males Females Persons Males Females Persons Males Females
1 2 3 4 5 6 7 8 9 10 11 12
Sitamarhi U.A. Urban 87268 47209 40059 13497 7157 6340 55723 33068 22655
(a)Sitamarhi M&OG Urban 72730 38960 33770 11894 6316 5578 44503 26464 18039
(i)Silamarhi M Urban 56769 30483 26286 8930 4798 4132 36756 21655 15101
(ii)RaJopatll·Dumra.Talk~"pur Dumra OG Urban 15961 8477 7484 2964 1518 1446 7747 4809 2938
(b)Dumra NA Urban 14538 8249 6289 ~603 841 762 11220 6604 4616
Bairgania NA Urban 34821 18496 16325 6829 3466 3363 14965 9805 5160
Belsand NA Urban 17821 9511 8310 3436 1760 1676 5962 3913 2049
Janakpur Road NA Urban 13341 7114 6227 2261 1220 1041 8548 5112 3436
MADHU8ANI DISTRICT Total 3570651 1837361 ·,733290 699906 361075 338831 1215742 845371 370371
Rural 3446248 1771686 1674562 679024 350182 328842 1149806 804466 345340
Urban 124403 65675 58728 20882 10893 9989 65936 40905 25031
Jainagar NA Urban 19493 10343 9150 3161 1671 1490 11357 6964 4393
Madhubani M Urban 66285 35391 30894 10792 5625 5167 38727 23670 15057
Jhanjharpur NA Urban 24102 12467 11635 4345 2273 2072 9575 6304 3271
Ghoghardiha NA Urban 14523 7474 7049 2584 1324 1260 6277 3967 2310
SUPAUL DISTRICT Total 1745069 908855 836214 364701 189821 174880 521755 382752 139003
Rural 1657175 862101 795074 349604 181773 167831 478171 354875 123296
Urban 87894 46754 41140 15097 8048 7049 43584 27877 15707
Nirmali NA Urban 16144 8521 7623 2842 1434 1408 7236 4850 2386
Blrpur NA Urban 17730 9495 8235 2727 1579 1148 9969 6162 3807
Supaul NA Urban 54020 28738 25282 9528 5035 4493 26379 16865 9514
MARIA DISTRICT Total 2124831 1108924 1015907 449343 228476 220867 585379 409365 176014 ~.
Rural 1992293 1037973 954320 425890 216452 2.09438 518070 368049 150021 _. "'rban 132538 70951 61587 23453 12024 11429 67309 41316 25993
Jugabani NA Urban 29962 15952 14010 5821 3004 2817 11083 7492 3591
Forbesganj M Urban 41982 22370 19612 6644 3391 3253 25730 15051 10679
Araria M Urban 60594 32629 27965 10988 5629 5359 30496 18773 11723
KISHANGANJ DISTRICT Tot21 1294063 666910 627153 280498 144501 135997 314389 223586 90803
Rural 1165057 597760 567297 257000 132442 124558 251395 184084 67311
Urban 129006 69150 59856 23498 12059 11439 62994 39502 23492
Thakurganj NA Urban 15288 8075 7213 2573 1328 . 1245 8261 5063 3198
40

State/DistrictlUAlCityl Civic TotalJ Population Child population in the Literates Town status Rural! age- group 0-6
of the Urban -Cityl
Town Persons Males Females Persons Males Females Persons Males Females 1 2 3 4 5 6 7 8 9 10 11 12 .
B"hadurganj NA Urban 28224 14911 13313 5863 3018 2845 9482 6527 2955
Kishanganj M Urban 85494 46164 39330 15062 7713 7349 45251 27912 17339
PLJRNIA DISTRICT Total 2540788 1325794 1214994 536851 272748 264103 711634 486083 225551
Rural 2318848 1205927 1112921 500828 254128 246700 578046 405839 172207
Urban 221940 119867 102073 36023 18620 17403 133588 80244 53344
Pumia U.A. Urban 196757 106051 90706 31494 16235 15259 120498 71865 48633
(a) Pumia M Urban 171235 92573 78662 27020 13907 13113 107876 64150 43726
(b) Kasba NA Urban 25522 13478 12044 4474 2328 2146 12622 7715 4907
Banmankhi Bazar NA Urban 25183 13816 11367 4529 2385 2144 13090 8379 4711
KATIHAR DISTRICT Total 2389533 1244943 1144590 514326 261630 252696 66:1848 447512 214336
Rural 2171287 1128240 1043047 480045 243853 236192 527507 367434 160073
Urban 218246 116703 101543 34281 17777 16504 134341 80078 54263
Katihar U.A. Urban 190862 102126 88736 29158 15144 14014 121769 72159 49610
(a) Katihar M&OG Urban 190862 102126 88736 29158 15144 14014 121769 72159 49610
(i) Katihar M Urban 175169 93567 81602 27166 14088 13078 110578 65461 45117
(ii) Katihar Rly.Colony OG Urban 15693 8559 7134 1992 1056 936 11191 6698 4493
Raghunafhpur CT Urban 5601 3054 2547 1035 520 515 2964 1882 1082
Manihari NA Urban 21783 11523 10260 4088 2113 1975 9608 6037 3571
MADHEPURA DISTRICT Total 1524596 796272 728324 32Q359 167034 153325 435774 307496 128278
Rural 1456660 759283 697377 309251 161248 148003 397493 283446 114047
Urban 67936 36989 30947 11108 5786 5322 38281 24050 14231
Madhepura M Urban 45015 24813 20202 6861 3624 3237 27864 17565 10299
Murliganj NA Urban 22921 12176 10745 4247 2162 2085 10417 6485 3932
SAHARSA DISTRICT Total 1506418 788585 717833 306253 161190 145063 471449 326498 ... 144951
Rural 1382403 721575 660828 285416 150443 134973 399298 281994 117304
Urban 124015 67010 57005 20837 10747 10090 72151 44504 27647
Saharsa M Urban 124015 67010 57005 20837 10747 \ 10090 72151 44504 27647
DARBHANGA DISTRICT Total 3285473 1716640 1568833 627897 33'3061 294836 1177743 791068 386675
Rural 3018639 1574598 1444041 - 587897 312075 275822 1006179 688927 317252
Urban 266834 142042 124792 40000 20986 19014 171564 102141 69423
Darbhanga M.Corp Urban 266834. . 142042 124792 40000 20986 19014 171564 102141 69423
41

State/District/UAlCityl Civic Totall Population Child population in the Literates Town status Rural/ age- group 0-6
of the Urban
City!
Town Persons Males Females Persons Males Females Persons Males Females 1 2 3 4 5 6 7 8 9 10 11 12
MUZAFFARPUR DISTRICT Total 3743836 1941480 1802356 718298 373238 345060 1456901 943928 512973
Rural 3395565 1754769 1640796 669624 347462 322162 1223101 809000 414101
Urban 348271 186711 161560 48674 25776 22898 233800 134928 98872
Kanti NA Urban 20873 11082 9791 3650 1907 1743 10116 6350 3766
Muzaffarpur M.Corp Urban 305465 163907 141558 40949 21752 19197 214188 122470 91718
Motipur NA Urban 21933 11722 10211 4075 2117 1958 9496 6108 3388
GOPALGANJ DISTRICT Total 2149343 1072151 1077192 417061 212641 204420 834827 548480 286347
Rural 2018807 1004505 1014302 394451 201029 193422 766564 506741 259823
Urban 130536 67646 62890 22610 11612 10998 68263 41739 26524
Kataiya NA Urban 17896 9284 8612 3312 1726 1586 7529 4935 2594
MlrganJ NA IUrban 23579 12247 11332 4139 2094 2045 12289 7458 4831
Gopalganj M Urban 54418 29016 25402 8187 4207 3980 34322 20355 13967
Barauli NA Urban 34643 17099 17544 6972 3585 3387 14123 8991 5132
SIWAN DISTRICT Total 2708840 1332218 1376622 532447 276274 256173 1131962 714522 417440
Rural 2561094 1254632 1306462 508937 264192 244745 1043777 662321 381456
Urban 147746 77586 70160 23510 12082 11428 88185 52201 35984
Mairwa NA Urban 18696 9834 8862 3165 1621 1544 10068 6319 3749
Siwan M Urban 108172 57223 50949 16353 8360 7993 67609 39497 28112
Maharajganj NA Urban 20878 10529 10349 3992 2101 1891 10508 6385 4123 ,
SARAN DISTRICT Total 3251474 1654428 1597046 619672 319229 300443 1368741 905398 463343
Rural 2953345 1495£145 1457400 571365 294587 276778 1201325 798403 402922
Urban 298129 158483 139646 48307 24642 23665 167416 106995 60421
Marhaura NA Urban 24534 12667 11867 4540 :'397 2143 10323 6887 3436
RevelganJ M Urban 34044 17607 16437 5945 2984 2961 15200 9944 5256
Chapra M Urban 178835 96077 82758 27224 13884 13340 108944 69320 39624
Dighwara NA Urban 27327 14291 13036 5168 2565 2603 13009 8390 4619
Sonepur NA Urban 33389 17841 15548 5430 2812 2618 19940 12454 7486
VAISHALI DiStRICT Total 2712389 1412276 1300113 522714 270420 252294 1130514 730841 399673 ,
Rural 2525912 1313552 1212360 490445 253623 236822 1027901 668672 359229
Urban 186477 98724 87753 32269 16797 15472 102613 62169 40444
Lalganj M Urban 29847 15581 14266 5438 2833 2605 15280 9318 5962
42
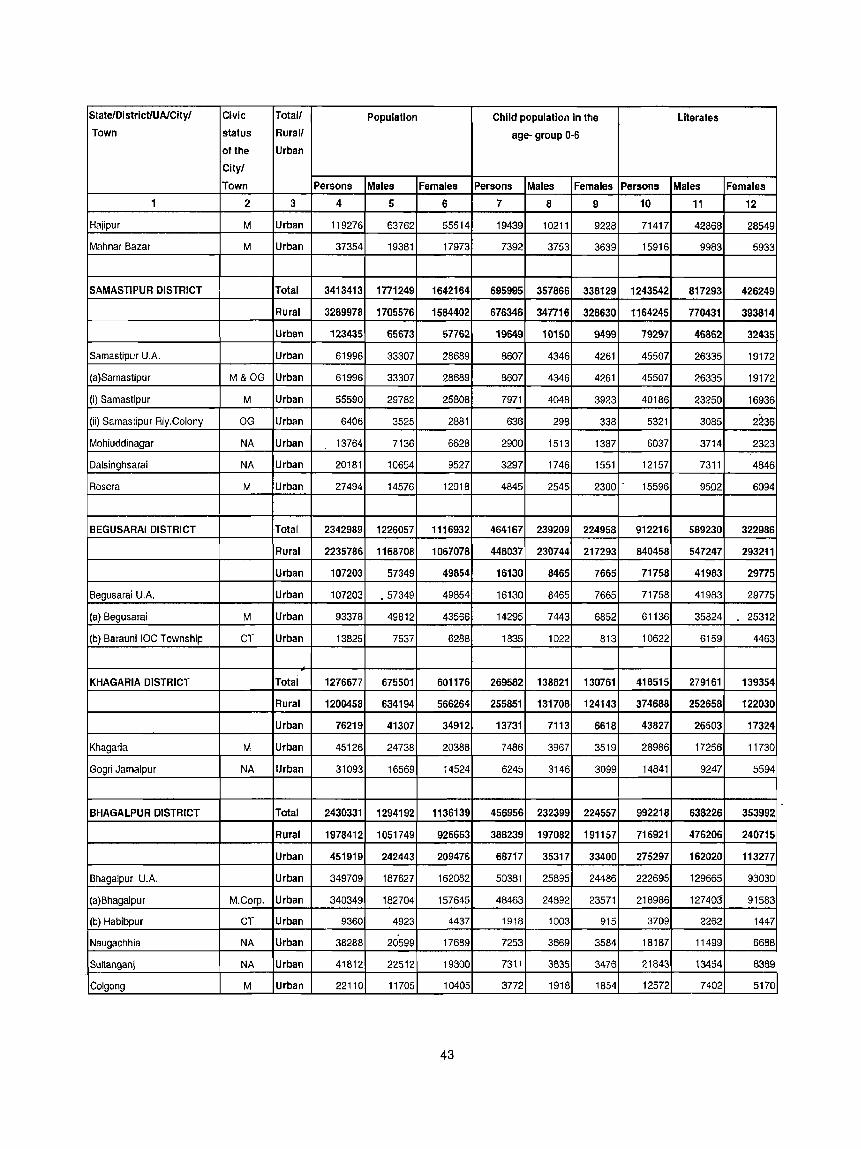
State!Oi strictlUAlCity! Civic Total! Population Child population in the Literates Town status Rural! age- group 0-6
of the Urban
Cityl
Town Persons Males Females Persons Males Females Persons Males Females
1 2 3 4 5 6 7 8 9 10 11 12
Hnjipur M Urban 119276 63762 55514 19439 10211 9228 71417 42868 28549
Mahnar Bazar M Urban 37354 19381 17973 7392 3753 3639 15916 9983 5933
SAMASTIPUR DISTRICT Total 3413413 1771249 1642164 695995 357866 336129 1243542 817293 426249
Rural 3289978 1705576 1584402 676346 347716 328630 1164245 770431 393814
Urban 123435 65673 51762 19649 10150 9499 79297 46862 32435
Samastipur U.A. Urban 61996 33307 28689 8607 4346 4261 45507 26335 19172
(a)Samastipur M&OG Urban 61996 33307 28689 8607 4346 4261 45507 26335 19172
(i) Samastipur M Urban 55590 29782 25808 7971 4048 3923 40186 23250 16936
(ii) Samastipur Rly.Colony OG Urban 6406 3525 2881 636 298 338 5321 3085 2~36
Mohiuddinagar NA Urban 13764 7136 6628 2900 1513 1387 6037 3714 2323
Dalsinghsarai NA Urban 20181 10654 9527 3297 1746 1551 12157 7311 4846
Rosera M Urban 27494 14576 12918 4845 2545 2300 . 15596 9502 6094
BEGUSARAI DISTRICT Total 2342989 1226057 1116932 464167 239209 224958 912216 589230 322986
Rural 2235786 1168708 1067078 448037 230744 217293 840456 547247 293211
Urban 107203 57349 49854 16130 8465 7665 71758 41963 29775
Begusarai U.A. Urban 107203 .57349 49854 16130 8465 7665 71758 41983 29775
(a) Begusarai M Urban 93378 49812 43566 14295 7443 6852 61136 35824 25312
(b) Barauni IOC Township CT Urban 13825 7537 6288 1835 1022 813 10622 6159 4463
KHAGARIA DISTRICT Total 1276677 675501 601176 269582 138821 130761 416515 279161 139354
Rural 1200458 634194 566264 255851 131708 124143 374688 252658 122030
Urban 76219 41307 34912 13731 7113 6618 43827 26503 17324
Khagaria M Urban 45126 24738 20388 7486 3967 3519 28986 17256 11730
Gogri Jamalpur NA Urban 31093 16569 14524 6245 3146 3099 14841 9247 5594
BHAGALPUR DISTRICT Total 2430331 1294192 1136139 456956 232399 224557 992218 638226 353992
Rural 1978412 1051749 926663 388239 197082 191157 716921 476206 240715
Urban 451919 242443 209476 68717 35317 33400 275297 162020 113277
Bhagalpur U.A. Urban 349709 187627 162082 50381 25895 24486 222695 129665 93030
(a)Bhagalpur M.Corp. Urban 340349 182704 157645 48463 24892 23571 218986 127403 91583
(b) Habibpur CT Urban 9360 4923 4437 1918 1003 915 3709 2262 1447
Naugachhia NA Urban 38288 20599 17689 7253 3669 3584 18187 11499 6688
Sultanganj NA Urban 41812 22512 19300 7311 3835 3476 21843 13454 8389
Colgong M Urban 22110 11705 10405 3772 1918 1854 12572 7402 5170
43

State/DistrictlUAlCityl Civic Totall Population Child population in the Literates Town status Rurall age- group 0-6
of the Urbln
Cltyl
Town Persons Males Females Persons Males Females Persons Males Females 1 2 3 4 5 6 7 8 9 10 11 12
BANKA DISTRICT Total 1608778 843061 765717 323329 166872 156457 557859 380549 177310
Rural 1-552432 812894 739538 313878 162047 151831. 529368 363166 166202
Urban 56346 30167 26179 9451 4825 4626 28491 17383 11108 . Amarpur NA Urban 20930 10957 9973 3'854 1935 1919 8873 5446 3427
, Banka M Urban 35416 19210 16206 5597 2890 2707 19618 11937 7681
MUNGER DISTRICT Total 1135499 604662 530837 197144 102928 94216 564043 354611 209432
Rural 818913 435774 383139 150156 78809 71347 356799 233051 123748 . Urban 316586 168888 147698 46988 24119 22869 207244 121560 85684
Munger M Urban 187311 100374 86937 28076 14529 13547 '120123 70603 49520
Jamalpur _ M Urban 96659 51262 45397 13288 6750 6538 70357 40833 29524
Asarganj CT Urban 5706 3011 2695 813 417 396 3985 2299 1686
Kharagpur NA Urban 26910 14241 12669 4811 2423 2388 12779 7825 4954
lAKHISARAI DISTRICT Total 801173 416727 384446 160210 81944 78266 309009 204125 104884
Rural 683588 354279 329309 139937 71520 68417 249449 167120 82329
Urban 117585 62448 55137 20273 10424 9849 59560 37005 22555
Barahiya M Urban 39745 21073 18672 6012 3089 2923 20928 12705 8223
lakhisarai M Urban 77840 41375 36465 14261 7335 6926 38632 24300 14332
. SHEIKHPURA DISTRICT total 525137 273468 251669 106335 54278 52057 205234 137116 68118
Rural 443837 230375 213462 91310 46595 . 44715 163234 110843 52391
Urban 81300 43093 38207 15025 7683 7342 42000 26273 15727
Barbigha NA Urban 38258 20158 18100 7253 3729 3524 19908 12622 7286
Sheikhpura M Urban 43042 22935 20107 7772 3954 3818 22092 13651 8441
NALANDA DISTRICT T~tal 2368327 1236467 ·1131860 444749 229109 215640 1031882 674304 357578
Rural 2014884 1050249 964635 386430 198633 187797 827261 552506 274755
Urban 353443 186218 167225 58319 30476 27643 204621 121798 62823
Hilsa NA Urban 37748 20378 17370 6397 3386 3011 21406 13446 7960
Bihar M Urban 231972 121813 110159 36264 18897 17367 139060 81346 57714
Islampur NA Urban 29855 15708 14147 5528 ' 2955 2573 16261 9780 6481 . Silao NA Urban 20177 10483 9694 3875 1982 1893 10416 6258 4158
Rajgir NA Urban 33691 17836 15855 6255 3256 2999 17478 10968 6510
44 '

State/District/UAlCityl Civic Totall Population Child population in the Literates
Town status Rurall age- group 0-6 01 the Urban
Cityl
Town Persons Males Females Persons Males Females Persons Males Females
1 2 3 4 5 6 7 8 9 10 11 12
PATNA DISTRICT Total 4709851 2514949 2194902 795842 408453 387389 2497924 1554868 943056
Rural 2740927 1449850 1291077 529501 268820 260681 11.59573 767573 392000
Urban 1968924 1055099 903825 266341 139633 126708 1338351 787295 551056
Patna U.A. Urban 1707429 925857 781572 222679 116919 105760 1193736 698989 494747
(a)Patna M.Corp.&OG Urban 1442932 784871 658061 183729 96362 87367 1030554 602112 428442
(i)F'atna M.Corp. Urban 1376950 749868 627082 175151 91810 83341 983884 575205 408679
(ii) Pataliputra Housing Colony OG Urban 4710 2533 2177 433 262 171 3952 2111 1841
(iii) Digha-Mainpura OG Urban 54031 28612 25419 7040 3717 3323 38274 22167 16107
(iv) Sabazpura OG Urban 1745 919 826 287 151 136 877 518 359
(v) Khalilpura OG Urban 4779 2550 2229 723 371 352 3020 1784 1236
(Vi) Badalpura OG Urban 717 389 328 95 51 44 547 327 220
(b) Phulwari Sharif NA Urban 53166 28089 25077 8153 4225 3928 33583 19575 14008
(e) Dinapur Nizamat M Urban 130339 69024 61315 19953 10541 9412 72621 43852 28769
(d) Dinapur Cantt. CB Urban 28149 15715 12434 3698 1932 1766 19861 12035 7826
(e) Khagaul M&OG Urban 52843 28158 24685 7146 3859 3287 37117 21415 15702
(i) Khagaul M Urban 48330 25754 22576 6372 3448 2924 34546 19870 14676
(ii) Saidpura OG Urban 4513 2404 2109 774 411 363 2571 1545 1026
Maner NA Urban 26912 14270 12642 5039 2622 2417 13983 8691 5292
Masaurhi NA Urban 46943 24793 22150 7853 4083 3770 26335 16067 10268
Fatwah NA Urban 38362 20598 17764 6462 3414 3048 20265 12445 7820
Khusrupur NA Urban 12185 6446 5739 2128 1101 1027 6546 3992 2554
Bakhtiarpur NA Urban 32288 17233 15055 5847 3019 2828 -17005 10704 6301
Barh M Urban 48405 26097 22308 7375 3860 J515 28710 17155 11555
Mokameh M Urban 56400 29805 26595 8958 4615 4343 31771 19252 12519
BHOJPUR DISTRICT Total 2233415 1175333 1058082 406343 209650 196693 1090868 722112 368756
Rural 1921121 1006468 914653 356473 183629 172844 897094 605344 291750
Urban 312294 168865 143429 49870 26021 23849 193774 116768 77006
Shahpur NA Urban 14456 7560 6896 2762 1393 1369 6744 44')0 2344
Behea NA Urban 20809 11112 9697 3558 1802 1756 12315 1291 5024
Arrah M Urban 203395 109876 93519 29866 15711 14155 135379 80792 54587 "
Koilwar NA Urban 19925 12145 7780 3802 1999 1803 10945 6712 4233 ,
Jagdishpur M Urban 28071 14587 13484 5156 2644 2512 14118 8778 5340
PliO NA Urban 25638 13585 12053 4726 2472 2254 14273 8795 5478
45

State/DistrictlUAlCityl Civic Totall Population Child population in the Literates
Town status Rurall age- group 0-6 of the Urban
Cityl
Town Persons Males Females Persons Males Females Persons Males Females
1 2 3 4 5 6 7 8 9 10 11 12
BUXAR DISTRICT Total 1403462 738239 665223 265287 137722 127565 654309 437298 217011
Rural 1274691 669446 605245 244185 127044 117141 573438 388399 185039
Urban 128771 68793 59978 21102 10678 10424 80871 48899 31972
Buxar M Urban 82975 44415 38560 13200 6560 6640 56131 33411 22720
Dumraon M Urban 45796 24378 21418 7902 4118 3784 24740 15488 9252
KAIMUR (BHABUA) Total 1284575 673556 611019 258460 133248 125212 570260 381298 188962
DISTRICT Rural 1243068 650973 592095 251939 129826 122113 543062 364776 178286
Urban 41507 22583 18924 6521 3422 3099 27198 16522 10676
Bhabua M Urban 41507 22583 18924 6521 3422 3099 27198 16522 10676
ROHTAS" DISTRICT Total 2448762 1282655 1166107 463050 237841 225209 1238348 799699 438649 -Rural 2122175 1109288 1012887 410596 210722 199874 1032391 676816 355575
Urban 326587 173367 153220 52454 27119 25335 205957 122883 83074
K,)ath NA Urban 15809 8197 7612 2926 1488 1438 7639 4867 2772
81kmmganj NA Urban 38391 20329 18062 7133 3743 3390 22251 13614 8637
Nokha NA Urban 22338 11624 10714 4107 2078 2029 11938 7403 4535
Sasaram M Urban 131042 69665 61377 20422 10548 9874 85300 49893 35407
Dehn M Urban 119007 63552 55455 17866 9262 8604 78829 47106 31723
JEHANABAD DISTRICT Total 1511406 783960 727446 282774 148160 134614 688428 450803 237625
Rural 1399513 724219 . 675294 264371 138377 125994 623527 411420 212107
Urban 111893 59741 52152 18403 9783 8620 64901 39383 25518
Jehanabad M Urban 81723 43992 37731 13340 7135 6205 51464 30942 20522
Makhdumpur NA Urban 30170 15749 14421 5063 2648 2415 13437 8441 4996
AURANGABAD DISTRICT Total 2004960 1035757 969203 378763 196056 182707 935133 604461 330672
Rural 1836127 946826 889301 350217 181117 169100 832971 544076 288895
Urban 168833 88931 79902 28546 14939 13607 102162 60385 41777
D3udnagar M Urban 37977 19881 18096 6828 3641 3187 20773 12474 8299
Jamhaur NA Urban 8575 4465 4110 1528 779 749 4245 2678 1567
Aurangabad M Urban 79351 42290 37061 12220 6319 5901 55435 32152 23283 . Nabinagar NA Urban 19041 9764 9277 3453 1806 1647 10102 6165 3937
Rahganj NA Urban 23889 12531 11358 4517 2394 2123 11607 6916 4691
--
46

Stale/DistrietlUAlCityl Civie Totall Population Child population in the Town status Rural! age- group 0-6
of the Urban
Cityl
Town Persons Males Females Persons Males Females
1 2 3 4 5 6 7 8 9
GA Y A DISTRICT Total 3464983 1789231 1675752 666327 340443 325884
Rural 2989942 1536340 1453602 595868 304007 291861
Urban 475041 252891 222150 70459 36436 34023
G<1ya U.A. Urban 394185 209926 184259 55953 28912 27041
(a)Gaya M.Corp.& OG Urban 388427 206011 182416 55230 28556 26674
(ilGaya M.Corp Urban 383197 203252 179945 54390 28121 26269
(it)Kaler OG Urban 5230 2759 2471 840 435 405
(b)Paharpur CT Urban 5758 3915 1843 723 356 367
Tikari M Urban 17615 9192 8423 3015 1562 1453
Bodh Gaya NA Urban 30883 16751 14132 5413 2769 2644
Sherghali NA Urban 32358 17022 15336 6078 3193 2885
NAWADA DISTRICT Total 1809425 928638 880787 346564 175549 171015
Rural 1670759 855675 815084 323772 163747 160025
Urban 138666 72963 65703 22792 11802 10990
Hisua NA Urban 25045 12900 12145 4502 2282 2220
Nawada M Urban 82291 43739 38552 12927 6762 6165
Warisaliganj NA Urban 31330 16324 15006 5363 2758 2605
JAMUl DISTRICT Total 1397474 728812 668662 264768 134841 129927
Rural 1294298 673840 620458 247826 126026 121800
Urban 103176 54972 48204 16942 8815 8127
Jamui M Urban 66752 35553 31199 11319 5829 5490
Jhajha NA Urban 36424 19419 17005 5623 2986 2637
Note :- Towns created after 1991 Census for the first time has been shown in italic.
M.Corp ..
M
NA
CT OG
Municipal Corporation
Municipality
Notified Area
Census Town
Outgrowth
47
Literates
Persons Males Females
10 11 12
1429291 924486 504805
1117549 740961 376588
311742 183525 128217
266268 155674 110594
261786 152372 109414
258906 150661 108245
2880 1711 1169
4482 3302 1180
11556 6763 4793
15850 10530 5320
18068 10558 7510
692751 461059 231692
609779 412203 197576
82972 48856 34116
12659 7633 5026
53785 31206 22579
16528 10017 6511
484164 339128 145036
424553 302243 122310
59611 36885 22726
36775 23005 13770
22836 13880 8956


Statel District!
C.D. Block
1
BIHAR STATE
Table ·2 Population, child population in the age-group 0-6 and literates by
residence and sex·State,District,Community Development Block,2001 Totall Population Child population in the
Rurall age- group 0-6
Urban Persons Males Females Persons Males Females Persons
2 3 4 5 6 7 8 9
Total 82878796 43153964 39724832 16234539 8375532 7859007 31675607
Rural 74199596 38510686 35688910 14883794 7673648 7210146 26346880
Urban 8679200 4643278 4035922 1350745 701884 648861 5328727
Total 3043044 1600853 1442191 631412 325203 306209 955828
PASHCHIM CHAMPARAN DISTRICT Rural 2733561 1436667 1296894 576084 296590 219494 191904
Urban 309483 164186 .145291 55328 28613 26115 163924
Sid haw Rural 236944 123268 113676 47834 24374 23460 62506
Total 192975 100915 92060 39518 20329 19189 65588
Ramnagar Rural 154426 80426 74000 32049 16438 15611 46957
Urban 38549 20489 18060 7469 3891 3578 18631
Gaunaha Rural 157619 81874 75745 32705 16846 15859 49820
Mainatanr Rural 144384 75806 68578 31542 16041 15501 46482 .~
Total 291814 153689 138125 60906 31916 28990 102340
Narkatiaganj Rural 250984 131695 119289 53847 28304 25543 78143
Urban 40830 21994 18836 7059 3612 3447 24197
Lauriya Rural 179384 93941 85443 38183 19854 18329 63470
Total 316454 167564 148890 62920 32339 30581 98852
Bagaha Rural 225071 119109 105962 45640 23377 22263 63794
Urban 91383 48455 42928 172BO 8962 8318 35058
Piprasi Rural 31464 16724 14740 6213 3204 3009 6206
Madhubani Rural 65554 34392 31162 13827 7079 6748 13480
Bhitaha Rural 52147 27807 24340 10335 5203 5132 11193
Thakrahan Rural 43752 23121 20631 7850 3849 4001 8751
Jogapalti Rural 185160 97925 87235 41095 21293 19802 46225
Total 225332 118580 106752 47271 24144 23127 74779
Chanpatia Rural 203303 107135 96168 43016 22029 20987 64022
Urban 22029 11445 10584 4255 2115 2140 10757
Sikta Rural 145449 76655 68794 30164 16021 14143 42496
Majhaulia Rural 254066 134057 120009 54304 27605 26699 72928
Total 184910 97785 87125 33399 17277 16122 101921
jdettiah Rural 68218 35982 32236 14134 7244 6890 26640
Urban 116692 61803 54689 19265 10033 9232 75281
Bairia Rural 159732 84271 75461 35255 18349 16906 40342
Nautan " Rural 175904 92479 83425 38091 19480 18611 48449
49
Annexure -II
Literates
Males Females
10 11
20978955 10696652
17794140 8552740
3184815 2143912
662131 293697
562208 229696
99923 64001
45377 17129
44270 21318
32539 14418
11731 6900
35267 14553
33048 13434
68278 34062
53400 24743
14878 9319
42714 20756
68348 30504
45382 18412
22966 12092
5139 1067
10732 2748
8673 2520
6555 2196
34361 11864
51070 23709
44441 19581
6629 4128
30009 12487
~2031 20897
61617 40304
17898 8742
43719 31562
29607 10735
35035 13414

State! District! Total! Population Child pOPlJlation in the Literates
C.D. Block Rural! age- group 0·6
Urban Persons Males Females Persons Males Females Persons Males Females
1 2 3 4 5 6 7 8 9 10 11
Total 3933636 2072350 1861286 805238 416279 388959 1193315 830346 362969
PURBA CHAMPARAN DISTRICT Rural 3682196 1937024 1745172 762442 393935 368507 1050833 743781 307052
Urban 251440 135326 116114 42796 22344 20452 142482 86565 55917
Total , 172886 92460 80426 34544 17587 16957 59859 41656 18203
Raxaul Rural 131539 70176 61363 27171 13724 13447 36015 27046 8969
Urban 41347 22284 19063 7373 3863 3510 23844 14610 9234
Adapur Rural 156231 83116 73115 33623 17235 16388 39283 29854 9429
Ramgarhwa Rural 157054 83495 73559 32422 16484 15938 49236 34740 14496
Total 176155 93536 82619 36499 19004 17495 52739 37001 15738
Sugauli Rural 144793 76709 68084 30257 15760 14497 39511 28418 11093
Urban 31362 16827 14535 6242 3244 2998 13228 8583 4645
Banjaria Rural 121971 65317 56654 24716 12646 12070 33569 23227 10342
Narkalia Rural 130248 69180 61068 29186 14882 14304 36350 26991 9359
Bankatwa Rural 90387 48220 42167 18573 9509 9064 20978 16077 4901
Ghorasahan Rural 135151 72506 62645 28436 14480 13956 37448 27272 10176
Total 245001 128475 116526 49634 25496 24138 80175 54195 25980
Dhaka Rural 212383 111263 101120 43054 22055 20999 67662 46055 21607
Urban 32618 17212 15406 6580 3441 3139 12513 8140 4373
Chiraia Rural 211494 112761 98733 42993 22037 20956 54955 40312 14643
Total 291054 156556 134498 54074 27941 26133 121222 77543 43679
Motihari Rural 181804 97039 84765 38370 19711 18659 45833 33461 12372
Urban 109250 59517 49733 15704 8230 7474 75389 44082 31307
Turkaulia Rural 139337 73236 66101 29940 15794 14146 42371 29651 12720
Harsidhi Rural 169808 88897 80911 35350 18278 17072 52651 37107 15544
Paharpur Rural 140494 73169 67325 30361 15717 14644 41112 29289 11823
Total 133067 69078 63989 26226 13273 12953 48180 31446 16734
Areraj Rural 112822 58460 54362 22246 11265 10981 39107 25598 13509
Urban 20245 10618 9627 3980 2008 1972 9073 5848 3225
Sangrampur Rural 116754 60558 56196 23175 11931 11244 36472 24350 12122
Kesaria Rural 147625 76307 71318 29215 15080 14135 45497 31375 14122
Kalyanpur Rural 216370 111534 104836 43266 22725 20541 69148 47154 21994
Kolwa Rural 127994 66513 61481 26251 13598 12653 37388 26720 10668
Piprakolhi Rural 58489 30814 27675 12534 6496 6038 16843 12060 4783
Total 170005 88298 81707 35261 18564 16697 49914 33851 16063
Chakia(Pipra) Rural 153387 79430 73957 32344 17006 15338 41479 28549 12930
Urban 16618 8868 7750 2917 1558 1359 8435 5302 3133
Pakri Dayal Rural 110641 58148 52493 22337 11335 11002 29083 20706 . 8377
Patahi Rural 124769 65359 59410 24949 12844 12105 35152 24042 11110
I'
50

Statel District! Totall Population Child population in the Literates
C.D. Block Rural! age· group 0·6 Urban Persons Males Females Persons Males Females Persons Males Females
1 2 3 4 5 6 7 B 9 10 11
Phenhara Rural 57724 30084 27640 12680 7055 5625 18504 13184 5320
Madhuban Rural 122793 64503 58290 25148 13112 12036 29630 21448 8182
Tetaria Rural 78018 41247 36771 16554 8742 7812 15674 11641 4033
Mehsi Rural 132116 68983 63133 27291 14434 12857 39882 27454 12428
Tolal 514288 271261 243027 101630 52954 48676 152726 99407 53319
SHEOHAR DISTRICT Rural 492961 259907 233054 97294 50699 46595 145262 94415 50847
Urban 21327 11354 9973 4336 2255 2081 7464 4992 2472
Purnahiya Rural 71308 37937 33371 14041 7305 6736 23168 15692 7476
Piprarhi Rural 95151 50064 45087 18538 9666 8872 27280 18341 8939
I Tolal 122497 63763 58734 24454 1276B 11686 43460 24538 18922
'Sheohar Rural 101170 52409 48761 20118 10513 9605 35996 19546 16450
Urban 21327 11354 9973 4336 2255 2081 7464 4992 2472
Dumri Kalsan Rural 71035 37534 .33501 14418 7697 6721 21364 14506 6858
Tariani Chowk Rural 154297 81963 72334 30179 15518 14661 37454 26330 11124
Total 2669887 1410149 1259738 539288 284369 254919 839086 574344 264742
SITAMARHI DISTRICT Rural 2516636 1327819 1188817 513265 270766 ·242499 753888 522446 231442
Urban 153251 82330 70921 26023 13603 12420 85198 51898 33300
ISairgania
Total 101598 53745 47853 20191 10401 9790 32946 22401 10545
Rural 66777 35249 31528 13362 6935 6427 17981 12596 5385
I Urban 34821 18496 16325 6829 3466 3363 14965 9805 5160
Suppi Rural 97238 51421 45817 18674 9816 8858 32221 21806 10415
jMajorganj Rural 72716 38043 34673 14579 7574 7005 19957 13492 6465
, Sonbarsa Rural 192101 101475 90626 41496 21295 20201 55987 40984 15003
Parihar Rural 252622 132937 119685 54476 28304 26172 67502 48453 19049
Sursand Rural 162570 85665 76905 28296 16490 11806 52433 35403 17030
Bathnaha Rural 197998 104994 93004 46050 26540 19510 57979 41315 16664
Riga Rural 162435 86542 75893 33808 17834 15974 48416 33990 14426
Parsauni Rural 67948 35839 32109 13897 7308 6589 17746 12540 5206
Total 101524 53547 47977 19674 9878 9796 39352 30007 9345
Belsand Rural 83703 44036 39667 16238 8118 8120 33390 26094 7296
Urban 17821 9511 8310 3436 1760 1676 5962 3913 2049
Runisaidpur Rural 297337 157371 139966 58501 30310 28191 90125 59912 30213
Total 338994 181046 157948 65383 34262 31121 131532 86141 45391
Dumra Rural 251726 133837 117889 51886 27105 24781 75809 53073 22736
Urban 87268 47209 40059 13497 7157 6340 55723 33068 22655 t ldajpatti Rural 173287 90428 82859 34393 17601 16792 53781 36198 17583
51
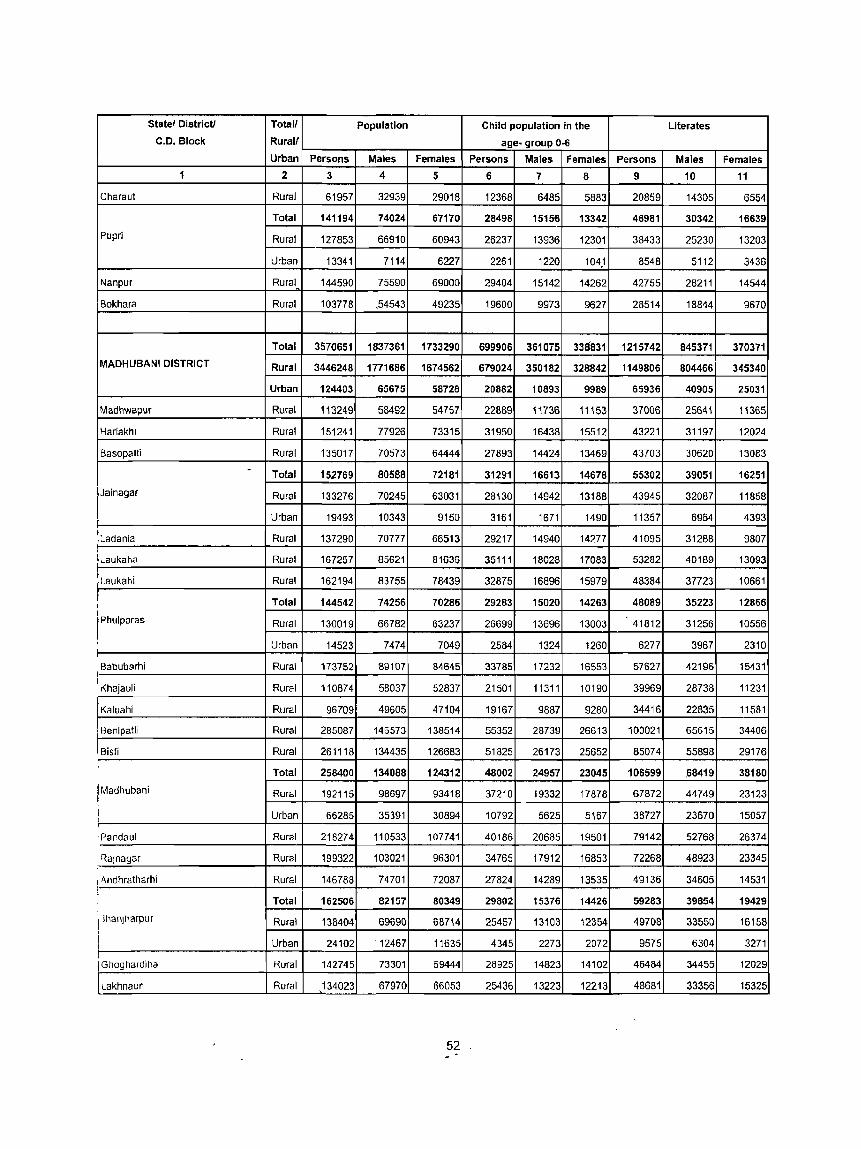
Statel District! Totall Population Child population in the Literates C.D. Block Rurall age- group 0-6
Urban Persons Males Females Persons Males Females Persons Males Females 1 2 3 4 5 6 7 8 9 10 11
Charaut Rural 61957 32939 29018 12368 6485 5883 20859 14305 6554
Total 141194 74024 67170 28498 15156 13342 46981 30342 16639
Pupri Rural 127853 66910 60943 26237 13936 12301 38433 25230 13203
Urban 13341 7114 6227 2261 1220 104,1 8548 5112 3436
Nanpur Rural - 144590 75590 69000 29404 15142 14262 42755 28211 14544
. Bokhara Rural 103778 .54543 49235 19600 9973 9627 28514 18844 9670
Total 3570651 1837361 1733290 699906 361075 338831 1215742 845371 370371 MADHUBANI DISTRICT Rural 3446248 1771686 1674562 679024 350182 328842 1149806 804466 345340
Urban 124403 65675 58728 20882 10893 9989 65936 40905 25031
Madhwapur Rural 113249 58492 54757 22889 11736 11153 37006 25641 11365
Harlakhl Rural 151241 77926 73315 31950 16438 15512 43221 31197 12024
Basopatti Rural 135017 70573 64444 27893 14424 13469 43703 30620 13083
- Total 152769 80588 72181 31291 16613 14678 55302 39051 16251
Jainagar Rural 133276 70245 63031 28130 14942 13188 43945 32087 11858
r. d .
Urban 19493 10343 9150 3161 1671 1490 11357 6964 4393
Rural 137290 70777 66513 29217 14940 14277 41095 31288 9807 ,~a ama i I, ... aukaha Rural 167257 85621 81636 35111 18028 17083 53282 40189 13093 I Rural 162194 83755 78439 32875 16896 15979 48384 37723 10661 tLaUkahi
Total 144542 74256 70286 29283 15020 14263 48089 35223 12866 I I tPhulParas Rural 130019 66782 63237 26699 13696 13003 41812 31256 10556
Urban 14523 7474 7049 2584 1324 1260 6277 3967 2310 I Babubarhi Rural 173752 89107 84645 33785 17232 16553 57627 42196 15431
I
r<:hajauli Rural 110874 58037 52837 21501 11311 10190 39969 28738 11231
Kaluahi Rural 96709 49605 47104 19167 9887 9280 34416 22835 11581
8enipatti Rural 285087 146573 138514 55352 28739 26613 100021 65615 34406
Bisfi Rural 261118 134435 126683 51825 26173 25652 85074 55898 29176
Total 258400 134088 124312 48002 24957 23045 106599 .68419 38180
Madhubani Rural 192115 98697 93418 37210 19332 17878 67872 44749 23123
Urban 66285 35391 30894 10792 5625 5167 38727 23670 15057
Pandaul Rural 218274 110533 107741 40186 20685 19501 79142 52768 26374
RaJnagor Rural 199322 103021 96301 34765 17912 16853 72268 48923 23345
A.ndhratharhi Rural 146788 74701 72087 27824 14289 13535 49136 34605 14531 I
Total 162506 82157 80349 29802 15376 14426 59283 39854 19429
JhanJharpur Rural 138404 69690 68714 25457 13103 12354 49708 33550 16158
Urban 24102 . 12467 11635 4345 2273 2072 9575 6304 3271
Ghoghardiha Rural 142745 73301 69444 28925 14823 14102 46484 34455 12029
Lakhnaur Rural 134023 67970 66053 25436 13223 12213 48681 33356 15325
52

State' District! Total' Population Child population in the Literates
C.D. Block Rurall age- group 0-6
Urban Persons Males Females Persons Males Females Persons Males Females
1 2 3 4 5 6 7 8 9 10 11
Madhepuf Rural 217494 111845 105649 42827 22373 20454 66960 46777 20183
Total 1745069 908855 836214 364701 189821 174880 521755 382752 139003
SUPAUL DISTRICT Rural 1657175 862101 795074 349604 181773 167831 478171 354875 123296
Urban 87894 46754 41140 15097 8048 7049 43584 27877 15707
Total 75931 39388 36543 15052 7745 7307 25845 19213 6632
Nirmali Rural 59787 30867 28920 12210 6311 5899 18609 14363 4246
Urban' 16144 8521 7623 2842 1434 1408 7236 4850 2386
Total 149779 78612 71167 32370 16687 15683 50947 35489 15458
Basantpur Rural 132049 69117 62932 29643 15108 14535 40978 29327 11651
Urban 17730 9495 8235 2727 1579 1148 9969 6162 3807
Chhatapur Rural 215155 112180 102975 44776 22687 22089 58357 43570 14787
Pratapganj Rural 81321 42338 38983 17477 9046 8431 26648 18927 7721
Raghopur Rural 163279 84727 78552 33881 17524 16357 50015 35007 15008
Sarai9arh Bhaptiyahi Rural 102268 53206 49062 22059 11443 10616 28127 21919 6208
Kishanpur Rural 134992 69595 65397 29011 15349 13662 38503 29132 9371
Marauna Rural 113185 58363 54822 24725 12626 12099 28295 23328 4967
Total 304386 159140 145246 . 61884 33275 28609 99995 70439 29556
ISupaul Rural 250366 130402 119964 52356 28240 24116 73616 53574 20042
I Urban 54020 28738 25282 9528 5035 4493 26379 16865 9514 j"
Pipra Rural 157314 81862 75452 33913 17931 15982 44160 33311 10849
fribeniganj Rural 247459 129444 118015 49553 25508 24045 70863 52417 18446 I
Total 2124831 1108924 1015907 449343 228476 220867 585379 409365 176014
ARARIA DISTRICT ' Rural 1992293 1037973 954320 425890 216452 209438 518070 368049 150021
Urban 132538 70951 61587 23453 12024 11429 67309 41316 25993
Narpatganj Rural 257846 135128 122718 52619 26735 25884 70239 51233 19006
Total 373640 196261 177379 77250 39332 37918 113534 77000 36534 Forbesganj Rural 301696 157939 143757 64785 32937 31848 76721 54457 22264
Urban 71944 38322 33622 12465 6395 6070 36813 22543 14270
Bhargama Rural 180164 94429 85735 37530 19057 18473 51110 35946 15164
Raniganj Rural 299582 155679 143903 63450 32673 30777 81757 56681 25076 -
Total 355243 185707 169536 74701 37847 36854 101418 67566 33852 Araria Rural 294649 153078 141571 63713 32218 31495 70922 48793 22129
Urban 60594 32629 27965 10988 5629 5359 30496 18773 11723
Kursakatta Rural 115416 60286 55130 25141 12626 12515 33763 25227 8536
Sikli Rural 123879 64070 59809 26660 13419 13241 32760 23763 8997
Palasi Rural 187353 97464 89889 40346 20482 19864 44543 33193 11350
53

Statel District! Total! Population Child pllpulation in the literates -C.D. Block Rural! age- group 0-6
Urban Persons Males Females Persons Males Females Persons Males Females 1 2 3 4 5 6 7 8 9 10 11
Jokihat Rural 231708 119900 111808 51646 26305 25341 56255 38756 17499
Total 1294063 666910 627153 280498 144501 135997 314389 223586 90803
KISHANGANJ DISTRICT Rural 1165057 597760 567297 257000 132442 124558 251395 184084 67311
Urban 129006 69150 59856 23498 12059 11439 62994 39502 23492
Terhagachh Rural 106878 54702 52176 22539 11720 10819 23088 18233 4855
Dighalbank Rural 152537 78095 74442 34073 17185 16888 31480 23511 7969
Total 221995 113901 108094 48787 25364 23423 52791 37631 15160
Thakurganj Rural 206707 105826 100881 46214 24036 22178 44530 32568 11962
Urban 15288 8075 7213 2573 1328 1245 8261 5063 3198
Pothia Rural 195907 100722 95185 41691 21381 20310 39421 27714 11707
Total 205888 105723 100165 44585 22808 21777 49463 35569 13894
Bahadurganj Rural 177664 90812 86852 38722 19790 18932 39981 29042 10939
. Urban 28224 14911 13313 5863 3018 2845 9482 6527 2955
Kochadhamin Rural 225323 116046 109277 50340 26343 23997 51512 .37564 13948
Total 185535 97721 87814 38483 19700 18783 '66634 43364 23270
Kishanganj Rural 100041 51557 48484 23421 11987 11434 21383 15452 5931
Urban 85494 46164 39330 15062 7713 7349 45251 27912 17339
Total 2540788 1325794 1214994 536851 272748 264103 711634 486083 225551
PURNIA DISTRICT Rural 2318848 1205927 1112921 500828 254128 246700 578046 405839 172207
Urban 221940 119867 102073 36023 18620 17403 133588 80244 53344
Total 279230 146681 132549 57692 29299 28393 83676 58010 25666
Banmankhi Rural 254047 132865 121182 53163 26914 26249 70586 49631 20955
Urban 25183 13816 11367 4529 2385 2144 13090 8379 4711
Barhara Kothi Rural 167121 87308 79813 35163 17920 17243 49386 33742 15644
Bhawanipur Rural 126717 66237 60480 26569 13370 13199 33680 23405 10275
Rupnuli Rural 188172 98560 89612 40022 20220 19802 47520 34145 13375
Dhamdaha Rural 233024 120820 112204 47644 24379 23265 62948 43681 19267
Krityanand Nagar Rural 174412 90540 83872 36392 18471 17921 47966 32604 15362
Total 349118 185720 163398 65481 33536 31945 162750 100920 61830
Purnia East Rural 177883 93147 84736 38461 19629 18832 54874 36770 18104
Urban 171235 92573 78662 27020 13907 13113 107876 64150 43726
Total 143784 74560 69224 32096 16080 16016 39713 26468 13245
Kasba Rural 118262· 61082 57180 27622 13752 13870 27091 18753 8338
Urban 25522 13478 12044 4474 2328 2146 17622 7715 4907
Srmagar Rural 81207 42222 38985 17834 9101 8733 18743 12833 5910
Jalalgarh Rural 86280 44585 41695 18848 9479 9369 22524 15364 7160

Statel District! Totall Population Child population in the Literates
C.D. Block Rural! age" group 0·6
Urban Persons Males Females Persons Males Females Persons Males Females
1 2 3 4 5 6 7 8 9 10 11
Amour Rural 221276 114743 106533 49298 25018 24280 45390 33380 12010
Baisa Rural 149247 77233 72014 33531 16926 16605 32534 23488 9046
Baisi Rural 168926 87232 81694 38686 19685 19001 26029 20321 5708
Dagarua Rural 172274 89353 82921 37595 19264 18331 38775 27722 11053
Total 2389533 1244943 1144590 514326 261630 252696 661848 447512 214336
KATIHAR DISTRICT Rural 2171287 1128240 1043047 480045 243853 236192 527507 367434 160073
Urban 218246 116703 101543 34281 17777 16504 134341 80078 54263
Falka Rural 121543 63071 58472 26283 13417 12866 32372 21993 10379
Korha Rural 209373 109211 100162 46932 23737 23195 50578 34676 15902
Hasanganj Rural 42871 22032 20839 9344 4871 4473 10787 7578 3209
t<adwa Rural 268398 139019 129379 58715 29698 29017 64080 45588 18492
Balrampur Rural 122801 64038 58763 27182 14004 13178 24699 18104 6595
Total 262249 135497 126752 59347 30224 29123 57300 39662 17638
Barsoi Rural 256648 132443 124205 58312 29704 28608 54336 37780 16556
Urban 5601 3054 2547 1035 520 515 2964 1882 1082
Azamnagar Rural 246851 127797 119054 55737 28288 27449 52501 37923 14578
Pranpur Rural 112537 58535 54002 24440 12449 11991 29229 20275 8954
Dandkhora Rural 54159 28047 26112 11085 5619 5466 15973 11491 4482
Total 263965 140345 123620 45519 23415 22104 143009 86692 56317
Katihar Rural 73103 38219 34884 16361 8271 8090 21240 14533 6707
Urban 190862 102126 88736 29158 15144 14014 121769 72159 49610
Mansahi Rural 62992 32805 30187 14650 7405 7245 15723 10819 4904
Barari Rural 220905 115441 105464 49706 25200 24506 55253 37563 17690
Sameli Rural 67230 34977 32253 15050 7592 7458 18268 12652 5616
Kursela Rural 52941 28035 24906 10957 5649 5308 17779 12176 5603
Total 149243 78137 71106 31207 15843 15364 44799 30274 14525
Manihari Rural 127460 66614 60846 27119 13730 13389 35191 24237 10954
Urban 21783 11523 10260 4088 2113 1975 9608 6037 3571
Amdabad Rural 131475 67956 63519 28172 142t9 13953 29498 20046 9452
-
Total 1524596 796272 728324 320359 167034 153325 435774 307496 128278
MADHEPURA DISTRICT Rural 1456660 759283 697377 309251 161248 148003 397493 283446 114047
Urban 67936 36989 30947 11108 5786 5322 38281 24050 14231
Gamharia Rural 65283 33745 31538 13365 7045 6320 19556 14099 5457
Singheshwar Rural 101240 52893 48347 20051 11091 8960 30525 21337 9188
Ghailarh Rural 72701 38140 34561 14523 7529 6994 21419 16186 5233
55

Statel District! Totall Population Child population in the Literates C.D. Block Rural! age· group 0·6
Urban Persons Males Females Persons Males Females Persons Males Females 1 2 3 4 5 6 7 8 9 10 11
Total 194682 103117 91565 37698 19380 18318 69517 47139 22378
Madhepura Rural 149667 78304 71363 30837 15756~ 15081 41653 29574 12079
Urban 45015 24813 20202 6861 3624 3237 27864 17565 10299
Shankarpur Rural 82498 42731 39767 16675 8810 786S. 21321 15857 5464
Kumarkhand Rural 187030 97074 89956 39923 21437 18486' 49048 35350 13698
Total 164014 86005 78009 33956 17584 16372 50023 34718 15305
Murliganj Rural 141093 73829 67264 29709 15422 14287 39606 28233 11373
Urban 22921 12176 10745 4247 2162 2085 10417 6485 3932
Gwalpara Rural 95138 49184 45954 20501 10468 10033 25930 18400 7530
Bihariganj Rural 101662 52541 49121 21458 10957 10501 30691 20831 9860
Kishanganj Rural 136842 70961 65881 30806 16232 14574 36929 25276 11653
Puraini Rural 77757 40524 37233 16768 8662 8106 20338 14375 5963
Alamnagar Rural 129263 67668 61595 29767 15349 14418 30569 22314 8255
Chausa Rural 116486 61689 54797 24868 12490 12378 29908 21614 8294
Total 1506418 788585 717833 306253 161190 145063 471449 326498 144951
SAHARSA DISTRICT Rural 1382403 7.21575 660828 285416 150443 134973 399298 281994 117304
Urban 124015 67010 57005 20837 10747 10090 72151 44504 27647
Nauhatta Rural 137579 71432 66147 27221 14443 12778 41570 29333 12237
Satar Kataiya Rural 128192 67169 61023 26237 13763 12474 39127 28112 11015
Mahishi Rural 184036 95867 88169 37866 . 21060 16806 54486 37566 16920
Total 229744 121857 107887 41836 21743 20093 111611 70802 40809
Kahara Rural 105729 54647 50862 20999 10996 10003 39460 26296 13162
Urban 124015 67010 57005 20837 10747 10090 72151 44504 27647
Saur Bazar Rural 161285 84313 76972 33291 17123 16168 46693 34868 11825
Patarghat Rural 97301 50751 46550 22356 11951 10405 28360 19349 9011
Sonbarsa Rural 176336 91844 84492 37972 19365 18607 45647 32414 13233
Simri Bakhtiarpur Rural 218430 114406 104024 43837 23083 .20754 62124 43749 18375
Salkhua Rural 103071 54053 49018 20097 1054.6 9551 23416 17304 6112
Banma Itahri Rural 70444 36893 33551 15540 8113 7427 18415 13001 5414
Total 3285473 1716640 1568833 627897 333061 294836 1177743 791068 386675
DARBHANGA DISTRICT Rural 3018639 1574598 1444041 587897 312075 275822 1006179 688927 317252
Urban 266834 142042 124792 40000 20986 19014 171564 102141 69423
Jale Rural 234004 122107 111897 45288 23581 21707 85559 54909 30650
Singhwara Rural 235603 122889 112714 46744 24543 22201 84727 54709 30018
Keotiranway Rural 236830 123002 113828 47208 25235 21973 88010 57487 30523

Statel District! Total! Population Child population in the Literates
C.D. Block Rural! age- group 0-6
Urban Persons Males Females Persons Males Females Persons Males Females
1 2 3 4 5 6 7 8 9 10 11
Total 495768 262081 233687 85608 45311 40297 246797 153046 93751
Darbhanga Rural 228934 120039 108895 45608 24325 21283 75233 50905 24328
Urban 266834 142042 124792 40000 20986 19014 171564 102141 69423
Manigachhi Rural 186347 96178 90169 34027 17849 16178 68127 45654 22473
Tardih Rural 98202 50623 47579 16818 8732 8086 32953 22473 10480
Alinagar Rural 113439 58684 54755 23261 11949 11312 28747 20313 8434
Benipur Rural 199633 103225 96408 30067 19784 10283 68807 47263 21544
Bahadurpur Rural 217702 114615 103087 42531 22693 19838 78918 53788 25130
Hanumannagar Rural 136418 71685 64733 26534 14060 12474 45370 30426 14944
Hayaghat Rural 122917 64642 58275 23807 12492 11315 46148 30456 15692
Baheri Rural 252739 133685 119054 55079 28642 26437 84306 61198 23108
Biraul Rural 232040 121337 110703 44471 23418 21053 72943 51793 21150
Ghanshyampur Rural 106960 55320 51640 19867 . 10313 9554 34648 24278 10370
Kiratpur Rural 68871 35859 33012 13998 7274 6724 18851 13843 5008
Gora Bauram Rural 122315 63641 58674 24438 12449 11989 37203 26564 10639
Kusheshwar Asthan Rural 130952 67455 63497 27605 14148 13457 34562 26276 8286
Kusheshwar Asthan Purbi Rural 94733 49612 45121 20546 10588 9958 21067 16592 4475
. Total 3743836 1941480 1802356 718298 373238 345060 1456901 943928 512973
MUZAFFARPUR DISTRICT Rural 3395565 1754769 1640796 669624 347462 322162 1223101 809000 414101
Urban 348271 186711 161560 48674 25776 22898 233800 134928 98872
Sahebganj Rural 183126 93268 89858 35938 18394 17544 64596 43421 21175
Total 305731 157841 147890 61664 31726 29938 107970 72338 35632
. Baruraj (Motipur) Rural 283798 146119 137679 57589 29609 27980 98474 66230 32244
Urban 21933 11722 10211 4075 2117 1958 9496 6108 3388
Parao Rural 273906 138745 135161 53297 27216 26081 100191 65523 34668
Saraiya Rural 248859 126039 122820 48226 24772 23454 94809 61057 33752
Marwan Rural 124259 64618 59641 24879 12953 11926 46532 30439 16093
Total 213411 112711 100700 39684 20791 18893 88693 56580 32113
Kanti Rural 192538 101629 90909 36034 18884 17150 78577 50230 28347 "
tMinapur
Urban 20873 11082 9791 3650 1907 1743 10116 6350 3766
Rural 259228 136672 122556 52891 27459 25432 79148 55127 24021 I I Bochaha Rural 184438 97082 87356 38643 20198 18445 56209 40127 16082
IAurai Rural 232581 121621 110960 47271 25171 22100 71721 47695 24026
Katra Rural 191286 98875 92411 39771 20901 18870 59737 39215 20522
Gaighat Rural 203277 105937 97340 41751 21944 19807 65738 43752 21986
Bandra Rural 107193 56258 50935 22085 11343 10742 33145 22590 10555
DhoJi (Moraul) Rural 74614 38340 36274 14220 7397 6823 33093 20912 12181
57

State! District! Total! Population Child population in the Literates C.D. Block Rural! age- group 0-6
Urban Persons Males Females Persons Males Females Persons Males Females
1 2 3 4 5 6 7 8 9 10 11
Total 555633 297241 258392 85095 44847 40248 322840 190893 131947
Musahri Rural 250168 133334 116834 44146 23095 21051 108652 68423 40229
Urban 305465 163907 141558 40949 21752 19197 214188 1224"0 91718
Kurhani Rural 344512 179437 165075 66618 34169 32449 134120 87879 46241
Sakra Rural 241782 116795 124987 46265 2395"( 22308 98359 66380 31979
Total 2149343 1072151 1077192 417061 212641 204420 834827 548480 286347
GOPALGANJ DISTRICT Rural 2018807 1004505 1014302 394451 201029 193422 766564 506741 259823
Urban 130536 67646 62890 22610 11612 10998 68263 41739 26524
Total 114591 56100 58491 21158 10797 10361 45135 29192 15943
Kaliya - . Rural 96695 46816 49879 17846 9071 8775 37606 24257 13349
Urban 17896 9284 8612 3312 1726 1586 7529 4935 2594
Bijaipur Rural 115603 56401 59202 21904 11212 10692 42145 28032 14113
Bhorey Rural 149196 73231 75965 28874 14684 14190 53753 35920 17833
Pachdeori Rural 83775 41810 41965 16204 8374 7830 28682 19949 8733
Kuchaikole Rural 277845 139355 138490 53755 27522 26233 ,.-}110{)9 73267 37742
Phulwaria Rural 108946 54616 54330 20790 10614 10176 44255 29318 14937
Halhua Rural 187979 94536 93443 35362 18219 17143 81888 52622 29266
Total 152265 76824 75441 29157 14792 14365 64196 41801 22395
UChkagaon Rural 128686 54577 54109 25018 12698 12320 51907 34343 17564
Urban 23579 12247 11332 4139 2094 2045 12289 7458 4831
Thawe Rural 96737 49113 47624 18255 9255 9000 43237 27610 15627
Total 183708 94640 89068 33692 16975 16717 81966 52504 29462
Gopalganj Rural 129290 55624 53665 25505 12768 12737 47544 32149 15495
Urban 54418 29016 25402 8187 4207 3980 34322 20355 13967
Manjha Rural 172543 86756 85787 34146 17219 16927 65143 42708 22435
Total 215513 105054 110459 44319 22681 21638 76440 49770 26670
Barauli Rural 180870 87955 92915 37347 19096 18251 52317 40779 21538
Urban 34643 17099 17544 6972 3585 3387 14123 8991 5132 -
Sidhwalia Rural 113629 56384 57245 23415 11869 11546 38705 26293 12412
Baikunthpur Rural 177013 87331 89682 36030 18428 17602 58273 39494 18779
Total 2708840 1332218 1376622 532447 276274 256173 1131962 714522 417440
SIWAN DISTRICT Rural 2561094 1254632 1306462 508937 264192 244745 1043777 662321 381456
Urban 147746 77586 70160 23510 12082 11428 88185 52201 35984
Nautan Rural 72631 36583 36048 13457 6970 6497 29620 19518 10102
Total 270064 138135 131929 48407 24677 23730 132943 82994 49949
Siwan Rural 151892 80912 80980 32054 15317 15737 55334 43497 21837
Urban 108172 57223 50949 16353 8360 7993 67609 39497 28112
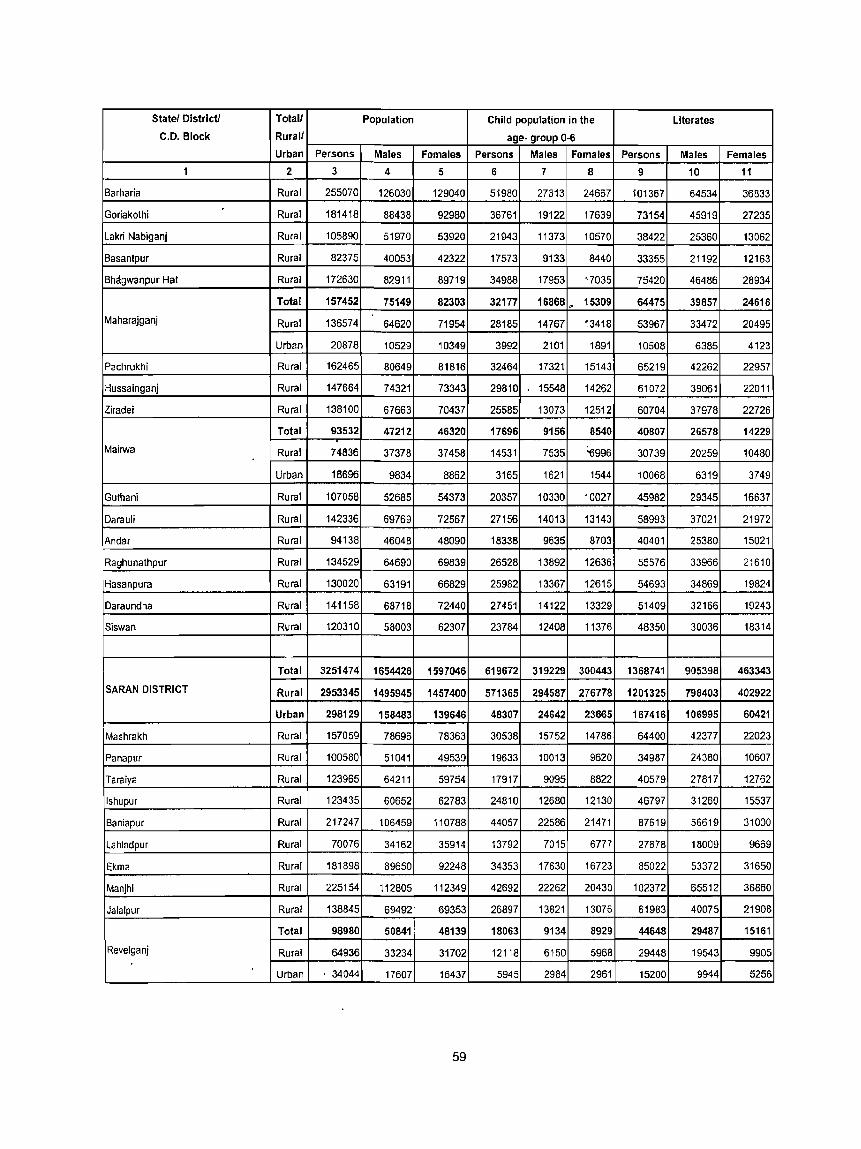
Statel District! Total/ Population Child population in the Literates C.D. Block Rural/ age- group 0-6
Urban Persons Males Females Persons Males Females Persons Males Females 1 2 3 4 5 6 7 8 9 10 11
Barharia Rural 255070 126030 129040 51980 27313 24667 101367 64534 36833
Goriakothi Rural 181418 88438 92980 36761 19122 17639 73154 45919 27235
Lakri Nabiganj Rural 105890 51970 53920 21943 11373 10570 38422 25360 13062
Basantpur Rural 82375 40053 42322 17573 9133 8440 33355 21192 12163
Bhagwanpur Hat Rural 172630 82911 89719 34988 17953 17035 75420 46486 28934
Total 157452 75149 82303 32177 16868._ 15309 64475 39857 24618
Maharajganj Rural 136574 64620 71954 28185 14767 13418 53967 33472 20495
Urban 20878 10529 10349 3992 2101 1891 10508 6385 4123
Pachrukhi Rural 162465 80649 81816 32464 17321 15143 65219 42262 22957
Hussainganj Rural 147664 74321 73343 29810 15548 14262 61072 39061 22011
Ziradei Rural 138100 67663 70437 25585 13073 12512 60704 37978 22726
Total 93532 47212 46320 17696 9156 8540 40807 26578 14229
Mairwa Rural 74836 37378 37458 14531 7535 ~996 30739 20259 10480
Urban 18696 9834 8862 3165 1621 1544 10068 6319 3749
Guthani Rural 107058 52685 54373 20357 10330 10027 45982 29345 16637
Darauli Rural 142336 69769 72567 27156 14013 13143 58993 37021 21972
Andar Rural 94138 46048 48090 18338 9635 8703 40401 25380 15021
Raghunathpur Rural 134529 64690 69839 26528 13892 12636 55576 33966 21610
Hasanpura Rural 130020 63191 66829 25982 13367 12615 54693 34869 19824
Daraundha Rural 141158 68718 72440 27451 14122 13329 51409 32166 19243
Siswan Rural 120310 58003 62307 23784 12408 11376 48350 30036 18314
Total 3251474 1654428 1597046 619672 319229 300443 1368741 905398 463343
SARAN DISTRICT Rural 2953345 1495945 1457400 571365 294587 276778 1201325 798403 402922
Urban 298129 158483 139646 48307 24642 23665 167416 106995 60421
Mashrakh Rural 157059 78696 78363 30538 15752 14786 64400 42377 22023
Panapur Rural 100580 51041 4953!J 19633 10013 9620 34987 24380 10607
Taraiya Rural 123965 64211 59754 17917 9095 8822 40579 27817 12762
Ishupur Rural 123435 60652 62783 24810 12680 12130 46797 31260 15537
Baniapuf Rural 217247 106459 110788 44057 22586 21471 87619 56619 31000
Lahladpur Rural 70076 34162 35914 13792 7015 6777 27678 18009 9669
Ekma Rural 181898 89650 92248 34353 17630 16723 85022 53372 31650
Manjhi Rural 225154 112805 112349 42692 22262 20430 102372 65512 36860
Jalalpur Rural 138845 69492 69353 26897 13821 13076 61983 40075 21908
Total 98980 50841 48139 18063 9134 8929 44648 29487 15161
Revelganj Rural 64936 33234 31702 12118 6150 5968 29448 19543 9905
Urban . 34044 17607 16437 5945 2984 2961 15200 9944 5256
59
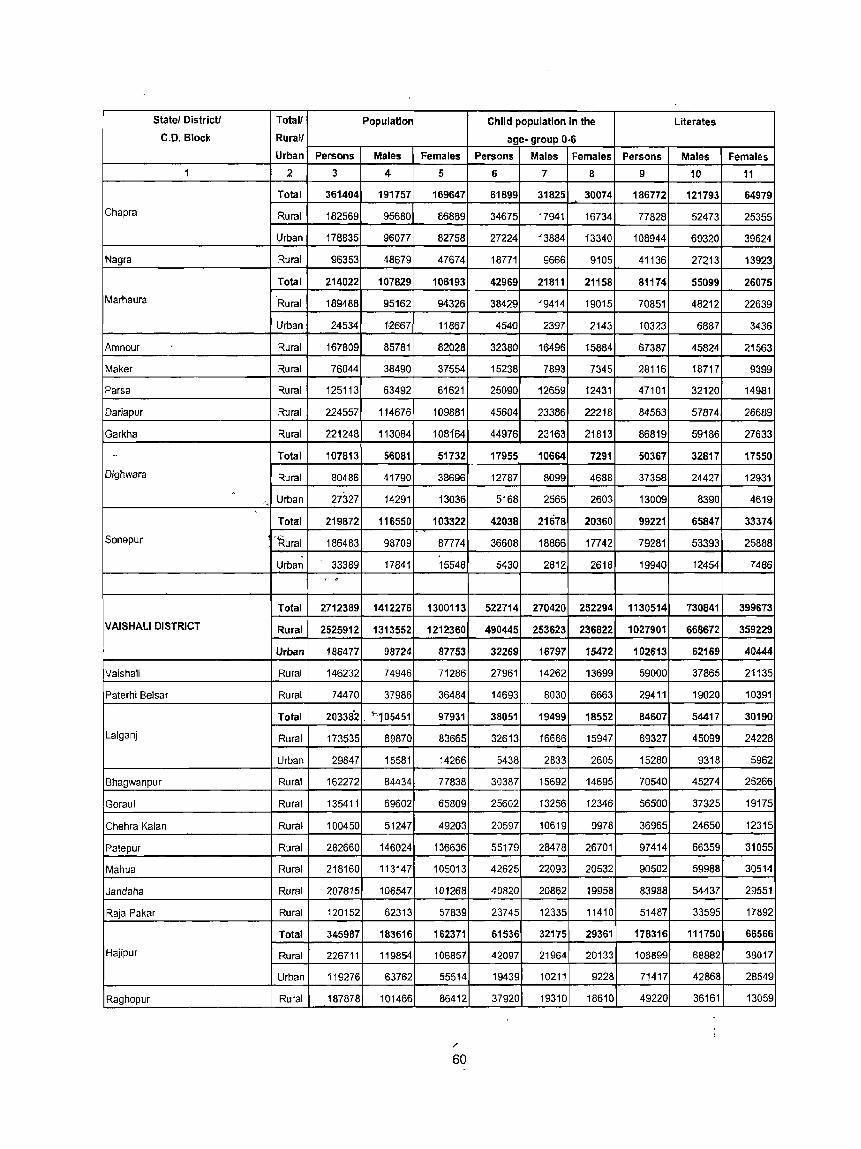
Statel District/ Totall Population Child population in the Literates C.D. Block Rurall age- group 0-6
Urban Persons Males Females Persons Males Females Persons Males Females 1 2 3 4 5 6 7 8 9 10 11
Total 361404 191757 169647 61899 31825 30074 186772 121793 64979
Chapra Rural 182569 95680 86889 34675 17941 16734 77828 52473 25355
Urban 178835 96077 82758 27224 13884 13340 108944 69320 39624
Nagra Rural 96353 48679 47674 18771 9666 9105 41136 27213 13923
Total 214022 107829 106193 42969 21811 21158 81174 55099 26075
Marhaura Rural 189488 95162 94326 38429 19414 19015 70851 48212 22639
Urban 24534 1-2667 11867 4540 2397 2143 10323 6887 3436
Amnour Rural 167809 85781 82028 32380 16496 15884 67387 45824 21563
Maker Rural 76044 38490 37554 15238 7893 7345 28116 18717 9399
Parsa Rural 125113 63492 61621 25090 12659 12431 47101 32120 14981
Dariapur Rural 224557 114676 109881 45604 23386 22218 84563 57874 26689
Garkha Rural 221248 113084 108164 44976 23163 21813 86819 59186 27633
-< Total 107813 56081 51732 17955 10664 7291 50367 32817 17550
Dighwara Rural 80486 41790 38696 12787 8099 4688 37358 24427 12931 .
i' .. Urban 27327 14291 13036 5168 2565 2603 13009 8390 4619
Total 219872 116550 103322 42038 21678 20360 99221 65847 33374
Sonepur c~ural 186483 98709 87774 36608 18866 17742 79281 53393 25888
Urban 33389 17841 15548 5430 2812 2618 19940 12454 7486 , .'
Total 2712389 1412276 1300113 522714 270420 252294 1130514 730841 399673
VAISHALI DISTRICT Rural 2525912 1313552 1212360 490445 253623 236822 1027901 668672 359229
Urban 186477 98724 87753 32269 16797 15472 102613 62169 40444
Vaishali Rural 146232 74946 71286 27961 14262 13699 59000 37865 21135
Paterhi Belsar Rural 74470 37986 36484 14693 8030 6663 29<411 19020 10391
Total 203382 . ~'105451 97931 38051 19499 18552 84607 54417 30190
Lalganj Rural 173535 89870 83665 32613 16666 15947 69327 45099 24228
Urban 29847 15581 14266 5438 2833 2605 15280 9318 5962
Bhagwanpur Rural 162272 84434 77838 30387 15692 14695 70540 45274 25266
Goraul Rural 135411 69602 65809 25602 13256 12346 56500 37325 19175
Chehra Kalan Rural 100450 51247 49203 20597 10619 9978 36965 24650 12315
Patepur Rural 282660 146024 136636 55179 28478 26701 97414 66359 31055
Mahua Rural 218160 113147 105013 42625 22093 20532 90502 59988 30514
Jandaha Rural 207815 106547 101268 40820 20862 19958 83988 54437 29551
Raja Pakar Rural 120152 62313 57839 23745 12335 11410 51487 33595 17892
Total 345987 183616 162371 61536 32175 29361 178316 111750 66566
Hajipur Rural 226711 119854 106857 42097 21964 20133 106899 68882 38017
Urban 119276 63762 55514 19439 10211 9228 71417 42868 28549
Raghopur Rural 187878 101466 86412 37920 19310 18610 49220 36161 13059
/
60

State' District' Totall Population Child population in the literates
C.D. Block Rural' age- group 0-6
Urban Persons Males Females Persons Males Females Persons Males Females
1 2 3 4 5 6 7 8 9 10 11
Bidupur Rural 205797 108351 97446 40054 20826 19228 106590 61480 45110
Desri Rural 77783 40801 36982 15351 7965 7385 32371 21303 11068
Sahdai Buzurg Rural 99535 51940 47595 20191 10534 9657 42343 27926 14417
Total 144405 74405 70000 28002 14484 13518 61260 39291 21969
Mahnar Rural 107051 55024 52027 20610 10731 9879 45344 29308 16036
Urban 37354 19381 17973 7392 3753 3639 15916 9983 5933
Total 3413413 1771249 1642164 695995 357866 338129 1243542 817293 426249
SAMASTIPUR DISTRICT Rural 3289978 1705576 1584402 676346 347716 328630 1164245 770431 393814
Urban 123435 65673 57762 19649 10150 9499 79297 46862 32435
Kalyanpur Rural 259520 135493 124027 53297 27774 25523 90991 60356 30635
Warisnagar Rural 169246 88195 84051 35672 18558 17114 58692 38116 20576
Shivaji Nagar Rural 144511 73491 71020 29914 15302 14612 43489 31172 12317
Khanpur Rural 151378 77707 73671 32735 16753 15982 45956 31988 13968
Total 287454 151600 135854 53169 27430 25739 143405 90443 52962
Samastipur Rural 225458 118293 107165 44562 23084 21478 97898 64108 33790
Urban 61996 33307 28689 8607 4346 4261 45507 26335 19172
Pusa Rural 110432 57179 53253 20269 10460 9809 51518 32732 18786
Tajpur Rural 127585 65554 62031 26016 13345 12671 53243 33621 19622
Morwa Rural 148204 76084 72120 32030 16730 15300 53211 35686 17525
Palor; Rural 143580 74320 69260 29755 15424 14331 51531 34034 17497
Mohanpur Rural 88800 46047 42753 17288 8827 8461 28906 19079 9827
Total 142428 73377 69051 29101 15157 13944 51566 33492 18074
Mohiuddinagar Rural 128664 66241 62423 26201 13644 12557 45529 29778 15751
Urban 13764 7136 6628 2900 1513 1387 6037 3714 2323
Sarairanjan Rural 204124 105152 98972 42574 21771 20803 76961 50862 26099
Vidyapati Nagar Rural 122486 63116 59370 25088 13306 11782 45958 29379 16579
Total 184091 103412 80679 34331 17801 16530 62947 39321 23626
Dalsinghsarai Rural 163910 92758 71152 31034 . 16055 14979 50790 32010 18780
Urban 20181 10654 9527 3297 1746 1551 12157 7311 4846
Ujiarpur Rural 230501 119242 111259 46915 23882 23033 94589 60613 33976
Bibhulpur Rural 260236 132105 128131 54561 28136 26425 98827 63342 35485
Total 159975 82920 77055 32061 16516 15545 59113 39392 19721
Rosera Rural 132481 68344 64137 27216 13971 13245 43517 29890 13627
Urban 27494 14576 12918 4845 2545 230i 15596 9502 6094
Singhia Rural 181047 92334 88713 38020 18250 19770 50331 34728 15603
Hasanpur Rural 178948 92681 86~67 36829 19072 17757 55197 38730 16467
Bilhan Rural 118867 61240 57627 26370 13371 12998 27111 20207 6904
61
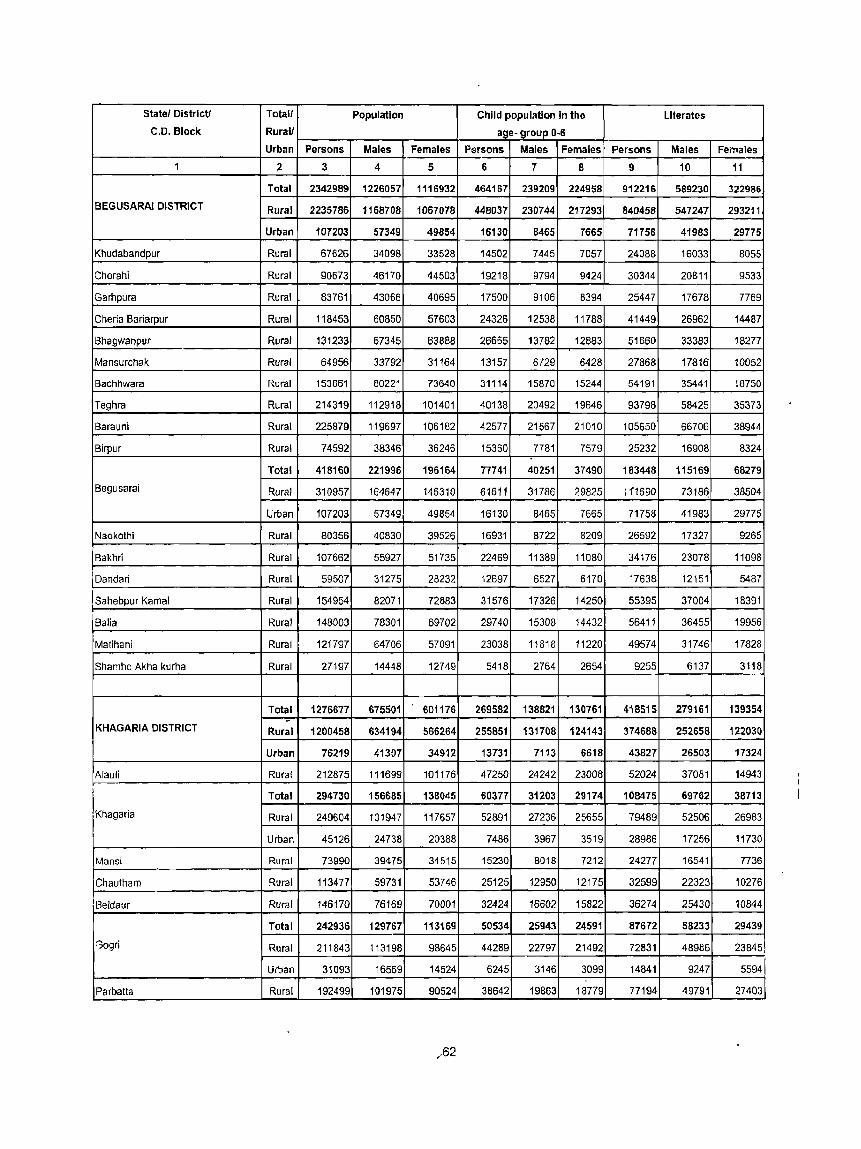
Statel Distrl ctl Total/ Population Child population in the Literates
C.D. Block Rurall age- group 0-6 Urban Persons Males Females Persons Males Females Persons Males Females
1 2 3 4 5 6 7 8 9 10 11
Total 2342989 1226057 1116932 464167 239209 224958 912216 589230 322986
BEGUSARAI DISTRICT Rural 2235786 1168708 1067078 448037 230744 217293 840458 547247 293211
Urban 107203 57349 49S54 16130 8465 7665 71758 41983 29775
Khudabandpur Rural 67626 34098 33528 14502 7445 7057 24088 16033 8055
Chorahi Rural 90673 46170 44503 19218 9794 9424 30344 20811 9533
Garhpura Rural 83761 43066 40695 17500 9106 8394 25447 17678 7769
Cheria Bariarpur Rural 118453 60850 57603 24326 12538 11788 41449 26962 14487
Bhagwanpur Rural 131233 67345 63888 26665 13782 12883 51660 33383 18277
Mansurchak Rural 64956 33792 31164 13157 6729 6428 27868 17816 10052
Bachhwara Rural 153861 B0221 73640 31114 15870 15244 54191 35441 18750
Teghra Rural 214319 112918 101401 40138 20492 19646 93798 58425 35373
Barauni Rural 225879 119697 106182 42577 21567 21010 105650 66706 38944
Birpur Rural 74592 38346 36246 15360 7781 7579 25232 16908 8324 ,
Total 418160 221996 196164 77741 40251 37490 183448 115169 68279
Begusarai Rural 310957 164647 146310 61611 31786 29825 111690 7318~ 38504
Urban 107203 57349 49854 16130 8465 7665 71758 41983 29775
Naokothi Rural 80356 40830 39526 16931 8722 8209 26592 17327 9265
Bakhri Rural 107662 55927 51735 22469 11389 11080 34176 23078 11098
Dandari Rural 59507 31275 28232 12697 6527 6170 17638 12151 5487
Sahebpur Kamal Rural 154954 82071 72883 31576 17326 14250 55395 37004 18391
Balia Rural 148003 78301 69702 29740 15308 14432 56411 36455 19956
Matihani Rural 121797 64706 57091 23038 11818 11220 49574 31746 17828
Shamho Akha kurha Rural 27197 14448 12749 5418 2764 2654 9255 6137 3118
Total 1276677 675501 601176 269582 138821 130761 418515 279161 139354 -KHAGARIA DISTRICT Rural 1200458 634194 566264 255851 131708 124143 374688 252658 122030
Urban 76219 41307 34912 13731 7113 6618 43827 26503 17324
Alauli Rural 212875 111699 101176 47250 24242 23008 52024 37081 14943 I Total 294730 156685 138045 60377 31203 29174 108475 69762 38713
1 Kh',,,,,, Rural 249604 131947 117657 52891 27236 25655 79489 52506 26983
Urban 45126 24738 20388 7486 3967 3519 28986 17256 11730
Mansi Rural 73990 39475 34515 15230 8018 7212 24277 16541 7736
Chautham Rural 113477 59731 53746 25125 12950 12175 32599 22323 10276
IBeldaur Rural 146170 76169 70001 32424 16602 15822 36274 25430 10844
Total 242936 129767 113169 50534 25943 24591 87672 58233 29439
Gogri Rural 211843 113198 98645 44289 22797 21492 72831 48986 23845.
Uiban 31093 16569 14524 6245 3146 3099 14841 9247 55941
Parbatta Rural 192499 101975 90524 38642 19863 18779 77194 49791 27403
,.62

Statel District! Totall Population Child population in the Literates C.D. Block Rural! age- group 0-6
Urban Persons Males Females Persons Males Females Persons Males Females
1 2 3 4 5 6 7 8 9 10 11
Total 2430331 1294192 1136139 456956 232399 224557 992218 638226 353992
BHAGALPUR DISTRICT Rural 1978412 1051749 926663 388239 1.97082 191157 716921 476206 240715
Urban 451919 242443 209476 68717 35317 33400 275297 162020 113277
Narayanpur Rural 81947 43586 38361 16011 8097 7914 29462 19743 9719
Bihpur Rural 96955 51807 45148 18016 9200 8816 38355 24730 13625
Kharik Rural 102873 54731 48142 20966 10516 10450 34453 23270 11183
Total 122750 65839 56911 23367 11914 11473 47397 30805 16592
Naugachhia Rural 84462 45240 39222 16134 8245 7889 29210 19306 9904
Urban 38288 20599 17689 7253 3669 3584 18187 11499 6688
Rangra Chowk Rural 72611 38965 33646 14126 7095 7031 25662 17424 8238
Gopalpur Rural 76434 40769 35665 14691 7403 7288 29135 19293 9842
Pirpainti Rural 219268 116920 102348 43781 22062 21719 74850 49790 25060
Total 300706 159418 141288 59578 31350 28228 115574 76022 39552
Colgong Rural 278596 147713 130883 55806 29432 26374 103002 68620 34382
Urban 22110 11705 10405 37]2 1918 1854 12572 7402 5170
Ismailpur Rural 37629 20036 17593 7986 3825 4161 10368 7540 2828
Sabour Rural 109551 58763 50788 21030 10589 10441 45343 29969 15374
Nathnagar Rural 121933 64997 56936 23662 11963 11699 44640 29517 15123
Total 199868 106749 93119 36897 19018 17879 89212 56895 32317
Sultanganj Rural 158056 84237 73819 29586 15183 14403 67369 43441 23928
Urban 41812 22512 19300 7311 3835 3476 21843 13454 8389
Shahkuncl Rural 153151 80909 72242 29482 14956 14526 57866 37575 20291
Goradih Rural 112647 60086 52561 23067 11664 11403 34771 24165 10606
Total 471441 251801 219640 73272 37354 35918 267167 158360 108807
Jagdishpur Rural 121732 64174 57558 22891 11459 11432 44472 28695 15777
Urban 349709 187627 162082 50381 25895 24486 222695 129665 93030
Sonhaula Rural 150567 78816 71751 31004 15393 15611 47963 33128 14835
Total 1608778 843061 765717 323329 166872 156457 557859 380549 177310
BANKA DISTRICT Rural 1552432 812894 739538 313878 162047 151831 529368 363166 166202
Urban 56346 30167 26179 9451 4825 4626 28491 17383 11108
Shambhuganj Rural 141460 75732 65728 26800 13989 12811 59208 38648 20560
Total 182866 96456 86410 34870 17741 17129 70997 46137 24860
Amarpur Rural 161936 85499 76437 31016 15806 15210 62124 40691 21433
Urban 20930 10957 9973 3854 1935 1919 8873 5446 3427
Rajaun Rural 162643 85559 71084 31596 16256 15640 61146 40524 20622
Dhuraiya Rural 186299 97706 88593 39274 19774 19500 62570 42747 19823
Barahat Rural 121661 63415 58246 23881 12211 11670 49499 32527 16972
63

State! District! Totall Population Child population in the Literates
C.D. Block Rurall age· group 0·6 Urban Persons Males Females Persons Males Females Persons Males Females
1 2 3 4 5 6 7 8 9 10 11
Total 169292 88953 80339 32850 16923 15927 60316 40448 1986B
8anka Rural 133876 69743 64133 27253 14033 13220 40698 28511 12187
Urban 35416 19210 16206 5597 2890 2707 19618 11937 7681
Phulidumar Rural 94527 49483 45044 18950 9685 9265 30870 21946 8924
Belhar Rural 129268 67013 62255 29117 16736 12381 44923 31150 13773
Chanan Rural - 126116 64969 61147 26604 13392 13212 33140 25550 7590
katoria Rural 146952 76573 70379 30739 15736 15003 32396 24881 7515
Bausi Rural 147694 77202 70492 28348 14429 13919 52794 35991 16803
Total 1135499 604662 530837 197144 102928 94216 564043 354611 209432
MUNGER DISTRICT Rural 818913 435774 383139 150156 78809 71347 356799 233051 123748
Urban 316586 168888 147698 46988 24119 22869 207244 121560 85684
Total 296950 159243 137707 48399 25084 23315 168940 101494 67446
Munger Rural 109639 58869 50770 20323 10555 9768 48817 30891 17926
Urban 187311 100374 86937 28076 14529 13547 120123 70603 49520
Bariarpur Rural 92431 49632 42799 17015 8630 8385 40604 26816 13788
Total 181571 96522 85049 28735 14829 13906 114768 68267 46501
Jamalpur Rural 84912 45260 39652 15447 8079 7368 44411 27434 16977
Urban 96659 51262 45397 13288 6750 6538 70357 40833 29524
Dharhara Rural 103919 55197 48722 19601 10295 9306 42986 28509 14477
Total 181008 96183 84825 30683 16619 14064 77249 51253 25996
Kharagpur Rural 154098 81942 72156 25872 14196 11676 64470 43428 21042
Urban 26910 14241 12669 4811 2423 2388 12779 7825 4954
Total 59562 31620 27942 11276 5832 5444 25108 16175 8933
Asarganj Rural 53856 28609 25247 10463 5415 5048 21123 13876 7247
Urban 5706 3011 2695 813 417 396 3985 2299 1686
Tarapur Rural 84341 44060 40281 16311 8531 7780 36289 23470 12819
Tetia Bombar Rural 57622 30869 26753 10796 5586 5210 23882 16395 7487
Sangrampur Rural 78095 41336 36759 14328 7522 6806 34217 22232 11985
Total 801173 416727 384446 160210 81944 78266 309009 204125 104884
LAKHISARAI DISTRICT Rural 683568 354279 329309 139937 71520 68417 249449 167120 82329
Urban 117585 62448 55137 20273 10424 9849 59560 37005 22555
Total 122571 64473 58098 22684 11664 11020 51732 33160 18572
Barahiya Rural 82826 43400 39426 16672 8575 8097 30804 20455 10349
Urban 39745 21073 18672 6012 3089 2923 20928 12705 8223
Pipariya Rural 31020 16330 14690 5573 2864 2709 13960 8904 5056
Surajgarha Rural 224318 115731 108587 45427 23456 21971 92043 59064 32979
64

Statel District! Totall Population Child population in the Literates C.D. Block Rural! age- group 0-6
Urban Persons Males Females Persons Males Females Persons Males Females 1 2 3 4 5 6 7 8 9 10 11
Total 261620 137017 124603 52877 26865 26012 96469 65449 31020
Lakhisarai Rural 183780 95642 88138 38616 19530 19086 57837 41149 16688
Urban 77840 41375 36465 14261 7335 6926 38632 24300 14332
Ramgarh Chowk Rural 71006 36528 34478 14304 7235 7069 24477 16426 8051
Halsi Rural 90638 46648 43990 19345 9860 9485 30328 21122 9206
Total 525137 273468 251669 106335 54278 52057 205234 137116 68118
SHEIKHPURA DISTRICT Rural 443837 230375 213462 91310 46595 44715 163234 110843 52391
Urban 81300 43093 38207 15025 7683 7342 42000 26273 15727
Total 115517 60214 55303 22412 11389 11023 53298 34315 18983
Barbigha Rural 77259 40056 37203 15159 7660 7499 33390 21693 11697
Urban 38258 20158 18100 7253 3729 3524 19908 12622 7286
Shekhopur Sarai Rural 58805 30400 28405 11523 5880 5643 24568 16157 8411
Total 164769 86283 78486 32474 16653 15821 68306 44564 23742
Sheikhpura Rural 121727 63348 58379 24702 12699 12003 46214 30913 15301
Urban 43042 22935 20107 7772 3954 3818 22092 13651 8441
Ghat Kusumbha Rural 36456 18849 17607 8207 4189 4018 11241 8120 3121
Chewara Rural 61559 32185 29374 12996 6655 6341 20107 14124 5983
Ariari Rural 88031 45537 42494 18723 9512 9211 27714 19836 7878
Total 2368327 1236467 1131860 444749 229109 215640 1031882 674304 357578
NALANDA DISTRICT Rural 2014884 1050249 964635 386430 198633 187797 827261 552506 274755
Urban 353443 186218 167225 58319 30476 27843 204621 121798 82823
Karai Parsurai Rural 60950 32228 28722 11179 5788 5391 21726 14959 6767
Nagar Nausa Rural 71713 37031 34682 13771 7001 6770 28768 19166 9602
Harnaut Rural 143803 75595 68208 27215 13981 13234 60785 40402 20383
Chandi Rural 125816 65639 60177 24134 12435 11699 53549 35718 17831
Rahui Rural 128027 66826 61201 25937 13416 12521 53401 36000 17401
Bind Rural 56251 29571 26680 11109 5650 5459 20433 14065 6368
Sarmera Rural 78674 40901 37773 15673 7998 7675 28548 19556 8992
Aslhawan Rural 143827 74676 69151 27339 13890 13449 57046 37461 19585
Total 394435 206849 187586 68088 35261 32827 203922 125557 78365
Bihar Rural 162463 85036 77427 31824 16364 15460 64862 44211 20651
Urban 231972 121813 110159 36264 18897 17367 139060 81346 57714
Noorsnrai Rural 137250 71164 66086 26889 13938 12951 57710 38427 19283
Tharthari Rural 51978 27240 24738 9558 4962 4596 21790 14616 7174
Parbalpur Rural 58333 30335 27998 10612 5467 5145 27600 17656 9944
65
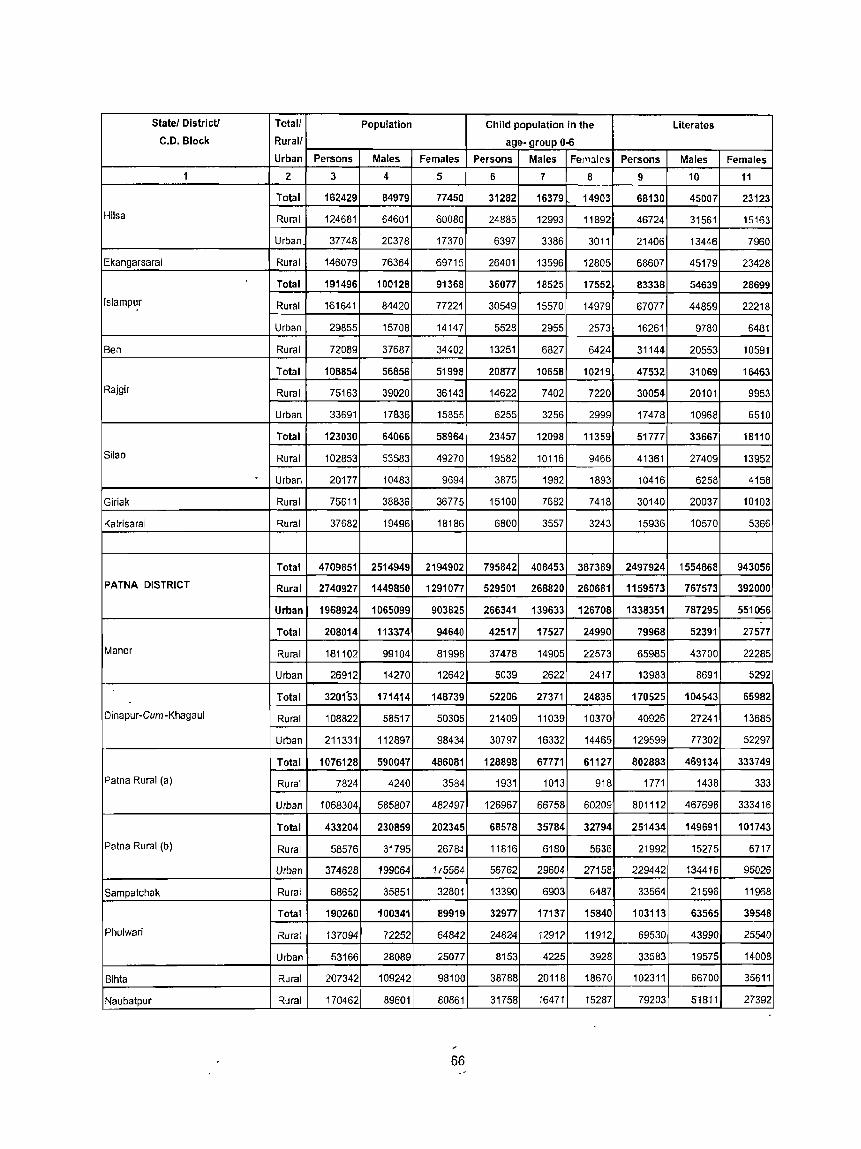
State/Districtl Tetal/ Population Child population in the Literates
C.D. Block Rurall age- group 0-6 Urban Persons Males Females Persons Males FelnJlcs Persons Males Females
1 2 3 4 5 6 7 B 9 10 11
Total 162429 84979 77450 31282 16379 14903 68130 45007 23123
Hilsa Rural 124681 64601 60080 24885 12993 11892 46724 31561 15163
Urban 37748 20378 17370 6397 3386 3011 21406 13446 7960
Ekangarsaral Rural 146079 76364 69715 26401 13596 12805 68607 45179 23428
Total 191496 100128 91368 36077 18525 17552 83338 54639 28699
Islampur Rural 161641 84420 77221 30549 15570 14979 67077 44859 22218
Urban 29855 15708 14147 5528 2955 2573 16261 9780 6481
Ben Rural 72089 37687 34402 13251 6827 6424 31144 20553 10591
Total 108854 56856 51998 20877 10658 10219 47532 31069 16463
Rajgir Rural 75163 39020 36143 14622 7402 7220 30054 20101 9953
Urban 33691 17836 15855 6255 3256 2999 17478 10968 6510
Total 123030 64066 58964 23457 12098 11359 51777 33667 18110
Silao Rural 102853 53583 49270 19582 10116 9466 41361 27409 13952
- Urban 20177 10483 9694 3875 1982 1893 10416 6258 4158
Giriak Rural 75611 38836 36775 15100 7682 7418 30140 20037 10103
Katrisarai Rural 37682 19496 18186 6800 3557 3243 15936 10570 5366
Total 4709851 2514949 2194902 795842 408453 387389 2497924 1554868 943056
PATNA DISTRICT Rural 2740927 1449850 1291077 529501 268820 260681 1159573 767573 392000
Urban 1968924 1065099 903825 266341 139633 126708 1338351 787295 551056
Total 208014 113374 94640 42517 17527 24990 79968 52391 27577
Maner Rural 181102 99104 81998 37478 14905 22573 65985 43700 22285
Urban 26912 14270 12642 5039 2622 2417 13983 8691 5292
Total 3201'53 171414 148739 52206 27371 24835 170525 104543 65982
Dinapur-Cum-Khagaul Rural 108822 58517 50305 21409 11039 10370 40926 27241 13685
Urban 211331 112897 98434 30797 16332 14465 129599 77302 52297
Total 1076128 590047 486081 12889B 67771 61127 802883 469134 333749
Patna Rural (a) Rural 7824 4240 3584 1931 1013 918 1771 1438 333
Urban 1068304 585807 482497 126967 66758 60209 801112 467696 333416
Total 433204 230859 202345 68578 35784 32794 251434 149691 101743
Patna Rural (b) Rural 58576 31795 2678.1 11816 6180 5636 21992 15275 6717
Urban 374628 199064 1/5564 56762 29604 27158 229442 134416 95026
Sampatchak Rural 68652 35851 32801 13390 6903 6487 33564 21596 11968
Total 190260 100341 89919 32977 17137 15840 103113 63565 39548
Phulwari Rural 137094 72252 64842 24824 12912 11912 69530 43990 25540
Urban 53166 28089 25077 8153 4225 3928 33583 19575 14008
Bihta Rural 207342 109242 98100 38788 20118 18670 102311 66700 35611
Naubatpur Rural 170462 89601 80861 31758 16471 15287 79203 51811 27392
66

Statel Districtf Totall Population Child population in the Literates C.D. Block Ruralf age· group 0·6
Urban Persons Males Females Persons Males Females Persons Males Females
1 2 3 .t 5 6 7 8 9 10 11
Bikram Rural 139031 72273 66758 25316 13191 12125 66000 42903 23097
Dulhin Bazar Rural 103397 53843 49554 19426 10121 9305 45709 30058 15651
Paliganj Rural 206177 107744 98433 38173 19442 18731 94430 61691 32739
Total 204910 106863 98047 38623 20200 18423 90496 59242 31254
Masaurhi Rural 157967 82070 75897 30770 16117 14653 64161 43175 20986
Urban 46943 24793 22150 7853 4083 3770 26335 16067 10268
Dhanarua Rural 174642 91252 83390 33345 17032 16313 74036 49819 24217
Punpun Rural 117138 61598 55540 21663 11153 10510 51685 33896 17789
Total 154059 82072 71987 29738 15737 14001 63859 42865 20994
Fatwah Rural 115697 61474 54223 23276 12323 10953 43594 30420 13174
Urban 38362 20598 17764 6462 3414 3048 20265 12445 7820
Daniawan Rural 59896 31768 28128 12639 5988 6651 26835 16905 9930
Total 80436 42612 37824 16078 8435 7643 30393 20191 10202
Khusrupur Rural 68251 36166 32085 13950 7334 6616 23847 16199 7648
Urban 12185 6446 5739 2128 1101 1027 6546 3992 2554
Total 172205 92399 79806 34196 17757 16439 68636 45762 22874
Bakhtiarpur Rural 139917 75166 64751 28349 14738 13611 51631 35058 16573
Urban 32288 17233 15055 5847 _ 3019 2828 17005 10704 6301
Athmalgola Rural 65914 35249 30665 13588 7056 6532 28449 18648 9801
Belch hi Rural 48467 25406 23061 9182 4687 4495 18018 12188 5830
Total 162378 86707 75671 30004 15445 14559 74839 47825 27014
Barh Rural 113973 60610 53363 22629 11585 11044 46129 30670 15459
Urban 48405 26097 22308 7375 3860 3515 28710 17155 11555
Pandarak Rural 123450 64870 58580 24411 12489 11922 44980 30623 14357
Ghoswari Rural 56312 30286 26026 11331 5694 5637 17008 12581 4427
Total 167224 89278 77946 29017 14944 14073 79550 50240 29310
Mokameh Rural 110824 59473 51351 20059 10329 9730 47779 30988 16791
Urban 56400 29805 26595 8958 4615 4343 31771 19252 12519
Total 2233415 1175333 1058082 406343 209650 196693 1090868 722112 368756
BHOJPUR DISTRICT Rural 1921121 1006468 914653 356473 183629 172844 897094 605344 291750
Urban 312294 168865 143429 49870 26021 23849 193774 116768 77006
Total 186341 98667 87674 33763 17487 16276 84224 57532 26692
Shahpur Rural 171885 91107 80778 31001 16094 14907 77480 53132 24348
Urban 14456 7560 6896 2762 1393 1369 6744 4400 2344
Total 369648 197792 171856 61256 31897 29359 216906 135866 81040
Arrah Rural 166253 87916 78337 31390 16186 15204 81527 55074 26453
Urban 203395 109876 93519 29866 15711 14155 135379 80792 54587
·67
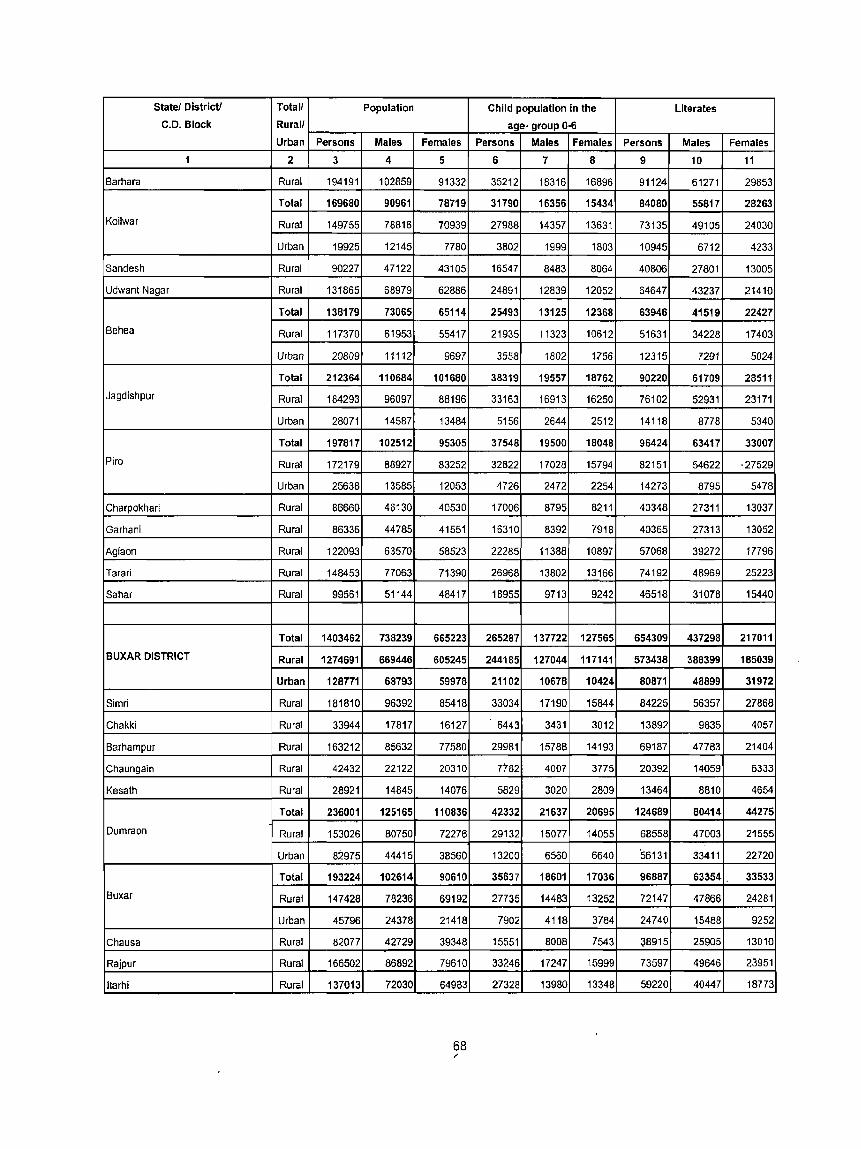
Statel District! Totall Population Child population in the Literates C.D. Block Rurall age- group 0-6
Urban Persons Males Females Persons Males Females Persons Males Females
1 2 3 4 5 6 7 8 9 10 11
Barhara Rural 194191 102859 91332 35212 18316 16896 91124 61271 29853
Total 169680 90961 78719 31790 16356 15434 84080 55817 28263
Koilwar Rural 149755 78816 70939 27988 14357 13631 73135 49105 24030
Urban 19925 12145 7780 3802 1999 1803 10945 6712 4233
Sandesh Rural 90227 47122 43105 16547 8483 8064 40806 27801 13005
Udwant Nagar Rural 131865 68979 62886 24891 12839 12052 64647 43237 21410
Total 138179 73065 65114 25493 13125 12368 63946 41519 22427
Behea Rural 117370 61953 55417 21935 11323 10612 51631 34228 17403
Urban 20809 11112 9697 3558 1802 1756 12315 7291 5024
Total 212364 110684 101680 38319 19557 18762 90220 61709 28511
Jagdishpur Rural 184293 96097 88196 33163 16913 16250 76102 52931 23171
Urban 28071 14587 13484 5156 2644 2512 14118 8778 5340
Total 197817 102512 95305 37548 19500 18048 96424 63417 33007
Piro Rural 172179 88927 83252 32822 17028 15794 82151 54622 ·27529
Urban 25638 13585 12053 4726 2472 2254 14273 8795 5478
Charpokhari Rural 86660 46130 40530 17006 8795 8211 40348 27311 13037
Garhani Rural 86336 44785 41551 16310 8392 7918 40365 27313 13052
Agiaon Rural 122093 63570 58523 22285 11388 10897 57068 39272 17796
Tarari Rural 148453 77063 71390 26968 13802 13166 74192 48969 25223
Sahar Rural 99561 51144 48417 18955 9713 9242 46518 31078 15440
Total 1403462 738239 665223 265287 137722 127565 654309 437298 217011
BUXAR DISTRICT Rural 1274691 669446 605245 244185 127044 117141 573438 388399 185039
Urban 128771 68793 59978 21102 10678 10424 80871 48899 31972
Simri Rural 181810 96392 85418 33034 17190 15844 84225 56357 27868
Chakki Rural 33944 17817 16127 6443 3431 3012 13892 9835 4057
Barhampur Rural 163212 85632 77580 29981 15788 14193 69187 47783 21404
Chaungain Rural 42432 22122 20310 7782 4007 3775 20392 14059 6333
Kesalh Rural 28921 14845 14076 5829 3020 2809 13464 8810 4654
Total 236001 125165 110836 42332 21637 20695 124689 80414 44275
Dumraon Rural 153026 80750 72276 29132 15077 14055 68558 47003 21555
Urban 82975 44415 38560 13200 6560 6640 56131 33411 22720
Total 193224 102614 90610 35637 18601 17036 96887 63354 33533
Buxar Rural 147428 78236 69192 27735 14483 13252 72147 47866 24281
Urban 45796 24378 21418 7902 4118 3784 24740 15488 9252
Chausa Rural 82077 42729 39348 15551 8008 7543 ~8915 25905 13010
Rajpur Rural 166502 86892 79610 33246 17247 15999 73597 49646 23951
Itarhi Rural 137013 72030 64983 27328 13980 13348 59220 40447 18773
68 r
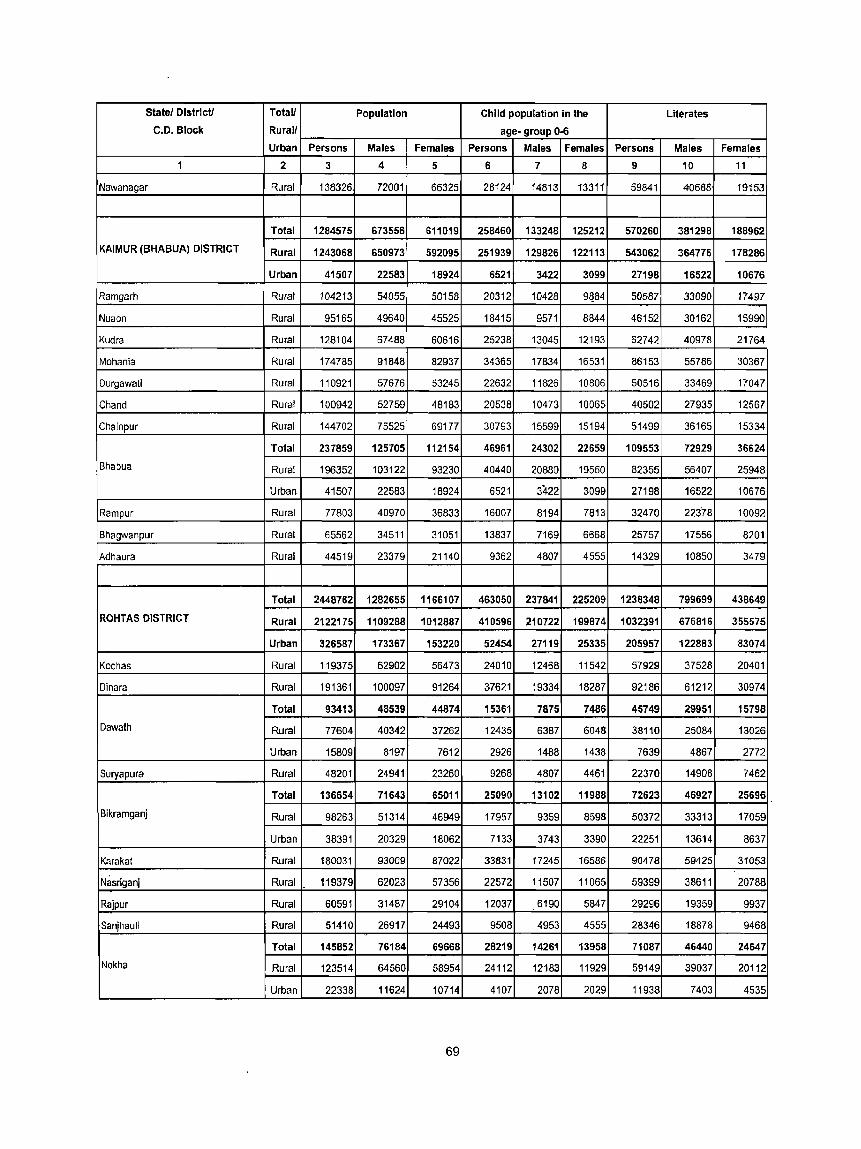
Statel District! Totall Population Child population in the Literates C.D. Block Rural! age- group 0-6
Urban Persons Males Females Persons Males Females Persons Males Females
1 2 3 4 5 6 7 8 9 10 11
Nawanagar Rural 138326 72001 66325 28124 14813 13311 59841 40688 19153
Total 1284575 673556 611019 258460 133248 125212 570260 381298 188962
KAIMUR (BHABUA) DISTRICT Rural 1243068 650973 592095 251939 129826 122113 543062 364776 178286
Urban 41507 22583 18924 6521 3422 3099 27198 16522 10676
Ramgarh Rural 104213 54055 50158 20312 10428 91!84 50587 33090 17497
Nuaon Rural 95165 49640 45525 18415 9571 8844 46152 30162 15990
Kudra Rural 128104 67488 60616 25238 13045 12193 62742 40978 21764
Mohania Rural 174785 91848 82937 34365 17834 16531 86153 55786 30367
Durgawati Rural 110921 57676 53245 22632 11826 10806 50516 33469 17047
Chand Rural 100942 52759 48183 20538 10473 10065 40502 27935 12567
Chainpur Rural 144702 75525 69177 30793 15599 15194 51499 36165 15334
Total 237859 125705 112154 46961 24302 22659 109553 72929 36624
Bhabua Rural 196352 103122 93230 40440 20880 19560 82355 56407 25948
Urban 41507 22583 18924 6521 3422 3099 27198 16522 10676
Rampur Rural 77803 40970 36833 16007 8194 7813 32470 22378 10092
Bhagwanpur Rural 65562 34511 31051 13837 7169 6668 25757 17556 8201
Adhaura Rural 44519 23379 21140 9362 4807 4555 14329 10850 3479
Total 2448762 1282655 1166107 463050 237841 225209 1238348 799699 438649
ROHTAS DISTRICT Rural 2122175 1109288 1012887 410596 210722 199874 1032391 676816 355575
Urban 326587 173367 153220 52454 27119 25335 205957 122883 83074
Kochas Rural 119375 62902 56473 24010 12468 11542 57929 37528 20401
Dinara Rural 191361 100097 91264 37621 19334 18287 92186 61212 30974
Total 93413 48539 44874 15361 7875 7486 45749 29951 15798
Dawath Rural 77604 40342 37262 12435 6387 6048 38110 25084 13026
Urban 15809 8197 7612 2926 1488 1438 7639 4867 2772
Suryapura Rural 48201 24941 23260 9268 4807 4461 22370 14908 7462
Total 136654 71643 65011 25090 13102 11988 72623 46927 25696
Bikramganj Rural 98263 51314 46949 17957 9359 8598 50372 33313 17059
Urban 38391 20329 18062 7133 3743 3390 22251 13614 8637
Karakat Rural 180031 93009 87022 33831 17245 16586 90478 59425 31053
Nasriganj Rural 119379 62023 57356 22572 11507 11065 59399 38611 20788
Rajpur Rural 60591 31487 29104 12037 6190 5847 29296 19359 9937
Sanjhauli Rural 51410 26917 24493 9508 4953 4555 28346 18878 9468
Total 145852 76184 69668 28219 14261 13958 71087 46440 24647
Nokha Rural 123514 64560 58954 24112 12183 11929 59149 39037 20112
Urban 22338 11624 10714 4107 2078 2029 11938 7403 4535
69

Statel District! Totall Population Child population in the Literates C.D. Block Rurall age·.group 0-6
Urban Persons Males Females Persons Males Females Persons Males Females 1 2 3 4 5 6 7 8 9 10 11
Kargahar Rural 179246 94403 84843 35994 18661 17333 91055 58984 32071
Chenari Rural 107058 56115 50943 21766 11124 10642 48110 31603 16507
NauhaUa Rural 75853 39547 36306 14987 7798 7189 28233 19646 8587
Sheosagar Rural 144150 75183 68967 29067 14710 14357 69658 45414 24244
Total 295841 156337 139504 53838 27642 26196 165080 101731 63349
Sasaram Rural 164799 86672 78127 33416 17094 16322 79780 51838 27942
Urban 131042 69665 61377 20422 10548 9874 85300 49893 35407
Akorhi Gola Rural 98504 51668 46836 17951 9147 8804 49632 32363 17269
Total 233147 123372 109775 39930 20637 19293 137373 84981 52392
Oehri Rural 114140 59820 54320 22064 11375 10689 58544 37875 20669
Urban 119007 63552 55455 17866 9262 8604 78829 47106 31723
Tilouthu Rural 90157 47113 43044 17394 8945 8449 43051 27867 15184
Rohtas Rural 78539 41175 37364 14606 7435 7171 36693 23871 12822
Total 1511406 783960 727446 282774 148160 134614 688428 450803 237625
JEHANABAD DISTRICT Rural 1399513 724219 675294 264371 138377 125994 623527 411420 212107
Urban 111893 59741 52152 18403 9783 8620 64901 39383 25518
Arwal Rural 130509 67410 63099 25044 13091 11953 63097 41320 21777
Kaler Rural 127445 65513 61932 23097 11875 11222 62894 40884 22010
Karpi Rural 165045 85995 79050 30037 15644 14393 71236 47861 23375
Sonbhadra Banshi Suryapur Rural 61593 31860 29733 10965 5789 5176 26352 17767 8585
Kurtha Rural 102337 52664 49673 21038 11148 9890 44458 28912 15545
Ratni Faridpur Rural 122643 63287 59356 23604 12697 10907 54234 36133 18101
Total 207899 109837 98062 37080 19432 17648 106058 67344 38714
Jehanabad Rural 126176 65845 60331 23740 12297 11443 54594 36402 18192
Urban 81723 43992 37731 13340 7135 6205 51464 30942 20522
Kako Rural 142862 73846 69016 28139 14912 13227 60416 40011 20405
Modanganj Rural 70116 36038 34078 12962 6710 6252 30520 19982 10538
Ghoshi Rural 88842 45804 43038 16783 8719 8064 39023 25550 13473
Total 215012 111811 103201 39333 20362 18971 95092 62218 32874
Makhdumpur Rural 184842 96062 88780 34270 17714 16556 81655 53777 27878
Urban 30170 15749 1442.1 5063 2648 2415 13437 8441 4995
Hulasganj Rural 77103 39895 37208 14692 7781 6911 35048 22821 12227
Total 2004960 1035757 969203 378763 196056 182707 935133 604461 330672
AURANGABAD DISTRICT Rural 1836127 946826 889301 350217 181117 169100 832971 544076 288895
i Urban 168833 88931 . 79902 28546 14939 13607 102162 60385 41777
70 "

Statel Distrlctl Totall Population Child population in the Literates C.D. Block Rurall age- group 0-6
Urban Persons Males Females Persons Males Females Persons Males Females
1 2 3 4 5 6 7 8 9 10 11
Total 167375 86544 80831 30474 15766 14708 82534 52592 29942
Oaudnagilr Rural 129398 66663 62735 23646 12125 11521 61761 40118 21643
Urban 37977 19881 18096 6828 3641 3187 20773 12474 8299
Haspura Rural 124854 63754 61100 23734 12055 11679 57737 37396 20341
Goh Rural 184741 95378 89363 35880 18842 17038 80849 54639 26210
Total 237301 122603 114698 45231 23676 21555 100316 65936 34380
Rafiganj Rural 213412 110072 103340 40714 21282 19432 88709 59020 29689
Urban 23889 12531 11358 4517 2394 2123 11607 6916 4691
Obra Rural 178850 92725 86125 33285 17272 16013 86649 55829 30820
Total 222067 116402 105665 39945 20586 19359 ·124258 76973 47285
Aurangabad Rural 134141 69647 64494 26197 13488 12709 64578 42143 22435
Urban 87926 46755 41171 13748 7098 6650 59680 34830 24850
Barun Rural 161299 84044 77255 30659 15744 14915 79222 51768 27454
Total 238763 122885 115878 45407 23749 21658 108328 70130 38198
Nabinagar Rural 219722 113121 106601 41954 21943 20011 98226 63965 34261
Urban 19041 9764 9277 3453 1806 1647 10102 6165 3937
Kutumba Rural 185380 95880 89500 35262 18067 17195 84268 54250 30018
Oeo Rural 137835 70197 67638 26073 13096 12977 59548 38673 20875
Madanpur Rural 166495 85345 81150 32813 17203 15610 71424 46275 25149
Total 3464983 1789231 1675752 666327 340443 325884 1429291 924486 504805
GAYA DISTRICT Rural 2989942 1536340 1453602 595868 304007 291861 1117549 740961 376588
Urban 475041 252891 222150 70459 36436 34023 311742 183525 128217
Konch Rural 155856 80104 75752 30997 15969 15028 66953 44799 22154
Total 209944 108331 101613 38943 20055 1888~ 97056 63173 338&3
Tikqri Rural 192329 99139 93190 35928 18493 17435 85500 56410 29090
Urban 17615 9192 8423 3015 1562 1453 11556 6763 4793
Belaganj Rural 177233 91353 85880 33424 17058 16366 76654 50236 26418
Khizirsarai Rural 142772 73704 69068 26920 13630 13290 59223 39220 20003
Neem Chak Bathani Rural 79110 40724 38386 15678 8129 7549 28563 19908 8655
Muhra Rural 77278 39754 37524 14357 7327 7030 29390 19489 9901
Alri Rural 65109 33514 31595 12184 6104 6080 22670 16022 6648
Manpur Rural 108608 56019 52589 22320 11791 10529 42086 26824 15262
Total 524762 278443 ·246319 83168 43029 40139 319747 189315 130432
Gaya Town C.D.Block Rural 130577 68517 62060 27215 14117 13098 53479 33641 19838
Urban 394185 209926 184259 55953 28912 27041 266268 155674 110594
Paraiya Rural 83838 43176 40662 17023 8546 8477 34385 23225 11160
Guraru Rural 112270 57999 54271 21748 11059 10689 47860 31595 16265
71

State' District! Total! Population Child population in the Literates
C.D. Block Rural! age- group 0-6 Urban Persons Males Females Persons Males Females Persons Males Females
1 2 3 4 5 6 7 8 9 10 11
Gurua Rural 142737 72514 70223 30023 15296 14727 55125 36003 19122
Amas Rural 80296 41581 38715 15714 8137 7577 32276 21055 11221
Banke Bazar Rural 99874 50909 48965 20682 10554 10128 33559 20887 12672
Imamganj Rural 151491 77612 73879 31084 15652 15432 49039 32128 16911
Dumaria Rural 100317 51251 49066 21652 10904 10748 29090 19647 9443
Total 120500 62202 58298 23579 12163 11416 46874 28895 17979
Sherghati Rural 88142 45180 42962 17501 8970 8531 28806 18337 10469
Urban 32358 17022 15336 6078 3193 2885 18068 10558 7510
Dobhl Rural 117890 59839 58051 24512 12326 12186 34617 23736 10881
Total 185639 96749 88890 35734 18152 17582 72700 48520 24180
Bodh Gaya Rural 154756 79998 74758 30321 15383 14938 56850 37990 18860
Urban 30883 16751 14132 5413 2769 2644 15850 10530 5320
Tan Kuppa Rural 92165 47546 44619 18701 10210 8491 28577 19705 8872
Waz[rganj Rural 179084 92522 86562 34791 17739 17052 73720 47648 26072
-Fatehpur Rural 185501 94474 91027 36993 18417 18576 60360 41847 18513
Mohanpur Rural 160832 81498 79334 33459 17038 16421 51088 35228 15860
Barachatti Rural 111877 57413 54464 '22641 11158 11483 37679 25381 12298
Total 1809425 928638 880787 346564 175549 171015 692751 461059 231692
NAWADA DISTRICT Rural 1.670759 855675 815084 323772 163747 160025 609779 412203 197576
Urban 138666 72963 65703 22792 11802 10990 82972 48856 34116
Nardiganj Rural 96809 49783 47026 18266 9172 9094 34491 23609 10882
Total 257439 134393 123046 47109 24260 22849 120626 76284 44342
Nawada Rural 175148 90654 84494 34182 17498 16684 66841 45078 21763
Urban 82291 "43739 38552 12927 6762 6165 53785 31206 22579
Total 155167 80128 75039 28773 14564 14209 62567 40991 21576
Warisaliganj Rural 123837 63804 60033 23410 11806 11604 46039 30974 15065
Urban 31330 16324 15006 5363 2758 2605 16528 10Q17 6511
Kashi Chak Rural 65467 34005 31462 12353 6124 6229 27263 18001 9262
Pakribarawan Rural 148908 76831 72077 29103 14867 14236 52185 35194 16991
Kawakol Rural 129168 66512 62656 25458 12795 12663 38961 27703 11258
Roh Rural 127022 65093 61929 23727 11934 11793 44011 29867 14144
Govindpur Rural 77654 38845 38809 16353 8173 8180 28674 19296 9378
Mbarpur Rural 185285 94943 90342 36185 18525 17660 68916 45685 23231
Total 114521 58552 55969 21438 10868 10570 45223 29702 15521
Hisua Rural 89476 45652 43824 16936 8586 8350 32564 22069 10495
Urban 25045 12900 12145 4502 2282 2220 12659 7633 5026
Narhat Rural 85510 43021 42489 16394 8326 8068 36717 23783 12934
72

Statel District! TotaU Population Child population In the Literates
C.D. Brock Rural! age- group 0-6 Urban Persons Males Females Persons Males Females Persons Males Females
1 2 3 4 5 6 7 8 9 10 11
Meskaur Rural 92211 46835 45376 16975 8542 8433 34184 23351 10833
Sirdala Rural 136576 69433 67143 27224 13753 13471 48488 33740 14748
Rajauli Rural 137688 70264 67424 27206 13646 13560 50445 33853 16592
Total 1397474 728812 66B662 26476B 134B41 129927 484164 339128 145036
JAMUl DISTRICT Rural 1294298 673840 620458 247826 126026 121800 424553 302243 122310
Urban 103176 54972 48204 16942 8815 8127 59611 36885 22726
isiamnagar Ahganj Rural 113356 58893 54463 21875 11237 10638 41634 27487 14147
Sikandra Rural 122463 63425 59038 23705 12058 11647 42616 29522 13094
Total 180884 95118 85766 34143 17432 16711 77626 51048 26578
Jamui Rural 114132 59565 54567 22824 11603 11221 40851 28043 12808
Urban 66752 35553 31199 11319 5829 5490 36775 23005 13770
Barhat Rural 74303 39452 34851 14144 7188 6956 27721 19264 8457
Lakshmipur Rural 98440 51377 47063 19678 10060 9618 30645 22079 8566
Total 215672 112947 102725 38391 19611 18780 74617 52227 22390
Jhajha Rural 179248 93528 85720 32768 16625 16143 51781 38347 13434
Urban 36424 19419 17005 5623 2986 2637 22836 13880 8956
Gidhaur Rural 60633 31908 28725 11224 5823 5401 24650 17050 7600
Khaira Rural 176535 91295 85240 33785 17177 16608 62070 44217 17853
Sono Rural 168194 87240 80954 33072 16883 16189 46704 34956 11748
Chakai Rural 186994 97157 89837 34751 17372 17379 55881 41278 14603
Note:- For those C.D. Blocks. which do not contain any urban component. the relevent data have been presented for
rural areas only.
73

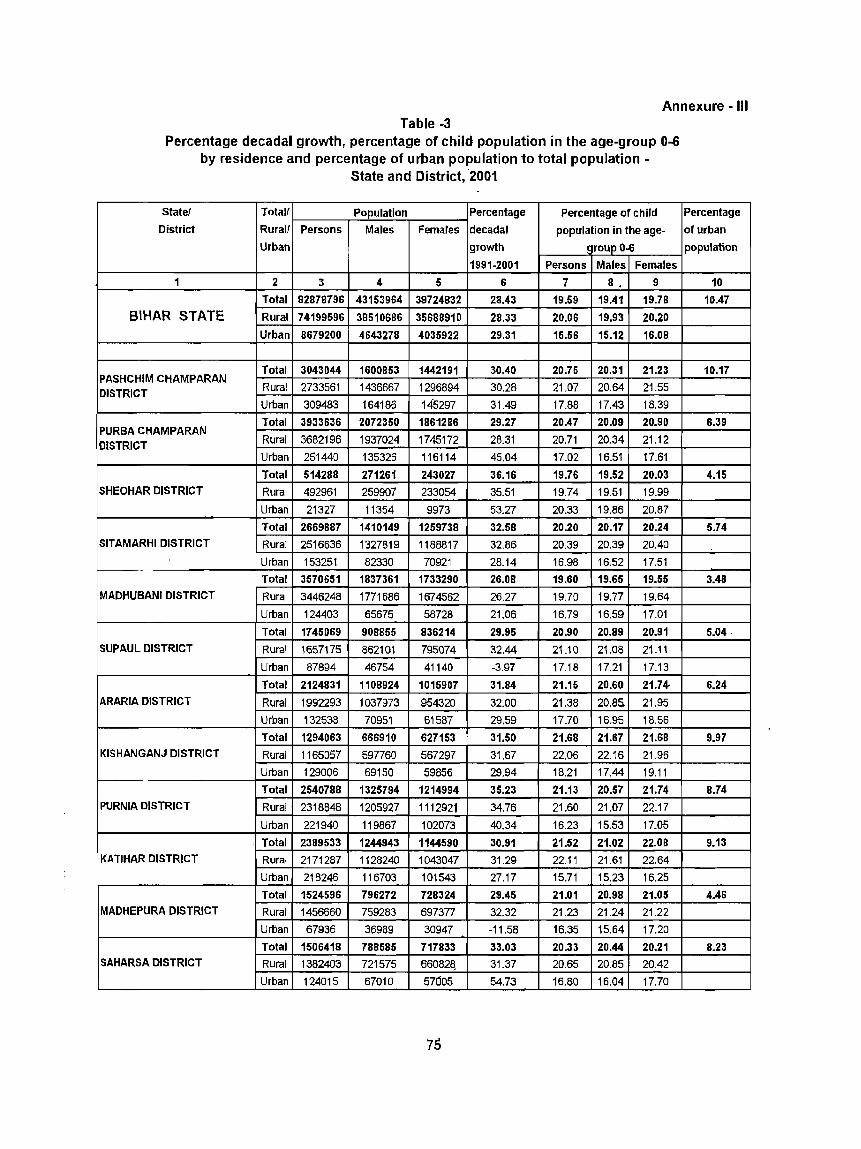
Annexure - III Table -3
Percentage decadal growth, percentage of child population in the age-group 0-6 by residence and percentage of urban population to total population -
State and District, '2001
State! Total! Population Percentage Percentage of child
District Rural! Persons Males Females decadal population in the age.
Urban growth ~ roup 0-6
1991·2001 Persons Males Females
1 2 3 4 5 6 7 8 • 9
Total 82878796 43153964 39724832 28.43 19.59 19.41 19.78
BIHAR STATE Rural 74199596 38510686 35688910 28.33 20.06 19.93 20.20
Urban 8679200 4643278 4035922 29.31 15.56 15.12 16.08
Total 3043044 1600853 1442191 30.40 20.75 20.31 21.23 PASHCHIM CHAMPARAN DISTRICT
Rural 2733561 1436667 1296894 30.28 21.07 20.64 21.55
Urban 309483 164186 145297 31.49 17.88 17.43 18.39
Total 3933636 2072350 1861286 29.27 20.47 20.09 20.90 PURBA CHAMPARAN DISTRICT
Rural 3682196 1937024 1745172 28.31 20.71 20.34 21.12
Urban 251440 135326 116114 45.04 17.02 16.51 17.61
Total 514288 271261 243027 36.16 19.76 19.52 20.03
SHEOHAR DISTRICT Rural 492961 259907 233054 35.51 19.74 19.51 19.99
Urban 21327 11354 9973 53.27 20.33 19.86 20.87
Total 2669887 1410149 1259738 32.58 20.20 20.17 20.24
SITAMARHI DISTRICT Rural 2516636 1327819 1188817 32.86 20.39 20.39 20.40
Urban 153251 82330 70921 28.14 16.98 16.52 17.51
Total 3570651 1837361 1733290 26.08 19.60 19.65 19.55
MADHUBANI DISTRICT Rural 3446248 1771686 1674562 26.27 19.70 19.77 19.64
Urban 124403 65675 58728 21.06 16.79 16.59 17.01
Total 1745069 908855 836214 29.95 20.90 20.89 20.91
SUPAUL DISTRICT Rural 1657175 862101 795074 32.44 21.10 21.08 21.11
Urban 87894 46754 41140 ·3.97 17.18 17.21 17.13
Total 2124831 1108924 1015907 31.84 21.15 20.60 21.74-
ARARIA DISTRICT Rural 1992293 1037973 954320 32.00 21.38 20.85- 21.95
Urban 132538 70951 61587 29.59 17.70 16.95 18.56
Total 1294063 666910 627153 31.50 21.68 21.67 21.6B
KISHANGANJ DISTRICT Rural 1165057 597760 567297 31.67 22.06 22.16 21.96
Urban 129006 69150 59856 29.94 18.21 17.44 19.11
Total 254078B 1325794 1214994 35.23 21.13 20.57 21.74
PURNIA DISTRICT Rural 2318848 1205927 1112921 34.76 21.60 21.07 22.17
Urban 221940 119867 102073 40.34 16.23 15.53 17.05
Total 2389533 1244943 1144590 30.91 21.52 21.02 22.0B
KATIHAR DISTRICT Rural 2171287 1128240 1043047 31.29 22.11 21.61 22.64
Urban 218246 116703 101543 27.17 15.71 15.23 16.25
Total 1524596 796272 728324 29.45 21.01 20.9B 21.05 MADHEPURA DISTRICT Rural 1456660 759283 697377 32.32 21.23 21.24 21.22
Urban 67936 36989 30947 ·11.58 16.35 15.64 17.20
Total 1506418 788585 717833 33.03 20.33 20.44 20.21 SAHARSA DISTRICT Rural 1382403 721575 660828, 31.37 20.65 20.85 20.42
Urban 124015 67010 57d05 54.73 16.80 16.04 17.70
75
Percentage
of urban
population
10
10.47
10.17
6.39
4.15
5.74
3.48
5.04·
6.24
9.97
B.74
9.13
4.46
8.23

Statel Totall Population Percentage Percentage of child Percentage
District Rurall Persons Males Females decadal population in the age- of urban
Urban growth ~ roup 0-6 population
1991·2001 Persons Males Females
1 2 3 4 5 S 7 8 9 10
Total 3285473 1718640 1568833 30.85 19.11 19.40 18.79 8.12 DARBHANGA DISTRICT RUral 3018639 1574598 1444041 31.67 19.48 1982 1910
Urban 266834 142042 124792 22.18 14.99 14.77 15.24
Total 3743836 1941480 1802356 26.74 19.19 19.22 19.14 9.30 MUZAFFARPUR DISTRICT Rural 3395565 1754769 1640796 26.75 19.72 19.80 19.63
Urban 348271 186711 161560 2666 1398 1381 14.17
Total 2149343 1072151 1077192 26.11 19.40 19.83 18.98 6.07
GOPALGANJ DISTRICT Rural 2018807 1004505 1014302 25.59 19.54 20.01 19.07
Urban 130536 67646 62890 34.76 17.32 17.17 17.49
Total 2708840 1332218 1376622 24.78 19.66 20.74 18.61 5.45 SIWAN DISTRICT Rural 2561094 1254632 1306462 24.60 19.87 21.06 18.73
Urban 147746 77586 70160 27.91 15.91 15.57 16.29
Total 3251474 1654428 1597046 26.37 19.06 19.30 18.81 9.17 SARAN DISTRICT Rural 2953345 1495945 1457400 26.29 19.35 19.69 18.99
Urban 298129 158483 139646 27 .. 21 16.20 15.55 16.95
Total 2712389 1412276 1300113 26.39 19.27 19.15 19.41 6.88
VAISHAU DISTRICT Rural 2525912 1313552 1212360 2612 19.42 1931 19.53
Urban 186477 98724 87753 30.08 17.30 17.01 17.63
Total 3413413 1771249 1642164 25.63 20.39 20.20 20.59 3.62
SAMASTIPUR DISTRICT Rural 3289978 1705576 1584402 27.42 20.56 20.39 20.74
Urban 123435 65673 57762 ·8.48 15.92 15.46 16,45
Total 2342989 1226057 1116932 29.11 19.81 19.51 20.14 4.58
BEGUSARAI DISTRICT Rural 2235786 1168708 1067078 36.57 20.04 19.74 20.36
Urban 107203 57349 49854 -39.67 15.05 14.76 15.37
Total 1278677 675501 601176 29.32 21.12 20.55 21.75 5.97
KHAGARIA DISTRICT Rural 1200458 634194 566264 29.30 21.31 20.77 21.92
Urban 76219 41307 34912 29.62 18.02 17.22 18.96
Total 2430331 1294192 1136139 27.24- 18.80 17.96 19.76 18.59
BHAGALPUR DISTRICT Rural 1978412 1051749 926663 26.29 19.62 18.74 20.63
Urban 451919 242443 209476 31.58 15.21 14.57 15.94
Total 1608778 843061 765717 24.47 20.10 19.79 20.43 3.50
BANKA DISTRICT Rural 1552432 812894 739538 24.42 20.22 19.93 20.53
Urban 56346 30167 26179 26.24 16.77 15.99 17.67
Total 1135499 604662 530837 20.34 17.36 17.02 17.75 27.88
MUNGER DISTRICT Rural 818913 435774 383139 24.00 18.34 18.08 18.62
Urban 316586 168888 147698 11.80 14.84 14.28 15.48
Total 801173 416727 384446 23.94 20.00 19.66 20.36 14.68
LAKHISARAI DISTRICT Rural 683588 354279 329309 21.84 20.47 2019 20.78
Urban 117585 62448 55137 37.78 17.24 16.69 17.86
Total 525137 273488 251669 24.96 20.25 19.85 20.68 15.48
SHEIKHPURA DISTRICT Rural 443837 230375 213462 24.78 20.57 20.23 20.95
Urban 81300 43093 38207 25.90 18.48 17.83 19.22
Total 2368327 1236467 1131860 18.64 18.78 18.53 19.05 14.92
NALANDA DISTRICT Rural 2014884 1050249 964635 18.52 19.18 18.91 19.47
Urban 353443 186218 167225 19.32 16.50 16.37 16.65
76

Statel Totall Population Percentage Percentage of child Percentage
District Rurall Persons Males Females decadal population in the age- of urban
Urban growth _l rol!P 0-6 population
1991-2001 Persons Males Females
1 2 3 4 5 6 7 8 9 10
Total 4709851 2514949 2194902 30.17 16.90 16.24 17.65 41.80
PATNA DISTRICT Rural 2740927 1449850 1291077 22.28 19.32 18,54 20,19
Urban 1968924 1065099 903825 43,02 13,53 13,11 14,02
Total 2233415 1175333 1058082 24.58 18.19 17.84 18.59 13.98
BHOJPUR DISTRICT Rural 1921121 1006468 914653 23.36 18,56 18.24 18.90
Urban 312294 168865 143429 32.62 15.97 15.41 1663
Total 1403462 738239 665223 29.03 18.90 18.66 19.18 9.18
BUXAR DISTRICT Rural 1274691 669446 605245 2787 19.16 18.98 19,35
Urban 128771 68793 59978 41,79 16.39 15.52 17,38
Total 1284575 673556 611019 30.64 20.12 19.78 20.49 3.23
KAIMUR (BHABUA)DISTRICT Rural 1243068 650973 592095 30.00 20.27 19,94 20,62
Urban 41507 22583 18924 53,50 15.71 15.15 16,38
Total 2448762 1282655 1166107 27.71 18.91 18.54 19.31 13.34
ROHTAS DISTRICT Rural 2122175 1109288 1012887 28.60 19.35 19.00 19.73
Urban 326587 173367 153220 22.25 16.06 15.64 16.54
Total 1511406 783960 727446 28.64 18.]1 18.90 18.51 7.40
JEHANABAD DISTRICT Rural 1399513 724219 675294 27,18 18,89 19.11 18.66
Urban 111893 59741 52152 5025 16.45 16,38 16,53
Total 2004960 1035757 969203 30.19 18.89 18.93 18.85 8.42
AURANGABAD DISTRICT Rural 1836127 946826 889301 29,13 19,07 19.13 19.01
Urban 168833 88931 79902 43.02 16.91 16.80 17.03
Total 3464983 1789231 1675752 30.03 19.23 19.03 19.45 13.71
GAYA DISTRICT Rural 2989942 1536340 1453602 29.50 19.93 19.79 20.08
Urban 475041 252891 222150 33.48 14.83 14.41 15.32
Total 1809425 928638 880787 33.08 19.15 18.90 19.42 7.66
NAWADA DISTRICT Rural 1670759 855675 815084 32.06 19,38 19.14 19.63
Urban 138666 72963 65703 46.65 1644 16.18 16.73
Total 1397474 728812 668662 32.90 18.95 18.50 19.43 7.38
JAMUl DISTRICT Rural 1294298 673840 620458 32.48 19.15 18.70 19.63
Urban 103176 54972 48204 38.37 16.42 1604 16.86
77

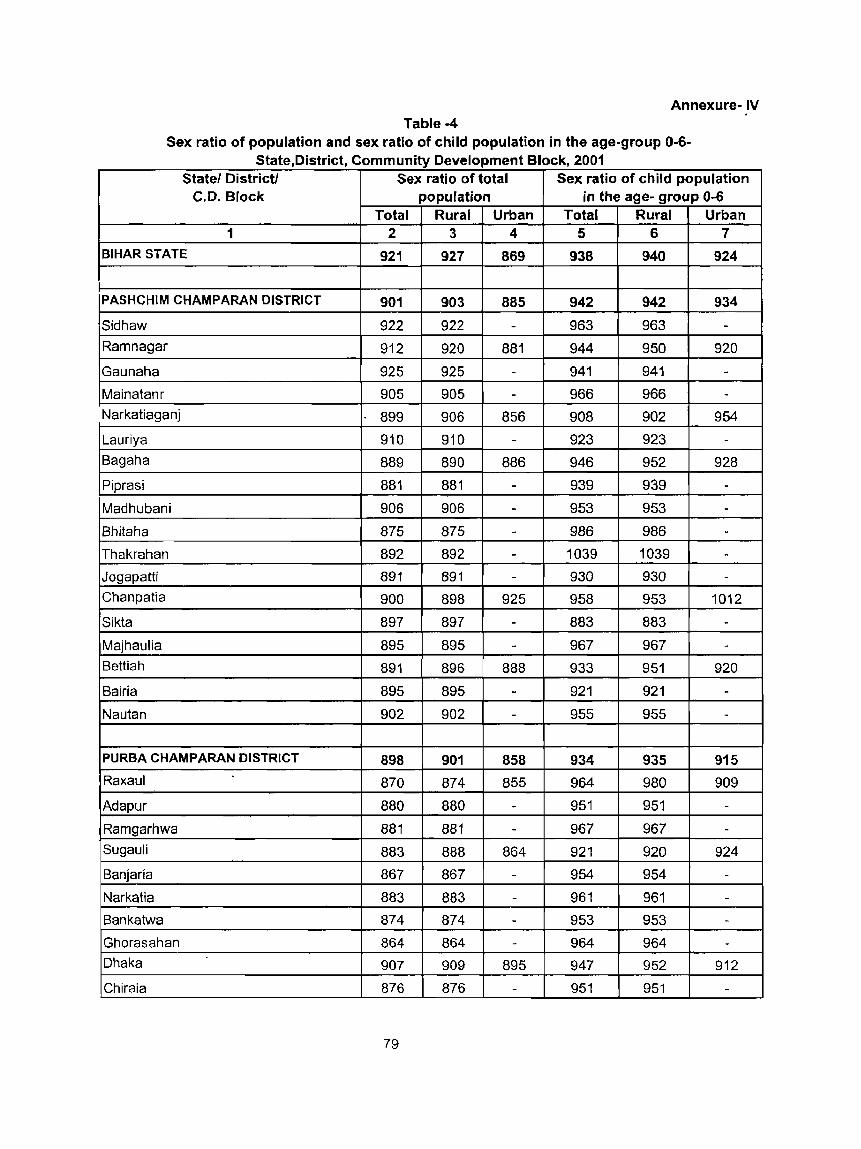
Annexure- IV Table -4
Sex ratio of population and sex ratio of child population in the age-group 0-6-State,District, Community Development Block, 2001
Statel District! Sex ratio of total Sex ratio of child population C.D. Block population in the age- group 0-6
Total Rural Urban Total Rural Urban 1 2 3 4 5 6 7
BIHAR STATE 921 927 869 938 940 924
PASHCHIM CHAMPARAN DISTRICT 901 903 885 942 942 934
Sidhaw 922 922 - 963 963 -Ramnagar 912 920 881 944 950 920
Gaunaha 925 925 - 941 941 -Mainatanr 905 905 - 966 966 -Narkatiaganj 899 906 856 908 902 954
Lauriya 910 910 - 923 923 -Bagaha 889 890 886 946 952 928
Piprasi 881 881 - 939 939 -
Madhubani 906 906 - 953 953 -Bhitaha 875 875 - 986 986 -Thakrahan 892 892 - 1039 1039 -Jogapatti 891 891 - 930 930 -Chanpatia 900 898 925 958 953 1012
Sikta 897 897 - 883 883 -
Majhaulia 895 895 - 967 967 -Bettiah 891 896 888 933 951 920
Bairia 895 895 - 921 921 -Nautan 902 902 - 955 955 -
PURBA CHAMPARAN DISTRICT 898 901 858 934 935 915
Raxaul .
870 874 855 964 980 909
Adapur 880 880 - 951 951 -
Ramgarhwa 881 881 - 967 967 -Sugauli 883 888 864 921 920 924
Banjaria 867 867 - 954 954 -
Narkatia 883 883 - 961 961 -Bankatwa 874 874 - 953 953 -Ghorasahan 864 864 - 964 964 -Dhaka 907 909 895 947 952 912
Chiraia 876 876 - 951 951 -
79

Statel District! Sex ratio of total Sex ratio of child population C.D. Bloc~ population in the age- group 0-6
Total Rural Urban Total Rural Urban 1 2 3 4 5 6 7
Motihari 859 874 836 935 947 908
Turkaulia 903 903 - 896 896 -
Harsidhi 910 910 - 934 934 -Paharpur 920 920 - 932 932 -Areraj 926 930 907 976 975 982
Sangrampur 928 928 - 942 942 -
Kesaria 935 935 - 937 937 -Kalyanpur 940 940 - 904 904 -Kotwa 924 924 - 931 931 -
Piprakothi 898 898 - 929 929 -Chakia(Pipra) 925 931 874 899 902 872
Pakri Dayal 903 903 - 971 971 -
Patahi 909 909 - 942 942 -Phenhara 919 919 - 797 797 -
Madhuban 904 904 - 918 918 -
Tetaria 891 891 - 894 894 -Mehsi 915 915 - 891 891 -
SHEOHAR DISTRICT 896 897 878 919 919 923
Purnahiya 880 880 - 922 922 --
Piprarhi 901 901 - 918 918 -Sheohar 921 930 878 915 914 923
Dumri Katsari 893 893 - 873 873 -
Tariani Chowk 883 883 - 945 945 -
SITAMARHI DISTRICT 893 895 861 896 896 913 Bairgania 890 894 883 941 927 970
Suppi 891 891 - 902 902 -Majorganj 911 911 - 925 925 -Sonbarsa 893 893 - 949 949 -Parihar 900 .gOO - 925 925 -Sursand 898 898 - 716 716 -Bathnaha 886 886 - 735 735 -Riga 877 877 - 896 896 -
Parsauni 896 896 - 902 902 -Belsand 896 901 874 992 1000 952
80

Statel Districtl Sex ratio of total Sex ratio of child population C.D. Block population in the age- group 0-6
Total Rural Urban Total Rural Urban 1 2 3 4 5 6 7
Runisaidpur 889 889 - 930 930 -Dumra 872 881 849 908 914 886
Bajpatti 916 916 - 954 954 -
Charaut 881 881 - 907 907 -Pupri 907 911 875 880 883 853
Nanpur 913 913 - 942 942 -
Bokhara 903 903 - 965 965 -
MADHUBANI DISTRICT 943 945 894 938 939 917
Madhwapur 936 936 - 950 950 -Harlakhi 941 941 - 944 944 -Basopatti 913 913 - 934 934 -Jainagar 896 897 885 884 883 892
Ladania 940 940 - 956 956 -Laukaha 953 953 - 948 948 -. Laukahi 937 937 - 946 946 -Phulparas 947 947 943 950 949 952
Babubarhi 950 950 - 961 961 -Khajauli 910 910 - 901 901 -Kaluahi 950 950 - 939 939 -Benipatti 945 945 - 926 926 -
Bisfi 942 942 - 980 980 -Madhubani 927 947 873 923 925 919
Pandaul 975 975 - 943 943 -Rajnagar 935 935 - 941 941 -Andhratharhi 965 965 - 947 947 -Jhanjharpur 978 986 933 938 943 912
Ghoghardiha 947 947 - 951 951 -Lakhnaur 972 972 - 924 924 -Madhepur 945 945 - 914 914 -
SUPAUL DISTRICT 920 922 880 921 923 876 Nirmali 928 937 895 943 935 982 Basantpur 905 911 867 940 962 727
Chhatapur 918 918 - 974 974 -
Pratapganj 921 921 - 932 932 -
81

Statel District! Sex ratio of total Sex ratio of child population C.D. Block population in the age- group 0-6
Total Rural Urban Total Rural Urban 1 2 3 4 5 6 7
Raghopur 927 927 - 933 933 -Saraigarh Bhaptiyahi 922 922 - 928 928 -Kishanpur 940 940 - 890 890 -Marauna 939 939 - 958 958 -Supaul 913 920 880 860 854 892
Pipra 922 922 - 891 891 -Tribeniganj 912 912 - 943 943 -
ARARIA DISTRICT 916 919 868 967 968 951
Narpatganj 908 908 - 968 968 -Forbesganj 904 910 877 964 967 949
Bhargama 908 908 - 969 969 -
Raniganj 924 924 - 942 942 -Araria - 913 925 857 974 978 952
Kursakatta 914 914 - 991 991 -Sikti 933 933 - 987 987 -
Palasi 922 922 - 970 970 -jokihat 933 933 - 963 963 -
. KJSHANGANJ DISTRICT 940 949 866 941 940 949
Terhagachh 954 954 - 923 923 -Dighalbank 953 953 - 983 983 -Thakurganj 949 953 893 923 923 938
Pothia 945 945 - 950 950 -Bahadurganj 947 956 893 955 957 943
Kochadhamin 942 942 - 911 911 -Kishanganj 899 940 852 953 954 953
PURNIA DISTRICT 916 923 852 968 971 935 Banmankhi 904 912 823 969 975 899
Barhara Kothi 914 914 - 962 962 -
Bhawanipur 913 913 - 987 987 -
Rupauli 909 909 - 979 979 -Dhamdaha 929 929 - 954 954 -Krityanand Nagar 926 926 - 970 970 -Purnia East 880 910 850 953 959 943
82
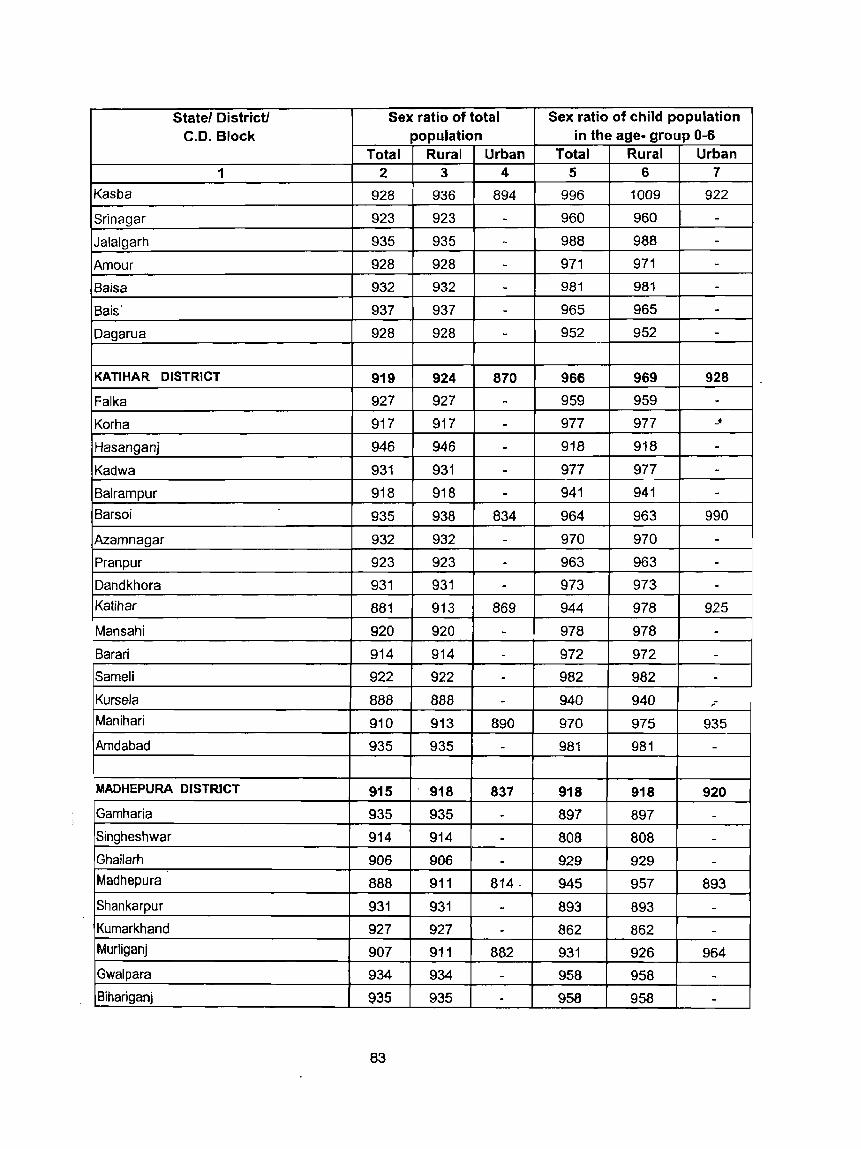
Statel Distrrct! Sex ratio of total Sex ratio of child population
C.D. Block population in the age- group 0-6 Total Rural Urban Total Rural Urban
1 2 3 4 5 6 7
Kasba 928 936 894 996 1009 922
Srinagar 923 923 - 960 960 -
Jalalgarh 935 935 - 988 988 -Amour 928 928 - 971 971 -Baisa 932 932 - 981 981 -Bais' 937 937 - 965 965 -Dagarua 928 928 - 952 952 -
KATIHAR DISTRICT 919 924 870 966 969 928
Falka 927 927 - 959 959 -Korha 917 917 - 977 977 _t
Hasanganj 946 946 - 918 918 -Kadwa 931 931 - 977 977 -Balrampur 918 918 - 941 941 -Barsoi 935 938 834 964 963 990
Azamnagar 932 932 - 970 970 -Pranpur 923 923 - 963 963 -Dandkhora 931 931 - 973 973 -Katihar 881 913 869 944 978 925
Mansahi 920 920 - 978 978 -Sarari 914 914 - 972 972 -Sameli 922 922 - 982 982 -Kursela 888 888 - 940 940 _-
Manihari 910 913 890 970 975 935 Amdabad 935 935 - 981 981 -
MADHEPURA DISTRICT 915 918 837 918 918 920
Gamharia 935 935 - 897 897 -
Singheshwar 914 914 - 808 808 -Ghailarh 906 906 - 929 929 -
Madhepura 888 911 814· 945 957 893 Shankarpur 931 931 - 893 893 -Kumarkhand 927 927 - 862 862 -Murliganj 907 911 882 931 926 964 Gwalpara 934 934 - 958 958 -Bihariganj 935 935 - 958 958 -
83

Statel District! Sex ratio of total - Sex ratio of child population C.D. Block population in the age- grou p 0-6
Total Rural Urban Total Rural Urban 1 2 3 4 5 6 7
Kishanganj 928 928 - 898 898 -Puraini 919 919 - 936 936 -
Alamnagar 910 910 - 939 939 -Chausa 888 888 - 991 991 -
SAHARSA DISTRICT 910 916 851 900 897 939
Nauhatta 926 926 - 885 885 -Satar Kataiya 908 908 - 906 906 -
Mahishi 920 920 - 798 798 -Kahara 885 928 851 924 910 939
Saur'Bazar 913 913 - 944 944 -Patarghat 917 917 - 871 871 -Sonbarsa 920 920 - 961 961 -Simri Bakhtiarpur 909 909 - 899 899 -Salkhua 907 907 - 906 906 -Banma Itahri 909 909 - 915 915 -
DARBHANGA DISTRICT 914 917 879 885 884 906
Jale 916 916 - 921 921 -Singhwara 917 917 - 905 905 -Keotiranway 925 925 - 871 871 -Darbhanga 892 907 879 889 875 906
Manigachhi 938 938 - 906 906 -Tardih 940 940 - 926 926 -
Alinagar 933 933 - 947 947 -
Benipur 934 934 - 520 520 -
Bahadurpur 899 899 - 874 874 -Hanumannagar 903 903 - 887 887 -
Hayaghat 902 902 - 906 906 -
Baheri 891 891 - 923 923 -
Biraul 912 912 - 899 899 -
Ghanshyampur 933 933 - 926 926 -Kiratpur 921 921 - 924 924 -
Gora Bauram 922 922 - 963 963 -Kusheshwar Asthan 941 941 - 951 951 -
Kusheshwar Asthan Purbi 909 909 ,
- 940 940 -
84

Statel District! Sex ratio of total Sex'~atio of child population C.D. Block population in the age- group 0-6
Total Rural Urban Total Rural Urban 1 2 3 4 5 6 7
MUZAFFARPUR DISTRICT 928 935 865 925 927 888
Sahebganj 963 963 - 954 954 -Baruraj (Motipur) 937 942 871 944 945 925
Paroo 974 974 - 958 958 -
Saraiya 974 974 - 947 947 -
Marwan 923 923 - 921 921 -Kanti 893 895 884 909 908 914
Minapur 897 897 - 926 926 -
Bochaha 900 900 - 913 913 -Aurai 912 912 - 878 878 -Katra 935 935 - 903 903 -
Gaighat 919 919 - -903 903 -Bandra 905 905 - . 947 947 -Dholi (Moraul) 946 946 - 922 922 -Musahri 869 876 864 897 911 883
Kurhani 920 920 - 950 950 -Sakra 1070 1070 - 931 931
~
-
GOPALGANJ DISTRICT 1005 1010 930 961 962 947
Katiya 1043 1065 928 960 967 919
Bijaipur 1050 1050 - 954 954 -Bhorey 1037 1037 - 966 96'6 -Pachdeori 1004 1004 - 935 935 -Kuchaikote 994 994 - 953 953 -Phulwaria 995 995 - 959 959 -Hathua 988 988 - 941 941 -Uchkagaon 982 993 925 971 970 977
Thawe - 970 970 - 972 972 -Gopalganj 941 970 875 985 998 946
Manjha 989 989 - 983 983 -Barauli 1051 1056 1026 954 956 945
Sidhwalia 1'015 1015 - 973 973 -Baikunthpur 1027 1027 - 955 955 -
/
SIWAN DISTRICT 1033 1041 904 927 926 946
85
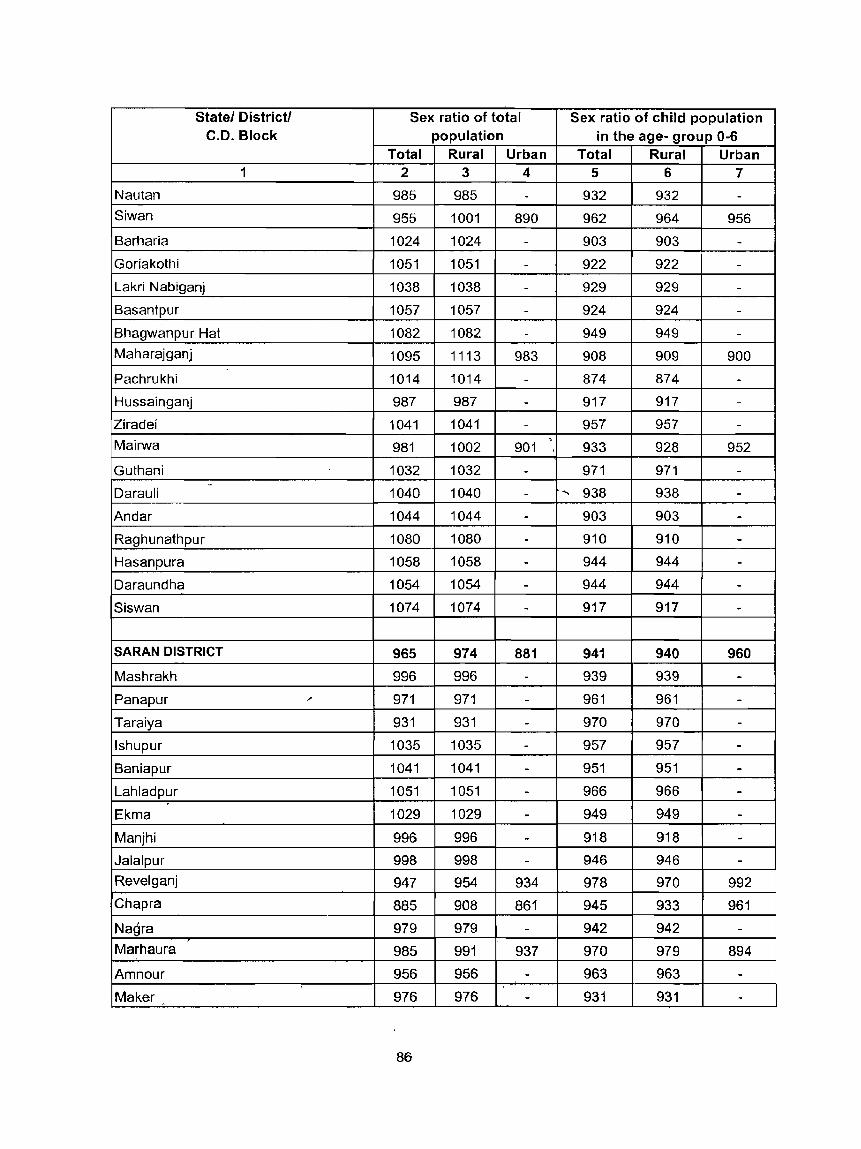
Statel Districtl Sex ratio of total Sex ratio of child population C.D. Block population in the age- group 0-6
Total Rural Urban Total Rural Urban 1 2 3 4 5 6 7
Nautan 985 985 - 932 932 -Siwan 955 1001 890 962 964 956
Barharia 1024 1024 - 903 903 -Goriakothi 1051 1051 - 922 922 -Lakri Nabiganj 1038 1038 - 929 929 -
Basantpur 1057 1057 - 924 924 -
Bhagwanpur Hat 1082 1082 - 949 949 -Maharajganj 1095 1113 983 908 909 900
Pachrukhi 1014 1014 - 874 874 -Hussainganj 987 987 - 917 917 -Ziradei 1041 1041 - 957 957 -Mairwa
, 981 1002 901 , 933 928 952
Guthani 1032 1032 - 971 971 --
Darauli 1040 1040 - .." 938 938 -Andar 1044 1044 - 903 903 -Raghunathpur 1080 1080 - 910 910 -Hasanpura 1058 1058 - 944 944 -Daraundha 1054 1054 - 944 944 -Siswan 1074 1074 - 917 917 -
SARAN DISTRICT 965 974 881 941 940 960
Mashrakh 996 996 - 939 939 -Panapur .'- 971 971 - 961 961 -Taraiya 931 931 - 970 970 -Ishupur 1035 1035 - 957 957 -Baniapur 1041 1041 - 951 951 -Lahladpur 1051 1051 - 966 966 --Ekma 1029 1029 - 949 949 -Manjhi 996 996 - 918 918 -Jalalpur 998 998 - 946 946 -Revelganj 947 954 934 978 970 992 Chapra 885 908 861 945 933 961
Nagra 979 979 - 942 942 -Marhaura 985 991 937 970 979 894
Amnour 956 956 - 963 963 -,.
Maker 976 976 - 931 931 -.~
86
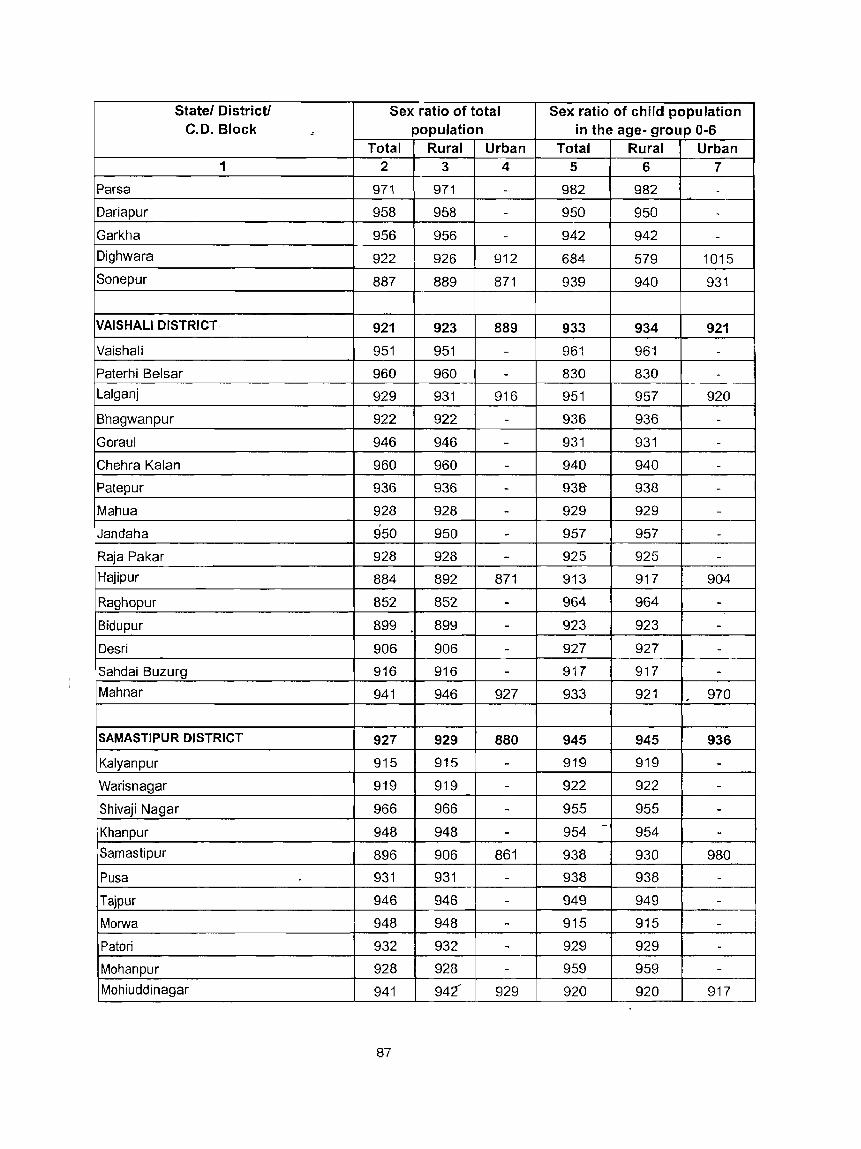
Statel Districtl Sex ratio of total Sex ratio of child population C.D. Block ; population in the age- group 0-6
Total Rural Urban Total Rural Urban 1 2 3 4 5 6 7
Parsa 971 971 - 982 982 -
Dariapur 958 958 - 950 950 -Garkha 956 956 - 942 942 -Dighwara 922 926 912 684 579 1015 Sonepur 887 889 871 939 940 931
VAISHALI DISTRICT 921 923 889 933 934 921
Vaishali 951 951 - 961 961 -Paterhi Belsar 960 960 - 830 830 -Lalganj 929 931 916 951 957 920
Bhagwanpur 922 922 - 936 936 -Goraul 946 946 - 931 931 -Chehra Kalan 960 960 - 940 940 -
Patepur 936 936 - 938- 938 -Mahua 928 928 - 929 929 -
, Jandaha 950 950 - 957 957 -Raja Pakar 928 928 - 925 925 -
Hajipur 884 892 871 913 917 904
Raghopur 852 852 - 964 964 -Bidupur 899 899 - 923 923 -Desri 906 906 - 927 927 -Sahdai Buzurg 916 916 - 917 917 -Mahnar 941 946 927 933 921 970 ,
SAMASTIPUR DISTRICT 927 929 880 945 945 936
Kalyanpur 915 915 - 919 919 -Warisnagar 919 919 - 922 922 -
Shivaji Nagar 966 966 - 955 955 --Khanpur 948 948 - 954 954 -
Samastipur 896 906 861 938 930 980
Pusa 931 931 - 938 938 -
Tajpur 946 946 - 949 949 -Morwa 948 948 - 915 915 -Patori 932 932 - 929 929 -Mohanpur 928 928 - 959 959 -Mohiuddinagar 941 942 929 920 920 917
87

Statel District! Sex ratio of total Sex ratio of ch ila population C.D. Block population in the age- group 0-6
Total Rural Urban Total Rural Urban 1 2 3 4 5 6 7
Sarairanjan 941 941 - 956 956 -"- -
Vidyapati Nagar 941 941 - 885 885 -Dalsinghsara i 780 767 894 929 933 888
Ujiarpur 933 933 - 964 964 -Bibhutpur 970 970 - 939 939 -Rosera 929 938 886 941 948 904
Singhia 961 961 - 1083 1083 -Hasanpur 931 931 - 931 931 -Bithan 941 941 - 972 972 -
,
BEGUSARAI DISTRICT 911 913 869 940 942 905
KhudabandpJ..Jr 983 983 - 948 948 -
Chorahi 964 964 - 962 962 --. Garhpura 945 945 - 922 922 -Cheria Bariarpur 947 947 - 940 940 -
Bhagwanpur 949 949 - 935 935 -
Mansurchak 922 922 - 955 955 -Bachhwara 918 918 - 961 961 -
Teghra 898 898 - 959 959 -. Barauni 887 887 - 974 974 -Birpur 945 945 - 974 974 -Begusarai 884 889 869 931 938 905
Naokothi 968 968 - 941 941 -Bakhri 925 925 - 973 973 -Dandari 903 903 - 945 945 -
Sahebpur Kamal 888 888 - 822 822 -Balia 890 890 - 943 943 -
Matihani 882 882 - 949 949 -Shamho Akha kurha 882 882 - 960 960 -
KHAGARIA DISTRICT 890 893 845 942 943 930
Alauli 906 906 - 949 949 -Khagaria 881 .892 824 935 942 887
Mansi 874 874 - 899 899 -
Chautham 900 900 - 940 940 -Beldaur 919 919 - 953 953 - .
88"

Statel District! Sex ratio of total Sex ratio of child population C.D. Block population in the age- group 0-6
Total Rural Urban Total Rural Urban 1 2 3 4 5 . 6 7
Gogri 872 871 877 948 943 985 Parbatta 888 888 - 945 945 -
BHAGALPUR DISTRICT 878 881 864 966 970 946
Narayanpur 880 880 - 977 977 --
Bihpur 871 871 - 958 958 -Kharik 880 880 - 994 994 -Naugachhia 864 867 859 963 957 977
Rangra Chowk 863 863 - 991 991 -Gopalpur 875 875 - 984 984 -Pirpainti 875 875 - 984 984 -
, Colgong 886 886 889 900 896 967
Ismail pur 878 878 - 1088 1088 -Sabour 864 864 - 986 986 -Nathnagar 876 876 - 978 978 -Sultanganj 872 876 857 940 949 906
Shahkund 893 893 - 971 971 -Goradih 875 875 - 978 978 -Jagdishpur 872 897 864 962 998 946
Sonhaula 910 910 - 1014 1014 -tI . .
BANKA DISTRICT 908 910 868 938 937 959
Shambhuganj 868 868 - 916 916 .- -Amarpur 896 894 910 966 962 992
Rajaun 901 901 - 962 962 -Dhuraiya 907 907 - 986 986 -Barahat 918 918 - • 956 956 -Banka 903 920 844 941 942 937
Phulidumar 910 910 - 957 957 -Belhar 929 929 - 740 740 -Chan an 941 941 - 987 987 -katoria 919 919 - 953 953 -Bausi 91.3 913 - 965 965 -
MUNGER DISTRICT 878 879 875 915 905 948 ~
Munger 865 862 866 919 925 932
89
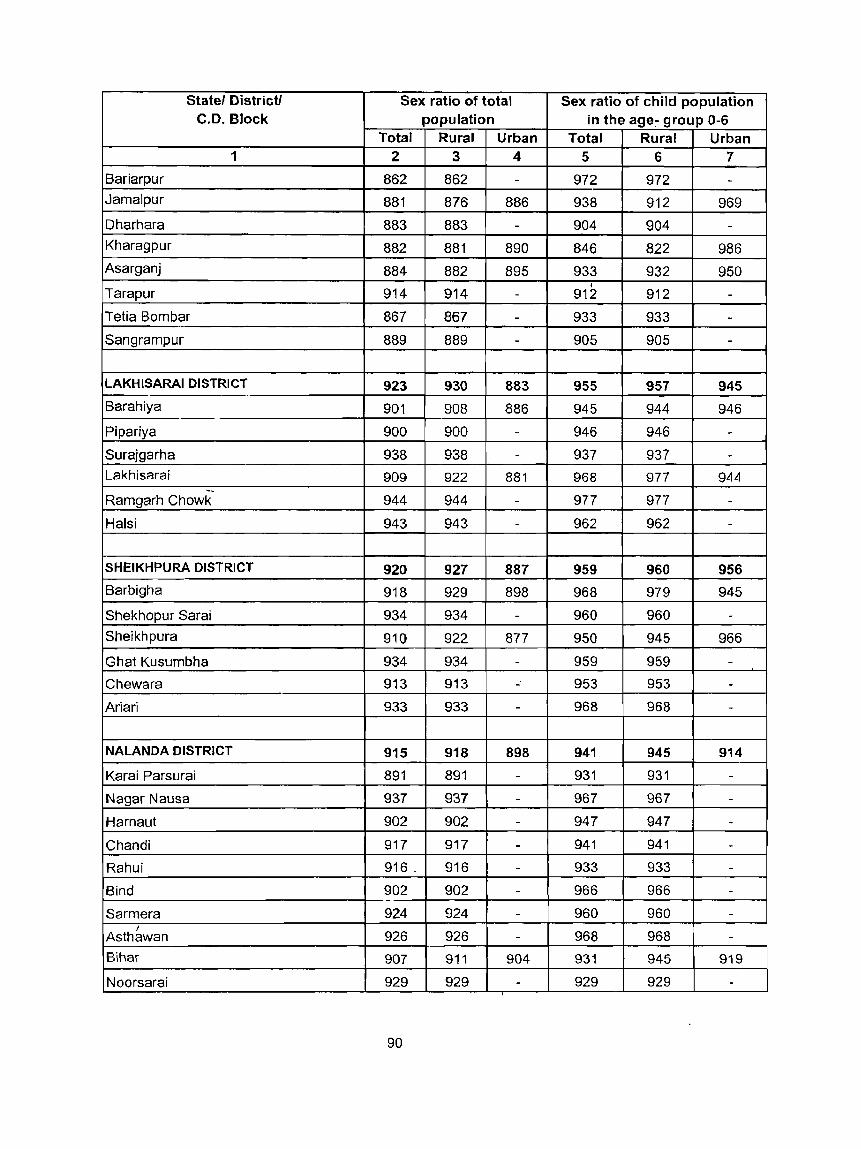
Statel District! Sex ratio of total Sex ratio of child population C.D. Block population in the age~ group 0-6
Total Rural Urban Total Rural Urban 1 2 3 4 5 6 7
Bariarpur 862 862 - 972 972 -Jamalpur 881 876 886 938 912 969
Oharhara 883 883 - 904 904 -Kharagpur 882 881 890 846 822 986 Asarganj 884 882 895 933 932 950
j
Tarapur 914 914 - 912 912 -
Tetia Bombar 867 867 - 933 933 -Sangrampur 889 889 - 905 905 -
LAKHISARAI DISTRICT 923 930 883 955 957 945 Barahiya 901 908 886 945 944 946
Pipariya 900 900 - 946 946 -Surajgarha 938 938 - 937 937 -Lakhisarai 909 922 881 968 977 944
-Ramgarh Chowk 944 944 - 977 977 -Halsi 943 943 - 962 962 -
SHEIKHPURA DISTRICT 920 927 887 959 960 956 Barbigha 918 929 898 968 979 945
Shekhopur Sarai 934 934 - 960 960 -Sheikhpura 910 922 877 950 945 966
Ghat Kusumbha 934 934 - 959 959 -Chewara 913 913 - 953 953 -Ariari 933 933 - 968 968 -
NALANDA DISTRICT 915 918 898 941 945 914
Karai Parsurai 891 891 - 931 931 -
Nagar Nausa 937 937 - 967 967 -
Harnaut 902 902 - 947 947 -Chandi 917 917 - 941 941 -Rahui 916 . 916 - 933 933 -
Bind 902 902 - 966 966 -
Sarmera 924 924 - 960 960 -I
Asthawan 926 926 - 968 968 -Bihar 907 911 904 931 945 919
Noorsarai 929 929 - 929 929 -
90
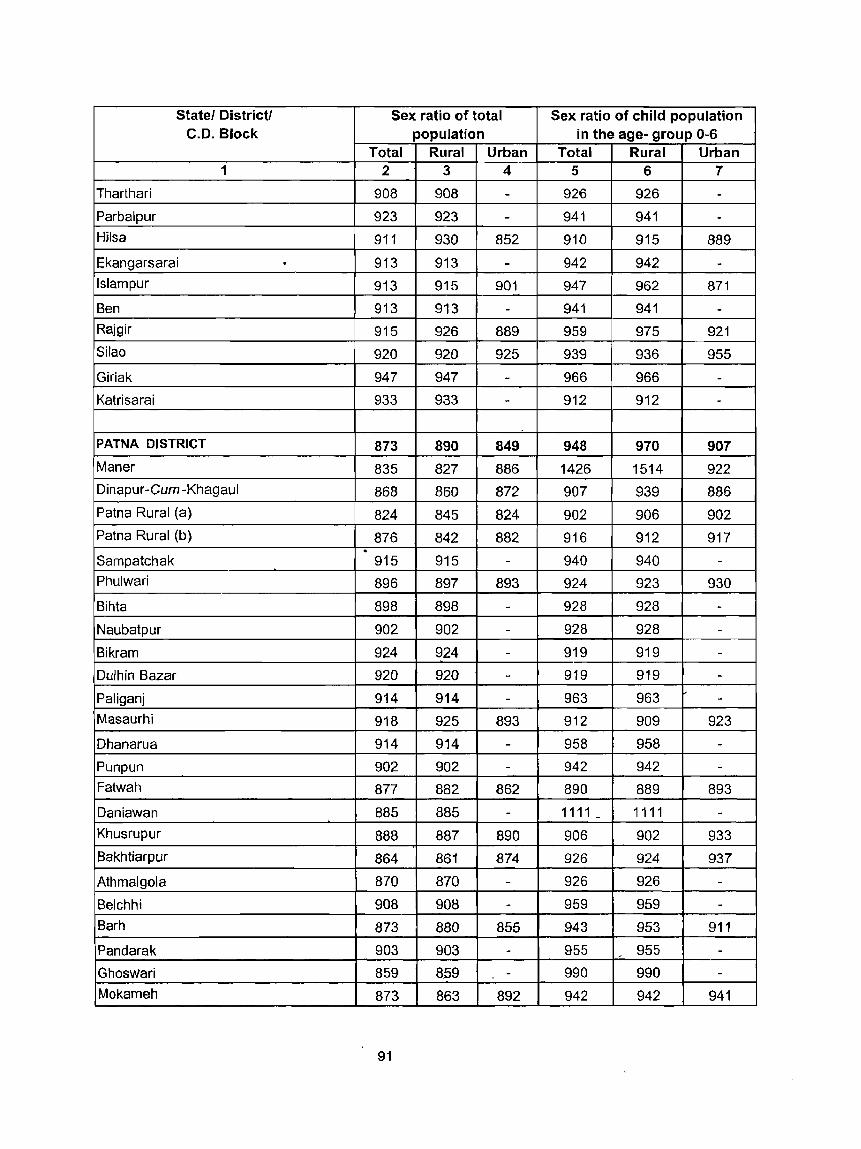
Statel District! Sex ratio of total Sex ratio of child population C.D. Block population in the age- group 0-6
Total Rural Urban Total Rural Urban 1 2 3 4 5 6 7
Tharthari 908 908 - 926 926 -Parbalpur 923 923 - 941 941 -Hilsa 911 930 852 910 915 889
Ekangarsarai . 913 913 - 942 942 -Islampur 913 915 901 947 962 871
Ben 913 913 - 941 941 -Rajgir 915 926 889 959 975 921 Silao 920 920 925 939 936 955
Giriak 947 947 - 966 966 -Katrisarai 933 933 - 912 912 -
PATNA DISTRICT 873 890 849 948 970 907 Maner 835 827 886 1426 1514 922 Dinapur-Cum -Khagaul 868 860 872 907 939 886 Patna Rural (a) 824 845 824 902 906 902 Patna Rural (b) 876 842 882 916 912 917 . Sampatchak 915 915 - 940 940 -Phulwari 896 897 893 924 923 930
Bihta 898 898 - 928 928 -Naubatpur 902 902 - 928 928 -
Bikram 924 924 - 919 919 -
Dulhin Bazar 920 920 - 919 919 -
Paliganj 914 914 - 963 963 -Masaurhi 918 925 893 912 909 923
Dhanarua 914 914 - 958 958 -Punpun 902 902 - 942 942 -Fatwah 877 882 862 890 889 893
Daniawan 885 885 - 1111 _ 1111 -Khusrupur 888 887 890 906 902 933 Bakhtiarpur 864 861 874 926 924 937
Athmalgola 870 870 - 926 926 -
Belchhi 908 9013 - 959 959 -Barh 873 880 855 943 953 911
Pandarak 903 903 - 955 , 955 -
Ghoswari 859 859 - 990 990 -Mokameh 873 863 892 942 942 941
91

Statel District! Sex ratio of total Sex ratio of child population C.D. Block population in the age- group 0-6
Total Rural Urban Total Rural Urban 1 2 3 4 5 6 7
BHOJPUR DISTRICT 900 909 849 938 941 917 Shahpur 889 887 912 931 926 983 Arrah 869 891 851 920 939 901
Barhara 888 888 - 922 922 -Koilwar 865 900 641 944 949 902
Sandesh 915 915 - 951 951 -
Udwant Nagar 912 912 - 939 939 -Behea 891 895 873 942 937 974 Jagdishpur 919 918 924 959 961 950 Piro 930 936 887 926 928 912
Charpokhri 879 879 - 934 934 -Garhani 928 928 - 944 944 -Agiaon 921 921 - 957 957 -
Tarari 926 926 - 954 954 -
Sahar 947 947 - 952 952 -
BUXAR DISTRICT 901 904 872 926 922 976
Simri 886 886 - 922 922 -Chakki 905 905 - 878 878 -
Barhampur 906 906 - 899 899 -Chaungain 918 918 - 942 942 -
Kesath 948 948 - 930 930 -Dumraon 886 895 868 956 932 1012 Buxar 883 884 879 916 915 919
Chausa 921 921 - 942 942 -
Rajpur 916 916 - 928 928 - -Itarhi 902 902 - 955 955 -Nawanagar 921 921 - 899 899 -
KAIMUR (BHABUA) DISTRICT 907 910 838 940 941 906
Ramgarh 928 928 - 948 948 -Nuaon 917 917 - 924 924 -
Kudra 898 898 - 935 935 -Mohania 903 903 - 927 927 -Durgawati 923 923 - 914 914 -
92

Statel Districtl Sex ratio of total Sex ratio of child population C.D. Block population in the age- group 0-6
Total Rural Urban Total Rural Urban 1 2 3 4 5 6 7
Chand 913 913 - 961 961 -Chain pur 916 916 - 974 974 -Bhabua 892 904 838 932 937 906
Rampur 899 899 - 954 954 -
Bhagwanpur 900 900 - 930 930 -Adhaura 904 904 - 948 948 -
ROHTAS DISTRICT 909 913 884 947 949 934
Kochas 898 898 - 926 926 -Dinara 912 912 - 946 946 -Dawath . 924 924 929 951 947 966
Suryapura 933 933 - 928 928 -Bikramganj 907 915 888 915 919 906 -Karakat 936 936 - 962 962 -
Nasriganj 925 925 - 962 962 -Rajpur 924 924 - 945 945 -
Sanjhauli 910 910 - 920 920 -Nokha 914 913 922 979 979 976
Kargahar 899 899 - 929 929 -Chenari 908 908 - 957 957 -
" Nauhatta 918 918 - 922 922 - .
Sheosagar 917 917 - 976 976 -Sasaram 892 901 881 948 955 936
Akorhi Gola 906 906 - 963 963 -Dehri 890 908 873 935 940 929
Tilouthu 914 914 - 945 945 -
Rohtas 907 907 - 964 964 -
JEHANABAD DISTRICT 928 932 873 909 911 881
Arwal 936 936 - 913 ~13 -
Kaler 945 945 - 945 945 -
Karpi 919 919 - 920 920 -
Sonbhadra Banshi Suryapur 933 933 - 894 894 -
Kurtha 943 943 - 887 887 -
Ratni Faridpur 938 938 - 859 859 -Jehanabad 893 916 858 90B' 931 870
93
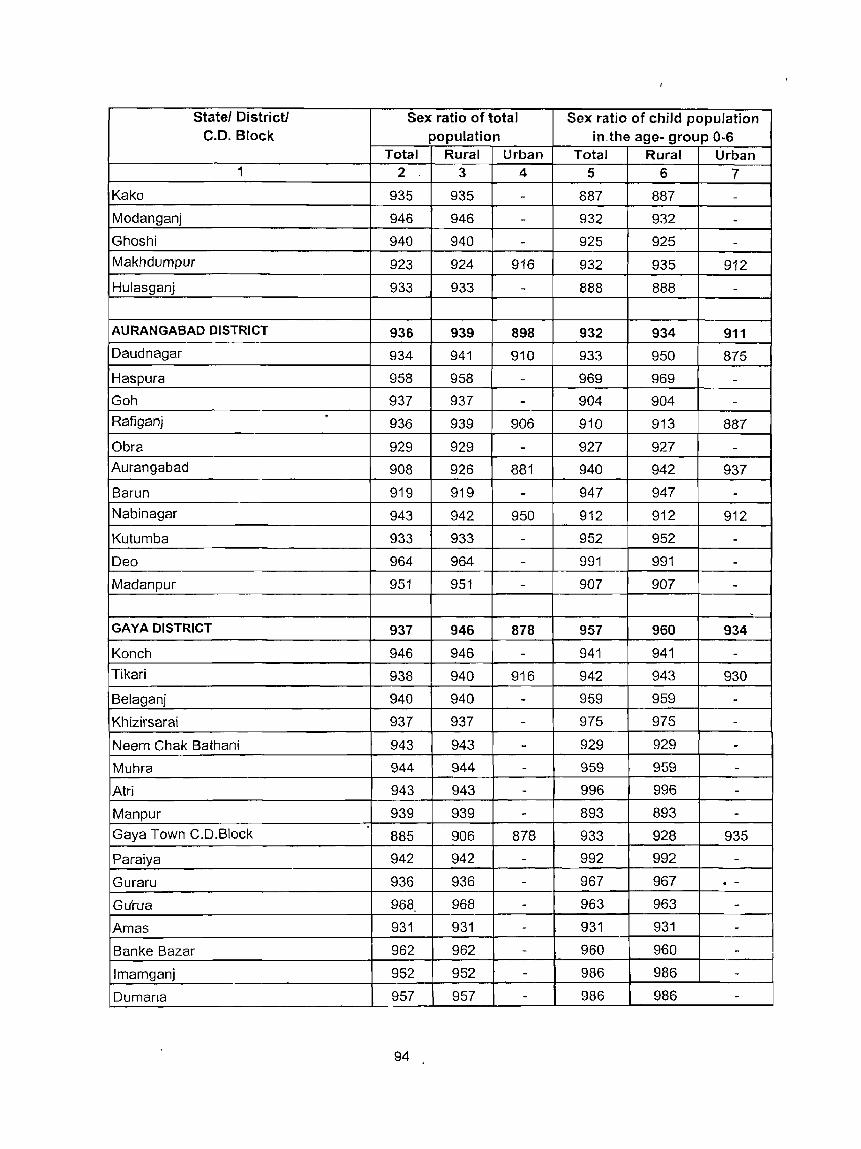
Statel District! Sex ratio of total Sex ratio of child population C.D. Block population in the age- group 0-6
Total Rural Urban Total Rural Urban 1 2 3 4 5 6 7
Kako 935 935 - 887 887 -Modanganj 946 946 - 932 932 -Ghoshi 940 940 - 925 925 -Makhdumpur 923 924 916 932 935 912
Hulasganj 933 933 - 888 888 -
AURANGABAD DISTRICT 936 939 898 932 934 911
Daudnagar 934 941 910 933 950 875
Haspura 958 958 - 969 969 -Goh 937 937 - 904 904 -Rafiganj
. 936 939 906 910 913 887
Obra 929 929 - 927 927 -Aurangabad 908 926 881 940 942 937
Barun 919 919 - 947 947 -Nabinagar 943 942 950 912 912 912
Kutumba 933 933 - 952 952 -Deo 964 964 - 991 991 -Madanpur 951 951 - 907 907 -
,
GAY A DISTRICT 937 946 878 957 960 934
Konch 946 946 - 941 941 -Tikari 938 940 916 942 943 930
Belaganj 940 940 - 959 959 -Khizirsarai 937 937 - 975 975 -
Neem Chak Bathani 943 943 - 929 929 -Muhra 944 944 - 959 959 -Atri 943 943 - 996 996 -
Manpur 939 939 - 893 893 -Gaya Town C.D.Block 885 906 878 933 928 935
Paraiya 942 942 - 992 992 -
Guraru 936 936 - 967 967 . -Gtfrua 968 968 - 963 963 -
Amas 931 931 - 931 931 -
Banke Bazar 962 962 - 960 960 -
Imamganj 952 952 - 986 986 -Dumana 957 957 - 986 986 -
94

State! District! Sex ratio of total Sex ratio of child population C.D. Block population in the age- group 0-6
Total Rural Urban Total Rural Urban 1 2 3 4 5 6 7
Sherghati 937 951 901 939 951 904
Dobhi 970 970 - 989 989 -Bodh Gaya 919 934 844 969 971 955
-Tan Kuppa 938 938 - 832 832 -Wazirganj 936 936 - 961 961 -
Fatehpur 964 964 - 1009 1009 -Mohanpur 973 973 - 964 964 -Barachatti 949 949 - 1029 1029 -
NAWADA DISTRICT 948 953 900 974 977 931
Nardiganj 945 945 - 991 991 -Nawada 916 932 881 942 953 912 Warisaliganj 936 941 919 976 983 945
Kashi Chak 925 925 - 1017 ~017 -
Pakribarawan 938 938 - 958 958 -Kawakol 942 942 - 990 990 -Roh 951 951 - 988 988 -Govindpur 999 999 - 1001 1001 -Akbarpur 952 952 - 953 953 -Hisua 956 960 941 973 973 973
Narhat 988 988 - 969 969 -
Meskaur 969 969 - 987 987 -
Sirdala 967 967 - 979 979 -
Rajauli 960 960 - 994 994 -
JAMUl DISTRICT 917 921 877 964 966 922
Islamnagar Aliganj 925 925 - 947 947 -
Sikandra 931 931 - 966 966 -Jamui 902 916 878 959 967 942
Barhat 883 883 - 968 968 -
Lakshmipur 916 916 - 956 956 -Jhajha 909 917 876 958 971 883
Gidhaur 900 900 - 928 928 -
Khaira 934 934 - 967 967 -
Sono 928 928 - 959 959 -Chakai 925 925 - 1000 1000 -
95


Annexure ~V Table - 5
Literacy rates by residence and sex - State, District, Community Development Block, 2001 Statel District! Literacy rate
C.D.Block Total Rural Urban Persons Males Females Persons Males Females Persons Males Females
1 2 3 4 5 6 7 8 9 10
BIHAR STATE 47.53 60.32 33.57 44.42 57.70 30.03 72.71 80.80 63.30 PASHCHIM CHAMPARAN DISTRICT 39.63 51.91 25.85 36.71 49.31 22.58 64.50 73.70 53.97
Sid haw 33.05 45.88 18.99 33.05 45.88 18.99 - - -Ramnagar 42.74 54.94 29.25 38.37 50.85 24.69 59.95 70.68 47.65
Gaunaha 39.88 54.23 24.30 39.88 54.23 24.30 - - -Mainatanr 41.19 55.30 25.31 41.19 55.30 25.31 - - -Narkatiaganj 44.32 56.07 31.21 39.64 51.65 26.39 71.65 80.94 60.56
Lauriya 44.95 57.65 30.93 44.95 57.65 30.93 - - -Bagaha 38.99 50.54 25.78 35.55 47.41 22.00 47.31 58.15 34.94
Piprasi 24.58 38.01 9.10 24.58 38.01 9.10 - - -Madhubani 26.06 39.29 11.26 26.06 39.29 11.26 - - -Bhitaha 26.77 3837 13.12 26.77 38.37 13.12 - - -Thakrahan 24.37 34.01 13.21 24.37 34.01 13.21 - - -lJogapatti 32.09 44.84 17.59 '32.09 44.84 17.59 - - -Chanpatia 42.00 54.08 28.35 39.94 52.22 26.05 60.52 71.05 48.89
Sikta 36.86 49.49 22.85 36.86 49.49 22.85 - - -Majhaulia 36.51 48.88 22.40 36.51 48.8e 22.40 - - -Bettiah 67.27 76.54 56.76 49.26 62.28 34.49 77.27 84.45 69.13
Bairia 32.41 44.91 18.33 32.41 44.91 18.33 - - -. Nautan 35.16 47.99 20.70 ;39. .. 16" 47.99 20.70 - - -PURBA CHAMPARAN DISTRICT 38.14 50.14 24.65 35.99 48.20 22.30 68.29 76.62 58.45
Raxaul 43.27 55.64 28.68 34.51 47.91 18.72 '70.18 79.31 59.37
Adapur 32.04 45.32 16.62 32.04 45.32 16.62 - - -Ramgarhwa 39.51 51.84 25.16 39.51 51.84 25.16 - - -Sugauli 37.76 49.64 24.17 34.50 46.63 20.70 52.66 63.19 40.26
Banjaria 34.52 44.10 23.20 34.52 44.10 23.20 - - -Narkatia 35.97 49.71 20.01 35.97 4~.71 20.01 - - -Bankatwa 29.21 41.53 14.81 29.21 41.53 14.81 - - -
Ghorasahan 35.09 47.00 20.90 35.09 47.00 20.90 - - -Dhaka 41.04 52.63 28.12 39.96 51.63 26.97 48.06 59.11 35.65
Chiraia 32.61 44.43 18.83 32.61 44.43 18.83 <l' - - -Motihari 51.15 60.29 40.31 31.95 43.27 18.72 80.59 85.95 74.08
Turkaulia 38.73 51.62 24.48 38.73 51.62 24.48 - - -
Harsidhi 39.16 52.55 24.35 39.16 52.55 24.35 - - -
97

State! District! Literacy rate C.D.Block Total Rural Urban
Persons Males Females Persons Males Females Persons Males Females
1 2 3 4 5 6 7 8 9 10
Paharpur 37.33 50.98 22.44 37.33 50.98 22.44 - - -Areraj 45.10 56.35 32.79 43.18 54.24 31.14 55.78 67.92 42.13
Sangrampur 38.97 50.08 26.97 38.97 50.08 26.97 - - -Kesaria 38.42 51.24 24.70 38.42 51.24 24.70 - - -Kalyanpur 39.95 53.10 26.09 39.95 53.10 26.09 - - -Kotwa 36.75 50.50 21.85 36.75 50.50 21.85 - - -
Piprakothi 36.65 49.59 22.11 36.65 49.59 22.11 - - -Chakia(Pipra) 37.04 48.54 24.71 34.27 45.73 22.06 61.56 72.53 49.02
Pakri Dayal 32.94 44.23 20.19 32.94 44.23 20.19 - - -
Patahi 35.22 45.78 23.49 35.22 45.78 23.49 - - -
Phenhara 41.08 57.25 24.17 41.08 57.25 24.17 - - -
Madhuban 30.34 41.73 17.69 30.34 41.73 17.69 - - -
Tetaria 25.50 35.81 13.93 25.50 35.81 13.93 - - -Mehsi 38.05 50.33 24.72 38.05 50.33 24.72 - - -SHEOHAR DISTRICT 37.01 45.54 27.43 36.71 45.13 27.27 43.93 54.86 31.32
Purnahiya 40.46 51.23 28.07 40.46 51.23 28.07 - - -Piprarhi 35.61 45.40 24.68 35.61 45.40 24.68 - - -Sheohar 44.33 48.12 40.22 44.41 46.65 42.01 43.93 54.86 31.32
Dumri Katsari 37.73 48.62 25.61 37.73 48.62 25.61 - - -
Tariani Chowk 30.18 39.63 19.29 30.18 39.63 19.29 - - -SITAMARHI DISTRICT 39.38 51.02 26.35 37.63 49.42 24.46 66.96 75.51 56.92
iBairgania 40.47 51.68 27.70 33.66 44.49 21.45 53.46 65.24 39.81
I.Suppi 41.01 52.41 28.18 41.01 52.41 28.18 - - -I Majorganj 34.33 44.28 23.37 34.33 44.28 23.~7 - - -Sonbarsa 37.17 51.11 21.30 37.17 51.11 21.30 - - -Parihar 34.07 46.31 20.37 34.07 46.31 20.37 - - -
Sursand 39.05 51.18 26.16 39.05 51.18 26.16 - - -Bathnaha 38.16 52.66 22.67 38.16 52.66 22.67 - - -Riga 37.64 49.47 24.08 37.64 49.47 24.08 - - -Parsauni 32.83 43.95 20.40 32.83 43.95 20.40 - - -Belsand 48.08 68.71 24.48 49.49 72.65 23.13 41.45 50.48 30.89
Runisaidpur 37.74 47.15 27.03 37.74 47.15 27.03 - - -.Dumra 48.07 58.69 35.79 37.93 49.73 24.42 75.54 82.56 67.19
Bajpatti 38.72 49.70 26.61 38.72 49.70 26.61 - - -Charaut 42.06 54.07 28.33 42.06 54.07 28.33 - - -
IPupri 41.69 51.54 30.91 37.82 47.63 27.14 77.15 86.73 66.26
98

Statel District! Literacy rate C.D.Block Total Rural Urban
Persons Males Females Persons Males Females Persons Males Females
1 2 3 4 5 6 7 8 9 10
Nanpur 37.12 46.67 26.57 37.12 46.67 26.57 - - -
Bokhara 33.87 42.28 24.41 33.87 42.28 24.41 - - -MADHUBANI DISTRICT 42.35 57.26 26.56 41.55 56.59 25.66 63.69 74.67 51.36
Madhwapur 40.95 54.84 26.06 40.95 54.84 26.06 - - -IHarlakhi 36.23 50.74 20.80 36.23 50.74 20.80 - - -8asopatti 40.80 54.53 25.67 40.80 54.53 25.67 - - -
lJainagar 45.52 61.04 28.26 41.79 58.02 23.79 69.54 80.30 57.35
ILadania 38.03 56.03 18.77 38.03 56.03 18.77 - - -Laukaha 40.32 59.46 20.28 40.32 59.46 20.28 - - -
ILaukahi 37.41 56.42 17.07 37.41 56.42 17.07 - - -Phulparas 41.72 59.46 22.97 40.47 58.88 21.01 52.58 64.50 39.90
Babubarhi 41.17 58.71 22.66 41.17 58.71 22.66 - - -Khajauli 44.72 61.50 26.33 44.72 61.50 26.33 - - -Kaluahi 44.38 57.49 30.62 44.38 57.49 30.62 - - -
Benipatti 43.54 55.68 30.75 43.54 55.68 30.75 - - -Sisfi 40.65 51.63 28.88 40.65 51.63 28.88 - - -'Madhubani 50.67 62.69 37.70 43.82 56.38 30.61 69.79 79.52 58.53
Pandaul 44.44 58.73 29.89 44.44 58.73 29.89 - - -Rajnagar 43.92 57.48 29.38 43.92 57.48 29.38 - - -
,Andhratharhi 41.30 57.28 24.82 41.30 57.28 24.82 - - -:Jhanjharpur 44.67 59.68 29.47 44.01 59.29 28.67 48.46 61.84 34.20
IGhoghardiha 40.84 58.92 21.74 40.84 58.92 21.74 - - -iLakhnaur 44.83 60.93 28.46 44.83 60.93 28.46 - - -Madhepur 38.34 52.28 23.69 38.34 52.28 23.69 - - -SUPAUL DISTRICT 37.80 53.23 21.02 36.57 52.16 19.66 59.87 72.02 46.07
Nirmali 42.45 60.72 22.68 39.11 58.49 18.44 54.40 68.44 38.39
Basantpur 43.39 57.31 27.86 40.02 54.30 24.07 66.45 77.84 53.72
Chhal;3pur 34.25 48.69 18.28 34.25 48.69 18.28 - - -
Pratapganj 41.74 56.85 25.27 41.74 56.85 25.27 - - -
Raghopur 38.65 52.09 2413 38.65 52.09 24.13 - - -
Saraigarh Bhaptiyahi 35.07 52.48 16.15 35.07 52.48 16.15 - - -
IKishanpur 36.33 53.70 18.11 36.33 53.70 18.11 - - -
Marauna ' 31.99 51.00 '11.63 31.99 51.00 11.63 - - -
ISupaul 41.23 55.96 25.34 37.18 52.44 20.91 59.29 71.15 45.76
Pipra 35.79 52.10 18.24 35.79 52.10 18.24 - - -
: fribeniganj 35.81 50.43 19.63 ;35.81 50.43 19.63 - - -
99

Statel District/· Literacy rate C.D.Block Total Rural Urban
Persons Males Females Persons Males Females Persons Males Females
1 2 3 4 5 6 7 8 9 10 ARARIA DISTRICT 34.94 46.50 22.14 33.07 44.80 20.14 61.70 70.11 51.82
Narpatganj 34.23 47.27 19.63 34.23 47.27 19.63 - - -Forbesganj 38.31 49.07 26.20 32.38 43.56 19.89 61.89 70.61 51.79
Bhargama 35.83 47.69 22.54 35.83 47.69 22.54 - - -Raniganj . 34.62 46.08 22.17 34.62 46.08 22.17 - - -Araria 36.15 45.70 25.51 30.71 40.37 20.10 61.48 69.53 51.86
Kursakatta 37.40 52.93 20.03 37.40 52.93 20.03 - - -Sikti 33.70 46.92 19.32 33.70 46.92 19.32 - - -Palasi 30.30 43.12 16.21 30.30 43.12 16.21 - - -Jokihat 31.24 41.41 20.24 31.24 41.41 20.24 - - -KISHANGANJ DISTRICT 31.02 42.80 18.49 27.68 39.56 15.20 59.71 69.19 48.52
Terhagachh 27.38 42.42 11.74 27.38 42.42 11.74 - - -Dighalbank 26.57 38.60 13.85 26.57 38.60 13.85 - - -Thakurganj ~0.48 42.50 17.90 27.75 39.82 15.20 64.97 75.04 53.59
Pothia 25.56 34.93 15.64 25.56 34.93 15.64 - - -Bahadurganj 30.66 42.90 17.72 28.78 40.89 16.11 42.40 54.88 28.23
Kochadhamin 29.44 41.88 16.36 '29.44 41.88 16.36 - - -Kishanganj 45.31 55.58 "33.71' 27.91 39.05 16.01 64.25 72.59 54.22
PURNIA DISTRICT 35.51 46.16 23.72 31.80 42.64 19.88 71.85 79.26 63.00
Banmankhi 37.77 49.42 24.64 35.14 46.84 22.07 63.38 73.30 51.08
Barhara Kothi 37.43 48.63 25.00 37.43 48.63 25.00 - - -Bhawanipur 33.63 44.27 21.73 33.63 4.4.27 21.73 - - -
Rupauli 32.08 43.59 19.16 32.08 43.59 19.16 - - . -Ohamdaha 33.96 45.29 21.66 33.96 45.29 21.66 - - -
Krityanand Nagar 34.75 45.24 23.29 34.75 . 45.24 23.29 - - -• Purnia East 57.38 66.31 47.04 39.36 M.01 27.47 " 74.80 81.55 66.71
Kasba 35.56 45.26 24.89 29.89 39.62 19.25 59.97 69.19 49.58
Srinagar 29.58 38.75 19.54 29.58 38.75 19.54 - - -Jalalgarh 33.40 43.76 22.15 33.40 43.76 22.15 - J -Amour 26.39 37.20 14.60 26.39 37.20 14.60 - - -. Baisa 28.12 38.95 16.33 28.12 38.95 16.33 - - -
Baisi 19.99 30.08 9.10 19.99 30.08 9.10 - - -
Oagarua 28.79 39.55 17.11 28.79 39.55 17.11 - - -KATIHAR DISTRICT 35.29 45.51 24.03 31.19 41.55 19.84 73.03 80.95 63.81
Falka 33.98 44.29 22.76 33.98 44.29 22.76 - - -Korha 31.14 40.57 20.66 31.14 40.57 20.66 - - -
100'
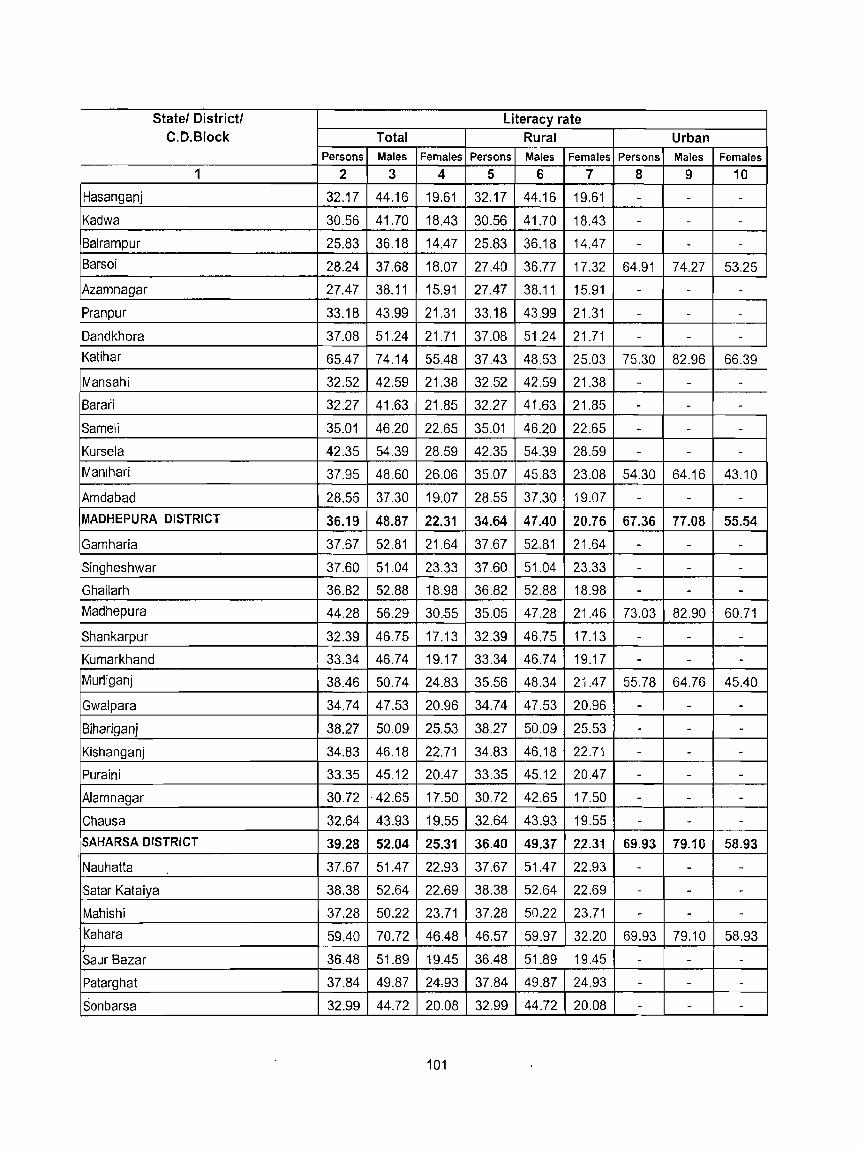
Statel Districtl Literacy rate C.D.Block Total Rural Urban
Persons Males Females Persons Males Females Persons Males Females
1 2 3 4 5 6 7 8 9 10
Hasanganj 32.17 44.16 19.61 32.17 44.16 19.61 - - -Kadwa 30.56 41.70 18.43 30.56 41.70 18.43 - - -Balrampur 25.83 36.18 14.47 25.83 36.18 14.47 - - -Sarsoi 28.24 37.68 18.07 27.40 36.77 17.32 64.91 74.27 53.25
Azamnagar 27.47 38.11 15.91 27.47 38.11 15.91 - - -
Pranpur 33.18 43.99 21.31 33.18 43.99 21.31 - - -Dandkhora 37.08 51.24 21.71 37.08 51.24 21.71 - - -Katihar 65.47 74.14 55.48 37.43 48.53 25.03 75.30 82.96 66.39
Mansahi 32.52 42.59 21.38 32.52 42.59 21.38 - - -Barari 32.27 41.63 21.85 32.27 41.63 21.85 - - -Sameli 35.01 46.20 22.65 35.01 46.20 22.65 - - -Kursela 42.35 54.39 28.59 42.35 54.39 28.59 - - -Manihari 37.95 48.60 26.06 35.07 45.83 23.08 54.30 64.16 43.10
Amdabad 28.55 37.30 19.07 28.55 37.30 19.07 - - -MADHEPURA DISTRICT 36.19 48.87 22.31 34.64 47.40 20.76 67.36 77.08 55.54
Gamharia 37.67 52.81 21.64 37.67 52,81 21.64 - - -Singheshwar 37.60 51.04 23.33 37.60 51.04 23.33 - - -Ghailarh 36.82 52.88 18.98 36.82 52.88 18.98 - - -Madhepura 44.28 56.29 30.55 35.05 47.28 21.46 73.03 82.90 60.71
Shankarpur 32.39 46.75 17.13 32.39 46.75 17.13 - - -Kumarkhand 33.34 46.74 19.17 33.34 46.74 19.17 - - -Murliganj 38.46 50.74 24.83 35.56 48.34 21.47 55.78 64.76 45.40
Gwalpara 34.74 47.53 20.96 34.74 47.53 20.96 - - -Bihariganj 38.27 50.09 25.53 38.27 50.09 25.53 - - -Kishanganj 34.83 46.18 22.71 34.83 46.18 22.71 - - -Puraini 33.35 45.12 20.47 33.35 45.12 20.47 - - -
Alamnagar 30.72 . 42.65 17.50 30.72 42.65 17.50 - - -Chausa 32.64 43.93 19.55 32.64 43.93 19.55 - - -SAHARSA DISTRICT 39.28 52.04 25.31 36.40 49.37 22.31 69.93 79.10 58.93
Nauhatta 37.67 51.47 22.93 37.67 51.47 22.93 - - -Satar Kataiya 38.38 52.64 22.69 38.38 52.64 22.69 - - -
Mahishi 37.28 50.22 23.71 37.28 50.22 23.71 - - -Kahara 59.40 70.72 46.48 46.57 59.97 32.20 69.93 79.10 58.93
Saur Bazar 36.48 51.89 19.45 36.48 51.89 19.45 - - -
Patarghat 37.84 49.87 24<93 37.84 49.87 24.93 - - -
Sonbarsa 32.99 44.72 20.08 32.99 44.72 20.08 - - -
101

State! District! Literacy rate C.D.Block Total Rural Urban
Persons Males Females Persons Males Females Persons Males Females
1 2 3 4 5 6 7 8 9 10
Simri Bakhtiarpur 35.58 47.91 22.07 35.58 47.91 22.07 - - -Salkhua 28.22 39.77 15.49 28.22 39.77 15.49 - - -Banma Itahri 33.54 45.17 20.72 33.54 45.17 20.72 - - -DARBHANGA DISTRICT 44.32 57.18 30.35 41.39 54.57 27.16 75.63 84.38 65.63
Jale 45.34 55.73 33.98 45.34 55.73 33.98 - - -Singhwara 44.86 55.63 33.16 44.86 55.63 33.16 - - -
Keotiranway 46.41 58.80 33.23 46.41 58.80 33.23 - - -Darbhanga 60.17 70.60 48.48 41.04 53.18 27.77 75.63 84.38 65.63
Manigachhi 44.73 58.28 30.37 44.73 513.28 30.37 - - -Tardih 40.49 53.65 26.54 40.49 53.65 26.54 - - -
Alinagar 31.88 43.46 19.41 31.88 43.46 19.41 - - -Benipur 40.58 56.64 25.01 40.58 56.64 25.01 - - -Bahadurpur 45.05 58.51 30.19 45.05 58.51 30.19 - - -
Hanumannagar 41.29 52.80 28.60 41.29 52.80 28.60 - - -Hayaghat 46.56 58.40 33.42 46.56 58.40 33.42 - - -Baheri 42.65 58.26 24.95 42.65 58.26 24.95 - - -Biraul 38.89 . 52.89 23.59 38.89 52.89 23.59 - - -Ghanshyampur 39.78 53.94 24.64 39.78 53.94 24.64 - - -Kiratpur 34.35 48.43 19.05 34.35 48.43 19.05 - - -Gora Bauram 38.01 51.89 22.79 38.01 51.89 22.79 - - -Kusheshwar Asthan 33.44 49.29 16.56 33.44 49.29 16.56 - - -Kusheshwar Asthan Purbi 28.40 42.52 12.73 28.40 42.52 12.73 - - -MUZAFFARPUR DISTRICT 48A5 60.19 35.20 44.87 57.49 31.40 78.04 83.84 71.30
Sahebganj 43.89 57.99 29.28 43.89 57.99 29.28 - - -Baruraj (Motipur) 44.24 57.36 30.21 43.53 56.84 29.39 53.18 63.59 41.05
Paroo 45.42 58.75 31.78 45.42 58.75 31.78 - - -Saraiya 47.25 60.29 33.97 47.25 60.29 33.97 - - -Marwan 46.82 58.92 33.73 46.82 58.92 33.73 - - -Kanti 51.05 61.55 39.25 50.21 60.70 38.43 58.74 69.21 46.79
Minapur 38.36 50.48 24.73 38.36 50.48 24.73 - - -Bochaha 38.55 52.19 23.34 38.55 . 52.19 23.34 - - -Aurai 38.70 49.45 27.04 38.70 49.45 27.04 - - -Katra 39.43 50.29 27.91 39.43 50.29 27.91 - - -Gaighat 40.70 52.09 28.36 40.70 52.09 28.36 - - -
Bandra 38.94 50.30 26.26 38.94 50.30 26.26 - - -,
I Dholi (Moraul) 54.80 67.58 41.36 54.80 67.58 41.36 - - -
102/

Statel Districtl Literacy rate C.D.Block Total Rural Urban
Persons Males Females Persons Males Females Persons Males Females
1 2 3 4 5 6 7 8 9 10
Musahri 68.61 75.63 60.49 52.74 62.07 42.00 80.97 86.15 74.96
Kurhani 48.26 60.49 34.87 48.26 60.49 34.87 - - -Sakra 50.31 71.50 31.14 50.31 71.50 31.14 - - -GOPALGANJ DISTRICT 48.19 63.81 32.81 47.19 63.07 31.65 63.25 74.49 51.11
Katiya 48.31 64.44 33.12 47.69 64.27 32.48 51.63 65.30 36.92
Bijaipur 44.98 62.03 29.09 44.98 62.03 29.09 - - -Bhorey 44.67 61.35 28.87 44.67 61.35 28.87 - - -Pachdeori 42.45 59.66 25.58 42.45 59.66 25.58 - - -Kuchaikote 49.54 65.51 33,62 49.54 65,51 33,62 - - -Phulwaria 50.20 66.63 33.83 50.20 66.63 33.83 - - -
Hathua 53,66 68.95 38.36 53.66 68.95 38,36 - . - -Uchkagaon 52,15 67.39 36,67 50.07 66.20 33.91 63.22 73.46 52.02
Thawe 55.09 69.27 40.46 55.09 69.27 40.46 - - -Gopalganj 54.64 67.60 40,72 45.91 60.82 30.42 74,24 82.05 65.20
Manjha 47.07 61.42 32.58 47.07 61.42 32.58 - - -Barauli 44,65 60.42 30.03 43.42 59.22 28.85 51.04 66.53 36.25
Sidhwalia 42,90 59.07 27.16 42.90 59.07 27.16 - - -Baikunthpur 41,33 57.32 26.05 41.33 57.32' 26.05 - - -SIWAN DISTRICT 52.01 67.67 37.26 50.86 66.87 35.93 70.98 79.69 61.27
Nautan 50.06 65.91 34.18 50.06 65.91 34.18 - - -Siwan 59.98 73.15 46.16 50.32 67.34 33.47 73.63 80.83 65.44
Barharia 49.91 65.37 35.29 49.91 65.37 35.29 - - -
Goriakothi 50.57 66.25 36.15 50.57 66.25 36.15 - - -Lakri Nabiganj 45.77 62.47 30.13 45.77 62.47 30.13 - - -Basantpur 51.47 68.54 35.90 51.47 68.54 35.90 - - -Bhagwanpur Hat 54.79 71.56 39.81 54.79 71.56 39.81 - - -~aharajganj 51.47 68.39 36.75 49.79 67.14 35.01 62.23 75.76 48.75
Pachrukhi 50.17 66.74 34.43 50.17 66.74 34.43 . . . Hussainganj 51.82 66.46 37.26 51.82 66.46 37.26 . - -Ziradei 53.95 69.57 39.23 53.95 69.57 39.23 - . -Mairwa 53.81 69.84 37.66 50.97 67.89 34.40 64.83 76.94 51.23
Guthani 53.04 69.28 37.52 53.04 69.28 37.52 - - -IDarauli 51.22 66.40 36.97 '51.22 66.40 36.97 - - -
, Andar 53.30 69.70 38.14 53.30 69.70 38.14 - - -i Raghunathpur 51.46 66.86 37.78 51.46 66.86 37.78 - - -I Hasanpura 52.57 69.98 36.57 52.57 69.98 36.57 - - -
103

Statel District! Literacy rate C.D.Block Total Rural Urban
Persons Males Females Persons Males Females Persons Males Females 1 2 3 4 5 6 7 8 9 10
Daraundha 45.21 58.92 32.55 45.21 58.92 32.55 - - -Siswan 50.09 65.88 35.96 50.09 65.88 35.96 - - -SARAN DISTRICT 52.01 67.81 35.74 50.43 66.46 34.13 67.01 79.94 52.10
Mashrakh 50.90 67.32 34.64 50.90 67.32 34.64 - - -Panapur 43.22 59.42 26.57 43.22 59.42 26.57 - - -Taraiya 38.26 50.47 25.'06 38.26 50.47 2506 - - -Ishupur 47.45 65.16 3067 47.45 65.16 30.67 - - -Baniapur 50.59 67.51 34.71 50.59 67.51 34.71 - - -
Lahladpur 49.18 66.34 33.18 49.18 66.34 33.18 - - -Ekma 57.62 74.11 41.91 57.62 74.11 41.91 - - -Manjhi 56.11 7235 40.10 56.11 72.35 40.10 - - -
Jalalpur 55.37 71.99 38.93 55.37 71.99 38.93 - - -Revelganj 55.18 70.70 38.67 55.75 72.16 38.49 54.09 68.00 39.00
Chapra 62.36 76.15 46.56 52.62 67.50 36.14 71.86 84.34 57.08
Nagra 53.02 69.75 36.10 53.02 69.75 36.10 - - -,Marhaura 47.46 64.06 30.66 46.90 63.65 30.06 51.63 67.06 35.34
Amnour 49.76 66.14 32.60 49.76 66.14 3260 - - -
Maker 46.24 61.17 31.11 46.24 61.17 31.11 - - -
Parsa 47.09 63.19 30.46 47.09 63.19 30.46 - - -
Oariapur 47.25 63.40 30.44 47.25 63.40 30.44 - - -
Garkha 49.25 65.82 32.00 49.25 65.82 32.00 - - -Dighwara 56.05 72.26 39.49 55.18 72.50 38.02 58.71 71.55 44.27
Sonepur 55.79 69.41 40.23 52.90 66.87 36.97 71.32 82.87 57.90
VAISHALI DISTRICT 51.63 64.00 38.14 50.50 63.09 36.82 66.54 75.88 . 55.95
Vaishali 49.89 62.40 36.70 49.89 62.40 36.70 . - -
Paterhi Belsar 49.20 63.49 34.84 49.20 63.49 34.84 - - -LalganJ 51.17 63.31 38.03 49.20 61.61 35.78 62.60 73.09 51.13
Bhagwanpur 53.49 65.86 40.01 53.49 65.86 40.01 - - -Goraul 51.45 66.24 35.87 51.45 66.24 35.87 - - -Chehra Kalan 46.29 60.67 31.40 4629 60.67 31 AO - - -
Patepur 42.82 56.45 28.25 42.82 56.45 28.25 - - -
Mahua 51.56 65.88 36.12 51.56 65.88 36.12 - - -
Jandaha 50.29 113.53 36.34 50.29 63.53 36.34 - - -
Raja Pakar 53.41 67.22 38.54 53.41 67.22 3854 - - . Hajipur 62.69 7379 50.05 57.90 70.37 43.84 71.53 80.05 61.68
Raghopur 32.82 44.02 19.26 32.82 44.02 19.26 - - -
104 "
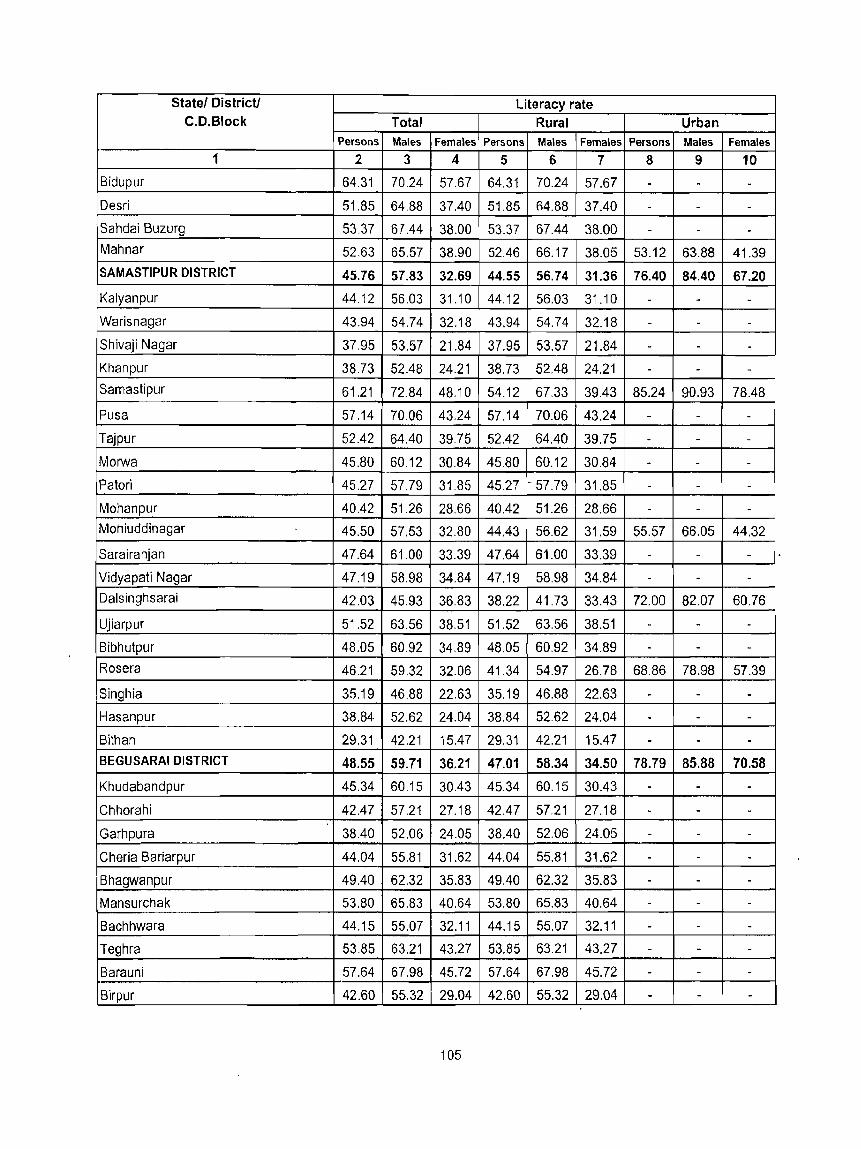
State! District! Literacy rate C.D.Block Total Rural Urban
Persons Males Females Persons Males Females Persons Males Females
1 2 3 4 5 6 7 8 9 10
Bidupur 64.31 70.24 57.67 64.31 70.24 57.67 - - -Desri 51.85 64.88 37.40 51.85 64.88 37.40 - - -Sahdai Buzurg 53.37 67.44 38.00 53.37 67.44 38.00 - - -Mahnar 52.63 65.57 38.90 52.46 66.17 38.05 53.12 63.88 41.39
SAMASTIPUR DISTRICT 45.76 57.83 32.69 44.55 56.74 31.36 76.40 84.40 67.20
Kalyanpur 44.12 56.03 31.10 44.12 56.03 31.10 - - -Warisnagar 43.94 54.74 32.18 43.94 54.74 32.18 - - -Shivaji Nagar 37.95 53.57 21.84 37.95 53.57 21.84 - - -Khanpur 38.73 52.48 24.21 38.73 52.48 24.21 - - -Samastipur 61.21 72.84 48.10 54.12 67.33 39.43 85.24 90.93 78.48
Pusa 57.14 70.06 43.24 57.14 70.06 43.24 - - -Tajpur 52.42 64.40 39.75 52.42 64.40 39.75 - - -
Morwa 45.80 60.12 30.84 45.80 60.12 30.84 - - -Patori 45.27 57.79 31.85 45.27 - 57.79 31.85 - - -Mohanpur 40.42 51.26 28.66 40.42 51.26 28.66 - - -Mohiuddinagar 45.50 57.53 32.80 44.43 56.62 31.59 55.57 66.05 44.32
Sarairanjan 47.64 61.00 33.39 47.64 61.00 33.39 - - -Vidyapati Nagar 47.19 58.98 34.84 47.19 58.98 34.84 - - -Dalsinghsarai 42.03 45.93 36.83 38.22 41.73 33.43 72.00 82.07 60.76
Ujiarpur 51.52 63.56 38.51 51.52 63.56 38.51 - - -
Bibhutpur 48.05 60.92 34.89 48.05 60.92 34.89 - - -Rosera 46.21 59.32 32.06 41.34 54.97 26.78 68.86 78.98 57.39
Singhia 35.19 46.88 22.63 35.19 46.88 22.63 - - -Hasanpur 38.84 52.62 24.04 38.84 52.62 24.04 - - -Bithan 29.31 42.21 15.47 29.31 42.21 15.47 - - -BEGUSARAI DISTRICT 48.55 59.71 36.21 47.01 58.34 34.50 78.79 85.88 70.58
Khudabandpur 45.34 60.15 30.43 45.34 60.15 30.43 - - -Chhorahi 42.47 57.21 27.18 42.47 57.21 27.18 - - -
Garhpura 38.40 52.06 24.05 38.40 52.06 24.05 - - -
Cheria Bariarpur 44.04 55.81 31.62 44.04 55.81 31.62 - - -
Bhagwanpur 49.40 62.32 35.83 49.40 62.32 35.83 - - -
Mansurchak 53.80 65.83 40.64 53.80 65.83 40.64 - - -
Bachhwara 44.15 55.07 32.11 44.15 55.07 32.11 - - -
Teghra 53.85 63.21 43.27 53.85 63.21 43.27 - - -
Barauni 57.64 67.98 45.72 57.64 67.98 45.72 - - -
Birpur 42.60 55.32 29.04 42.60 55.32 29.04 - - -
105

Statel District! Literacy rate C.D.Block Total Rural Urban
Persons Males Females Persons Males Females Persons Males Females 1 2 3 4 5 6 7 8 9 10
Begusarai 53.89 63.37 43.03 44.79 55.08 33.05 78.79 85.88 70.58
Naokothi 41.93 53.96 29.58 41.93 53.96 29.58 - - -Bakhri 40.12 51.82 27.30 40.12 51.82 27.30 - - -Dandari 37.68 49.10 24.87 37.68 49.10 24.87 - - -Sahebpur Kamal 44.90 57.15 31.37 44.90 57.15 31.37 - - -Balia 47.70 57.87 36.11 47.70 57.87 36.11 - - -Matihani 50.20 60.02 38.87 50.20 60.02 38.87 - - -Shamho Akha kurha 42.50 52.52 30.89 42.50 52.52 30.89 - - -KHAGARIA DISTRICT 41.56 52.02 29.62 39.67 50.28 27.60 70.14 77.51 61.23
Alauli 31.41 42.40 19.12 31.41 42.40 19.12 - - -Khagaria 46.29 55.60 35.56 40.41 50.14 29.33 77.01 83.08 69.54
Mansi 41.32 52.58 28.33 41.32 52.58 28.33 - - -Chautham 36.90 47.72 24.72 36.90 47.72 24.72 - - -Beldaur 31.89 42.69 20.02 31.89 42.69 20.02 - - -Gogri 45.57 56.09 33.24 43.47 54.19 30.91 59.73 68.89 48.96
Parbatta 50.17 60.64 38.19 50.17 60.64 38.19 - - -BHAGALPUR DISTRICT 50.28 60.11 38.83 45.08 55.72 32.73 71.84 78.22 64.33
Narayanpur 44.68 55.63 31.92 44.68 55.63 31.92 - - -Bihpur 48.59 58.04 37.50 48.59 58.04 37.50 - - -Kharik 42.06 52.63 29.67 42.06 52.63 29.67 - - -Naugachhia 47.70 57.13 36.52 42.75 52.19 31.61 58.60 67.92 47.42
Rangra Chowk 43.88 54.67 30.95 43.88 54.67 30.95 - - -Gopalpur 47.19 57.82 34.68 47.19 57.82 34.68 - - -Pirpainti 42.65 52.49 31.08 42.65 52.49 31.08 - - -Colgong 47.93 59.36 34.98 46.23 58.01 32.90 68.56 75.63 60.46
Ismailpur 34.98 46.51 21.05 34.98 46.51 21.05 - - -Sabour 51.22 62.21 38.10 51.22 62.21 38.10 - - -Nathnagar 45.43 55.66 33.43 45.43 55.66 33.43 - . -
Sultanganj 54.74 64.85 42.95 52.44 62.91 40.27 63.31 72.04 53.01
Shahkund 46.79 56.97 35.16 46.79 56.97 35.16 - - -Goradih 38.82 49.91 25.77 38.82 49.91 25.77 - - -Jagdishpur 67.10 73.85 59.22 44.99 54.43 34.20 74.40 80.17 67.61
Sonhaula 40.12 52.23 26.43 40.12 52.23 26.43 - - -BANKA DISTRICT 43.40 56.28 29.10 42.74 55.80 28.28 60.75 68.59 51.54
Shambhuganj 51.64 62.59 38.85 51.64 62.59 38.85 - - -Amarpur 47.97 58.61 35.88 47.45 . 58.39 35.01 51.96 60.36 42.55
106
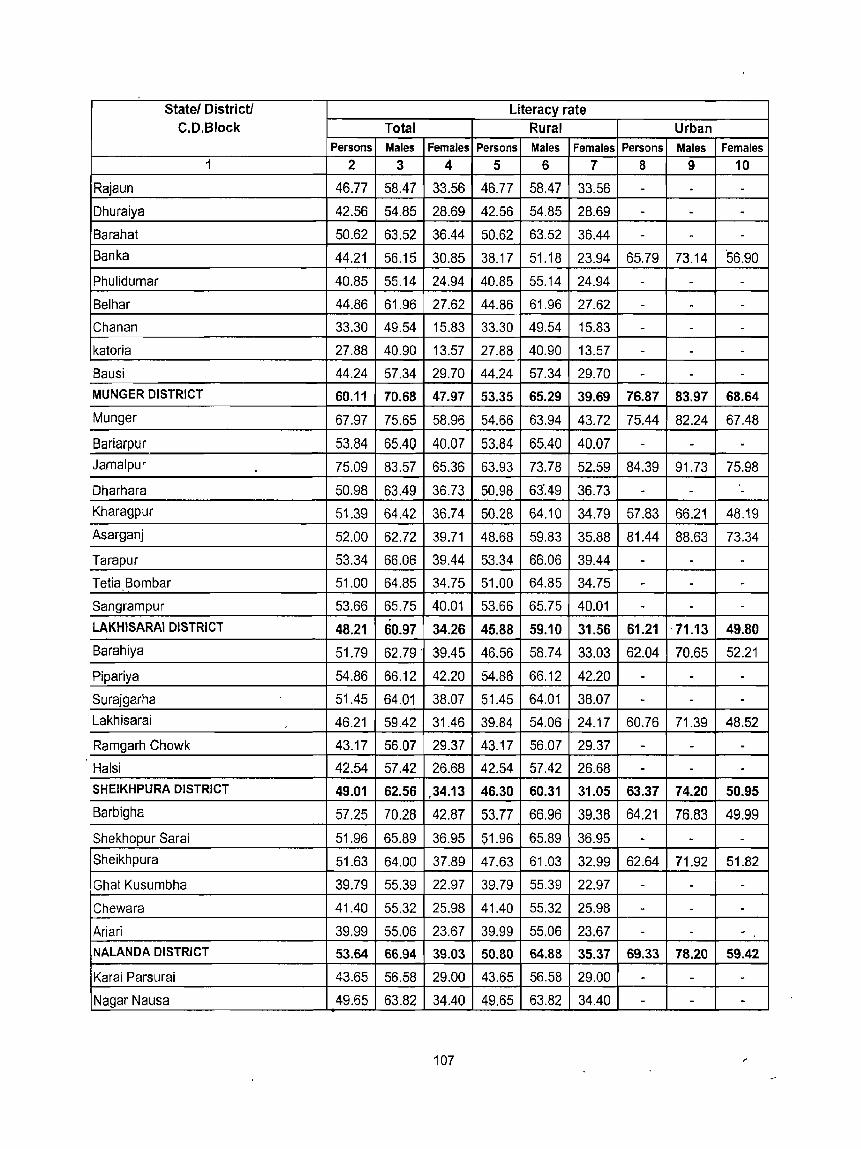
Statel District/ Literacy rate C.D.Block Total Rural Urban
Persons Males Females Persons Males Females Persons Males Females
1 2 3 4 5 6 7 8 9 10
Rajaun 46.77 58.47 33.56 46.77 58.47 33.56 - - -Dhuraiya 42.56 54.85 28.69 42.56 54.85 28.69 - - -Barahat 50.62 63.52 36.44 50.62 63.52 36.44 - - -Banka 44.21 56.15 30.85 38.17 51.18 23.94 65.79 73.14 56.90
Phulidumar 40.85 55.14 24.94 40.85 55.14 24.94 - - -Belhar 44.86 61.96 27.62 44.86 61.96 27.62 - - -Chanan 33.30 49.54 15.83 33.30 49.54 15.83 - - -katoria 27.88 40.90 13.57 27.88 40.90 13.57 - - -Bausi 44.24 57.34 29.70 44.24 57.34 29.70 - - -MUNGER DISTRICT 60.11 70.68 47.97 53.35 65.29 39.69 76.87 83.97 68.64
Munger 67.97 75.65 58.96 54.66 63.94 43.72 75.44 82.24 67.48
Bariarpur 53.84 65.40 40.07 53.84 65.40 40.07 - - -Jamalpur . 75.09 83.57 65.36 63.93 73.78 52.59 84.39 91.73 75.98
Dharhara 50.98 63.49 36.73 50.98 63~~9 36.73 - - -Kharagpur 51.39 64.42 36.74 50.28 64.10 34.79 57.83 66.21 48.19
Asarganj 52.00 62.72 39.71 48.68 59.83 35.88 81.44 88.63 73.34
Tarapur 53.34 66.06 39.44 53.34 66.06 39.44 - - -Tetia Bombar 51.00 64.85 34.75 51.00 64.85 34.75 - - -Sangrampur 53.66 65.75 40.01 53.66 65.75 40.01 - - -LAKHISARAI DISTRICT 48.21 60.97 34.26 45.88 59.10 31.56 61.21 . 71.13 49.80
Barahiya 51.79 62.79 . 39.45 46.56 58.74 33.03 62.04 70.65 52.21
Pipariya 54.86 66.12 42.20 54.86 66.12 42.20 - - -Surajgarha 51.45 64.01 38.07 51.45 64.01 38.07 - - -Lakhisarai 46.21 59.42 31.46 39.84 54.06 24.17 60.76 71.39 48.52
Ramgarh Chowk 43.17 56.07 29.37 43.17 56.07 29.37 - - -Halsi 42.54 57.42 26.68 42.54 57.42 26.68 - - -SHEIKHPURA DISTRICT 49.01 62.56 34.13 46.30 60.31 31.05 63.37 74.20 50.95
Barbigha 57.25 70.28 42.87 53.77 66.96 39.38 64.21 76.83 49.99
Shekhopur Sarai 51.96 65.89 36.95 Q1.96 65.89 36.95 - - -Sheikhpura 51.63 64.00 37.89 47.63 61.03 32.99 62.64 71.92 51.82
Ghat Kusumbha 39.79 55.39 22.97 39.79 55.39 22.97 - - -
Chewara 41.40 55.32 25.98 41.40 55.32 25.98 - - -Ariari 39.99 55.06 23.67 39.99 55.06 23.67 - - ~
NALANDA DISTRICT 53.64 66.94 39.03 50.80 64.88 35.37 69.33 78.20 59.42
Karai Parsurai 43.65 56.58 29.00 43.65 56.58 29.00 - - -Nagar Nausa 49.65 63.82 34.40 49.65 63.82 34.40 - - -
107
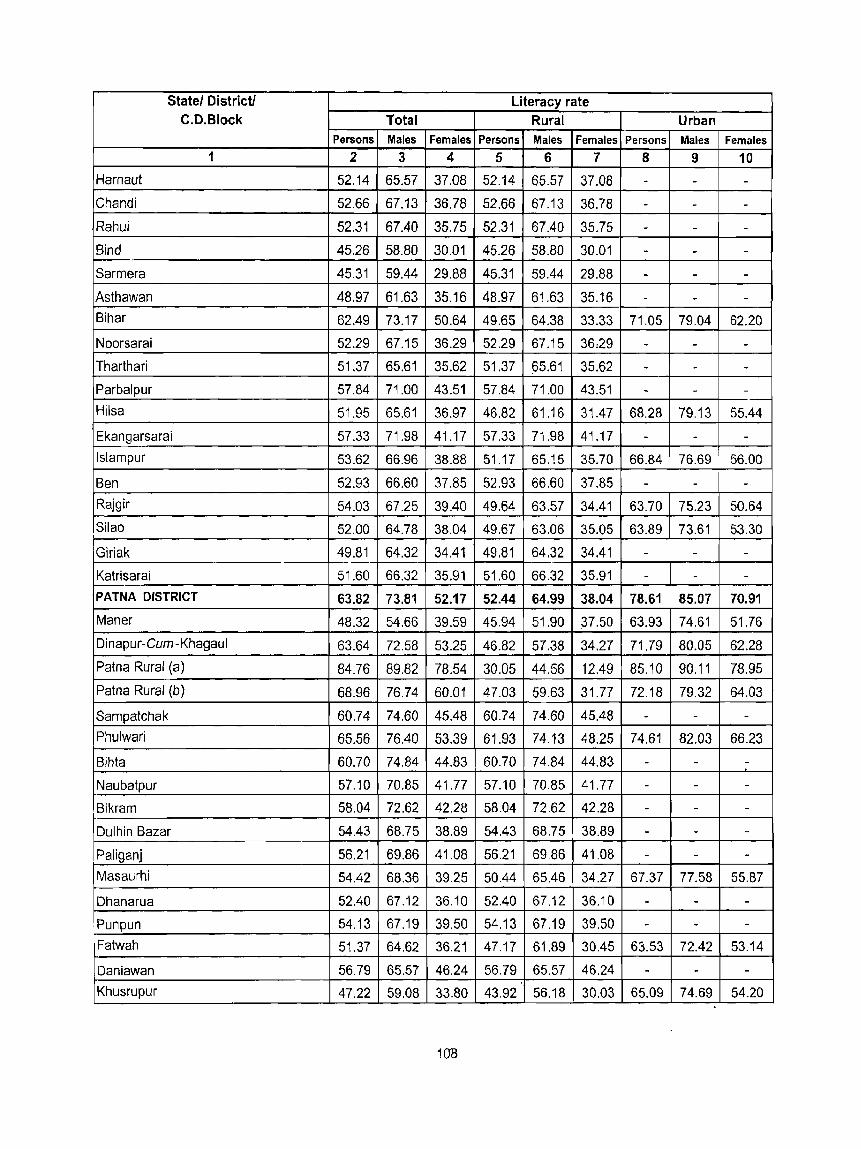
Statel District! Literacy rate C.D.Block Total Rural Urban
Persons Males Females Persons Males Females Persons Males Females
1 2 3 4 5 6 7 8 9 10
Harnaut 52.14 65.57 37.08 52.14 65.57 37.08 - - -
Chand; 52.66 67.13 36.78 52.66 67.13 36.78 - - -
Rahui 52.31 67.40 35.75 52.31 67.40 35.75 - - -Bind 45.26 58.80 30.01 45.26 58.80 30.01 - - -
Sarmera 45.31 59.44 29.88 45.31 59.44 29.88 - - -Asthawan 48.97 61.63 35.16 48.97 61.63 35.16 - - -Bihar 62.49 73.17 50.64 49.65 64.38 33.33 71.05 79.04 62.20
Noorsarai 52.29 67.15 36.29 52.29 67.15 36:29 - - -Tharthari 51.37 65.61 35.62 51.37 ~5.61 35.62 - - -Parbalpur 57.84 71.00 43.51 57.84 71.00 43.51 . - -
Hilsa 51.95 65.61 36.97 46.82 61.16 31.47 68.28 79.13 55.44
Ekangarsarai 57.33 71.98 41.17 57.33 71.98 41.17 . - -Islampur 53.62 66.96 38.88 51.17 65.~5 35.70 66.84 76.69 56.00
Ben 52.93 66.60 37.85 52.93 66.60 37.85 - - -Rajgir 54.03 67.25 39.40 49.64 63.57 34.41 63.70 75.23 50.64
Silao 52.00 64.78 38.04 49.67 63.06 35.05 63.89 73.61 53.30
Giriak 49.81 64.32 34.41 49.81 64.32 34.41 - - -
Katrisarai 51.60 66.32 35.91 51.60 66.32 35.91 - - -PATNA DISTRICT 63.82 73.81 52.17 52.44 64.99 38.04 78.61 85.07 70.91
Maner 48.32 54.66 39.59 45.94 51.90 .37.50 63.93 74,61 51.76
Dinapur-Cum -Khagaul 63.64 72.58 53.25 46.82 57.38 34.27 71.79 80.05 62.28
Patna Rural (a) 84.76 89.82 78.54 30.05 44.56 12.49 85.10 90.11 78.95
Patna Rural (b) 68.96 76.74 60.01 47.03 59.63 31.77 72.18 79.32 64.03
Sampatchak 60.74 74.60 45.48 60.74 74.60 45.48 - - -Phulwarj 65.56 76.40 53.39 61.93 74.13 48.25 74.61 82.03 66.23
Bihta 60.70 74.84 44.83 60.70 74.84 44.83 - - -
Naubatpur 57.10 70.85 41.77 57.10 70.85 41.77 - - -
Bikram 58.04 72.62 42.28 58.04 72.62 42.28 - - -
Dulhin Bazar 54.43 68.75 38.89 54.43 68.75 38.89 - - -
Paliganj 56.21 69.86 41.08 56.21 69.86 41.08 - - -Masaurhi 54.42 68.36 39.25 50.44 65.46 34.27 67.37 77.58 55.B7
Dhanarua 52.40 67.12 36.10 52.40 67.12 36.10 - - -Pun pun 54.13 67.19 39.50 54.13 67.19 39.50 - - -Fatwah 51.37 64.62 36.21 47.17 61.89 30.45 63.53 72.42 53.14
Daniawan 56.79 65.57 46.24 56.79 65.57 46.24 - - -Khusrupur 47.22 59.08 33.80 43.92 56.18 30.03 65.09 74.69 54.20
108

Statel DistricU Literacy rate C.D.Block Total Rural Urban
Persons Males Females Persons Males Females Persons Males Females
1 2 3 4 5 6 7 8 9 10
Bakhtiarpur 49.73 61.31 36.10 46.28 58.02 32.41 64.31 75.31 51.53
Athmalgola 54.37 66.14 40.61 54.37 66.14 40.61 - - -Belchhi 45.86 58.83 31.40 45.86 58.83 31.40 - - -BaTh 56.54 67.11 44.20 50.50 62.56" 36.53 69.97 77.15 61.49
Pandarak 45.42 58.46 30.77 45.42 58.46 30.77 - - -Ghoswari 37.81 51.16 21.71 37.81 51.16 21.71 - - -Mokameh 57.56 67.59 45.89 52.64 63.06 40.34 66.97 76.43 56.26
BHOJPUR DISTRICT 59.71 74.78 42.81 57.34 73.57 39.33 73.84 81.75 64.40
Shahpur 55.20 70.87 37.38 55.00 70.83 36.96 57.67 71.35 42.41
Arrah 70.33 81.90 56.87 60.45 76.78 41.90 78.02 85.80 68.78
Barhara 57.32 72.47 40.11 57.32 72.47 40.11 - - -Koilwar 60.98 74.82 44.66 60.06 76.18 41.93 67.88 66.15 70.82
Sandesh 55.38 71.95 37.11 55.38 71.95 37.11 - - -Udwant Nagar 60.43 77.02 42.12 60.43 77.02 42.12 - - -Behea 56.75 69.27 42.52 54.10 67.60 38.84 71.39 78.31 63.27
Jagdishpur 51.84 67.72 34.38 50.36 66.85 32.21 61.61 73.50 48.67
Piro 60.16 76.39 42.72 58.95 75.97 40.81 68.25 79.14 55.90
Charpokhari 57.93 73.15 40.34 57.93 73.15 40.34 - - -
Garhani 57.64 75.05 38.81 57.64 75.05 38.81 - - -
Agiaon 57.18 75.26 37.37 57.18 75.26 37.37 - - -
Tarari 61.07 77.41 43.32 61.07 77.41 43.32 - - -
Sahar 57.71 75.01 39.41 57.71 75.01 39.41 - - -BUXAR DISTRICT 57.49 72.82 40.36 55.65 71.61 37.91 75.11 84.14 64.52
Simri 56.61 71.16 40.06 56.61 71.16 40.06 - - -
Chakki 50.51 68.37 30.93 50.51 68.37 30.93 - - -
Barhampur 51.93 68.41 33.77 51.93 68.41 33.77 - - -
Chaungain 58.85 77.61 38.30 58.85 77.61 38.30 - - -
Kesath 58.31 74.50 41.31 58.31 74.50 41.31 - - -Dumraon 64.38 77.67 49.12 55.34 71.57 37.02 80.45 88.26 71.18
Buxar 61.48 75.41 45.58 60.28 75.08 43.41 65.29 76.45 52.47
Chausa 58.50 74.61 40.91 58.50 74.61 40.91 - - -Rajpur 55.23 71.28 37.65 55.23 71.28 37.65 - - -
Itarhi 53.99 69.68 36.36 53.99 69.68 36.36 - - -Nawanagar 54.30 71.15 36.13 54.30 71.15 36.13 - - -KAIMUR (BHABUA) DISTRICT 55.57 70.57 38.90 54.79 69.99 37.93 77.74 86.23 67.46
Ramgarh 60.29 75.85 43.44 60.29 75.85 43.44 - - -
109
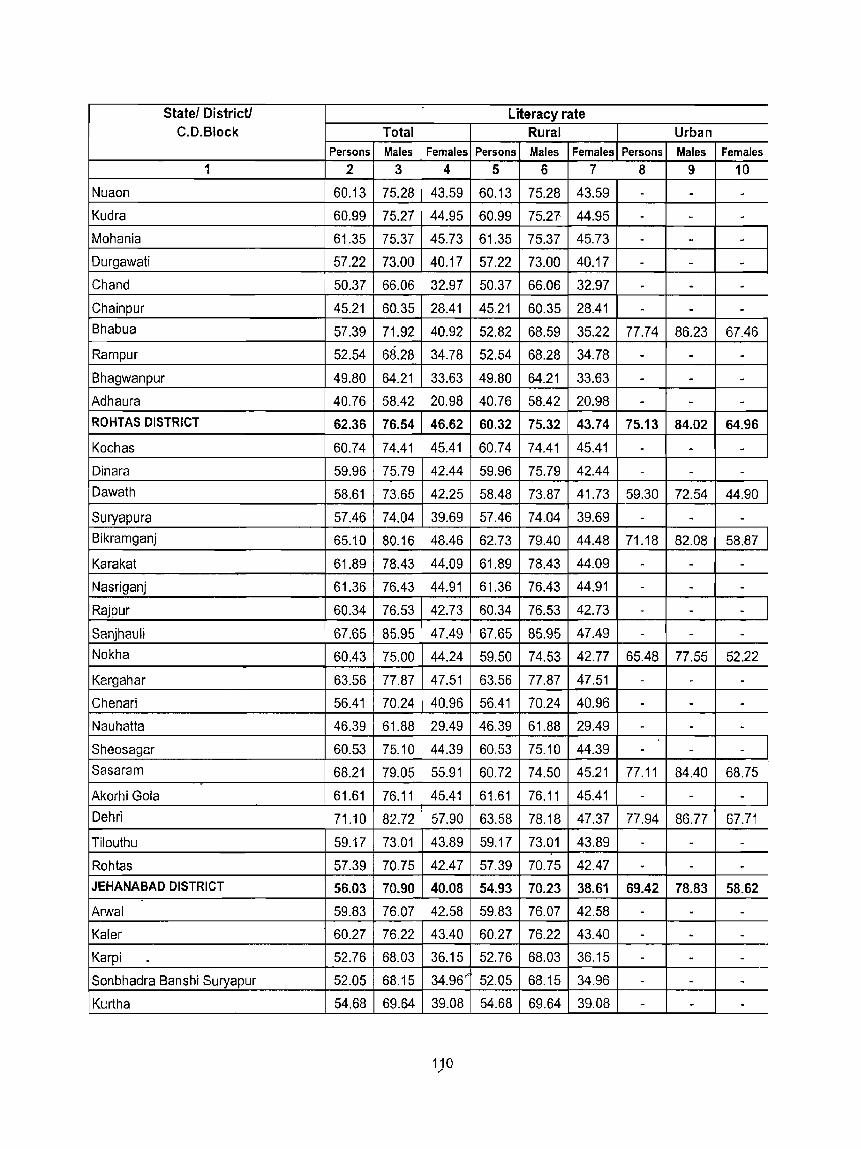
State! DistricU Literacy rate C.D.Block Total Rural Urban
Persons Males Females Persons Males Females Persons Males Females
1 2 3 4 5 6 7 8 9 10
Nuaon 60.13 75.28 43.59 60.13 75.28 43.59 - - -Kudra 60.99 75.27 44.95 60.99 75.27 44.95 - - · Mohania 61.35 75.37 45.73 61.35 75.37 45.73 - - · Durgawati 57.22 73.00 40.17 57.22 73.00 40.17 - - -Chand 50.37 66.06 32.97 50.37 66.06 32.97 - - -Chainpur 45.21 60.35 28.41 45.21 60.35 28.41 - - -Bhabua 57.39 71.92 40.92 52.82 68.59 35.22 77.74 86.23 67.46
Rampur 52.54 68.28 34.78 52.54 68.28 34.78 - - -Bhagwanpur 49.80 64.21 33.63 49.80 64.21 33.63 . - -Adhaura 40.76 58.42 20.98 40.76 58.42 20.98 - - -ROHTAS DISTRICT 62.36 76.54 46.62 60.32 75.32 43.74 75.13 84.02 64.96
Kochas 60.74 74.41 45.41 60.74 74.41 45.41 - - -Dinara 59.96 75.79 42.44 59.96 75.79 42.44 - - -Dawath 58.61 73.65 42.25 58.48 73.87 41.73 59.30 72.54 44.90
Suryapura 57.46 74.04 39.69 57.46 74.04 39.69 - - -Bikramganj 65.10 80.16 48.46 62.73 79.40 44.48 71.18 82.08 58.87
Karakat 61.89 78.43 44.09 61.89 78.43 44.09 - - -
Nasriganj 61.36 76.43 44.91 61.36 76.43 44.91 - - -Rajpur 60.34 76.53 42.73 60.34 76.53 42.73 - - -
Sanjhauli 67.65 85.95 47.49 67.65 85.95 47.49 - - -Nokha 60.43 75.00 44.24 59.50 74.53 42.77 65.48 77.55 52.22
Kargahar 63.56 77.87 47.51 63.56 77.87 47.51 - - -
Chenari 56.41 70.24 40.96 56.41 70.24 40.96 - - · Nauhatta 46.39 61.88 29.49 46.39 61.88 29.49 - - -Sheosagar 60.53 75.10 44.39 60.53 75.10 44.39 - - -Sasaram 68.21 79.05 55.91 60.72 74.50 45.21 77.11 84.40 68.75
Akorhi Gola 61.61 76.11 45.41 61.61 76.11 45.41 - - -Dehri 71.10 82.72 57.90 63.58 78.18 47.37 77.94 86.77 67.71
Tilouthu 59.17 73.01 43.89 59.17 73.01 43.89 - - -Rohtas 57.39 70.75 42.47 57.39 70.75 42.47 . - -JEHANABAD DISTRICT 56.03 70.90 40.08 54.93 70.23 38.61 69.42 78.83 58.62
Arwal 59.83 76.07 42.58 59.83 76.07 42.58 - - -Kaler 60.27 76.22 43.40 60.27 76.22 43.40 - - -Karpi 52.76 68.03 36.15 52.76 68.03 36.15 - - -Sonbhadra Banshi Suryapur 52.05 68.15 34.96" 52.05 68.15 34.96 - - -Kurtha 54.68 69.64 39.08 54.68 69.64 39.08 - - ·
1)0

Statel District! Literacy rate C.D.Block Total Rural Urban
Persons Males Females Persons Males Females Persons Males Females 1 2 3 4 5 6 7 8 9 10
Ratni Faridpur 54.76 71.42 37.36 54.76 71.42 37.36 - - -Jehanabad 62.09 74.49 48.14 53.30 67.98 37.21 75.26 83.95 65.10
Kako 52.66 67.89 36.58 52.66 67.89 36.58 - - -Modanganj 53.40 68.1S 37.87 53.40 68.13 37.87 - - -Ghoshi 54.15 68.90 38.52 54.15 68.90 38.52 - - -Makhdumpur 54.13 68.04 39.03 54.23 68.64 38.60 53.52 64.43 41.61
Hulasganj 56.16 71.06 40.36 56.16 71.06 40.36 - - -AURANGABAD DISTRICT 57.50 71.99 42.04 56.06 71.06 40.11 72.82 81.61 63.02
Daudnagar 60.29 74.31 45.28 58.40 73.56 42.26 66.69 76.81 55.66
Haspura 57.10 72.33 41.16 57.10 72.33 41.16 - - -
Goh 54.31 71.39 36.24 54.31 71.39 36.24 - - -Rafiganj 52.23 66.65 36.91 51.37 66.47 35.38 59.92 68.23 50.80
Obra 59.53 73.99 43.96 59.53 73.99 43.96 - - -Aurangabad 68.23 80.33 54.79 59.83 75.04 43.32 80.46 87.83 71.99
Barun 60.64 75.80 44.04 60.64 75.80 44.04 - - -Nabinagar 56.03 70.74 40.54 55.26 70.15 39.57 64.81 77.47 51.60
Kutumba 56.13 69.72 41.52 56.13 69.72 41.52 - - -Deo 53.28 67.73 38.19 53.28 67.73 38.19 - · · Madanpur 53.43 67.91 38.37 53.43 67.91 '.38.37 - · ·
GAY A DISTRICT 51.07 63.81 37.40 46.68 60.13 32.42 77.05 84.79 68.15
Konch 53.62 69.85 36.48 53.62 69.85 36.48 - - -Tikari 56.76 71.56 40.96 54.67 69.95 38.40 79.15 88.64 68.77
Belaganj 53.30 67.62 38.00 53.30 67.62 38.00 - - -
Khizirsarai 51.12 65.29 35.86 51.12 65.29 35.86 - - -
Neem Chak Bathani 45.03 61.08 28.07 45.03 61.08 28.07 - - -
Muhra 46.71 60.10 32.47 46.71 60.10 32.47 · · ·
Atri 42.83 58.45 26.06 42.83 58.45 26.06 - - -
Manpur 48.77 60.65 36.29 48.77 60.65 36.29 - - -Gaya Town C.D.Block 72.41 80.42 63.26 51.74 61.84 40.52 78.72 86.00 70.34
Paraiya 51.46 67.07 34.67 51.46 67.07 34.67 - - -
Guraru 52.87 67.31 37.32 52.87 67.31 37.32 - - -
Gurua 48.91 62.92 34.46 48.91 62.92 34.46 - · -
iAmas 49.98 62.96 36.04 49.98 62.96 36.04 · · -
Banke Bazar 42.38 51.76 32.63 42.38 51.76 32.63 - · -
Imamganj 40.73 51.85 28.93 40.73 51.85 28.93 · - -
Dumaria 36.98 48.70 24.64 36.98 48.70 24.64 - - -
111

Statel District! Literacy rate C.D.Block Total Rural Urban
Persons Males Females Persons Males Females Persons Males Females
1 2 3 4 5 6 7 8 9 10
Sherghati 48.36 57.74 38.35 40.78 50.64 30.41 68.75 76.35 60.32
Dobhi 37.07 49.96 23.72 37.07 49.96 23.72 - - -Bodh Gaya 48.50 61.73 33.91 45.69 58.79 31.53 62.23 75.31 46.31
Tan Kuppa 38.90 52.78 24.56 38.90 52.78 24.56 . - -Wazirganj 51.09 63.72 37.51 51.09 63.72 37.51 - - -
Fatehpur 40.64 55.02 25.55 40.64 55.02 25.55 - - -
Mohanpur 40.11 54.65 25.21 40.11 54.65 25.21 - - -
BarachaUi 42.22 54.87 28.61 42.22 54.87 28.61 - - -NAWADA DISTRICT 47.36 61.22 32.64 45.27 59.57 30.16 71.61 79.88 62.35
Nardiganj 43.91 513.13 28.69 43.91 58.13 28.69 - - -Nawada 57.35 69.27 44.25 47.42 61.62 32.09 77.54 84.39 69.72
Wnrisa liganj 49.50 62.52 35.47 45.84 59.57 31.11 63.65 73.84 52.50 r--Kasbi Chak 51.33 64.56 36.71 51.33 64.56 36.71 - - -Pakribarawan 43.56 56.80 29.38 43.56 56.80 29.38 - - -Kawakol 37.57 51.57 22.52 37.57 51.57 22.52 - - -Roh 42.61 56.18 28.21 42.61 56.18 28.21 - - -Govindpur 46.78 62.91 30.62 46.78 62.91 30.62 - - -Akbarpur 46.22 59.78 31.96 46.22 59.78 31.96 - - -Hisua 48.58 62.29 34.19 44.89 59.54 29.59 61.62 71.89 50.64
Narhat 53.12 68.55 37.58 53.12 68.55 37.58 - - -Meskaur 45.44 60.98 29.32 45.44 60.98 29.32 - - -Sirdala 44.34 60.60 27.48 44.34 60.60 27.48 - - -Rajauli 45.66 59.79 30.80 45.66 59.79 30.80 - - -JAMUl DISTRICT 42.74 57.10 26.92 40.57 55.17 24.53 69.13 79.91 56.71
Islamnagar Aliganj 45.51 57.68 32.28 45.51 57.68 32.28 - - -
Sikandra 43.15 57.47 27.63 43.15 57.47 27.63 - - -
Jamui 52.90 65.71 38.49 44.74 58.47 29.55 66.34 77.40 53.56
Barhat 46.08 59.71 30.32 46.08 59.71 30.32 - - -
Lakshmipur 38.91 53.44 22.88 38.91 53.44 22.88 - - -Jh<Jjha 42.09 55.96 26.67 35.35 49.86 19.31 74.14 84.46 62.33
Gidhaur 49.89 65.36 32.58 49.89 65.36 32.58 - - -Khaira 43.48 59.66 26.01 43.48 59.66 26.01 - - -
Sono 34.56 49.68 18.14 34.56 49.68 18.14 - - -Chakai 36.71 51.74 20.15 36.71 51.74 20.15 - - -
'11-2

Annexure - VI Table-6
Population,percentage decadal growth 1991·2001,sex ratio, literacy by sex - UAs,Cities and Towns by size class in the State, 2001
Size· Civic District Population Percentage Sex Literacy rate class status Persons Males Females decadal ratio Persons Males Females
and of the growth
name City! 1991-2001
of UAI CitylTown Town
1 2 3 4 5 6 7 8 9 10 11
All Classes 8679200 4643278 4035922 29.31 869 72.71 80.80 63.30
I. Class 1(100,000 & above) 5147411 2765557 2381854 68.75 861 77.38 84.37 69.18
a)M7 (5,000,000 and above) . · . · · . . . b)M6 (2,000,000· 4,999,999) . · . - · . . . e)M5 (1,000,000·1,999,999) 1707429 925857 781572 55.27 844 80.40 86.41 73.21
1.Patna UA Patna 1707429 925857 781572 55.27 844 80.40 86.41 73.21
(i)Patna M.Corp.&OG Patna 1442932 784871 658061 50.87 838 81.84 87.45 75.07
Patna M.Corp. Patna 1376950 749868 627082 50.12 836 81.87 87.41 75.16
Pataliputra Housing Colony OG Patna 4710 2533 2177 6.95 859 92.40 92.95 91.77
Digha • Mainpura OG Patna 54031 28612 25419 55.40 888 81.45 8904 72.90
Sabazpura OG Patna 1745 919 826 - · 899 60.15 67.45 52.03
Khalilpura OG Patna 4779 2550 2229 - 874 74.46 81.87 65.85
8adalpura OG Patna 717 389 328 - '843 87.94 96.75 77.46
(ii) Phulwari Sharif NA Patna 53166 28089 25077 51.37 893 74.61 82.03 66.23
(iii) Dinapur Nizamat M Patna 130339 69024 61315 54.04 888 65.79 74.98 55.43
(iv) Dinapur Cantonment C.B. Patna 28149 15715 12434 19.83 791 81.23 87.32 73.36
(v) Khagaul M&OG Patna 52843 28158 24685 - 877 81.22 88.13 73.38
Khagaul M Patna 48330 25754 22576 19.47 877 82.33 89.08 74.68
Saidpura OG Patna 4513 2404 2109 - 877 68.76 77.52 58.76
d)M4 (500,000 - 999,999) - · - - · . - -e)M3 (300,000·499,999) 1049359 561460 487899 · 869 77.95 84.10 70.80
1.Gaya UA Gaya 394185 209926 184259 33.88 878 78.72 86.00 70.34
(i) Gaya M.Corp.&OG Gaya 388427 206011 182416 33.17 885 78.57 85.87 70.25
Gaya M.Corp. Gaya 383197 203252 179945 31.38 885 78.74 86.03 70.44
Kaler OG Gaya 5230 2759 2471 90.04 896 65.60 73.62 56.58
(ii) Paharpur C.T. Gaya 5758 3915 1843 · 471 89.02 92.78 79.95
2.Bhagalpur U.A. Bhagalpur 349709 187627 162082 33.44 864 74.40 80.17 67.61
(i) Bhagalpur M.Corp. Bhagalpur 340349 182704 157645 34.41 863 75.02 80.73 68.31
(ii) Habibpur C.T. Bhagalpur 9360 4923 4437 35.77 901 49.84 57.70 41.08
3.Muzaffarpur M.Corp. Muzaffarpur 305465 163907 141558 26.69 864 80.97 86.15 74.96
f)M2 (200,000·299,999) 702201 373731 328470 -42.22 879 74.82 83.07 65.38
1.Darbhanga M.Corp. Darbhanga 266834 142042 124792 22.18 879 75.63 84.38 65.63
2.Bihar M Nalanda 231972 121813 110159 15.22 904 71.05 79.04 62.20
3:Arrah M Bhojpur 203395 109876 93519 29.48 851 78.02 85.80 68.78
g)M1 (100,000-199,999) 1688422 904509 783913 129.61 867 74.95 82.93 65.61
1.Purnia U.A. Purnia 196757 106051 90706 43.70 855 72.91 80.01 64.46
(i)Purnia M Purnia 171235 92573 78662 49.01 850 .74.80 81.55 66.71
(ii)Kasba NA Purnia 25522 13478 12044 15.9B 894 59.97 69.19 49.5B
113
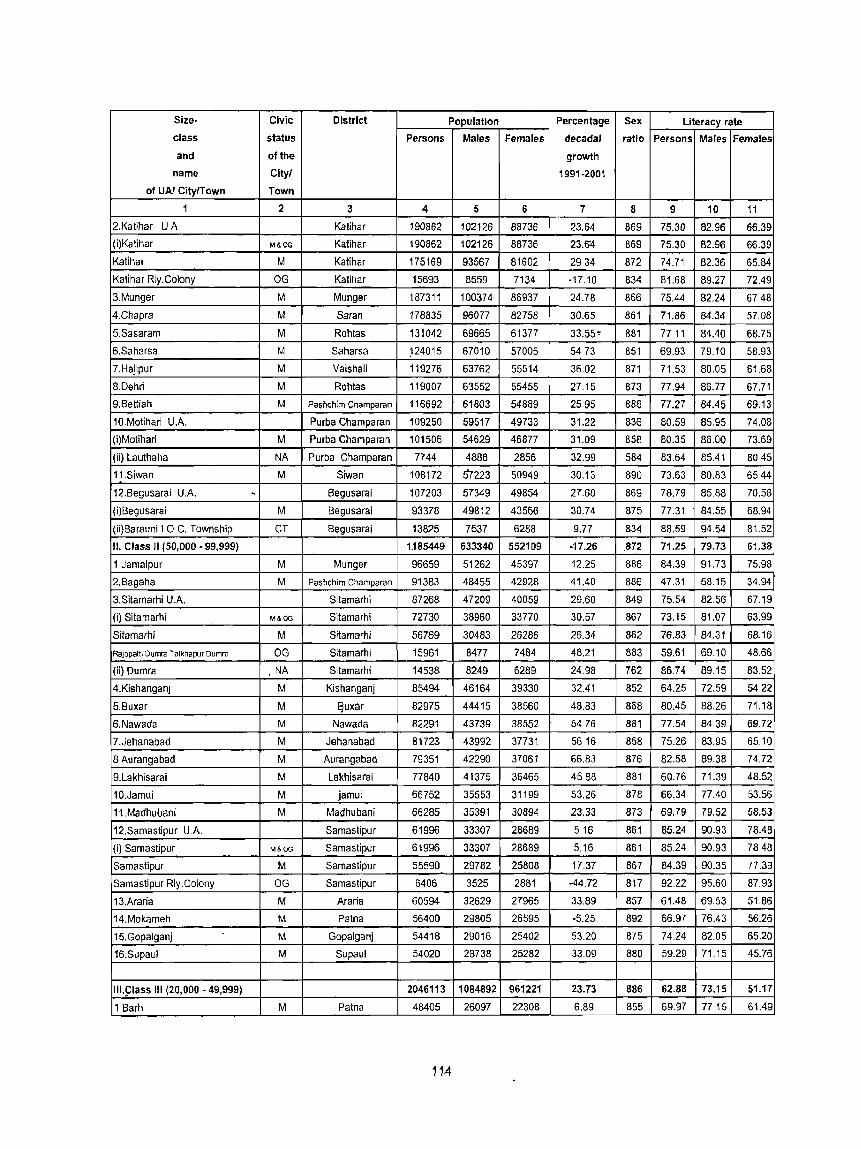
Size· Civic District Population Percentage Sex Literacy rate
class status Persons Males Females decadal ratio Persons Males Females
and of the growth
name Cityl 1991·2001
of UAI CitylTown Town
1 2 3 4 5 6 7 8 9 10 11
2.Katihar UA Katihar 190862 102126 88736 23.64 869 75.30 82.96 66.39
(i)Katihar M&OO Katihar 190862 102126 88736 23.6'4 869 75.30 82.96 66.39
Katihar M Katihar 175169 93567 81602 2934 872 74.71 82.36 65.84
Katihar Rly.Colony OG Katihar 15693 8559 7134 -17.10 834 81.68 89.27 72.49
3.Munger M Munger 187311 100374 86937 24.78 866 75.44 82.24 67.48
4.Chapra M Saran 178835 96077 82758 30.65 861 71.86 84.34 57.08
5.Sasaram M Rohlm. 131042 69665 61377 33.55~ 881 77 11 84.40 68.75
6.Saharsa M Saharsa ~24015 67010 57005 5473 851 69.93 79.10 58.93
7.Hajipur M Vaishali 119276 63762 55514 36.02 871 71.53 8005 61.68
8.Dehri M Rohtas 119007 63552 55455 27.15 873 77.94 86.77 67.71
9.Bettiah M Pash~him Ch~mparan 116692 61803 54889 25.95 888 77.27 84.45 69.13
10.Molihari U.A. Purba Champaran 109250 59517 49733 31.22 836 80.59 85.95 74.08
(i)Molihari M Purba Champaran 101506 54629 46877 31.09 858 80.35 8600 73.69
(ii) Lauthaha NA Purba Champaran 7744 4888 2856 32.99 584 83.64 85.41 8045
11.Siwan M Siwan 108172 !)r223 50949 30.13 890 73.63 80.83 6544
12.Begusarai UA ~ Begusarai 107203 57349 49854 27.60 869 78.79 85.88 70.58
(i)Begusarai M Begusarai 93378 49812 43566 30.74 875 77.31 84.55 68.94
(ii)Barauni 1.0 C. Township CT Begusarai 13825 7537 6288 9.77 834 88.59 94.54 81.52
II. Class II (50,000 ·99,999) 1.185449 633340 552109 ·17.26 .872 71.25 79.73 61.38
1 Jamalpur M Munger 96659 51262 45397 12.25 886 84.39 91.73 75.98
2.Bagaha M Pash~him Champaran 91383 48455 42928 41.40 886 47.31 58.15 34.94
3.Sitamarhi U.A. Sitamarhi 87268 47209 40059 29.60 849 75.54 82.56 67.19
(i) Sitamarhi M&OG Sitamarhi 72730 38960 33770 30.57 867 73.15 81.07 63.99
Sitamarhi M Sitamarhi 56769 30483 26286 26.34 862 76.83 84.31 68.16
RaJopatti Dumra Talkhapur Dumra OG Sitamarhi 15961 8477 7484 48.21 883 59.61 69.10 48.66
(ii) Dumra NA Sitamarhi 14538 8249 6289 24.98 762 86.74 89.15 83.52
4.KishanganJ M Kishanganj 85494 46164 39330 32.41 852 64.25 72.59 5422
5.Buxar M ~uxar 82975 44415 38560 48.83 868 80.45 88.26 71.18
6. Nawada M Nawada 82291 43739 38552 54.76 881 77.54 8439 69.72
7.Jehanabad M Jehanabad 81723 43992 37731 5616 858 75.26 83.95 65.10
8 Aurangabad M Aurangabad 79351 42290 37061 66.83 876 82.58 89.38 74.72
9.Lakhisarai M Lakhisarai 77840 41375 36465 4588 881 60.76 71.39 48.52
10.Jamui M jamui 66752 35553 31199 53.26 878 66.34 77.40 53.56
11.Madhubani M Madhubani 66285 35391 30894 23.33 873 69.79 79.52 58.53
12.Samaslipur U.A. Samaslipu( 61996 33307 28689 516 861 85.24 90.93 78.48
(il Samastipur M&OO Samastipur 61996 33307 28689 5.16 861 85.24 90.93 7848
Samastipur M Samastipur 55590 29782 25808 17.37 867 84.39 90.35 77.39
Samastipur Rly.Colony OG Samastipuf 6406 3525 2881 -44.72 817 92.22 95.60 87.93
13.Araria M Araria 60594 32629 27965 33.89 857 61.48 69.53 51.86
14.Mokameh M Patna 56400 29805 26595 ·5.25 892 66.97 76.43 56.26
15.Gopalganj M Gopalganj 54418 29016 25402 53.20 875 74.24 82.05 65.20
16.Supaul M Supaul 54020 28738 25282 33.09 880 59.29 71.15 45.76
1I1.91ass III (20,000 .49,999) 2046113 1084892 961221 23.73 886 62.88 73.15 51.17
1 Barh M Pain a 48405 26097 22308 6.89 855 69.97 77 15 61.49
114
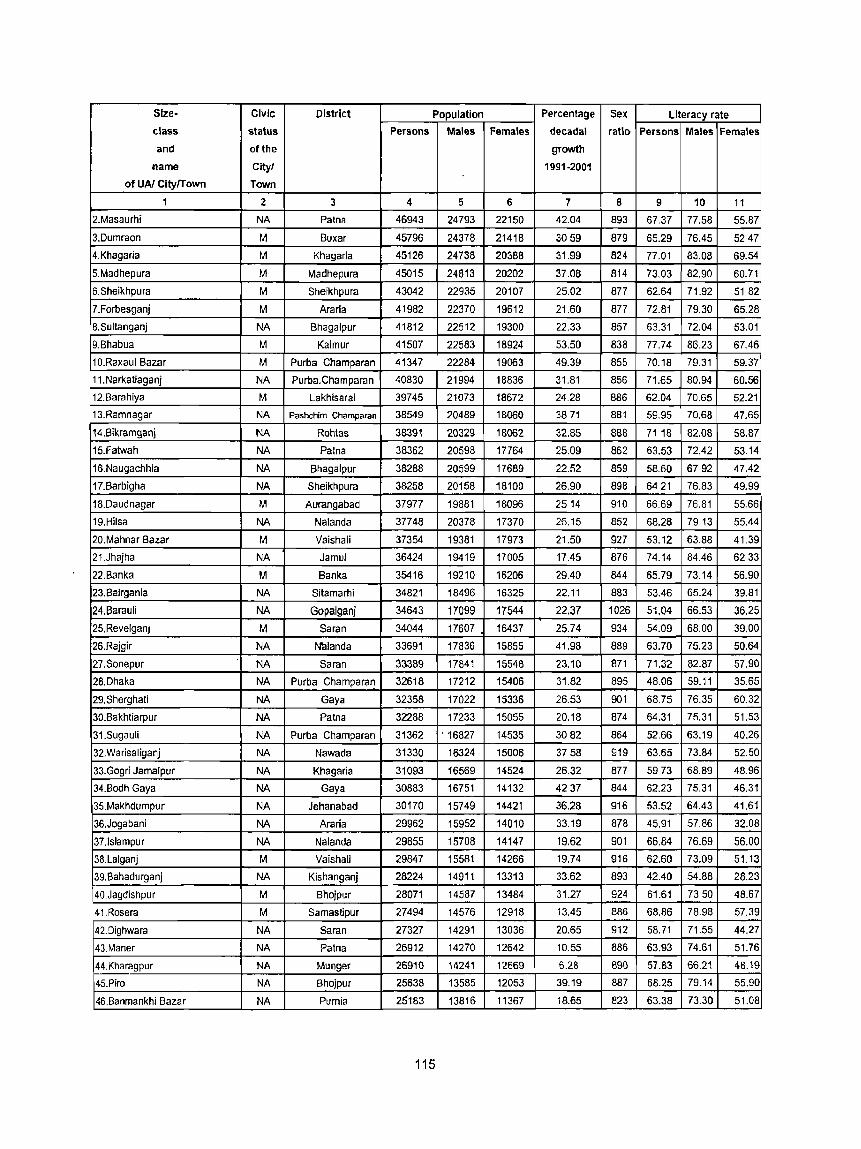
Size· Civic District Population Percentage Sex Literacy rate
class status Persons Males Females decadal ratio Persons Males Females
and of the growth
name City! 1991-2001
of UAI City/Town Town
1 2 3 4 5 6 7 8 9 10 11
2.Masaurhi NA Patna 46943 24793 22150 42.04 893 67.37 77.58 55.87
3.Dumraon M Buxar 45796 24378 21418 3059 879 65.29 76.45 5247
4.Khagaria M Khagarla 45126 24738 20388 31.99 824 77.01 83.08 69.54
5.Madhepura M Madhepura 45015 24813 20202 37,08 814 73.03 82.90 60.71
6,Sheikhpura M Sheikhpura 43042 22935 20107 25.02 877 62.64 71.92 5182
7.Forbesganj M Araria 41982 22370 19612 21.60 877 72.81 79.30 65.28
B.Sullanganj NA Bhagalpur 41812 22512 19300 22,33 857 63.31 72.04 53.01
9,Bhabua M Kaimur 41507 22583 18924 53,50 838 77.74 86.23 67.46
10.Raxaul Bazar M Purba Champa ran 41347 22284 19063 49.39 855 70.18 79.31 59.37
11.Narkatiaganj NA Purba.Champaran 40830 21994 18836 31.81 856 71.65 80.94 6D.56
12.8arahiya M Lakhisarai 39745 21073 18672 24,28 886 62.04 70.65 52.21
13.Ramnagar NA Pashchim Champatan 38549 20489 18060 3871 881 59.95 70.68 47.65
14.Bikramganj NA Rohlas 38391 20329 18062 32.85 888 7118 82.08 58.87
15.Fatwah NA Patna 38362 20598 17764 25,09 862 63.53 72.42 53.14
16,Naugachhia NA Bhagalpur 38288 20599 17689 22,52 859 58,60 6792 47.42
17. Barbigha NA Sheikhpura 38258 20158 18100 26,90 898 6421 76.83 49.99
18.Daudnagar M Aurangabad 37977 19881 18096 2514 910 66,69 76.81 55.66
19.Hilsa NA Nalanda 37748 20378 17370 26,15 852 68.28 79.13 55.44
20.Mahnar Bazar M Vaishali 37354 19381 17973 21,50 927 53.12 63.88 41.39
21.Jhajha NA Jamui 36424 19419 17005 17.45 876 74.14 84.46 6233
22.Banka M Banka 35416 19210 16206 29,40 844 65.79 73.14 56.90
23.Bairgania NA Sitamarhi 34821 18496 16325 22,11 883 53.46 65.24 39.81
24.Barauli NA Gopalganj 34643 17099 17544 22.37 1026 51.04 66.53 36.25
25.Revelgan) M Saran 34044 17607 16437 25.74 934 54.09 68.00 39.00
26.Rajgir NA N'alanda 33691 17836 15855 41.98 889 63.70 75.23 50.64
27.Sonepur NA Saran 33389 17841 15548 23.10 871 71.32 B2.87 57.90
28.Dhaka NA Purba Champaran 32618 17212 15406 31.82 895 48.06 59.11 35.65
29.Sherghati NA Gaya 32358 17022 15336 26.53 901 68.75 76.35 60.32
30.Bakhtiarpur NA Patna 32288 17233 15055 20.18 874 64.31 75.31 51.53
31.Sugauli NA Purba Champaran 31362 . 16827 14535 3082 864 52,66 63.19 40.26
32.Warisaliganj NA Nawada 31330 16324 15006 3758 919 63.65 73.84 52,50
33.Gogri Jamalpur NA Khagaria 31093 16569 14524 26.32 877 5973 68,89 48.96
34.Bodh Gaya NA Gaya 30883 16751 14132 4237 844 62.23 75.31 46.31
35,Makhdumpur NA Jehanabad 30170 15749 14421 36.28 916 53.52 64.43 41.61
36.Jogabani NA Araria 29962 15952 14010 33.19 878 45.91 57.86 32.08
37,lslampur NA Nalanda 29855 15708 14147 19.62 901 66.84 76.69 56.00
3B,Lalganj M Vaishali 29847 15581 14266 19.74 916 62.60 73.09 51.13
39. Bahadurganj NA Kishanganj 28224 14911 13313 33.62 893 42.40 54.88 28.23
40,Jagdishpur M BhojplJr 28071 14587 13484 31.27 924 61.61 7350 48.67
41,Rosera M Samastipur 27494 14576 12918 13.45 886 68.86 78.98 57.39
42.Dighwara NA Saran 27327 14291 13036 20,65 912 58.71 71,55 44.27
43,Maner NA Patna 26912 14270 12642 10.55 886 63.93 74.61 51.76
44.Khara9Pur NA Munger 26910 14241 12669 6.28 890 57.83 66.21 48.19
45.Piro NA Bhojpur 25638 13585 12053 39.19 887 68.25 79.14 55.90
46.Banmankhi Bazar NA Purnia 25183 13816 11367 18.65 823 63.38 73.30 51.08
115

Size· Civic District Population Percentage Sex Literacy rate
class status Persons Males Females decadal ratio Persons
and of the growth
name Cityl 1991·2001
of UAI CitylTown Town
1 2 3 4 5 6 7 8 9
47.Hisua NA Nawada 25045 12900 12145 34.59 941 61.62
48.Marhaura NA Saran 24534 12667 11867 18.92 937 51.63
49.Jhanjharpur NA Madhubani 24102 12467 11635 20.40 933 48.46
50.Rafiganj NA Aurangabad 23889 12531 11358 28.91 906 59.92
51.Mirganj NA Gopalganj 23579 12247 11332 19.71 925 63.22
52.Murliganj NA Madhepura 22921 12176 10745 11.55 882 55.78
53. Nokha NA Rohtas 22338 11624 10714 36.62 922 65.48
54.Colgong M Bhagalpur 22110 11705 10405 23.53 889 68.56
55.Chanpatia NA Pas he him Champaran 22029 11445 10584 14.02 925 60.52
56.Motipur NA Muzaffarpur 21933 11722 10211 23.07 871 53.18
57.Manihari NA Katihar 21783 11523 10260 26.26 890 54.30
58.Sheohar NA Sheohar 21327 11354 9973 53.27 878 43.93
59.Amarpur NA Banka 20930 10957 9973 21.22 910 51.96
60.Maharajganj NA Siwan 20878 10529 10349 21.63 983 62.23
61.Kanti NA Muzaffarpur 20873 11082 9791 30.16 884 58.74
62.Behea NA Bhojpur 20809 11112 9697 21.82 873 71.39
63. Areraj NA Purba Champaran 20245 10618 9627 . 907 55.78
64 Dalsinghsarai NA Samastipur 20181 10654 9527 20.57 894 72.00
65.Silao NA Nalanda 20177 10483 9694 23.91 925 63.89
IV.ClassIV(10,OOO·19,999) 280345 148959 131386 -47.61 882 62.16
1.Koilwar NA Bhojpur 19925 12145 7780 94.14 641 67.88
2.Jainagar NA Madhubani 19493 10343 9150 14.81 885 69.54
3.Nabinagar NA Aurangabad 19041 9764 9277 27.97 950 64.81
4.Mairwa NA Siwan 18696 9834 8(:62 22.88 901 64.83
5.Kataiya NA Gopalganj 17896 9284 8612 3419 928 51.63
6.Belsand NA Sitamarhi 17821 9511 8310 25.93 874 41.45
7.Birpur NA Supaul 17730 9495 8235 20.27 867 66.45
8.Tikari M q.<!ya 17615 9192 8423 24.03 916 79.15
9.Chakia NA Purba Champaran 16618 8868 7750 21.23 874 61.56
10.Nirmali NA Supaul 16144 8521 7623 17.13 895 54.40
11.Koath NA Rohtas 15809 8197 7612 16.72 929 59.30
12. Thakurganj NA Kishanganj 15288 8075 7213 12.50 893 64.97
13.Ghoghardiha NA Madhubani 14523 7474 7049 20.82 943 52.58
14.Shahpur NA Bhojpur 14456 7560 6896 28.45 912 57.67
15.MOhiuddinagar NA Samastipur 13764 7136 6628 2499 929 55.57
16.Janakpur Road NA Sitamarhi 13341 7114 6227 39.11 875 77.15
17. Khusrupur NA Patna 12185 6446 5739 18.79 890 65.09
V.Class V(5,OOO·9,999) 19882 10530 9352 -42.96 888 67.82
1.Jamhaur NA Aurangabad 8575 4465 4110 27.43 920 60.24
2.Asarganj CT Munger 5706 3011 2695 15.83 895 81.44
3.Raghunathpur CT Katihar 5601 3054 2547 - 834 64.91
VI.Class VI(Less than 5,000) . . . . . . . Note :- 1. Towns created after 1991 Census for the first time have been shown In Italics.
2. The inter censal growth rate of population for a size-class for 1991·2001 has been worked out according to the size class of the towns in 1991 .
11&
Males Females
10 11
71.89 50.64
6706 35.34
61.84 3420
68.23 50.80
73.46 52.02
64.76 45.40
77.55 52.22
7563 60.46
71.05 48.89
63.59 41.05
64.16 4310
54.86 31 32
60.36 42.55
75.76 48.75
69.21 46.79
78.31 63.27
67.92 42.13
82.07 60.76
73.61 53.30
72.59 50.24
66.15 70.82
80.30 57.35
77.47 51.60
76.94 51.23
65.30 36.92
50.48 30.89
77.84 5372
88.64 68.77
72.53 49.02
68.44 38.39
72.54 44.90
75.04 53.59
64.50 39.90
71.35 42.41
66.05 44.32
86.73 66.26
74.69 54.20
77.82 56.36
72.65 46.62
88.63 73.34
74.27 53.25
. .

Name
of
Cityl
Town
1
Amarpur
Araria
Arera]
Arrah
Asarganj
Aurangabad
Bagaha
Bahadurganj
Bairgania
Bakhtiarpur
Banka
Banmankhi Bazar
Barahiya
Barauli
Barauni IOC Township
Barbigha.
Barh
Begusarai
Behea
Belsand
Bettiah
Bhabua
Bhagalpur . Bihar
Bikramganj
Birpur
Bodh Gaya
Buxar
Chakia
Chanpatia
Chapra
Colgong
Dalsinghsarai
Darbhanga
Daudnagar
Dehn
Dhaka
Dighwara
Dinapur Contonment
Dinapur Nizamat
Dumra
Appendix-1 to Table-6 Population, child population in the age-group 0-6 and literates by sexIndependent Cities and Towns arranged in alphabetical order, 2001
Civic District Population Child population in the
Status age- group 0-6
of Cityl Persons Males Females Persons Males Females
Town
2 :3 4 5 6 7 8 9
NA Banka 20930 10957 9973 3854 1935 1919
M Araria 60594 32629 27965 10988 5629 5359
NA Purba Champaran 20245 10618 9627 3980 2008 1972
M Bhojpur 203395 109876 93519 29866 15711 14155
CT Munger 5706 3011 2695 813 417 396
M Aurangabad 79351 42290 37061 12220 6319 5901
M Pashchim Champaran 91383 48455 42928 17280 8962 8318
NA Kishanganj 28224 14911 13313 5863 3018 2845
NA Sitamarhi 34821 18496 16325 6829 3466 3363
NA Patna 32288 17233 15055 5847 3019 2828
M Banka 35416 19210 16206 5597 2890 2707
NA Purnia '. 25183 13816 11367 4529 2385 2144
M lakhisarai 39745 21073 18672 6012 3089 2923
NA Gopalganj 34643 17099 17544 6972 3585 3387
CT Begusarai 13825 7537 6288 1835 1022 813
NA Sheikhpura 38258 20158 18100 7253 3729 3524
M Patna 48405 26097 22308 7375 3860 3515
M Begusarai 93378 49812 43566 14295 7443 6852
NA Bhojpur 20809 11112 9697 3558 1802 1756
NA Sitamarhi 17821 9511 8310 3436 1760 1676
M Pashchim Champaran 116692 61803 54889 19265 10033 9232
M Kaimur 41507 22583 18924 6521 3422 3099
M.Corp . Bhagalpur 340349 182704 157645 48463 24892 23571
M Nalanda 231972 121813 110159 36264 18897 17367
NA Rohtas 38391 20329 18062 7133 3743 3390
NA Supaul 17730 9495 8235 2727 1579 1148
NA Gaya 30883 16751 14132 5413 2769 2644
M Buxar 82975 44415 38560 13200 6560 6640
NA Purba Champa ran 16618 8868 7750 2917 1558 1359
NA Pashchim Champaran 22029 11445 10584 4255 2115 2140
M Charpa 178835 96077 82758 27224 13884 13340
M Bhagalpur 22110 11705 10405 3772 1918 1854
NA Samastipur 20181 10654 9527 3297 1746 1551
M.Corp. Darbhanga 266834 142042 124792 40000 20986 19014
M Aurangabad 37977 19881 18096 6828 3641 3187
M Rohtas 119007 63552 55455 17866 9262 8604
NA Purba Champaran 32618 17212 15406 6580 3441 3139
NA Charpa 27327 14291 13036 5168 2565 2603
CB Patna 28149 15715 12434 3698 1932 1766
M Patna 130339 69024 61315 19953 10541 9412
NA_ Sitamarhi 14538 8249 6289 1603 841 762
117
Annexure- VII
Literates
Persons Males Females
10 11 12 8873 5446 3427
30496 18773 11723
9073 5848 3225
135379 80792 54587
3985 2299 1686
55435 32152 23283
35058 22966 12092
9482 6527 2955
14965 9805 5160
17005 10704 6301
19618 11937 7681
13090 8379 4711
20928 12705 8223
14123 8991 5132
10622 6159 4463
19908 12622 7286
28710 17155 11555
61136 35824 25312
12315 7291 5024
5962 3913 2049
75281 43719 31562
27198 16522 10676
218986 127403 91583
139060 81346 57714
22251 13614 8637
9969 6162 3807
15850 10530 5320
56131 33411 22720
8435 5302 3133
10757 6629 4128
108944 69320 39624
12572 7402 5170
12157 7311 4846
171564 102141 69423
20773 12474 8299
78829 47106 31723
12513 8140 4373
13009 8390 4619
19861 12035 7826
1"2621 43852 28769
11220 6604 4616
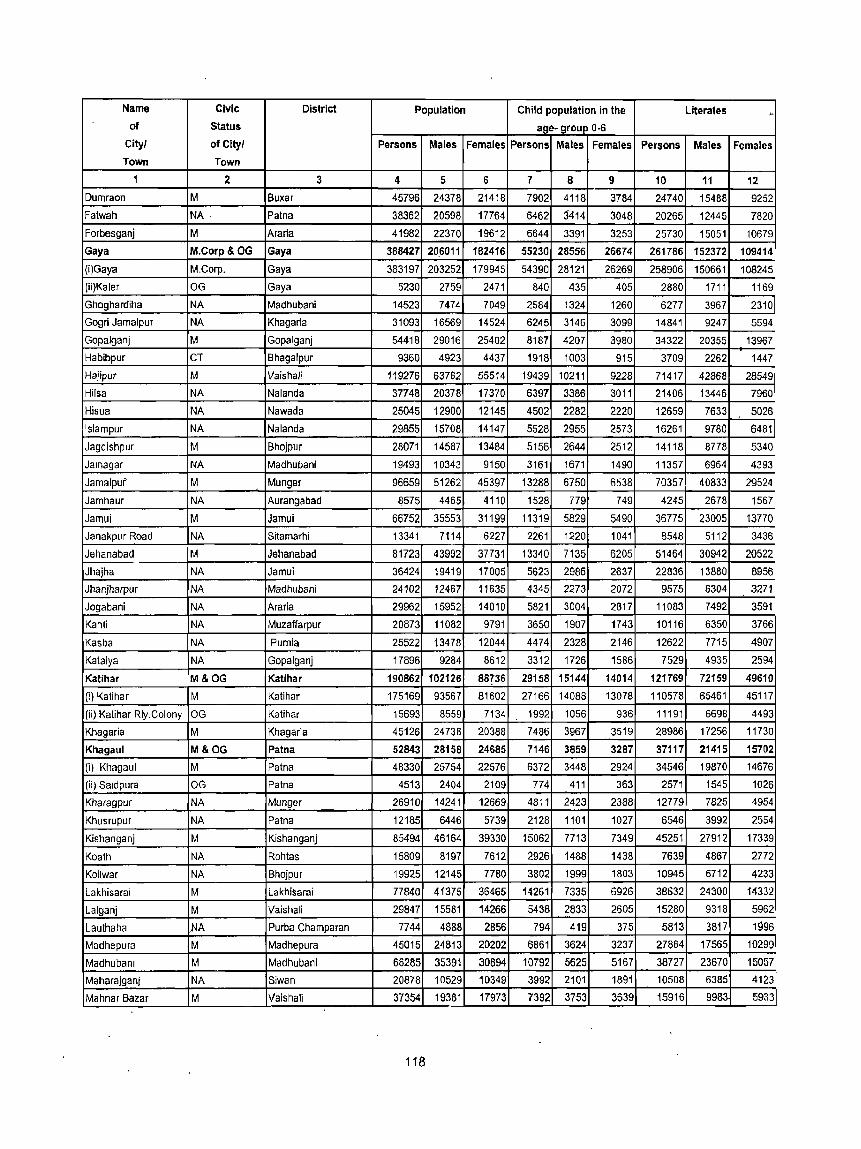
Name Civic District Population Child population in the Literates " of Status age- group 0-6
Cityl of Cityl Persons Males Females Persons Males Females Persons Males Females Town Town
1 2 3 4 5 6 7 8 9 10 11 12 Dumraon M Buxar 45796 24378 21418 7902 4118 3784 24740 15488 9252 Falwah NA· Palna 38362 20598 17764 6462 3414 3048 20265 12445 7820 Forbesganj M Aralia 41982 22370 19612 6644 3391 3253 25730 15051 10679 Gaya M.Corp&OG Gaya 388427 206011 182416 55230 28556 26674 261786 152372 109414
{i)Gaya M.Corp. Gaya 383197 203252 179945 54390 28121 26269 258906 150661 108245
(ii)Kaler OG Gaya 5230 2759 2471 840 435 405 2880 1711 1169 Ghoghardiha NA Madhubani 14523 7474 7049 2584 1324 1260 6277 3967 2310 Gogri Jamalpur NA Khagaria 31093 16569 14524 6245 3146 3099 14841 9247 5594
Gopalganj M Gopalganj 54418 29016 25402 8187 4207 3980 34322 20355 13967 Habibpur CT Bhagalpur 9360 4923 4437 1918 1003 915 3709 2262 1447 Hajipur M Vaishali 119276 63762 55514 19439 10211 9228 71417 42868 28549 Hilsa NA Nalanda 37748 20378 17370 6397 3386 3011 21406 13446 7960 Hisua NA Nawada 25045 12900 12145 4502 2282 2220 12659 7633 5026 Islampur NA Nalanda 29855 15708 14147 5528 2955 2573 16261 9780 6481
Jagdishpur M Bhojpur 28071 14587 13484 5156 2644 2512 14118 8778 5340
Jalnagar NA Madhubani 19493 10343 9150 3161 1671 1490 11357 6964 4393
JamalpuF M Munger 96659 51262 45397 13288 6750 6538 70357 40833 29524
Jamhaur NA Aurangabad 8575 4465 4110 1528 779 749 4245 2678 1567
Jamui M Jamui 66752 35553 31199 11319 5829 5490 36775 23005 13770
Janakpuf Road NA Sitamarhi 13341 7114 6227 2261 1220 1041 8548 5112 3436
Jehanabad M Jehanabad 81723 43992 37731 13340 7135 6205 51464 30942 20522
Jhajha NA Jamui 36424 19419 17005 5623 2986 2637 22836 13880 8956 Jhanjharpur NA Madhubanl 24102 12467 11635 4345 2273 2072 9575 6304 3271
Jogabani NA Araria 29962 15952 14010 5821 3004 2817 11083 7492 3591
Kanti NA Muzaffa rpu r 20873 11082 9791 3650 1907 1743 10116 6350 3766
Kasba NA Purnia 25522 13478 12044 4474 2328 2146 12622 7715 4907
Kataiya NA Gopalganj 17896 9284 8612 3312 1726 1586 7529 4935 2594
Katihar M&OG Katihar 190862 102126 8S!36 29158 15144 14014 121769 72159 49610
(1) Kalihar M Katihar 175169 93567 81602 27166 14088 13078 110578 65461 45117
(ii) Katihar Rly.Colony OG Kalihar 15693 8559 7134 1992 1056 936 11191 6698 4493
Khagaria M Khagaria 45126 24738 20388 7486 3967 3519 28986 17256 11730
Khagaul M&OG Patna 52843 28158 24685 7146 3859 3287 37117 21415 15702
(i) Khagaul M Patna 48330 25754 22576 6372 3448 2924 34546 19870 14676
(ii) Saldpura OG Palna 4513 2404 2109 774 411 363 2571 1545 1026
Kharagpur NA Munger 26910 14241 12669 4811 2423 2388 12779 7825 4954
Khusrupur NA Patna 12185 6446 5739 2128 1101 1027 6546 3992 2554
Kishanganj M Kishanganj 85494 46164 39330 15062 7713 7349 45251 27912 17339
Koath NA Rohtas 15809 8197 7612 2926 1488 1438 7639 4867 2772
Koilwar NA Bhojpur 19925 12145 7780 3802 1999 1803 10945 6712 4233
Lakhisarai M Lakhisarai 77840 41375 36465 14261 7335 6926 38632 24300 14332
Lal9anj M Vaishali 29847 15581 14266 5438 2833 2605 15280 9318 5962
Laulhaha .NA Purba Champaran 7744 4888 2856 794 419 375 5813 3817 1996
Madhepura M Madhepura 45015 24813 20202 6861 3624 3237 27864 17565 10299
Madhubanl M Madhubani 68285 35391 30894 10792 5625 5167 38727 23670 15057
Maharajganj NA Siwan 20878 10529 10349 3992 2101 1891 10508 6385 4123
Mahnar Bazar M Vaishali 37354 19381 17973 7392 3753 3639 15916 9983 59:13
118
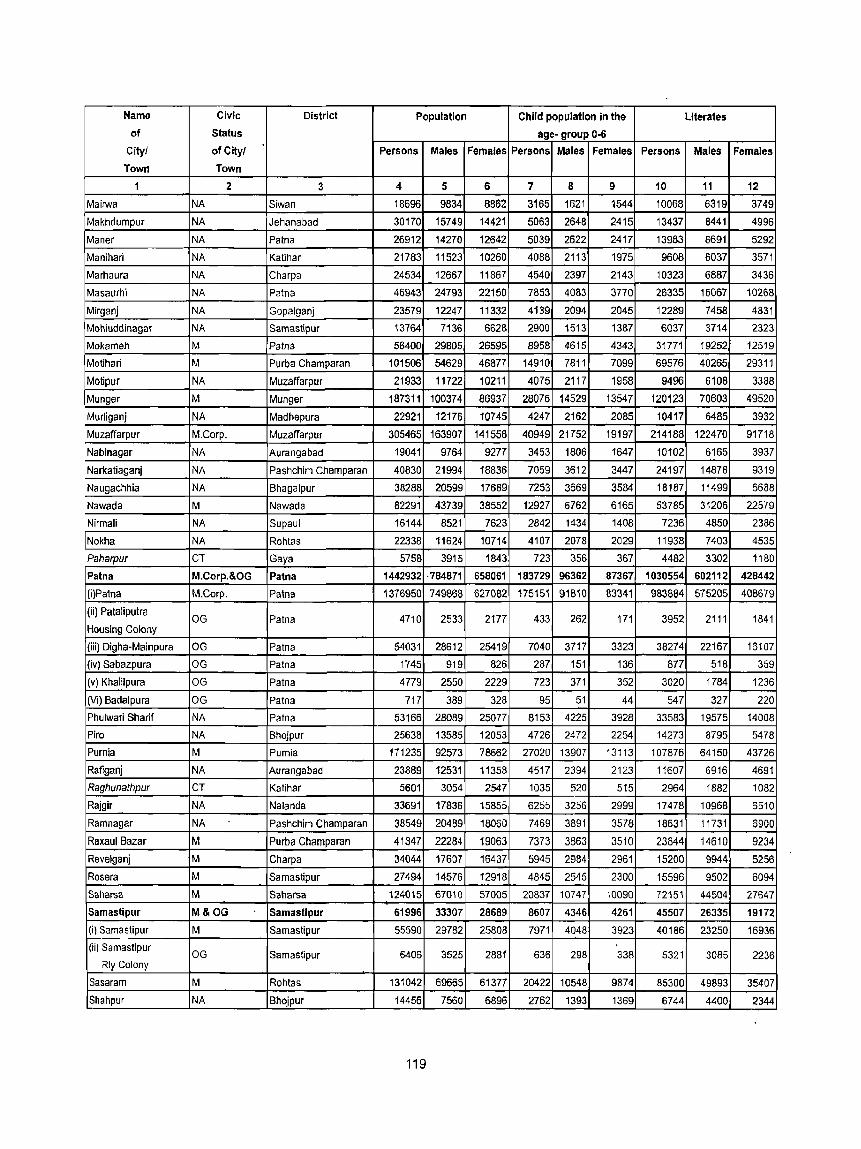
Name Civic District Population Child population in the Literates of Status age- group 0-6
Cityl of Cityl Persons Males Females Persons Males Females Persons Males Females Town Town
1 2 3 4 5 6 7 8 9 10 11 12
Mairwa NA Siwan 18696 9834 8862 3165 1621 1544 10068 6319 3749
Makhdumpur NA Jehanabad 30170 15749 14421 5063 2648 2415 13437 8441 4996
Maner NA Patna 26912 14270 12642 5039 2622 2417 13983 8691 5292
Manihari NA Katihar 21783 11523 10260 4088 2113 1975 9608 6037 3571
Marhaura NA Charpa 24534 12667 11867 4540 2397 2143 10323 6887 3436
Masaurhi NA Patna 46943 24793 22150 7853 4083 3770 26335 16067 10268
Mirganj NA Gopalganj 23579 12247 11332 4139 2094 2045 12289 7458 4831
Mohiuddinagar NA Samastipur 13764 7136 6628 2900 1513 1387 6037 3714 2323
Mokameh M Patna 56400 29805 26595 8958 4615 4343 31771 19252 12519
Motihari M Purba Champaran 101506 54629 46877 14910 7811 7099 69576 40265 29311
Motipur NA Muzaffarpur 21933 11722 10211 4075 2117 1958 9496 6108 3388
Munger M Munger 187311 100374 86937 28076 14529 13547 120123 70603 49520
Murliganj NA Madhepura 22921 12176 10745 4247 2162 2085 10417 6485 3932
Muzaffarpur M.Corp. Muzaffarpur 305465 163907 141558 40949 21752 19197 214188 122470 91718
Nabinagar NA Aurangabad 19041 9764 9277 3453 1806 1647 10102 6165 3937
Narkatiaganj NA Pashchim Champaran 40830 21994 18836 7059 3612 3447 24197 14878 9319
Naugachhia NA Bhagalpur 38288 20599 17689 7253 3669 3584 18187 11499 6688
Nawada M Nawada 82291 43739 38552 12927 6762 6165 53785 31206 22579
Nirmali NA Supaul 16144 8521 7623 2842 1434 1408 7236 4850 2386
Nokha NA Rohtas 22338 11624 10714 4107 2078 2029 11938 7403 4535
Paharpur Cl Gaya 5758 3915 1843 723 356 367 4482 3302 1180
Patna M.Corp.&OG Patna 1442932 ·784871 658061 183729 96362 87367 1030554 602112 428442
(i)Patna M.Corp. Patna 1376950 749868 627082 175151 91810 83341 983884 575205 408679
(iI) Pataliputra OG Palna 4710 2533 2177 433 262 171 3952 2111 1841
Housing Colony
(iii) Digha-Mainpura OG Palna 54031 28612 25419 7040 3717 3323 38274 22167 16107
(iv) Sabazpura OG Palna 1745 919 826 287 151 136 877 518 359
(v) Khalilpura OG PaIn a 4779 2550 2229 723 371 352 3020 1784 1236
(Vi) Badalpura OG Patna 717 389 328 95 51 44 547 327 220 Phulwari Sharif NA Palna 53166 28089 25077 8153 4225 3928 33583 19575 14008 Piro NA Bhojpur 25638 13585 12053 4726 2472 2254 14273 8795 5478 Purnia M Purnia 171235 92573 78662 27020 13907 13113 107876 64150 43726
Rafiganj NA Aurangabad 23889 12531 11358 4517 2394 2123 11607 6916 4691 Raghunathpur CT Katihar 5601 3054 2547 1035 520 515 2964 1882 1082 Rajgir NA Nalanda 33691 17836 15855 6255 3256 2999 17478 10968 6510 Ramnagar NA Pashchim Champaran 38549 20489 18060 7469 3891 3578 18631 11731 6900
Raxaul Bazar M Purba Champaran 41347 22284 19063 7373 3863 3510 23844 14610 9234 Revelganj M Charpa 34044 17607 16437 5945 2984 2961 15200 9944 5256 Rosera M Samastipur 27494 14576 12918 4845 2545 2300 15596 9502 6094 Saharsa M Saharsa 124015 67010 57005 20837 10747 10090 72151 44504 27647 Samastipur M&OG Samastipur 61996 33307 28689 8607 4346 4261 45507 26335 19172 (i) Samastipur M Samastipur 55590 29782 2580B 7971 4048 3923 40186 23250 16936 (ii) Samastipur
Rly Colony OG Samastipur 6406 3525 2881 636 298 338 5321 3085 2236
Sasaram M Rohtas 131042 69665 61377 20422 10548 9874 85300 49893 35407 Shahpur NA Bhojpur 14456 7560 6896 2762 1393 1369 6744 4400 2344
119

Name Civic District Population Child population in the Literates
of Status age- group 0-6 Cityl of Cityl , Persons Males Females Petsons Males Females Persons Males Females
Town Town
1 2 3 4 5 6 7 8 9 10 11 12 Sheikhpura M Sheikhpura 43042 22935 20107 7772 3954 3818 22092 13651 8441
Sheohar NA Sheohar 21327 11354 9973 4336 2255 2081 7464 4992 .2472
Sherghati NA Gaya 32358 17022 15336 6078 3193 2885 18068 10558 7510
Silao NA Nalanda 20177 10483 9694 3875 1982 1893 10416 6258 4158
Sitamarhi M& OG Sitamarhi 72730 38960 33770 11894 6316 5578 44503 26464 18039
(i)Sitamarhi M Silamarhi 56769 30483 26286 8930 4798 4132 36756 21655 15101
(ii)Rajopatti-Dumra-OG Silamarhi 15961 8477 7484 2964 1518 1446 7747 4809 2938
Talkhapur Dumra
Siwan M Siwan 108172 57223 50949 16353 8360 7993 67609 39497 28112
Sonepur NA Charpa 33389 17841 15548 5430 2812 2618 19940 12454 7486
Sugauli NA Purba Champaran 31362 16827 14535 6242 3244 2998 13228 8583 4645
Sullanganj NI>. Bhagalpur 41812 22512 19300 7311 3835 3476 21843 la454 8389
Supaul M Supaul 54020 28738 25282 9528 5035 4493 26379 16865 9514
Thakurganj NA • Kishangan) 15288 8075 7213 2573 1328 1245 8261 5063 3198
Tikari M Gaya ;7615 9192 8423 3015 1562 1453 11556 6763 4793
Warisaliganj NA Nawada 31330 16324 15006 5363 2758 2605 16528 10017 6511 -
120

Annexure- VIII
Appendix - 2 to Table - 6 List of towns of 1991 declassified in 2001 and towns of 1991 merged with other towns in 2001
Declassified Towns Merged towns Name of Civic District If constituent Popu- Name Civic Papu- Name afthe District
the town status of UA, name lation of the status lation city/town with
of the of the UA 1991 town of the 1991 which merged
town town (alongwith the
in 1991 in 1991 name of UA. if
constituent of UA)
1 2 3 4 5 6 7 8 9 10 Chhatapur NA Supaul 16746 Bhimnagar CT Supaul 5673 Bihariganj NA Madhepura 23452 Hasanpur NA Samaslipur 23941 Barauni CT Begusarai 60685 -Teghra CT Begusarai 32999 No such cas~ exists in the state of Bihar
Bariarpur CT Munger 10434 Gazipur CT Munger 6262 Janpur CT Patna 6603 Nasrlganj CT Rohtas 16647
Kaler CT* Gaya Gaya UA 2752
• Although declassified as Census Town but treated as OG of Gaya (M.Corp.) during 2001 Census.
121

Annexure -IX Table -7
Growth of urban population 1981-2001 Size· Number of UAslTown Population Percentage of population Percentage
Class of in each size· class decadal growth
UA/Cityl 1981 1991 2001 1981 1991 2001 1981 1991 2001 1981-1991 1991·2001
Town
1 2 3 4 5 6 7 8 9 10 11 12 All Classes 5 UAs and 7 UAs and 9 UA's and 5144945 6711785 8679200 100.00 100.00 100.00 25.09 32.76
107 Towns 122 Towns 111 Towns
Class I 2 UA's and 4 UA's and 7 UA's and 2506915 3050370 5147411 48.73 45.45 59.31 21.29 35.95
9 Towns 7 Towns 12 Towns
Class II 2 UA's and 3 UA's and 2 UA's and 776493 1432777 1185449 15.09 21.35 13.66 25.37 31.55
10 Towns 17 Towns 14 Towns
Class III 1 UA's and 57 Towns 65 Towns 1186908 1653710 2046113 23.07 24.64 23.57 30.73 29.68
40 Towns
Crass IV 39 Towns 35 Towns 17 Towns 601849 535145 280345 11.70 7.97 3.23 28.25 26.30
Class V 9 Towns 5 Towns 3 Towns 72780 34857 19882 1.41 0.52 0.23 34.83 34.30
Class VI - 1 Town - - 4926 - - 0.07 - - 15.83
Note:- The inter- censal growth rates of population have been worked out according to the size-class of the town in the 1981 Census in respect of the decade 1981-91 and in the 1991 Census in respect of the decade 1991-2001.
122
STATEMENTS


Annexure-X Statement·1
Rural-Urban distribution of population -India and States/Union Territories, 2001
Population Percent SI.No India/State/Union Territory* T/R/U Persons Males Females urban
population 1 2 3 4 5 6 7
INDIA T 1027015247 531277078 495738169 27.78 R 741660293 381141184 360519109 U 285354954 150135894 135219060
State/Union Territory*
1 Jammu & Kashmir T 10069917 5300574 4769343 24.88 R 7564608 3925846 3638762 U 2505309 1374728 1130581
2 Himachal Pradesh T 6077248 3085256 2991992 9.79 R 5482367 2754251 2728116 U 594881 331005 263876
3 Punjab T 24289296 12963362 11325934 33.95 R 16043730 8500647 7543083 U 8245566 4462715 3782851
4 Chandigarh* T 900914 508224 392690 89.78 R 92118 56837 35281 U 808796 451387 357409
. 5 Uttaranchal T 8479562 4316401 4163161 25.59
R 6309317 3143380 3165937 U 2170245 1173021 997224
6 Haryana T 21082989 11327658 9755331 29.00 R 14968850 8017622 6951228 U 6114139 3310036 2804103
7 Delhi* T 1.3782976 7570890 6212086 93.01 R 963215 533219 429996 U 12819761 7037671 5782090
8 Rajasthan T 56473122 29381657 27091465 23.38 R 43267678 22394479 20873199 U 13205444 6987178 6218266
9 Uttar Pradesh T 166052859 87466301 78586558 20.78 R 131540230 69096765 62443465 U 34512629 18369536 16143093
125

Population Percent SI.No India/State/Union Territory* T/R/U Persons Males Females urban
population 1 2 3 4 5 6 7
10 Bihar T 82878796 43153964 39724832 10.47 R 74199596 3851'0686 35688910 U 8679200 4643278 4035922
11 Sikkim T 540493 288217 252276 11.10 R 480488 255386 225102 U 60005 32831 27174
12 Arunachal Pradesh T 1091117 573951 517166 20.41 R 868429 453560 414869 U 222688 120391 102297
13 Nagaland T 1988636 1041686 946950 17.74 R 1635815 846651 789164 U 352821 195035 157786
. 14 Manipur T 2388634 1207338 1181296 23.88
R 1818224 923428 894796 U 570410 283910 286500
15 Mizoram T 891058 459783 431275 49.50 R 450018 233718 216300 U 441040 226065 214975
16 Tripura T 3191168 1636138 1555030 17.02 R 2648074 1359288 1288786 U 543094 276850 266244
17 Meghalaya T 2306069 1167840 1138229 19.63 R 1853457 939803 913654 U 452612 228037 224575
18 Assam T 26638407 13787799 12850608 12.72 R 23248994 11983157 11265837 U 3389413 1804642 1584771
I
19 West Bengal T 80221171 41487694 38733477 28.03 R 57734690 29606028 28128662 U 22486481 11881666 10604815
20 Jharkhand T 26909428 13861277 13048151 22.25 R 20922731 10660430 10262301 U 5986697 3200847 2785850
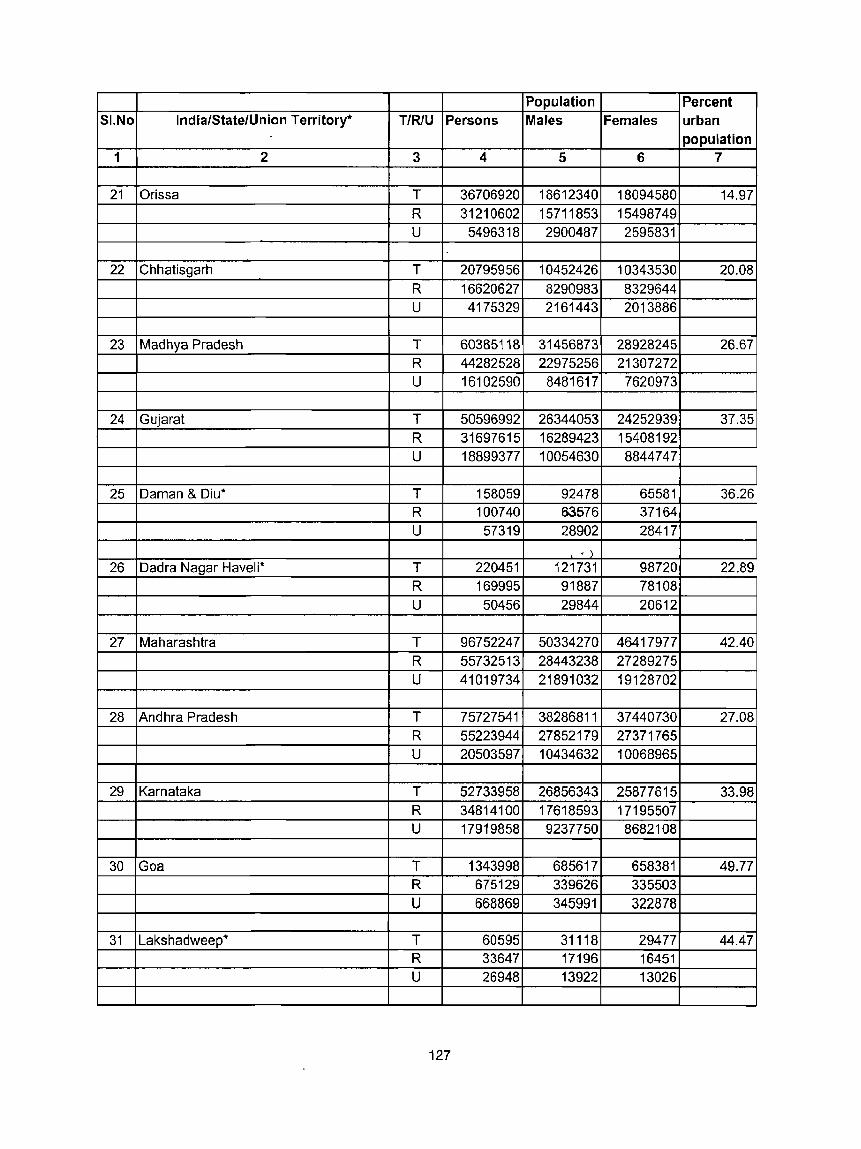
Population Percent SI.No India/State/Union Territory· T/RIU Persons Males Females urban
population 1 2 3 4 5 6 7
21 Orissa T 36706920 18612340 18094580 14.97 R 31210602 15711853 15498749 U 5496318 2900487 2595831
22 Chhatisgarh T 20795956 10452426 10343530 20.08 R 16620627 8290983 8329644 U 4175329 2161443 2013886
23 Madhya Pradesh T 60385118 31456873 28928245 26.67 R 44282528 22975256 21307272 U 16102590 8481617 7620973
24 Gujarat T 50596992 26344053 24252939 37.35 R 31697615 16289423 15408192 U 18899377 10054630 8844747
25 Daman & Diu* T 158059 92478 65581 36.26 R 100740 63576 37164 U 57319 28902 28417
, )
26 Dadra Nagar Haveli' T 220451 121731 98720 22.89 R 169995 91887 78108 U 50456 29844 20612
27 Maharashtra T 96752247 50334270 46417977 42.40 R 55732513 28443238 27289275 U 41019734 21891032 19128702
28 Andhra Pradesh T 75727541 38286811 37440730 27.08 R 55223944 27852179 27371765 U 20503597 10434632 10068965
29 Karnataka T 52733958 26856343 25877615 33.98 R 34814100 17618593 17195507 U 17919858 9237750 8682108
30 Goa T 1343998 685617 658381 49.77 R 675129 339626 335503 U 668869 345991 322878
31 Lakshadweep" T 60595 31118 29477 44.47 R 33647 17196 16451 U 26948 13922 13026
127
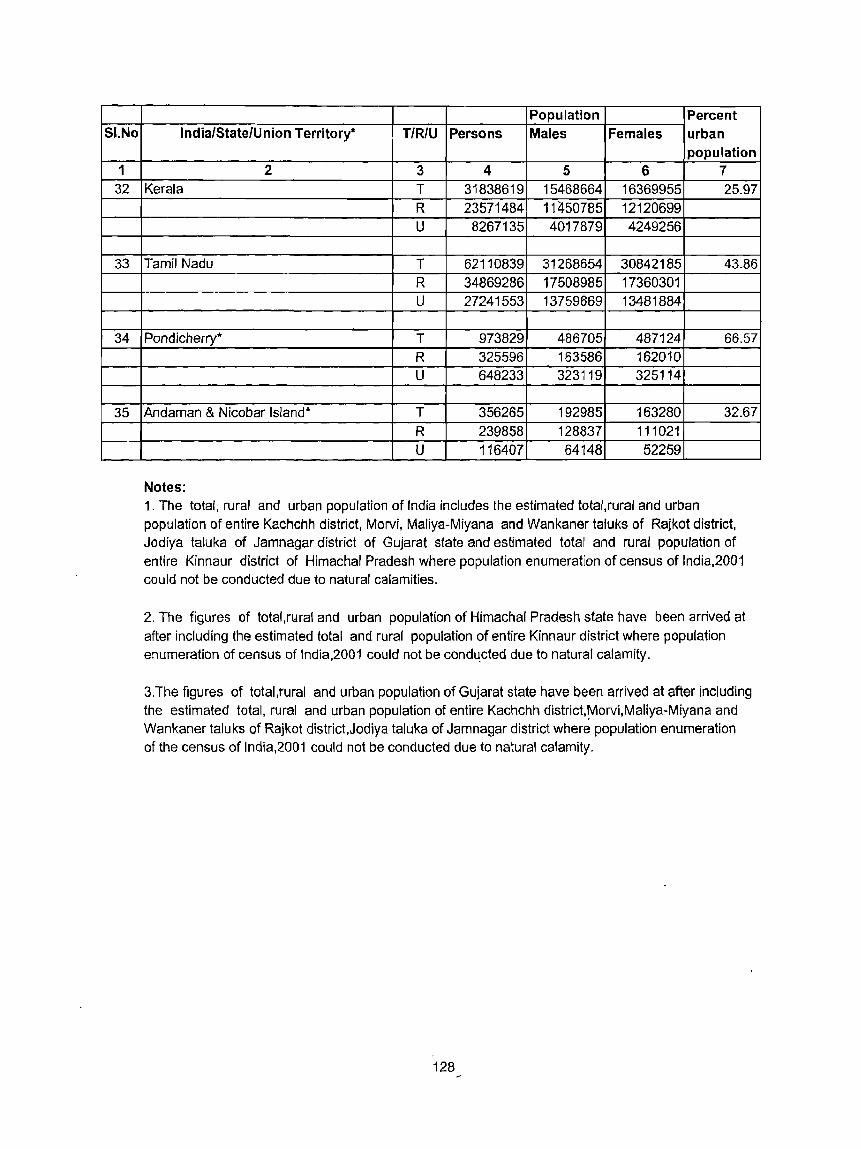
SI.No
1 32
33
34
35
Population Percent India/State/Union Territory* T/R/U Persons Males Females urban
population 2 3 4 5 6 7
Kerala T 31838619 15468664 16369955 25.97
R 23571484 11LJ.50785 12120699 U 8267135 4017879 4249256
Tamil Nadu T 62110839 31268654 30842185 43.86 R 34869286 17508985 17360301 U 27241553 13759669 13481884
Pondicherry* T 973829 486705 487124 66.57
R 325596 163586 162010
U 648233 323119 325114
Andaman & Nicobar Island* T 356265 192985 163280 32.67
R 239858 128837 111021
U 116407 64148 52259
Notes: 1. The total, rural and urban population of India includes the estimated total,rural and urban population of entire Kachchh district, Morvi, Maliya-Miyana and Wankaner taluks of Rajkot district, Jodiya taluka of Jamnagar district of Gujarat state and estimated total and rural population of entire Kinnaur district of Himachal Pradesh where population enumeration of census of India,2001 could not be conducted due to natural calamities.
2. The figures of total,rwral and urban population of Himachal Pradesh state have been arrived at after including the estimated total and rural population of entire Kinnaur district where population enumeration of census of India,2001 could not be condu.cted due to natural calamity.
3.The figures of total ,rural and urban population of Gujarat state have been arrived at after including the estimated total, rural and urban population of entire Kachchh district,~orvi,Maliya-Miyana and Wankaner taluks of Rajkot district,Jodiya taluka of Jamnagar district where population enumeration of the census of India,2001 could not be conducted due to natural calamity.
128
Annexure - XI Statement - 2
Number of statutory and census towns, 1991 and 2001
Statel 1991 2001 District Statutory Census Totar Statutory Census Total
towns towns towns towns BIHAR 127 11 138 125 5 130
Pashchim Champaran 5 - 5 5 - 5 Purba Champaran 6 - 6 7 - 7
Sheohar 1 - 1 1 - 1
Sitamarhi 5 - 5 5 - 5 Madhubani 4 - 4 4 - 4
Supaul 4 1 5 3 - 3 Araria 3 - 3 3 - 3 KisYlanganj 3 - 3 3 - 3 Purnia 3 - 3 3 - 3
Katihar 2 - 2 2 1 3 Madhepura 3 - 3 2 - 2 Saharsa 1 - 1 1 - . 1
Darbhanga 1 - 1 1 - 1 . Muzaffarpur 3 - 3 3 - 3
GopaJganj 4 - 4 4 - 4 Siwan 3 - 3 3 - 3
Saran 5 - 5 5 - 5
Vaishali 3 - 3 3 - 3
Samastipur 5 - 5 4 - 4
Begusarai 1 3 4 1 1 2 Khagaria 2 - 2 2 - 2 Bhagalpur 4 1 5 4 1 5 Banka 2 - 2 2 - 2 Munger 3 3 6 3 1 4
Lakhisarai 2 - 2 2 - 2 Sheikhpura 2 - 2 2 - 2
Nalanda 5 - 5 5 - 5
Patna 12 1 13 12 - 12
Bhojpur 6 - 6 6 - 6
Buxar 2 - 2 2 - 2 Kaimur 1 - 1 1 - 1
Rohtas 5 1 6 5 - 5
Jehanabad 2 - 2 2 - 2
Aurangabad 5 - 5 5 - 5
Gaya 4 1 5 4 1 5
Nawada 3 - 3 3 - 3
Jamui 2 - .2 2 - 2
129

Annexure - XII Statement - 3
Ranking of districts by percentage of urban population, 1991 and 2001
Rank in 2001 District Percent urban population Rank in 1991 2001 1991
1 2 3 4 5 1 Patna 41.80 38.05 1 2 Munger 27.88 30.01 2 3 Bhagalpur 18.59 17.98 3 4 SFleikhpura 15.48 15.37 4 5 Nalanda 14.92 14.84 5
6 Lakhisarai 14.68 13.20 8 7 Bhojpur 13.98 13.14 9 8 Gaya 13.71 13.36 7
9 Rohtas 13.34 13.93 6 10 Pashchim Champaran 10.17 10.09 11
11 Kishanganj 9.97 10.09 10 12 Muzaffarpur 9.30 9.31 14
13 Bw(ar 9.18 8.35 18 14 Saran 9.17 9.11 15
15 Katihar 9.13 9.40 13
16 Purnia 8.74 8.42 17
17 Aurangabad 8.42 7.67 19
18 Saharsa 8.23 708 21
19 Darbhanga: 8.12 8.70 16
20 Nawada 7.66 6.95 22
21 Jehanabad 7.40 6.34 27
22 Jamui 7.38 7.09 20
23 Vaishali 6.88 6.68 24
24 Purba Champaran 6.39" 5.70 30
25 Araria 6.24 6.35 26
26 Gopalganj 6.07 5.68 31
27 Khagaria 5.97 5.96 28
28 Sitamarhi 5.74 5.94 29
29 Siwan 5.45 5.32 32
30 Supaul 5.04 6.82 23
31 Begusarai 4.58 9.79 12
32 Madhepura 4.46 6.52 25
33 Sheohar 4.15 3.68 34
34 Samastipur 3.62 4.9& 33
35 Banka 3.50 3.45 36
36 Madhubani 3.48 3.63 35
37 Kaimur 3.23 2.75 37
130

Annexure-XIII
Statement - 4
Trends in Urbanization, 1991-2001
Census Total Total Total urban Percent Decennial Annual Year number population population urban Growth exponential
of UAsl population growth rate TGs'l Absolute Percent (urban) Towns
1 2 3 4 5 6 7 8
1901 44 21243632 979010 4.61 - - -
1911 43 21567159 919059 4.26 (-) 59951 (-) 6.12 -0.63
1921 46 21358905 921915 4.32 2856 (+) 0.31 0.03
1931 48 23438371 '1099896 4.69 177981 (+) 19.31 1.77
1941 58 26302771 1392850 5.30 292954 (+) 26.63 2.36
1951 73 29085017 1865911 6.42 473061 (+) 33.96 2.92
1961 6 TGs 34840968 2580578 7.41 714667 (+) 38.30 3.24 88
1971 7 UAs 42126236 3356334 7.97 775756 (+) 30.06 2.63 106
1981 5 UAs 52302665 5144945 9.84 1788611 (+) 53.29 4.27 129
1991 7 UAs 64530554 6711785 10.40 1566840 (+) 30.45 2.66 138
2001 9 UAs 82878796 8679200 10.47 1967415 (+) 29.31 2.57 130
131


MAPS


o 00 00
o to 00
o 'V 00
T"" ,LL 0 0 0
W~ ~C;; a:~
a:::I:Z ......... 0 ....... 3:-::tO~ _a:..J m(!J=> ..Jo.
<cO co. <t ..J' 0« Wa: o=> a:
I II s
..J
a
, /
o <0 C\.J
tt I::J d
/
o U")
J: I-
~ a:: <!' ...J
C§
~ w
~ C\.J
c w U. > o 0 W III <!' <C oc:( oil I-' ~ Z 0 W .;. (.) M
~I
:::c
g .;. (')
M M cO ... w ~ II: W
~ w !ii: ~ 0 0 0 (')
I II •• I I II • • I
I II
0 0 cD N
~ ..J w III
</)0 w.;-a: Iii :; o oJ 520
0 co co
c t-co
o CD CXl
c; "" N
1E .!l' >. 8 .. '6 ,!iii.
"0 C e '" :;; > ~ ©

o CO CO
o ...... CO
o CO CO
o LO CO
o '<;j" CO
,..... ,LL 0 0 0
W~ -~~ a: .... -
a:J:Z ~I-O ~3:-:I: oti _a:..J mC!J::)
..Jo.. <to CD.. <t _I' oct wa: c::)
a::
s
..J
o d
\Jr J.
135
J.
o LD OJ
IJ
::I: t-~ 0 a: 0 ....I <I: C <I: 0 W C W LL. > o 0 W al CJ <J: !C( a;:$
~ T"""
Z 0 w «i o M
a: W c.
M M cO N W (!) <J: a: w ~ w !;i I-' (J)
0 0 0 0 «i d M <')
0 T""" 0
d cD M N
-I I I • • I
I II .• • I I I I : :
s: 0
0 ....J
0 cD
W al
N otl
0 0 0
N N N - N
0 D
o to
(/)0 WV IX
Iii :!: 9 ;0:0
o C\J
o - v
0 CO CO
o
""" co
o <.0 co

a: « :I: -m
u. o w ~~ CC O
o ::J:N ..... ,!. 3:~ O~ CC z eJ O ....J -<c!ci: C...J <c:::) 00.. Wo Co.. W z eJ<c ~m Za:: W:::) o a:: W a..
w <' z oct J: C)
UJ
" i! z w o 0: W Il.
W
1f5~ a: -(.)Z W' C
:r.
eli 3:
0 0 oro 0 ...J .ow .0 w C')~ N III
c: ,w ~ ;:: 0
Ci~ 5 0 co ... 0 0 (\I", (\I (\I
I~QD
I II • • I
I II • • I
I II o co
enO w"'" a: tu :;:
9 520
~
o N
0
00 00
o
" 00
o CO 00
o Ii) 00
:r:: 0
~ z w w a:
" ... 0 I-
'" < w 0
~ 00
~ .s '0
~ '" OJ ~
:; iii' !5 '" '" t5 'S !5 'OJ .!!l E ~ .. ,$
:€ it c. '" :II!
45 .s "0 a;-~ a; '" 8-'" "g
!

------------------------------------~--------------------~o----------------------~o~--------------------'0 ~ (0 ~ ~ ~
a:: c:( J: -m
C'J N :E
LL o w !:(,... a: O
o ::I:N I-,!. :S: .O) 00) 0:"1"""" (!)z _.Q ct~ c_. ct::) hlc.. C~ UJz (!)c:c ~m Za: UJ::J o a: UJ Q.
/
i
- ...1
s a
I:J
V D tv 3 iii
c::( r~J ./ .
,- -
d \1 J.
137
w U>
~~ u.I a:: -(!) (..) z
W · Z c
~ « &~
::I: w (.) i3 W IQ
'If <!' <C
;:: o!I Z .,.... W 0 C) ~ a: W
..,. w ~ I c..
(..) . ~
J. n
0 0 ~ ..,.
.,.... C! II) M
~ c~ ol!l uiw MS!
a: ,w ~
"""w C!!i co ... NUl
I . I . I
~ 0 0 cO
'" .,.... 0 0 N
D
Q ~ ..J w IQ
o!I
0 0 0 N
0
o <X)
(/)0 W«t a: Iii :: o -' i:o
o C\J
--
0 00 00
o "-00
x: u ~ z III III a: CJ u.. 0 ... '" ct W
0 -.:t 00
.g' =a.. o u
'" 'i5 ..5 '0 C '" E <=
~ ~
@
.,; 'i5 ..5 "0 E '" <::
'" ~ .. >-
'" c: ::J
en · ."
:S "0 co 0
u; '" -S lD "'-II>
:S § ;: "'-'" == _!l!
""0 ..5
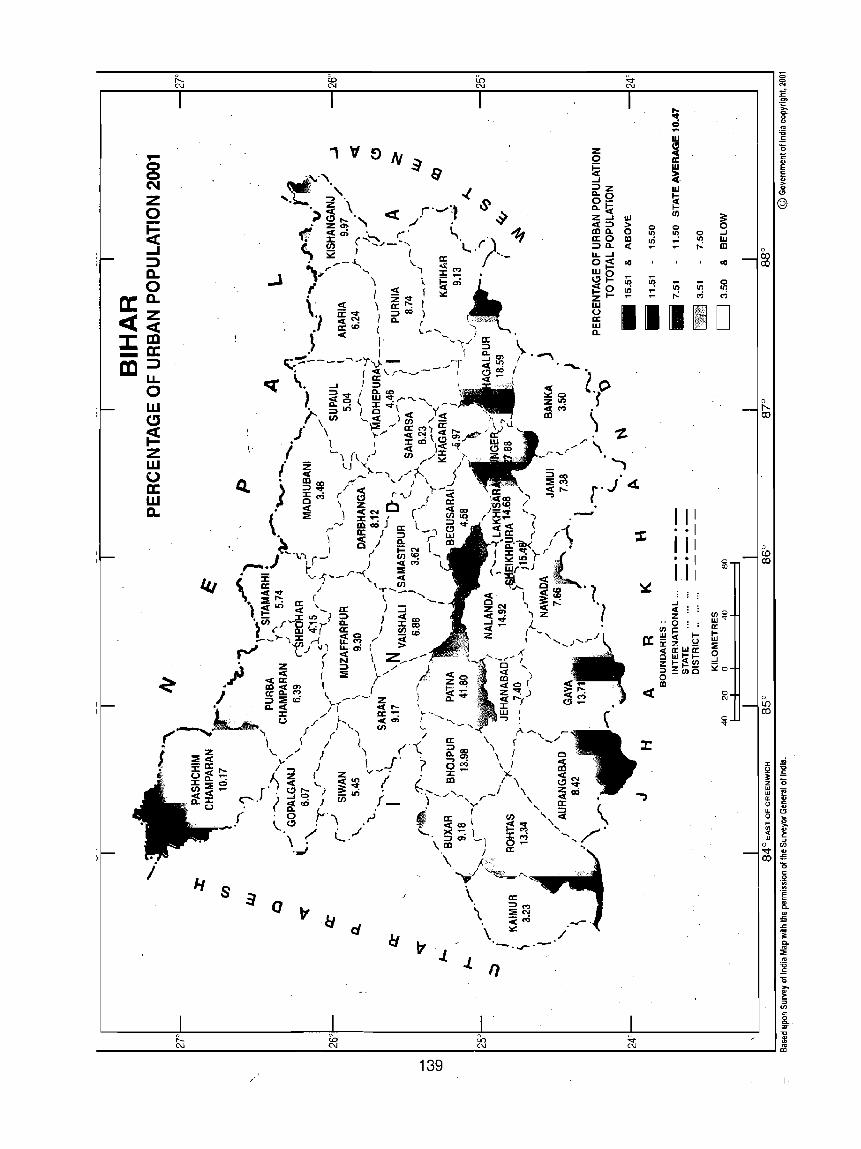
c:: <C ::I: -m
,.... o o C\I z a ~ ...I :::l a.. a a. z <C m a:: :::l LL o W (!J
~ z w (.) a:: w c.
/
La N
s /
a d
V / J. J.
..,
I)
I . I • I
o It) ,..:
~ ...J W m Gil
o 00
cnO W..,. II: I-w :;: o ...J 520
o (\J
o ..,.
o co co
o t-co
o r.o co
o L[) co
<:: Q
-~
"1" 8. '" :5 .<:
'i 0-.. :;: .. 'C ..5 Ci
f " en co o 0.., ::r
r- (0 zn ~ ~ ____________ N~ _____________________ N ______________________ N~ ____________________ ~N~ __________________ ~~
139

, OJ OJ
o CD CO
o l!) CO
o '¢ CO
a: <C ::I: -m
op-
o o N
Z o ~ ...J :l a... o a... z « m a:: :l u.. o w (!)
~ Z W o a:: w a...
..J
s 3 o V .1:1
o <0 N
d
V 1.
139
1.
o LO N
n
/
o L()
Il'i
s: o ...J UJ to ..., o L()
M
DO
I II. • • I I II • • I 111
o <Xl
(/)0 W .... a:: .... w :E o ..J
~O
o N
o CD CD
o <D CD

,... o o N
I ,... 0') 0') ,... CJ) w E
w[3 ~a: 0 CI (I)\z :5 8 0 0 Zw 0 0 g 0 520 0 0 0 0
S~~ \& ~ ~ § ~~ O::::l a.LI.
o
I II • • I .: "I • • I
I II

o (0
C'-l
Ii
141
W(/)
NW
_0: (/)1-ZZ OW _0 ~Z ....1< ::lID Q.O: O::l Q.u.
o
o 0 goo o ~ g g o 0 0 0 o ('\j 0 0
®
1 I I _. • I
I I I • • I I II
S: 0 ....I W ID
.a 0 U> ...; T'"
•
o co
(/)0 WV 0:
ti:i :s g S;::O
~ .. '
0
co co
o I'-co
o co co
o LO co
'" :5

DIAGRAMS


BIHAR DISTRIBUTION OF RURAL-URBAN POPULATION
1901-2001
URBAN
RURAL
1901 1911 1921 1931 1941 1951 1961 1971 1981 1991 2001
CENSUS YEAR
. 145
90
80
70
60
z 50 0 ::::;
....J
40
30
20
10
o
:E ~

. , BIHAR DISTRIBUTION O'F RURAL-URBAN POPULATION
1901-2001
URBAN
RURAL
1901 1911 1921 1931 1941 1951 1961 1971 1981 1991 2001
CENSUS YEAR
. 145
90
80
70
60
z 50 0
::i ...J
40
30
20
10
:!: z
I

f _
BI-HAR PERCENTAGE DECADAL GROWTH IN
-....
URBAN POPULATION' 1901-11 TO 1991-2001
55
50
45
40
35
~ - 30 .
~ z (+) "25 w o ffi 20 Q..
15
5
(-)5
,.... ....... N M
I . I ..... - ....... ....,. N Q) en ~ .....
.. -____
./
....... ,.... ....... - V U") CQ . • I ..... ....... ,....
M V U")
en en en ..... ..... .....
, ~I~r-u:,t <, ~ , ,..-----:!~." ". -
j - ~" ....... "'.". - . iff LIBRARY \. ",~" 30 107 J; . ... . ............ ~ .._._.....,_,
- ~EW OE\"~\"
~----------- ---146
..... ..... • ._ CQ en .....
....... co • ,.... ..... en .....
..... en • ....... co en .....
..... o o N . ,.... en en .....

- ~ _
BI-HAR DISTRIBUTION OF POPULATION OF UAs/CITIESrrOWNS
~N DIFFERENT SIZE CLASSES 1901·2001
CLASS
D CLASS
CLASS
. DCLASS
D CLASS
CLASS
1901 1911
II
III
IV
v
VI
1921 1931
--
1991 2001 1941 ' ' .. 1951 '. Cr
. _ .. , CENSUS-YEAR _- ;. _" . .:,: ~ " {" ~~t~;~- __ ~ ._: .. _ ' ... ~ .. ,
147
90
85
80
75
70
65
60
55
50
45 0 Q Q 0
40 0
z
35
30
25
20
15
10
5
0
/" ---

~,
BI.HAR ~.
DISTRIBUTION OF-RURAL - URBAN POPULATION 2001 (DISTRICTS)
-.. RURAL
URBAN
' .
. ,. ---- - _- - --. - ----. - .
- ... --- - ---~ ::.. -- - - ;: - -_ T • __ - - . ~ J~ __ " J
- -.- - --
'c
~~~~ --.--,. - -- - - - - -..-- -= - -~~ ...... - -- ~- ~ _ . .... - _. " -_ - ._.. --- -_ . - - ---,-:- -- - _- -- - - - - --- - -.,,-
. ----.. - -.. - ~- ....... -
~ . - .
48 44 40 36 32 28 24 20 16 12 8 4 0 ;'
IN'OOOOO ~~
~ .----- 148
SHEOHAR
SHEIKHPURA
LAKHISARAI
MUNGER
KHAGARIA
KAIMUR
KISHANGANJ
JAMUl
BUXAR
SAHARSA
JEHANABAD
MADHEPURA
BANKA
SUPAUL
NAWADA
AURANGABAD
ARARIA
GOPALGANJ
BHOJPUR
BEGUSARAI
NALANDA
KATIHAR
BHAGALPUR
ROHTAS
PURNIA
SITAMARHI
SIWAN
VAISHALI
..
PASHCHIM CHAMPARAN
SARAN
DARBHANGA
SAMASTIPUR
GAYA
MADHUBANI
MUZAFFARPUR
PURBA CHAMPARAN
PATNA
(J) Io a::: I(J)
5


![CENSUS OF INDIA - Linguistic Survey of Indialsi.gov.in:8081/jspui/bitstream/123456789/382/1/24475_1971_FP.pdfERRATA Paper] of 1972 - Final Population Table Page Col. No. No. Particulars](https://static.documents.pub/doc/80x56/6059609b0c7877142473e6f2/census-of-india-linguistic-survey-of-errata-paper-of-1972-final-population.jpg)
