65
Census of India 2011 PCA Maharashtra 2011 (Release of data) 23 rd , May, 2013 Director of Census Operations, Maharashtra 1

Census of India 2011
PCA Maharashtra 2011(Release of data)
23rd, May, 2013
Director of Census Operations, Maharashtra
1

• Census in India is carried under Census Act 1948
• The Census of India 2011 is the 15th Census and the 7th after Independence.
• Census 2011 is a milestone as the National Population Register (NPR) will also be prepared
• 1st Phase: Houselisting & Housing census and collection of data on National Population Register (1st May to 15th June 2010)
• 2nd Phase: Population Enumeration (9th to 28th
February 2011)
Census of India 2011
2

3
• This is the first set of final data from the Population
Enumeration exercise held in February 2011
• So far the data released from Census 2011 pertained to
Houselisting and Housing Census covering
• All Households
• SC & ST Households
• Female Headed Households
• Slum Households
Background
4
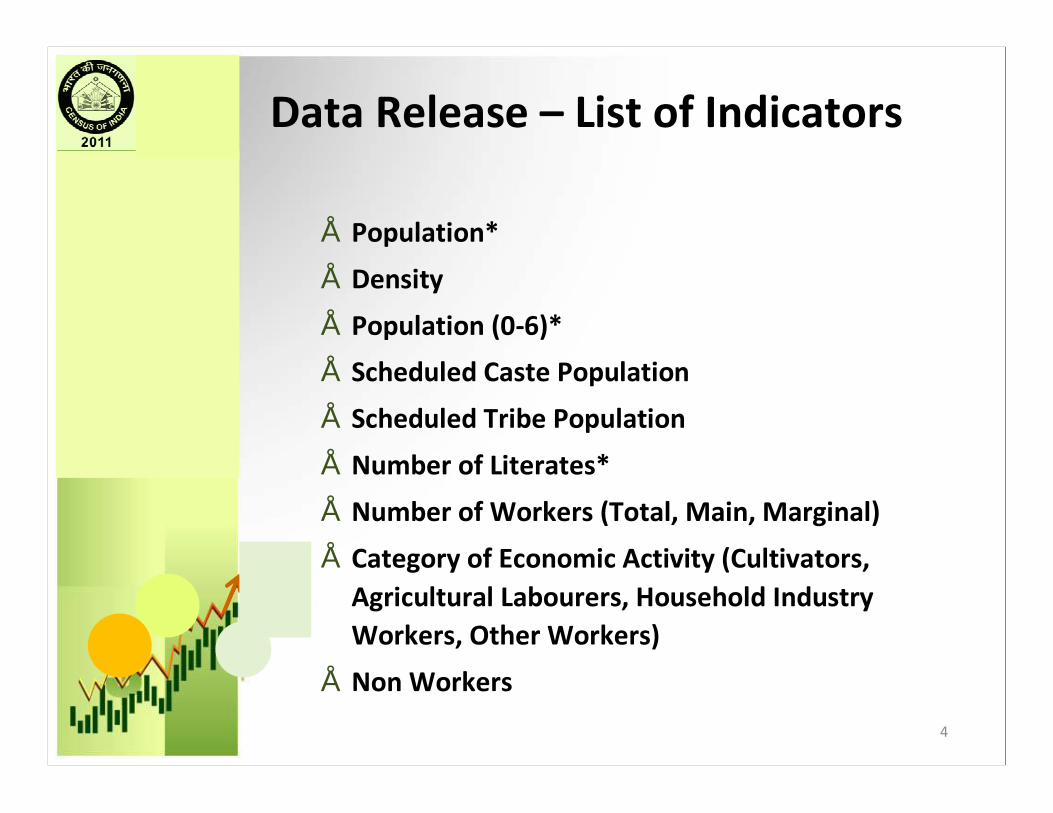
• Population*
• Density
• Population (0-6)*
• Scheduled Caste Population
• Scheduled Tribe Population
• Number of Literates*
• Number of Workers (Total, Main, Marginal)
• Category of Economic Activity (Cultivators, Agricultural Labourers, Household Industry Workers, Other Workers)
• Non Workers
Data Release – List of Indicators

5
Administrative set up of State according to Census-2011
v There are 43,665 total villages in Maharashtra
out of which 40,960 villages are in-habited.
v There are 355 Tehsil in Maharashtra.
v There are 534 Towns (including 278 census
towns) in Maharashtra.
v There are 35 Districts in Maharashtra.

6
Decadal change in population

7
• Final Total Population of the State is
11,23,74,333
• Provisional Population Total was
11,23,72,972
• Difference: + 1361 persons (0.001211 %)
CENSUS 2011Maharashtra

Maharashtra at a glance
• The State has recorded 11,23,74,333 population against 9,68,78,627 in 2001, i.e., an addition of 1,54,95,706 during the decade 2001-11.
• This makes 15.99 percent growth rate during 2001-11. The same was 22.73 during 1991-01.
• This shows a reduction in growth rate by 6.74 percentage points.
• The total density is 365 persons per sq. Km in Maharashtra as against 315 in 2001.
8
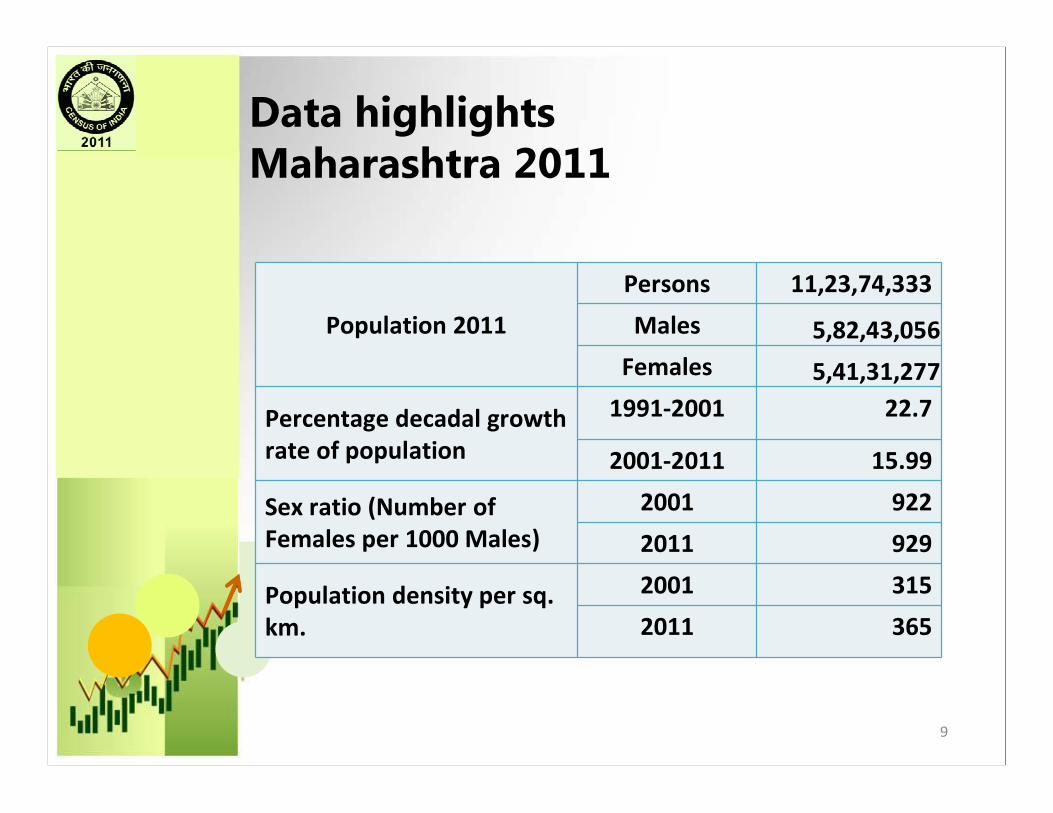
Data highlightsMaharashtra 2011
Population 2011
Persons 11,23,74,333
Males 5,82,43,056 Females 5,41,31,277
Percentage decadal growth rate of population
1991-2001 22.7
2001-2011 15.99
Sex ratio (Number of Females per 1000 Males)
2001 922
2011 929
Population density per sq. km.
2001 315
2011 365
9

Position of the State in India
10

Growth rate of population
11

Population of Maharashtra - 2011
11, 23, 33374,
12

13
Districts with percentage share of population Maharashtra 2011

14
Decadal growth rate in districtsMaharashtra : 2001-2011
• In 14 districts the growth rate is above the average
growth rate at State level.
• The highest decadal growth in population has been
recorded in Thane (36.01%), followed by Pune (30.4%)
and Aurangabad (27.8%).
• Nandurbar ,Nashik ,Jalna, Parbhani and Dhule districts
also have recorded a growth rate of above 20 percent.

Population density in districts
§ Mumbai (sub-urban) and Mumbai districts tops in density of population with about 20,980 and 19,652 population per sq. Km. respectively.
§ In Thane the density is 1,157 whereas Pune (603) and Kolhapur (504) are the other districts with a density more than 500.
§ Gadchiroli stands with the lowest density at 74 followed by Sindhudurg (163), Chandrapur (193) and Ratnagiri (197).
15

16
UrbanisationMaharashtra : 2001-2011
• The share of urban population which was 42.4 percent in 2001 has increased to 45.2 percent during 2011.
• This makes an addition of 57,78,427 in rural and 97,17,279 in urban during 2001-11.
• Though the growth rate of urban population is more than the rural growth rate but the rural-urban difference is shrinking slowly.
• The rate of growth in rural, which was 15.25 percent in 1991-01 became 10.36 percent in 2001-11 whereas the same in urban decreased from 34.57 to 23.64 percent.

17

18
Sex compositionMaharashtra : 2011
• There has been an increase of 15.50 million persons
in absolute number of population in Maharashtra during 2001-11
• Increase among males: 7.84 million
• Increase among females: 7.65 million
• Growth Rate of females (16.47%) is higher than males (15.56%)

19
Residence 2001 2011 Change
Total 922 929 +7
Rural 960 952 -8
Urban 873 903 +30
Sex Ratio of PopulationMaharashtra : 2001, 2011
• However, the same for rural-urban comparison reveals that there is a decline in sex ratio in rural from 960 to 952 (by 8 points)
• whereas in urban, Sex ratio has increased from 873 to 903 (by 30 points)
20
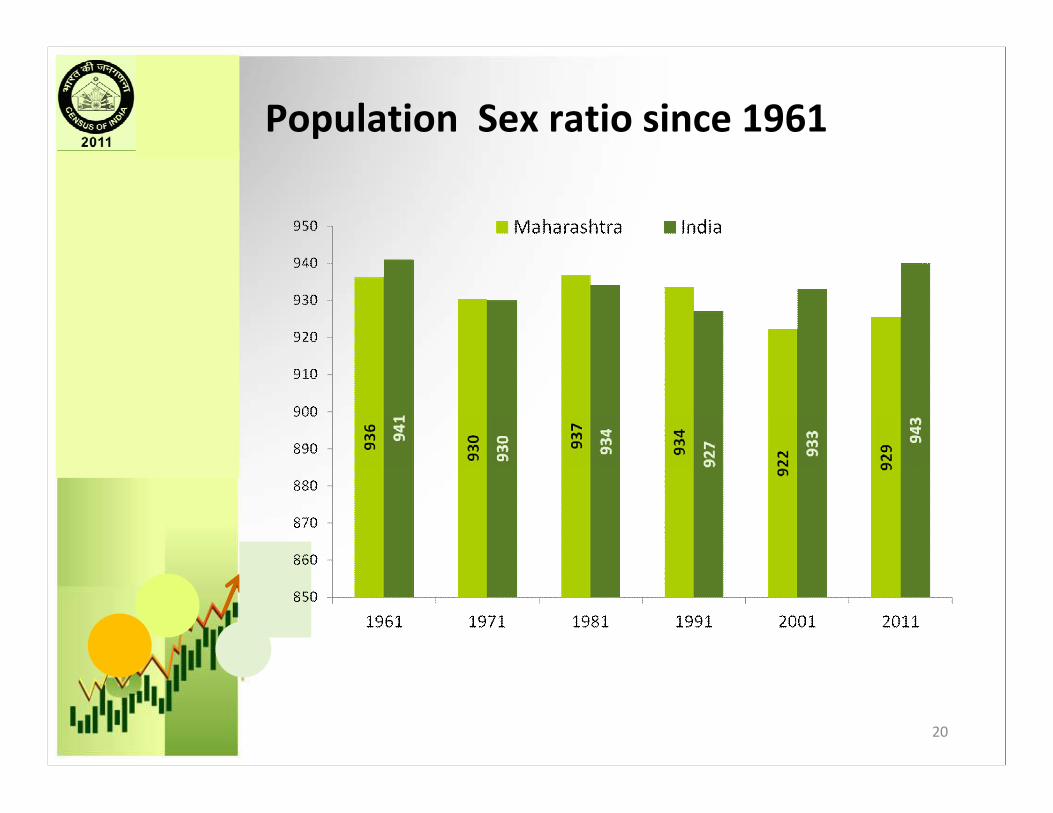
Population Sex ratio since 1961
21
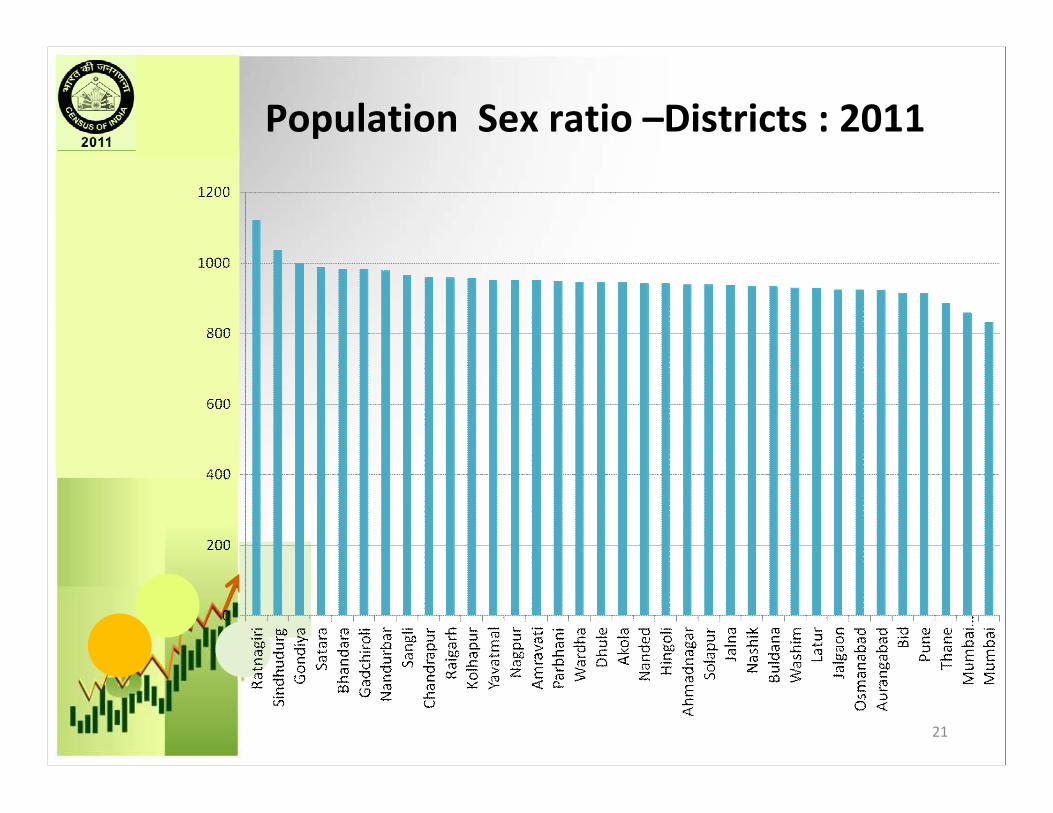
Population Sex ratio –Districts : 2011

Child population
in age 0-6 years
22

23
Child Population (0-6) – Maharashtra 2011
• The total number of children in Maharashtra is 13.32 millions, i.e., 3.45 lakh less than the number recorded in 2001
• Both Male and Female Child (0-6) population has decreased in rural areas (-7.5% for males & -10.1% for females).
• Whereas the same has increased in urban areas (8.0% for males & 7.0% for females).
• However, the percent increase in urban during 2001-11 is less than that of during 1991-01.

24
Decadal growth rate of Child population (0-6 age)- 2011
YearTotal
Persons Male Female
1991-01 1.23 2.99 -0.62
2001-11 -2.52 -1.55 -3.58
Rural
1991-01 -4.17 -2.35 -6.08
2001-11 -8.78 -7.54 -10.13
Urban
1991-01 11.32 12.86 9.68
2001-11 7.54 8.03 7.00

25
District-wise decadal growth rate of child population :2001-11

26
District-wise decadal growth rate of child population :2001-11
• In 10 districts the growth rate of 0-6 age population is positive.
• But in case of female children it is positive only in 7 districts.
• In Kolhapur, Sangli, Satara and Chandrapur the decline in male child population is more than the same of female child population

27
Year Persons Male FemaleTotal
1991 17.1 17.0 17.2 2001 14.1 14.2 14.0 2011 11.9 12.1 11.6
Rural1991 18.2 18.4 18.02001 15.1 15.5 14.82011 12.5 12.9 12.1
Urban1991 15.4 14.9 16.02001 12.8 12.5 13.02011 11.1 11.1 11.1
Proportion of Child population-Maharashtra :2011

28
• The percentage of child population which was 17.1 in 1991 came down to 14.1 in 2001 and again to 11.9 in 2011.
• This is declining both in rural and urban.
• Decline in rural is more as compared to urban
• Gap between in male and female proportion is increasing in rural against females.
Proportion of Child population-Maharashtra :2011

29
District-wise proportion of child population : 2011

30
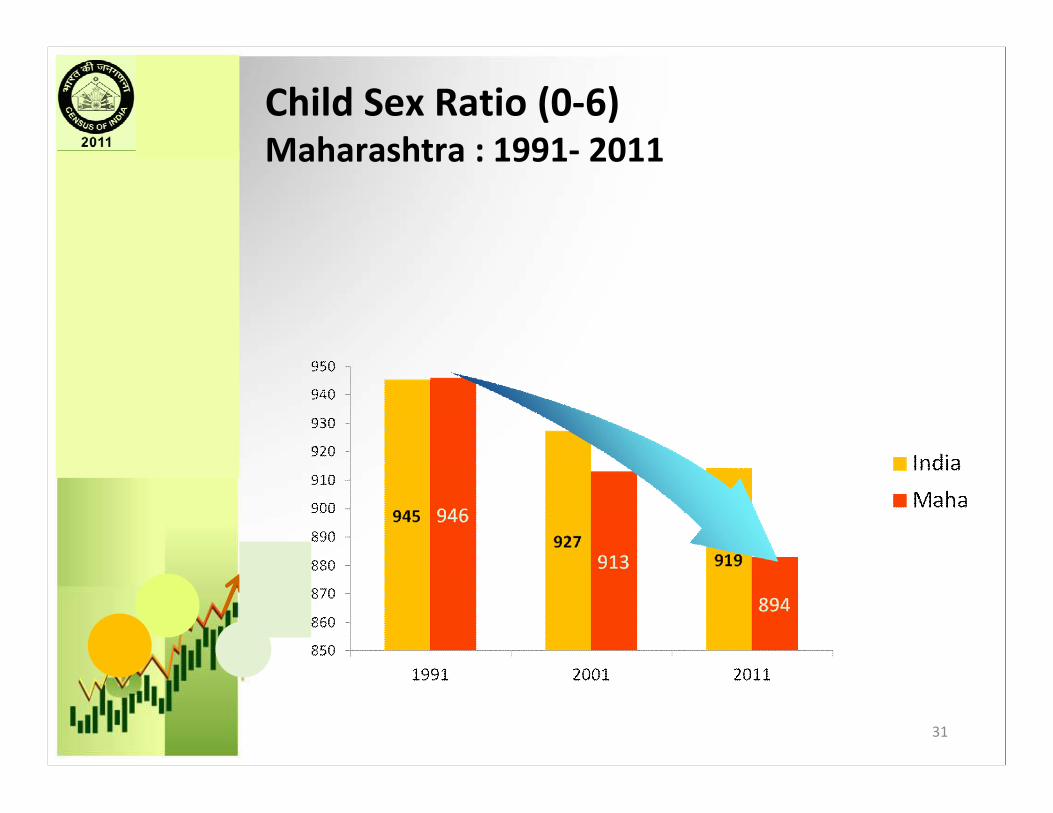
Child Sex Ratio (0-6)Maharashtra : 2001, 2011
• The sex ratio in the age group 0-6 reveals the recent changes in our society in its attitude and outlook towards the girl child.
• Also it is an indicator of the likely future trends of sex ratio in the population.
Residence 2001 2011 Change
Total 913 894 -19
Rural 916 890 -26
Urban 908 899 -9
31
Child Sex Ratio (0-6)Maharashtra : 1991- 2011

32
Child sex ratio in districts Maharashtra -2011

33
Decline in child sex ratio in districtsMaharashtra-2011

Bottom 5 districts -2011 Top 5 districts -2011District 2001 2011 District 2001 2011
Bid 894 807 Gadchiroli 966 961Jalgaon 880 842 Gondiya 958 956Ahmadnagar 884 852 Chandrapur 939 953Buldana 908 855 Bhandara 956 950Kolhapur 839 853 Nandurbar 961 944
34
Child sex ratio in districts Maharashtra: 2001-2011

Literacy Status of population
35

Literacy rateMaharashtra 2011
• There are 8,15,54,290 literates and 3,08,20,043 illiterates in Maharashtra .
• There are 82.3 percent literates in the State in 2011.
• Among males it is 88.4 percent and among females it is 75.9 percent.
• Mumbai (suburban) district (89.9) has the highest literacy rate in Maharashtra.
• The gap between male and female literacy in 2011 has come down to 12.5 percent from 19.0 percent in 2001.
36

37
Number of LiteratesMaharashtra : 2001, 2011
Sex 2001 2011 Change
Persons 64.0 81.6 +17.6
Males 37.2 45.3 +8.1
Females 26.8 36.3 +9.5
(In millions)

38
Change in Literacy Rate Maharashtra: 2001- 2011
Sex 2001 2011Difference(2011 – 2001)
Persons 76.9 82.3 +5.4
Males 86.0 88.4 +2.4
Females 67.0 75.9 +8.9

Literacy rateMaharashtra 2011
Year Persons Males Females1 2 3 4
1951 27.91 40.49 14.56
1961 35.08 49.26 19.80
1971 45.77 59.40 31.00
1981 57.24 70.06 43.50
1991 64.87 76.56 52.32
2001 76.88 85.97 67.03
2011 82.30 88.40 75.90
39

40
Literacy Rate – Rural Urban DifferentialMaharashtra - 2001, 2011

41
Districts by Literacy Rate Maharashtra2011
Top 5 Districts Bottom 5 Districts
DistrictLiteracy
RateDistrict
Literacy Rate
Mumbai (Suburban) 89.9 Nandurbar 64.4
Mumbai 89.2 Jalna 71.5Nagpur 88.4 Dhule 72.8
Akola 88.0 Parbhani 73.3
Amravati 87.4 Gadchiroli 74.4

Literacy rate in major States - 2011
42

43
Female literacy rate Maharashtra 2011

44
Districts by female literacy rate Maharashtra 2011
Top Five districts Bottom Five districtsMumbai 86.5 Nandurbar 56.5
Mumbai Suburban 86.4 Jalna 61.0Nagpur 84.5 Parbhani 63.6Akola 83.5 Dhule 65.8Amravati 83.1 Nanded 66.1

Scheduled Caste and
Scheduled Tribe population
45

46
Scheduled Caste Population Maharashtra : 2011
Persons 2001 2011 Variation Growth
rate
Persons 9881656 13275898 3394242 34.3
Males 5063062 6767759 1704697 33.7
Females 4818594 6508139 1689545 35.1
47
Scheduled Caste Population Maharashtra : 2011
v There are 1,32,75,898 persons reported as belonging to Scheduled Castes of which 67,67,759 are males and 65,08,139 are females. v As compared to 2001 census their number increased by 33,94,242 showing a decadal growth of 34.3 percent during 2001-11. v Consequently, their proportion in total population which was 10.2 percent in 2001 has gone up to 11.8 percent during 2011. v At district level Akola has the highest proportion of SC population with 20.1 percent followed by Latur (19.6 percent), Washim (19.2 percent) and Nanded (19.1 percent).

48
Districts by proportion of SC population Maharashtra : 2011

49
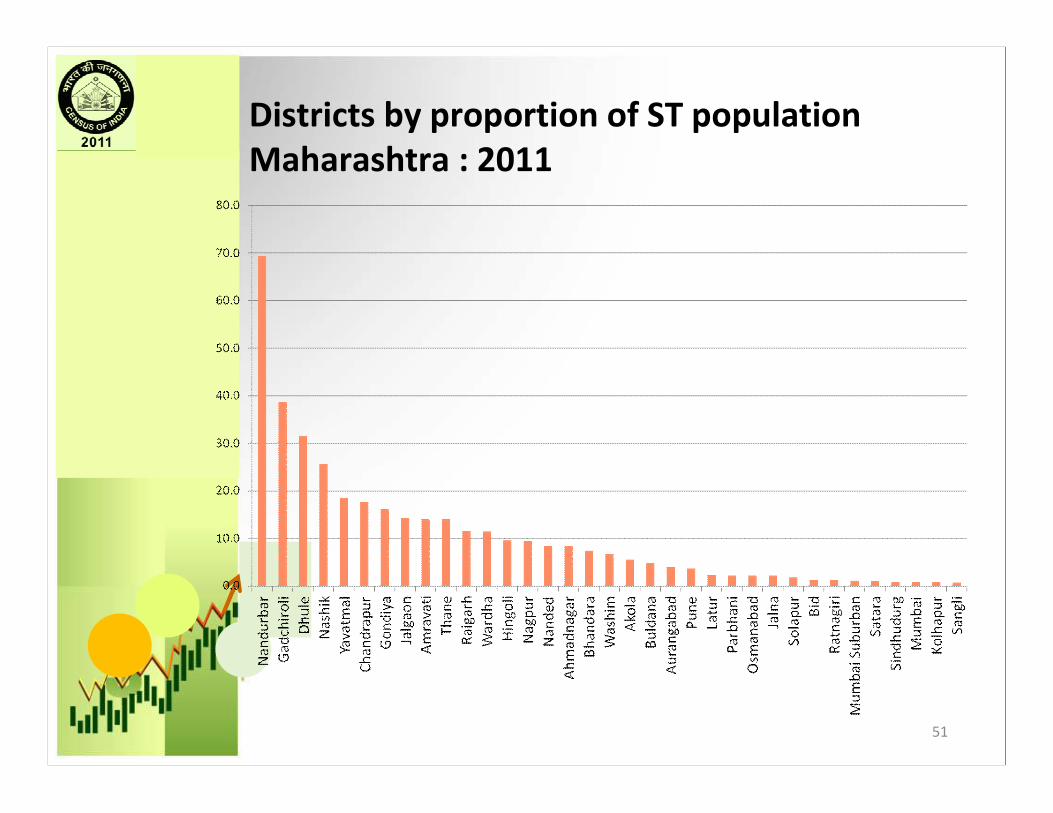
vThere are 1,05,10,213 reported as Scheduled Tribe, of which 53,15,025 are males and 51,95,188 are females showing an addition of 19,32,937 during 2001-11.
vThe growth rate for ST population during 2001-11 stands to be 22.5 percent and their proportion in total population is 9.4 percent against 8.9 percent in 2001.
vAt district level Nandurbar has the highest proportion of ST population with 69.3 percent followed by Gadchiroli (38.7 percent), Dhule (31.6 percent) and Nashik (25.6 percent).
Scheduled Tribe Population Maharashtra : 2011

50
Population 2001 2011 Variation Growth rate
Persons 8577276 10510213 1932937 22.5
Males 4347754 5315025 967271 22.2
Females 4229522 5195188 965666 22.8
Scheduled Tribe Population Maharashtra : 2011
51
Districts by proportion of ST population Maharashtra : 2011

Work Participation Rate
52

53
v There are 4,94,27,878 persons reported as workers in Maharashtra. Among them 4,37,62,890 are main workers and 56,64,988 are marginal workers.
v 44.0 percent of population are workers and among males there are 56.0 percent and among females 31.1 percent reported as workers.
v The share of main workers in total workers is 88.5 percent i.e, 91.9 percent among males and 81.9 percent among females.
Number of WorkersMaharashtra : 2011

54
Number of Workers by ResidenceMaharashtra : 2011
ResidenceNumber of
Workers(Millions)
Non-Workers(Millions)
Work Participation
Rate
Total 49.4 62.9 44.0
Rural 30.6 30.9 49.8
Urban 18.8 32.0 36.9

55
v As compared to 2001 Census, the percentage of workers to total population has increased from 42.4 in 2001 to percent to 44.0 percent in 2011 (by 1.6 percentage point).
v In case of males that has increased from 53.3 percent to 56.0 percent (by 2.7 percentage point) and in case of females it has increased from 30.8 percent to 31.1 percent (by 0.3 percentage point).
Work Participations rateMaharashtra : 2001-11

56
Work Participation Rate by SexMaharashtra : 2001, 2011
Sex 2001 2011 Change
Persons 42.5 44.0 +1.5Males 53.3 56.0 +2.7Females 30.8 31.1 +0.3

57
Districts by WPR- 2011 - Maharashtra
Top 5 Districts Bottom 5 Districts
District WPR District WPR
Gadchiroli 54.5 Mumbai Suburban 39.9
Gondiya 50.3 Nagpur 40.2Bhandara 49.8 Thane 40.6
Yavatmal 48.9 Raigarh 40.7
Bid 48.6 Sindhudurg 40.9

58
Districts by Female WPR Maharashtra - 2011
Top 5 Districts Bottom 5 Districts
District WPR(F) District WPR(F)
Gadchiroli 49.1Mumbai Suburban 18.3
Nandurbar 42.8 Mumbai 18.8Gondiya 42.7 Thane 21.7
Bid 42.7 Nagpur 23.6
Bhandara 42.4 Raigarh 24.7

59
Main and Marginal WorkersMaharashtra : 2001, 2011
Residence Sex 2001 2011 Change
Main Workers Persons 84.4 88.5 4.1
Males 90.9 91.9 1.0
Females 72.1 81.9 9.8
Marginal Workers
Persons 15.6 11.5 -4.1
Males 9.1 8.1 -1.0
Females 27.9 18.1 -9.8

60
Proportion of workers by Category Maharashtra: 2001 & 2011
Workers category 2001 2011 Variation
Cultivators 28.7 25.4 -3.3
Ag. Labourers 26.3 27.3 1.0
HHI Workers 2.6 2.5 -0.2
Other Workers 42.4 44.8 2.4
(% to total workers)

61
Workers by duration in workMaharashtra: 2011
(% to total workers)

62
Percentage of workers by category -1981-2011 : Persons

63
Percentage of workers by category -1981-2011 : Males

64
Percentage of workers by category -1981-2011 : Females

Thank you
65


