UNIVERSITY Center for Air Sea Technology DESIGN DOCUMENT, DATABASE SPECIFICATIONS, AND DATABASE ADMINISTRATION for the NAVAL INTERACTIVE DATA ANALYSIS SYSTEM (NIDAS) VERSION 3.1 Technical Note 3-97 1 June 1997 Prepared for: Naval Oceanographic Office (Code OTT) Stennis Space Center, Mississippi 39529 Contract Numbers: NASA NAS13-564 Delivery Orders 82 and 96 Approved for public release; distribution is unlimited. Mississippi State University, Center for Air Sea Technology Stennis Space Center, MS 39529-6000 DTIC QUALITY INSPECTED 1
Transcript
UNIVERSITY
Center for Air Sea Technology
DESIGN DOCUMENT, DATABASE SPECIFICATIONS, AND DATABASE
ADMINISTRATION
for the
NAVAL INTERACTIVE DATA ANALYSIS SYSTEM
(NIDAS) VERSION 3.1
Technical Note 3-97 1 June 1997
Prepared for: Naval Oceanographic Office (Code OTT) Stennis Space Center, Mississippi 39529
Contract Numbers: NASA NAS13-564 Delivery Orders 82 and 96
Approved for public release; distribution is unlimited. Mississippi State University, Center for Air Sea Technology Stennis Space Center, MS 39529-6000
DTIC QUALITY INSPECTED 1
DESIGN DOCUMENT, DATABASE SPECIFICATIONS,
AND DATABASE ADMINISTRATION
for the
NAVAL INTERACTIVE DATA ANALYSIS SYSTEM (NIDAS) VERSION 3.1
NIDAS VERSION 3.1 (1 JUNE 1997)
CONTRACT NO: NASA NAS13-564 Delivery Order 82 and 96
Prepared for
NAVAL OCEANOGRAPHIC OFFICE CODE OTT
STENNIS SPACE CENTER, MS 39529
Prepared by:
Mississippi State University Center for Air Sea Technology
Building 1103, Room 233 Stennis Space Center, MS 39529-6000
ACKNOWLEDGEMENTS
Special Note of Thanks: The Center for Air Sea Technology gratefully acknowledges the special attention, clear guidance, and encouragement of Mr. Steve Haeger, Naval Oceanographic Office.
UNIX is a trademark of American Telephone and Telegraph (AT&T), incorporated
SUN, SUNOS and SparcStation are trademarks of Sun Microsystems, Incorporated
Motif is a trademark of the Open Software Foundation
X-Window is a trademark of the Massachusetts Institute of Technology
Oracle is a trademark of Oracle, Incorporated
ag/X Toolmaster is a trademark of UNIRAS, Incorporated
Contributors to the NIDAS-C Software Design Document are:
Mr. Clifton Abbott, Software Engineer/Project Manager Mr. Vishnu Mohan Das, Consultant
A Glossary of Terms A-l B List of Acronyms B-l C The NIDAS Relational Database Management System (RDBMS)
Specification C-l D Functional And Design Requirements for the NIDAS Relational
Database Management System (RDBMS) D-l E The NIDAS Development Environment E-l F NIDAS Structures F-l G The NIDAS Default Configuration File G-l H NIDAS Region Configuration System Design H-l I Database Administrator Tools Design 1-1 J Ingesting Data Into the NIDAS Database J-l
LIST OF FIGURES
Figure 1. Top-Level Modular Structure of the Naval Interactive Data Analysis System (NIDAS) 4
Figure 2. Illustration of the NIDAS Top Level GUI 1) (CSC1) Display Screen 7
Figure 3. Illustration of the NIDAS Main Window GUI 2 (CSC2) Display Screen 8
Figure 4. Illustration of the DRM 9 Figure 5. NIDAS Detail Design and Connectivity 10 Figure 6. DRM "Options" Pop-Up for Bathymetry Data 14 Figure 7. DRM "Data" Pop-Up for LLT Data 16 Figure 8. DRM "Options" Pop-Up for LLT Data 17 Figure 9. DRM "Data" Pop-Up for Volume Data 17 Figure 10. DRM "Option" Pop-Up for Volume Data 19 Figure 11. DRM "Data" Pop-Up for Image Data 19 Figure 12. DRM "Options" Pop-Up for Image data 20 Figure 13. DIM "Charter" Pop-Up Dialog 25 Figure 14. DIM Transect Pop-Up Dialog 27 Figure 15. DIM "Synthetic Profiles Selection" Pop-Up Dialog 28 Figure 16. DIM Grid Edit Pop-Up Dialog 30 Figure 17. DIM "Window Options" for Main Chart Window 31 Figure 18. DIM "Window Options" for Profile Chart Window 32
LIST OF FIGURES APPENDIX H
Figure 1. Illustration of the NRCS Main Window Graphical User Interface (GUI) Display Screen H-2
Figure 2. Project Area Info Dialog H-4 Figure 3. Dataset Information Dialog H-5
LIST OF FIGURES APPENDIX I
Figure 1. Illustration of the DᎠTools Main Window Graphical User Interface (GUI) Display Screen 1-2
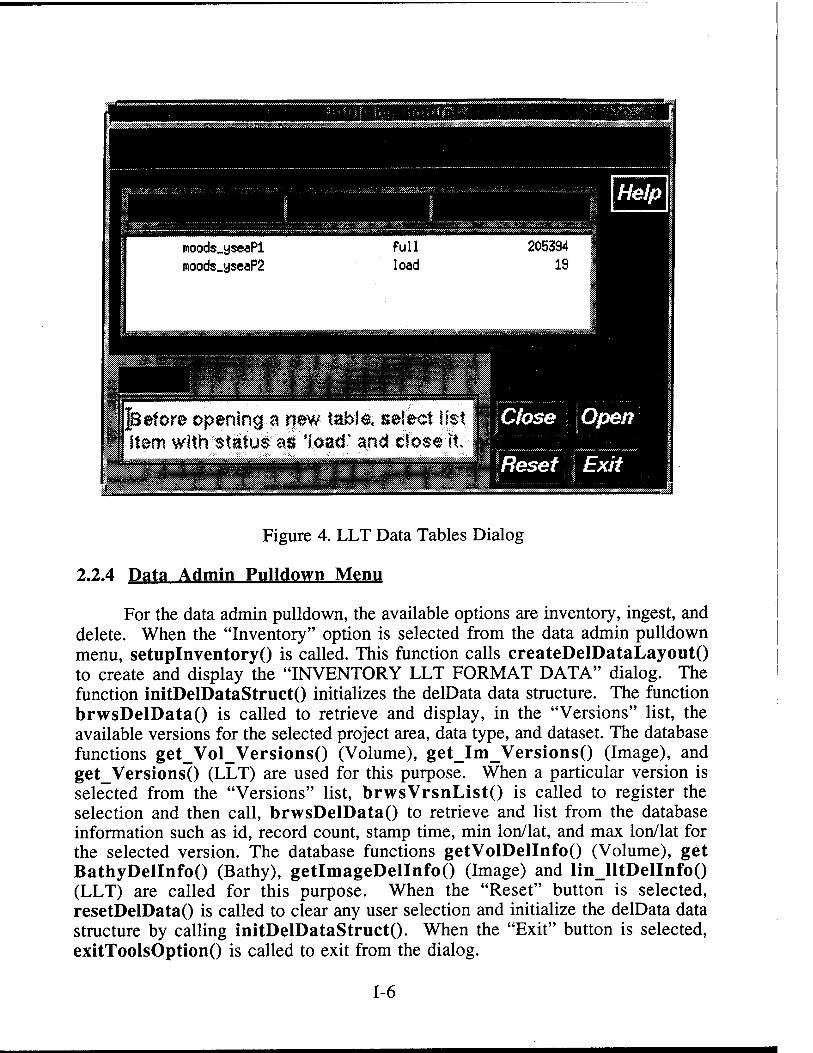
Figure 2. Data Selection Dialog 1-3 Figure 3. Access Control List Dialog 1-4 Figure 4. LLT Data Tables Dialog 1-6
VI
NIDAS DESIGN DOCUMENT, DATABASE SPECIFICATIONS, AND DATABASE
ADMINISTRATION
1.0 INTRODUCTION
1.1 Scope
1.1.1 Identification
Computer Software Configuration Item (CSCI): Naval Interactive Data Analysis System (NIDAS)
Version: 3.1
Release Data: To be determined at a later date
Contract No:
Contractor:
Principal Investigator:
NASANAS13-564-D0-82 NASA NAS13-564-D0-96
J.H. Corbin, Director Mississippi State University Center for Air Sea Technology Building 1103, Room 233 Stennis Space Center, MS 39529-6000 Telephone: (601) 688-2561 Facsimile: (601) 688-7100
Clifton Abbott Mississippi State University Center for Air Sea Technology Building 1103, Room 233 Stennis Space Center, MS 39529-6000 Telephone: (601) 688-3085 Facsimile: (601) 688-7100
1.1.2 System Overview
The objective of NIDAS is to provide NAVOCEANO with an interactive overlay capability for several types of oceanographic, meteorological, and satellite defined data, and create 3-D gridded fields of temperature and salinity
profiles constructed from a combination of "provinced" data (user derived) and gridded data.
Under this project, the tasks were to ingest static databases into a CAST installed EMPRESS/NEONS system; prepare draft and final design/database specification documents; ingest revolving databases into EMPRESS/NEONS; design and develop additional application programs to provide the capability to interactively view and evaluate the OTIS fields by comparison with other data fields; assist NAVOCEANO in interfacing the system to the classified POPS via the LAN to ensure the continuity of NIDAS operational commitments; train NAVOCEANO personnel in NIDAS system operation; and provide informal monthly demonstrations on NIDAS. This was completed in 1994 as NIDAS Version 1.0. From this version, NIDAS for climatologies was performed in 1995 with documentation as NIDAS-C Version 2.0 completed in 1996.
In FY96, CAST also provided maintenance and development tasks for NIDAS at both the unclassified and classified levels, and was also funded by NAVOCEANO to develop software upgrades to NIDAS that will enable NAVOCEANO to better produce databases and products specific to Mine Warfare. NAVOCEANO also provided funding to port NIDAS from EMPRESS to ORACLE. The result of this upgrade is NIDAS Version 3.1.
1.1.3 Document Overview
The purpose of this document is to define and describe the structural framework and logical design of the software components/units which will be integrated into the major computer software configuration item (CSCI) identified as NIDAS Version 3.1. The preliminary design is based on functional specifications and requirements identified through contracts specified above. The contents and format of this document are specified by Department of Defense (DOD)-STD 2167A. Function names appear in bold and ends with empty parentheses.
Appendix A contains a glossary of terms used. Appendix B is a listing of acronyms. The NIDAS relational database specification is contained in Appendix C. Appendix D contains functional and design requirements for the NIDAS relational database management system (RDBMS). Refer to Appendix E for a description of the NIDAS development environment. Appendix F contains a listing of all relevant source code structures. Appendix G provides a default configuration file. Appendix H provides for the NIDAS Region Configuration System, and Appendix I provides Database Administrator Tools.
1.2 Referenced Documents
Note: The section(s) or subsection(s) of this document wherein a reference is cited appears as parenthetical information following each document listed.
1.2.2 NASA NAS12-564 Delivery Order 82 dated 23 May 1996. 1.2.3 NASA NAS 12-564 Delivery Order 96 dated 4 September 1996.
2.0 PRELIMINARY DESIGN
2.1 CSCI Overview
The Naval Interactive Data Analysis System (NIDAS), a stand-alone system, is the major Computer Software Configuration Item (CSCI) developed by this project. Functional requirements, as identified by the sponsor, were not defined in the context of a modular approach to software development. Therefore, the subordinate tasks necessary to fulfill these requirements have been divided among/assigned to the internal Computer Software Components (CSC) for accomplishment. The top-level (simplistic) NIDAS architecture is illustrated in Figure 1.
There are four principle CSC's within the NIDAS structure:
• Graphical User Interface 1 (GUI 1) - incorporates window manage- ment, user interface and display functionality;
• Graphical User Interface 2 (GUI 2) - incorporates window manage- ment, user interface and display functionality;
• Data Retrieval Module (DRM) - provides functional data manage- ment using relational RDBMS technology;
• Data Interactive Module (DIM) - incorporates data processing, appli- cation of interactive methods and algorithms to the data, and graphical (visualization) processing of the data;
NIDAS has one external interface, the User-GUI interface which includes two graphical user interfaces. The User-GUI interface supports 1) user control of interactive techniques and 2) response/feedback to the user in the form of data display (graphical or numerical) and status indicators.
2.1.1 CSCI Architecture
Figure 1 illustrates the NIDAS Top Level module and external interface architecture. There are four CSC's.
CSCI: NIDAS
CSC 3: Data Retrieval Module (DRM)
*
CSC 1: Graphical User Interface 1 (GUI 1)
CSC 2: Graphical User Interface 2 (GUI 2)
\
CSC 4: Data Interactive Module (DIM)
Figure 1. Top-Level Modular Structure of the Naval Interactive Data Analysis System (NIDAS).
2.1.1.1 CSC 1
Graphical User Interface 1 (GUI 1). The NIDAS top level GUI supports and manages the links between the user and NIDAS. Through the GUI, the user exercises all available NIDAS control options. NIDAS provides displays to the user for interpretation and interactive response. The GUI integrates non- developmental software as follows:
• X-Windows (proprietary): Manages all controls and display windows. The X-Windows clients/server model supports remote user access to NIDAS using network protocol via the UNIX operating system.
• Motif Widget Toolkit (proprietary): Provides a widely accepted standard inventory of window components (Widgets) pleasing to the eye and easy to interpret.
Functionally of the GUI allows the user to select a project area.
2.1.1.2 CSC 2
Graphical User Interface 2 (GUI 2). The NIDAS GUI for the main window display integrates the same non-developmental software (X-Windows & Motif Widget Toolkit) as GUI 1. In addition it serves as the agent for internal DRM/DIM communications.
Functionally of the GUI is to exercise direct, centralized control over the DRM and DIM; monitor activities of the DRM and DIM via their external interfaces; intercept, interpret and route user interactive commands; provides status information and feedback to the user; provide a windowing environment for visualization of data, display of control elements, and intercepting user interactive commands; and receive and interpret user input via the keyboard or mouse pointing device.
2.1.1.3 CSC 3
Data Retrieval Module (DRM). The NIDAS DRM is tasked with managing access to and communications with the internal RDBMS. In addition, the DRM prepares simple data displays that conform to user-selectable options and passes them to the GUI for presentation in a window. When a data display is designated for interactive manipulation, it is passed to the DIM via the GUI. The DRM receives data management instructions from the GUI (user). In turn, through the Naval Environmental Operational Nowcast system (NEONS), the DRM translates these instructions into Structured Query Language (SQL) commands to the RDBMS. The DRM is also responsible for allocating the internal memory space for data retrieved from the. database or data destined for database ingestion. The DRM employs the following non-developmental software in accomplishing its tasks:
• UNIRAS ag/X Toolmaster (proprietary): Handles graphical representation and visualization of data displays;
• Oracle RDBMS (proprietary): Performs low-level management of the RDBMS;
• Naval Environmental Operational Nowcast System (NEONS) (government provided software): Performs high level management of the RDBMS via embedded SQL commands to the underlying Empress RDBMS. NEONS also embodies the data model used by the RDBMS.
2.1.1.4 CSC 4
Data Interactive Module (DIM). The DIM modifies and manipulates the data in response to user interactive commands. It supplies the main window GUI with real-time, updated data displays that reflect user interaction. As in the DRM, graphical representation and visualization with the DIM is accomplished using UNIRAS ag/X Toolmaster (proprietary non-developmental software).
2.1.2 System States and Modes
NIDAS is an interactive software application and is always in the event- driven state. As with all event-driven software applications, NIDAS may assume either of two execution states (modes): processing and rest (idle). The NIDAS default state is the rest mode. When not processing data in response to user input, NIDAS automatically reverts to the rest mode and awaits the next user command or input.
2.1.3 Memory and Processing Time Allocation
The interactive, event-driven nature of NIDAS precludes a quantitative description of memory allocation and processing time among NIDAS CSC's. Thus NIDAS responds to user demands by allocating memory, swap space, and processor time within the limitations imposed by available memory and UNIX operating system constraints.
2.2 CSCI Design Description
The CSCI (NIDAS) consists of four CSC modules with functionality as described above. The remainder of this section identifies NIDAS requirements by CSC and discusses the software design employed to achieve the required functionality. The CSCI incorporates all NIDAS functional requirements (NFR) and design requirements (NDR) as presented in Section 5. The CSCI achieves the following design requirements: NDR1, NDR2, NDR3, and NDR4.
2.2.1 GUI 1 (CSC 1)
CSC 1 is responsible for providing the visual display link between the user and the NIDAS top level interactive display. The preliminary design for the NIDAS top level interactive display window is illustrated in Figure 2. While other CSC modules manage their own suite of window displays, the GUI is the ultimate destination of the functionality achieved through user interaction with them. The GUI and its sub-level components achieve the following specific
functional and design requirements, either wholly or in concert with other CSC's (see Section 5): NFR1, NFR9, and NFR10.
-iiasr ÄiÄs*
Naval Interactive Data Analysis System
Figure 2. Illustration of the NIDAS Top Level GUI 1 (CSC1) Display Screen.
2.2.2 GUI 2 (CSC 2)
CSC 2 provides the visual display link between the user and the NIDAS main window interactive display. The preliminary design for the NIDAS main window interactive display window is illustrated in Figure 3. The GUI and its sub-level components achieve the following specific functional and design requirements, either wholly or in concert with other CSC's (see Section 5): NFR1, NFR2, NFR12, NFR13, NFR14, NFR15, NFR16, NFR17, NFR18, NFR19, andNFR21.
Figure 3. Illustration of the NIDAS Main Window GUI 2 (CSC 2) Display Screen.
2.2.3 DRM (CSC 3)
CSC 3 controls the selection and display of data for NIDAS CSCI. User interaction with the DRM is handled via the Data Selection pop-up window shown in Figure 4a. There are three choices for each selectable data type listed in the "Data Selection" pop-up window: "Data", "Options", and "Dismiss". The "Data" button produces dialog pop-up windows, tailored to each data type that allow selection of available parameters contained in the dataset. The "Options" button produces data dialog pop-up windows tailored to each data type, offering other user options such as color. The "Dismiss" button removes the "Data Selection" pop-up window. Once data has been read into memory, a toggle button is produced for that data type in the "Display Toggle Buttons" area shown in Figure 4b. The toggle button specifies the data to view in the "Main Chart" and in the "Profile Chart". The DRM and its sub-level components achieve the following specific functional and design requirements, either wholly or in concert with other CSC's: NFR1, NFR3, NFR4, NFR5, NFR6, NFR7, NFR8, NFR11, NFR13, NFR20, NDR5, and NDR6.
8
Display On/Off Toggle buttons
(a) Data Selection (b) Display Toggles
Figure 4. Illustration of the DRM.
2.2.4 DIM (CSC 4)
CSC 4 provides capability for manipulating and editing selected data. Options are provided to support identification of data subsets by constructing polygon boundaries, zooming of data profiles for improved interpretation/ analysis, interpolating the data, displaying vertical cross sections of volume data, displaying an image histogram, display point information for an image, synthetically creating profiles, and grid-editing Volume-LLT data. The DIM and its sub-level components achieve the following specific functional and design requirements, either wholly or in concert with other CSC's: NFR1, NFR11, NFR14, NFR16, NFR18, NFR21, and NDR8.
3.0 DETAILED DESIGN
Figure 5 illustrates the functional connectivity within NIDAS and forms the basis for the detailed design of the NIDAS CSCI. The preliminary design (see section 3) provides a broad overview of the framework and functional design of the NIDAS CSCI and its four CSCs (GUI1, GUI2, DRM, and DIM). In this section, each CSC is described.
3.1 The NIDAS Graphical User Interface
The design criteria for the Top Level GUI and the Main Window GUI are listed in Section 5, "Requirements Traceability". These CSUs are constrained by the following: 1) the X-server must be opened and available for display; 2) the database must be opened and available for reading; and 3) UNIRAS ag/X Toolmaster must be active for handling graphics functionality.
USER
^ ^ —COASTLINE
—BATHYMETRY —LLT
—IMAGE
—VOLUME
READ GUI1
GUI 2 DATA DATA
RETRD2VAL MODULE
i— ZOOM DISPLAY
- POLYGON
OPTIONS — POLYGON
— OPTIONS DATA
INTERACTIVE MODULE
MULTIVIEW
— INTERPOLATION
— FLAGGING
SYNTHETIC ~ PROFILES
- TRANSECT
- GRID EDITING
Figure 5. NIDAS Detail Design and Connecting.
3.1.1 CSC 1 - The NIDAS Top Level Window (GUI 1)
3.1.1.1 Components
Figure 2 illustrates the layout for the Top Level GUI. The main components of the front page CSU are: globe map, project area specification, menu bar, and title area.
3.1.1.2 Functionality
The Top Level Window GUI design employs the X, Motif, and UNIRAS ag/X Toolmaster libraries. Input to the GUI is via the REGIONJNFO data structure. The function getFrontPageColors() gets the pixel value of specified colors. The function mapPageLayout() creates the layout for the top level window. Within this function, nidasMainPulldown() creates the menu_bar. CreateMapFormO creates the globe map and its components. The function getRegList() retrieves a list of predefined project areas and puts them in the region list. The function regionSelectQ is called when a selection is made on
10
the region list and the appropriate functions are called from within to draw the rectangle across the selected region in the globe. LatIon2Cursor(), Cursor2LatLon(), and ZoomCursor2Latlon() are associated with transform- ing values between the xy coordinates of the cursor and the latitude/longitude values and vice versa. Latlon2Map() is called to transform the latitude/ longitude values into a rectangle across the region in the globe.
SelectZoomO is called when the "Zoom" button is selected. This calls the required functions to draw a zoomed version of the selected region. ZoomDatadialogO, DrawZoomMapO, and ZoomCursor2Latlon() are involved in this process.
The function nidasPopUpO is called when the "Nidas" button is selected from the "Program" pulldown menu in the menu bar. This allocates the required memory for the data structures, sets the appropriate display values, and calls nidasGraphicsInterfaceQ to display the Nidas Main Window.
3.1.2 CSC 2 - The NIDAS Main Window (GUI 2)
3.1.2.1 Components
Figure 5 illustrates the functional connectivity within NIDAS. The design of the Main Window is subdivided into the following: the Title Area; the "Main Chart" which provides a geographical display; the "Profile Chart" which displays the profiles of the LLT data type; a pull-down menu bar containing various options for interacting with the "Main Chart" and "Profile Chart" windows; data control and interaction buttons; window control buttons; and a "Remark" area which communicates important messages to the user.
3.1.2.2 Functionality
Like the top level page design, the NIDAS main window page design employs the X, Motif, and UNIRAS ag/X Toolmaster libraries. The NIDAS data structure is used to store and retrieve any input data pertaining to the NIDAS main window. The function readDefaultValues() is called to read default values into the DEFAULT_STRUCT data structure from a specified file. The function getColorPixel() initialize the colorStruct data structure. The function allocMemoryAndlnitO allocates memory to the NIDAS structure and initialize the data elements. The function createLogLayout() creates a scrolled text area to log user interactions with the application. The function mainWindowData DialogO converts the lat/lon data into the mercator projection and also stores the min and max window coordinates in the NIDAS data structure. It also stores the bathymetry values and finds its min and max values.
11
The function frontPageLayout() creates the layout of the NIDAS main window as shown in Figure 3. The various data action and analysis buttons are created here as are the window control buttons. The function nidasPulldown() creates the menu bar. A second menu bar is created which contains the various data action and analysis buttons. The function dataForm() is called to create the NIDAS Data Interface Module. It then creates the data selection dialog but does not display it. The data form calls getRegDataType() to retrieve all the data types and the corresponding data models available. Then the "Main Chart" and the "Profile Chart" drawing areas are created. The "Nidas" button when selected, displays a list of options and an "Exit" button. The "Help" button has a list of options provided to offer help.
3.1.2.3 Nidas Pulldown Menu
The "BackG/ForeG Color" option from the "Nidas" pulldown menu calls invertBackGForeGCoIorO to invert the background and foreground colors of the display. The "Window/Pixmap First" option calls se!ectDrawOrder() to set the drawing order. The drawing order specifies whether the graphics are drawn in the chart windows and then stored in memory, or drawn in memory first and then in the chart windows. The "Label" option calls displayLabel() to display the labels. When the "Status" button is selected, displayStatus() is called which creates and displays a scrollable status dialog. The dialog lists all the default values for the various data types. When the "Log" button is selected, ShowLogDisplayO is called which creates and displays a scrollable log of the user's actions.
3.1.2.4 Help
The buttons "Layout", "Data Selection", and "Data Analysis" from the "Help" pulldown menu calls createlnterfaceHelpO to provide on-line help in the respective topics.
3.2 CSC 3-The NIDAS Data Retrieval Module (DRM)
3.2.1 Components
Figure 4 illustrates the components of the NIDAS Data Interface. The purpose of the interface is to provide data retrieval, display, and manipulation options for the following data: Bathymetry, Coastline, LLT, Volume, and Image.
12
3.2.2 Functionality
When the "Data Select/Option" button is selected, dataPress() is called to manage and display the data dialog as shown in Figure 4. The data selection component consists of two main components: Data and Options for the Bathymetry, Coastline, LLT, Volume, and Image. Selecting a particular data type from the "DATA TYPE" list in the data dialog executes typeBrws() which registers the data type selected and lists all the datasets available for the selected data type. Selecting a particular dataset executes dataBrws() to register the selected data set. When the "Data" button is selected, dataSelectPressO is called which retrieves the data for the selected data model. When the "Options" button is selected, optionChoicePress() is called which displays the options dialog for the particular data type. Depending on the particular data type selected, the corresponding functions are called to perform the data retrieval or displaying the options dialog as explained below.
3.2.2.1 Bathymetry
3.2.2.1.1 Data Selection
When Bathymetry data is selected, readBathymetryO is called to retrieve the data from the database in accordance with the parameters contained in the region selected. The required memory is allocated and the retrieved data is then stored in the NIDAS Bathy structure. After the data has been retrieved, a toggle button for that dataset is created in the "Display Toggle Buttons" area. This toggle button allows the turning on and off of the dataset.
3.2.2.1.2 Data Display
When the display toggle button for a bathymetry dataset is selected, displayBathymetryO is called to perform the rendering of the bathymetry. The function createIsolines() is called to render the isolines. This function first checks the option values for errors, allocates the required memory, and performs the rendering. The function copyPixmapO allocates the required amount of memory for the pixmap and then extracts the bathymetry data from the original bathymetry array for the region. After creating the pixmap, this function then releases the memory allocated for the new array.
3.2.2.1.3 Data Options
When the "Options" button for a specific bathymetry dataset is selected, bathyVolImageOptionsO is called. This function creates and displays the "Bathymetry Options" pop-up window as shown in Figure 6. This pop-up dialog
13
allows for the setting of the minimum, maximum, contour internal, color value, label on/off, isoline width, and label height. When the "Reset" button is selected, resetOptionsO is called to restore the original values from the BATHYMETRY data structure.
Figure 6. DRM "Options" Pop-Up for Bathymetry Data
3.2.2.2 Coastline
3.2.2.2.1 Coastline Data Selection
When the Coastline data is selected, coastLineLayout() is executed. This function creates and displays the "Coastline Data" pop-up window which provides the selection between four kinds of coastline. When one of the types of coastline is selected from the Coastline pull down menu, the correct coastline name is displayed in the text area.
3.2.2.2.2 Data Display
By default, the display toggle button for the Coastline is selected. Selecting this button calls displayCoastLine() which calls createCoastlinePixmap(). This sets the appropriate scale values with regards to the "Main Chart" area of the main window and then calls draw_coast() to allocate the required memory and draw the coastline. The GEOG routines are used to perform the retrieval of the coastline data from the database and draw the coastline. Deselecting the Coastline display toggle button executes drawMainwindowGraphics(), which calls displayCoastlineO to remove the coastline from the pixmap.
14
3.2.2.2.3 Data Options
Selecting the "Options" button for the Coastline executes coastLineLayout(). Like the Coastline "Data" selection, this function creates and displays a pop-up dialog. This dialog allows for selecting the coastline color.
3.2.2.3 LLT
3.2.2.3.1 Data Selection
When "Data" is selected for a specific LLT dataset, createLltData layoutO is executed. This creates and displays a data selection window for the LLT data type as shown in Figure 7. This dialog allows for specifying the minimum and maximum values for the latitude, longitude, time, classification, month, parameters, cruise id, instrument type, source code, and water depth. The function createVrsnDialogO is called to create a dialog listing the versions available. This pop up dialog is made visible when showVrsnDialogO is executed by selecting the "Version" toggle button. The function getLltnVrsn Info() performs the actual retrieval of the versions from the database. Initially the default values from the NIDAS LLT structure are set for the various elements. These values can be changed to any appropriate value. Whenever a value is changed the corresponding function is called to register the new value.
To initiate the retrieval of data the "Read" button is selected. This results in readLltData() being called. The necessary header information is obtained, the input parameter values are validated, and the data is retrieved from the database by calling retrieveLltData(). The retrieveLltData() function utilizes the LLTN database library routines to extract the data from the database. The function storeLltVals() is called to allocate memory and store the data in the NIDAS LLT structure. When the "Reset" button is selected resetLltData() is executed to restore the original values from the LLT data structure.
3.2.2.3.2 Data Display
Selecting the display toggle button for the LLT dataset activates displayLlt(). Depending on whether the location and/or the profile buttons have been selected, createLltLocationPixmapO is called to create the profile locations pixmap and copy it onto to the main window "Main Chart" display. The function createLltProfilesPixmapO creates the profiles pixmap and copies it onto the "Profile Chart" display of the main window. When the display toggle button is deactivated, the LLT dataset profiles and the locations are removed from the "Profile Chart" and "Main Chart" respectively.
15
K;Ä«siii3ÄiUt WO» J»1»«W0,.:
Data Selection
Classification
0 Default Mki dass 1010010 Unclassified; Unllrrt 1100010 Unclassified
10001000 Delete Class 100000000 Default Max dass
0 Special Data Z FNOC Message Data 4 NODCSDH-Through 1: 6 FNOC XBT In SPOT Fror 7 NODC STD Dat High rte
Instrument I VIM;
0 Special Instrument 1 Message Data 2 Mechanical Bathytherm S New
Internally, createLItLocationPixmapO calculates all the boundary values, validates the data and performs the actual plotting of the locations by calling plotLltLatLon(). Likewise createLltProfilesPixmapO sets the proper scale, validates the parameters and calls drawLltProfile(). This calculates all the boundary values, validates the data and calls one of the two functions to draw the actual profiles: drawLItZoomedProfiles() if only the zoomed profiles are to be drawn, and drawLltAHProfiIes() if all the profiles are to be drawn.
3.2.2.3.3 Data Options
Selecting the "Options" button for a specific LLT dataset executes createLltOptions(). This creates a pop-up window, as shown in Figure 8, where by the various data parameters for the LLT data type can be set to the desired values. Among the various parameters that can be set is the option for indicating the profile flag settings. The corresponding functions are executed to register the new values. When the "Reset" button is selected resetOptions() is called to restore the original values from the LLT data structure.
16
Figure 8. DRM "Options" Pop-Up for LLT Data
3.2.2.4 Volume
3.2.2.4.1 Data Selection
When "Data" is selected for a specified volume dataset, setupVolData() is executed. This function checks if the dataset is of the Climatology type or not by executing getVolTimeType(). The function volumeLayout() is called to create and display the Volume data selection dialog as shown in Figure 9. The function getVolumelnfoQ is called from here to retrieve information about the
various versions and list them. When a particular version is selected brwVrsn() is called to register the selection. When the "Read" button is selected to initiate the retrieval of the data, readVolumeData() is called. This function frees any memory which has been previously allocated. The function getVoIume() which is subsequently called, allocates the required memory and performs the data retrieval and stores the retrieved data. When the "Reset" button is selected, resetVolumeDataO is called to reset the VOLUME data structure.
3.2.2.4.2 Data Display
When the display toggle button is selected for the Volume dataset, volumeDisplayO is called. This performs some parameter error checks and then calls updateVolLocation() to update the volume lat/lon data points if necessary. The function createVolLocation PixmapO is called to create a pixmap of the volume locations and then calls copyPixmapO to copy the pixmap onto the "Main Chart" area. If the "Profiles" option is selected then createVolProfilesPixmapO is called to create and draw the profiles in the "Profile Chart" area. When the display toggle button is deselected, drawMainWindowGraphicsO and drawProfileWindowGraphics() are called to render the graphics without the volume data.
3.2.2.4.3 Data Options
Selecting the "Options" button for a specific volume dataset executes bathyVolImageOptionsO. This creates and displays a pop-up window as shown in Figure 10. This pop-up dialog allows for the setting of the isoline, location, label, and profile on/off options as well as display levels, color values, minimum, maximum, interval, number of decimals, line widths, points size, and label heights. The function getVolLvl() retrieves and lists the various levels, while brwsLevelO is called to register any selected level. The corresponding functions are called to register any selected values. When the "Reset" button is selected resetOptions() is called to restore the original values from the Volume data structure.
3.2.2.5 Image
3.2.2.5.1 Data Selection
When "Data" is selected for a specific Image dataset, ImageDataLayoutO is executed. The creates and displays the Image data selection dialog, as shown in Figure 11. The function getlmageDateldO is called from within to retrieve a list of images and dates. When a particular image is selected getlmageQ is called to register the image in the Image data structure. When the "Read" button
18
is selected, readImageData() is called to perform the retrieval of the image. When the "Reset" button is selected, resetlmageDataO is called to reset the IMAGE data structure of any image selected.
Figure 10. DRM "Options" Pop-Up for Volume Data
""T^Pl^ä^aSäftiäfö«' Image Data
1995/5/31:23.06 :1454139875 : wp151f3
Figure 11. DRM "Data" Pop-Up for Image Data
3.2.2.5.2 Data Display
When the display toggle button is selected for the Image dataset, displaylmageO is called. This first checks if any Image data is selected. Any existing image displayed will be freed from the pixmap and createNewImage() called. The window parameters are calculated and the required memory is allocated to the IMAGE data structure. The image values are calculated and a new Image pixmap is created. The function drawMainWindowGraphics() is called to redraw the image in the "Main Chart" area and drawProfileWindow GraphicsO is called to redraw the profiles in the "Profile Chart" area.
3.2.2.5.3 Data Options
Selecting the "Options" button for a specific Image dataset executes bathyVoIImageOptions(). This creates and displays a pop-up window, as shown in Figure 12. This dialog allows for setting the minimum, maximum, and the interval values. When the "Grayscale" or the "ColorScale" toggle buttons are selected, colorTypeChanged() is called to register the selection in the IMAGE data structure. When the "Reset" button is selected resetOptions() is called to restore the default values to the Image data structure.
Figure 12. DRM "Options" Pop-Up for Image Data
3.3 CSC 4 - The NIDAS Data Interactive Module (DIM)
3.3.1 Components
The purpose of the DIM is to support user interaction with the data. The kinds of interactive options provided are: Changing of Parameters, Exporting, Zooming, Reference Polygon, Polygon, Polygon Subsetting, Polygon/Zoom
20
Options, Multiview, Interpolation, Flagging, Transect, Single Profile, Histogram, Point Information, Synthetic Profiles, and Gridding Session. There are also interactive window operations that can be used to manipulate the windows. Each of these options are described below.
3.3.2 Functionality
The DIM is programmed using the C programming language. It uses the X, Motif, NEONS, and UNIRAS ag/X Toolmaster libraries.
3.3.2.1 Parameters
When the "Parameters" button is selected a menu of parameters is presented. Selecting a parameter will call selectParam() which will register the selected parameter. Depending on the parameter selected (Temperature, Salinity, Sound Speed, Density, or Conductivity), the Parameter selected vs Depth profiles are drawn in the "Profile Chart" area by calling drawProfileWindowGraphics() and the locations are drawn in the "Main Chart" area by calling drawMainWindowGraphicsO.
3.3.2.2 Exporting
LLT data may be expected via the "Data Tools" area on Profile Isolation (see Section 3.3.2.6). When the "Export" button is selected from the "Data Tools" area, a pulldown menu appears with four options: "Polygon Data" which exports only data that has been polygoned; "Accumulative Subset Data" which exports multiple subsets made in profile isolation (see Section 3.3.2.6); "All Data" which exports all data; and "Image Data" which exports images. When exporting through Profile Isolation, the export is treated like "Polygon Data". When an option is selected, SetupExportData() is called. This function checks the conditions that it was called, initialize the EXPORT data structure by calling InitExportStructO, and then creates and displays a pop-up dialog. The pop-up dialog allows the selection of data to export from (if more than one dataset is currently being displayed), the setting of a header and filename of each dataset, the selection of either binary format or ASCII format, and the selection of flagged profiles to export. When the "Export" button is activated, WriteToFileO checks the file format and exports the data according to the conditions given.
21
3.3.2.3 Zoom
When the "Zoom" button is activated, zoomEdit() is executed. This function registers the required functions to the "Main Chart" area and unregisters them when the button is deactivated.
The function zoomDrawingPress() is activated when the user clicks the left mouse button on the "Main Chart" area to start drawing a rectangle. The function zoomDrawingMotion() is activated when the user drags the mouse across a region in the "Main Chart" area, and zoomDrawingRelease() is activated when the user releases the left mouse button to complete the drawing of the rectangle across the region to be zoomed. This computes the required lat/lon values and other parameters and calls zoomGraphics() which creates and plots all the graphics displayed in the zoomed area on the "Main Chart". The function drawProfileWindowGraphicsO is called to create and plot all the profiles displayed in the zoomed area on the "Profile Chart".
3.3.2.4 Reference Polygon
When the "Reference Polygon" button is selected from the "Analysis Tools" section dummyPolyEdit() is called. This clears any previous reference poly- gons and prompts the user to draw the polygon. The function dummyPoly Press() is called when the polygon is being drawn. The left mouse button is utilized to indicate the current active chart. The middle mouse button is used to specify the location of polygon corners, and the right mouse button is used to close the polygon. The reference polygon is not active in the "Profile Chart" area.
3.3.2.5 Polygon
When the "Polygon" button is activated, polygonEdit() is executed. This function registers the eventhandlers mainPolyPress() to the "Main Chart" area, and profilePoIyPressO to the "Profile Chart" area. When the "Polygon" button is deactivated, the eventhandlers are unregistered.
The function mainPoIyPress() utilizes the left mouse button to indicate the current active chart and it changes the border color of the "Main Chart" area. The middle mouse button is used to specify the locations of polygon corners. The right-most mouse button is used to close the polygon. Once the polygon is closed the proper scales are set by calling setMainWindowScale() and the polygon is drawn. Also, drawFlaggedLocations() is called to plot the locations of the data profiles lying inside the polygon in the "Main Chart" area and to plot the corresponding profiles in the "Profile Chart" area.
22
The function profiIePolyPress() utilizes the left mouse button to indicate the current active chart and it changes the border color of the "Profile Chart" area. The middle mouse button is used to specify the locations of polygon corners. The right-most mouse button is used to close the polygon. Once the polygon is closed the proper scales are set by calling setProfileWindowScale() and the polygon is drawn. Also, drawFlaggedProfiles() is called to plot the profiles lying inside the polygon in the "Profile Chart" area and their corresponding locations in the "Main Chart" area.
3.3.2.6 Polygon Subsetting (Profile Isolation^)
When the "Profile Isolation" button is activated, profileIso!atePress() is executed. This function checks whether any of the displayed data have subsets and then calls createProfilelsolateOptionQ to create and display a dialog to perform profile isolation. When any dataset toggle button is selected, display ProfileListO is called to display the profiles of the data type. Selecting the "Single" button from the "List Selection Policy" box selects one profile from the list. Selecting "Multiple" allows for more than one. Selecting "All" selects all profiles from the list. Whenever a profile is selected, profileListBrws() high- lights the selected profiles in the "Profile Chart" area and in the "Main Chart" area.
The "Flag" button and the "Update DB" button are explained in detail in Section 3.3.2.10.
The "Export" button function as described in Section 3.3.2.2 and treated as a polygon data export with the isolated profile(s) as the polygoned data.
When the "Delete" button is selected, deleteProfileIsolate() is called. This creates and displays an information pop-up dialog asking the user to reconfirm whether to delete or not. Selecting the "Ok" button activates okDeleteProfileO to delete the VOLUME, and/or LLT data from their respective data structures. After the profiles are deleted the allocated array memory is freed. The profiles are deleted only from memory.
Selecting the "Exit" button activates exitProfilelsolateQ to destroy the "Profile Isolation" pop-up dialog, perform the necessary data structure updates, and exit.
3.3.2.7 Polvgon/Zoom Options
Selecting the Polygon/Zoom Options button executes the function polyOptPressQ which displays a pop-up dialog to facilitate setting of the
23
polygon options. Options such as vertex color, edge color, vertex size, edge line width, and vertex symbol can be specified. The functions getDotSize() and getLineWidth() are called to register the values in the data structure. Selecting the "Zoomed Profiles only" toggle button will execute zoomProfiles() which sets the zoom only flag in the ZOOM data structure. Selecting the "Overlay Zoomed Profiles" will execute overlayProfiles() which will set the overlay flag in the ZOOM data structure. Selecting the "Dismiss" button calls exitPoIyOptO which exits and destroys the pop-up dialog.
3.3.2.8 Multiview
When the "Multiview" button is selected from the LLT action buttons area, multi_view() is called. This calls checkValidMuItiViewO to check for errors and allocate memory. Memory is allocated for the Main Window data structure as well as for the Profile Window data structure to hold data for the new windows created. The newly allocated memory is initialized by calling initMultiView(). This populates the data structure with the required values and calls the functions to display the profiles in the different windows. The six windows that are created represent a reduced copy of the "Main Chart", "Temperature vs Depth", "Temperature vs Salinity", "Salinity vs Depth", "SoundSpeed vs Depth", and "Density vs. Depth". The function windowSetupO is called to perform setup operations (such as setting the label strings) on the six windows. Selecting "Multiview" again returns NIDAS back to a two window display.
3.3.2.9 Interpolation
Only LLT data can be interpolated to a contour. When the "Interpolation" button is selected from the LLT action area, interPress() is called. The required memory is allocated for the CHARTER data structure and also a check is made to see if the LLT data is displayed. The charter bathymetry structure is initialized by calling initBathyStruct(). An "Interpolation Selection" dialog is then created that displays the different interpolation routines. The function getlnterMethodO is called when one of the interpolation routines is selected to register the selection. If more than one LLT dataset is available, then a list of those datasets are shown. When a particular dataset is selected, getlnterData Type() is called to register the selection.
When the "Data" button is selected, interApplyO is called. This initialize the EXPORT data structure and then creates and displays the "Charter Dialog" pop-up dialog as shown in Figure 13. This dialog allows for specifying the various Charter values such as grid interval (in minutes), latitude/longitude values for the lower left and upper right corners, depths, and smooth values. Selecting
24
the "Apply" button activates chrtrOkPress(). This validates the specified data values, exports the data to a file with chrtrWriteToFile(), executes an inter- polation routine on this exported file in order to create the contour file, and imports the contour file back into memory. Etopo5 bathymetry is read from database functions to base the land masking on. This contour is treated as another datatype and is given a display toggle button for displaying. When the "Dismiss" button is selected, chrtrCancelPress() is called to destroy the dialog and to free the EXPORT data structure. When the "Help" button is selected, chrtrHelp PressQ is called which creates and displays an on-line help dialog.
Figure 13. DIM "Charter" Pop-Up Dialog
When the "Options" button is selected, bathyVolImageOptions() is called, whose functionality is as described in Section 3.2.2.1.3. The land making option is added to this dialog for interpolation.
3.3.2.10 Flagging
LLT profiles are flagged through the profile isolation dialog (Section 3.3.2.6). After one or more profiles have been isolated, the "Flag" button is selected where SetupFlagO creates and displays a pop-up dialog for setting flags. The function createFlagToggleQ is called to create ten differs
25
flag toggles: Not Yet Examined, Good Profile, Coarse Resolution, Inconsistent, Duplicate (but keeps), Duplicate (delete), Suspect, Needs Repair, Wrong Location, and Bad Profile. When one of these flag toggles are set, setPoofFlagO is called to set the profile flags. The required memory is allocated and the flag values are assigned to the FLAG data structures. When the "Reset" button is selected, setFlagResetO is called to reset the flag values.
There are two ways to update the database of the flag changes: the "Update DB" button from the profile isolation dialog, or the "Update Flags" button from the "LLT Tools" area. Updating from the profile isolation dialog updates the database with one flag grouping at a time. This is a "flag-update, flag-update process." Updating from the "LLT Tools" area updates the database of all accumulative profile isolation flagging. This is a "profile isolate-flag, profile isolate-flag, update process."
When the "Update DB" button from profile isolation is selected, updateProfilelsolateO is called. This updates the current flags in the database by calling updateDB().
When the "Update Flags" button from the "LLT Tools" area is selected, SetUpdateO is called. This checks for the display of LLT data and whether or not profiles have been flagged. The "Update Database Facility" dialog is then created and displayed. A list of datasets are displayed along with a toggle button to set on/off. When a toggle button and the "Update" button are selected, UpdateDB() is called to update the database for each dataset selected. When the "Dismiss" button is selected, exitUpdate() is called which frees any allocated memory and destroys the dialog.
3.3.2.11 Transect
When the "Transect" button is selected from the Volume action area, transectEditO is called. This checks for the presence of data and then calls transectDrawingPressO to calculate the end points and draw the transect. The middle mouse button is used to select the end points and the right button is used to start the transect. The function createTransectOptionsO is called to create and display the options dialog for the transect as seen in Figure 14. After specify- ing the various options and when the "Apply" button is selected, applyTransect DialogO is called. This checks whether a dataset has been selected and if it has been displayed. The required memory is allocated for the VERT_XSEC (TRAN- SECT) data structure. The required data for the data type selected is obtained from the VOLUME data structure. After the data values have been extracted, createTransectWindowO is called to create a window to draw transect isolines and profiles. The right mouse button is used to close the transect window.
26
Figure 14. Dim Transect Pop-Up Dialog
3.3.2.12 Single Profile
When the "Single Profile" button is selected from the Volume action area, singleVolEditO is called. The function checks if a polygon is drawn. The function mainVolLocGetPress() is called when the middle mouse button is clicked inside the drawn polygon. After setting the scale and getting the location value of the point selected, drawSingleVoILocation() is called. This function sets the required scale, allocates the required memory, and draws the single profile on the "Profile Chart" area based on the location of the clicked point.
3.3.2.13 Histogram
When the "Histogram" button is selected from the Image action area, imageHistPress() is called. This checks if an Image has been displayed and then calls createImageHistOption() to create and display the "Image Histogram" dialog. If there are more than one image being displayed, this dialog allows the selection of a specific image. When an image has been selected, or if there is only image, setupImageHistogram() is called. This function provides the setup for the histogram and calls createImageHistogram() to draw the histogram in the drawing area of the dialog. When the "Dismiss" button is selected, exitImageHistogram() is called to destroy the dialog, reset the histogram flag, and exit.
27
3.3.2.14 Point Info
When the "Point Info" button is selected from the Image action area, imagePtEdit() is called. This checks if an Image has been displayed. When the middle button is pressed on a point in the image, imagePtDrawingPress() is called. This displays a dialog showing the latitude, longitude, pixel value, and temperature of the selected image point. The dialog is updated each time the middle button is selected. The "Dismiss" button exits from this dialog.
3.3.2.15 Synthetic Profiles
When the "Synthetic" button is selected syntheticPress() is called. This function sets the appropriate flag and calls checkValidSynthetic(). The function syntheticPopupO is called to create and display the "Synthetic Profiles Selection" pop-up dialog as shown in Figure 15. A province polygon can be drawn if the synthetic profiles are to be from a subset of the data. When "Province" is selected, synProvicePress() is executed. On the "Main Chart" area, the middle mouse button is used to select the corner points of the polygon and the right mouse button is used to close the polygon. A synthetic profile can be drawn for an average profile, minimum profile, maximum profile, and six alternative profiles. When one of these profiles is selected, SynSelectTog Press() is called. On the "Profile Chart", the left mouse button is used to create a new point in the profile. The right mouse button is used to quit and cancel created mode.
Figure 15. DIM "Synthetic Profiles Selection" Pop-Up Dialog
When the "Overlay" button is selected, overIaySynProf() is called. This calls repaintAll() to clear the windows of any excess polygons and profile lines. The function IastProvince() is called to draw the last drawn province in the "Main Chart" area, and drawSynProf() is called to draw the synthetic profiles in the "Profile Chart" area.
28
When the "Import" button is selected, importSynthetic() is called. This function checks if the synthetic_db directory exists and is readable. A dialog is created and displayed prompting the user to make a selection. When the "OK" button is selected readSynProf() is called. This performs some error checks and then reads the synthetic profile data from the file. The functions readSynFromFileO, readProvincePts(), and readRecord() are involved in the reading of the data from the file.
When the "Export" button is selected, exportSynthetic() is called. This function checks if the export directory exists and also if province or profiles exists. The "Synthetic Export" pop-up dialog is created and displayed. An option is provided to save the synthetic profile in the synthetic database directory. Options are provided to specify the export file name, latitude, longitude, year, month, day, hour, province number, and region codes values. When the "Export" button is selected, writeSynthetic() is called. The checks the validity of the options specified and then writes the data into the file. If the file exists, the user is prompted. If the "save in database directory" button is selected, okSaveSyn InDbaseO is called to copy the data into the directory.
When the "ResetlCLIM" button is selected, resetSynthetic() is called to reset the SYNTHETIC data structure for the profile type selection.
When the "Dismiss" button is selected, exitSynthetic() is called to destroy the synthetic dialog, reset the flags, reset the various data structures, and exit.
When the "Synthetic Profile Options" toggle button is selected, synOptTogPressO is called. This function calls createSynOptDialogO to create and display the "Synthetic Profile Options" dialog. This dialog provides for the specifying of the First and Last Depth Values, Depth On/Off, Line Color, Line Width, and Line Style of the different types of profiles.
3.3.2.16 Grid Editing
When the "Sessions" pulldown in the "Gridding" section has been selected, three options appear: Read, Edit, and Store. When "Read" is selected, ReadSessionQ is called. This function calls getActiveLLT() to read and display the active LLT data that has been converted from a volume.
When the "Edit" button is selected, editSession() is called to check for the presence of a polygon and then create a pop-up dialog, as shown in Figure 16. This dialog is the same dialog as the profile isolation dialog except instead of selecting a dataset, you select an "Editing Policy" and an "Edit" button has been added. The rest of the functions in this dialog are described in Section 3.3.2.6.
29
When the editing policy of "New Synthetic" has been selected and the "Edit" button pressed, editProfilelsoIateO is called. This function creates a line at the end depth on the "Profile Chart". The left mouse button is used to select a new point for a depth while the middle mouse button quits the new synthetic mode.
THC-l Iftiiliiaifll^^ ^Z~~
instrument source depths
3/15/19« 0 10000000 35.833000 121 £66990 91 91 SO 9999.000000
When the editing policy "Partial Synthetic" has been selected and the edit button pressed, editProfilelsoIateO is called. The left mouse button is used to select the start and end points on an existing profile. The middle mouse button registers the end points and starts the "New Synthetic" mode for the selected range. The right mouse button cancels and quits partial synthetic mode.
When the "Store" button is selected, StoreSession() is called. This function calls storeActiveLLT() to create a pop-up dialog asking "Store in Database". When "OK" is pressed, okStoreActiveLLT() is called. This function deletes the current LLT and calls writeLLT() to ingest the new LLT into the database.
3.3.2.17 Window Operations
The window operations are applied to the current active window. The active window is indicated by a blue border around the window. Possible active windows are the "Main Chart" window, the "Profile Chart" window, or any one of the six multiview windows (See Section 3.3.2.8).
30
When the "Repaint" button is selected, repaintWindow() is called. This function clears the highlighted window of all the user graphics leaving only the profiles or the locations.
When the "Default" button is selected, returnDefault() is called. This function resets the values of the highlighted window to the values present before any changes were made by the user. The functions zoomGraphics() and drawProfileWindowGraphicsO are utilized here.
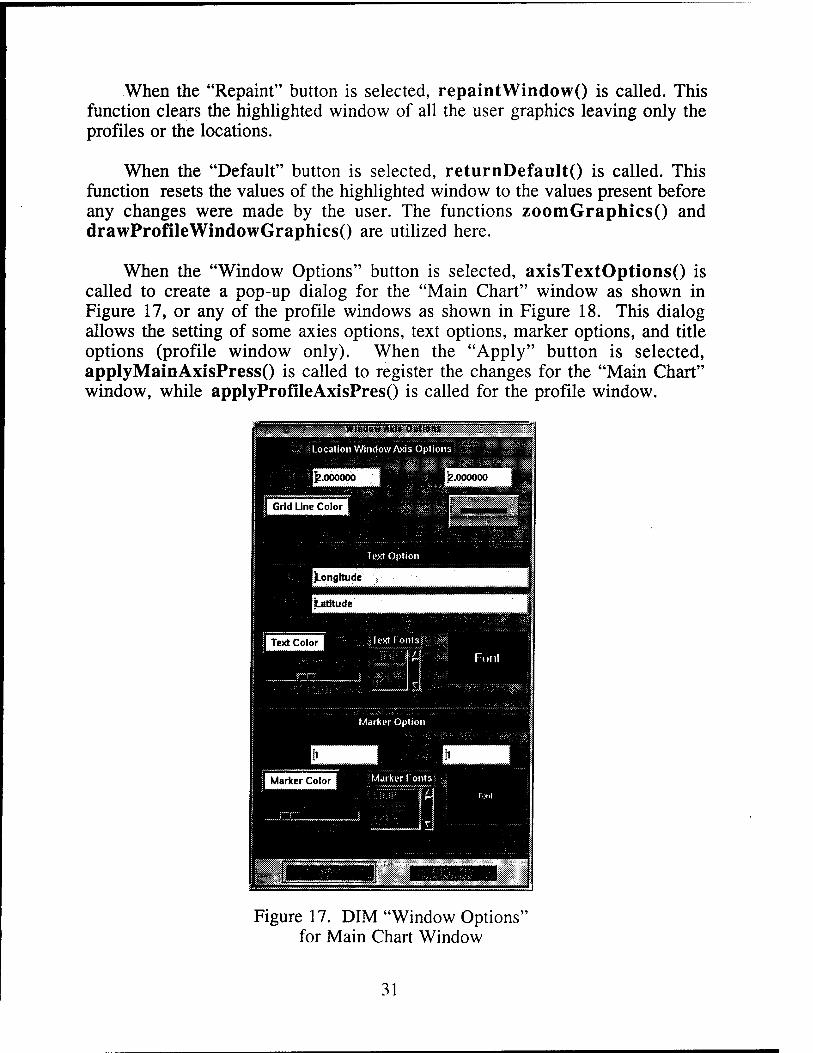
When the "Window Options" button is selected, axisTextOptions() is called to create a pop-up dialog for the "Main Chart" window as shown in Figure 17, or any of the profile windows as shown in Figure 18. This dialog allows the setting of some axies options, text options, marker options, and title options (profile window only). When the "Apply" button is selected, applyMainAxisPressO is called to register the changes for the "Main Chart" window, while applyProfileAxisPresQ is called for the profile window.
:WIWaw*ktt Ortfttt*;
Figure 17. DIM "Window Options" for Main Chart Window
31
pwiii'f mmmmmv""'::_ ' 1»
| Jjiooooooo(jo.oooooo
J JfrS.000000 J JfWO.OOOOOO
1 IN 1 1 c 1 s 1 HlTempv» Depth|
■j Title Color 1 DBS Ml Ml MSB Sill
III Tin« ■II;.:", ;■'.—~ —;—a-.".-! — ™
f
Figure 18. DIM "Window Options" for Profile Chart Window
When the "Last Polygon" button is selected, lastPolygon() is called. This function calls repaintWindow() first to clear the window of any polygons and other user graphics. Then depending on which window is selected, the last drawn polygon is drawn by obtaining the values from the BACKUP structure.
When the "ErasePoly" button is selected, erasePolygon() is called to erase any polygon from the window.
When the "PlotEnhance" button is selected, plotEnhance Process() is called. Memory is first allocated to the PLOT_ENHANCEMENT data structure and it is initialized. The "Enhancement Dialog" is then created and displayed. Pixel width and pixel height can be set here. Selecting the "Apply" button executes applyEnhance(). This function checks for the validity of the pixel width and height and calls createEnhanceWindow() to draw the enhancement plot. The function drawEnhancePlotQ does the actual plotting. When the
32
mouse button is clicked on the enhancement drawing window, exitEnhance Window() is called to exit the plot enhancement drawing area window. When the "Dismiss" button is selected, exitEnhance() is called to free the memory and exit from the "Enhancement Dialog".
When the "RepaintAll" button is selected, repaintAH() is called. Like repaintWindow(), this function also clears, from all visible windows, all the polygons and other user graphics.
4.0 NIDAS DATA
NIDAS retrieves data from the NIDAS database except for the user configuration file. The user configuration file is located in the NIDAS installation in a file named nidasConfig.def. There are no other data file requirements for NIDAS. The NIDAS database is described in Appendix C and the configuration file is described in Appendix G.
5.0 REQUIREMENTS TRACEABILITY
Functional requirements (NFR) and design requirements (NDR) have been defined for NIDAS. NFR/NDR requirements are also indicated in subsections for cross-reference and traceability. CSC responsibility for achieving each NFR and NDR are indicated parenthetically in the following descriptions for each NFR and NDR.
5.1 NIDAS Function Requirements (NFR)
NFR1: Operate in an interactive manner, i.e., displays must be interactive. (GUI1, GUI2, DRM, DIM)
NFR2: Provide overlay capability for several different types of ocean, and meteorological data. (GUI2)
NFR3: System must be able to manipulate overlays of various data types. (DRM)
NFR4: Access to Regional Bathymetry. (DRM) NFR5: Access to Coastlines/Shorelines. (DRM) NFR6: Access to Regional LLT. (DRM) NFR7: Access to Regional VOLUME. (DRM) NFR8: Access to Regional IMAGE. (DRM) NFR9: Top Level GUI must display the global coastline, and a list of
selectable regions. (GUI1) NFR10: Top Level GUI must have zoom capability. (GUI1) NFR11: Selectively evaluate and/or edit environmental data. (DRM/DIM)
33
NFR12: Selectively retain subsets of environmental data after evaluation and/or editing procedures have been performed. (GUI2)
NFR13: Main Chart must display data distribution points (profile locations), contoured data fields, coastlines, bathymetry contours, and images (satellite data). (DRM/GUI2)
NFR14: Main Chart must support construction and overlay of polygons. (DIM/GUI2)
NFR15: Profiles on Main Chart must be viewable on envelope or inside envelope. (GUI2)
NFR16: Main Chart and Profile Composite Chart must have zoom capability. (DIM/GUI2)
NFR17: Toggle between temp, sal, sound spd, density, and conductivity in Profile Composite Chart. (GUI2)
NFR18: Create synthetic temp or sal profiles in Profile Chart. (DIM/ GUI2)
NFR19: Draw corresponding salinity profiles for temperature profiles displayed on Profile Composite Chart. (GUI2)
NFR20: System must be able to export selected profiles. (DRM) NFR21: System must provide for interpolation of displayed data.
(GUI2/DIM)
5.2 NIP AS Design Requirements fNDR)
NDR1: NIDAS must operate as a stand-alone system. (CSCI) NDR2: NIDAS must operate within the UNIX operating system
environment. (CSCI) NDR3: NIDAS must execute within the X-Windows client-server model.
(CSCI) NDR4: Windows displays must incorporate the Open Software
Foundation (OSF) Motif Widget Library. (CSCI) NDR5: There must be a relational database management system (rdbms)
specifically for NIDAS utilization. (DRM) NDR6: NIDAS must include an internal link to the rdbms for data
retrieval. (DRM) NDR7: Ingestion of data into the rdbms will be accomplished by software
external to NIDAS NDR8: Zoom capability for NIDAS Main Chart must replace enlarged
display within Main Chart window; i.e. No pop-up windows for enlarged area. (GUI2/DIM)
34
APPENDIX A
GLOSSARY OF TERMS
Charter - An interpolation module that creates a contour.
Computer Software Configuration Item (CSCI) - a software application or a major component thereof.
Computer Software Component (CSC) - a top level functional module within a computer software configuration item (CSCI). CSC's are generally considered to be one structural level below the CSCI.
Computer Software Unit (CSU) - low level software modules, usually at the function or subroutine level that perform specific functions within a CSC.
Data Interactive Module (DIM) - NIDAS module that performs data manipulation functions and processing required for display and interpretation of data.
Data Retrieval Module (DRM) - NIDAS module responsible for identifying, obtaining, and formatting data obtained from the NIDAS (NEONS) database.
Graphical User Interface (GUI) - NIDAS module responsible for interfacing with the user and controlling the functionality of the top level and main NIDAS display.
Pixmap - "... is a window like structure memory in which graphics are drawn." This graphics can be copied to the window.
Project Area - An area of interest identified by a minimum and maximum latitude and longitude.
Widget - "... a graphic device capable of receiving input from the keyboard and the mouse and communicating with an application or another widget by means of a callback. Every widget is a member of only one class and always has a window associated with it."
A-l
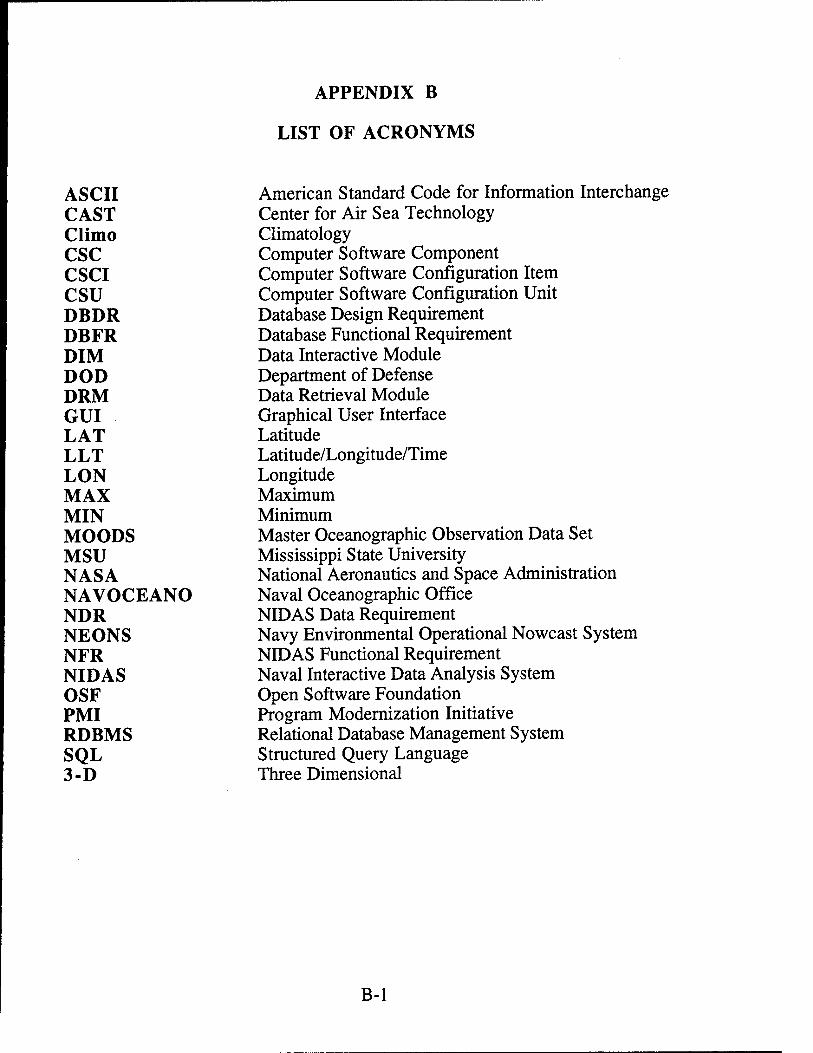
APPENDIX B
LIST OF ACRONYMS
ASCII CAST Climo CSC CSCI CSU DBDR DBFR DIM DOD DRM GUI LAT LLT LON MAX MIN MOODS MSU NASA NAVOCEANO NDR NEONS NFR NIDAS OSF PMI RDBMS SQL 3-D
American Standard Code for Information Interchange Center for Air Sea Technology Climatology Computer Software Component Computer Software Configuration Item Computer Software Configuration Unit Database Design Requirement Database Functional Requirement Data Interactive Module Department of Defense Data Retrieval Module Graphical User Interface Latitude Latitude/Longitude/Time Longitude Maximum Minimum Master Oceanographic Observation Data Set Mississippi State University National Aeronautics and Space Administration Naval Oceanographic Office NIDAS Data Requirement Navy Environmental Operational Nowcast System NIDAS Functional Requirement Naval Interactive Data Analysis System Open Software Foundation Program Modernization Initiative Relational Database Management System Structured Query Language Three Dimensional
B-l
APPENDIX C
THE NIDAS RELATIONAL DATABASE MANAGEMENT SYSTEM (RDBMS) SPECIFICATION
NIDAS accesses a NEONS database created specifically to support the CSCI. The database exists as a dedicated external and independent element of the system. Data ingestion into the database is also accomplished independently of NIDAS. NIDAS queries the database and retrieves requested data from it by calling NEONS software library functions. NEONS provides a data model for all generic data types that are required by NIDAS. These data types support the following operational datasets:
• Bathythermograph observations in standard format (lit) • Volume • Coastlines (geographical) • LLT • Satellite imagery (image)
Each dataset can be retrieved by the following parameters:
• Coastline - Specify the resolution (1,3,8, or 20 km) • LLT - lat, Ion, time, month, water depth, parameter, source,
instrument, classification, cruise id
Further information about NEONS, its structure and use is available in the NEONS design document ("Database Design Document for the Naval Environmental Operational Nowcast System", Version 3.5).
C-l
APPENDIX D
FUNCTIONAL AND DESIGN REQUIREMENTS FOR THE NIDAS RELATIONAL DATABASE MANAGEMENT SYSTEM (RDBMS)
DATABASE FUNCTIONAL REQUIREMENTS (DBFR):
DBFR1: Database must be capable of data retrieval. DBFR2: Data ingestion into the rdbms is to be accomplished external to NIDAS
as data becomes available using automated process (crontab, etc.). DBFR3: Data resident in the rdbms to include the last four past versions (at a
minimum) in addition to the current dataset in a revolving data pool.
DATABASE DESIGN REQUIREMENTS (DBDR):
DBDR1: RDBMS engine must be Oracle. DBDR2: RDBMS model must be the Naval Environmental Operational Nowcast
System (NEONS) Version 3.1.1, or later. DBDR3: Database must be compatible with NAVOCEANO Program
Modernization Initiative (PMI) of 26 January 1993.
D-l
APPENDIX E
THE NIDAS DEVELOPMENT ENVIRONMENT
NID AS has been developed in a Sun Microsystems SparcStation Model 10 computer hardware environment. The operating system was SunOS version 4.1.3, including the resident SUN C compiler which was used to write the NIDAS software code. Some minor elements of NEONS have been written FORTRAN77 (Sun FORTRAN77 version 1.4). Graphics support is provided by UNIRAS ag/X Toolmaster version 6v3b. The RDBMS engine is Oracle 7.1.x. The windowing environment consists of X-Windows version XI1 R5 and the OSF Motif widget set version 1.3.
E-l
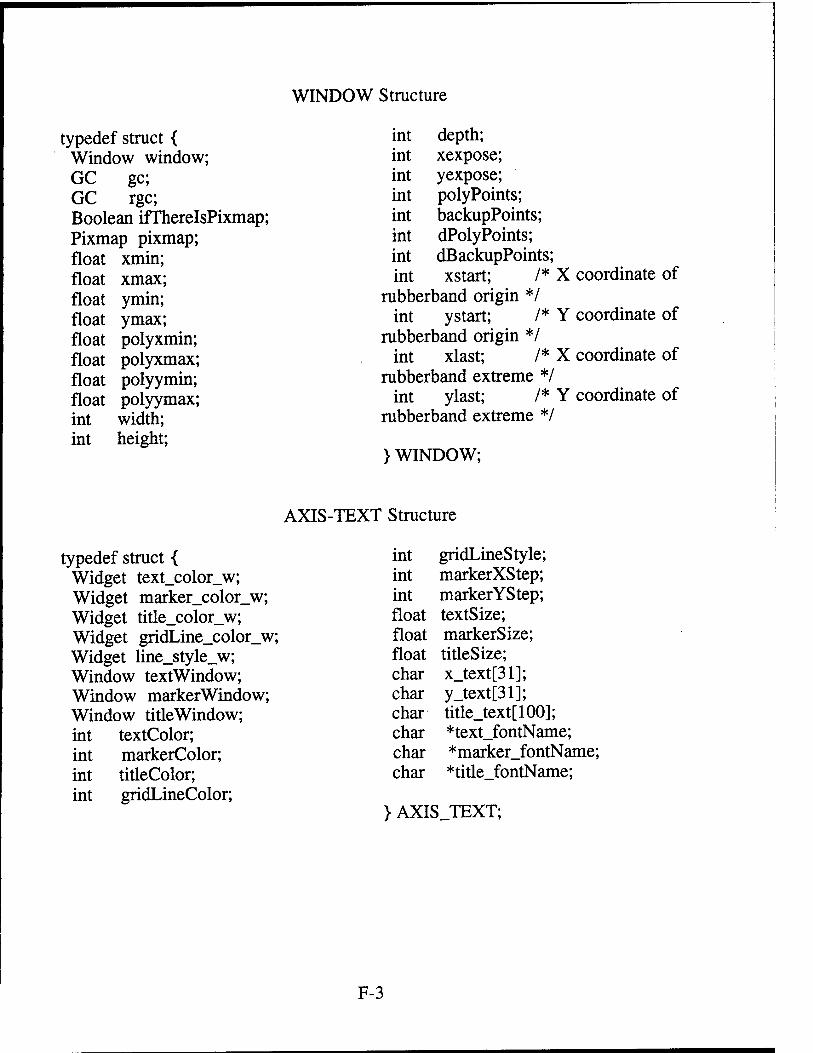
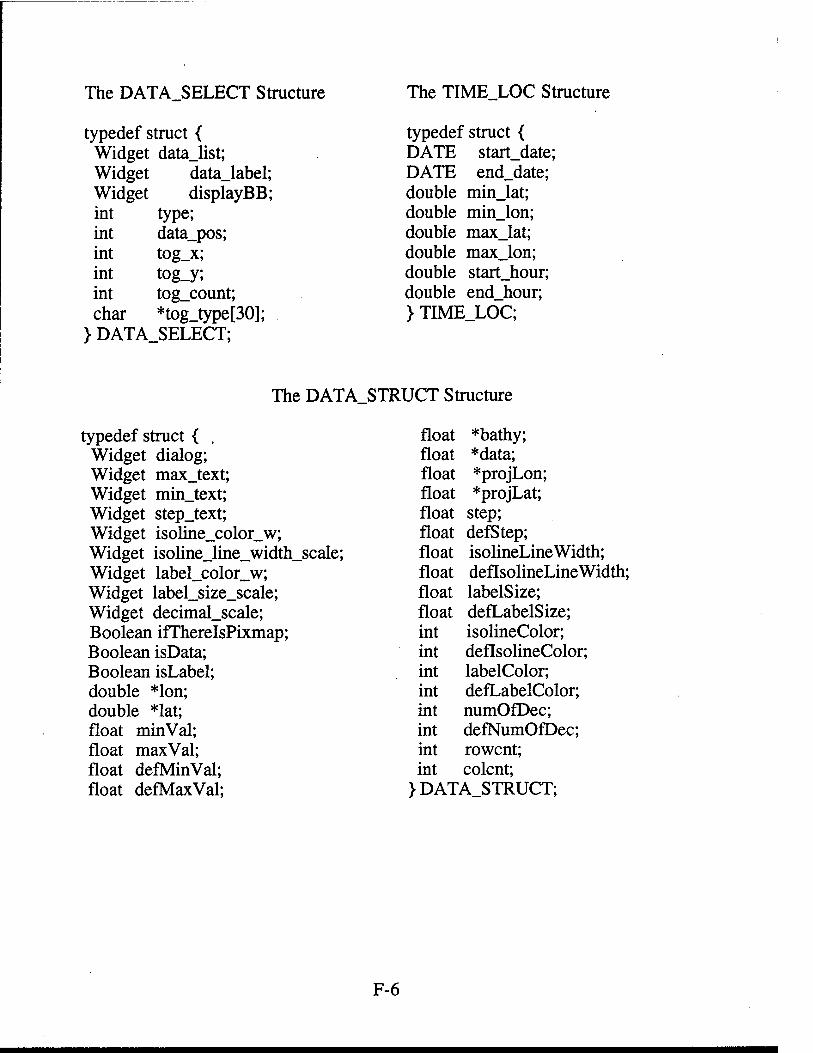
APPENDIX F
NIDAS STRUCTURES
A C structure is a collection of data variables, pointers or other structures grouped together for the convenience of using a single variable name to reference or identify the whole group. The use and behavior of structures is covered in any C programming language textbook.
The NIDAS structure is a collection of 21 pointers to subordinate structures that comprise the critical data framework of the NIDAS application. The NIDAS structure is defined as follows:
float polyLineWidth; float defPolyLineWidth; float polyDotSize; float defPolyDotSize; float isolateLineWidth; float deilsolateLineWidth; float isolateDotSize; float deflsolateDotSize; int color; int defColor; int polyColor; int defPolyColor; int isolateColor; int deflsolateColor; int profile_count; int *profile_array; int *color_array; int defLevelPos; int levelPos;
typedef struct { char dates[MAX_DATES][15]; Widget sep_tog; int num_days; Widget datejist; float freddy; Widget color_w; int color; Boolean ifTherelsPixmap; int defColor; Boolean isData; Boolean sepColors; char date[15]; }FRONT_STRUCT;
The LLT_REG_HEADER Structure
typedef struct { int lvl_cnt; double minLat; float *lon; double maxLat; float *lat; double minLon; float *lvl_val; double maxLon; float pack_null; double defMinLat; Boolean ifTherelsPixmap; double defMaxLat; Widget dialog; double defMinLon; Widget min_toggle; double defMaxLon; Widget max_toggle; long minParm; Widget parm_scale; long maxParm; Widget vrsn_toggle; long defMinParm; Widget latjext; long defMaxParm; Widget lon_text; char *vrsnName[12]; Widget min_lat_text; char minDate[15]; Widget max_lat_text; char maxDate[15]; Widget min_lon_text; char defMinDate[15]; Widget max_lon_text; char defMaxDate[15]; Widget min_time_text; int vrsnCnt; Widget max_time_text; int parm; Widget min_parm_text; int numOfProfiles; Widget max parm text; int selection_type; } LLT_REG_HEADER;
F-8
The LLT OPT HEADER Structure
typedef struct { int dayl_color; int day2_color; int day3_color; int defDayl Color; int defDay2Color; int defDay3Color; int dayl; int day2; int day 3; int defDayl; int defDay2; int defDay3; int centerDate; int sstColor; int defCenterDate; int defSstColor; int poly 1 Color; int poly2Color; int poly3Color; int defPolyl Color; int defPoly2Color; int defPoly3Color; int isolateColor; int deflsolateColor; int profile_count; int *profile_array; int *color_array; float minsst; float maxsst; float lineWidth; float dotSize; float polyLineWidth;
typedef struct { long minClass; long maxClass; long minlnst; long maxlnst; long minSource; long maxSource; long minMonth; long maxMonth; long minWdepth; long maxWdepth; long minCruise; long maxCruise; int month; int defMonth; Widget class_list; Widget instjist; Widget source_list; Widget month_list; Widget cruise_id_text;
Widget opt_dialog; Widget image_list; Widget min_text; Widget max_text; Widget step_text; REG_GEOM geom; unsigned short *sbuff; unsigned short *newlmage; int rowcnt; int colcnt; int minPixel; int maxPixel; double min_lon; double max_lon; double min_lat; double max_lat;
} IMAGE_STRUCT;
F-ll
The COLOR STRUCT Structure
typedef struct { unsigned long colors[NUM_OF_COLOR]; unsigned long black; unsigned long white; unsigned long blue; unsigned long whiteyellow; unsigned long skyblue;
unsigned long tan; unsigned long cyan4; unsigned long bluegrey; unsigned long bluesteel; unsigned long blueblack; unsigned long whitegreen;
}COLOR_STRUCT;
The VERT_XSEC_STRUCT Structure
typedef struct { Widget transectDialog; Widget spacing_w; Widget min_depth_w; Widget max_depth_w; Widget interval_w; Boolean isData; int num_poly_pts; int iend; int type; int lvl_cnt; int rowcnt; int colcnt; char parm_name [31]; float pt_lon[2];
typedef struct .NIDASZOOMDIALOG { int startx; /* X grid coordinate of first zoom corner */ int starty; /* Y grid coordinate of first zoom corner */ int endx; /* X grid coordinate of second zoom corner */ int endy; /* Y grid coordinate of second zoom corner */ float xmin; float xmax; float ymin; float ymax; Boolean zoomOnly; Boolean overlay;
} NIDASZOOMDIALOG;
The SYNTHETIC_PROFILE Structure
typedef struct _SYNTHETIC_PROFELE { int synPoints; int numOfSynPoints; float synxarr[MAX_EDIT_POINTS]; float synyarr[MAX_EDIT_POINTS];
[MAX_SYN_POINTS]; float Ion arr[MAX POINTS]; float lat_arr[MAX_POINTS]; int poly Points; int backupPoints; char fileName[51]; float Ion; float lat; int year; int month; int day; float hour; int lprov; int ireg;
} SYNTHETIC_STRUCT;
F-14
The VOLUME TYPE STRUCT Structure
typedef struct { VOL_STRUCT **volStruct; NAME_STRUCT *vol_names; int num_vol;
} VOLUME_TYPE_STRUCT;
The LLT TYPE STRUCT Structure
typedef struct { LLT_STRUCT **UtStruct; NAME_STRUCT *llt_names; int num_llt;
} LLT_TYPE_STRUCT;
The LINE TYPE STRUCT Structure
typedef struct { FRONT_STRUCT **lineStruct; NAME_STRUCT *line_names; int num_line;
} LINE_TYPE_STRUCT;
The IMAGE_TYPE_STRUCT Structure
typedef struct { IMAGE_STRUCT **imageStruct; NAME_STRUCT *image_names; int num_image;
} IMAGE_TYPE_STRUCT;
F-15
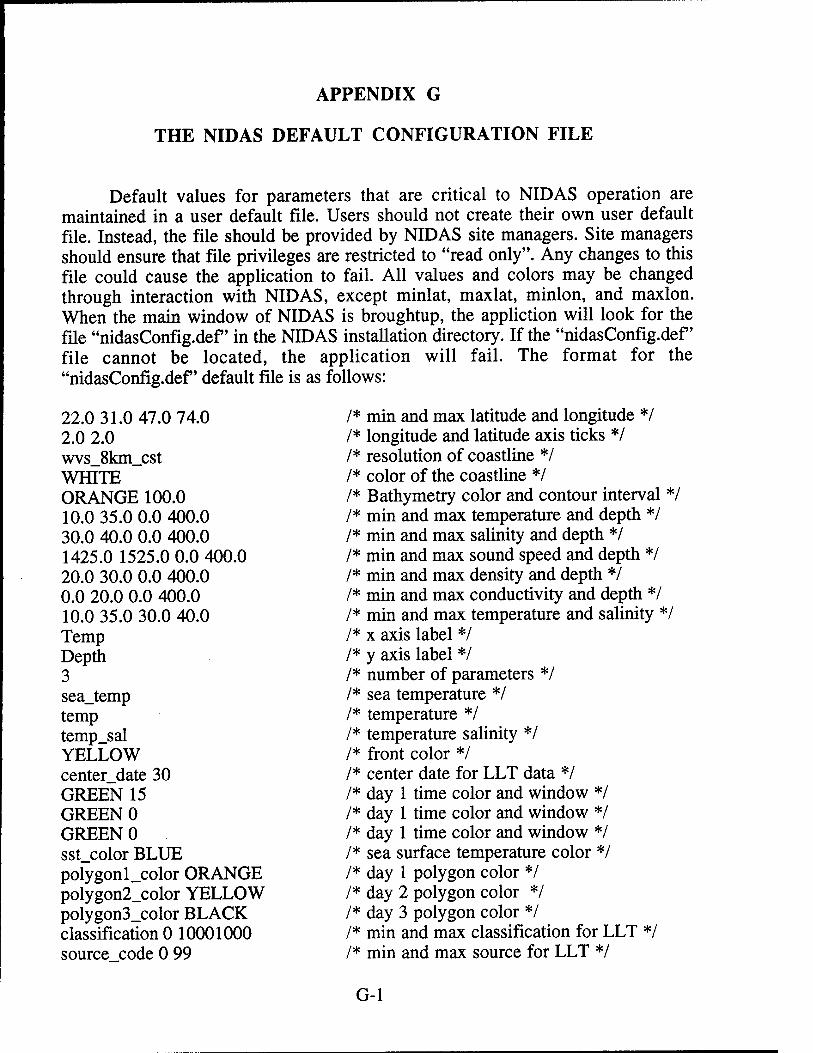
APPENDIX G
THE NIDAS DEFAULT CONFIGURATION FILE
Default values for parameters that are critical to NIDAS operation are maintained in a user default file. Users should not create their own user default file. Instead, the file should be provided by NIDAS site managers. Site managers should ensure that file privileges are restricted to "read only". Any changes to this file could cause the application to fail. All values and colors may be changed through interaction with NIDAS, except minlat, maxlat, minion, and maxlon. When the main window of NIDAS is broughtup, the appliction will look for the file "nidasConfig.def' in the NIDAS installation directory. If the "nidasConfig.def file cannot be located, the application will fail. The format for the "nidasConfig.def default file is as follows:
/* min and max latitude and longitude */ /* longitude and latitude axis ticks */ /* resolution of coastline */ /* color of the coastline */ /* Bathymetry color and contour interval */ /* min and max temperature and depth */ /* min and max salinity and depth */ /* min and max sound speed and depth */ /* min and max density and depth */ /* min and max conductivity and depth */ /* min and max temperature and salinity */ /* x axis label */ /* y axis label */ /* number of parameters */ /* sea temperature */ /* temperature */ /* temperature salinity */ /* front color */ /* center date for LLT data */ /* day 1 time color and window */ /* day 1 time color and window */ /* day 1 time color and window */ /* sea surface temperature color */ /* day 1 polygon color */ /* day 2 polygon color */ /* day 3 polygon color */ /* min and max classification for LLT */ /* min and max source for LLT */
/* min and max instrument for LLT */ /* min and max months for LLT */ /* min and max cruise number for LLT */ /* min and max parameters for LLT */ /* min and max water depth for LLT */ /* VOLUME level to be plotted */ /* otis output file */ /* gdem output file */ /* moods output file */ /* goods output file */ /* volume output file */ /* polygon output file */ /* modas temp output file */ /* modas salinity output file */ /* modas sound speed output file */ /* NIDAS temp output file */ /* NIDAS salinity output file */ /* NIDAS sound speed output file */
G-2
APPENDIX H
NIDAS REGION CONFIGURATION SYSTEM DESIGN
1.0 SYSTEM OVERVIEW
The NIDAS Region Configuration System (NRCS) is a tool that provides facilities for defining geographical regions. NRCS also provides for defining different environmental data types and formats for each defined region. The following sections describe in detail the design of the tool and its functionality. NRCS has to be used to setup project areas and datasets prior to ingesting data and using NIDAS.
2.0 MAIN WINDOW GRAPHICAL USER INTERFACE (GUI)
2.1 Components
Figure 1 displays the main window Graphical User Interface dialog of NRCS. The main components of the dialog are project area list, dataset list, globe map, menu bar, function buttons, and remark area. The project area list contains a list of project areas previously defined. The dataset list contains a list of datasets previously defined. The globe map allows for the selection of any region of the globe with the aid of the mouse. The function buttons allow certain operations to be performed for any project area and/or dataset selected. These functions are project area information, dataset information, add project area, add dataset, delete dataset, delete project area, and zoom. The remark area displays the current status of any user interaction with the tool.
2.2 Functionality
The NRCS Main Window GUI design employs the X, Motif, and UNIRAS ag/X Toolmaster libraries. Input to the NRCS top level window GUI is via the REGIONJNFO data structure. The function allocMemoryO is called to allocate memory for the NRCS FRONT_PAGE data structure, while initFrontPage() initializes the FRONTJPAGE data structure. The function getColorPixel() gets the pixel value of specified colors. The function createFrontPage() creates the layout for the NRCS main window. Within this function, createPulldown() creates the menu_bar. The function createGIobeMapO creates the globe map and its components.
H-l
r^ig"«l«t1"»- äm&m®"&?" 2W^"VSrV'^,>',",XWMmmm
Figure 1. Illustration of the NRCS Main Window Graphical User Interface (GUI) Display Screen.
The function getRegionInfo() retrieves a list of predefined project areas from the database and lists them in the project area list. The function brwsProjectAreaO is called when a selection is made on the project area list to register the selection. The appropriate functions are called from within to draw the rectangle across the selected region in the globe. The function getDatasetList() is called from within this function to retrieve all the datasets available for the selected project area. Latlon2Cursor(), Cursor2LatLon(), and Zoom Cursor2Latlon() are associated with transforming values between the xy coordinates of the cursor and the latitude/longitude values and vice versa. Latlon2Map() is called to transform the latitude/longitude values into a rectangle across the region in the globe.
H-2
2.2.1 File Pulldown Menu
The menu-bar "File" button displays a reset and an exit option. The "Reset" option calls resetMapO to erase any user selected project area and also erase the resulting rectangle drawn across the selected project area in the globe map. The "Exit" option calls exitRegAnalysis() to free widget memory and exit from the application.
2.2.2 Function Buttons
The function buttons are composed of the following buttons: 1) Project Area Information, 2) Dataset Information, 3) Create Project Area, 4) Create Dataset, 5) Delete Project Area, 6) Delete Dataset, and 7) Zoom.
2.2.2.1 Project Area Info
When the Project Area Info button is selected, setupRegionlnfoO is called. This function checks if a project area is selected and then allocates memory for the nrcs REGIONJNFO data structure. The function initRegionCreate() initializes the REGIONJNFO data structure and regionInfo() is then called to create and display the "Project Area Info" dialog as shown in Figure 2. This dialog displays information such as name of the project area, area description, the creator of the project area, date the project area was created, the project name, and classification of the project area. The function retrieveRegionlnfoO is called to retrieve these information for the selected project area from the database and display them. The button "Geoglnfo" when selected will call setupGeogInfo() to allocate memory for the NRCS GEOGLOC JNFO data structure and to initialize the structure. The function geoglnfoO is then called from within to create and display the "Project Boundary Info". This dialog displays min/max latitude and longitude values. The function displayGeogValuesO is called to retrieve and display these values.
2.2.2.2 Dataset Info
When the Datasetlnfo button is selected, setupDsetInfo() is called. This function checks if a dataset is selected and then allocates memory for the NRCS DATASET JNFO data structure. This structure is initialized by initDsetInfo(). The function datasetInfo() is called to create and display the "Dataset Information" dialog, as shown in Figure 3. This dialog provides information such as dataset name, classification, type, dataset creator, description, and date created. The function getDsetInfo() is called to retrieve and display these values. The "Details" and Options" buttons provide greater details on the dataset based on data type (LLT, Volume, Bathymetry, or Image).
H-3
m^^^9»9S^M^w^^i^m)
Wmm'' SHI'"
Figure 2. Project Area Info Dialog
2.2.2.2.1 LLT
When the "Details button is selected, addDisplayDelDset() is called to display detailed information about the dataset. For the LLT data type, HtDatalnfoO is called to create and display the "LLT Data Information" dialog. This dialog displays information such as range, color, and polygon color for three time range subsets and location, profile, and depth flags. The function getLltInfo() retrievels and displays the required information. There are no "Options" for LLT.
H-4
sss
¥MWW»I«^^
X^xit
Figure 3. Dataset Information Dialog
2.2.2.2.2 Volume
When the "Details" button is selected, addDisplayDelDset() is called to display detailed information about the dataset. For the Volume data type, volDatalnfoO is called to create and display the "Volume Data Information" dialog. This dialog displays information such as climatology flag; min/max latitude and longitude; north-south resolution; east-west resolution; row count; column count; depth count; depth values; and input grid flag. When the "InputGrid" button is selected setupVoIVrsns() is called to create and display the "Versions" dialog. This dialog displays a list of versions for the currently selected volume dataset which can be selected as input for the LLT data type. The function getVolInfo() retrieves and displays the required information.
When the "Options" button is selected for the Volume data type, addDelDisplayOptionsO is called to create and display the "Volume Data Information" options dialog. This dialog displays information such as minimum, maximum, contour interval, transect min/max; and color. The function getVolInfoQ retrieves and displays the required information.
H-5
2.2.2.2.3 Bathymetry
When the "Details" button is selected, addDispIayDelDset() is called to display detailed information about the dataset. For the Bathymetry data type, bathyDatalnfoO is called to create and display the "Bathy Data Information" dialog. This dialog displays information such as min/max latitude and longitude; row count; column count; and horizontal resolution. The function getBathylnfoO retrieves and displays the required information.
When the "Options button is selected for the Bathymetry data type, addDelDispIayOptionsO is called to create and display the "Bathy Data Information" options dialog. This dialog displays information such as minimum, maximum, contour interval; and color values. The function getBathylnfoO retrieves and displays the required information.
2.2.2.2.4 Image
When the "Details" button is selected, addDisplaydelDset() is called to display information about the dataset. For the Image data type, imageData Info() is called to create and display the "Image Data Information" dialog. This dialog displays information such as satellite name, sensor name, and band. The function getlmagelnfoO retrieves and displays the required information.
When the "Options" button is selected for the Image data type, addDelDispIayOptionsO is called to create and display the "Image Data Information" options dialog. This dialog displays information such as minimum, maximum, and contour interval. The function getlmagelnfoO retrieves and displays the required information.
2.2.2.3 Project Area Create
When the Project Area Add button is selected, setupRegionCreate() is called. This function allocates memory for the NRCS REGION_INFO data struc- ture and calls initRegionCreate() to initialize it. The function regionInfo() is then called to create and display the "Project Area Create" dialog similar to the "Project Area Info" dialog shown in Figure 2. The button "Geoglnfo" when selected will call setupGeogCreate() to allocate memory for the NRCS GEOGLOC_INFO data structure and to initialize the structure. The function geoglnfoO is then called from within to create and display the "Project Boundary Create". The dialog will allow for specifying the min/max latitude and longitude values. If the specified values are out of bounds, then the default values are assigned. When the "Add" button is selected, addNewRegion() is called. The coordinates of the project area are first checked and then insAnalysisRegO is called to create a new project area and store the information in the database.
H-6
2.2.2.4 Dataset Create
When the AddDataset button is selected, setupDsetCreate() is called. This function checks if a project area is selected and then allocates memory for the NRCS DATASETJNFO data structure. This structure is initialized by initDset Info(). The function datasetlnfoO is called to create and display the "Dataset Add" dialog similar to the "Dataset Info" dialog shown in Figure 3. The dataset type can be set by selecting any type from the pop-up menu which appears when the "DataType" button is selected. When a particular data type is selected from the pop-up menu showDataDialogO is called to display the selected data type dialog. Memory is allocated by calling allocDataStruct(). The function addDisplayDel Dset() then calls the appropriate function, depending on the data type, to bring up the editing dialog. The editing dialog for each dataset is similar to the "Dataset Info" dialogs discussed in Sections 2.2.2.2.1 through 2.2.2.2.4.
2.2.2.5 Project Area Delete
When the Project Area Delete button is selected, setupRegionDelete() is called. This function checks if a project area is selected and then allocates memory for the nrcs REGION_INFO data structure and the GEOG_LOC data structure. The function initRegionCreate() initializes the REGIONJNFO data structure and regionlnfoO is then called to create and display the "Project Area Delete" dialog similar to the "Project Area Info" dialog shown in Figure 2, with the excep- tion of a "Delete" button. Selecting the "Delete" button will call deleteRegionO to delete the project area. This function first deletes any datasets defined in the project area and then deletes the project area. The database function delAnalysisRegO is called to execute the delete.
2.2.2.6 Dataset Delete
When the DelDataset button is selected, setupDsetDelete() is called. This function checks if a dataset is selected and then allocates memory for the NRCS DATASETJNFO data structure. This structure is initialized by initDsetInfo(). The function datasetlnfoO is called to create and display the "Dataset Delete" dialog similar to that of the "Dataset Information" dialog shown in Figure 3, with the exception of a "Delete" button. Selecting the "Delete" button will call delDatasetO to delete the selected dataset and the associated information. The database functions are used for this purpose. For BATHY dataset, delBathylnfoO is called. For VOLUME, deIVolDataset() is called. For IMAGE, delLImagelnfoO is called. For LLT, delLltInfo2() is called.
If the dataset type is VOLUME and if the dataset is also a base input grid for LLT, then warnForOutputGrid() is called to display a confirmation dialog. Selecting OK will call delVolDataset() to complete the delete.
H-7
2.2.2.7 ZOOM
When the "Zoom" button is activated, setupZoom() is executed. This function creates the zoom dialog and registers the required functions. The function initZoomRubberBandQ initializes the rubber band data structure while zoom DataDialogO sets the various coordinates. The function zoomDrawingPress() is activated when the user clicks the left mouse button on the globe map to start drawing a rectangle. The function zoomDrawingMotion() is activated when the user drags the mouse across a region in the map. The function zoom DrawingReleaseO is activated when the user releases the left mouse button to complete the drawing of the rectangle across the region to be zoomed and also produce a pop-up dialog containing the outline of the zoomed region. The zoomed area can be used to define the min/max latitude and longitude values for a new project area.
H-8
APPENDIX I
DATABASE ADMINISTRATOR TOOLS DESIGN
1.0 SYSTEM OVERVIEW
The Database Administrator Tools (DBA Tools) application is a tool that provides facilities for performing various database administrative functions for NIDAS. Among the facilities provided are database access control, table maintenance, and data maintenance such as inventory, delete, and ingest. The following sections describe in detail the design of the tool and its functionality.
2.0 MAIN WINDOW GRAPHICAL USER INTERFACE (GUI)
2.1 Components
Figure 1 displays the main window Graphical User Interface dialog of DBA Tools. The main components of the dialog are project area list, globe map, menu bar, and remark area. The project area list contains a list of predefined project areas. The globe map allows for visual of location of the pre-define project area. The remark area displays the current status of any user interaction with the tool.
2.2 Functionality
The DBA Tools Main Window GUI design employs the X, Motif, and UNIRAS ag/X Toolmaster libraries. Input to the Dba Tools top level window GUI is via the DBAT data structure. The function allocMemoryO is called to allocate memory for the DBAT data structure and its sub structures, while initMainScreen() initializes the DBAT data structure. The function getColorPixelO gets the pixel value of specified colors. The function createMainScreen() creates the layout for the Dba Tools main window. Within this function, AclGetUserInfo() retrieves the various access permissions of the user currently logged. If the table containing the access information is empty then this table is initialized with the DBA access information via AclAddNewUser(). If the table does not contain information pertaining to the user currently logged then the error message "User not authorized to use dbatool. Check with dba." is displayed and the application exits.
The function createPulldown() creates the menu_bar, while createGlobeMapO creates the globe map and its components. The function getRegionlnfoO retrieves a list of predefined project areas from the database and lists them in the project area list. The function brwsProjectArea() is called when a selection is made on the project area list to register the selection. This
1-1
function calls UpdateRegion() to draw the rectangle across the selected region in the globe and dataForm() to create and display the "DATA SELECTION" dialog shown in Figure 2.
Figure 1. Illustration of the Dba Tools Main Window Graphical User Interface (GUI) Display Screen
The database function getDataTypeList() is called to retrieve and display a list of data types available for the project area in the "DATA TYPE" list. When a data type is selected from this list, typeBrws() is called to retrieve and display the list of datasets in the "DATASET" list that is available for the project area and the data type selected. The function dataBrws() is called when a selection is made in the "DATASET" list. The function grayIn_Menu() is called to sensitize the "TableAdmin", and the "DataAdmin" buttons of the menu bar. When the "Dismiss" button is selected, dismissDataPressQ is called to exit from the dialog.
1-2
Figure 2. Data Selection Dialog
The function grayOut_Menu() is called from brwsProjectArea() to desensitize the "DBaseAdmin", "TableAdmin", and the "DataAdmin" buttons of the menu bar. Latlon2Cursor(), and Cursor2LatLon(), are associated with trans- forming values between the xy coordinates of the cursor and the latitude/longitude values and vice versa. Latlon2Map() is called to transform the latitude/longitude values into a rectangle across the region in the globe. The menu-bar contains the following options: File, DBase Admin, Table Admin, Data Admin, and Help.
2.2.1 File Pulldown Menu
For the file pulldown, the options available are "Reset" and "Exit". The "Reset" option calls resetMapO to erase any user selected project area and also erase the resulting rectangle drawn across the selected project area in the globe map. The "Exit" option calls quitTools() to exit from the application.
2.2.2 DBASE Admin Pulldown Menu
For the dbase admin pulldown, the available option is "ACL" (Access Control List). When the "ACL" option is selected, setupAcl() is called. This function calls createAclLayout() to create and display the "ACCESS CONTROL LIST" dialog shown in Figure 3.
1-3
Figure 3. Access Control List Dialog
This dialog allows the administrator to modify the access control list by deleting a user, adding a new user, or updating an existing user's access permissions. The "Users" list in the dialog displays the list of users currently in the access list. The "Privileges" section contains toggle buttons for the various kinds of privileges. When a particular privilege is selected, getDbPrivs() is called to register the selection. The new user name is entered and when the "Add" button is selected, addNewAclUser() is called. This function first checks whether the name entered is a valid user or not. Then checkACLPermissions() is called to check for the validity of the privileges. AclAddNewUser() is then called to add the new user to the access control list.
When a user is selected from the "Users" list, brwsAclUserList() is called to retrieve the privilege information of the user. AclGetUserlnfoO is called for this purpose. Depending on the privileges, the corresponding toggle buttons are set
1-4
in the "Privileges" area. When a user is selected from the "Users" list and the "Delete" button is selected, acICheck() is called. The function deleteAclUser() is then called which checks the validity of the privileges by calling checkACL PermissionsO. The database function delAclUser() is then called to delete the user from the access control list. After selecting a user from the "Users" list and then changing the privileges, by selecting or deselecting the corresponding toggle buttons, the "Update" button is selected for updating the user's access privileges. The functions aclCheck() and updateAcIUserList() are called which checks the validity of the privileges by calling checkACLPermissions(). AclUpdate User() is then called to update the access privileges of the user. When the "Reset" button is selected, initAcl() is called to initialize the ACL data structure and clear the dialog of any user interaction. The function getAclUserNames() is then called to retrieve the list of users currently in the access control list. When the "Exit" button is selected, exitToolsOption() is called to exit from the dialog.
2.2.3 Table Admin Pulldown Menu
For the table admin pulldown, the available option is "Add Table Space". When this option is selected, setupPrimaryTbl() is called. This function first checks to see if the selected data type is of type "LLT" and then calls primaryTblLayoutO to create and display the "LLT DATA TABLES" pop-up dialog shown in Figure 4. The PrimaryTbl data structure is then initialized by calling initPrimaryTbl(). The function initPrimaryTbl() then calls getTbl Data() to retrieve and display, in a list, the table name, status, and record count of all tables for the project area. When a list item is selected, brwsTableList() is called to register the selection. The function also checks to see if the selected item's status is of type "load".
When the "Close" button is selected, closePrimaryTbl() is called. The function checks to see if a list item is selected and then closes the table by changing the status from "load" to "full". The database function changeTable() is used for this purpose. When the "Open" button is selected, openNewTable() is called. The function checks to see if the last performed user action was to close a table. The function newTblLayout() is then called to create and display the "NEW TABLE NAME" pop-up dialog which is used for entering a new table name or the suggested default name can be used. When the "Ok" button is selected, createNewTbl() is called. This function checks for the validity of the new table name and then creates the table by calling createTable() and exits from the dialog. If the "Exit" button is selected instead of "Ok", exitNewTableO is activated to exit from the dialog. Selecting the "Reset" button will activate resetPrimaryTblO which calls initPrimaryTbl() to initialize the PrimaryTbl data structure. Selecting the "Help" button will call createHelpO to create and display help dialogs. Selecting the "Exit" button will call exitTblLayout() to exit from the "LLT DATA TABLES" dialog.
1-5
JBefore opening anew table, select list JJ item with status as 'load' m<t close it
Figure 4. LLT Data Tables Dialog
2.2.4 Data Admin Pulldown Menu
For the data admin pulldown, the available options are inventory, ingest, and delete. When the "Inventory" option is selected from the data admin pulldown menu, setupInventoryO is called. This function calls createDelDataLayout() to create and display the "INVENTORY LLT FORMAT DATA" dialog. The function initDelDataStruct() initializes the delData data structure. The function brwsDelDataO is called to retrieve and display, in the "Versions" list, the available versions for the selected project area, data type, and dataset. The database functions get_Vol_Versions() (Volume), get_Im_Versions() (Image), and get_Versions() (LLT) are used for this purpose. When a particular version is selected from the "Versions" list, brwsVrsnList() is called to register the selection and then call, brwsDelDataO to retrieve and list from the database information such as id, record count, stamp time, min lon/lat, and max lon/lat for the selected version. The database functions getVolDellnfoO (Volume), get BathyDellnfoO (Bathy), getlmageDellnfoO (Image) and lin_lltDelInfo() (LLT) are called for this purpose. When the "Reset" button is selected, resetDelData() is called to clear any user selection and initialize the delData data structure by calling initDelDataStruct(). When the "Exit" button is selected, exitToolsOptionO is called to exit from the dialog.
1-6
When the "Ingest" option is selected, setuplngest() is called. This function calls createlngDataLayoutO to create and display the "INGEST LLT DATA" dialog. The function also calls initIngDataStruct() to initialize the ingestData data structure. The dialog allows the specification of the version name and the file name containing the data to be ingested. When the "Ingest" button is selected, ingestData() is called. This function checks for the presence of the version name and file name. It then checks for the user privileges by calling checkACLpermissions(). The program, with the appropriate parameters, vol_wr (Volume), or im_wr (Image), or bathy_wr (Bathy), or llt_wr (LLT) is executed to ingest the data into the database. The ingestData data structure is then initialized by calling initlngDataStructQ. When the "Reset" button is selected all the user interactions are removed by calling initlngDataStructQ. When the "Exit" button is selected, exitToo!sOption() is called to exit from the dialog.
The "Delete" option is similar to that of "Inventory" except for a "Delete" button. When an item is selected from the dataset list, brwsDelDsetList() is called to register the selection and store the id of the dataset. Selecting the "Delete" button will call deleteData() to delete the dataset from the database. The database functions delVolData_l() (Volume), delBathyData() (Bathy), dellmage Data_l() (Image) and delData() (LLT) are called for this purpose.
2.2.5 HjdB
When the "Help" button is selected, createHelpO is called to create and display help for the dialog from which the button was selected.
1-7
APPENDIX J INGESTING DATA INTO THE NIDAS DATABASE
Data ingestion is independent of NIDAS. A database administrators tool is provided for ingesting data into the database. This tool takes a data file and ingest the data into the database. The data file can be in one of three data types: Bathymetry, LLT (MOODS), Image, or Volume (3-D Grid). The format abbreviations used are as follows: F is Float, I is Integer, and A is ASCII.
BATHYMETRY
Bathymetry is in Charter format with the following format:
Parameter Format
Longitude of the West Side F Longitude of East Side F Latitude of South Side F Latitude of North Side F Grid Resolution in Minutes F Number of Columns I Number of Rows I Data (Columns*Rows in Row Major Order) F
LLT
LLT is in Master format which is a binary file with the following format:
File Header (First record in Master file)
Parameter Format Default Range File Type Al T = Temperature
S = Salinity V = Sound Speed B - Both Temperature and Salinitv
Dataset Description A60
J-l
Profile Header (At the beginning of each data record)
Parameter Format Default Jiange.
Consecutive Profile Number II 1 - Total Number Flags 18 Each of the 8 flags are
Profile 0 = True Random (MOODS or other) 1 = Gridded to Random 8 = Artificial (General) 9= Artificial (NIDAS)
Hag[5] Number of Extended Depths to Surface
Flag[6] Number of Extended Depths
to Bottom
J-2
Parameter Format Default Range Flag[7]
Temperature Only valid when File
Tvpe = B
1 - No Temperature Values in Profile (All Temperature Values
= -99) Flag[8]
Salinity
Only valid when File Tvpe = B
1 = No Salinity Values in Profile
(All Temperature Values = -99)
Latitude F -90S - 90N Longitude F -180W- 180E Province Flag (Groups profiles into Geographical Provinces')
I -999
Classification Code 17 Pattern Flag (Used in Water Mass Analvsis)
I -999
Water Mass Flag I -999 Unique Profile ID I Water Depth at Profile Location in Original MOODS Header
F -99
Water Depth at Profile Location from Bathymetry Database
F -99
Year 14 Month I 1 - 12 Dav I 1 -31 Hour F 0 - 24.99 Unique ID (Not Used) A10 Source/Instrument Code 16 The first two integers are
the instrument code and the last four integers are the source code.
Number of Data Cycles (Depths) in Original Profile
I
Number of Cycles added to Profile when Artificially Extended
I Flag[5] + Flag[6]
Extra Variable for Future use F Cruise Number 17
J-3
Profile Record (Data Record)
If File Type - T' Depth and Temperature If File Type - 'S' Depth and Salinity If File Type - 'V Depth and Sound Speed If File Type - 'B' Depth, Temperature, and Salinity The data based on File Type is repeated "Number of Data Cycles" + "Number of Added Cycles" times.
IMAGE
Image is made up of AVHRR LAC (Local Area Coverage) data and are available in "mes" files. The format of the "mes" file is as follows:
Header Record (First Record in Image File)
Parameter Columns Format Default Range
Format/Generating 1-8 A8 "SEAS V##" Software ID ## = Version number
(i.e.. 40 is 4.0) Image Classification 9 Al S U = Unclassified
R = Restricted C = Confidential S = Secret N = Secret Noforn T = Top Secret
Total Number of 256-byte 10 11 1 1-9 Header Blocks (1 + RGB Records
+ Optional Records) Date Time Group 11-24 A14 ddhhmmZMMMyy
dd = Day (0-31) hh = Hours (0-23) mm = Minutes (0-59) Z = Zulu MMM = Month (JAN-DEC) vv = Year CO-99)
Data Compression Code 25-26 A2 0 0 = No Compression DC = Discrete Cosine Transformation
J-4
Parameter Columns Format Default Range
Projection Code 27 Al M ■ Mercator P = Polar Stereographic* S - Polar Stereographic** R = Rectangular
Coordinates G = Gridded Data N = No Projection Used
* 90 Degree Tangent ** 60 Degree Tangent
Image Type Code 28 Al I = Infrared V = Visual P = PCX Blank = Neither
Number of Pixels per Row 29-32 14 640 1 -800 Number of Pixels per Column
33-36 14 480 1 -480
Number of Bits per Pixel 37-38 12 8 8 Minimum Pixel Value 39-42 14 0-255 Maximum Pixel Value 43-46 14 0-255 Temperature Reference for Minimum Pixel Value
47-52 F6.2 0.0 999 = No Cross Reference
Temperature Reference for Maximum Pixel Value
53-58 F6.2 0.0 999 = No Cross Reference
Temperature Reference 59 Al C C - Degrees Celsius F = Degrees Fahrenheit Blank = No Temperature
Reference Longitude Reference Point 1
60-69 F10.5 -180W - 180E
Latitude Reference Point 1 70-78 F9.5 -90S - 90N Image Column of Reference Point 1
79-83 15 1 1
Image Row of Reference Point 1
84-88 15 1 1
Longitude Reference Point 2
89-98 F10.5 -180W-180E
Latitude Reference Point 2 99-107 F9.5 -90S - 90N Image Column of Reference Point 2
108-112 15 1 1
Image Row of Reference Point 2
113-117 15 2 - "Number of Pixels per Column"
J-5
Parameter Columns Format üfifauli Range
Longitude Reference Point 2
89-98 F10-5 -180W- 180E
Latitude Reference Point 3 128-136 F9.5 -90S - 90N Image Column of Reference Point 3
137-141 15 "Number of Pixels per Row"
Image Row of Reference Point 3
142-146 15 "Image Row of Reference Point 2"
File Originator 147 11 l 1 = NAVO 2 = FNOC
Destination 148 11 l 1 = NODDS 2=PCSATMSG
Image Source Identifica- tion Comment
149-188 A40
EGA Palette Flag 189 11 0 0 = EGA Palette Not Included 1 = EGA Palette Included
EGA Color Palette 190-205 116 0- 15 RGB Palette Flag 206 11 0 0 - RGB Palette Not Included
Record RGB Color Values 207-254 116(3) 0-63 Undefined 255-256 A2
Red. Green. Blue (RGB) Palette Records
The RGB records containing the red, green, and blue color palettes are for the monitors operating in the 256-color mode. These records exist when the RGB palette flag is set to 2 or 3 in the header record. The 256 RGB palette will occupy three records: 256 red values, 256 green values, and 256 blue values (in that order). The 64 RGB palette will occupy only one record with three sections, each containing 64 RGB values. The remaining 64 values are undefined. The number of records in this section is included in the total number listed in the header record.
Optional Text Records
Additional text records are 256 bytes each in length. These records contain descriptive text concerning the image. The number of records in this section is in the total number list in the header record.
J-6
Image Data Record
The image pixel data follows the header and text records. It is a series of 8-bit binary integer values that can range from 0 to 255. Each byte represents an image pixel. The data structure is based on the number of pixels per row and the number of pixels per column listed in the header record. The data is organized by row such that byte 1 is the first pixel of the first row and column. The second byte is the pixel at row 1, column 2 and so on.
VOLUME
Volume is a 3-D grid designed for ocean climatologies with a single parameter (temperature OR salinity OR sound speed OR whatever). 3-D gridded model output can also use this format by interpreting the date differently. The format is as follows:
Header Record 1 (First Record in File)
Format Default Range
Grid Type (For Future Use)
I 1
Ocean Parameter Al T = Temperature S = Salinity V = Sound Speed C = Conductivity D = Densitv
Date or Season 112 Described later * Descriptive Text A20 Date Grid was Created A12 Name of Person Creating Grid A12 Number of Meaningless Depths at the Bottom
I
Classification of Grid I 0 = Public Domain 1 = Restricted 2 = Confidential 3 = Secret
Extra Variable for Future Use I Extra Variable for Future Use I Extra Variable for Future Use I Extra Variable for Future Use A20 Extra Variable for Future Use F
* Date or Season includes 12 integers, one integer per month. A 0 means that the grid does not include that month. A 1 means that the grid includes that whole month. A 2 means that the grid includes only the last two weeks of that month.
J-7
A 3 means that the grid includes only the first two weeks of that month. For example, 000000002130 - last two weeks of September through the first two weeks of November. If the first integer is a 9, then the grid is associated with a specific data and time. This is usually the case for gridded model output. In this case, the 12 integers are defined as follows:
[1] = 9 (Identifying and specific date and time) [2] = 0 (Undefined) [3] = Month [4] = Day [5] - Year (4 digits) [6] = Hour/Minutes (24 hour clock, 4 digits) [7-12] = 0 (Undefined)
Header Record 2 (Second Record in File)
Parameter Format Longitude of West Side F Longitude of East Side F Latitude of South Side F Latitude of North Side F Grid Resolution in Minutes F Number of Columns (East-West) I Number of Rows (North-South) I
Data Records (Columns*Rows)
Parameter Format Latitude of Profile Longitude of Profile Date or Season Same as in Header 1. This parameter is ignored.
112
Number of Depths in Profile to the bottom of Grid Water Depth of Profile from Bathv Grid Number of Valid Depths Extra Variable for Future use Extra Variable for Future use Extra Variable for Future use A20 Extra Variable for Future use Data (Specified in Header Record 1)
There are "Number of Depths in Profile to the bottom of Grid" number of these.
Fx
J-8
DISTRIBUTION LIST
1. Commanding Officer, Code N3211 Naval Oceanographic Office Stennis Space Center, MS 39529
2. Mr. Steve Haeger Naval Oceanographic Office, Code OOT Stennis Space Center, MS 39529
3. Technical Director, Code OOT COMNAVMETOCCOM Stennis Space Center, MS 39529
4. Oceanographer of the Navy U.S. Naval Observatory 34th and Massachusetts Avenue Washington, DC 20392
5. Space and Naval Warfare Systems Command
Code PMW175-3B 2451 Crystal Drive Arlington, VA 2245-6145
6. Defense Technical Information Center (2) 8725 John J. Kingman Road, #944 Fort Belvoir, Va 22060-6217
7. Director, Sponsored Programs Administration Mississippi State University Mississippi State, MS 39762
REPORT DOCUMENTATION PAGE Form Approved OMB No. 0704-0188
PuWIc raportlng btirdan (of thla collaetlonol Information It attlmatad to avaraga 1 hour par raaponaa, Including In« tlma lor ravlawlng Inttruotlont, aaarchtng axlatlng data aourcaa, gatharing «id maintaining tha data naadad, and computing and ravlawlng th« oollaollon o( Information. Sand eommanlt ragardlng thla burdan aitlmata or any olhar «pact ol X,,,.e<Sr!ilon °« n1
,?,^l?niLrlc'u?'no.S^Ä2I?,]lS, "«L1*1"0 "»I» byrdan,to WaaWngton Haadquartan Sarvtcaa, Olractorata lor Intormatlon Oparatlona and Raports, 1215 Jalfaraon Oavla Highway, Sulla 1204, Arlington, VA 22202-4302, and to Ina Olllca o« Managamant and Budgat, Paparwork Raduetlon Projact (0704-0188), WaaWngton, DC 20503.
1. Agency Use Only (Leave blank). 2. Report Oat«. 1 JUNE 1997
3. Report Type and Dates Covered. TECHNICAL NOTE
4. Title and Subtitle. DESIGN DOCUMENT, DATABASE SPECIFICATIONS, AND DATABASE ADMINISTRATION FOR THE NAVAL INTERACTIVE DATA ANALYSIS SYSTEM (NIDAS) VERSION 3.1
5. Funding Numbers.
Program Eltmtnt No.
Prolect No.
Task No.
Accasslon No.
6. Author».
CLIFTON ABBOTT
7. Performing Organization Name(s) and Addressees). MISSISSIPPI STATE UNIVERSITY CENTER FOR AIR SEA TECHNOLOGY STENNIS SPACE CENTER, MS 39529
8. Performing Organization Report Number.
CAST TECHNICAL NOTE 3-97
9. Sponsoring/Monitoring Agency Name(s) and Address(es).
NAVAL OCEANOGRAPHIC OFFICE CODE DOST STENNIS SPACE CENTER, MS 39529
10. Sponsoring/Monitoring Agency Report Number.
CAST TECHNICAL NOTE 3-97
11. Supplementary Notes.
RESEARCH PERFORMED UNDER NASA NAS-13-564, DELIVERY ORDERS 82 AND 96
12a. Distribution/Availability Statement.
APPROVED FOR PUBLIC RELEASE; DISTRIBUTION IS UNLIMITED
12b. Distribution Code.
13. Abstract (Maximum 200 words).
THIS TECHNICAL NOTE PROVIDES THE DESIGN DOCUMENT, DATABASE SPECIFICATION, AND DATABASE ADMINISTRATION FOR THE NIDAS VERSION 3.1 SYSTEM DEVELOPED FOR THE NAVAL OCEANOGRAPHIC OFFICE.
14. Subject Terms.
(U) NOTE (U) NIDAS (U) NAVAL (U) DATA (U) ANALYSIS (U) INTERACTION (U) NEONS (U) SYSTEM
15. Number of Pages. 84
16. Price Code.
17. Security Classification of Report.
UNCLASSIFIED
18. Security Classification of This Pag«.
UNCLASSIFIED
19. Security Classification of Abstract
UNCLASSIFIED
20. Limitation of Abstract.
NSN 754O-O1-280-5500 Standard Form 298 (Rav. 2-89) Pimcflbad by ANSI SI4. 09-1« Ka-tU