+ All Categories
Home > Documents > CENTER FOR INFRASTRUCTURE ENGINEERING...

CENTER FOR INFRASTRUCTURE ENGINEERING...

Date post: 15-Apr-2018
Category:
Upload: votuong
View: 221 times
Download: 3 times
Share this document with a friend
226
CENTER FOR INFRASTRUCTURE ENGINEERING STUDIES Steel-Free Hybrid Reinforcement System for Concrete Bridge Decks By Dr. Abdeldjelil Belarbi Huanzi Wang University Transportation Center Program at The University of Missouri-Rolla UTC R52
Transcript

���� ��

CENTER FOR INFRASTRUCTURE ENGINEERING STUDIES

Steel-Free Hybrid Reinforc

Bridge

B

Dr. Abdeld

Huanz

University Transporta

The University UTC R52

ement System for Concrete

Decks

y

jelil Belarbi

i Wang

tion Center Program at

of Missouri-Rolla

Disclaimer The contents of this report reflect the views of the author(s), who are responsible for the facts and the accuracy of information presented herein. This document is disseminated under the sponsorship of the Department of Transportation, University Transportation Centers Program and the Center for Infrastructure Engineering Studies UTC program at the University of Missouri - Rolla, in the interest of information exchange. The U.S. Government and Center for Infrastructure Engineering Studies assumes no liability for the contents or use thereof.

Technical Report Documentation Page

1. Report No.

UTC R52

2. Government Accession No. 3. Recipient's Catalog No.

5. Report Date

Dec 2004

4. Title and Subtitle

Steel-Free Hybrid Reinforcement System for Concrete Bridge Decks 6. Performing Organization Code

7. Author/s

Dr. Abdeldjelil Belarbi, Huanzi Wang

8. Performing Organization Report No.

00001140 OT052

10. Work Unit No. (TRAIS) 9. Performing Organization Name and Address

Center for Infrastructure Engineering Studies/UTC program University of Missouri - Rolla 223 Engineering Research Lab Rolla, MO 65409

11. Contract or Grant No.

DTRS98-G-0021

13. Type of Report and Period Covered

Final

12. Sponsoring Organization Name and Address

U.S. Department of Transportation Research and Special Programs Administration 400 7th Street, SW Washington, DC 20590-0001

14. Sponsoring Agency Code

15. Supplementary Notes

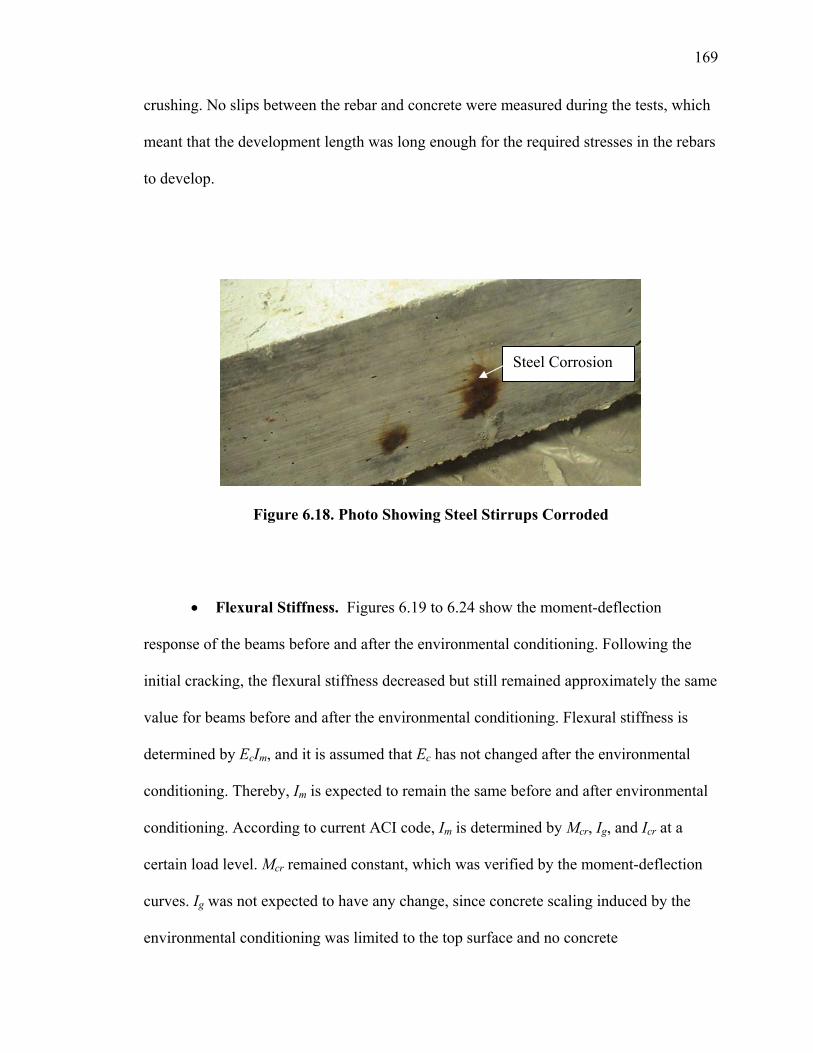
16. Abstract A research project was initiated to develop a nonferrous hybrid reinforcement system for concrete bridge decks by using continuous fiberreinforcedpolymer (FRP) rebars and discrete randomly distributed polypropylene fibers. This hybrid system may eliminate problems related to corrosion of steel reinforcement while providing requisite strength, stiffness, and desired ductility, which are shortcomings of FRP reinforcement system in reinforced concrete. The test results showed that with the addition of fibers, structural performances of the system are improved. Although polypropylene fibers do not increase the ultimate bond strength, they provide enhanced ductile bond behavior. Also, with the addition of fibers, the flexural behaviors are improved with the increase of the ductility index µ by approximately 40%, as compared to the plain concrete beams. In addition, with the addition of polypropylene fibers, the durability of the system was improved. Furthermore, some design recommendations are proposed based on analytical models and test results.

17. Key Words

Fiber Reinforced Polymer, Fiber-Reinforced-Concrete, Bond, Ductility, Durability

18. Distribution Statement

No restrictions. This document is available to the public through the National Technical Information Service, Springfield, Virginia 22161.

19. Security Classification (of this report)

unclassified

20. Security Classification (of this page)

unclassified

21. No. Of Pages

22. Price

Form DOT F 1700.7 (8-72)

iii

ABSTRACT

New materials and design methods are being investigated for the design of bridge

components to alleviate the current devastating corrosion problems. A research project

was initiated at the University of Missouri (UM) and the Missouri Department of

Transportation (MoDOT) to develop a nonferrous hybrid reinforcement system for

concrete bridge decks by using continuous fiber-reinforced-polymer (FRP) rebars and

discrete randomly distributed polypropylene fibers. This hybrid system may eliminate

problems related to corrosion of steel reinforcement while providing requisite strength,

stiffness, and desired ductility, which are shortcomings of FRP reinforcement system in

reinforced concrete.

The overall study plan includes: (1) development of design procedures for an

FRP/FRC hybrid reinforced bridge deck, (2) laboratory studies of static and fatigue bond

performances and ductility characteristics of the system, (3) accelerated durability tests of

the system, and (4) static and fatigue tests on full-scale hybrid reinforced composite

bridge decks (this was conducted at University of Missouri – Columbia).

The test results showed that with the addition of fibers, structural performances of

the system are improved. Although polypropylene fibers do not increase the ultimate

bond strength, they provide enhanced ductile bond behavior. Also, with the addition of

fibers, the flexural behaviors are improved with the increase of the ductility index µ by

approximately 40%, as compared to the plain concrete beams. In addition, with the

addition of polypropylene fibers, the durability of the system was improved. Furthermore,

some design recommendations are proposed based on analytical models and test results.

iv

ACKNOWLEDGMENTS

The authors would like to gratefully acknowledge the support by the Missouri

Department of Transportation and the UMR University Transportation Center to this

research project. The authors are also thankful to Hughes Brothers and SI Concrete

Systems for their participation as well as the generous in-kind material donation to this

project.

v

TABLE OF CONTENTS

Page

ABSTRACT......................................................................................................................iii

ACKNOWLEDGMENTS ............................................................................................... iv

LIST OF ILLUSTRATIONS............................................................................................. x

LIST OF TABLES .......................................................................................................... xv

NOTATIONS ................................................................................................................xvii

CHAPTER

1. INTRODUCTION .................................................................................................. 1

1.1. BACKGROUND AND PROBLEM STATEMENT...................................... 1

1.2. METHOD OF IMPLEMENTATION............................................................. 2

1.3. RESEARCH SIGNIFICANCE....................................................................... 5

1.4. PREVIOUS RESEARCH ON STEEL-FREE BRIDGE ................................ 6

1.5. OUTLINE OF THE REPORT........................................................................ 9

2. BACKGROUND .................................................................................................. 11

2.1 GENERAL..................................................................................................... 11

2.2. AASHTO AND MoDOT DECK SLAB DESIGN PROCEDURES ............ 11

2.2.1. Loads Relative to Deck Slab Design ................................................... 12

2.2.2. Detail Design Procedures..................................................................... 13

2.2.2.1. AASHTO standard specifications............................................... 13

2.2.2.2. MoDOT bridge manual............................................................... 21

2.2.2.3. AASHTO LRFD ......................................................................... 29

vi

2.2.3. Summary of the Design Procedures ................................................... 35

3. EXPERIMENTAL PROGRAM ............................................................................ 37

3.1. DETAILS OF THE EXPERIMENAL PROGRAM..................................... 37

3.1.1. Study of Bond Characteristics ............................................................. 37

3.1.1.1. Bond study by pullout test method ............................................. 38

3.1.1.1.1. Pullout test specimens........................................................ 38

3.1.1.1.2. Test setup and procedures.................................................. 39

3.1.1.2. Bond study by splitting test method ........................................... 42

3.1.1.2.1. Splitting bond test specimens............................................. 42

3.1.1.2.2. Test setup and procedures.................................................. 43

3.1.2. Study of Ductility Characteristics........................................................ 44

3.1.2.1. Test specimens ............................................................................ 46

3.1.2.2. Test setup and procedures........................................................... 47

3.1.3. Study of Durability Characteristics...................................................... 49

3.1.3.1. Test specimens ............................................................................ 49

3.1.3.1.1. Bond specimens ................................................................. 49

3.1.3.1.2. Beam specimens................................................................. 51

3.1.3.2. Test setup and procedures........................................................... 52

3.1.3.2.1. Bond tests........................................................................... 52

3.1.3.2.2. Beam tests .......................................................................... 53

3.1.3.2.3. Environmental conditioning............................................... 53

3.1.3.2.4. Preparation of de-icing solution......................................... 55

3.2. MATERIALS................................................................................................ 58

vii

3.2.1. FRP Rods ............................................................................................. 58

3.2.2. Polypropylene Fiber............................................................................. 59

3.2.3. Concrete ............................................................................................... 60

4. STATIC AND FATIGUE BOND TEST RESULTS............................................. 61

4.1. INTRODUCTION ........................................................................................ 61

4.2. PULLOUT BOND TEST RESULTS ........................................................... 64

4.2.1. Test Results and Discussions ............................................................... 64

4.2.1.1. Monotonic pullout tests............................................................... 64

4.2.1.2. Fatigue pullout tests .................................................................... 78

4.2.2. Prediction of Ultimate Bond Strength.................................................. 84

4.2.3. Basic Development Length.................................................................. 88

4.3. SPLITTING BOND TEST RESULTS ......................................................... 91

4.3.1. Test Results and Discussions ............................................................... 91

4.3.1.1. Fiber effect on bond characteristics ............................................ 95

4.3.1.2. Cover effect on bond characteristics........................................... 98

4.3.1.3. Diameter effect on bond characteristics...................................... 98

4.3.2. Theoretical Prediction of Bond Strength ............................................. 98

4.3.3. Basic Development Length................................................................ 103

4.4. CONCLUDING REMARKS...................................................................... 104

5. FLEXURAL DUCTILITY TEST RESULTS .................................................... 106

5.1. INTRODUCTION ...................................................................................... 106

5.2. TEST RESULTS AND DISCUSSIONS .................................................... 107

5.2.1. Crack Distribution.............................................................................. 107

viii

5.2.2. Load-Deflection Response................................................................. 120

5.2.3. Relative Slip between Longitudinal Rebar and Concrete at Ends ..... 126

5.2.4. Loading/Unloading Effect on the Flexural Behaviors ....................... 126

5.2.5. Strains in Reinforcement and Concrete ............................................. 126

5.3. PREDICTIONS OF THE ULTIMATE FLEXURAL CAPACITY ........... 130

5.4. DUCTILITY EVALUATION .................................................................... 132

5.4.1. Energy Based Approach .................................................................... 133

5.4.2. Deformation Based Approach............................................................ 134

5.4.3. Ductility Index Computed by Energy Based Method........................ 135

5.4.4. Ductility Index Computed by Deformation Based Method............... 135

5.4.5. Discussions of Ductility Index........................................................... 135

5.5. CONCLUDING REMARKS...................................................................... 140

6. ACCELERATED DURABILITY TEST RESULTS .......................................... 142

6.1. INTRODUCTION ...................................................................................... 142

6.2. PROBLEM STATEMENT......................................................................... 144

6.3. TEST OBSERVATIONS AND DISCUSSIONS ....................................... 148

6.3.1. Durability Effect on Bond.................................................................. 148

6.3.1.1. Appearance of specimen after environmental conditioning ..... 148

6.3.1.2. Environmental conditioning effect on bond behaviors............. 149

6.3.1.2.1. Plain concrete specimens ................................................. 157

6.3.1.2.2. FRC specimens ................................................................ 161

6.3.1.3. Discussions on the durability effect on bond............................ 162

6.3.1.3.1. Specimen dimension effect on bond degradation ............ 164

ix

6.3.1.3.2. Fiber effect on bond degradation ..................................... 165

6.3.1.3.3. Difference of GFRP vs. CFRP......................................... 166

6.3.2 Durability Effect on Flexural Behavior .............................................. 167

6.3.2.1. Appearance of specimen after environmental conditioning ..... 167

6.3.2.2. Flexural response after environmental conditioning................. 168

6.3.2.3. Ductility .................................................................................... 178

6.4. CONCLUDING REMARKS...................................................................... 184

7. DESIGN RECOMMENDATIONS ..................................................................... 186

7.1. GENERAL.................................................................................................. 186

7.2. DESIGN EQUATIONS.............................................................................. 186

8. CONCLUSIONS.................................................................................................. 194

8.1. BOND TESTS ............................................................................................ 194

8.2. FLEXURAL BEAM TESTS ...................................................................... 195

8.3. DURABILITY TESTS ............................................................................... 196

BIBLIOGRAPHY………………………...................................................................... 198

LIST OF ILLUSTRATIONS

x

Figure Page

1.1. Typical Cross Section of Steel-Free Concrete Bridge Deck. ..................................... 6

1.2. FRP Panels, FRP Rebars and FRP Grid Used in Wisconsin ...................................... 9

2.1. Stress-Strain Diagram ............................................................................................... 19

2.2. Distribution Reinforcement ..................................................................................... 27

3.1. Pullout Test Specimen and Test Setup...................................................................... 40

3.2. Beam End Specimen Details..................................................................................... 44

3.3. Test Setup of Beam End Tests .................................................................................. 45

3.4. Beam Specimen Details ............................................................................................ 46

3.5. Flexural Beam Test Setup......................................................................................... 48

3.6. Bond Stress Distribution in Beam Specimen and Pullout Specimen........................ 50

3.7. Pullout Specimens Coated with Epoxy at Free End ................................................. 50

3.8. Artificial Cracks Created by Steel Plate ................................................................... 52

3.9. Cycle of Freezing-and-Thawing ............................................................................... 54

3.10. Environmental Cycles............................................................................................. 56

3.11. Photograph of Specimens in the Environmental Chamber ..................................... 57

3.12. FRP Rods Used in this Study.................................................................................. 58

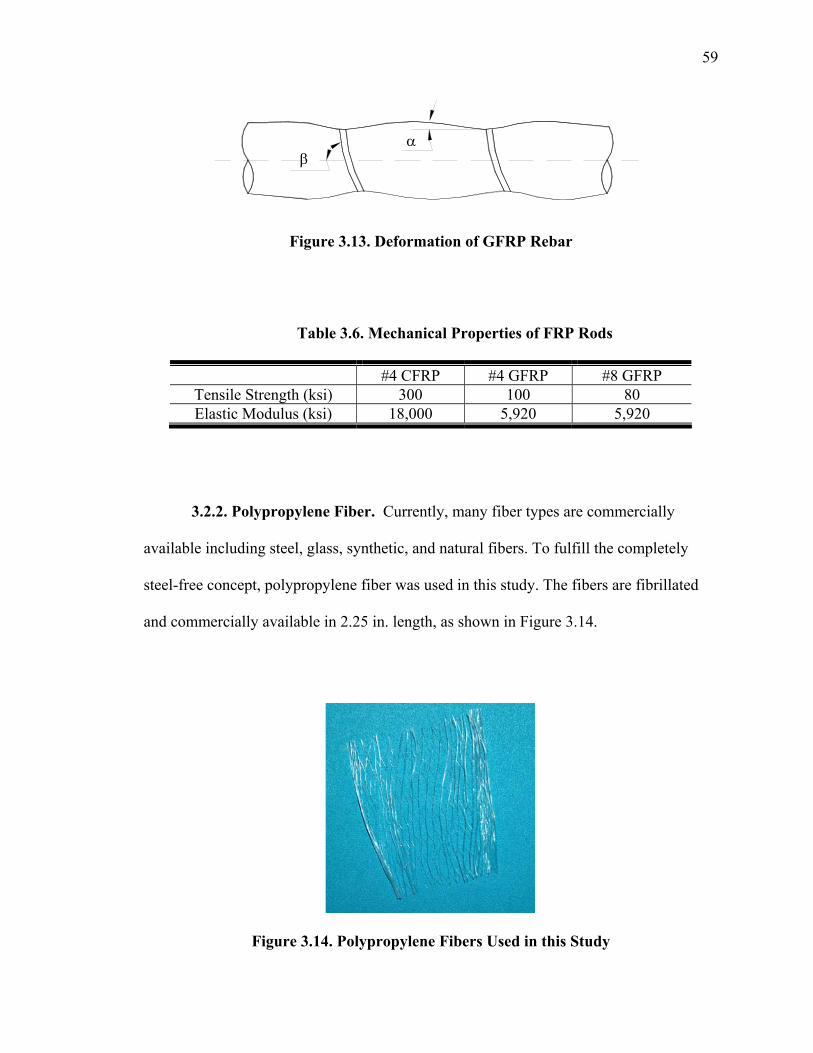
3.13. Deformation of GFRP Rebar .................................................................................. 59

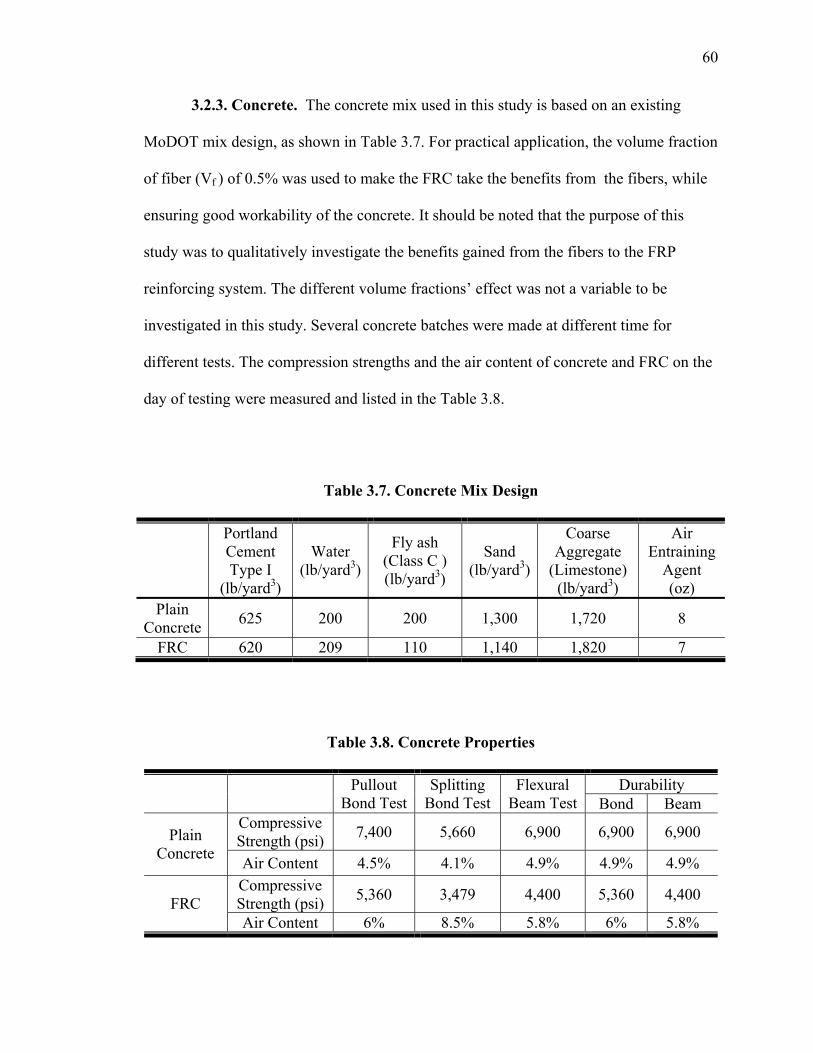
3.14. Polypropylene Fibers Used in this Study................................................................ 59

4.1. Bond Mechanisms for Deformed GFRP Rebar ........................................................ 61

4.2. Average Bond and Local Bond................................................................................. 62

4.3. Bond-slip Relationship of GFRP and CFRP............................................................. 66

4.4. Surface Conditions of Various Rebar Before and After Loading............................. 67

xi

4.5. Idealized Load-Slip Curve for CFRP Rebar Embedded in Concrete ....................... 67

4.6. Different Deformation Patterns of FRP Rebars ........................................................ 70

4.7. Embedment Length Effect on Bond-Slip Behavior of Various CFRP and GFRP Rebars……………………………… ....................................................................... 72

4.8. Diameter Effect on Bond-Slip Behavior………………………………................... 74

4.9. Polypropylene Fibers’ Effect on Bond-Slip Behavior of CFRP and GFRP Rebars ……………………………… ...................................................................... 75 4.10. Failure for FRC and Plain Concrete Specimens ..................................................... 77

4.11. Residual Slips versus Cycle Numbers of Various FRP Rebars .............................. 80

4.12. Residual Bond-Slip Response Before and After Fatigue Loading ......................... 81

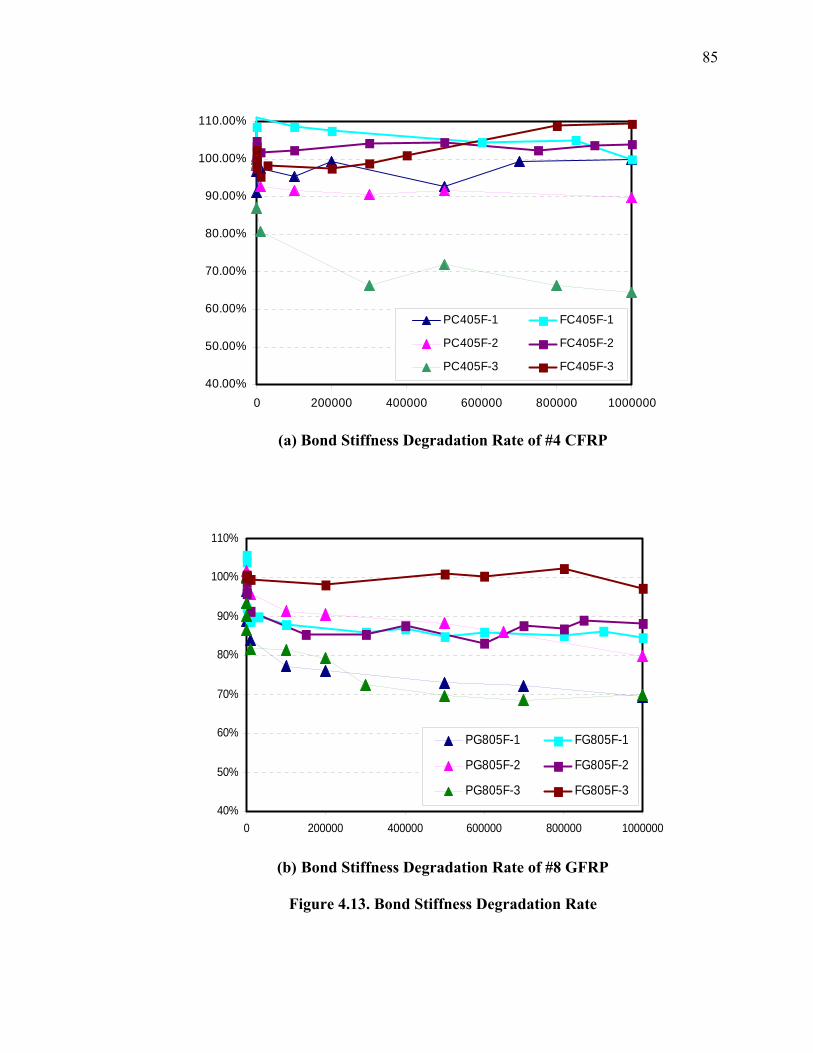
4.13. Bond Stiffness Degradation Rate............................................................................ 85

4.14. Relationship between Bond Strength and Splitting Force ...................................... 86

4.15. Crack Patterns for Various Specimens Showing Effect of Cb and Vf..................... 91

4.16. Surface Condition of Various FRP Rebars after Testing........................................ 94

4.17. Bond-Slip Relationship of Various Rebars in Plain Concrete and FRC................. 96

4.18. Previous Definition of Contribution from Concrete ............................................. 100

4.19. Definition of Splitting Area for Beam End Specimen .......................................... 100

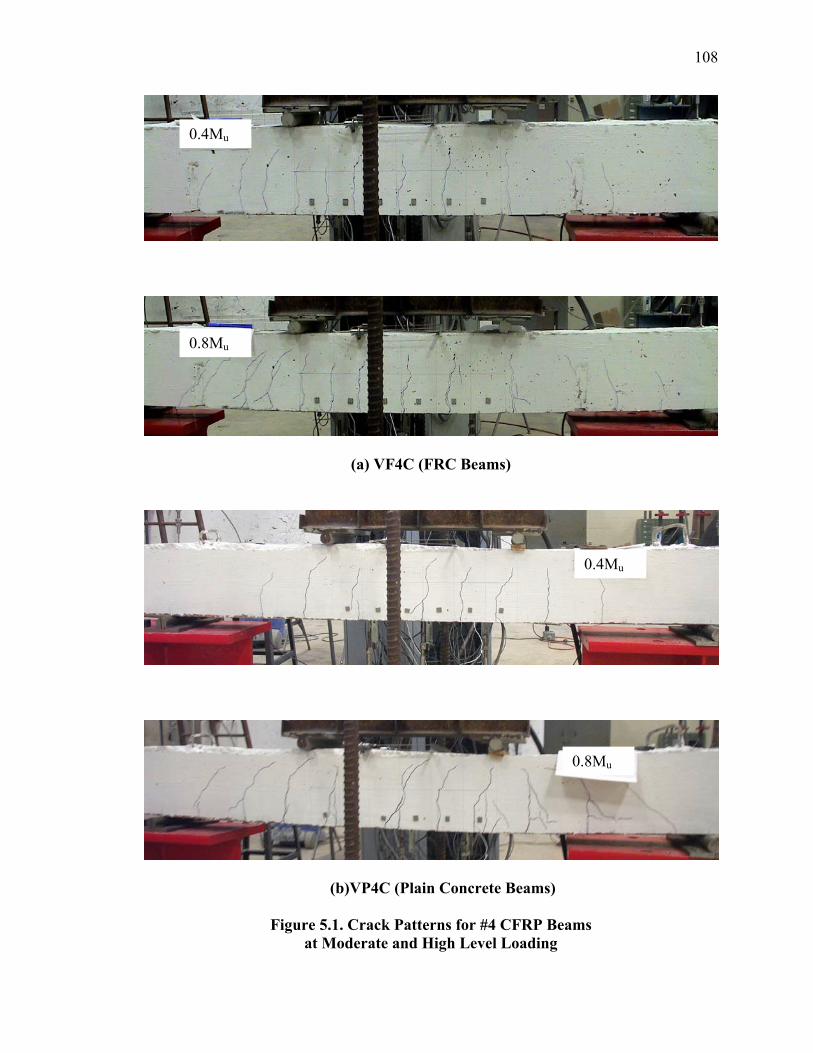
5.1. Crack Patterns for #4 CFRP Beams at Moderate and High Level Loading ........... 108

5.2. Crack Patterns for #4 GFRP Beams at Moderate and High Level Loading ........... 109

5.3. Crack Patterns for #8 GFRP Beams at Moderate and High Level Loading ........... 110

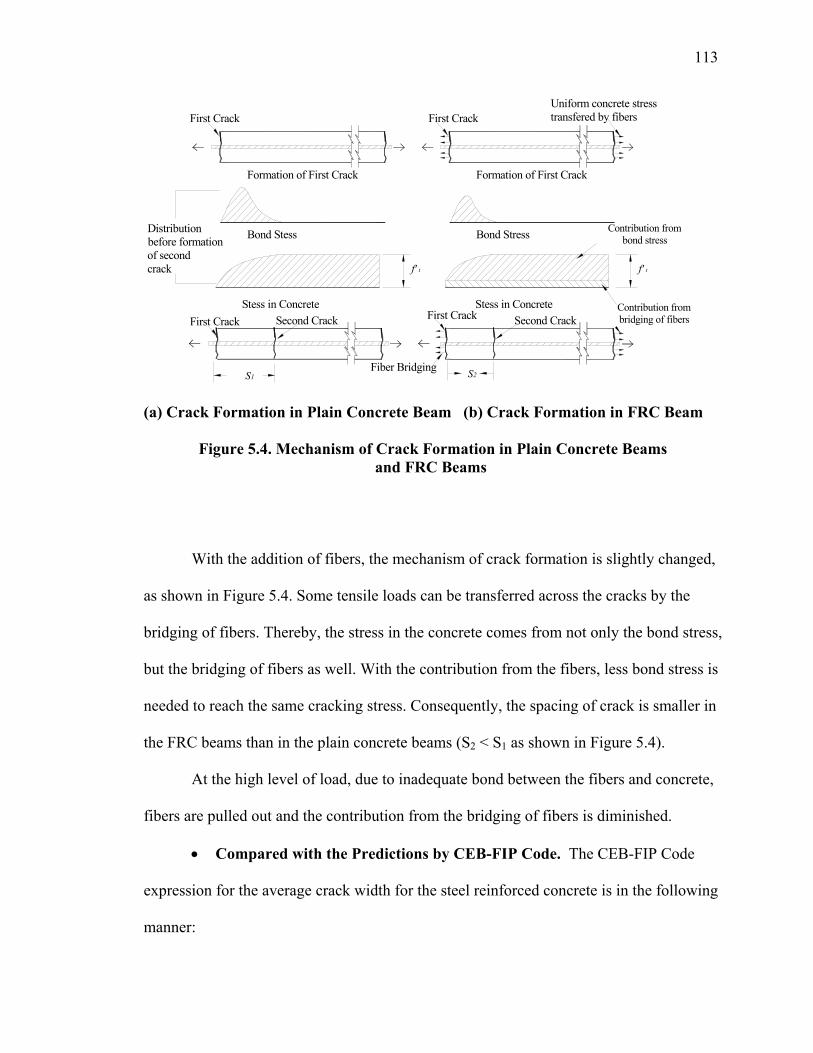
5.4. Mechanism of Crack Formation in Plain Concrete Beams and FRC Beams ......... 113

5.5. Crack Width versus Applied Moment of #4 CFRP Beams .................................... 115

5.6. Crack Width versus Applied Moment of #4 GFRP Beams .................................... 116

5.7. Crack Width versus Applied Moment of #8 GFRP Beams .................................... 116

xii

5.8. Moment-Deflection Relationship for FRC Beams ................................................. 121

5.9. Moment-Deflection Relationship for Plain Concrete Beams ................................. 121

5.10. Moment-Deflection Relationship for #4 CFRP with/without Fibers.................... 123

5.11. Moment-Deflection Relationship for #4 GFRP with/without Fibers ................... 123

5.12. Moment-Deflection Relationship for #8 GFRP with/without Fibers ................... 124

5.13. Typical Loading/unloading Cycle’s Effect on FRC Beams ................................. 127

5.14. Typical Loading/unloading Cycle’s Effect on Plain Concrete Beams ................. 127

5.15. Typical Strain Distributions of #4 CFRP Beams.................................................. 128

5.16. Typical Strain Distributions of #4 GFRP Beams.................................................. 128

5.17. Typical Strain Distributions of #8 GFRP Beams.................................................. 129

5.18. Typical Failure Mode............................................................................................ 130

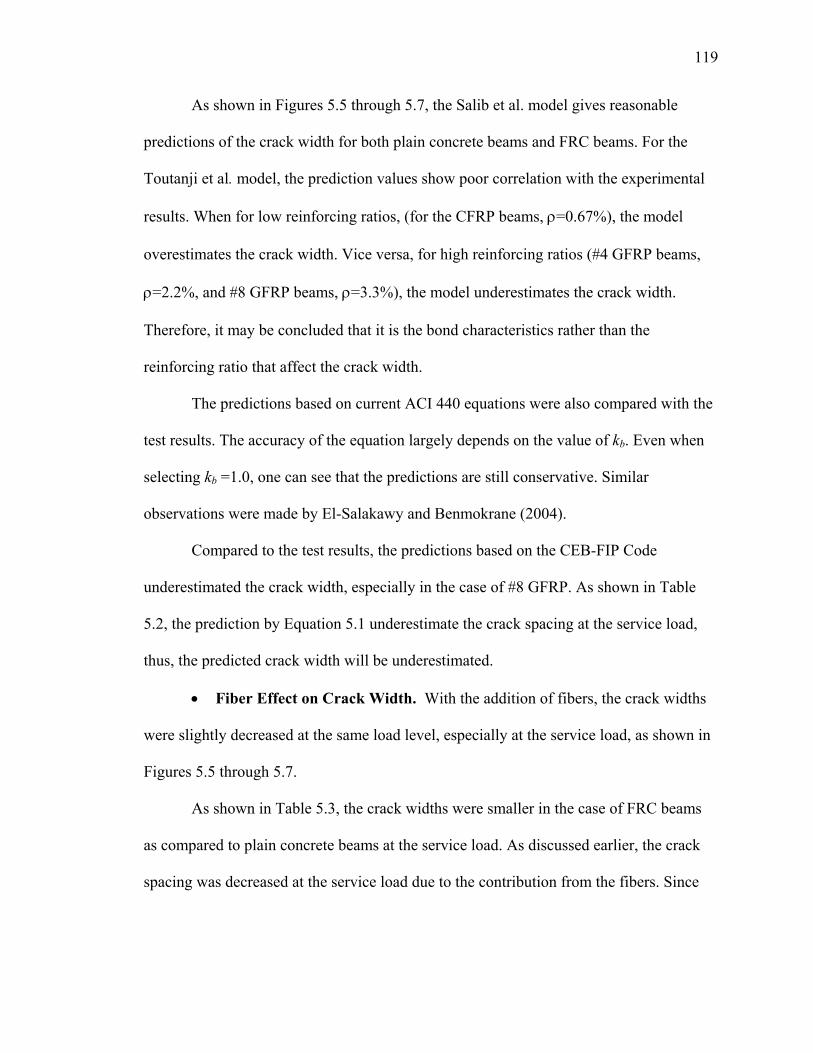
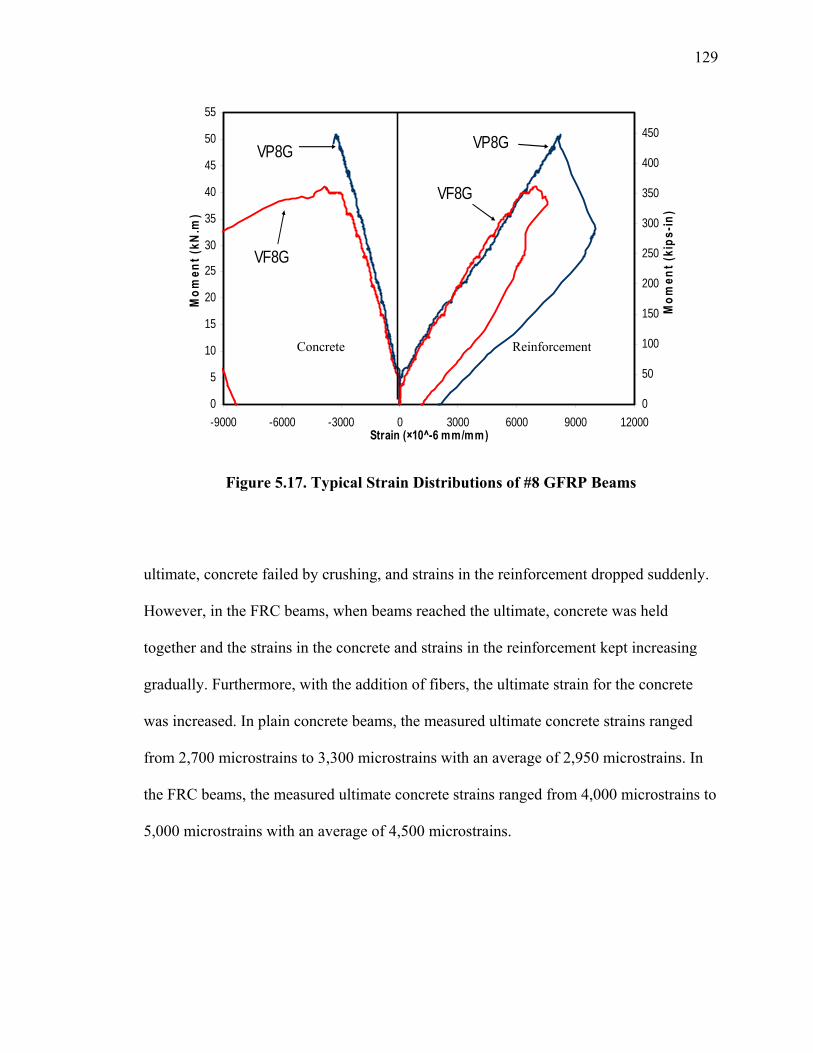
5.19. Comparison of Ultimate Strain of Concrete of ACI Value and Test Results in this Study ……………………………… ............................................................ 132 5.20. New Definition of Ductility Index........................................................................ 134

5.21. Typical Moment Curvature Relationship for #4 CFRP Beams ............................ 136

5.22. Typical Moment Curvature Relationship for #4 GFRP Beams ............................ 136

5.23. Typical Moment Curvature Relationship for #8 GFRP Beams ............................ 137

5.24. Schematic Load-Deflection Relationship ............................................................. 139

6.1. Different in Appearance of Plain Concrete Specimen and FRC Specimen after Environmental Conditioning................................................................................... 148 6.2. Loaded-end Bond-Slip Relationship for #4 CFRP Plain Concrete Specimens ...... 151 6.3. Loaded-end Bond-Slip Relationship for #4 CFRP FRC Specimens ...................... 151 6.4. Loaded-end Bond-Slip Relationship for #4 GFRP Plain Concrete Specimens ...... 152 6.5. Loaded-end Bond-Slip Relationship for #4 GFRP FRC Specimens ...................... 152

xiii

6.6. Loaded-end Bond-Slip Relationship for #8 GFRP Plain Concrete Specimens ...... 153 6.7. Loaded-end Bond-Slip Relationship for #8 GFRP FRC Specimens ...................... 153 6.8. Free-end Bond-Slip Relationship for #4 CFRP Plain Concrete Specimens ........... 154 6.9. Free-end Bond-Slip Relationship for #4 CFRP FRC Specimens ........................... 154 6.10. Free-end Bond-Slip Relationship for #4 GFRP Plain Concrete Specimens ......... 155 6.11. Free-end Bond-Slip Relationship for #4 GFRP FRC Specimens ......................... 155 6.12. Free-end Bond-Slip Relationship for #8 GFRP Plain Concrete Specimens ......... 156 6.13. Free-end Bond-Slip Relationship for #8 GFRP FRC Specimens ......................... 156 6.14. Reductions in Ultimate Bond Strength ................................................................. 159

6.15. Reductions in Design Bond Strength or Bond Stiffness....................................... 160

6.16. Two Ways of Solution Ingress.............................................................................. 165

6.17. Concrete Scaling on the Beam Surface................................................................. 168

6.18. Photo Showing Steel Stirrups Corroded ............................................................... 169

6.19. Moment-Deflection Relationship for #4 CFRP Plain Concrete Specimens ......... 170 6.20. Moment-Deflection Relationship for #4 GFRP Plain Concrete Specimens......... 170 6.21. Moment-Deflection Relationship for #4 GFRP Plain Concrete Specimens......... 171 6.22. Moment-Deflection Relationship for #4 CFRP FRC Specimens ......................... 171 6.23. Moment-Deflection Relationship for #4 GFRP FRC Specimens ......................... 172 6.24. Moment-Deflection Relationship for #8 GFRP FRC Specimens ......................... 172 6.25. Strain Distributions of #4 CFRP Plain Concrete Specimens ................................ 175 6.26. Strain Distributions of #4 GFRP Plain Concrete Specimens................................ 175 6.27. Strain Distributions of #8 GFRP Plain Concrete Specimens................................ 176 6.28. Strain Distributions of #4 CFRP FRC Specimens ................................................ 176

xiv

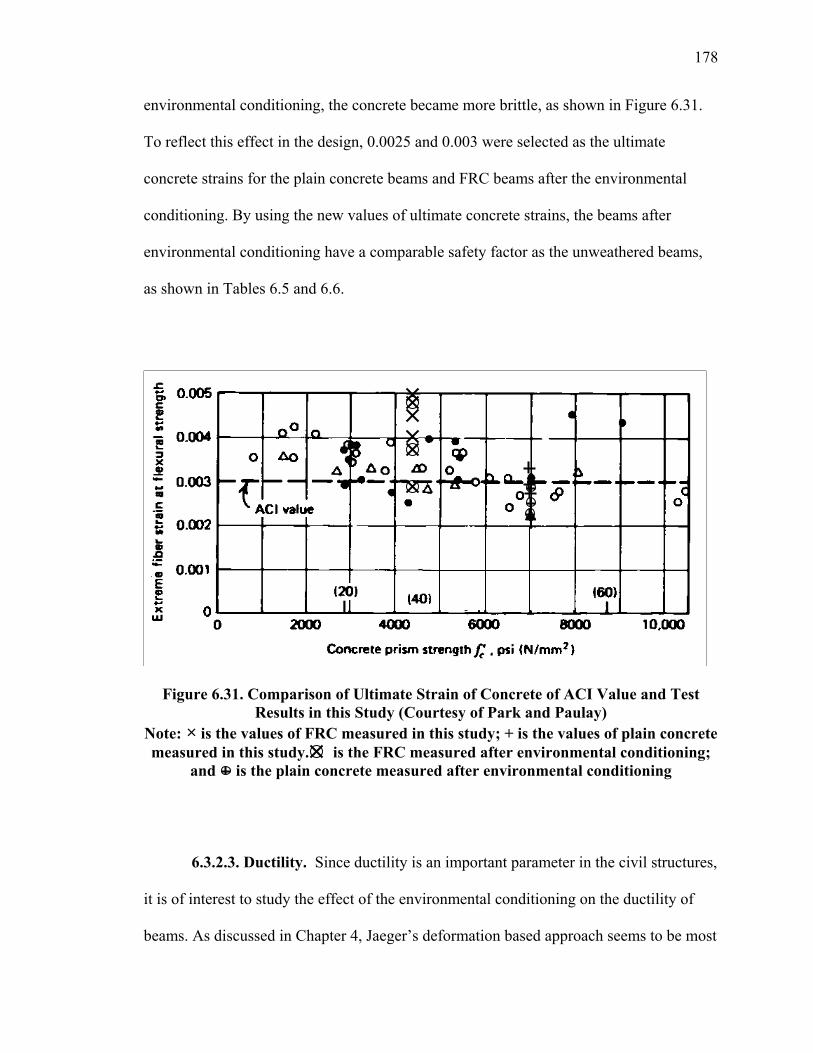
6.29. Strain Distributions of #4 GFRP FRC Specimens................................................ 177 6.30. Strain Distributions of #8 GFRP FRC Specimens................................................ 177 6.31. Comparison of Ultimate Strain of Concrete of ACI Values and Test Results in this Study…………………… ......................................................................... 178 6.32. Typical Moment Curvature Relationship for #4 CFRP Plain Concrete Beams.... 181

6.33. Typical Moment Curvature Relationship for #4 GFRP Plain Concrete Beams ... 181

6.34. Typical Moment Curvature Relationship for #8 GFRP Plain Concrete Beams ... 182

6.35. Typical Moment Curvature Relationship for #4 CFRP FRC Beams.................... 182

6.36. Typical Moment Curvature Relationship for #4 GFRP FRC Beams ................... 183

6.37. Typical Moment Curvature Relationship for #8 GFRP FRC Beams ................... 183

LIST OF TABLES

xv

Table Page

1.1. Summary of Canadian Steel-Free Bridges. ................................................................ 7

2.1. Minimum Cover….................................................................................................... 18

2.2. Width of the Primary Strip........................................................................................ 30

2.3. Load Factors……...................................................................................................... 32

2.4. Bridge Deck Design Procedures ............................................................................... 36

3.1. Details of Pullout Specimen...................................................................................... 39

3.2. Beam End Specimen Details..................................................................................... 42

3.3. Flexural Beam Test Matrix ....................................................................................... 47

3.4. Durability Bond Test Matrix..................................................................................... 51

3.5. Durability Beam Test Matrix .................................................................................... 53

3.6. Mechanical Properties of FRP Rods ......................................................................... 59

3.7. Concrete Mix Design ................................................................................................ 60

3.8. Concrete Properties................................................................................................... 60

4.1. Summary of Static Pullout Bond Test Results.......................................................... 65

4.2. Fatigue Bond Tests Results....................................................................................... 83

4.3. Comparison of Bond Strength between Prediction and Experiment ........................ 88

4.4. Description of Test Results....................................................................................... 93

4.5. Test Results of Beam End Tests … .......................................................................... 98

4.6. Comparison of Bond Strength between Prediction and Experiment ...................... 102

5.1. Cracking Moment and Average Crack Spacing...................................................... 112

5.2. Average Crack Spacing........................................................................................... 112

5.3. Comparison of Crack Width between Plain Concrete Beams and FRC Beams at Service Load…………………… .......................................................................... 120

xvi

5.4. Comparison of Flexural Strength and Deflection between FRC Beams and Plain Concrete Beams ……………………........................................................... 122 5.5. Predictions of Ultimate Capacities.......................................................................... 133

5.6. Ductility Index by Energy Based Method .............................................................. 137

5.7. Ductility Index by Deformation Based Method...................................................... 138

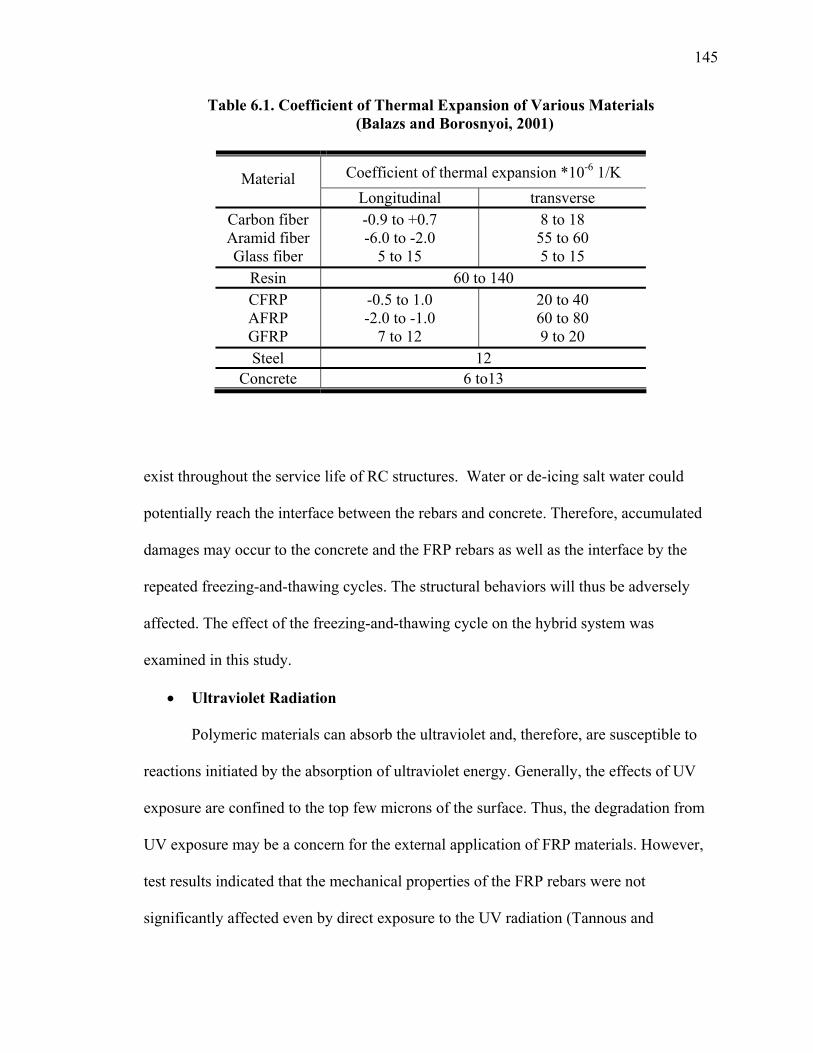
6.1. Coefficient of Thermal Expansion of Various Materials........................................ 145

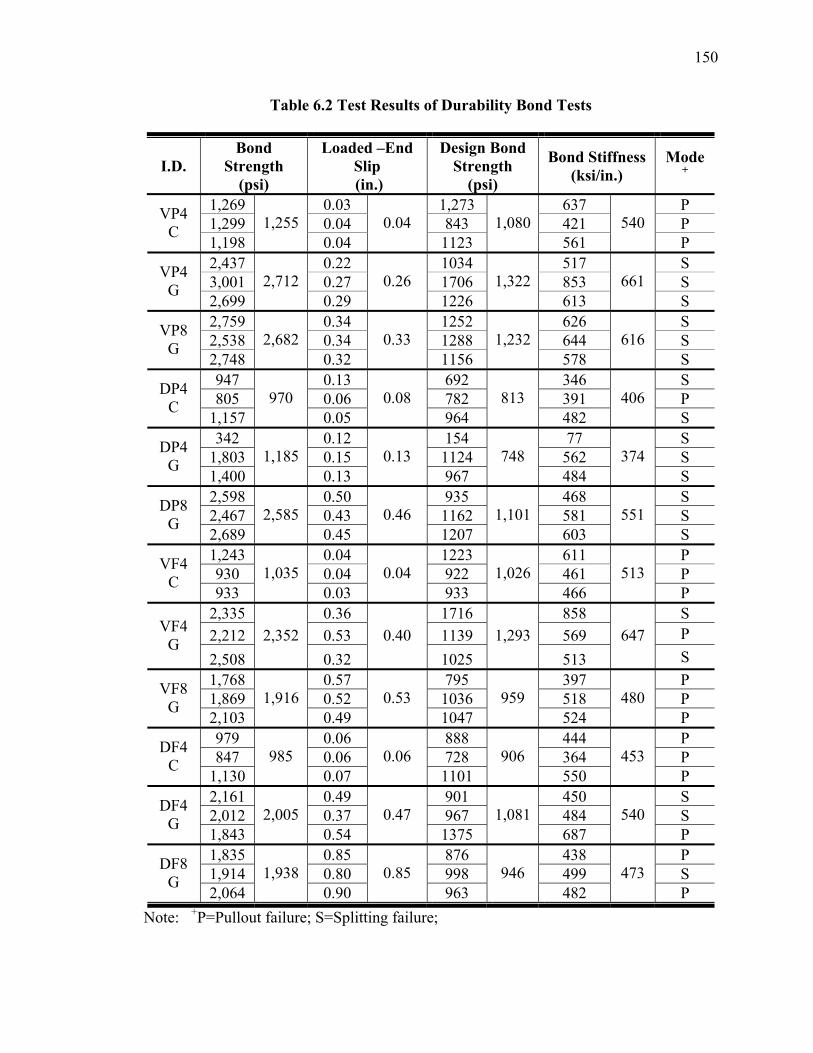
6.2. Test Results of Durability Bond Test...................................................................... 150

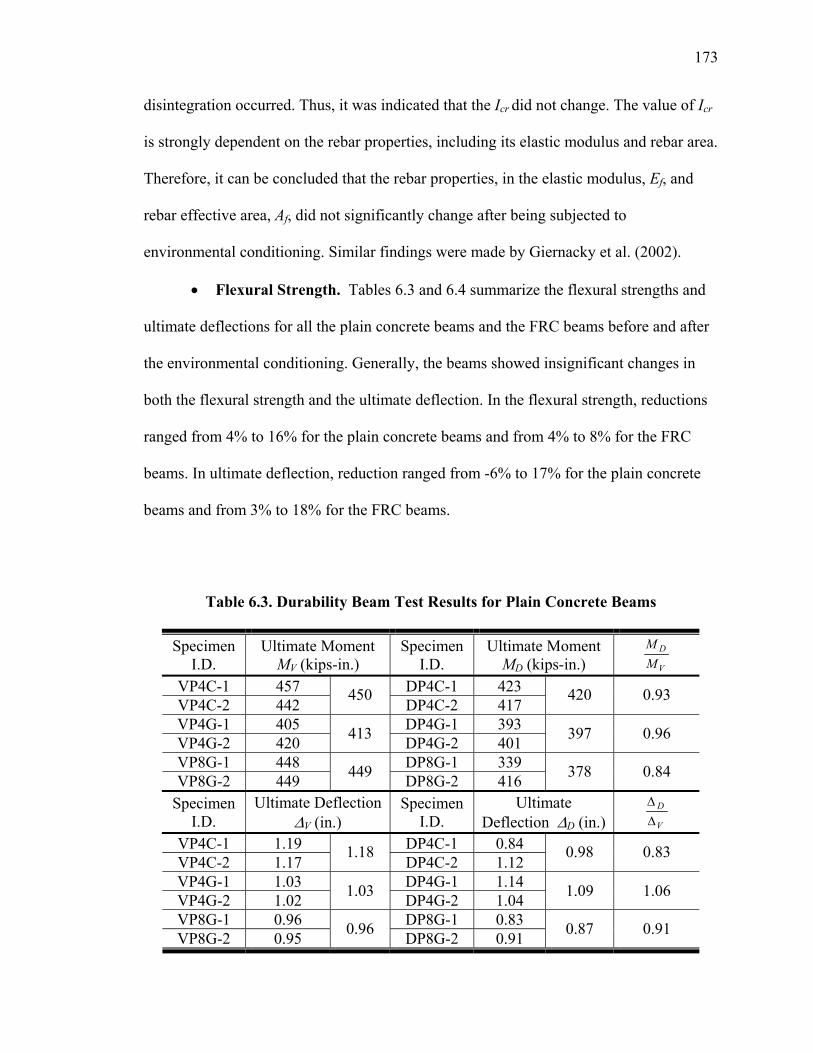
6.3. Durability Beam Test Results for Plain Concrete Beams....................................... 173

6.4. Durability Beam Test Results for FRC Beams ....................................................... 174

6.5. Predictions of Ultimate Capacities for Plain Concrete Beams ............................... 179

6.6. Predictions of Ultimate Capacities for FRC Beams ............................................... 180

6.7. Ductility Index by Deformation Based Method...................................................... 180

7.1. Residual Design Bond Strength Based on Experiment........................................... 189

7.2. Correction Factors for Moisture Condition in Concrete Member, moη .................. 190

7.3. Correction Factors for Mean Annual Temperature, Tη .......................................... 190

7.4. Correction Factors for Required Service Life, SLη ................................................. 190

7.5. Correction Factors for Standard Reduction of Bond Strength, env,fbf∆ ................... 191

7.6. Correction Factors for Rebar Type, barη ................................................................. 191

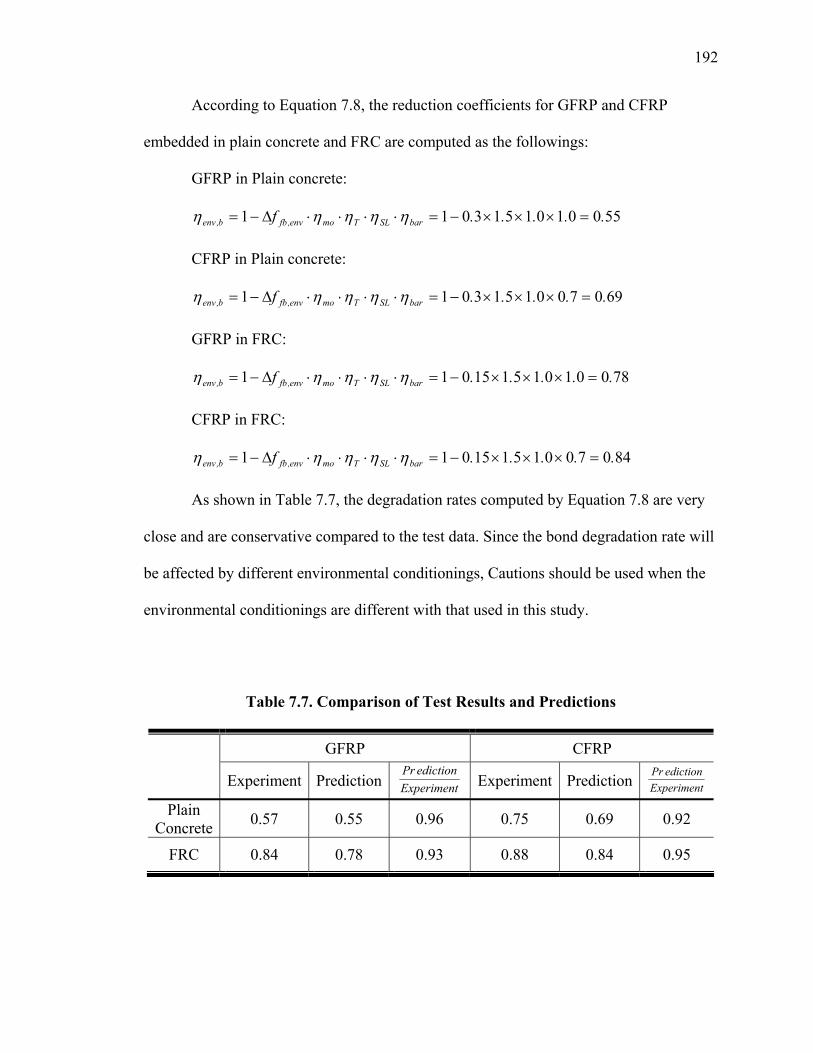
7.7. Comparison of Test Results and Predictions .......................................................... 192

xvii

NOTATIONS

a distance from the support to the point load applied, in.

A effective tension area per bar, in.2

Af area of rebars, in.2

Asplit concrete splitting area, in.2

be effective beam width, in.

C cover depth, in.

CE environmental reduction factor

d distance from the extreme compression fiber to centroid of the tension

reinforcement

db diameter of rebar, in.

dc thickness of concrete cover measured from extreme tension fiber to the

center of the closest layer of longitudinal bars

Ec modulus of elasticity of concrete, psi

Ef modulus of elasticity of FRP rebar, psi

Et total energy of the system, kips-in.

Ee elastic energy, kips-in.

E0.75Pu energy corresponding at 75% of the ultimate load, kips-in.

F friction force on deformation with unit area, psi

'cf concrete compressive strength, psi

fct concrete splitting tensile strength, ksi

ff stress in the FRP reinforcement, ksi

xviii

ffu tensile strength of FRP bars, ksi

hr height of deformation, in.

Ie effective moment of inertia of the section, in.4

Ig gross moment of inertia of the section, in.4

kb coefficient that accounts for the degree of bond between the FRP bar and

the surrounding concrete

L span length, in.

ld embedment length, in.

ldb basic development length, in.

le effective splitting length, in.

Ma moment applied to the section, kips-in.

Mcr cracking moment including rebars’ contribution, kips-in.

Mcr-exp cracking moment measured from experiments, kips-in.

MDL moment induced by deal loads, kips-in.

MLL+I moment induced by live load and impact, kips-in.

Mu ultimate flexural strength, kips-in.

Mε=0.001 flexural strength at concrete strain of 0.001, kips-in.

ni number of cycles applied at a particular stress level

Nmax,i number of cycles which cause fatigue failure at a certain stress level

P normal stress on deformation, psi

R resultant stress of P and F, psi

Rr radial component of R, psi

S crack spacing

xix

Sm slip at peak bond strength, in.

S’m slip at second peak bond strength, in.

Sr residual slip after fatigue loading, in.

T pullout force, kips

u bond strength (longitudinal component of R), psi

u’ bond strength at second peak, psi

u0.002 bond strength at the slip of 0.002 in. at the free end, psi

u0.01 bond strength at the slip of 0.01 in. at the loaded end, psi

udesign design bond strength , psi

ub,f bond strength of FRP rebar to concrete, psi

ub,s bond strength of steel rebar to concrete, psi

utest bond strength based on test results, psi

utheo. theoretical bond strength, psi

w crack width at tensile face of the beam, in.

Vf volume fraction of fibers

α rib angle

β coefficient to converse crack width corresponding to the level of

reinforcement to the tensile face of beam

βd modification factor for FRP reinforced beam

∆mid mid-span deflection, in.

εcu ultimate concrete strain

ψε=0.001 curvature at concrete strain of 0.001

ψu curvature at ultimate

xx

γ adjustment factor for different embedment length

µ friction coefficient

µΕ ductility index

ρf reinforcing ratio

1. INTRODUCTION

1.1. BACKGROUND AND PROBLEM STATEMENT

There are approximately 592,000 bridges in the United States. Of these,

approximately 78,000 are classified as structural deficient. Eighty thousand bridges are

functionally obsolete (FHwA, 2003). These numbers indicate that in excess of 25 percent

of the bridges listed in the National Bridge Inventory Databases are in need of repair or

replacement. Steel corrosion is the primary reason for the structural deficiency of bridges.

The annual direct cost of corrosion for highway bridges is estimated to be $8.3 billion.

This consists of $3.8 billion to replace structurally deficient bridges over the next ten

years, $2.0 billion for maintenance and cost of capital for concrete bridge decks, $2.0

billion for maintenance and cost of capital for concrete substructures (minus decks), and

$0.5 billion for maintenance painting of steel bridges. Life-cycle analysis estimates

indirect costs to the user due to traffic delays and lost productivity at more than ten times

the direct cost of corrosion maintenance, repair, and rehabilitation. (www.

CorrosionCost.com 2004).

Corrosion decay has been a continual challenge for bridge engineers. Corrosion is

aggravated by the common usage of deicing salts in cold climate areas; e.g., many

regions in North America. Several methods, such as epoxy coated rebars, synthetic

membranes, or cathodic protection have been developed to mitigate the corrosion.

However, each method has shown only limited success (Keesler and Power, 1988;

Rasheeduzzafar et al., 1992).

2

Recently, a non-metallic material, fiber reinforced polymer (FRP), has been

adopted in civil engineering as an alternative to the traditional steel rebar to overcome the

corrosion problem. FRP materials offer many advantages over the conventional steel

reinforcement, such as, corrosion-free, high tensile strength, light weight, ease of

handling, and free of electromagnetism. However, due to their brittle behaviors and lower

modulus of elasticity, they also induce unsatisfactory structural ductility and

serviceability problems.

The use of fibers in reinforced concrete (RC) has resulted in an increase in

concrete toughness, ductility, and freeze-thaw durability, as well as in an improved

resistance to crack growth, plastic and drying shrinkage, impact loading, and fatigue

loading (ACI 544.1R-96). It is proven to have notable benefits to RC structures,

especially under service conditions.

The idea of combining corrosion-free FRP bars with fiber reinforced concrete

(FRC) is appealing. It is believed that this kind of hybrid system may eliminate problems

related to corrosion of steel reinforcement, while providing requisite strength, stiffness,

and desired ductility, which are shortcomings of the plain concrete and FRP

reinforcement system.

1.2. METHOD OF IMPLEMENTATION

Recently, the Missouri State Department of Transportation (MoDOT) sponsored a

project to study the steel-free FRP/FRC hybrid system with the aim of developing more

durable bridges. As part of this project, several tasks needed to be undertaken to fulfill

this goal. The overall program can be summarized as follows:

3

(A) Review Current Procedures in the Design of Bridge Deck. The MoDOT

and AASHTO procedures for the design of deck slabs in steel girder bridges were

reviewed to understand the current approaches in the design of concrete decks. By taking

into account the arching action in the deck, researchers (Campbell, Chitnuyanondh, and

Batchelor, 1980; Batchelor and Kwun 1981; Bakht and Mufti, 1998) in Canada

developed the steel-free bridge deck concept. The innovative Canadian approach was also

studied. The above reviews were facilitate development of a set of preliminary design

specifications for the new hybrid concrete bridge deck system that has the mechanical

and service performance comparable to that of the conventional steel reinforced concrete

decks.

(B) Laboratory Studies of Bond Performances. Perfect bond is essential for

“reinforced concrete”. Because it is a new material in civil engineering, research on bond

between FRP rod and concrete is necessary. One of the key reasons is that there is a lack

of standardization on the manufacture of FRP rods. Different surface treatments resulted

in tremendously different bond behaviors (Ehsani et al., 1997; Kaza, 1999).

Three test methods are commonly used to study bond behaviors: namely, pullout

bond test, splitting bond test, and flexural bond test. Different test methods provide

different information on the bond behaviors. Pullout tests can clearly represent the

concept of anchorage and is usually adopted to study the bond behavior between rebar

and concrete. Although pullout tests cause concrete to be in compression and the testing

bar to be in tension, a stress condition not exhibited in real structures, a reasonable

correlation was found between structural performance and measures of performance in

the pullout test (Cairns and Abdullah, 1992). Splitting bond tests can be used to study the

4

splitting bond behavior under different cover thicknesses. The effect of the transverse

reinforcement on bond behavior can be avoided when properly designed. Splitting bond

tests can simulate the stress field of real structures to some extent; it can simulate the

shear stress field but not the stress gradient induced by bending. Flexural bond tests have

the advantage of representing actual stress fields in real beams and the cover effects on

bond. However, it requires considerable confining reinforcement to avoid a shear failure,

and so bond splitting failures are unlikely (Cairns and Plizzari, 2003). All three study

methods were investigated and compared with each other. The flexural bond test was

conducted by the University of Missouri – Columbia (UMC) and is not reported in this

report.

(C) Laboratory Studies of Ductility Characteristics. Ductility is a design

requirement in most civil engineering structures and is mandated by most design codes.

In RC structures, ductility is defined as the ratio of post yield deformation to yield

deformation. For properly reinforced and dimensioned members, RC member will exhibit

good ductile behavior Due to the linear-stain-stress relation of FRP bars, traditional

definition of ductility cannot be applied to the structures reinforced with FRP

reinforcement. Two approaches, i.e., energy-based approach and deformation-based

approach, have been developed and successfully used (Naaman and Jeong, 1995; Jaeger

et al., 1995). With the addition of fibers, the toughness of concrete will be greatly

increased. Thus, a significant increase in the energy absorption of the entire system is

expected.

(D) Accelerated Durability Tests of the Hybrid System. Composite materials

offer many advantages such as corrosion resistance, and their use in bridge decks have

5

become more technically attractive and economically viable. However, long-term

performances have to be clearly understood before it can be applied in the field with

confidence.

Much research has been done on the durability issue regarding individual FRP

components, but there is a paucity of literature on the durability of FRP and concrete

system. The durability mechanism depends more on the interrelation between the

materials than on the individual component’s property. In addition, the mechanical

properties of a hybrid material system may deteriorate much faster than that suggested by

the property degradation rates of the individual components making up the hybrid system

(Schutte, 2004). The FRP/FRC hybrid system is new; research on durability

characteristics of this hybrid system has not been found in open literature. Thus,

accelerated durability tests on the FRP/FRC system are necessary. Specimens were

subjected to cycles of freeze-thaw and high temperature while in contact with salt water.

Bond characteristics and flexural performance were evaluated, and results were compared

to those without environmental effects.

(E) Static and Fatigue Tests on Full-Scale Hybrid Reinforced Composite

Bridge Decks. Several full-scale hybrid reinforced slabs were designed and tested using

the results developed in the previous study. This task was performed by the UMC, but is

not reported in this report.

1.3. RESEARCH SIGNIFICANCE

New materials and design methods are being investigated for the design of

bridges to eliminate the current corrosion problems. A research project was initiated at

6

the University of Missouri to develop a nonferrous hybrid reinforcement system for

concrete bridge decks using FRP rebars and discrete randomly distributed polypropylene

fibers. This study will provide new insights for bridge engineers and researchers.

1.4. PREVIOUS RESEARCH ON STEEL-FREE BRIDGE

The steel-free design concept in concrete bridge decks is not new. Considering the

arching action in the decks between supports, Canadian researchers have developed a

system that realizes the idea of steel-free. The steel-free concrete bridge deck system

utilized transverse steel straps welded to the top flange of each girder. The straps

prevented the outward movement of the girders, as shown in Figure 1.1. After the

cracking of the concrete, the concrete slab sustained loads through an arching action that

is enabled by compressive membrane forces in the concrete. The polypropylene fibers

were added to the concrete to control the plastic shrinkage cracking of the deck. To

guarantee the composite action between the concrete slab and the steel girder, shear studs

were used. Table 1.1 lists the steel-free bridges constructed in Canada (Bakht and Mufti,

1998).

Tensile Strap Force

Compressive Membrane Forces

Steel Straps

<120 in.

P

Figure 1.1. Typical Cross Section of Steel-Free Concrete Bridge Deck

(Bakht and Mufti, 1998)

7

Table 1.1. Summary of Canadian Steel-Free Bridges (Bakht and Mufti, 1998)

Bridge Girder Spacing

Slab Thickness Features

Slamon River (1995)

Steel Plate 8.86 ft 8 in.

-first steel-free deck slab in new construction -transverse confinement by welded steel straps -barrier wall loads taken to girders -6% more expensive than conventional slab

Chatham (1996)

Steel Plate 6.89 ft 7 in.

-first steel-free deck slab used in rehabilitation -transverse confinement by welded steel straps -CFRP for transverse negative bending -first barrier wall with double-headed tension bars and GFRP grid -significantly more expensive than conventional slab

Crowchild Trail

(1997)

Steel Plate 6.56 ft 7.4 in.

-transverse confinement by studded straps -GFRP for transverse negative moments -first steel-free deck slab in continuous-span bridge -selected in competitive bidding against conventional slab

Waterloo Creek (1998)

Precast Concrete 9.18 ft

7.6 in.

-first steel-free deck slab on precast concrete girders -transverse confinement by studded straps -nearly the same cost as conventional slab

Lindquist (1998)

steel plate 11.48 ft 6 in.

-first steel-free precast panel -transverse confinement with studded straps embedded in precast panel -recorded girder spacing to minimum thickness ratio, being 23.3 -30% cheaper than conventional panel

In recent years, there has been a great deal of activity in use of FRP reinforcement

in the concrete bridge decks in the United States. A convenient database has been

developed by the United States Department of Transportation’s Federal Highway

Administration (FHwA, 2003) to provide information on the projects in United States

using FRP reinforcement in concrete bridge decks.

8

The first FRP rebar reinforced bridge deck constructed across Buffalo Creek in

McKinleyville, West Virginia, is worthy of note. The McKinleyville Bridge was a 177-ft

long, three-span, continuous structure accommodating two lanes of traffic. The design of

the FRP reinforced concrete deck was based on a design method developed at the

Constructed Facility Center at West Virginia University. The design method is similar to

the procedures for the highway bridges working stress design of transversely reinforced

concrete decks, as described in the American Association of State Highway

Transportation Officials' Standard Specifications. The design required a deck thickness of

9 in. and #4 FRP rebars as the main transverse reinforcement of a 6-in spacing. The main

reinforcement was tied to #3 FRP bars for distribution reinforcement, also at 6 in. spacing.

The clean covers for top and bottom reinforcements were 1 ½ in. and 1in, respectively.

The Sierrita de la Cruz Creek Bridge in Potter County, Texas, had two of its seven

spans redecked with an FRP cast-in-place reinforced concrete deck slab, where the top

mat was made of GFRP bars (#6 at 5.5 in. center to center in both directions), and the

bottom mat was made of epoxy-coated steel rebars (Bradberry, 2001). The composite

deck slab also had stay-in-place forms made of concrete precast panels reinforced with

epoxy-coated steel rebars at the bottom.

More recently, a new FRP reinforced bridge deck was built inWaupum,

Wisconsin. The uniqueness of this bridge was the combination of three different FRP

materials. The FRP reinforcing system was made up of three different components: a

stay-in-place FRP pultruded deck panel, standard FRP rebars, and a bi-directional FRP

pultruded grid panel, as shown in Figure 1.2 (Berg et al., 2004). The deck was 8 in. thick

with 1.5 in. of cover at the top. The deck panels served as the bottom tensile

9

reinforcement for the deck in the transverse direction. Standard FRP rods served as the

temperature and shrinkage reinforcement. The grid served as the top reinforcement of the

concrete deck.

Figure 1.2. FRP Panels, FRP Rebars and FRP Grid Used in Wisconsin

1.5. OUTLINE OF THE REPORT

Chapter 2 gives background information of the bridge design procedures,

including the AASHTO Standard Specifications, AASHTO LRFD and MoDOT Design

Approach.

Chapter 3 provides the details of the experimental program, including the

experimental variables, testing specimens, testing matrix, and test setup and procedures.

FRP Grid FRP Rebar

FRP Panel

10

Chapter 4 to Chapter 6 cover the bond characteristics, flexural behavior, and the

durability performance of this hybrid system. The test specimens, test setup, test

procedures, test results, and some theoretical derivations are presented.

Chapter 7 presented the design recommendations for the FRP/FRC hybrid

concrete bridge deck.

Chapter 8 contains all the conclusions that were obtained based on the test results

and theoretical analysis. Furthermore, some recommendations for the future study are

also provided.

11

2. BACKGROUND

2.1. GENERAL

The proposed FRP/FRC hybrid reinforcement system is a novel approach for

bridge deck application. Neither field application nor research has been found in the open

literature. To facilitate development of the design procedures for the new deck system

that has mechanical and service performance comparable to that of conventional steel

reinforced concrete decks, the current AASHTO and MoDOT design procedure in the

deck slabs of steel girder bridges were reviewed.

2.2. AASHTO AND MODOT DECK SLAB DESIGN PRCEDURES

Decks are the platform of a roadway extending horizontally over a crossing.

Decks have many functions. In addition to provide the riding surface for vehicular traffic,

they also serve several structural purposes. The bridge deck distributes the vehicular

wheel loads to the girders, which are the primary load-carrying members on a bridge

superstructure. And the deck is often composite with the main girders and, thus, helps to

increase the flexural strength and torsional rigidity of the bridge. For most new bridges,

cast-in-place concrete bridge decks are chosen as the most appropriate deck type.

Typically, these types of decks are designed as a transverse beam supported by the main

longitudinal girders. While cast-in-place concrete decks designed as transverse beams

have been the standard for decades, bridge deck type and design is continuing to evolve.

2.2.1. Loads Relative to Deck Slab Design. From the construction stage through

its service life, the bridge deck must sustain various loads. The bridge engineer must take

12

into account a wide variety of loads which vary based on duration (permanent or

temporary), deformation (concrete creep, thermal expansion, etc.), and effect (shear,

bending, compression, torsion, etc.).

• Permanent Loads

(a) Dead Load. The dead load on a deck slab is the aggregate weight of all

elements. This includes the deck, wearing surface, stay-in-place forms, sidewalks and

railings, parapets, signing, and utilities.

(b) Superimposed Dead Load. Superimposed dead loads are those loads added

onto the deck after it has cured. From the list of elements mentioned previously, the

designer should treat items such as sidewalks, railings, parapets, signing, utilities and the

wearing surface independently.

• Temporary Loads

(a) Vehicle Live Load. To help designers accurately model the live load on a

structure, hypothetical design vehicles based on truck loading, such as HS20, were

developed by AASHTO.

(b) Impact. In order to account for the dynamic effects of the loading of a

moving vehicle onto a structure, an impact factor is used as a multiplier for certain

structural elements.

(c) Construction Loads. During the construction period, large stresses in the

structural members may be induced. It is the engineers’ responsibility to consider this

effect.

• Deformation and Response Loads

13

(a) Shrinkage. Shrinkage is the natural change in volume of concrete that occurs

over time. While recommended methods of optimal curing will reduce shrinkage effects,

reinforcement is added perpendicular to the main reinforcement to account for tensile

stresses induced by shrinkage.

(b) Thermal Forces. The effects of thermal forces on a structure are significant

and should not be underestimated by the designer. In general, thermal forces are caused

by fluctuations in temperature. Reinforcements are required on the top of the deck and

also in the negative regions for continuous joint-free decks to withstand the tensile

stresses induced by temperature change.

2.2.2. Detail Design Procedures. AASHTO Standard Specifications, MoDOT

Bridge Manual, and AASHTO LRFD design procedures for a typical girder bridge deck

are discussed in detail in the following sections.

2.2.2.1. AASHTO standard specifications. The American Association of State

Highway and Transportation Officials (AASHTO) has published design specifications for

many decades. These specifications, adopted throughout the United States, have been

updated periodically. AASHTO’s 17th Edition, Standard Specifications for Highway

Bridges, published in 2002, is the latest specification.

STEP 1: Choose the general parameters

Some general design parameters have to be decided first, such as (1) slab

thickness; (2) girder spacing; (3) girder type; (4) reinforced steel; (5) concrete strength;

and (6) future wearing surface (FWS).

STEP 2: Compute the effective span length

14

CASE A: slab on two supports:

The effective span length is decided as follows when slab on two supports:

S = the Distance Center to Center of Supports & S ≤ Clear Span +Slab Thickness

(AASHTO 3.24.1.1)

CASE B: slab supported on steel stringers over more than two supports

The effective span length is as follows when slab on more than two supports:

S = Distance between Edges of Top Flange + ½ Top Flange Width

(AASHTO 3.24.1.2 (b))

STEP 3: Compute moment due to dead load

(a) Dead Load:

Dead load consists of the following:

(1) slab; (2) FWS; (3) barrier curb; (4) media; (5) railing; (6) pedestrian curb

and fence

(b) Moment calculation:

CASE A: simple spans:

The moment induced is:

MDL = 8

2WS,

CASE B: slabs continuous over more than 2 supports:

The moment induced is:

MDL = 10

2WS ,

where W = dead load

S = effective span length

15

(AASHTO does not give specific dead load moment equations. This is the

generally accepted expression).

CASE C: cantilever slabs:

Compute the moments induced by different loads and add them together.

STEP 4: Compute moment due to live load + impact

(A) Interior spans.

(1) Calculate the moment induced by live load, MLL

Moment induced by live load is computed as follows:

CASE A: Main reinforcement perpendicular to traffic

(a) simple span

MLL= 2( )32

S P+ (AASHTO 3.24.3.1)

(b) slabs continuous over more than two supports

MLL= 20.8( )32

S P+ (AASHTO 3.24.3.1)

where P = Live load

= 12,000lb for H15 & HS15 loading or

= 16,000lb for H20 & HS20 loading

CASE B: Main reinforcement parallel to traffic

(a) simple span

HS20 loading:

Spans up to and including 50 feet: LLM = 900S foot-pounds;

Spans 50 feet to 100 feet: LLM =1,000 (1.30S-20.0) foot-pounds.

HS15 loading:

16

Use ¾ of the values obtained from the formulas for HS 20 loading.

(b) slabs continuous over more than two supports

Moments in continuous spans shall be determined by suitable analysis

using the truck or appropriate lane loading.

(AASHTO 3.24.3.2)

(2) Compute the moment induced by live load and impact, MLL+I

Moment induced by the live load and impact is computed as follows:

MLL+I = MLL×I

where: I = Impact coefficient

= 125

50+L

≤ 0.3 (AASHTO 3.8.2.1)

L = Length in feet of the portion of the span that is loaded to produce the

maximum stress in the member.

(B) Cantilever Spans

(a) Truck Loads

The moment induced by the truck load is computed as follows:

CASE A: Reinforcement perpendicular to traffic

MLL = P×X/E (foot-pounds)

where: P = Wheel load

E = the effective length of slab resisting post loadings

= 0.8X+3.75

X = the distance in feet from load to point of support

(AASHTO 3.24.5.1.1)

CASE B: reinforcement parallel to traffic

17

MLL = P×X/E

where: E = 0.35X+3.2≤7.0 feet

(AASHTO 3.24.5.1.2)

(b) Railing Loads

MLL = Py/E

where: P = Highway design loading=10kips

Y = moment arm

E = 0.8X+3.75 feet, where no parapet is used

= 0.8X+5.0 feet, where a parapet is used

X = the distance is feet from the center of the post to the point under

investigation

* Railing and wheel loads shall not be applied simultaneously.

(AASHTO 2.7; AASHTO 3.24.5.2)

STEP 5: Compute factored bending moment

The factored bending moment can be expressed as follows:

Mu = 1.3(MDL+1.67MLL+I)

Mu ≥ 1.2Mcr (This requirement may be waived if the area of reinforcement

provided at a section is at least one-third greater than that required

by analysis based on the loading combinations)

STEP 6: Protection against Corrosion

The minimum cover for the slab in inches is shown in Table 2.1.

STEP 7: Compute the Main Reinforcement

18

The main reinforcement needed is computed based on the following equations:

)ad(fAM ySn 2−=φ

Table 2.1. Minimum Cover (inches) (AASHTO 8.22)

Concrete deck slabs in mild climate

Concrete deck slabs which have no protective corrosion

protection and are frequently exposed to deicing salts

Top Reinforcement 2 2.5

Bottom reinforcement 1 1

)85.0/( ' bffAa cys= (AASHTO 8.16.3.2.1)

bs ρρ 75.0≤ (AASHTO 8.16.3.1.1)

)000,87

000,87(85.0 '1

yy

cb ff

f+

=βρ (AASHTO 8.16.3.2.2)

All the above equations can be derived based on the normal assumptions used in

the RC members, as shown in Figure 2.1.

STEP 8: Compute distribution steel in bottom of slab

To provide for the lateral distribution of the concentrated live loads,

reinforcement shall be placed transverse to the main steel reinforcement in the bottom of

the slabs except culvert or bridge slabs where the depth of fill over the slab exceeds 2 feet.

(AASHTO 3.24.10.1)

19

d

εs=εyf s=f y

c

εcu=0.0030.85f c'

a=βc

Figure 2.1. Stress-Stain Diagram

(a) for main reinforcement parallel to traffic

Percentage = %S

50100≤

(b) for main reinforcement perpendicular to traffic

Percentage = %S

67220≤

where S = the effective span length in feet (AASHTO 3.24.10.2)

STEP 9: Shrinkage & temperature reinforcement

Reinforcement for shrinkage & temperature stresses shall be provided near

exposed surfaces of slabs not otherwise reinforced.

As ≥ 1/8 in.2/ft in each direction

Spacing ≤ 3hslab

≤ 18 in. (AASHTO 8.20)

20

STEP 10: Negative moment reinforcement over supports

In the negative regions of continuous spans, the minimum longitudinal

reinforcement, including the longitudinal distribution reinforcement, must equal or

exceed 1 percent of the cross sectional area of the concrete slab. Two-thirds of this

required reinforcement is to be placed in the top layer of the slab within the effective

width. (AASHTO 10.38.4.3)

STEP 11: Check serviceability

The crack width should be limited during the service conditions. Because of the

scatter in crack widths, AASHTO or MoDOT do not limit crack width, but rather limits

the magnitude of the term:

3 AdfZ cs=

Based on this method, the allowable stress in the reinforcement is limited as

follows:

(a) compute fs at service load

ss

MfA jd

= ;

(b) compute allowable fs,allow

yc

allows fAdZf 6.0

)( 3/1, ≤= (AASHTO 8.16.8.4)

where A=effective tension area, in square inches, of concrete surrounding the flexural

tension reinforcement and having the same centroid as that reinforcement, divided by the

number of bars or wires. When the flexural reinforcement consists of several bar or wire

sizes, the number of bars or wires shall be computed as the total area of reinforcement

21

divided by the largest bar or wire used. For calculation purposes, the thickness of clear

concrete cover used to compute A should not be greater than 2 inches.

dc = distance measured from extreme tension fibre to center of the closest bar or

wire in inches. For calculation purposes, the thickness of the clear concrete cover used to

compute dc should not be taken greater than 2 inches.

Z ≤ 170kips/in for members in moderate exposure conditions

≤ 130kips/in for members in severe exposure conditions

(c) check

fs≤ fs,allow

2.2.2.2. MoDOT bridge manual. The MoDOT Bridge Manual, developed for

the design of bridges in the state of Missouri, builds on and references the latest

AASHTO Standard specifications. It has more restricted conditions on design than

AASHTO LFD. Load Factor Design methods for all bridges (both steel and concrete) are

used.

STEP 1: Choose the general parameters

First of all, some general design parameters have to be decided.

(1) slab thickness: cast-in-place concrete slab with conventional forming with

thickness of 8.5 in.; or 3 in. prestressed concrete panels with 5-1/2 in. minimum cast-in-

place concrete.

(2) concrete strength is recommended equal to 4000 psi, and the stress at service

is 1600 psi.

(3) reinforcing steel is equal to 60,000 psi.

(4) modular ratio of elasticity between concrete and reinforcement is 8.

22

(5) future wearing surface (F.W.S) is 3 in. thick and is equal to35 lb/ft2.

(6) girder type & spacing should be decided case by case.

(BM Sec 3.30.1.2-1; 3.30.1.2-2)

STEP 2: Compute the effective span length

The effective span length is decided as follows:

CASE A: slab on two supports:

S = the Distance Center to Center of Supports & S ≤ Clear Span +Slab Thickness

CASE B: slab supported on steel stringers over more than two supports

S = distance between Edges of Top Flange + ½ Top Flange Width

(AASHTO 3.24.1; BM Sec3.30.1.2-1)

STEP 3: Moment over Interior Support

(a) compute moment due to dead load

CASE A: Simple spans:

MDL =2

8WS ,

CASE B: slabs continuous over more than 4 supports:

MDL = -0.100WS2

CASE C: slabs continuous over more than 5 supports:

MDL = -0.107WS2,

where W = dead load

S = effective span length

(BM Sec 3.30.1.2-1)

(b) compute moment due to live load

The moment due to the live load can be computed by two cases as follows:

23

CASE A: main reinforcement perpendicular to traffic

(1) simple span

The moment is decided as:

MLL = pS )32

2( +

(2) slabs continuous over more than two supports

The moment is decided as:

MLL = pS )32

2(8.0 +

where P = Live load

= 12,000lb for H15 & HS15 loading or

= 16,000lb for H20 & HS20 loading

(AASHTO 3.24.3, BM Sec 3.30.1.2-1)

CASE B: main reinforcement parallel to traffic

(1) simple span

HS20 loading:

Spans up to and including 50 feet LLM = 900S foot-pounds;

Spans 50 feet to 100 feet: LLM = 1,000 (1.30S×20.0) foot-pounds.

HS15 loading:

Use ¾ of the values obtained from the formulas for HS20 loading.

(2) slabs continuous over more than two supports

Moments in continuous spans shall be determined by suitable analysis

using the truck or appropriate lane loading.

(AASHTO 3.24.3.2)

24

(c) compute moment due to live load + impact

The moment is decided as:

MLL+I = MLL×I

where I = Impact coefficient

= 125

50+L

≤ 0.3 (AASHTO 3.8.2.1)

L = Length in feet of the portion of the span that is loaded to produce the

maximum stress in the member.

STEP 4: Cantilever moment

(a) compute moment due to dead load

Moment induced by dead load can be expressed as follows:

Dead load Moment =Moment due to slab, future wearing surface (F.W.S) and

safety barrier curb (S.B.C.)

(b) compute moment due to live load + impact

Wheel Loads

The moment due to the wheel load can be computed as the following two cases:

CASE A: reinforcement perpendicular to traffic

The moment due to live load and impact is:

MLL+I = P×X/E

where: P = wheel load (apply impact factor)

E = the effective length of slab resisting post loadings

= 0.8x+3.75

X = the distance in feet from load to point of support

(AASHTO 3.24.5.1.1)

25

CASE B: reinforcement parallel to traffic

The moment due to live load and impact is:

MLL+I = P×X/E

Where: E = 0.35X+3.2≤7.0 feet (AASHTO 3.24.5.1.2)

Collision Loads

The moment due to the collision load can be computed as the follows:

MCOLL = EPy

where: P = 10 kips (collision force)

y = Moment arm (curb height + 0.5 slab thickness)

E = 0.8X+5.0

where: X = Dist. from C.G. of S.B.C. to support

Find the greater of the two (wheel load & collision load) for design load

Mu = 1.3(MDL+1.67MLL+I)

(BM Sec 3.30.1.2-1)

STEP 5: Determine the design moment

Use the bigger one of the cantilever moment and the interior moment as the

design moment.

STEP 6: Protective against Corrosion

3 inches clear cover preferred minimum for cast-in-place, 2-3/4 inches clear cover

preferred minimum for prestressed panels to accommodate No.8 bars over supports and

2-1/2 inches clear cover absolute minimum by AASHTO 8.22.1.

(BM Sec 3.30.1.2-1A)

STEP 7: Determine the top transverse reinforcement

26

By the normal design equations for the reinforced members, the transverse

reinforcement can be decided as follows:

(1) )2

( adfAM ySn −=φ

)bf./(fAa 'cys 850=

(AASHTO 8.16.3)

(2) Check ρmax & ρmin

max 0.75 bρ ρ=

'

10.85 87,0000.75[ ( )]87,000

c

y y

ff fβ

=+

(AASHTO 8.16.3)

The minimum reinforcement shall provide:

'2

min 1.67( ) c

y

fhd f

ρ =

STEP 8: Bottom transverse reinforcement

For design of the bottom transverse reinforcement, the following applied:

(a) Assume the positive moment is the same as the negative moment

(b) Remove 1.0 inch of wearing surface from the effective depth.

Note: When using prestressed panels, P/S panels replace the bottom transverse

reinforcement.

(BM Sec. 3.30.1.2-1)

STEP 9: Longitudinal distribution reinforcement

Distribution reinforcements include the reinforcements for shrinkage and

temperature and over the supports, as shown in Figure 2.2.

27

(a) Top of Slab

Use # 5 bars at 15 in. spacing for temperature distribution, as shown in Figure 2.2.

(BM Sec. 3.30.1.2-1A)

(b) Bottom of Slab

The distribution reinforcement at the bottom is decided as follows and shown in

Figure 2.2.

CIP SLAB P/S PANEL OPTION Figure 2.2. Distribution Reinforcement (Gupta, 2001)

Note: cl.=Clear Cover

(1). For main reinforcement parallel to traffic

Percentage = %50100≤

s

(2). For main reinforcement perpendicular to traffic

Percentage = %67220≤

s

where S = the effective span length in feet

(AASHTO 3.24.10)

Neg. Moment Reinf.

#5 @ 15 in. (Temp. Reinf.)

Dist. Reinf. By design

Main Reinf. By design 3in. prestressed Panel 1in.

Cl.

Cl.

Neg. Moment Reinf.

#5 @ 15 in. (Temp. Reinf.)

1in

Cl.

28

STEP 10: Negative moment reinforcement over supports

For slabs on steel girder, add #6 bars at 5 in. between #5 bars.

(AASHTO 10.38.4)

STEP 11: Serviceability Requirement

The same method is adopted as AASHTO to control the crack width.

(1) Allowable Stress

, 1/3 0.6( )s allow y

c

Zf fd A

= ≤×

where: Z=130 k/in.

dc = Distance from extreme tension fiber to center of closest bar (concrete cover

shall not be taken greater than 2)

A = Effective tension area of concrete

= 2dcS

S = Bar spacing center to center

(2) Actual Stress

ws

s

MfA j d

=× ×

;

where: Mw =Service load moment;

As =Area of steel;

j=moment arm coefficient

ρρρ nnnk −+= 2)( 2 ;

bdAs=ρ ;

b= Effective width;

29

d= Effective depth;

(3) Check (BM Sec. 3.30.1.2-1A)

fs ≤ fs,allow

2.2.2.3. AASHTO LRFD. AASHTO LRFD Bridge Design Specifications, first

published in 1994, is based on load resistance factors and employs the load and resistance

factor design (LRFD) methodology. The factors have been developed from the theory of

reliability based on current statical knowledge of loads and structural performance.

STEP 1: Determine the deck thickness

1030deck

St f+=

Where S = the girder spacing. The minimum required deck thickness, excluding

provisions for grinding, grooving, and sacrificial surface is tdeck = 7.0 in.

(LRFD Table 2.5.2.6.3-1, LRFD 9.7.1.1)

STEP 2: Compute the effective length

STEP 3: Determine unfactored dead loads

For simplicity, the deck will be designed as a one-foot wide one way slab.

Therefore, all loads will be determined on a per foot width.

STEP 4: Determine unfactored live loads

a) Wheel load:

Truck axle load = 32 kips/axle

The axle load of 32 kips is distributed equally such that each wheel load is 16 kips.

(LRFD 4.6.2.1, 3.6.1.3.3, 3.6.1.2.2)

b) Calculate the number of live load lanes

30

Generally, the number of design lanes should be determined by taking the integer

part of the ratio w/12.0, where w is the clear roadway width in FT between curbs

and/or barriers.

(LRFD 3.6.1.1.1)

c) Determine the wheel load distribution

The width of the primary strip is listed in Table 2.2.

Table 2.2. Width of the Primary Strip

Type of Deck Direction of Primary Strip Relative Traffic

Width of Primary Strip (in)

Concrete: • Cast-in-place

• Cast-in-place with stay-

in-place concrete formwork

• Precast, post-tensioned

Overhang Either Parallel or Perpendicular Either Parallel or Perpendicular Either Parallel or Perpendicular

45.0 + 10.0x +M: 26.0 + 6.6s -M: 48.0 + 3.0s +M: 26.0 + 6.6s -M: 48.0 + 3.0s +M: 26.0 + 6.6s -M: 48.0 + 3.0s

(LRFD 4.6.2.1, Table 4.6.2.3-1, 4.6.2.1.3)

d) Determine the live loads on one foot strip:

The unfactored wheel loads placed on a one foot strip based on the width of

the strips, that is, 16 kips/w, where w = the width of primary strip.

STEP 5: Determine the wheel load location to maximize the live-load

moment

31

Apply the unfactored loads to a continuous one-foot-wide beam spanning across

the girders and find the maximum moment value.

The design section for negative moments may be taken as follows: one-quarter the

flange width from the centerline of support for steel beam.

(LRFD 4.6.2.1.6)

STEP 6: Determine the load factors

The factored load can be decided as follows:

i iQ qη γ= ∑

where Q = factored load

η = load modifier

γ = load factor

q = unfactored loads

(LRFD 1.3.2.1, 3.4.1)

(a) Load modifier

The load modifier, η, used in the above equation can be calculated as follows:

η = ηDηRηi>0.95

where for strength limit state

ηD =1.05 for non-ductile components and connections

= 0.95 for ductile components and connections

ηR= 1.05 for non-redundant members

= 0.95 for redundant members

For other limit state

ηD = ηR =1.0

32

ηi ≥1.05 if a bridge is deemed of operational importance

ηi ≥0.95 otherwise

(LRFD 1.3.3, 1.3.4, 1.3.5)

(b) Load factor

Load factors are listed in Table 2.3.

Table 2.3. Load Factors

Maximum Load Factor

Minimum Load Factor

Slab and barrier rail γ DCmax=1.25 γ DCmin=0.90 Future wearing surface γ Dwmax=1.50 γ Dwmin=0.65

γ LL =1.75

γ IM =1.75 (Strength-1 Load Combination)

(LRFD Table 3.4.1-1, Table 3.4.1-2, 3.4.1, 3.3.2)

(c) Multiple presence factor

m1lane = 1.20, m2lane = 1.00, m3lane = 0.85, m>3lane = 0.65

(LRFD Table 3.6.1.1.2-1)

(d) Dynamic load allowance

IM = 0.33

(LRFD 3.6.1.2, 3.6.2)

STEP 7: Calculate the factored moments

[ ( ) ( ) ( ) ( )(1 )( )( )u DC DD DC DB Dw DW LL LLM M M M m IM Mη γ γ γ γ= + + + +

33

As specified in LRFD 4.6.2.1.1, the entire width of the deck should be designed

for these maximum moments.

STEP 8: Determine the slab reinforcement detailing requirements

(a) Determine the top deck reinforcement cover

The top deck requires a minimum cover of 2 in. over the top mat reinforcement

(when exposing to deicing salt, 2.5 in.), unless environment conditions at the site require

additional cover. This cover does not include additional concrete placed on the deck for

sacrificial purposes, grooving, or grinding.

The cover of the bottom of the cast-in-place slabs is 1.0 in. for steel bar up to No.

11 and 2.0 in. for No. 14 to No. 18.

(LRFD Table 5.12.3-1)

(b) Determine deck reinforcement spacing requirements

1.5S t≤ × (t = thickness of slab) and S <18 in.

The minimum spacing of reinforcement is determined by LRFD 5.10.3.1 and is

dependent on the bar size chosen and aggregate size.

(LRFD 5.10.3.2)

(c) Determine distribution reinforcement requirements

Reinforcement is needed in the bottom of the slab in the direction of the girders in

order to distribute the deck loads to the primary deck slab reinforcement.

Reinforcement should be placed in the secondary direction in the bottom of the

slabs as a percentage of the primary reinforcement for positive moment as follows:

• For primary reinforcement parallel to traffic:

100 / 50%S ≤

34

• For primary reinforcement perpendicular to traffic:

220 / �� 67%S ≤

where S = the effective span length taken as equal to the effective length specified in

Article 9.7.2.3 (in unit of foot)

(LRFD 9.7.3.2)

(d) Determine the minimum top slab reinforcement parallel to the girders

Reinforcement for shrinkage and temperature stresses should be provided

near surfaces of concrete exposed to daily temperature changes and in structural

mass concrete.

The top slab reinforcement should be a minimum as required for shrinkage

and temperature of 0.11Ag/fy. And it should not be spaced farther than either 3.0

times the slab thickness or 18 inches.

(LRFD 5.10.8.2)

STEP 9: Check serviceability

The same method is adopted as previous design procedures.

1/3 0.6( )sa y

c

Zf fd A

= ≤

where A = effective tension area, in square inches, of concrete surrounding the flexural

tension reinforcement and having the same centroid as that reinforcement, divided by the

number of bars or wires. When the flexural reinforcement consists of several bar or wire

sizes, the number of bars or wires shall be computed as the total area of reinforcement

divided by the largest bar or wire used. For calculation purposes, the thickness of the

clear concrete cover used to compute A should not be taken greater than 2 inches.

35

dc = distance measured from extreme tension fibre to center of the closest bar or wire in

inches. For calculation purposes, the thickness of the clear concrete cover used to

compute dc shall not be taken greater than 2 inches.

Z ≤ 170kips/in. for members in moderate exposure conditions, which corresponding to

the limitation of crack width of 0.016 in.

≤ 130kips/in. for members in severe exposure conditions, which corresponding to the

limitation of crack width of 0.013 in.

(LRFD 5.7.3.4)

2.2.3. Summary of the Design Procedures. A summary of the design

procedures of the typical girder bridge deck is shown in Table 2.4.

36

Table 2.4. Bridge Deck Design Procedures

AASHTO Standard Spec.

AASHTO LRFD MODOT NOTES

Step1: Choose general parameters

Step1: Choose general parameters

Step1: Choose general parameters

AASHTO: 1030

S ft+ ;

MoDOT: 8.5 in. for C.I.P

Step 2: Compute effective span length

Step 2: Compute effective span length

Step 2: Compute effective span length

Step 3: Compute moment due to dead load

Step 3: Determine unfactored dead load

Step 3: Determine moment over interior support

Step 4: Compute moment due to live load + impact

Step 4: Determine unfactored live load

Step 4: Determine cantilever moment

Step 5: Compute factored bending moments

Step 5: Calculate unfactored moments

Step 5: Determine design moments

Step 6: Determine the load factors

Step 7: Calculate factored moments

1. LFD: 232LL

SM P+= ;

LRFD: Based on structural analysis. Loads are applied to a continuous 1-ft-wide beam spanning across the girder. Wheel load= 16 kips/W, where W is the width of primary strip.

2. LFD: 50 0.3125

IL

= ≤+

;

LRFD: IM=0.33 3. LFD:

Mu= 1.3(MDL+1.67MLL+I); LRFD:

[ ( ) ( )u DC DD DC DBM M Mη γ γ= + ( ) ( )(1 )( )( )Dw DW LL LLM m IM Mγ γ+ + +

Step 6~10: Determine reinforcement in details (main reinforcement, bottom distribution reinforcement, shrinkage and temperature reinforcement, reinforcement over supports

Step 8: Determine reinforcement in details

Step 6~10: Determine reinforcement in details

1.Temperature reinforcement: AASHTO: 1/ 8SA ≥

3 18"Spacing slab≤ ≤ MODOT: #5 @ 15” 2.Reinforcement over support: AASHTO: 0.01S gA A≥ MODOT: #6 @ 5” between # 5 bars 3. Cover AASHTO: 2.5” for exposing to deicing salts. MODOT: 3” for C.I.P

Step 11: Check serviceability

Step 9: Check serviceability

Step 11: Check serviceability

37

3. EXPERIMENTAL PROGRAM

3.1. DETAILS OF THE EXPERIMENTAL PROGRAM

In this research program, the structural performances of the steel-free hybrid

reinforcing system will be extensively investigated. The overall experimental study plan

includes (1) laboratory studies of static and fatigue bond performances between FRP and

FRC hybrid system; (2) laboratory studies of static and fatigue flexural characteristics for

this hybrid system; (3) accelerated durability tests of the hybrid system; and (4) static and

fatigue tests on full-scale hybrid reinforced composite bridge decks.

3.1.1. Studies of Bond Characteristics. Bond is essential for reinforced concrete

structures. Three test methods are commonly used to study the bond characteristics:

namely, pullout test, splitting bond test, and flexural beam test. These test methods

provide information to bond behaviors. The pullout test can clearly represent the concept

of anchorage and is usually adopted to study the bond behavior between rebar and

concrete. Although the pullout test puts concrete in compression and the reinforcing bar

in tension, a stress condition that is not representative of a RC beam or a bridge deck, a

reasonable correlation was found between structural performance and measures of

performance in the pullout test (Cairns and Abdullah, 1995). The splitting bond test can

be used to study the splitting bond behavior under different cover thicknesses. The effect

of the transverse reinforcement on bond behavior can be avoided when properly designed.

The splitting bond test can simulate the stress field of real structures to some extent. The

flexural beam test has the advantage of representing an actual stress field in real beams

and slabs and the cover effects on bond. However, it requires considerable confining

38

reinforcement to avoid a shear failure, and so bond splitting failures may not occur

(Cairns and Plizzari, 2003). In this testing program, all three types of bond tests were

investigated and their results were compared.

3.1.1.1. Bond study by pullout test method. Test specimens, test setup, and test

procedures are discussed in the following sections.

3.1.1.1.1. Pullout test specimens. A total of 45 pullout specimens were studied.

The experimental variables included FRP rebar type (CFRP vs. GFRP), FRP rebar size

(#4 vs. #8), concrete with or without polypropylene fibers, embedment length, and the

loading conditions (monotonic vs. fatigue). Specimens were divided into 15 groups, as

shown in Table 3.1.

The notation for specimens is as follows: the first character (“P” or “F”) indicates

the plain concrete or FRC; the second character (“C” or “G”) indicates the rebar type,

CFRP or GFRP; the third character (#4 or #8) is the bar size in US designation; the fourth

character (“05” or “10”) refers to the embedment length in the bar diameter db; the last

character (“M” or “F”) represents monotonic or fatigue loading.

Test specimens were designed according to RILEM recommendations

(International Union of Laboratories and Experts in Construction Materials, Systems and

Structures) with a 5 db embedment length (some with 10 db to study the effect of different

embedment lengths), which was generally assumed to be able to represent local bond

behavior. FRP rods were embedded in concrete to a predetermined length, ld, in the

concrete block. PVC pipe was used as a bond breaker at the first 5db length to minimize

the bottom plate’s restraint effect on the FRP rebar and to eliminate any undesirable

confinement that may affect bond characteristics. More details are shown in Figure 3.1.

39

Table 3.1. Details of Pullout Specimen

Loading Conditions Specimen I.D. Materials Vf (%) ld/db

PC405M #4 CFRP 0 5 PG405M #4 GFRP 0 5 Plain

Monotonic PG805M #8 GFRP 0 5 FC405M 0.5 5 FC410M #4 CFRP 0.5 10 FG405M 0.5 5 FG410M #4 GFRP 0.5 10 FG805M 0.5 5

FRC Monotonic

FG803M #8 GFRP 0.5 3 PC405F #4 CFRP 0 5 PG405F #4 GFRP 0 5 Plain

Fatigue PG805F #8 GFRP 0 5 FC405F #4 CFRP 0.5 5 FG405F #4 GFRP 0.5 5 FRC Fatigue FG805F #8 GFRP 0.5 5

Note: Each testing group has three test specimens. 3.1.1.1.2. Test setup and procedures. In the following sections, the test setup

and procedures for the static bond and fatigue bond are presented.

(A) Static pullout bond test. The pullout tests were conducted in an MTS 880

machine. The test was run through close-loop displacement control using an external

LVDT 2 (Linear Variable Differential Transformer) as a feedback device (see Figure 3.1).

Because the FRP rods were weak in the transverse direction, special anchorages were

used to protect the rebar from crushing. The free end of the FRP rebar was embedded in a

steel pipe using an expansive grout as an interface. The pullout was then performed by

pulling the steel pipe at one end, with the concrete block being encased in the steel

reaction frame, as shown in Figure 3.1. The rebar’s slip relative to the concrete was

computed from measurements of both LVDTs placed at both ends of the rebar, as shown

40

Steel Anchorage

Expansive Grout

Lower moving head

LVDT 2

Steel Tube

Bolt welded to tube

y=10 in (14 in.) for #4 (#8)specimens;

FRP Rebary

RegionBonded

Reaction Frame

LVDT 1 PVC Pipe

4 in.

Upper Stationary Head

10db 1in.

le

5db

PVCConduitLead Sheet

Figure 3.1. Pullout Test Specimen and Test Setup

in Figure 3.1. To minimize the eccentricity effect, lead sheets were placed between the

concrete block and the reaction frame.

The pullout tests were monotonic by increasing the slip at 0.03 in/min rate. All

measurements, including pullout load and displacements (slips), were recorded by a

computer-controlled data acquisition system at the rate of 2 data/sec.

(B) Fatigue pullout bond tests. Fatigue tests were conducted under load control.

A 5 Hz sinusoidal pattern of load cycles was used. Measurements, such as pullout load,

slips at loaded end and slips at free end, were measured at 1, 10, 100, 1000, 10,000,

41

100,000, 500,000, and 1,000,000 cycles to study the residual slip development and

progressive bond stiffness degradation. To eliminate the possible errors resulting from

recording at high frequency, the loading frequency rate was reduced to 0.1 Hz. After

reaching the maximum cycles of 1 million, the surviving specimens were subjected to

monotonic pullout tests to failure.

• Stress Range. To simulate the real bridge loading conditions, a statistical

analysis was conducted based on the MoDOT Bridge Design Manual (2001). A value of

u

DL

MM = 5% to 15%,

u

ILLDL

MMM ++ = 45% to 55% was calculated for the typical steel

reinforced bridge deck. To avoid premature fatigue fracture of the FRP rebar before bond

failure, the fatigue strength of the FRP rebar, which was much lower than its static

strength, was also taken into account. ACI 440 recommends 0.20ffu for GFRP and 0.55ffu

for CFRP, respectively. Based on the above considerations, a stress range of 10% to 60%

ultimate bond strength was selected for #4 GFRP and #4 CFRP and 0% to 40% for #8

GFRP.

• Frequency of Loading. The actual rate of fatigue loading on a highway

bridge has been reported as 0.5 to 1.0Hz, depending on the traffic (Demers, 1998; Mays

and Tilly, 1982). Considerable heat is generated at high loading frequencies, and it

reduces the fatigue life (Admi et al., 2000). Frequencies of fatigue loading under 4 or 5

Hz have been reported to produce negligible internal heating in glass FRP composites

(Demers, 1998). To allow tests to be completed within a reasonable amount of time, a

conservative frequency rate of 5Hz was chosen. At the rate of 5Hz, it took up to 3 days to

run one test.

42

3.1.1.2. Bond Study by splitting test method. In the following sections, the test

specimens, test setup, and the test procedures are discussed.

3.1.1.2.1. Splitting bond test specimens. A total of 24 specimens were

investigated for the splitting bond tests. The experimental variables included FRP rebar

size (#4 or #8), concrete cover depth, and concrete with or without polypropylene fibers.

The notation for the specimens is as follows: the first character (#4 or. #8) is the

bar size in English designation; the second character (“P” or “F”) indicates the plain

concrete or FRC; the third character (“C” or “G”) indicates the rebar type, CFRP or

GFRP; the last character (“1” or “3”) refers to the clear cover depth in the bar diameter,

db. Specimens were divided into 12 groups, as shown in Table 3.2.

Table 3.2. Beam End Specimen Details

Specimen I.D. Rebars

Embedment length ld

(in.)

Volume fractionVf (%)

Cover C (in.)

4PG1 10db=5 0 1db=0.5 4PG3 10db=5 0 3db=1.5 4FG1 10db=5 0.5 1db=0.5 4FG3

#4GFRP

10db=5 0.5 3db=1.5 4PC1 10db=5 0 1db=0.5 4PC3 10db=5 0 3db=1.5 4FC1 10db=5 0.5 1db=0.5 4FC3

#4CFRP

10db=5 0.5 3db=1.5 8PG1 10db=10 0 1db=1 8PG3 10db=10 0 3db=3 8FG1 10db=10 0.5 1db=1 8FG3

#8GFRP

10db=10 0.5 3db=3 Note: Each testing group has two test specimens.

43

Specimens were designed based on ASTM A944 specifications. No. 4 specimens

consisted of #4 CFRP and #4 GFRP with dimensions of 9 in.×14 in.×24 in. No. 8

specimens consisted of No. 8 GFRP with dimensions of 9 in.×17 in.×24 in. Two PVC

pipes were used to cover the two ends of the testing rebar as bond breakers so as to adjust

the test embedment length to 10 db, as shown in Figure 3.2. Four closed stirrups were

used to increase shear strength of the No. 8 GFRP specimens. The stirrups were oriented

parallelly, rather than perpendicularly, to the side of specimens to eliminate their effect

on a splitting bond failure. This kind of specimen is thought to be especially good for

testing bond strength in bridge deck systems, where no stirrups are usually used. Steel

bars were also used as auxiliary flexural reinforcement (two No. 4 steel bars were used in

#4 specimens and two No. 6 steel bars for No. 8 specimens) to increase the flexural

capacity of the specimens, so that the failure of the specimens would be controlled by

bond. The specimens also contained two No. 5 steel rebars to ease fabrication and testing.

3.1.1.2.2. Test setup and procedures. Specimens were tested in a test setup, as

shown in Figure 3.3. A special steel frame with an opening at the front face was

fabricated. It was fixed to a steel beam, which was tied down to the laboratory floor. Due

to the weakness of the FRP in the transverse direction, an anchorage was developed at the

loaded end to protect the rebar from being crushed directly. The loaded-end of the rebar

was inserted through the opening of the steel frame, a hydraulic jack, a load cell, and a

spacer steel plate. The anchor served as part of the reaction frame to resist the pullout

load applied by the hydraulic jack and also to transfer the pullout load to the rebar. The

load cell was sandwiched between the hydraulic jack and the steel pipe, and it was used

to measure the pullout load. Relative slips between the rebar and concrete were measured

44

Cov

er

PVC pipe

229

PVC pipe

Embedded Region

Stirrup Stirrup

Cov

er

(3) Numbers in the parentheses are for No.4 specimens

(2) Stirrups are used only in #8 specimens; for No.4 specimens, no additional stirrups are provided.

2 No. 8 (No. 4)steel rebar

Stirrup

Test Rebar

Test Rebar

Embedded Region

Pullout Force

Reaction Force

Reaction Force

2

(1) Units are in inches.

4.8 4.8 4.8 4.8 4.8

7(9) 10(5) 7(9)

24

1

1.59

17(1

4)

17(1

4)

Figure 3.2. Beam End Specimen Details

by LVDTs attached to both ends of the rebar. All measurements, including the pullout

load and displacements (slips), were recorded by a computer-controlled data acquisition

system at the rate of 2 data/sec. This testing scheme successfully solved the grip problem

induced by the weak characteristics of the FRP rebar in the transverse direction. It also

simplified the test setup compared to the recommendations by the ASTM A-944

specifications.

3.1.2. Studies of Ductility Characteristics. In this study, several issues

regarding flexural behaviors were addressed, including mid-span deflection, curvature,

crack width, crack distribution, and relative slip of the longitudinal rebar to the concrete.

45

Top View

Side View

Steel Pipe

Load Cell

Hydraulic Jack

Laboratory Floor

Load CellSteel Pipe Hydraulic Jack

Steel Frame

Steel Plate

Specimen

Steel Block

Steel Frame

Embedment Region

Tie down to Laboratory Floor

Steel Block

Loaded end LVDTFree end LVDT

17 in

.(14

in.)

9 in

.

24 in.

Figure 3.3. Test Setup of Beam End Tests

Also, the energy absorption capacity of this hybrid system was studied by

loading/unloading at load level of 45% and 90% of its ultimate capacity. The residual

deflection and crack width caused by the loading/unloading cycles were also discussed.

A total of 12 beams making 6 testing groups was investigated. Each testing group

was composed of two similar beams, one subjected to monotonic loading and the other to

repeated loading/unloading. The experimental variables included FRP rebar size (#4 vs.

#8), rebar type (GFRP vs. CFRP), and Plain concrete vs. FRC.

46

3.1.2.1. Test specimens. The beams were 7 in. wide, 9 in. high, and 72 in. long.

To avoid shear failure, traditional #3 steel U-shape stirrups with a spacing of 89 mm were

used as shear reinforcement at both ends of the beams. To minimize the confining effect

of the shear reinforcement on the flexural behaviors, no stirrups were used in the testing

regions (pure bending regions). A concrete clear cover of 1.5 in. was used for all the

beams. All beams were designed to fail by concrete crushing, as recommended by the

current ACI 440. This was accomplished by using a reinforcement ratio greater than the

balanced reinforcement ratio ρb. Specimen details are shown in Figure 3.4.

4 in.

9"

28 in.

#[email protected] in.

80 in.

24 in. 28 in.

7 in.

1.5 in.

1.5 in.

#4 GFRP Specimen

5#4 GFRP

#8 GFRP Specimen

1.5 in.

7 in.

1.5 in.

2#8 GFRP

#4 CFRP Specimen

1.5 in.

7 in.

1.5 in

2#4 CFRP

4 in.

Figure 3.4. Beam Specimen Details

47

The notation for the specimen’s identification is as follows: the first character “V”

means the unweathered specimens without being subjected to accelerated environmental

conditioning (this notation is for the convenience of the Section 5); the second character,

“P” or “F”, indicates the plain concrete or FRC; the third character, “4” or “8”, is the

rebar size in English designation used as reinforcement; the fourth character, “C” or “G”,

indicates the rebar type, CFRP or GFRP, and the last character represents the first beam

or the second beam in the testing group. Details of the specimens are shown in Table 3.3.

Table 3.3. Flexural Beam Test Matrix

I.D. f`c (psi)

Af (in2) ρf/ ρfb

Vf (%)

VP4G-1 7000 5#4=1.12 3.51 0 VP4G-2 7000 5#4=1.12 3.51 0 VP8 G-1 7000 2#8=1.67 3.6 0 VP8G-2 7000 2#8=1.67 3.6 0 VP4C-1 7000 2#4=0.34 3.16 0 VP4C-2 7000 2#4=0.34 3.16 0 VF4G-1 4400 5#4=1.12 4.71 0.5 VF4G-2 4400 5#4=1.12 4.71 0.5 VF8 G-1 4400 2#8=1.67 4.83 0.5 VF8G-2 4400 2#8=1.67 4.83 0.5 VF4C-1 4400 2#4=0.34 4.24 0.5 VF4C-2 4400 2#4=0.34 4.24 0.5

3.1.2.2. Test setup and procedures. Beams were subjected to a four-point

flexural testing, as shown in Figure 3.5. Beams were instrumented with three LVDTs in

the testing region (pure bending region) to monitor the mid-span deflection and determine

curvature. FRP rebars were instrumented with strain gauges to measure rebar deformation.

48

Two LVDTs were mounted at the top surface of the beam to record the compressive

concrete strain. In the testing region, Demac gages were bonded to the beam surface, 38

mm above the bottom (the same level as the longitudinal rebars) to measure the crack

widths. A microscope was also used to measure the crack width at the rebar location.

Another two LVDTs were mounted at the ends of the beam to record the relative slips

between the longitudinal rebar and the concrete (the longitudinal rebars were protruded

about 10 mm from the ends). Load was applied in increments by hydraulic jack and

measured with a load cell. Three increments were taken up to the initiation of cracking

and ten increments up to failure. At the end of each load increment, the load was held

constant, crack patterns were photographed, and near mid-span crack widths were

recorded.

Figure 3.5. Flexural Beam Test Setup

Each testing parameter was investigated using two identical specimens, as shown

in Table 3.3. One beam was loaded monotonically to failure. The other beam was

LVDT 5 LVDT 4

LVDT (6,7) Demac Gages

LVDT(1,2,3)

Load, P

LVDT8

72 in.

9 in

.

49

subjected to loading/unloading cycles at 40% and 80% of its capacity to evaluate the

residual deflection, residual crack width, as well as the energy absorption capacity.

3.1.3. Studies of Durability Characteristics. Composite materials offer many

advantages, such as corrosion resistance, and their use in bridge decks has become more

technically attractive and economically viable. However, long-term performances have to

be investigated and clearly understood with confidence before its application in the field.

3.1.3.1. Test specimens. Details of the bond specimens and the beam specimens

are presented in the following sections.

3.1.3.1.1. Bond specimens. Dimensions of test specimens were the same as the

specimens described in Chapter 3.1.1.

Chemical agents will attack the reinforcing materials as well as the bond between

the concrete and the reinforcing materials. In RC structures, cracks exist under service

conditions. The degradation effect is expected to be more pronounced at locations where

cracks exist. As shown in Figure 3.6, bond stress distribution along half of the crack

spacing in the beam specimen is similar to that in the pullout bond specimen. Because the

portion between the cracks is not directly in contact with solution, to better simulate the

real situations, the portion at the loaded end of the bond specimens was directly exposed

to salt water, while the portion at the free end was coated with water-proof epoxy to

protect it from direct attack from salt water, as shown in Figure 3.7. Since the epoxy

could induce unwanted mechanical anchorages and change the bond behavior when the

rebar was pulled out, all the epoxy that stuck to the rebar was removed after the

environmental conditioning.

50

Bond Stress in pullout bond specimen

ForcePullout

Bond Stress in Beam Specimen

S/2 S/2

Figure 3.6. Bond Stress Distribution in Beam Specimen and Pullout Specimen

Coated with Epoxysubjected to pullout testEpoxy Removed when

Figure 3.7. Pullout Specimens Coated with Epoxy at Free End

The notation for specimens is as follows: the first character, “V” or “D”, indicates

the unweathered specimen or durability specimen; the second character, “P” or “F”,

51

indicates the plain concrete or FRC, the third character (#4 vs. #8) is the bar size in US

designation, and the fourth character, “C” or “G”, indicates the rebar type, CFRP or

GFRP. The test matrix of the bond specimens is shown in Table 3.4.

Table 3.4. Durability Bond Test Matrix

Specimen I.D.

Number of Specimens

f`c (psi) Vf (%) ld/db

VP4C 3 6,900 0 5 VP4G 3 6,900 0 5 VP8G 3 6,900 0 5 VF4C 3 5,360 0.5 5 VF4G 3 5,360 0.5 5 VF8G 3 5,360 0.5 5 DP4C 3 6,900 0 5 DP4G 3 6,900 0 5 DP8G 3 6,900 0 5 DF4C 3 5,360 0.5 5 DF4G 3 5,360 0.5 5 DF8G 3 5,360 0.5 5

3.1.3.1.2. Beam specimens. The dimensions of the beams specimens were the

same as the beams described in Chapter 3.1.2.

As mentioned previously, cracks usually exist in the concrete structures under

service conditions. Cracked structures will be much more susceptible to environmental

attack than the intact ones. To represent realistic conditions, three artificial cracks for

each beam were fabricated, as shown in Figure 3.8. Those cracks were 0.024 in. wide (a

limitation of 0.020 in. for exterior exposure by ACI 440), 1.5 in. deep (cracks reaching

the rebars) and 8 in. in spacing. This was accomplished by putting 0.024 in. thick and 1.5

52

in. wide stainless steel sheets underneath the longitudinal rebars before casting the

concrete. Once the concrete had hardened, the steel plates were pulled out. Artificial

seams were thus created to simulate the concrete cracks.

Figure 3.8. Artificial Cracks Created by Steel Plate

The notation for the specimens is as follows: the first character, “V” or “D”,

indicates the unweathered specimens or durability specimens; the second character, “P”

or “F”, indicates the plain concrete or FRC; the third character, “4” or “8”, is the rebar

diameter in US designation; the fourth character, “C” or “G”, indicates the rebar type,

CFRP or GFRP. The test matrix of the beam specimens is shown in Table 3.5.

3.1.3.2. Test setup and procedures. In the following sections, details about the

test setup and procedures are presented.

3.1.3.2.1. Bond tests. The bond test procedures are the same as those of the

pullout bond test described in Chapter 3.1.1.

SteelPlate

Strain Gauge Steel Stirrups

53

Table 3.5. Durability Beam Test Matrix

Specimen I.D.

Number of Specimens

fc’

(psi)

Af (in2) ρf / ρfb

Vf (%)

VP4G 2 6900 5#4=1.12 3.51 0 VP8 G 2 6900 2#8=1.67 3.6 0 VP4C 2 6900 2#4=0.34 3.16 0 VF4G 2 4400 5#4=1.12 4.71 0.5 VF8 G 2 4400 2#8=1.67 4.83 0.5 VF4C 2 4400 2#4=0.34 4.24 0.5 DP4G 2 6900 5#4=1.12 3.51 0 DP8 G 2 6900 2#8=1.67 3.6 0 DP4C 2 6900 2#4=0.34 3.16 0 DF4G 2 4400 5#4=1.12 4.71 0.5 DF8 G 2 4400 2#8=1.67 4.83 0.5 DF4C 2 4400 2#4=0.34 4.24 0.5

3.1.3.2.2 Beam tests. The beam test procedures are the same as those of the

flexural beam test described in Chpater 3.1.2.

3.1.3.2.3. Environmental conditioning. The internal temperature of the concrete

was not the same as the air temperature in the chamber. It is important that the interface

at the FRP/concrete reaches the targeted temperature, i.e., the internal temperature below

32oF during the freezing period and above 32oF during the thawing period.

Thermocouples were embedded in two 4 in. × 8 in. concrete cylinders, one in air, the

other one in water, to monitor the core temperature inside the concrete. Several

preliminary freeze-thaw cycles were conducted to determine the appropriate air

temperature and cycle time. It was found that a 9-hour cycle, consisting of a 6-hour

freezing regime and 3-hour thawing regime, was adequate to obtain the freezing and

thawing conditions in the core of the specimens. A computer data acquisition system was

used to monitor the temperature change of the air, inside the concrete cylinder in air, and

inside the concrete cylinder submerged in water. Temperatures were recorded at three-

54

minute intervals. The temperature variation during the freeze-thaw cycle is shown in

Figure 3.9. One can see that the temperature in the concrete specimens changed the

temperature at a much slower rate than the temperature in the air. However, the

temperature in the concrete specimen can reach the targeted temperature, with about three

hours in the thawing region and about six hours in the freezing region during each cycle.

-13

2

17

32

47

62

77

92

107

0:00 3:00 6:00 9:00 12:00 15:00 18:00Time (h)

Tem

pera

ture

(F)

-25-20-15-10-5

05101520253035

40

Tem

pera

ture

(C)

airconcrete in airconcrete in water

Figure 3.9. Cycle of Freezing-and-Thawing

The glass transition temperatures, Tg, for FRP materials were considered in

deciding the high temperature magnitude. FRP materials should not be used at

temperatures above their glass transition temperatures, Tg. The glass transition

temperatures for vinyl ester and polyester resin are 2000F and 1700F, respectively. Also,

after considering the temperature in the US Mid-West region, it was decided that the high

temperature cycle ranged from 950F to 1400F.

55

As shown in Figure 3.10, a combined environmental cycle consisted of 20 freeze-

thaw cycles and 20 high temperature cycles. The same cycles were iterated 10 times.

Thus, a total of 200 freeze-thaw cycles and 200 high temperature cycles were conducted

during the study program to simulate the seasonal weather changes. Compared to the

long-term average temperature data on Missouri, the determined environmental cycles

were far more severe than the average temperature so that the worst-case scenario and the

accelerated test were possible.

3.1.3.2.4. Preparation of de-icing solution. In this study, a solution of sodium

chloride (NaCl), 5% by weight, was selected to simulate the de-icing salt solution. Bond

specimens were submerged into the salt solution in two large tanks. Also, due to the large

dimensions of beam specimens, the effects of de-icing salt on flexural performance were

investigated by the ponding test (ASTM C 1543-02). The beams were placed upside

down in the environmental chamber to allow the surface with cracks to face up. Using a

silicone sealant, polystyrene strips were bonded to the top surfaces of the beams to form

dikes to retain the salt solution. Inspection was made to check the water level by every

two days. The beams were kept moist by adding additional fresh solution. At the end of

the environmental conditioning, no solid salt was observed left on the surface of the

beams, which meant that the concentration of salt solution did not vary significantly. It

seems that the leakage of the salt solution between the dike and the beam surface may be

the main reason for the reduction of the salt solution.

It took approximately 100 days to complete the 10 combined environmental

cycles. Figure 3.11 shows the specimens in the environmental chamber. One can see the

salt solution was retained in the dike on the top of the beams, which have three artificial

56

(a) Combined Environmental Cycle

(b) Freezing-and-Thawing Cycle

(c) High Temperature Cycle

Figure 3.10. Combined Environmental Cycles used in this Study

Tem

pera

ture

95°F

0°F

20 High Temperature Cycles 140°F

20 Freezing-and-Thawing Cycles

Repeated 10 times

1 hr 1 hr0.33 hr 0.33 hr

2.66 hr

0°F

95°F

140°F

0.75 hr

9 hr

0.75 hr 2.25 hr 5.25 hr

95°F

0°F

57

cracks. After the environmental conditioning, specimens were removed from the chamber

and allowed to dry for one week before testing.

(a) Photo Showing Artificial Cracks on the Surface of Beams

(b) Bond Specimens and Beam Specimens Placed in the Chamber

Figure 3.11. Photograph of Specimens in the Environmental Chamber

Cracks Dike

Bond Specimens

Beam Specimens

58

3.2. MATERIALS

3.2.1. FRP Rods. Three types of commonly used FRP rods were adopted in this

study: namely the #8 GFRP, #4 GFRP, and #4 carbon fiber reinforced polymer (CFRP),

as shown in Figure 3.12. The surface of the GFRP rods is tightly wrapped with a helical

fiber strand to create indentations along the rebar, and sand particles are added to the

surface to enhance its bonding strength. For the #4 GFRP, the pitch of the fiber strand is

about 1 in., and the angle between the strands to the longitudinal direction β is 60 degrees.

For the #8 GFRP, the pitch of the fiber strand is 0.87 in. and β is 75 degrees, as shown in

Figure 3.13. The deformation angles α are 2 degrees and 5 degrees for #4 GFRP and #8

GFRP, respectively. The surface of the CFRP is very smooth, as shown in Figure 3.12.

The resin used was epoxy modified vinyl ester, based on the information provided by the

manufacturer. The mechanical properties of FRP rods as reported by their manufacturer

are summarized in Table 3.6.

Figure 3.12. FRP Rods Used in this Study

#8 GFRP #4 GFRP #4 CFRP

59

αβ

Figure 3.13. Deformation of GFRP Rebar

Table 3.6. Mechanical Properties of FRP Rods

#4 CFRP #4 GFRP #8 GFRP Tensile Strength (ksi) 300 100 80 Elastic Modulus (ksi) 18,000 5,920 5,920

3.2.2. Polypropylene Fiber. Currently, many fiber types are commercially

available including steel, glass, synthetic, and natural fibers. To fulfill the completely

steel-free concept, polypropylene fiber was used in this study. The fibers are fibrillated

and commercially available in 2.25 in. length, as shown in Figure 3.14.

Figure 3.14. Polypropylene Fibers Used in this Study

60

3.2.3. Concrete. The concrete mix used in this study is based on an existing

MoDOT mix design, as shown in Table 3.7. For practical application, the volume fraction

of fiber (Vf ) of 0.5% was used to make the FRC take the benefits from the fibers, while

ensuring good workability of the concrete. It should be noted that the purpose of this

study was to qualitatively investigate the benefits gained from the fibers to the FRP

reinforcing system. The different volume fractions’ effect was not a variable to be

investigated in this study. Several concrete batches were made at different time for

different tests. The compression strengths and the air content of concrete and FRC on the

day of testing were measured and listed in the Table 3.8.

Table 3.7. Concrete Mix Design

Portland Cement Type I

(lb/yard3)

Water (lb/yard3)

Fly ash (Class C ) (lb/yard3)

Sand (lb/yard3)

Coarse Aggregate

(Limestone) (lb/yard3)

Air Entraining

Agent (oz)

Plain Concrete 625 200 200 1,300 1,720 8

FRC 620 209 110 1,140 1,820 7

Table 3.8. Concrete Properties

Durability Pullout Bond Test

Splitting Bond Test

Flexural Beam Test Bond Beam

Compressive Strength (psi) 7,400 5,660 6,900 6,900 6,900 Plain

Concrete Air Content 4.5% 4.1% 4.9% 4.9% 4.9% Compressive Strength (psi) 5,360 3,479 4,400 5,360 4,400 FRC Air Content 6% 8.5% 5.8% 6% 5.8%

61

4. STATIC AND FATIGUE BOND TEST RESULTS

4.1 INTRODUCTION

It is generally understood that the three primary mechanisms of bond behaviors

result from chemical adhesion, mechanical interlock, and friction resistance. Each

component contributes to the overall bond performance in varying degrees depending on

the type of rebar. Typical bond mechanisms for the deformed rebars are shown in Figure

4.1 (Hamad, 1995).

R e su lta n t

F ric tio n αP u llo u tF o rc e

B o n d S tre n g th

M e c h a n ic a l B e a rin g R a d ia l sp littin g fo rc e

Figure 4.1 Bond Mechanisms for Deformed GFRP Rebar (Hamad, 1995) Based on its overall performance, bond can be divided into two categories, the

average bond and the local bond, as shown in Figure 4.2. The average bond is the average

bond over a specific length of embedment, and its value is generally varied with the

embedment length. The local bond is an inherent property of the rebar and the concrete. It

is independent of the embedment length and is determined by its constitutions (the

concrete and the rebar) and the interaction between the constitutions.

62

Long Embedment Length

PulloutForce

Short Embedment Length

ForcePullout

Local Bond Distribution

Bon

d St

ress

Bon

d St

ress

Local Bond Distribution

Average Bond

Average Bond

Figure 4.2. Average Bond and Local Bond

Considerable studies have been conducted on the bond behavior of the Glass

Fiber Reinforced Polymer (GFRP) rebar in plain concrete. Different types of the FRP

rebars have quite different bond characteristics, which are strongly dependent on the

mechanical and physical properties of external layer of FRP rods (Ehsani et al., 1997;

Kaza, 1999). On the other hand, because no accepted manufacturing standards for FRP

are available, bond research is far from satisfactory. For the deformed GFRP rebar having

similar surface to rebar GFRP, as shown in Figure 3.9, the bond strength is equivalent to

or larger than those of ordinary deformed steel (Cosenza et al., 1997; Kaza, 1999).

Research also showed that for some smooth surface rebars, the bond strength can be as

low as 145 psi (Nanni at al., 1995), which is about 10% of that of steel. As for Carbon

Fiber Reinforced Polymer (CFRP) rebar, relatively fewer experimental data are available

in the literatures. Four types of CFRP rods were tested by Malvar et al. (2003) and they

found that when there was sufficient surface deformation, 1,160 psi or more of bond

strength could be reached.

63

Compared to relatively rich materials on monotonic bond tests, literatures on

fatigue bond tests are very limited and the testing results are also controversial. Test

results by Katz (2000) indicated that there was a reduction in the bond strength after

cyclic loading, while Bakis et al. (1998) found that the bond strength in cyclically loaded

beams increased as compared to the bond strength in the monotonic tests.

Fibers may improve the properties of concrete, although there is no strong opinion

on the effect on the strength (ACI 544, 1996). As a consequence, with the addition of

fibers, bond performance will change due to the alteration of the concrete properties.

Bond between the traditional steel bars and the FRC was investigated by several

researchers and the test results indicated the addition of fibers significantly improved the

post-peak bond behavior. However, no agreement was reached on its effect on bond

strength. As for bond behavior of the FRP bars embedded in the FRC, open literature

does not provide any published information.

Three test methods are commonly used to study bond behaviors: namely, pullout

test, splitting bond test, and flexural beam test. These test methods provide different

information to the bond behaviors. Pullout tests can clearly represent the concept of

anchorage and is usually adopted to study the bond behavior between rebar and concrete.

Although pullout tests cause concrete to be in compression and the testing bar to be in

tension, a stress condition not exhibiting in real structures, a reasonable correlation was

found between structural performance and measures of performance in the pullout test

(Cairns and Abdullah, 1995). Splitting bond tests can be used to study the splitting bond

behavior under different cover thicknesses. The transverse reinforcement’s effect on bond

behavior can be avoided when properly designed. Splitting bond tests can simulate the

64

stress field of real structures to some extent; it can simulate the shear stress field but not

the stress gradient induced by bending. Flexural beam tests have the advantage to

represent actual stress fields in real beams and the cover effects on the bond. But, it

requires considerable confining reinforcement to avoid a shear failure and so bond

splitting failures are unlikely (Cairns and Plizzari, 2003). In this program, all three types

of tests were investigated and compared. In this Chapter, bond characteristics, studied by

pullout test method and splitting bond test method, are presented.

4.2. PULLOUT BOND TEST RESULTS

4.2.1. Test Results and Discussions. The average bond strength was calculated

as the pullout force over the embedded area of the rebar. The slip at the loaded end was

calculated as the the value of LVDT2 minus the elastic deformation of the FRP rebar

between the bond zone and the location of LVDT2. It should be mentioned that the

deformation of the steel frame was very small, less than 1% of the slip (approximately

0.0015 in. when the pullout load equals to 45 kips), which the total slip was larger than

0.30 in., thus it was ignored for simplicity. When the bond strength of specimens was

compared with different concrete strengths, 'cf , bond strength was normalized based on

the square root of 'cf , which is adopted in the current ACI 318-02.

4.2.1.1. Monotonic pullout tests. The monotonic test results are listed in Table

4.1. Most of the test results were repeatable with small variations for the same testing

group. In the case of PG405M and FG405M, there was a combination of both pullout and

splitting failure modes. Since the slip at failure was very different for different failure

modes, the coefficients of variance for slip in these two groups were large.

65

Table 4.1. Summary of Static Pullout Bond Test Results

Note (1): P=Pullout failure; S=Splitting failure; (2): Two peak values were observed only in CFRP specimens, refer to Figure 3.4;

The numbers in the parenthesis are the vales at the second peak; (3): Values are the average of three duplicate specimens;

• Effect of Rebar Surface Conditions. Due to their significant surface

differences, bond behavior of the GFRP and the CFRP are not the same, as shown in

Figure 4.3. The bond strength of the GFRP was about twice as much as that of the CFRP.

The bond failure of the CFRP was controlled by the rebar pullout, providing more ductile

behavior.

(a) Bond-slip behavior of CFRP. During the pullout of the CFRP rebars, the

surface of the rebar was severely rubbed and the resin was scratched off (see Figure 4.4).

The surface of the CFRP used in this study was very smooth. As a result, a very low

Bond Strength First

(Second)Peak '/ cfu ( '' / cfu )

(psi/ psi )

Slip at First (Second)Peak

mS ( 'mS )

(in.)

0.002 in. Bond Strength

'05.0 / cfu

(psi/ psi )

Mode1 Specimen

I.D.

Average COV (%) Average COV

(%) Average COV (%)

PC405M 11.40 (15.24)

6.01 (5.33)

0.03 (0.69)

9.77 (4.42) 11.52 7.49 P

PG405M 32.88 7.80 0.36 40.57 15.12 6.95 S/P PG805M 30.6 2.95 0.34 9.31 11.88 5.09 S

FC405M 14.04 (13.20)

14.20 (1.54)

0.04 (0.67)

11.11 (9.57) 13.92 13.57 P

FC410M 16.68 (15.12)

14.26 (3.97)

0.07 (0.66)

3.68 (16.92) 16.32 13.14 P

FG405M 31.92 5.16 0.41 23.22 17.64 23.38 S/P FG410M 28.2 4.44 0.37 16.23 24.36 4.53 S FG805M 26.04 7.25 0.54 6.21 13.08 12.13 P FG803M 29.28 5.92 0.48 6.52 13.20 12.26 P

66

0

0.4

0.8

1.2

1.6

2

2.4

2.8

3.2

0 10 20 30 40 50Slip(mm.)

u√f`

c(M

Pa/√

MPa

)

0

5

10

15

20

25

30

35

0 0.4 0.8 1.2 1.6 2Slip(in.)

u√f`

c(ps

i/√ps

i)

#4 CFRP

#4 GFRP

(a) Bond-slip Relationship of GFRP and CFRP in FRC Specimens

0

0.4

0.8

1.2

1.6

2

2.4

2.8

3.2

0 5 10 15 20 25 30Slip (mm)

u√f`

c(M

Pa/√

MPa

)

0

5

10

15

20

25

30

35

0 0.2 0.4 0.6 0.8 1 1.2Slip (in.)

u√f`

c(ps

i/√ps

i)

#4 CFRP

#4 GFRP

(b) Bond-slip Relationship of GFRP and CFRP in Plain Concrete Specimens

Figure 4.3. Bond-slip Relationship of GFRP and CFRP

67

(a) CFRP Rebar (b) GFRP Rebar

Figure 4.4. Surface Conditions of Various Rebar Before and After Loading mechanical bearing force can be expected. Thus, for the CFRP rebar, the mechanical

bearing can be neglected. Load-slip response for the CFRP can be roughly divided into

four phases, as shown in Figure 4.5.

Figure 4.5. Idealized Load-Slip Curve for CFRP Rebar Embedded in Concrete Phase I (as described in Figure 4.5 in portion O~A): At Phase I, the chemical

bond and friction force resisted pullout force together, which resulted in a very high bond

stiffness.

Before Test

After Test

Before Test After

Test

O

B

A C D

Slip

Load

68

Point A (refer to Figure 4.5): Chemical bond was broken at the loaded end first

and then extended to the free end. The peak value of chemical adhesion was reached at

Point A. After this point, chemical bond was completely lost along the whole rebar.

Phase II (as descripted in Figure 4.5 in portion A~B): After the chemical bond

was broken, only the friction component was present. The total resisting force provided

only by the friction decreased suddenly. Because the tests were controlled by the slip at

the loaded end, the slip between the rebar and concrete continued increasing constantly.

As a result, the pullout load had to be reduced to maintain the increasing rate of the slip.

When the pullout load dropped to Point B, a new equilibrium was reached. The chemical

bond component can be calculated by the difference of the bond strength at Point A and

Point B minus the increase of the friction bond component from Point A to Point B. For

the CFRP rebar used in this study, the chemical bond strength was 150 to 200 psi.

Chemical cohesion between deformed steel bars and concrete was reported, ranging from

150 to 300 psi by Choi et al. (2002).

Phase III (as described in Figure 4.5 in portion B~C): As the slip continued to

increase, friction force increased accordingly, and the load-slip curve went up again. Due

to the loss of chemical bond, the curve B~C was much flatter than O~A. At this phase,

microcracks occurred and propagated.

Point C (refer to Figure 4.5): At Point C, friction reached its maximum value.

Phase IV (as described in Figure 4.5 in portion C~D): With the increasing of

slip, more and more microcracks developed. It caused the confinement from concrete to

rebar to reduce. Thus, the friction force between rebar and concrete also decreased. The

load-slip curve was softened.

rve

69

Based on the bond-slip curve, two peak bond values were observed for each

specimen. (1) In Phase I, chemical adhesion and friction resistance dominated bond

behavior. The first peak occurred when maximum local chemical bond stress spreaded to

the free end. (2) In phase II, friction force dominated the bond behavior. The second peak

value occurred when friction force reached its maximum.

(b) Bond-slip behavior of GFRP. At failure, the surface of the GFRP rebar was

damaged, and resin was rubbed off from the rebar surface. Some small pieces of resin

scale were noticed in the concrete, and helical fiber strands were broken in several

specimens. However, the overall shape of the rebar remained intact. The deformation

created by the helical fiber strand could still be seen, which suggested that the

deformation was not transversely crushed or sheared off by the bearing force from the

concrete. In other words, the resin acted as a good cover to protect the glass fibers, as

shown in Figure 4.4b. Previous work carried out by other researchers (Katz, 1999;

Chaallal and Benmokrane, 1993) showed that the shearing of the rib is the main reason

for the bond failure in the deformed FRP bars. This kind of failure phenomenon was not

observed in this study. That may be due to the different surface characteristics of the FRP

rebar. In the studies conducted by Katz et al. and Chaallal and Benmokrane, the ratio of

the projected area that was normal to the bar axis to the shearing area of the rib was much

smaller than that of the rebar used in this study, as shown in Figure 4.6.

Consequently, when the bearing forces on the projected deformation are the same

(i.e., deformation heights, hr, are the same), the rebar as shown in Figure 4.6b will induce

much larger shearing stresses on the rib. Thus, it is easier for the rib to be sheared off. In

other words, rib deformation like Figure 4.6a is more desirable to prevent such shearing

70

off failure. This factor is more important for the FRP rebar than it is for the traditional

steel rebar, since the ribs of the FRP rebar are made of resin, which is much weaker in

shear-resisting capacity. At this point, the bond is strongly relative to the FRP

manufacturer.

(a) Deformation pattern of GFRP used in this study

(b) FRP with other deformed patterns

hr

hr

Figure 4.6. Different Deformation Patterns of FRP Rebars

Chemical bond played a much less important role for the GFRP specimens than

for the CFRP specimens. It was the mechanical bearing and friction force that dominated

the bond behavior. Due to the GFRP’s relatively rough surface, internal cracks (crack

unnoticeable at concrete surface) were created, even at a very low load level. It was

thought that chemical adhesion had been lost at these portions (Goto, 1971). Since the

CFRP had a very smooth surface, no internal cracks, or very few, were formed at the

initial loading. Chemical cohesion was almost intact until the relative slip between the

rebar and concrete was too large, and then it was broken abruptly.

71

• Embedment Length Effect. Similar to the traditional steel rebar, bond

stresses along the FRP rebar are also nonlinearly distributed along the embedded portion

(Benmokrane et al., 1996). The bond mechanisms for the CFRP and GFRP bars in this

study were different, therefore, the embedment length effect on bond strength was also

different.

(a) GFRP: As mentioned earlier, mechanical bearing dominated the bond. The

bond stresses were nonlinearly distributed along the embedment portion. High bond

stresses concentrated at the portions near the loaded end, and the bond stresses decrease

sharply toward the free end. In the case of the longer embedment length, a relatively

smaller portion of the embedded area had large bond stress. Consequently, the average

bond strength with a longer embedment length would have a lower value, as shown in

Figure 4.7. Also, the slope of the bond-slip curve of the specimens with shorter

embedment length was steeper than that of the specimens with longer embedment length.

That was due to the fact that the higher bond stress concentrated near the loaded end and

lower bond stress developed far away the loaded end. Thus, when the average bond stress

was calculated based on the pullout load divided over the whole embedment length, the

specimens with longer embedment would have lower bond stiffness.

(b) CFRP: As mentioned previously, all the bond strength came from friction

resistance at ultimate (the second peak). The friction resistance was a function of the

friction coefficient and normal pressure on the rebar. Obviously, the friction coefficient

was the same along the rebar. Also, the normal pressure was the same along the

embedment portion, except that the portions near the ends had lower values due to less

confinement at the ends. As a result, the bond stress distribution was almost uniformly

72

0

0.3

0.6

0.9

1.2

1.5

0 10 20 30 40Slip (mm)

u√f`

c(M

Pa/√

MPa

)

0

3

6

9

12

15

180 0.2 0.4 0.6 0.8 1 1.2 1.4

Slip (in.)

u√f`

c(ps

i/√ps

i)

5db

10db

(a) Bond-Slip Relationship of #4 CFRP

0

0.4

0.8

1.2

1.6

2

2.4

2.8

3.2

0 5 10 15 20Slip (mm)

u√f`

c(M

Pa/√

MPa

)

0

5

10

15

20

25

30

35

0 0.1 0.2 0.3 0.4 0.5 0.6 0.7Slip (in.)

u√f`

c(ps

i/√ps

i)

10db

5db

(b) Bond-Slip Relationship of #4 GFRP

Figure 4.7. Embedment Length Effect on Bond-Slip Behavior

of Various CFRP and GFRP Rebars

73

0

0.6

1.2

1.8

2.4

3

0 10 20 30 40Slip(mm)

u√f`

c(M

Pa/√

MPa

)

0

6

12

18

24

30

360 0.2 0.4 0.6 0.8 1 1.2 1.4

Slip(in.)

u√f`

c(ps

i/√ps

i)

3db

5db

(c) Bond-Slip Relationship of #8 GFRP

Figure 4.7. Embedment Length Effect on Bond-Slip Behavior

of Various CFRP and GFRP Rebars (Cont.)

distributed along the embedment length. The average bond strength over the whole

embedment length would not decrease with the increasing of the embedment length. It

could even get a higher value due to the relative small portion of rebar near the ends. A

14% increase of the bond strength was observed in this study, when the embedment

length increased from 5 db to 10 db, as shown in Figure 4.7a.

• Diameter Effect. As shown in Figure 4.8, the bond strengths of the #4

specimen were about 8% and 23% higher than the #8 embedded in the plain concrete and

the FRC, respectively. One explanation is that the possibility of defect (voids created by

concrete bleeding—Tighiouart et al., 1998) is higher for a larger rebar, a phenomenon

similar to the size effect on the behavior of various brittle materials. Another possible

explanation is the Poisson effect; as there is elongation in the longitudinal direction, the

74

0

0.8

1.6

2.4

3.2

0 10 20 30 40 50Slip (mm)

u√f`

c(M

Pa/√

MPa

)

0

5

10

15

20

25

30

35

0 0.2 0.4 0.6 0.8 1 1.2 1.4 1.6 1.8Slip (in.)

u√f`

c(ps

i/√ps

i)

FRC--#8GFRP

FRC--#4GFRP

(a) Fiber Reinforced Concrete

0

0.6

1.2

1.8

2.4

3

0 2 4 6 8 10Slip (mm)

u√f`

c(M

Pa/√

MPa

)

0

5

10

15

20

25

30

350 0.05 0.1 0.15 0.2 0.25 0.3 0.35

Slip (in.)

u√f`

c(ps

i/√ps

i)

Plain #4GFRP

Plain # 8GFRP

Concrete Splitting

(b) Plain Concrete

Figure 4.8. Diameter Effect on Bond-Slip Behavior

75

transverse direction tends to contract. Consequently, the confinement from the concrete

to the rebar will be reduced to some extent. This effect is more significant for a larger

rebar; thus, a rebar with a bigger diameter will have smaller bond strength.

• Effect of Polypropylene Fibers

(a) The ultimate bond strength slightly decreased with the addition of the

polypropylene fibers. The reduction ranged from 3% to 16% (see Table 4.1 and Figure

4.9).

0

0.3

0.6

0.9

1.2

1.5

0 10 20 30 40Slip (mm)

u√f`

c(M

Pa/√

MPa

)

0

3

6

9

12

15

180 0.3 0.6 0.9 1.2 1.5Slip (in.)

u√f`

c(ps

i/√ps

i)

Plain

FRC

(a) Bond-Slip Relationship of #4 CFRP

Figure 4.9. Polypropylene Fibers’ Effect on Bond-Slip Behavior

of CFRP and GFRP Rebars

76

0

0.8

1.6

2.4

3.2

0 5 10 15 20Slip (mm)

u√f`

c(M

Pa/√

MPa

)

0

5

10

15

20

25

30

35

0 0.1 0.2 0.3 0.4 0.5 0.6 0.7Slip (in.)

u√f`

c(ps

i/√ps

i)

Plain

FRC

Concrete Spiltting

(b) Bond-Slip Relationship of #4 GFRP

0

0.6

1.2

1.8

2.4

3

0 10 20 30 40Slip(mm)

u√f`

c(M

Pa/√

MPa

)

0

5

10

15

20

25

30

35

0 0.3 0.6 0.9 1.2 1.5Slip(in.)

u√f`

c(ps

i/√ps

i)

Plain

FRC

Concrete Splitting

(c) Bond-Slip Relationship of #8 GFRP

Figure 4.9. Polypropylene Fibers’ Effect on Bond-Slip Behavior

of CFRP and GFRP Rebars (Cont.)

77

(b) The slip corresponding to the ultimate bond strength increased significantly

with the addition of fibers for the GFRP specimens and less for the CFRP specimens. As

discussed previously, in the case of the GFRP, internal microcracks were created due to

the mechanical bearing; however, fewer internal cracks existed in the case of CFRP, due

to its negligible mechanical bearing. Only when the microcracks developed could the

polypropylene fibers functioned effectively to limit the opening of microcracks and thus

decreased the rate of microcracks propagation. Since many more microcracks existed in

the GFRP specimens, the contribution from the polypropylene fibers was more noticeable.

(c) The addition of fibers changed the failure mode; most specimens that failed in

concrete splitting changed to pullout failure.

(d) When specimens failed in splitting, the failure for the plain concrete

specimens was much more brittle than that of the FRC specimens. As shown in Figure

4.10, the plain concrete specimens usually failed by breaking the concrete into several

pieces; while, in the case of the FRC specimens, splitting cracks developed along the

splitting plane. With the presence of the polypropylene fibers, the specimens were held

together and remained integrated.

Figure 4.10. Failure for FRC and Plain Concrete Specimens

78

4.2.1.2. Fatigue pullout tests. Fatigue loading will produce a progressive

deterioration of bond caused by the propagation of microcracks and the progress of

micro-crushing of concrete in front of the irregularity of the rebar surface (ACI 408-99).

The damage accumulation can be observed by measuring the relative slip between the

concrete and the rebar.

• General Observations. Different results were drawn for different specimens

when they were subjected to the fatigue loading. The #4 CFRP and the #8 GFRP

specimens withstood one million cycle fatigue loading, while, the #4 GFRP specimens

failed because the concrete split prematurely. It should be noted that ranges of fatigue

loading were 10% to 60%, 10% to 60%, and 0% to 40% of their ultimate monotonic bond

strengths for #4 CFRP, #4 GFRP, and #8 GFRP specimens, respectively.

Because the #4 GFRP and the #8 GFRP had similar surface conditions and bond

mechanisms, we may regard that their fatigue bond behaviors were also the same. Based

on the limited test data, 10% to 60% and 0% to 40% can be conservatively considered as

the fatigue bond limit to sustain one million cycle loading for the CFRP and the GFRP,

respectively.

• Residual Slip Accumulation. The commonly accepted hypothesis to

determine the damage accumulation due to fatigue loading is the Miner’s hypothesis.

According to the rule, failure occurs if 1max,

=∑i

i

Nn

, where ni is the number of cycles

applied at a particular stress level, and Nmax,i is the number of cycles which cause fatigue

failure at that same stress level. Test results have shown that this hypothesis is only partly

suitable for FRP fatigue bond behavior.

79

As shown in Figure 4.11, the residual slips accumulated gradually with the

increasing number of cycles, but the rate of increase was not constant. Micro-voids

between rebar and concrete existed at the time of the specimen fabrication; i.e., rebar was

not in full contact with the concrete. When the specimens were subjected to fatigue

loading, some of the micro-voids would be gradually closed. At the beginning, relatively

large amounts of voids existed; thus, the residual slips were easier to develop. After a

certain number of fatigue cycles, most of the voids were closed and the system became

stabilized. At that point, the accumulation rate of the residual slip slowed down. Figure

4.11 shows slip vs. cycle-number curve can be roughly divided into two phases. The first

approximately 10,000 cycles may be regarded as the first phase. The rest of the curve is

the second phase. During the first phase, the fatigue damage accumulated much faster

than it did in the second phase. After the first phase, the slip increased linearly with a

much lower rate.

• Fatigue Loading Effect on Residual Bond-Slip Behavior

(1) Fatigue Loading Effect on Bond Stiffness. Fatigue loading can increase

bond stiffness (Figure 4.12). This was reported by Gylltoft et al. (1982) based on a study

on steel bars embedded in the plain concrete. As mentioned previously, the rebar and

concrete were not in full contact because of the micro-voids. After the specimen had been

subjected to fatigue loading, some of the voids were closed, resulting in a larger

contacting area. Another reason may be that the rebar surface became rougher after being

subjected to the fatigue loading, and the friction resistance increased consequently.

(2) Fatigue Loading Effect on Ultimate Bond Strength. The fatigue loading

may increase the ultimate bond strength to some extent, as shown in Figure 4.12 and

80

0

1

2

3

4

5

0 200000 400000 600000 800000 1000000

Number of cycles

Slip

(mm

)

0

0.02

0.04

0.06

0.08

0.1

0.12

0.14

0.16

0.18

Slip

(in.

)

FC405F-1 PC405F-1

FC405F-2 PC405F-2

FC405F-3 PC405F-3

(a) Residual Slips vs. Cycle Numbers of #4 CFRP

0

0.5

1

1.5

2

2.5

0 200000 400000 600000 800000 1000000Number of cycles

Slip

(mm

)

0

0.02

0.04

0.06

0.08

0.1

Slip

(in.

)

FG405F-1 PG405F-1

FG405F-2 PG405F-2

FG405F-3 PG405F-3

Concrete Splitting

(b) Residual Slips vs. Cycle Numbers of #4 GFRP

Figure 4.11. Residual Slips versus Cycle Numbers of Various FRP Rebars

81

0

0.5

1

1.5

2

2.5

0 200000 400000 600000 800000 1000000Number of cycles

Slip

(mm

)

0

0.02

0.04

0.06

0.08

0.1

Slip

(in.

)

FG805F-1 PG805F-1FG805F-2 PG805F-2FG805F-3 PG805F-3

(c) Residual Slips vs. Cycle Numbers of #8 GFRP

Figure 4.11. Residual Slips versus Cycle Numbers of Various FRP Rebars (Cont.)

0

0.3

0.6

0.9

1.2

1.5

0 10 20 30 40 50Slip (mm)

u√f`

c(M

Pa/√

MPa

)

0

3

6

9

12

15

180 0.2 0.4 0.6 0.8 1 1.2 1.4 1.6 1.8

Slip (in.)

u√f`

c(ps

i/√ps

i)fatigue Test

static Test

(a) Bond-Slip Relationship of #4 CFRP

Figure 4.12. Residual Bond-Slip Response Before and After Fatigue Loading

82

0

0.6

1.2

1.8

2.4

3

0 10 20 30 40 50Slip (mm)

u√f`

c(M

Pa/√

Mpa

)

0

4

8

12

16

20

24

28

32

360 0.2 0.4 0.6 0.8 1 1.2 1.4 1.6 1.8

Slip (in.)

u√f`

c(ps

i/√ps

i)

static Test

fatigue Test

(b) Bond-Slip Relationship of #8 GFRP

Figure 4.12. Residual Bond-Slip Response Before and After Fatigue Loading (Cont.) Table 4.2. The reasons are that fatigue loadings cause the micro-voids close up and result

in more contact area.

(3) Accumulated Slip’s Effect on Load-Slip Behavior. Specimens that did not

fail during the fatigue tests were subjected to the monotonic pullout tests. When

compared to the specimens without fatigue loading, the slip, mS , of the post-fatigue

specimens decreased. Interestingly, when adding the slip, mS , and residual slip, rS , due

to the fatigue loading (see Table 4.2), the sum of the slip would be very close to that of

the specimen without fatigue loading, mS . This may be due to the slip, to a large extent,

had already occurred during the fatigue loading. Also, the total slip is an inherent

property between the rebar and the concrete and has little relationship with the loading

history. A similar phenomenon was observed for

83

Table 4.2. Fatigue Bond Tests Results

Post-fatigue Specimens Specimens

without fatigue loading

I.D. Bond strength

'/ cfu (psi/ psi )

Slip1 mS

(in.)

Residual slip due

to fatigue2

rS (in.)

rm SS + (1)+(2)

Average Bond

Strength 'cf/u

(psi/ psi )

Average Slip mS (in.)

15.12 0.50 0.16 0.66 15.24 0.44 0.16 0.60 PC405F 16.56

15.6 0.51 0.14 0.65

0.64 15.24 0.69

35.52 0.23 0.08 0.31 35.4 0.16 0.09 0.26 PG805F 36.96

36 0.30 0.08 0.38

0.32 30.6 0.34

13.8 0.60 0.07 0.67 13.2 0.66 0.00 0.67 FC405F 16.32

14.4 0.57 0.09 0.66

0.67 13.2 0.67

27.84 0.43 0.08 0.51 32.28 0.38 0.03 0.41 FG805F 35.52

29.52 0.36 0.06 0.42

0.45 26.04 0.54

Note: (1) PG405F and FG405F specimens did not sustain 1 million cycles and are not listed

(2) Unlike the static tests, fatigue test results are more scattering. Thus, individual test results are also listed

the steel rebar embedded in plain concrete (Rehm and Eligehausen, 1979; Clark and

Johnston, 1983).

(4) Fatigue Loading Effect on Failure Mode. The load-slip behavior became

more brittle after being subjected to fatigue loading, and the fatigue loading could even

change the failure mode. Two of the three FG805F specimens failed by the concrete

splitting, while all the specimens FG805M failed in the rebar pullout. The fatigue loading

did not change the failure mode of the CFRP specimens.

84

• Effect of Polypropylene Fibers. Polypropylene fibers could effectively

decrease the rate of microcracks propagation, which was manifested by the fatigue bond

tests.

(1) Residual Slip. With the addition of polypropylene fibers, the residual slip

due to fatigue loading decreased (see Figure 4.13). The test results were scattered, a

characteristic well known in fatigue tests. However, it was clear that the progressive rate

of the residual slip was noticeably reduced with the addition of fibers.

(2) Degradation of Bond Stiffness. With the addition of polypropylene fibers,

the degradation rate of bond stiffness due to the fatigue loading decreased (see Figure

4.13). For CFRP specimens without fibers, the bond stiffness reduction ranged from 0%

to 35%. However, for CFRP specimens after adding fibers, no bond stiffness degradation

was observed. For GFRP specimens without fibers, the bond stiffness reduction ranged

from 20% to 30%. However, for GFRP specimens after adding fibers, the reduction range

was reduced to 5% to15%. Similar observations were made by Gopalaratnam et al. (2004)

based on their flexural bond tests.

4.2.2. Prediction of Ultimate Bond Strength. Bond of GFRP to concrete is

controlled by the following internal mechanisms: chemical bond, friction resistance, and

mechanical bearing of the GFRP rod against the concrete. When large slip exists, friction

and mechanical bearing are considered to be the primary means of stress transfer.

Based on the test results, slippage between the FRP rebar and the concrete was

very large at failure (more than 0.4 in. at the loaded end and 0.1 in. at the free end). Thus

it is safe to conclude that all the chemical adhesion has already been destroyed; that is, all

the bond strength consisted only of friction and mechanical bearing.

85

40.00%

50.00%

60.00%

70.00%

80.00%

90.00%

100.00%

110.00%

0 200000 400000 600000 800000 1000000

PC405F-1 FC405F-1

PC405F-2 FC405F-2

PC405F-3 FC405F-3

(a) Bond Stiffness Degradation Rate of #4 CFRP

40%

50%

60%

70%

80%

90%

100%

110%

0 200000 400000 600000 800000 1000000

PG805F-1 FG805F-1

PG805F-2 FG805F-2

PG805F-3 FG805F-3

(b) Bond Stiffness Degradation Rate of #8 GFRP

Figure 4.13. Bond Stiffness Degradation Rate

86

Through mechanical analysis (Figure 4.14), the summation of longitudinal

component, u, is equal to the total pullout force. Thus, Tuld db =π will result in:

dbldTu

π= psi (4.1)

)arctantan()arctantan( µαπµα +=

+=

dbr ld

TuR psi (4.2)

Figure 4.14. Relationship between Bond Strength and Splitting Force The splitting force is caused by radial component, Rr. For simplification, it is

assumed that the concrete is split into one half, and the force is evaluated as follows:

)tan()tan1(cos

22

2αµπαµθθ

π

π +−

== ∫−

Tdd

lRF bdrsplit lbs (4.3)

αRadial Splitting Force, R

Resultant, R

Bond Strength, u

Bearing, P

Friction, F

tan µ-1

r

A

A

α tan-1µ

Rr

θ dθ

R Rr

F

P

u Relationship between different components

A-A

87

where P is normal bearing force on deformation with unit area,

F is friction force on deformation with unit area,

R is resultant of P and F,

Rr is radial component of R,

u is longitudinal component of R=bond strength,

T is pullout force,

µ is friction coefficient, and

α is rib angle.

The pullout force is then expressed by:

splitFT ×−

+=

αµαµπ

tan1)tan( (4.4)

It is assumed that the splitting tensile strength is reached and uniformly

distributed along the splitting plane at the ultimate stage because of the plasticity of the

concrete. Therefore,

splitctsplit AfF = lbs (4.5)

Substituting Equation 4.5 into Equation 4.4 results in

splitct AfT ×−

+=

αµαµπ

tan1)tan( lbs

Finally, the bond strength, u, is expressed by:

db

splitct

db ldA

fld

Tuαµαµ

π tan1tan

−+

== psi (4.6)

where Asplit is the concrete splitting area, and fct is the splitting tensile strength. fct has

been related to 'cf in many publications. According to Carrasquillo et al. (1981), fct is

approximated by 5.0' )(8.6 cct ff = in psi and 5.0' )(56.0 cct ff = in MPa. It is assumed that the

88

tensile strength will not be changed with the addition of a small amount of polypropylene

fibers.

Based on results reported in Table 4.3, by assuming µ equals 0.45, predictions of

the bond strength correlated well with the test results.

Table 4.3. Comparison of Bond Strength between Prediction and Experiment

µ=0.4 µ=0.45 µ=0.5 '

cf (psi) db (in.)

α degree

utest (psi) Utheo

(psi) theo

test

uu upred.

(psi) theo

test

uu utheo.

(psi) theo

test

uu

7,400 0.5 2 2,850 2,263 1.25 2,524 1.12 2,785 1.02 7,400 1 5 2,644 2,553 1.04 2,814 0.94 3,075 0.86 5,360 0.5 2 2,352 1,929 1.22 2,146 1.09 2,379 0.99 5,360 0.5 2 2,070 1,929 1.07 2,146 0.96 2,379 0.87

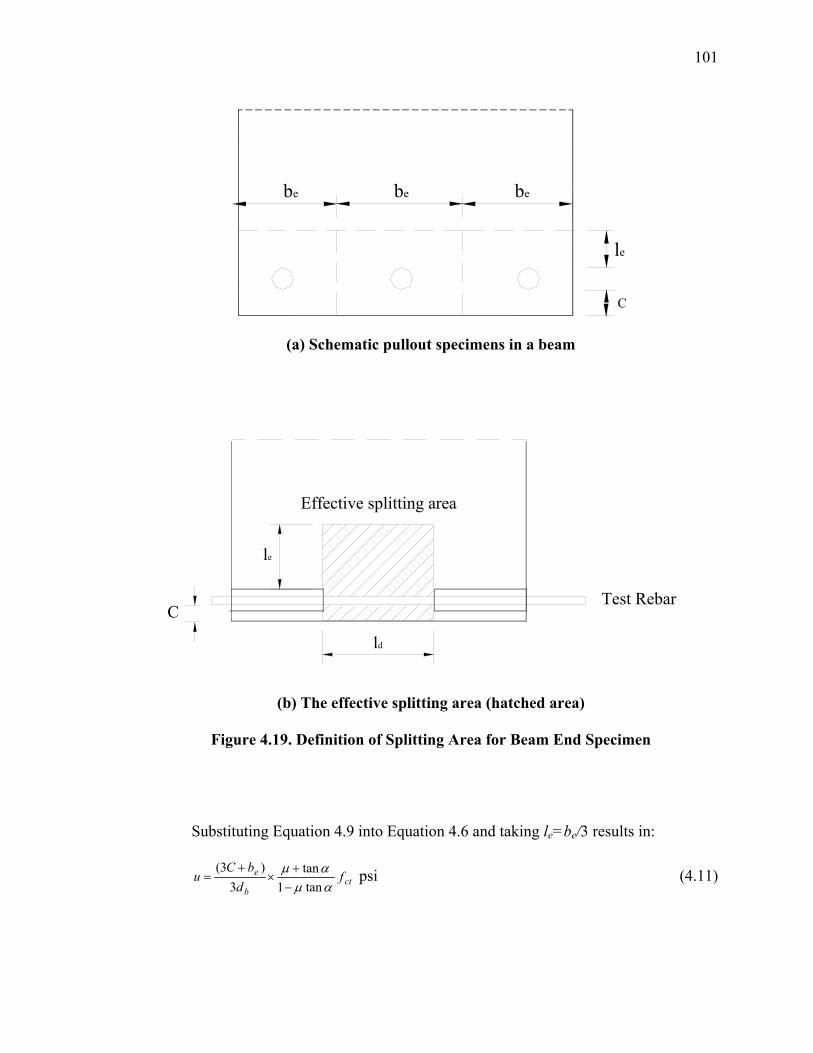
Equation 4.6 shows good correlation for bond strength controlled by concrete

splitting. In this study, it is assumed that deformation of the FRP bar is strong enough to

prevent itself from being sheared off. This assumption is generally valid in normal

strength concrete, especially for the rebar with deformations with small angles to the

longitudinal direction, like the GFRP used in this study. The FRP rebar with steep

deformations (as shown in Figure 4.6b) will produce larger shear stresses on the ribs,

even when they have the same projected rib areas (i.e. the same hr), and thus, the ribs are

easier to be sheared off. When the bond behavior is governed by the rib shear strength

other than concrete splitting, Equation.4.6 is no longer valid.

4.2.3. Basic Development Length. The application of the ultimate bond strength

data to real design is not appropriate because of the excessive slip occurring in these

89

specimens at large loads. Too much slip will result in untolerated crack widths. Although

the FRP rebars were relatively inert to environmental exposure, the slip may cause some

other problems, e.g., aesthetics. For traditional steel reinforced structures, ACI 318-02

requires a maximum crack width of 0.016 in. for interior exposure and 0.013 in. for

exterior exposure. ACI 440 recommends crack limitation for FRP structures to be 0.020

in. and 0.028 in. for exterior and interior exposure, respectively. From a designer’s point

of view, Mathey and Watstein (1961) suggested that bond stress corresponding to 0.01 in.

slippage of loaded end or 0.002 in. of free end for steel reinforced structures can be

defined as critical bond stress. The criterion of 0.01 in. slippage at loaded-end was

decided based on half of the crack width limitation. In a study conducted by Ferguson et

al. (1965), the researchers discovered that the loaded-end slip of the pullout specimens

was larger than that of the beam specimens because flexural cracks in beam specimens

tended to distribute the slip in several places along the beam. Also, since there is

relatively low elastic modulus of FRP materials (GFRP is about 1/5 that of steel, CFRP is

about 2/3 that of steel), greater elongation along the embedded rebar will be produced

and lead to larger loaded-end slip. Thus, 0.01 in. slippage at the loaded-end of pullout

specimens as design criterion is too conservative. To keep it comparable to limits

imposed on steel rebar, bond strength corresponding to 0.002 in. slippage at the free-end

is recommended as designing bond strength.

For the FRP rebar, the basic development length, ldb, is defined as the minimum

embedment length required to develop fracture tensile strength, ffu, of the FRP rebar.

Based on the equilibrium equation, fufbdb fAudl =π results in:

udfA

lb

fufdb π

= in. (4.7)

90

Referring to ACI 318-02, the development length of the rebar is expressed as

follows:

b

c

fud d

fK

fl

'= in. (4.8)

Equating (4.7) to (4.8) gives an expression to the coefficient '

4

cf

uK =

where Af = area of the FRP bar in in.2;

ffu = ultimate strength of FRP bar in psi,

fc’=concrete strength, psi.

db = diameter of FRP rebar in in., and

u = bond strength in psi.

A statistical analysis was performed on the design bond strength. Assuming the

test results were distributed as Student t distribution, the bond strength with 95%

confidence was computed as nstu − , where t is t distribution quantity, and is equal to

2.353 for 95% confidence in the case of three specimens; u is the average bond strength;

s is the standard derivation; n is the number of the test specimens, in this study n = 3.

Thus, a coefficient K = 42 was obtained. As mentioned previously, specimens after

fatigue loading have higher bond stiffness and capacity. Thus, this equation can also be

safely used in the fatigue loading situations.

If adjusting the development length to the AASHTO format, the equation used for

development length is:

'c

fufdb

f

fA.l 050= in. (4.9)

91

where Af= area of the FRP rebar, in2.

A K value of 0.04 is adopted by AASHTO for the steel reinforcement. Based on

this study, the development length for the FRP bars is recommended to be 25% larger

than that of the steel bar.

4.3. SPLITTING BOND TEST RESULTS

4.3.1. Test Results and Discussions. In the following sections, the observations

from the tests and several parameters that would influence the bond characteristics will

be discussed. These parameters included the fiber effect by volume fraction (Vf), cover

effect (Cb), and rebar diameter (db).

The average bond strength is calculated as the pullout force over the embedded

area of the rebar. When comparing the bond strength of specimens with different concrete

strengths, 'cf , bond strength was normalized by dividing by the square root of '

cf , which is

adopted in the current AASHTO Code.

Cracks, if any, initiated from the loaded end and propagated to the free end.

Following this, some cracks derivated from the longitudinal direction to the transverse

direction. Crack patterns observed on the outside of the specimens are shown in Figure

4.15 and listed in Table 4.4.

After failure, concrete covers were removed from the specimens to allow

inspection of the surface conditions of the rebars after testing. No major differences were

observed between the FRC specimens and the plain concrete specimens. The following

are some of the observations (see Figure 4.16):

92

(a) Crack patterns of #4 CFRP with 1 db cover in plain concrete and FRC

(b) Crack patterns of #4 CFRP with 3 db cover in plain concrete and FRC

(c) Crack patterns of #4 GFRP with 1 db cover in plain concrete and FRC

(d) Crack patterns of #4 GFRP with 3 db cover in plain concrete and FRC

Figure 4.15. Crack Patterns for Various Specimens Showing Effect of Cb and Vf

Plain FRC

Plain FRC

PlainFRC

Plain

FRC

93

(e) Crack patterns of #8 GFRP with 1 db cover in plain concrete and FRC

(f) Crack patterns of #8 GFRP with 3 db cover in plain concrete and FRC

Figure 4.15. Crack Patterns for Various Specimens Showing Effect of Cb and Vf (Cont.)

In the GFRP specimens, some resin of the rebar was scratched off the rebar

surface and remained attached to the concrete. The indentation shape of the GFRP rebar

was not changed, showing that the transverse direction of the rebar could sustain the

bearing compression force. Traces of concrete were observed on the rebar surface, which

revealed a good chemical bond between the rebar and the concrete.

Plain

FRC

Plain

FRC

94

Table 4.4. Description of Test Results

I.D. Failure Mode

Splitting Crack Width

Descriptions

4PC1 Splitting 0.001 in. One longitudinal crack along the embedment portion developed first, and then the concrete cover at the embedment portion spalled.

4PC3 Splitting 0.007 in.

One longitudinal crack along the embedment portion developed and extended toward the front face but did not reach the front face. Transverse flexural cracks were also observed.

4PG1 Splitting 0.035 in. Concrete cover spalled at the embedment portion. No cracks at side faces were observed.

4PG3 Splitting 0.011 in.

Longitudinal splitting crack developed and extended toward the front face but did not reach the front face. Transverse flexural cracks were observed. Cracks at side faces developed at the embedment portion. No cracks at the front face were observed.

8PG1 Splitting 0.2 in.

One big crack went through from front face to the free end, accompanied by several transverse cracks induced by bending. Two big cracks were also observed at the front face. They extended along the side faces and finally connected with the longitudinal crack at the surface, splitting the concrete into several pieces.

8PG3 Splitting 0.25 in.

One big crack went through from front face to the free end and extended down to the bottom at the front face; it almost splitted the concrete into halves. Several transverse cracks also were observed.

4FC1 Splitting 0.001 in. One crack developed and was limited to the embedment region.

4FC3 Pullout N/A

4FG1 Splitting 0.003 in. One crack developed and was limited to the embedment region.

4FG3 Pullout N/A

8FG1 Splitting 0.015 in. One longitudinal crack developed at the embedment portion, extended to the front face, and then went down to the rebar.

8FG3 Splitting 0.009 in. One longitudinal crack developed at the embedment portion, extended to the front face, and then went down to the rebar.

Note: (1) See Figure 4.15 for crack Patterns. (2) Results and descriptions are based on two duplicate specimens. (3) Splitting crack width was measured by microscope.

95

Figure 4.16. Surface Condition of Various FRP Rebars after Testing

In the CFRP specimens, some resin was scratched off the rebar surface and

remained glued to the concrete surface. Traces of concrete were observed on the rebar

surface, which revealed a good chemical bond between the rebar and the concrete.

4.3.1.1. Fiber effect on bond characteristics. In the following sections, the

fibers’ effects on the bond characteristics, in terms of crack patterns and bond slip

response, are discussed.

(a) Splitting Crack Patterns

The following are some of the different observations regarding the crack patterns

between the plain concrete specimens and the FRC specimens.

All the plain concrete specimens failed by concrete splitting. Most of the FRC specimens

failed also by concrete splitting, except for the #4 CFRP and #4 GFRP specimens with 3

db cover, which failed by rebar pullout. The width of the splitting cracks was smaller in

the case of the FRC specimens, which revealed that the fibers could effectively restrict

the development of cracks. Concrete spalling was observed in several plain concrete

specimens, but it did not occur in the FRC specimens. Since concrete spalling is a sign of

Concrete powder adhered to Concrete powder adhered

Resin was scratched Resin was scratched
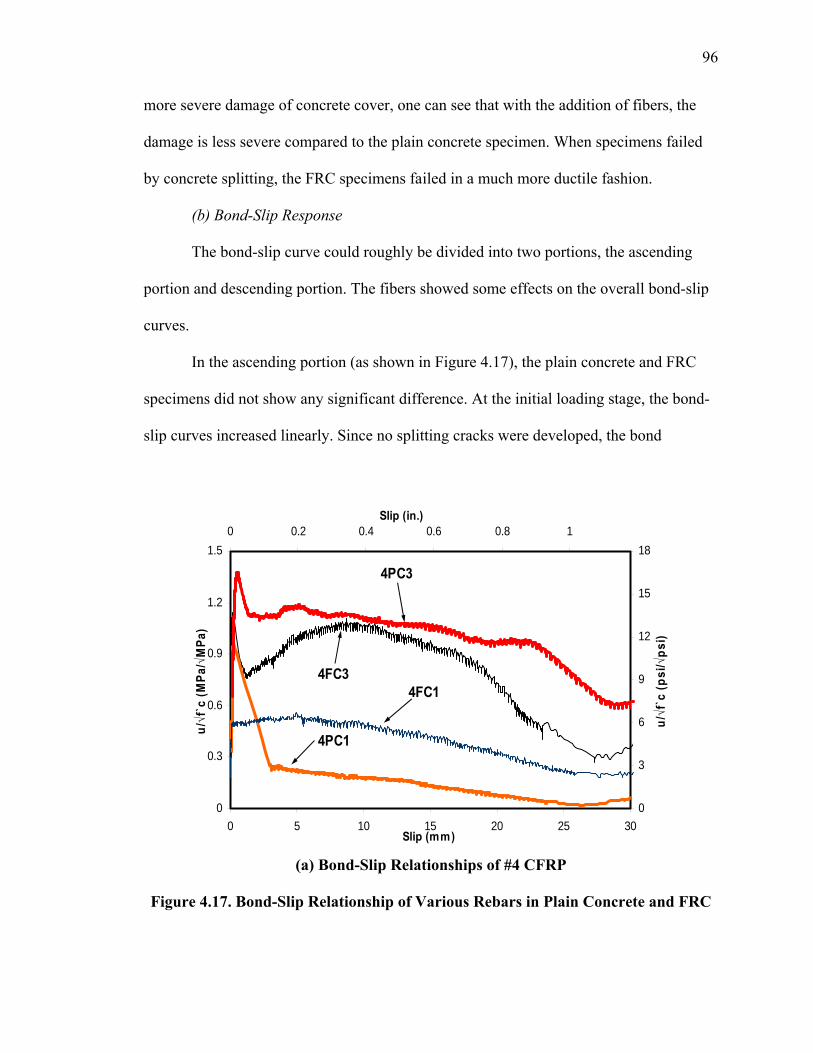
96

more severe damage of concrete cover, one can see that with the addition of fibers, the

damage is less severe compared to the plain concrete specimen. When specimens failed

by concrete splitting, the FRC specimens failed in a much more ductile fashion.

(b) Bond-Slip Response

The bond-slip curve could roughly be divided into two portions, the ascending

portion and descending portion. The fibers showed some effects on the overall bond-slip

curves.

In the ascending portion (as shown in Figure 4.17), the plain concrete and FRC

specimens did not show any significant difference. At the initial loading stage, the bond-

slip curves increased linearly. Since no splitting cracks were developed, the bond

0

0.3

0.6

0.9

1.2

1.5

0 5 10 15 20 25 30Slip (mm)

u/√f

`c (M

Pa/√

MPa

)

0

3

6

9

12

15

180 0.2 0.4 0.6 0.8 1

Slip (in.)

u/√f

`c (p

si/√

psi)

4FC14FC3

4PC1

4PC3

(a) Bond-Slip Relationships of #4 CFRP

Figure 4.17. Bond-Slip Relationship of Various Rebars in Plain Concrete and FRC

97

0

0.5

1

1.5

2

2.5

0 5 10 15 20Slip (mm)

u/√f

`c (M

Pa/√

MPa

)

0

5

10

15

20

25

300 0.1 0.2 0.3 0.4 0.5 0.6 0.7

Slip (in.)

u/√f

`c (p

si/√

psi)

4FG3

4PG34PG1 4FG1

(b) Bond-Slip Relationship of #4 GFRP

0

0.4

0.8

1.2

1.6

2

0 4 8 12 16 20Slip (mm)

u/√f

`c (M

Pa/√

MPa

)

0

4

8

12

16

20

240 0.1 0.2 0.3 0.4 0.5 0.6 0.7

Slip (in.)

u/√f

`c (p

si/√

psi)

8FG3

8FG1

8PG3

8PG1

(c) Bond-Slip Relationship of #8 GFRP

Figure 4.17. Bond-Slip Relationship of Various Rebars in Plain Concrete and FRC

(Cont.)

98

stiffness was quite high. At about 50% to 80% of the ultimate capacity, the splitting

micro-cracks developed. The stiffness of the bond-slip curve decreased accordingly.

In the descending portion, the confinement from the concrete to rebar decreased

with the propagation of the splitting cracks. Consequently, the pullout loads dropped. In

the descending portion (as shown in Figure 4.17), significant differences were observed

between the plain concrete specimens and the FRC specimens. In the plain concrete, after

reaching its capacity, the load dropped suddenly to zero. However, in the FRC, after

reaching the peak, with the presence of fibers, which limited the propagation of splitting

cracks, the confinement force from the concrete was still relatively significant. Therefore,

the bond-slip curve dropped gently and maintained at more than 70% of its capacity, even

at the slip of 0.4 in.

4.3.1.2. Cover effect on bond characteristics. The bond strength increased with

the increase of the clear cover depth. The increasing rates differed for the different

specimens, as shown in Figure 4.17 and Table 4.5. Before the bond reached the peak, the

bond-slip curves for specimens with 1 db and 3 db were almost identical. Specimens with

1 db cover always failed with less capacity and smaller slips.

4.3.1.3. Diameter effect on bond characteristics. The smaller diameter rebar

had higher bond capacity, similar to the behavior of the traditional steel rebar, as shown

in Table 4.5.

4.3.2. Theoretical Prediction of Bond Strength. The theory used in pullout

specimens should also be valid in beam end specimens since the bond mechanism is

similar. However, the definition of the effective splitting area, Asplit, is necessary before

the direct application of Equation 4.6.

99

Table 4.5. Test Results of Beam End Tests

I.D.

Ultimate Bond

Strength u

(psi)

Ultimate Bond Strength*

u/ 'cf

(psi/ psi )

Loaded-End Slip at Peak

(in.)

Free-End

Slip at Peak (in.)

Design Bond

Strength udesign (psi)

95% of Design

Strength (psi)

4PC1 943 12.48 0.011 0.001 904 863 4PC3 1,318 17.52 0.018 0.002 1,025 962 4FC1 357 6.00 0.003 0.004 454 428 4FC3 880 14.88 0.009 0.001 1,107 995 4PG1 1,607 21.24 0.038 0.002 1,072 1,012 4PG3 2,055 27.24 0.052 0.010 1,089 982 4FG1 1,279 21.60 0.037 0.011 1,146 1,054 4FG3 1,388 23.40 0.215 0.202 1,398 1,387 8PG1 969 12.84 0.020 0.002 844 696 8PG3 1,436 19.08 0.026 0.001 957 848 8FG1 893 15.12 0.019 0.002 976 964 8FG3 1,179 19.92 0.162 0.132 975 954

(1) Numbers are the average values for two testing specimens. (2) The asterisk indicates the bond strength normalized to square root of concrete

strength. Several models have been developed for the bond strength prediction of the

traditional steel rebar. In these models, an assumption is commonly used: concrete within

the cylinder or square (the largest square or circle that can be drawn within the beam

section around the rebar, as shown in Figure 4.18) is regarded as the effective portion to

prevent the beam from splitting. In other words, the contribution from the portion outside

the cylinder or square is ignored (Kemp, 1986). This theory does not consider the beam-

width effect on bond strength. Two beams, as shown in Figure 4.18, should have the

same bond strength based on that theory, since they have the same area of concrete to

resist the beam from splitting. However, research showed that the width of the beam

could influence the bond strength and that wider beams resulted in higher bond strength

100

be be

C

Figure 4.18. Previous Definition of Contribution from Concrete

(Chinn et al., 1955; Ferguson and Thompson, 1962). This phenomenon reveals that

concrete outside the circle or square has a noticeable effect on bond strength and cannot

be ignored. Wider beams have more concrete to prevent beams from splitting. In other

words, the effective splitting area increases with the increasing of the beam width.

Apparently, it is the effective beam width rather than the total beam width that influences

the bond strength.

Based on the above explanation, schematic pullout specimens (rectangular

concrete blocks surrounded by dash lines with an area of )( Cdlb bee ++× , as shown in

Figure 4.19), are used to represent the beam to describe its bond mechanism. Thus, the

approach used in the pullout specimens can be applied to the beam situation. The

effective splitting area, as shown in Figure 4.19b, is taken as

desplit lClA )( += in.2 (4.10)

where le is the effective splitting length, and le is a function of effective beam width. In

this analysis, le is assumed to be equal to be/3 in this study and be is the effective beam

width, from center to center of the rebar spacing or from the edge of the beam to the

center of the rebar spacing;

101

be be be

le

C

(a) Schematic pullout specimens in a beam

Effective splitting area

Test RebarC

ld

le

(b) The effective splitting area (hatched area)

Figure 4.19. Definition of Splitting Area for Beam End Specimen

Substituting Equation 4.9 into Equation 4.6 and taking le=be/3 results in:

ctb

e fd

bCu

αµαµ

tan1tan

3)3(

−+

×+

= psi (4.11)

102

To test the correlation of Equation 4.10, a comparison was made between test

results and predictions, as shown in Table 4.6. Since Equation 4.10 is based on the

assumption that the specimen fails in concrete splitting, only specimens that failed in this

mode were included. As shown in Table 4.6, the predictions of Equation 4.10 are close to

the test results but are consistently lower by about 10% than those of the test results.

Bond strength is highly dependent on the embedment length as well. Specimens with

longer embedment length usually result in lower average bond strength. To account for

this, an adjustment factor, γ, is added to reflect the embedment length. Thus, Equation

4.10 becomes

ctb

e fd

bCu γ

αµαµ

tan1tan

3)3(

−+

×+

= psi (4.12)

in which γ is a function of embedment length, based on the current test results, where

ld=10db, γ can be taken as 0.9. Further study is needed to look into various embedment

lengths and other situations, such as the effect of different fiber volume fraction.

Table 4.6. Comparison of Bond Strength between Prediction and Experiment

Specimen I.D.

f`c (psi) C/db

db (in.)

be (in.)

α degree

utest (psi)

utheo (psi) Eq. (9)

theo

test

uu

4PG1 5656 1 0.5 9 2 1588 1743 0.91 4PG3 5656 3 0.5 9 2 2055 2241 0.92 8PG1 5656 1 1 9 5 969 1131 0.86 8PG3 5656 3 1 9 5 1436 1697 0.85 4FG1 3480 1 0.5 9 2 1279 1368 0.94 8FG1 3480 1 1 9 5 893 888 1.01 8FG3 3480 3 1 9 5 1179 1331 0.89

Average 0.91 COV 0.05

103

4.3.3. Basic Development Length. By adopting the same methodology used in

the pullout tests, a similar expression based on the test data from splitting bond test was

developed for the basic development length for the FRP rebars embedded in FRC.

Based on the test data from a total of 24 specimens (The #4 CFRP with 1 db cover

was not considered, which had much lower bond strength value when compared to the

other cases. This may be due to the ill vibration during fabrication of the specimen.), a

statistical analysis with 95% confidence was conducted (the method is the same as that

conducted in pullout bond test). The following expression was obtained

'37 c

bfudb

f

dfl = in. (4.13)

Also, by adjusting the format to the AASHTO, the development length can be

computed as the following expression:

'056.0

c

fufdb

f

fAl = in. (4.14)

As mentioned previously, a K value of 0.04 is adopted by AASHTO for the steel

reinforcement. Based on this study, the development length for the FRP bars is

recommended to be 40% larger than that of the steel bar.

The development length derived based on the beam tests are slightly larger

(approximately 10%) than that obtained from the pullout bond test. As we discussed

previously, the pullout bond specimen is under compression in the case of pullout bond

tests, which will induce confinement effect on the bond and result in larger bond strength.

Consequently, the development length computed by the pullout test method is smaller.

Since the stress condition in beam end specimens are closer to the real conditions,

104

Equation 4.13 or 4.14 is recommended as the equation to calculate the development

length for FRP reinforcement.

ACI 440 recommendations for the development length is:

2700bfu

db

dfl = in. (4.15)

By assuming the concrete strength of 5000 psi, one can see that the development

length computed by Equation 4.15 is very close to ACI 440 recommendation.

4.4. CONCLUDING REMARKS

Bond characteristics were investigated by two different methods; i.e., the pullout

bond test and the splitting bond test. Fibers, bar surface, diameter, embedment length,

cover depth, and fatigue loading’s effect on bond characteristics were investigated. The

following concluding remarks could be made:

• With the addition of fibers, the bond-slip relationship significantly improved in

the post-peak region, while little change was observed for the pre-peak behavior.

The FRC specimens failed in a more ductile fashion with a smooth descending

portion. A large portion of the load could be held, even at large slip. The plain

concrete specimens failed in a very brittle fashion. Once it reached the peak value,

the load dropped suddenly to zero.

• Different bond mechanisms were observed for the CFRP and the GFRP

specimens due to their different surface treatments. Bond strength of the GFRP

specimen was about twice as much as that of the CFRP. The GFRP specimen

failed by concrete splitting; while the bond failure of the CFRP specimen initiated

by the rebar pullout, providing more ductile behavior;

105

• Fatigue loading, within a working stress range, was shown to increase the bond

stiffness and the bond strength, while causing the bond behavior to be more brittle

and often change the failure mode from rebar pullout to concrete splitting.

• The large amount of slip between the rebar and concrete has occurred during the

fatigue loading. Therefore, the total slip, including the residual slip due to fatigue

loading, could be regarded as an inherent property for bond behavior between the

rebar and the concrete, and it has little relationship with the loading history.

• Polypropylene fibers can effectively decrease the rate of bond degradation due to

the fatigue loading.

• Based on analytical derivation and experimental calibration, an equation was

proposed to predict the bond strength for the FRP bars embedded in FRC failed

by concrete splitting.

• Bond value corresponding to 0.002 in. at the free-end slip or 0.01 in. at the loaded

end was recommended as the designing bond strength in previous studies (Mathey

and Watstein, 1961). Based on this criteria, an equation for the basic development

length of the FRP rebar in the FRC was proposed.

106

5. FLEXURAL DUCTILITY TEST RESULTS

5.1. INTRODUCTION

Ductility is a structural design requirement in most design codes. In steel RC

structures, ductility is defined as the ratio of post-yield deformation to yield deformation

which usually comes from steel. Ductile structural members offer many benefits for the

structures. The most important aspect is that for the ductile structures, there will be a

warning before failure; while little or no warning can be observed before failure for the

brittle structures. Due to the linear-strain-stress relationship of the FRP bars, the

traditional definition of ductility cannot be applied to the structures reinforced with FRP

reinforcement. Several methods, such as the energy based method and the deformation

based method, have been proposed to calculate the ductility index for FRP reinforced

structures (Naaman and Jeong, 1995, and Jaeger et al., 1995).

Due to the linear elastic behavior of the FRP bars, the flexural behavior of FRP

reinforced beams exhibits no ductility as defined in the steel reinforced structures. A

great deal of effort has been made to improve and define the ductility of the beams

reinforced with FRP rebars. To date, there are three approaches; one approach is to use

the hybrid FRP rebars; that is, pseudo-ductile materials are fabricated by combining two

or more different FRP reinforcing materials to simulate the elastic-plastic behavior of the

steel rebars. Harris, Somboonsong, and Ko (1998) tested beams reinforced with the

hybrid FRP reinforcing bars and they found that the ductility index of those beams can be

close to that of the beams reinforced with steel. This method has shown some success in

the research studies but has resulted in limited practical applications because of the

107

complicated and costly manufacturing process of the hybrid rebars. Another approach to

realize the ductility of the FRP reinforced members is through the progressive failure of

bond and the combination of rebars with different mechanical properties (Gopalaratnam,

2005). The third approach is to improve the property of concrete. ACI 440 recommends

the FRP reinforced structure be over-reinforced and designed so that the beams fail by

concrete crushing rather than by rebar rupture. Thus, the ductility of the system is

strongly dependent on the concrete properties. Alsayed and Alhozaimy (1999) found that

with the addition of 1% steel fibers, the ductility index could be increased as much as

100%. Li and Wang (2002) reported that the GFRP rebars reinforced with engineered

cementitious composite material showed much better flexural behaviors. The ductility

was also found to be significantly improved.

This chapter presents research result on the flexural behavior of concrete beams

reinforced with FRP rebars and concrete containing polypropylene fibers. The different

behaviors of plain concrete beams and FRC beams are also discussed.

5.2. TEST RESULTS AND DISCUSSIONS

This Chapter provides a summary of the overall flexural behavior of the FRP/FRC

hybrid system in terms of crack distribution, load-deflection response, relative slip

between the rebar and concrete, cyclic loading effect on flexural behavior, and strain

distribution in concrete and reinforcement. Comparison between FRP/Plain concrete

system and FRP/FRC system is also discussed.

5.2.1. Crack Distribution. Figures 5.1 to 5.3 show the typical crack patterns for

the FRP reinforced beams at moderate (40% Mu) and high (80% Mu) load levels to

108

(a) VF4C (FRC Beams)

(b)VP4C (Plain Concrete Beams)

Figure 5.1. Crack Patterns for #4 CFRP Beams at Moderate and High Level Loading

0.4Mu

0.8Mu

0.8Mu

0.4Mu

109

(b) VF4G (FRC Beams)

(b) VP4G (Plain Concrete Beams)

Figure 5.2. Crack Patterns for #4 GFRP Beams at Moderate and High Level Loading

0.4Mu

0.8Mu

0.4Mu

0.8Mu

110

(a) VF8G (FRC Beams)

(b) VP8G (Plain Concrete Beams)

Figure 5.3. Crack Patterns for #8 GFRP FRC Beams at Moderate and High Level Loading

0.8Mu

0.4Mu

0.8Mu

0.4Mu

111

investigate the crack distribution at different load level. Like traditional steel rebar

reinforced beams, vertical flexural cracks developed first at the pure bending regions.

Then, the inclined shear cracks were induced with the increase of load.

• Cracking Moment. Theoretical and experimental values for cracking

moments are given in Table 5.1. As shown in Table 5.1, the experimental values were

close to the theoretical values but were consistently lower by about 20% than those of the

theoretical predictions. Also, as expected, the cracking moment was not affected by the

addition of 0.5% of polypropylene fibers. This was because the elongation at break of the

polypropylene fiber is three orders of magnitude greater than the ultimate tensile strain of

the concrete due to the low elastic modulus (500 to 700 ksi). Hence, the concrete would

crack long before the fiber strength was approached.

• Crack Spacing. Table 5.2 shows the average crack spacing at 40% and 80%

of the flexural capacity. With the increase of load, crack spacing slightly decreased.

Interestingly, by comparing the crack spacing between the plain concrete beams and the

FRC beams, the crack spacing was virtually the same at 80% of ultimate load, while the

crack spacing of the FRC beams was about 20% smaller than that of plain concrete at a

moderate service load (about 40% of ultimate load).

Studies suggest that the flexural cracking can be closely approximated by the

behavior of a concrete prism surrounding the main reinforcement and having the same

centroid. Cracks initiate when the tensile stress in the concrete exceeds the tensile

strength of concrete, ft’. When this occurs, all the force in the prism is transferred to the

rebar. Away from the crack, the concrete stress is gradually built up through the bond

stress between the rebar and the concrete. When the stresses in the concrete are large

112

enough and exceed the tensile strength of concrete ft’, a new crack forms. The above

mechanism is demonstrated in Figure 5.4.

Table 5.1. Cracking Moment and Average Crack Spacing

Specimen I.D. Mcr (kips-in.)

Mcr-exp

(kips-in.) expcr

cr

MM

VP4C-1 53.1 1.13 VP4C-2 60.0 48.3 1.24 VP4G-1 54.3 1.10 VP4G-2 60.0 48.3 1.24 VP8G-1 48.1 1.26 VP8G-2 60.4 48.3 1.25

Average 50.1 1.20 VF4C-1 42.3 1.13 VF4C-2 47.7 42.3 1.13 VF4G-1 40.3 1.18 VF4G-2 47.7 44.0 1.08 VF8G-1 36.3 1.33 VF8G-2 48.1 36.7 1.31

Average 40.3 1.19 Note: the self weight of beams have been included in calculating the experimental cracking moments.

Table 5.2. Average Crack Spacing

Specimen I.D.

Crack Spacing, Sm, at 40%Mu

(in.)

Crack Spacing, Sm, at 80%Mu

(in.)

plain

FRC

SS

at 40%Mu plain

FRC

SS

at 80%Mu

ACI-440 (in.)

CEB-FIP Code (in.)

VP4C 6.00 4.55 N/A N/A 7.30 4.50 VP4G 5.28 3.58 N/A N/A 5.40 3.75 VP8G 6.00 4.23 N/A N/A 8.02 4.24 VF4C 4.60 4.20 0.77 0.93 7.30 4.50 VF4G 4.00 3.43 0.76 0.96 5.40 3.75 VF8G 4.80 4.40 0.8 1.04 8.02 4.24

113

Formation of First Crack

Stess in Concrete

Bond Stess

Contribution from bridging of fibers

Stess in Concrete

f' t f' t

Contribution from bond stressBond Stress

Formation of First Crack

First Crack First Crack

First Crack First Crack Second CrackSecond Crack

Fiber Bridging

Uniform concrete stresstransfered by fibers

S1 S2

Distribution before formationof secondcrack

(a) Crack Formation in Plain Concrete Beam (b) Crack Formation in FRC Beam

Figure 5.4. Mechanism of Crack Formation in Plain Concrete Beams and FRC Beams

With the addition of fibers, the mechanism of crack formation is slightly changed,

as shown in Figure 5.4. Some tensile loads can be transferred across the cracks by the

bridging of fibers. Thereby, the stress in the concrete comes from not only the bond stress,

but the bridging of fibers as well. With the contribution from the fibers, less bond stress is

needed to reach the same cracking stress. Consequently, the spacing of crack is smaller in

the FRC beams than in the plain concrete beams (S2 < S1 as shown in Figure 5.4).

At the high level of load, due to inadequate bond between the fibers and concrete,

fibers are pulled out and the contribution from the bridging of fibers is diminished.

• Compared with the Predictions by CEB-FIP Code. The CEB-FIP Code

expression for the average crack width for the steel reinforced concrete is in the following

manner:

114

ef

bm

dkk)sc(S

ρ21102 ++= in. (5.1)

where c = clear concrete cover

s = maximum spacing between longitudinal reinforcing bars but shall not be taken

greater than 15 db

db = bar diameter

ρef = As / Acef

As = area of steel considered to be effectively bonded to the concrete

Acef = area of effective embedment zone of the concrete

k1 = 0.4 for deformed bars; and 0.8 for plain bars

k2 = coefficient to account for stain gradient

The same method is adopted for the FRP reinforced beams and compared to the

test data. As shown in Table 5.2, the prediction values underestimate the crack spacing at

the service load (40% of the ultimate), especially in the case of the plain concrete beams.

• Compared with the Prediction by ACI 440. Based on the current ACI 440

recommends for the crack width of the FRP reinforced member, the following equations

can be derived to calculate the crack spacing:

32200 Adkw cb= in. (5.2)

where w = the crack width at tensile face of the beam,

A = the effective tension area per bar,

dc = the thickness of concrete cover measured from extreme tension fiber to the

center of the closest layer of longitudinal bars, and

115

kb = the coefficient that accounts for the degree of bond between the FRP bar and

the surrounding concrete. ACI suggests 1.2 for deformed FRP bars if kb is not

experimentally known.

As shown in Table 5.2, the ACI predictions overestimate the crack spacing for

both plain concrete beams and FRC beams when kb is equal to 1.2.

• Crack Width. During the tests, crack widths were measured by the distance

changes between the Demac gages. Figures 5.5 to 5.7 show the relationships between the

crack width and the applied moment. In the following section, several currently available

models to predict the crack width are discussed and compared with test results.

0

5

10

15

20

25

30

35

40

45

50

0 0.2 0.4 0.6 0.8 1 1.2 1.4 1.6 1.8 2Crack Width (mm)

Mom

ent (

kN.m

)

0

50

100

150

200

250

300

350

400

0 0.01 0.02 0.03 0.04 0.05 0.06 0.07Crack Width (in.)

Mom

ent (

kips

-in.)

VF4C-1VF4C-2VP4C-2VP4C-1

ACI 440, Kb=1.0

Toutanji et al.

Salib et al.

ACI 318

CEB-FIP

Service Moment=180 Kips-in

Figure 5.5. Crack Width versus Applied Moment of #4 CFRP Beams

116

0

5

10

15

20

25

30

35

40

45

50

0 0.2 0.4 0.6 0.8 1 1.2Crack Width (mm)

Mom

ent (

kN.m

)

0

50

100

150

200

250

300

350

400

0.000 0.005 0.010 0.015 0.020 0.025 0.030 0.035 0.040 0.045Crack Width (in.)

Mom

ent (

kips

-in.)

VF4G-1

VF4G-2

VP4G-1

VP4G-2

Toutanji et al.

ACI 440 Kb=1.0

Salib et al.

ACI 318

CEB-FIP

Service Moment=180 Kips-in

Figure 5.6. Crack Width versus Applied Moment of #4 GFRP Beams

0

5

10

15

20

25

30

35

40

45

50

0 0.3 0.6 0.9 1.2Crack Width (mm)

Mom

ent (

kN.m

)

0

50

100

150

200

250

300

350

400

0 0.005 0.01 0.015 0.02 0.025 0.03 0.035 0.04 0.045Crack Width (in.)

Mom

ent (

kips

-in.)

VF8G-1

VF8G-2

VP8G-1

VP8G-2

Toutanji et al.

ACI 440, Kb=1.0

Salib et al.

ACI 318

CEB-FIP

Service Moment=180 Kips-in

Figure 5.7. Crack Width versus Applied Moment of #8 GFRP Beams

117

Based on the well-known Gergely-Lutz (1973) equation, ACI 440 recommends

the equation to calculate the crack width of FRP reinforced member as follows:

32200 AdfkE

w cfbf

β= in. (5.3)

where w = the crack width at tensile face of the beam,

A = the effective tension area per bar,

dc = the thickness of concrete cover measured from extreme tension fiber to the

center of the closest layer of longitudinal bars,

ff = the stress in the FRP reinforcement,

β = the coefficient to converse crack width corresponding to the level of

reinforcement to the tensile face of beam, and

kb = the coefficient that accounts for the degree of bond between the FRP bar and

the surrounding concrete. It was reported that kb ranges from 0.71 to 1.83 for

different types of GFRP bars (Gao et al., 1998). ACI 440 does not give a

mathematical relationship between kb and the bond strength. And it suggests 1.2

for deformed FRP bars if kb is not experimentally known.

Toutanji and Saafi (2000) reported that the crack width was a function of the

reinforcement ratio. They proposed the following equation to predict the crack width:

3200 AdfE

w cfff

βρ

= in. (5.4)

where ρf is the reinforcing ratio.

Based on the equivalent beam concept, Salib and Abdel-Sayed (2004) proposed

the following equation:

33/2,,

3 })/)(/{(10076.0 AdfuuEEw cffbsbfs β×××= − in. (5.5)

118

By substitute Es=29000 ksi; thus

3)3/2(

,

,2200 Adfuu

Ew cf

fb

sb

fβ×⎟

⎜⎜

⎛×= in. (5.6)

where ub,s and ub,f are the bond strengths of steel rebar and FRP rebar, respectively.

In Equation 5.6, the values of ub,f and ub,f need to be evaluated and decided upon.

For traditional steel rebar, according to ACI 318-02, 'c

byd

f

dfl

25= (neglecting the adjusting

coefficients) and based on the definition of the development length,

sys,bdb Afuld =π (5.7)

One gets: 'cs,b f.u 256= psi.

For FRP rebar used in this study, based on the previous study (Belarbi and Wang,

2005), 'cf,b f.u 259= . Based on these approximate values, Equation 5.5 become

31700 AdfE

w cff

β= in. (5.8)

The crack width can also be derived based on the crack spacing. Concrete can

sustain very small tensile stain due to stress before it cracks. After cracking, the tensile

side of the beam elongates by widening of the cracks and by formation of new cracks.

Ignoring the small elastic stain in the concrete between the cracks, the crack width can

also be expressed as follows:

mf Sw ε= in. (5.9)

Substitute Equation 5.1 into 5.9, result in

⎪⎭

⎪⎬⎫

⎪⎩

⎪⎨⎧

++=ef

bf

dkk)sc(w

ρε 2110

2 in. (5.10)

119

As shown in Figures 5.5 through 5.7, the Salib et al. model gives reasonable

predictions of the crack width for both plain concrete beams and FRC beams. For the

Toutanji et al. model, the prediction values show poor correlation with the experimental

results. When for low reinforcing ratios, (for the CFRP beams, ρ=0.67%), the model

overestimates the crack width. Vice versa, for high reinforcing ratios (#4 GFRP beams,

ρ=2.2%, and #8 GFRP beams, ρ=3.3%), the model underestimates the crack width.

Therefore, it may be concluded that it is the bond characteristics rather than the

reinforcing ratio that affect the crack width.

The predictions based on current ACI 440 equations were also compared with the

test results. The accuracy of the equation largely depends on the value of kb. Even when

selecting kb =1.0, one can see that the predictions are still conservative. Similar

observations were made by El-Salakawy and Benmokrane (2004).

Compared to the test results, the predictions based on the CEB-FIP Code

underestimated the crack width, especially in the case of #8 GFRP. As shown in Table

5.2, the prediction by Equation 5.1 underestimate the crack spacing at the service load,

thus, the predicted crack width will be underestimated.

• Fiber Effect on Crack Width. With the addition of fibers, the crack widths

were slightly decreased at the same load level, especially at the service load, as shown in

Figures 5.5 through 5.7.

As shown in Table 5.3, the crack widths were smaller in the case of FRC beams

as compared to plain concrete beams at the service load. As discussed earlier, the crack

spacing was decreased at the service load due to the contribution from the fibers. Since

120

the crack width is proportionally related to the crack spacing, the crack width is expected

to be smaller in the FRC beams at the service load.

Table 5.3. Comparison of Crack Width between Plain Concrete Beams and FRC Beams at Service Load

Specimen I.D. VP4C VP4G VP8G VF4C VF4G VF8G

Crack Width (in.) 0.024 0.019 0.018 0.021 0.016 0.014

% decrease relative to respective plain concrete N/A N/A N/A 10% 16% 20%

Note: the values are average of two beams.

5.2.2. Load-Deflection Response. Figures 5.8 and 5.9 show the typical

experimental moment-deflection curves for the plain concrete beams and the FRC beams

reinforced with different types of FRP rebars. With the increasing of moment, cracks

occurred in the testing region when the moment exceeded the cracking moment, Mcr.

Consequently, the flexural stiffness of the beams was significantly reduced and the

curves were greatly softened. As expected, due to the linear-elastic behaviors of the FRP

rebars, the FRP reinforced beams showed no yielding. The curves went up almost

linearly until the crushing of concrete.

• Fiber Effect on Moment-Deflection Curves. In order to compare the

flexural behaviors between plain concrete beams and FRC beams, all the load-deflection

curves of the plain concrete beams were normalized, based on the following rules: 1)

moment was divided by a coefficient CM, defined as FRCACI

plainACIM M

MC

−= , where MACI-plain and

MACI-FRC are theoretical ultimate capacities computed based on ACI 440 for beams with

121

0

5

10

15

20

25

30

35

40

45

0 5 10 15 20 25 30 35 40Deflection (mm)

Mom

ent (

kN.m

)

0

50

100

150

200

250

300

350

0 0.2 0.4 0.6 0.8 1 1.2 1.4Deflection (in.)

Mom

ent (

ips-

in.)

VF4C

VF4G

VF8G

Figure 5.8. Moment-Deflection Relationship for FRC Beams

0

5

10

15

20

25

30

35

40

45

50

55

0 5 10 15 20 25 30 35 40Deflection (mm)

Mom

ent (

kN.m

)

0

50

100

150

200

250

300

350

400

450

0 0.2 0.4 0.6 0.8 1 1.2 1.4Deflection (in.)

Mom

ent (

kips

-in.)

VF4G

VP4C

VP8G

Figure 5.9. Moment-Deflection Relationship for Plain Concrete Beams

122

Table 5.4. Comparison of Flexural Strength and Deflection between FRC Beams and Plain Concrete Beams

Specimen I.D. (1)

Ultimate Moment (kips-in.)

(2)

Ultimate Deflection

(in.) (3)

Ultimate Moment (kips-in.)

(4)

Ultimate Deflection

(in.) (5)

Plain

FRC

MM

(6) Plain

FRC

∆∆

(7) VP4C-1 457 1.19 375 1.03 VP4C-2 442 450 1.17 1.18 362 369 1.00 1.02 N/A N/A

VP4G-1 405 1.03 330 0.94 VP4G-2 420 413 1.02 1.03 342 336 0.93 0.94 N/A N/A

VP8G-1 448 0.96 360 0.87 VP8G-2 449 449 0.95 0.96 360 360 0.86 0.87 N/A N/A

VF4C-1 415 1.20 415 1.20 VF4C-2 388 402 1.10 1.15 388 402 1.10 1.15 1.09 1.13

VF4G-1 350 1.19 350 1.19 VF4G-2 362 356 1.19 1.19 362 356 1.19 1.19 1.06 1.27

VF8G-1 371 0.95 371 0.95 VF8G-2 361 366 0.87 0.91 361 366 0.87 0.91 1.02 1.05

Note: Columns (4) and (5) are the normalized values of Column (3) and (4); Columns (6) and (7) are the ratios of moment or deflection between the FRC beams to those of the plain concrete beams after normalizations. concrete strengths equal to the plain concrete beams and the FRC beams using the same

approach, respectively; 2) deflection was divided by a coefficient CD, defined as

FRCACI

plainACIDC

∆= , where ∆ACI-plain and ∆ACI-FRC are theoretical deflection based on ACI 440

for beam with concrete strengths equal to the plain concrete beams and FRC beams at the

service load (40% of the ultimate load), respectively.

As shown in Table 5.4 and Figures 5.10 through 5.12, with the addition of fibers,

the ultimate moments and deflections were increased. The plain concrete beams failed in

a more brittle manner. Once it reached the capacity, the concrete was crushed and the

123

0

5

10

15

20

25

30

35

40

45

0 5 10 15 20 25 30 35 40Deflection (mm)

Mom

ent (

kN.m

)

0

50

100

150

200

250

300

350

0 0.2 0.4 0.6 0.8 1 1.2 1.4

Deflection (in.)

Mom

ent (

ips-

in.)

VF4C

VP4C

ACI 440

Analytical Curve

Figure 5.10. Moment-Deflection Relationship for #4 CFRP with/without Fibers

0

5

10

15

20

25

30

35

40

45

0 5 10 15 20 25 30 35 40Deflection (mm)

Mom

ent (

kN.m

)

0

50

100

150

200

250

300

350

0 0.2 0.4 0.6 0.8 1 1.2 1.4Deflection (in.)

Mom

ent (

kips

-in.)

VF4G

VP4G

ACI 440

Analytical Curve

Figure 5.11. Moment-Deflection Relationship for #4 GFRP with/without Fibers

124

0

5

10

15

20

25

30

35

40

45

0 5 10 15 20 25 30 35 40Deflection (mm)

Mom

ent (

kN.m

)

0

50

100

150

200

250

300

350

0 0.2 0.4 0.6 0.8 1 1.2 1.4Deflection (in.)

Mom

ent (

kips

-in.).

VF8G

VP8G

ACI 440

Analytical Curve

Figure 5.12. Moment-Deflection Relationship for #8 GFRP with/without Fibers

load dropped suddenly and violently. FRC beams failed in a more ductile way as the load

dropped more gently and smoothly.

Theoretical Correlation. Deflection at mid-span for a simply supported beam of

total length L and subjected to a four-point flexural test is given as

eecmid GI

aPh)aL(IE

Pa10

4324

222 +−=∆ (in.) (5.11)

The first term on the right is from the flexural component, and the second term is

from the shear component. In this study, testing beams had a span-depth ratio of 2.67.

Based on calculation, it was found that the shear component was about 3% of the flexural

component. It was, therefore, neglected for simplicity. Thus, Equation 5.11 becomes

)aL(IE

Pa

ecmid

22 4324

−=∆ in. (5.12)

125

ACI 440 recommends the following expressions to calculate the effective moment

of inertia Ie:

ge II = when cra MM ≤ ;

gcra

crgd

a

cre II

MMI

MMI ≤

⎥⎥⎦

⎢⎢⎣

⎡⎟⎟⎠

⎞⎜⎜⎝

⎛−+⎟⎟

⎞⎜⎜⎝

⎛=

33

1β when cra MM > (5.13)

where ⎥⎦

⎤⎢⎣

⎡+= 1

s

fbd E

Eαβ , and ACI 440 recommends taking the value of 50.b =α for all the

FRP bar type. (5.14)

As shown in Figures 5.10 to 5.12, ACI 440 equations predict the moment-

deflection response fairly well, especially at the service stage. Thus, the equations

recommended by the current ACI 440 would be used for the design purpose for both

plain concrete beams and FRC beams.

A more refined analysis was also conducted to compare the theoretical and

experimental results. The theoretical moment-deflection curves were obtained based on

the double integration of a theoretical moment-curvature relationship, in which the

Thorenfeldt model was used to represent the stress-strain relationship of the concrete, as

shown in the following equation:

' '

'

( / )1 ( / )

c c cc nk

c c

n ffn

ε εε ε

=− +

(5.15)

Based on the information provided by Collins and Mitchell (1991), n = 2.6, k =

1.16, 001980.'c =ε was adopted in this study when the concrete strength is equal to 4,400

psi in the Thorenfeldt model. The above coefficients were derived based on experimental

study on normal-weight concrete. Because the concrete in this study was also normal-

126

weight concrete, it is assumed that the above predictions can reasonably predict the

stress-strain relationship of the concrete used in this study. The implementation of the

double integration of the theoretical moment-curvature relationship was based on the

conjugate beam method. The analytical curve was interrupted at εc = 0.0045. As shown in

Figure 5.10 to 5.12, the theoretical curves show good match with the experimental results.

5.2.3. Relative Slip between Longitudinal Rebar and Concrete at Ends. No

relative slip was observed for any test specimens during the test program. That means

that the development lengths as designed based on the previous bond study (Belarbi and

Wang, 2005) were adequate for the FRP bars to develop the required forces.

5.2.4. Loading/Unloading Effect on the Flexural Behaviors. No significant

differences were observed before and after loading and unloading cycles in the crack

width, crack distribution, and deflection. Also, the flexural stiffness did not change after

cyclic loading, as shown in Figures 5.13 to 5.14.

5.2.5. Strains in Reinforcement and Concrete. Figures 5.15 to 5.17 present the

measured mid-span strains in reinforcement and in concrete versus the applied moment.

It can be seen that after cracking, the strains in the reinforcement increased almost

linearly up to failure. Because all test beams failed in concrete crushing rather than FRP

reinforcement rupture, the maximum measured strains in the reinforcement were less than

the ultimate tensile strains. In beams reinforced with #4 CFRP, #4 GFRP, and #8 GFRP,

the maximum measured strains were 12,000; 12,000; and 8,000 microstrains, respectively;

while the ultimate strains were 16,700; 16,900; and 13,500 microstrains, respectively.

The differences of the moment-strain curves between the plain concrete beams

and the FRC beams were significant. In the plain concrete beams, once reaching the

127

0

5

10

15

20

25

30

35

40

45

0 5 10 15 20 25 30 35 40Deflection (mm)

Mom

ent (

kN.m

)

0

50

100

150

200

250

300

350

0 0.2 0.4 0.6 0.8 1 1.2 1.4Deflection (in.)

Mom

ent (

ips-

in.)

VF8G-2

VF8G-1

Figure 5.13. Typical Loading/unloading Cycle’s Effect on FRC Beams

0

5

10

15

20

25

30

35

40

45

0 5 10 15 20 25Deflection (mm)

Mom

ent (

kN.m

)

0

50

100

150

200

250

300

350

0 0.1 0.2 0.3 0.4 0.5 0.6 0.7 0.8 0.9 1Deflection (in.)

Mom

ent (

kips

-in.).

VP8G-1

VP8G-2

Figure 5.14. Typical Loading/unloading Cycle’s Effect on Plain Concrete Beams

128

0

5

10

15

20

25

30

35

40

45

50

55

-9000 -6000 -3000 0 3000 6000 9000 12000Strain (×10^-6 mm/mm)

Mom

ent (

kN.m

)

0

50

100

150

200

250

300

350

400

450

Mom

ent (

kips

-in.)

VP4C

VF4C

VF4C

VP4C

Figure 5.15. Typical Strain Distributions of #4 CFRP Beams

0

5

10

15

20

25

30

35

40

45

50

-9000 -6000 -3000 0 3000 6000 9000 12000 15000Strain, (×10^-6 mm/mm)

Mom

ent (

kN.m

)

0

50

100

150

200

250

300

350

400

Mom

ent (

kips

-in.)

VP4G

VF4GVF4G

VP4G

Figure 5.16. Typical Strain Distributions of #4 GFRP Beams

Reinforcement Concrete

Reinforcement Concrete

129

0

5

10

15

20

25

30

35

40

45

50

55

-9000 -6000 -3000 0 3000 6000 9000 12000Strain (×10^-6 mm/mm)

Mom

ent (

kN.m

)

0

50

100

150

200

250

300

350

400

450

Mom

ent (

kips

-in)

VP8G

VF8G

VF8G

VP8G

Figure 5.17. Typical Strain Distributions of #8 GFRP Beams

ultimate, concrete failed by crushing, and strains in the reinforcement dropped suddenly.

However, in the FRC beams, when beams reached the ultimate, concrete was held

together and the strains in the concrete and strains in the reinforcement kept increasing

gradually. Furthermore, with the addition of fibers, the ultimate strain for the concrete

was increased. In plain concrete beams, the measured ultimate concrete strains ranged

from 2,700 microstrains to 3,300 microstrains with an average of 2,950 microstrains. In

the FRC beams, the measured ultimate concrete strains ranged from 4,000 microstrains to

5,000 microstrains with an average of 4,500 microstrains.

Reinforcement Concrete

130

5.3. PREDICTIONS OF THE ULTIMATE FLEXURAL CAPACITY

As shown in Table 3.5, the reinforcing ratio, ρf, for all the beams were greater

than the balanced ratio, ρbf, which is defined as follows:

⎟⎟⎠

⎞⎜⎜⎝

+⎟⎟⎠

⎞⎜⎜⎝

⎛=

fucu

cu

fu

'c

bf ff

εεε

βαρ 11 (5.15)

where εcu=0.003 as defined by ACI 318-02.

As expected, all the beams failed in concrete crushing. Figure 5.18 shows the

typical failure mode.

Figure 5.18. Typical Failure Mode

Predictions by the ACI 440 equations were based on the following assumptions:

(1) Plane sections remain plane; that is, the concrete and the reinforcement strain

values are proportional to their distance from the neutral axis.

(2) The tensile strength of the concrete is ignored.

(3) A parabolic stress distribution in the concrete was utilized, and the stress block

factors, α1 and β1, as defined in ACI 318, were adopted.

131

(4) The ultimate concrete compressive strain εcu is 0.003. εcu =0.0035 were also

computed for comparison in this study.

(5) There is perfect bond between the reinforcement and the concrete.

ACI 440 recommends the following equations to predict the flexural strength:

25901 bdf

f.fM '

c

ffffn ⎟

⎟⎠

⎞⎜⎜⎝

⎛−=

ρρ kips-in. (5.16)

( )fucufcuf

f

ccuff fEE

fEf ≤

⎟⎟⎟

⎜⎜⎜

⎛−+= εε

ρβε

5.085.0

4

'1

2

psi (5.17)

There are two possible ways by which fibers can increase the flexural strength:

one is that the fibers function as auxiliary reinforcement to carry some tensile stresses;

the other way is that the fibers can improve the concrete properties. In this study,

contribution of fibers in tensile strength was neglected since

(1) Compared to the steel fibers, the tensile strength of polypropylene fibers is low:

less than 1/3 of the tensile strength of the steel fibers.

(2) Due to the low elastic modulus of polypropylene fiber (500 to 700 ksi), the

elongation at break is three orders of magnitude greater than the tensile strain at

failure of the concrete. Hence, the concrete will crack long before the fiber

strength is approached.

Thus, the most likely contribution from the fibers to increase the flexural strength

is to improve the concrete properties. As shown in Figure 5.19, ultimate concrete strain

measured for FRC beams in this study is larger than the value recommended by ACI. In

this study, a value of 0.0035 is used. As shown in Table 5.5, the theoretical predictions

agree well with the test results. As discussed earlier, the concrete strains of the FRC

132

beams at failure were greater than 0.0035. For the design of the FRC beams, it is

suggested that εcu to be equal to 0.0035, with a comparable safety factor of εcu = 0.003 for

the plain concrete beams.

Figure 5.19. Comparison of Ultimate Strain of Concrete of ACI Value and Test Results in this Study (Courtesy of Park and Paulay)

Note: × is the values of FRC measured in this study; + is the values of plain concrete measured in this study.

5.4. DUCTILITY EVALUATION

As mentioned earlier, since the traditional definition of ductility can not be

applied to the structures reinforced with FRP reinforcement, there is a need for

developing a new approach and a set of ductility indices to both quantitatively and

qualitatively evaluate the FRP reinforced members.

Value used in this study

133

Table 5.5. Predictions of Ultimate Capacities

Specimen I.D.

Mexp. (kips-in.)

MACI (kips-in)

εcu =0.003 .exp

ACIMM

M*ACI

(kips-in.) εcu =0.0035 .exp

ACI*

MM

VP4C 450 355 0.79 377 0.84 VP4G 413 367 0.89 388 0.94 VP8G 449 401 0.89 423 0.94

Average 0.86 0.91 VF4C 402 290 0.72 306 0.76 VF4G 356 298 0.84 314 0.88 VF8G 366 322 0.88 338 0.92

Average 0.81 0.86 Note: MACI and M*

ACI is the prediction of moment capacity based on ACI equations. And the ultimate strain assumed to be 0.003 for MACI and 0.0035 for M*

ACI, respectively; The calculations of ductility index related to the FRP reinforced members have

been widely studied. Two approaches have been in the literature proposed to address this

problem.

5.4.1. Energy Based Approach. Based on the definition of the energy based

approach, ductility can be defined ability to absorb the energy and can be expressed as

the ratio between the total energy and the elastic energy, as shown in Figure 5.20.

Naaman and Jeong (1995) proposed the following equation to compute the

ductility index, µE:

⎟⎟⎠

⎞⎜⎜⎝

⎛+= 1

21

e

tE E

Eµ kips-in. (5.18)

where Et is the total energy computed as the area under the load deflection curve; and Ee

is the elastic energy. The elastic energy can be computed as the area of the triangle

formed at failure load by the line having the weighted average slope of the two initial

straight lines of the load deflection curve, as shown in Figure 5.20.

134

S2

S1

S= [P1S1+(P2-P1)S2)]/P2P1

S

P2

Pfailure

Load

Deflection

Elastic Energy (Ee)

Figure 5.20. New Definition of Ductility Index (Naaman and Jeong, 1995)

5.4.2. Deformation Based Approach. The deformation based approach was first

introduced by Jaeger et al. (1995). It takes into account the strength effect as well as the

deflection (or curvature) effect on the ductility. Both the strength factor Cs and the

deflection factor Cd (or curvature factor Cc) are defined as the ratio of moment or

deflection (or curvature) values at ultimate to the values corresponding to the concrete

compressive strain of 0.001. The strain of 0.001 is considered the beginning of inelastic

deformation of concrete.

dsE CC ×=µ or csE CC ×=µ (5.19)

0.001

us M

M C

==

ε (5.20)

0.001

ud

C

=∆∆

(5.21)

0.001

uc

C

==

εψψ (5.22)

135

Thus, the ductility is reflected by its deformability margin between the ultimate

stage and the service stage.

In the following sections, ductility indices based on both approaches, that is

deformation based approach and energy based approach, are computed and compared.

5.4.3. Ductility Index Computed by the Energy Based Method. As shown in

Figure 5.20, the definition of elastic slope is dependent on the selections of P1, P2, S1,

and S2. Also, the experimental moment-deflection curves, as shown in Figures 5.8 and

5.9, were hard to be idealized into three portions with three distinct slopes and it could

induce some subjective errors if the curves are artificially divided. In this study, the

elastic slopes were decided by the slopes of loading/unloading cycles during the tests

rather than using the theoretical predictions proposed by Naaman and Jerong (1994). The

ductility indices computed are shown in Table 5.6.

5.4.4. Ductility Index Computed by the Deformation Based Method.

Theriault and Benmokrane (1998) found that the ductility indices computed by the

curvature factor demonstrated more consistent in comparison to those computed by

deflection factor. Therefore, the curvature factor is adopted in this study. Figures 5.21 to

5.23 show the typical moment-curvature relationship of the testing beams. The ductility

indices are computed and shown in Table 5.7.

5.4.5. Ductility Index. As shown in Tables 5.6 and 5.7, the ductility indices

computed by the two methods are quite different. The effect from the addition of fibers

on the ductility indices is much more pronounced when calculated based on the Jaeger

method.

136

0

5

10

15

20

25

30

35

40

45

50

55

0 0.00002 0.00004 0.00006 0.00008 0.0001 0.00012Curvature (1/mm)

Mom

ent (

kN.m

)

0

50

100

150

200

250

300

350

400

450

0 0.0005 0.001 0.0015 0.002 0.0025 0.003Curvature (1/in.)

Mom

ent (

kips

-in.)VF4C

VP4C

Figure 5.21. Typical Moment Curvature Relationship for #4 CFRP Beams

0

5

10

15

20

25

30

35

40

45

50

0 0.00002 0.00004 0.00006 0.00008 0.0001 0.00012Curvature (1/mm)

Mom

ent (

kN.m

)

0

50

100

150

200

250

300

350

400

0 0.0005 0.001 0.0015 0.002 0.0025 0.003Curvature (1/in.)

Mom

ent (

kips

-in.)VF4G

VP4G

Figure 5.22. Typical Moment Curvature Relationship for #4 GFRP Beams

137

0

5

10

15

20

25

30

35

40

45

50

55

0 0.00002 0.00004 0.00006 0.00008 0.0001Curvature (1/mm)

Mom

ent (

kN.m

)

0

50

100

150

200

250

300

350

400

-0.0005 0 0.0005 0.001 0.0015 0.002 0.0025Curvature (1/in.)

Mom

ent (

kips

-in.)

VF8G

VP8G

Figure 5.23. Typical Moment Curvature Relationship for #8 GFRP Beams

Table 5.6. Ductility Index by Energy Based Method (Naaman and Jeong, 1995)

Specimen I.D. Et (kips-in.)

Ee (kips-in)

µE PlainE

FRCE

µµ

VP4C 27.83 14.58 1.45 1

VP4G 22.17 13.92 1.30 1

VP8G 23.00 12.00 1.46 1

VF4C 24.33 11.50 1.56 1.07

VF4G 22.08 11.33 1.48 1.14

VF8G 18.25 9.08 1.50 1.03

Average 1.08

138

Table 5.7. Ductility Index by Deformation Based Method (Jaeger, 1995)

Specimen I.D.

Mε=0.001 (kips-in.)

ψε=0.001 (1/in.)

Mu (kips-in.)

ψu (1/in.) µE PlainE

FRCE

µµ

VP4C 202 7.82×10⁻⁴ 450 19.46×10⁻⁴ 5.50 1

VP4G 177 6.66×10⁻⁴ 405 17.63×10⁻⁴ 6.05 1

VP8G 190 4.96×10⁻⁴ 449 14.73×10⁻⁴ 7.04 1

VF4C 163 6.15×10⁻⁴ 402 20.78×10⁻⁴ 8.35 1.52

VF4G 153 5.74×10⁻⁴ 356 22.10×10⁻⁴ 8.94 1.48

VF8G 157 4.45×10⁻⁴ 366 14.40×10⁻⁴ 7.56 1.08

Average 1.36

A schematic load-deflection curve for a certain material reinforced beam, as

shown in Figure 5.24, is created to explain the different results by the two methods. With

the addition of fibers, the load capacity and deflection are increased from P1 to P2 and ∆1

to ∆2 proportionally.

Although there are different ways to calculate the ductility index, ductility can be

defined as the ability to absorb the inelastic energy without losing its load capacity.

Higher inelastic energy absorption of the same system means higher ductility. Obviously,

from this standpoint, the addition of fibers significantly improves the system’s ductility.

However, based on the prediction of Naaman and Jerong’s ductility index, the ductility is

the same before and after the addition of fibers. Because the ratios of e

t

EE are the same, µE

is not changed. The reason is although the absorption of the inelastic energy with the

addition of fibers increases, the absorption of the elastic energy is also increased

139

P2

O ∆2∆1C1 B2C2B1

P1A1

A2

Elastic Energy (Ee)Lo

ad

Deflection

Figure 5.24. Schematic Load-Deflection Relationship

proportionally. Thus, the index µE remains constant in this example. From this standpoint,

the ductility index proposed by Naaman and Jerong cannot efficiently take into account

the benefits gained from the increase of the ultimate moment capacity and the

accompanying increase of the deflection with the addition of fibers. The ductility index

based on the Jaeger approach is more reasonable. It not only considers factors resulting

from the load capacity, but it also considers the deformation effect on the ductility. The

ductility increases approximately 40% with the addition of fibers, based on the Jaeger

approach. Also, all the ductility indices, as calculated by the Jaeger method, were found

to be above the lower limit of 4 recommended by Jaeger and the Canadian Highway

Bridge Design Code. Both the plain concrete beams and the FRC beams can, therefore,

be considered acceptable for design in terms of ductility requirement.

140

5.5. CONCLUDING REMARKS

A research program was initiated to investigate the feasibility of steel-free hybrid

reinforcement system for concrete bridge decks by combining FRP reinforcement with

the polypropylene fiber reinforced concrete. From the flexural study covered in this paper,

the following conclusions can be drawn:

• The deflection predicted by the current ACI 440 guidelines yield results

consistent with experimental results, especially at the service load stage, and

could be used for both the plain concrete beams and the FRC beams.

• The model proposed by Salib et al. (2004) yields reasonable predictions of the

crack width for both the plain concrete beams and the FRC beams. The

predictions by the ACI 440 were found to be conservative.

• The addition of fibers reduced the crack widths at the service load in the case of

FRC beams as compared to plain concrete beams.

• The compression concrete strain measured at the compression fiber of the FRC

beams was larger than that of the plain concrete beams. It ranged from 4,000

microstrains to 5,500 microstrains, with an average of 4,500 microstrains for the

FRC beams, while concrete strains, ranging from 2,700 microstrains to 3,300

microstrains, with an average of 2,950 microstrains, were measured for the plain

concrete beams.

• With the addition of polypropylene fibers, the ductility indices increased by

approximately 40% based on deformation based approach, which takes into

account the strength effect as well as the deflection (or curvature) effect on

determining the ductility. In addition, both plain concrete beams and FRC beams

141

provided an adequate deformability level, as described by Jaeger. Moreover, FRC

made it slightly more ductile, based on the new definition of ductility for the FRP

reinforced beam.

142

6. ACCELERATED DURABILITY TEST RESULTS

6.1. INTRODUCTION

Many studies have been carried out on the durability of individual FRP

components, but literature concerning durability of the FRP and the concrete as a system,

in terms of durability of bond and durability of flexural behavior, is sparse. The durability

mechanism depends more on the inter-relation between the materials than on an

individual component’s property. In addition, the mechanical properties of a hybrid

material system may deteriorate much faster than that suggested by the property

degradation rates of the individual components making up the hybrid system (Schutte,

1994). The FRP/FRC hybrid system is a novel approach, and research on the durability

characteristics of this hybrid system is paucity with limited information in open literature.

Thus, accelerated durability tests on the FRP/FRC system are necessary.

Limited research has been conducted on the durability characteristics of the FRP

and the plain concrete system, in terms of the bond and the flexural behavior after being

subjected to the long-term environmental conditioning. Katz et al. (1999) observed a

reduction of 80 to 90% in the bond strength as the temperature increased from 680F to

4820F. In addition, a reduction of the bond stiffness was observed as the temperature

increased. Mashima and Iwamoto (1993) noted that the bond strengths for both glass and

carbon FRP seemed not to be reduced up to 300 cycles of freezing-and-thawing. Bank et

al. (1998) studied the bond degradation by submerging the specimens that were made of

different types of FRP rebars in tap water at 176 0F for up to 84 days. They found a good

relation between material degradation and the bond degradation. Al-Dulaijan et al. (2001)

143

investigated the effect of the environmental pre-conditioning on the bond of the FRP

reinforcement to concrete. The FRP rebars were exposed to three types of solution,

ammonia, acetic acid, and water at 176 0F for 28 days, before the rebars were embedded

into concrete. They reported that the lugged rods had significantly reduced bond strength

due to the degradation of the resin or the fiber/resin interface. On the other hand, little

difference was observed for the smooth rods.

As for the durability of beam tests as a system, very limited information was

found in the published literature. Laoubi et al. (2002) observed that the change in the

overall behavior, in terms of deflection, ultimate capacity, and mode of failure, for the

tested beams (both under-reinforced and over-reinforced) after 200 freezing-and-thawing

cycles was insignificant. Approximately 10% reduction in the ultimate strength was

observed by Tannous and Saadatmanesh (1998) in their tests of under-reinforced beams

submerged in de-icing solutions for two years. Sen et al. (1993, 1999) investigated FRP

pretensioned beams under tidal/thermal cycles. They found that fiberglass strands were

unsuitable for pretensioning application in a marine environment. The CFRP beams

showed good durability, although degradation in both bond and flexural strength was

observed.

Based on the limited information discussed above, it is still not clear whether the

bond or flexural behavior degrades, or to what extent, after being subjected to various

environmental agents. Furthermore, most of the studies mentioned previously on the FRP

and concrete system concentrate on certain specific applications and do not reflect the

environmental conditions to which bridge decks would be subjected in the US Mid-West

region, where bridge decks are oftentimes subjected to freezing-and-thawing cycles while

144

exposed to de-icing salts. Therefore, further study is needed to investigate the durability

characteristics of the whole system.

6.2. PROBLEM STATEMENT

Composite materials, as well as the whole reinforcing system, will degrade by the

attack from various environmental agents. The environmental agents that have potential

effects on the long-term structural behaviors of this FRP/FRC hybrid system are

discussed as follows:

• Thermal Effect

The thermal parameters of steel reinforcement and concrete are very close, as

shown in Table 6.1. Thus, there is little or no interaction between the steel rebar and

concrete due to the thermal effect on RC structure. Unlike the traditional RC structures,

the CTE (coefficient of thermal expansion) between fibers and concrete is different.

Furthermore, the resin materials used to bind the fibers have very large CTE in

comparison to concrete. A significant interaction can occur with the temperature variation,

which may affect the interactive properties between the two materials. To study the

thermal effect on the FRP/FRC system, temperatures were varied from -4 oF to 140 oF in

this study to investigate the thermal effect on the system.

• Freezing-and-Thawing Effect

An serious environmental threat to bridge structures with a poor quality of

concrete is the freezing-and-thawing cycles. Research (ACI 201.2R-92) shows that cycles

of freezing-and-thawing will damage the concrete and the damage is greatly accelerated

by the use of deicing salts. Concrete is a permeable material. In addition, cracks usually

145

Table 6.1. Coefficient of Thermal Expansion of Various Materials (Balazs and Borosnyoi, 2001)

Coefficient of thermal expansion *10-6 1/K Material Longitudinal transverse

Carbon fiber Aramid fiber Glass fiber

-0.9 to +0.7 -6.0 to -2.0

5 to 15

8 to 18 55 to 60 5 to 15

Resin 60 to 140 CFRP AFRP GFRP

-0.5 to 1.0 -2.0 to -1.0

7 to 12

20 to 40 60 to 80 9 to 20

Steel 12 Concrete 6 to13

exist throughout the service life of RC structures. Water or de-icing salt water could

potentially reach the interface between the rebars and concrete. Therefore, accumulated

damages may occur to the concrete and the FRP rebars as well as the interface by the

repeated freezing-and-thawing cycles. The structural behaviors will thus be adversely

affected. The effect of the freezing-and-thawing cycle on the hybrid system was

examined in this study.

• Ultraviolet Radiation

Polymeric materials can absorb the ultraviolet and, therefore, are susceptible to

reactions initiated by the absorption of ultraviolet energy. Generally, the effects of UV

exposure are confined to the top few microns of the surface. Thus, the degradation from

UV exposure may be a concern for the external application of FRP materials. However,

test results indicated that the mechanical properties of the FRP rebars were not

significantly affected even by direct exposure to the UV radiation (Tannous and

146

Saadatmanesh, 1998). For the application of FRP material in this project, FRP rebars

were protected by concrete cover. Therefore, the degradation caused by UV radiation was

expected to be negligible and was not investigated in this study.

• De-icing Salt Solution

De-icing salt used in cold climates, and associated chloride penetration, is a major

cause of corrosion in steel reinforced highway structures. It may also affect the strength

of the FRP materials. More than 20% tensile strength reduction was observed for E-glass/

vinylester immersed in de-icing salt solution for 180 days (Tannous and Saadatmanesh,

1998). As discussed previously, damage caused by the freezing-and-thawing cycles will

be aggravated by the use of salt solution. The effect of a de-icing solution on this new

hybrid system was simulated and investigated in this study.

• Humidity Effect

FRP rods are not waterproof. Moisture can diffuse into resin, leading to changes

in mechanical characteristics as well as in physical appearance (increase of volume). As a

consequence, the overall performance of the FRP/FRC hybrid system may be altered.

Since the specimens in this study were in contact with salt water, the humidity effect on

the FRP/FRC system was not investigated separately.

• Alkaline Effect

When in contact with alkaline media, FRP material will degrade due to the

chemical reaction with an alkaline solution. For this hybrid FRP/FRC system, FRP rods

were embedded in concrete, which is known to have a pH level as high as 13.5. This

alkaline environment can damage glass fibers through the loss of toughness and strength.

Several studies have been conducted out on the effect of alkaline on the FRP material.

147

However, in most of these studies, FRP rods were directly immersed into an alkaline

solution to simulate the FRP rods in concrete, and significant degradation for GFRP

rebars was reported (Uomoto and Nishimura, 1999). Direct immersion into an alkaline

solution was thought to be much more severe than real conditions. Some researchers

(Sekijima et al., 1999) conducted durability test in which prestressed concrete beams

reinforced with GFRP grids were exposed outdoors for 7 years, where the annual average

temperature was 60oF, and the annual precipitation amounted to 58 in.; an extremely

small effect was observed. A similar observation was made by Tannous and

Saadatmanesh (1998). Most likely, it is the mobility of the alkaline ions that greatly

affects the test results. To accelerate the possible degradation effect from alkaline while

not exaggerating it, FRP rods were embedded in concrete and the specimens were kept

moist in this study.

In this study, a total of 36 bond specimens and 24 beam specimens were

fabricated to study the effect of various environmental agents on the durability of the

FRP/FRC system. To simulate the seasonal weather changes in the mid-west region of

the US, specimens were subjected to combined environmental cycles, consisting of the

freezing-and-thawing cycles and the high temperature cycles, while in contact with a salt

solution. Then, bond behaviors and flexural beam behaviors were compared with

unweathered specimens to investigate the durability of this new hybrid system.

6.3. TEST RESULTS AND DISCUSSIONS

6.3.1. Durability Effect on Bond. In the following sections, the environmental

conditioning’s effect on the specimen conditions and the bond behaviors are discussed.

148

Differences of the bond performances between the plain concrete specimens and the FRC

specimens after being subjected to the environmental conditioning are also presented.

6.3.1.1. Appearance of specimen after environmental conditioning. After the

environmental conditioning, the specimen conditions were changed.

• Plain Concrete Specimens

In addition to concrete scaling on the surface, most specimens also showed some

damage on the concrete, especially at the corner areas. One DP4C specimen and one

DP4G specimen were severely damaged and large portions of concrete were broken apart,

as shown in Figure 6.1.

(a) #4 GFRP

Figure 6.1. Different in Appearance of Plain Concrete Specimen and FRC Specimen after Environmental Conditioning

Plain ConcreteFRC

149

(b) #4 CFRP

Figure 6.1. Different in Appearance of Plain Concrete Specimen and FRC Specimen after Environmental Conditioning (Cont.)

• FRC Specimens

Damages were limited to the surfaces of the specimens. With the scaling of

concrete at the surfaces, fibers could clearly be observed. However, all FRC specimens

remained integrated, as shown in Figure 6.1. In comparison to plain concrete specimens,

the FRC specimens were more immune to the attack of the environmental conditioning.

6.3.1.2. Environmental conditioning effect on bond behaviors. The test results

are summarized in Table 6.2. The bond-slip responses at the loaded end and the free end

are shown in Figures 6.2 to 6.13. Herein, the average bond strength was calculated as the

pullout force over the embedded area of the rebar. The slip on the side of loading was

calculated as the value of LVDT2 minus the elastic deformation of the FRP rebar

between the bond zone and the location of LVDT2. Again, the deformation of the steel

frame is ignored.

Plain ConcreteFRC

150

Table 6.2 Test Results of Durability Bond Tests

I.D. Bond

Strength (psi)

Loaded –End Slip (in.)

Design Bond Strength

(psi)

Bond Stiffness (ksi/in.)

Mode+

1,269 0.03 1,273 637 P 1,299 0.04 843 421 P VP4

C 1,198

1,255 0.04

0.04 1123

1,080561

540 P

2,437 0.22 1034 517 S 3,001 0.27 1706 853 S VP4

G

2,699 2,712

0.29 0.26

1226 1,322

613 661

S 2,759 0.34 1252 626 S 2,538 0.34 1288 644 S VP8

G

2,748 2,682

0.32 0.33

1156 1,232

578 616

S 947 0.13 692 346 S 805 0.06 782 391 P DP4

C 1,157

970 0.05

0.08 964

813 482

406 S

342 0.12 154 77 S 1,803 0.15 1124 562 S DP4

G 1,400

1,185 0.13

0.13 967

748 484

374 S

2,598 0.50 935 468 S 2,467 0.43 1162 581 S DP8

G 2,689

2,585 0.45

0.46 1207

1,101603

551 S

1,243 0.04 1223 611 P 930 0.04 922 461 P VF4

C 933

1,035 0.03

0.04 933

1,026466

513 P

2,335 0.36 1716 858 S 2,212 0.53 1139 569 P VF4

G 2,508

2,352 0.32

0.40 1025

1,293513

647 S

1,768 0.57 795 397 P 1,869 0.52 1036 518 P VF8

G 2,103

1,916 0.49

0.53 1047

959 524

480 P

979 0.06 888 444 P 847 0.06 728 364 P DF4

C 1,130

985 0.07

0.06 1101

906 550

453 P

2,161 0.49 901 450 S 2,012 0.37 967 484 S DF4

G 1,843

2,005 0.54

0.47 1375

1,081687

540 P

1,835 0.85 876 438 P 1,914 0.80 998 499 S DF8

G 2,064

1,938 0.90

0.85 963

946 482

473 P

Note: +P=Pullout failure; S=Splitting failure;

151

0

0.2

0.4

0.6

0.8

1

1.2

1.4

0 5 10 15 20 25 30 35 40Slip (mm)

u√f`

c(M

Pa/√

MPa

)

0

2

4

6

8

10

12

14

16

0 0.2 0.4 0.6 0.8 1 1.2 1.4Slip (in.)

u√f`

c(ps

i/√ps

i)

VP4CDP4C

Figure 6.2. Loaded-end Bond-Slip Relationship for #4 CFRP Plain Concrete Specimens

0

0.3

0.6

0.9

1.2

1.5

0 5 10 15 20 25 30 35 40 45Slip (mm)

u√f`

c(M

Pa/√

MPa

)

0

2

4

6

8

10

12

14

16

180 0.2 0.4 0.6 0.8 1 1.2 1.4 1.6

Slip (in.)

u√f`

c(ps

i/√ps

i)

VF4CDF4C

Figure 6.3. Loaded-end Bond-Slip Relationship for #4 CFRP FRC Specimens

152

0

0.5

1

1.5

2

2.5

3

3.5

0 2 4 6 8 10Slip (mm)

u√f`

c(M

Pa/√

MPa

)

0

4

8

12

16

20

24

28

32

36

40

0 0.05 0.1 0.15 0.2 0.25 0.3 0.35Slip (in.)

u√f`

c(ps

i/√ps

i)

VP4G

DP4G

Figure 6.4. Loaded-end Bond-Slip Relationship for #4 GFRP

Plain Concrete Specimens

0

0.5

1

1.5

2

2.5

3

0 5 10 15 20 25Slip (mm)

u√f`

c(M

Pa/√

MPa

)

0

4

8

12

16

20

24

28

32

360 0.1 0.2 0.3 0.4 0.5 0.6 0.7 0.8 0.9 1

Slip (in.)

u√f`

c(ps

i/√ps

i)

VF4GDF4G

Figure 6.5. Loaded-end Bond-Slip Relationship for #4 GFRP FRC Specimens

153

0

0.5

1

1.5

2

2.5

3

0 3 6 9 12 15Slip (mm)

u√f`

c(M

Pa/√

MPa

)

0

4

8

12

16

20

24

28

32

360 0.05 0.1 0.15 0.2 0.25 0.3 0.35 0.4 0.45 0.5 0.55

Slip (in.)

u√f`

c(ps

i/√ps

i)

VP8GDP8G

Figure 6.6. Loaded-end Bond-Slip Relationship for #8 GFRP

Plain Concrete Specimens

0

0.5

1

1.5

2

2.5

0 5 10 15 20 25 30 35 40Slip (mm)

u√f`

c(M

Pa/√

MPa

)

0

5

10

15

20

25

300 0.2 0.4 0.6 0.8 1 1.2 1.4

Slip (in.)

u√f`

c(ps

i/√ps

i)

VF8GDF8G

Figure 6.7. Loaded-end Bond-Slip Relationship for #8 GFRP FRC Specimens

154

0

0.2

0.4

0.6

0.8

1

1.2

1.4

0 5 10 15 20Slip (mm)

u√f`

c(M

Pa/√

MPa

)

0

2

4

6

8

10

12

14

16

0 0.1 0.2 0.3 0.4 0.5 0.6 0.7Slip (in.)

u√f`

c(ps

i/√ps

i)

VP4CDP4C

Figure 6.8. Free-end Bond-Slip Relationship for #4 CFRP Plain Concrete Specimens

0

0.2

0.4

0.6

0.8

1

1.2

1.4

0 2 4 6 8 10 12 14 16 18 20Slip (mm)

u√f`

c(M

Pa/√

MPa

)

0

2

4

6

8

10

12

14

16

180 0.1 0.2 0.3 0.4 0.5 0.6 0.7

Slip (in.)

u√f`

c(ps

i/√ps

i)

VF4CDF4C

Figure 6.9. Free-end Bond-Slip Relationship for #4 CFRP FRC Specimens

155

0

0.5

1

1.5

2

2.5

3

3.5

0 0.5 1 1.5 2 2.5Slip (mm)

u√f`

c(M

Pa/√

MPa

)

0

4

8

12

16

20

24

28

32

36

40

0 0.02 0.04 0.06 0.08 0.1Slip (in.)

u√f`

c(ps

i/√ps

i)

VP4GDP4G

Figure 6.10. Free-end Bond-Slip Relationship for #4 GFRP

Plain Concrete Specimens

0

0.5

1

1.5

2

2.5

3

0 2 4 6 8 10 12Sip (mm)

u√f`

c(M

Pa/√

MPa

)

0

4

8

12

16

20

24

28

32

360 0.05 0.1 0.15 0.2 0.25 0.3 0.35 0.4 0.45

Slip (in.)

u√f`

c(ps

i/√ps

i)

VF4GDF4C

Figure 6.11. Free-end Bond-Slip Relationship for #4 GFRP FRC Specimens

156

0

0.5

1

1.5

2

2.5

3

0 0.5 1 1.5 2SLip (mm)

u√f`

c(M

Pa/√

MPa

)

0

5

10

15

20

25

30

350 0.01 0.02 0.03 0.04 0.05 0.06 0.07 0.08

Slip (in.)

u√f`

c(ps

i/√ps

i)

VP8GDP8G

Figure 6.12. Free-end Bond-Slip Relationship for #8 GFRP

Plain Concrete Specimens

0

0.5

1

1.5

2

2.5

0 2 4 6 8 10 12Slip (mm)

u√f`

c(M

Pa/√

MPa

)

0

5

10

15

20

25

300 0.05 0.1 0.15 0.2 0.25 0.3 0.35 0.4 0.45

Slip (in.)

u√f`

c(ps

i/√ps

i)

VF8GDF8G

Concrete Splitting

Figure 6.13. Free-end Bond-Slip Relationship for #8 GFRP FRC Specimens

157

6.3.1.2.1. Plain concrete specimens. As shown in Figures 6.2 to 6.13, in

comparison to the unweathered specimens, the bond-slip response was significantly

altered after being subjected to the environmental conditioning.

• Bond-Slip Response

Unweathered specimens showed fairly consistent test results with the same testing

parameters. However, test results for specimens after being subjected to environmental

conditioning were inconsistent. The inconsistent behavior may be due to the random

nature of the development of the degradation (Bank et al., 1998). Different levels of

damage on the specimens were observed visually. In general, specimens with more

severely damaged concrete showed lower bond strength. In other words, the bond

strength was strongly dependent on the condition of the concrete. Figure 6.1 showed the

most severely damaged specimens (DP4C and DP4G). These specimens had large

amounts of concrete broken apart and thus showed very low bond strengths.

After specimens had been subjected to the environmental conditions have their

bond-slip curves softened. The slopes of the pre-peak curves were decreased and the

shapes of the curves were even changed in some specimens. As discussed in Chapter 4,

bond between the CFRP rebar and the concrete initially consisted of chemical adhesion

and friction. With the increase of the relative slip between the rebar and the concrete,

chemical adhesion was broken and the pullout load was then resisted by friction force

only. Therefore, two peak bond strengths have been observed. One occurred when the

chemical bond reached its ultimate; the other occurred when the friction force reached its

maximum. As shown in Figure 6.3, only one peak was observed in one DP4C specimen

158

after environmental conditioning, which may be due to the serious damage to the

chemical bond.

• Failure Modes

Most of the specimens had the same failure modes as the unweathered specimens.

However, the failure modes were changed in the DP4C specimens. All three unweathered

specimens, VP4C, failed in the rebar pullout. However, two of the three DP4C specimens

failed in concrete splitting; the other one failed in rebar pullout. This was caused by the

damage of concrete. Some portions of the concrete were broken apart; thus a smaller

amount of concrete could resist the splitting force caused by the rebar.

• Ultimate Bond Strength

Ultimate bond strengths of all the specimens were reduced and this effect was

more significant in specimens with small dimensions (#4 rebar specimens). As shown in

Figure 6.14, 23%, 56 %, and 4% reductions were observed in ultimate bond strength for

DP4C, DP4G, and DP8G specimens, respectively.

• Bond Stiffness

Because the bond stiffness gives a relationship between load and deformation, this

value has an important effect on the width of flexural cracks in reinforced concrete and

on the deflection of beams and slab (Katz, et al., 1999). Its value can be computed by the

slope of the bond-slip curve at the loaded end or at the free end. As mentioned previously,

after being subjected to environmental conditioning, the surfaces of most of the

specimens were severely damaged. Some amounts of concrete at the surface were broken

apart. Concrete may have become less compacted than before. During the pullout bond

tests, the concrete at the loaded end was under compression, and the loose concrete would

159

-10

0

10

20

30

40

50

60

#4 CFRP #4 GFRP #8 GFRP

% R

educ

tion

of U

ltim

ate

Bon

d St

reng

th

Plain Concrete FRC

Figure 6.14. Reductions in Ultimate Bond Strength

be compacted. Thus, the measured loaded end slip would be enlarged. However, the slip

measured from the free-end slip did not have this influence. As shown in Figures 6.2 to

6.13, the slopes of the curves at the free end did not show as much reduction as those at

the loaded end. Thus, the bond stiffness in this research was computed by the slope of the

bond-slip curve at the free end. On the other hand, bond behavior at the service stage is of

more significance since bond failure rarely controls the design of the structural members.

It is more related to the serviceability. In this study, bond stiffness is defined as the slope

of the secant modulus corresponding to the slip of 0.002 in. at the free end. The value of

0.002 in. was used because this value is often selected as the criteria for the design

strength of bond. Some more explanation can be found in the later paragraphs.

As shown in Figure 6.15, 25%, 43%, and 11% reductions were observed in the

bond stiffness for DP4C, DP4G, and DP8G specimens, respectively.

160

0

10

20

30

40

50

#4 CFRP #4 GFRP #8 GFRP

% R

educ

tion

of D

esig

n B

ond

Stre

ngth

or B

ond

Stiff

ness

Plain Concrete FRC

Figure 6.15. Reductions in Design Bond Strength or Bond Stiffness • Design Bond Strength

The application of the ultimate bond strength data to real design is not appropriate

because of the excessive slip occurring in these specimens at large loads. Too much slip

will result in untolerated crack width. From a designer’s point of view, Mathey and

Watstein (1961) suggested that bond stress corresponding to 0.01 in. slippage of loaded

end or 0.002 in. of free end for steel reinforced structures can be defined as the critical

bond stress. The criterion of 0.01 in. slippage at the loaded-end was decided based on half

of the crack width limitation (Mathey and Watstein, 1961). Ferguson et al. (1966) pointed

out that the loaded-end slip of the pullout specimens was larger than that of the beam

specimens because flexural cracks in beam specimens tended to distribute the slip in

several places along the beam. Also, since there is relatively low elastic modulus of FRP

161

materials (GFRP is about 1/5 that of steel, CFRP is about 2/3 that of steel), greater

elongation along the embedded rebar will be produced and will lead to a larger loaded-

end slip. Thus, 0.01 in. slippage at the loaded-end of the pullout specimens as design

criterion is not appropriate. To keep it comparable to limits imposed on the steel rebar,

bond strength corresponding to 0.002 in. slippage at the free-end was adopted as the

designing bond strength.

Based on the definition of the bond stiffness and the design bond strength in this

study, the reduction rates of the design bond strengths were the same as those of the bond

stiffness.

6.3.1.2.2. FRC specimens. In the following sections, test results regarding the

FRC specimens are presented.

• Bond-Slip Response

In general, the test results of the FRC specimens showed good consistency. The

behavior of the specimens in the same testing group was similar. Like the plain concrete

specimens, all the bond-slip curves were softened after being subjected to the

environmental cycles.

• Failure Modes

Like the plain concrete specimens, most of the FRC specimens had the same

failure modes as the unweathered specimens. However, the failure mode of one of the

three DF8G specimens was changed from rebar pullout to concrete splitting.

• Ultimate Bond Strength

Reductions of the bond strength in the FRC specimens were observed as in the

plain concrete specimens. As shown in Figure 6.14, 5%, 15%, and -1% reductions were

162

observed in the ultimate bond strength for DF4C, DF4G, and DF8G specimens,

respectively.

• Bond Stiffness

Like the plain concrete specimens, reductions of the bond stiffness were observed

in the FRC specimens. As shown in Figure 6.15, 12%, 16%, and 1% reductions were

observed in the bond stiffness for DF4C, DF4G, and DF8G specimens, respectively.

• Design Bond Strength

The reduction rates of design bond strength were the same as the rates of the bond

stiffness, which are 12%, 16%, and 1% for DF4C, DF4G, and DF8G specimens,

respectively.

6.3.1.3. Discussions on the durability effect on bond. After being subjected to

the environmental conditioning, both the plain concrete specimens and the FRC

specimens showed bond degradations. Bond is determined by the properties of its

constitutions (concrete and rebar) and the interaction between the constitutions. Three

possible reasons are provided to explain the bond degradation as follows:

1. Microvoids between the rebar and the concrete exist at the time of the

specimen fabrication; i.e., rebar is not in full contact with the concrete (Gylltoft, et al.,

1982). When specimens are submerged in the solution, the solution will permeate into the

interface between the rebar and concrete. Later, the microvoids will be filled with

solutions. The volume of water will expand about 10% when frozen. Microcracks will

thus be induced if the stresses, fc, are larger than the tensile strength of the concrete, f’t.

With the subsequent freezing-and-thawing cycles, damage will build up and more and

bigger microcracks will be created.

163

2. As shown in Table 6.1, the FRP rebar has a higher CTE than the concrete.

When the temperature increases, the expansion rate of the FRP rebar is larger than that of

the concrete. Radial busting force will be imposed on the concrete surface at the interface,

and the structure at the interface will be disrupted. When the stress in the concrete, fc, is

larger than the tensile strength, f’t, cracks will develop. When the temperature reduces, the

contraction rate of the FRP rebar is bigger than that of the concrete, micro-gaps will form

along the interface.

The above two mechanisms function together and degrade the bond mainly by

disturbing the structures at the interface. Bond degradation may also come from the

degradation of the rebar itself.

3. FRP rods are not waterproof. Moisture may diffuse into the polymer resin to a

certain degree (Micelli and Nanni, 2004). Studies also show that some deterioration of

the polymer resins may occur since water molecules can act as resin plasticizers, thereby

disputing van der Waals bonds in polymer chains (Bank and Gentry, 1995). Furthermore,

during the freezing-and-thawing cycles, water will expand and lead to the cracking of the

resin. Resin damage will speed up the process by which moisture is transported inside the

composite, thereby allowing the deteriorations to be accelerated. The surface area is most

vulnerable to be attacked; thus, the surface is expected to be the most seriously

deteriorated. Consequently, the rebar and concrete will not be contacted as tightly as

before. Bond thus is degraded.

All three mechanisms play a certain role in the bond degradation and the

combined effects are likely to be even more detrimental to the bond. As mentioned

previously, all specimens showed bond degradation to some extent after environmental

164

conditioning. However, the degradation magnitude differed among the different

specimens.

6.3.1.3.1. Specimen dimension effect on bond degradation. Compared to the

large (#8) specimens, the small specimens (#4) showed greater degradation effect. This

was so in both the plain concrete specimens and the FRC specimens. As shown in Figure

6.14, the ultimate bond strengths reduced 56% for DP4G specimens, while only 4%

reduction was observed in DP8G specimens. Similarly, the ultimate bond strengths

reduced 15% for DF4G specimens; while DF8G specimens showed 1% increase. In

design bond strength or bond stiffness, the small specimens also showed a much more

serious reduction, as shown in Figure 6.15. Specimen dimensions effect on the bond

durability can be explained by ways that the salt solution attacks the bond behavior.

There are two ways in which the salt solution can reach the interface between the rebar

and concrete, as shown in Figure 6.16. One is through the loaded-end of the specimens,

since the free-end was coated with water-proof epoxy, and it was assumed that no

solution can permeate the epoxy, as shown in Figure 6.16. The other way is through the

concrete cover, as shown in Figure 6.16. In the large specimens, there were relatively

smaller portions of the bonded area that could be immediately attacked by the solution. In

this study, the loaded end of the specimen was directly exposed to the solutions, and the

solutions could easily access the interface near the loaded end. Since the depth of the

specimen that was immediately accessible to the solution was independent of the size of

the specimens, the absolute depths that were affected were the same. On the other hand,

the bigger specimens had a bigger embedment length; thus, the ratio of affected area to

the whole bonded area was smaller in the case of the large specimens. Another reason

165

may be due to the larger cover depth of the large specimens. The #4 specimens had 2.5”

embedment length and dimensions of 5 in. × 5 in. × 5 in., which meant a 2.25 in. concrete

clear cover. The #8 specimens had 5” embedment length and dimensions of 10 in. × 10 in.

× 10 in., which meant a 4.5 in. concrete clear cover. The concrete cover played a

significant role in decreasing the rate of the ingress of the solution. Potter and Ho (1987)

found that the depth of water penetration was a function of square root of time, which

meant it would take three times longer for water to reach the rebar if double the cover

depth. Since the cover of the large specimens was twice as thick as the small specimens,

the interface between the rebar and concrete was better protected.

Coated with Epoxy

Solution Ingress Through the Loaded-End

Solution Ingress Through the Concret Cover

Figure 6.16. Two Ways of Solution Ingress

6.3.1.3.2. Fiber effect on bond degradation. With the addition of fibers, the

degradation rate of bond was significantly reduced. As shown in Figure 6.14, an average

reduction of 28% of bond strength was observed in the plain concrete specimens, while

only 6% reduction was observed in the FRC specimens. In the design bond strength, an

166

average reduction of 26% was observed in the plain concrete specimens, while only 10%

reduction was observed in the FRC specimens, as shown in Figure 6.15. It can be

concluded that fibers can effectively alleviate the bond deteriorations caused by

environmental conditioning. As discussed earlier, cracks or voids were created during the

environmental conditioning. Although the addition of fibers would not increase the first

cracking load, the fibers would restrict the further development of the cracks due to the

expansion of the water or the rebar. Hence, the deteriorations would not be accumulated,

or this would happen at a much more moderate rate.

It should also be noted that the fact that there was less bond degradation for the

FRC specimens could also be partly attributed to the fact that there was less damage of

the concrete after the environmental conditioning. It was clear from the difference in

appearance between the plain concrete specimens and the FRC specimens, after being

subjected to environmental conditioning, the fibers could effectively alleviate the damage

to the concrete caused by the freezing-and-thawing cycles. During the freezing cycles, the

water entrained in the concrete microvoids would expand and induce microcracks.

Microcracks were increased by the subsequent freezing-and-thawing cycles. In the worse

cases, this cumulative effect resulted in the collapse of the concrete, as shown in the

Figure 6.1. With the addition of fibers, the progress of the microcracks was restricted and

the concrete was held integrated by the fibers. Also, the air content of the plain concrete

used in this study was lower that that of FRC, which may also be responsible for the more

severe damage of the plain concrete specimens.

6.3.1.3.3. Difference of GFRP vs. CFRP. The bond degradation rate of the

GFRP specimens was more severe than that of the CFRP specimens. As shown in Figure

167

6.14, the bond reduced by 23% in the DP4C specimens and 56% in the DP4G specimens.

Similarly, the bond reduced 5% in the DF4C specimens and 15% in the DF4G specimens.

In the design bond strength or bond stiffness, the reductions were also observed to be

larger in the GFRP specimens, as shown in Figure 6.15.

As discussed previously, the degradation of the rebar may partly be attributed to

the bond degradation. Due to the attack by the salt water, the rebar, especially the outer

surface, was damaged. Thus, less contact area may result. Research has shown that the

CFRP rebar has superior durability characteristics compared to the GFRP rebar. Thus,

less damage was expected in the case of the CFRP rebar, and hence, the CFRP specimens

showed better durability of bond.

6.3.2. Durability Effect on Flexural Behavior. In the following sections, the

effect of the environmental conditioning on the beam, in terms of specimen condition,

flexural behaviors, and ductility is discussed. Differences in the flexural performances

between the plain concrete specimens and the FRC specimens after being subjected to

environmental conditioning are also reported.

6.3.2.1. Appearance of specimen after environmental conditioning. After the

environmental cycles were completed, the appearance of the specimens was examined.

Some observations were made as follows:

1. Concrete scaling on the surface of the beams was observed, as shown in Figure

6.17. Concrete scaling was limited to the top surface, and no concrete was broken apart.

It can be concluded that the deterioration to the beam’s flexural behavior due to the

concrete scaling is negligible, if any. The most obvious concrete scaling occurred at the

places where rebar chairs were placed. This is expected since the CTE of the plastic rebar

168

chairs is different from that of the concrete. Overall, the damage was much less severe

compared to the damage in bond specimens. In real bridge decks, the exposure condition

is expected to be similar to that of beam specimens in this study, thus, the concrete

damage due to the environmental conditioning for bridge deck is expected to be small.

Figure 6.17. Concrete Scaling on the Beam Surface

2. Traces of steel rust can be found on the beam surface, as shown in Figure 6.18,

indicating steel stirrups have already corroded to a certain degree. On the other hand, the

corrosion of steel stirrups revealed that the environmental conditionings of this study are

very critical for the steel reinforced structures.

6.3.2.2. Flexural response after environmental conditioning. In this section,

the effect of the environmental conditioning on the overall flexural behavior, in terms of

failure modes, flexural stiffness, and flexural strength is presented.

• Failure Mode. After being subjected to the environmental conditioning, the

failure modes for the beams did not change. That is, all the beams still failed in concrete

Concrete Scaling

Rebar Chair

169

crushing. No slips between the rebar and concrete were measured during the tests, which

meant that the development length was long enough for the required stresses in the rebars

to develop.

Figure 6.18. Photo Showing Steel Stirrups Corroded

• Flexural Stiffness. Figures 6.19 to 6.24 show the moment-deflection

response of the beams before and after the environmental conditioning. Following the

initial cracking, the flexural stiffness decreased but still remained approximately the same

value for beams before and after the environmental conditioning. Flexural stiffness is

determined by EcIm, and it is assumed that Ec has not changed after the environmental

conditioning. Thereby, Im is expected to remain the same before and after environmental

conditioning. According to current ACI code, Im is determined by Mcr, Ig, and Icr at a

certain load level. Mcr remained constant, which was verified by the moment-deflection

curves. Ig was not expected to have any change, since concrete scaling induced by the

environmental conditioning was limited to the top surface and no concrete

Steel Corrosion

170

0

5

10

15

20

25

30

35

40

45

50

55

0 5 10 15 20 25 30 35Deflection (mm)

Mom

ent (

kN.m

)

0

50

100

150

200

250

300

350

400

450

0 0.2 0.4 0.6 0.8 1 1.2Deflection (in.)

Mom

ent (

ips-

in.)

DP4C

VP4C

Figure 6.19. Moment-Deflection Relationship for #4 CFRP

Plain Concrete Specimens

0

5

10

15

20

25

30

35

40

45

50

0 5 10 15 20 25 30 35 40Deflection (mm)

Mom

ent (

kN.m

)

0

50

100

150

200

250

300

350

400

0 0.2 0.4 0.6 0.8 1 1.2 1.4Deflection (in.)

Mom

ent (

kips

-in.)

DP4G

VP4G

Figure 6.20. Moment-Deflection Relationship for #4 GFRP

Plain Concrete Specimens

171

0

5

10

15

20

25

30

35

40

45

50

55

0 5 10 15 20 25 30Deflection (mm)

Mom

ent (

kN.m

)

0

50

100

150

200

250

300

350

400

450

0 0.2 0.4 0.6 0.8 1Deflection (in.)

Mom

ent (

kips

-in.).

DP8G

VP8G

Figure 6.21. Moment-Deflection Relationship for #4 GFRP Plain Concrete

Specimens

0

5

10

15

20

25

30

35

40

45

50

0 5 10 15 20 25 30 35 40Deflection (mm)

Mom

ent (

kN.m

)

0

50

100

150

200

250

300

350

400

0 0.2 0.4 0.6 0.8 1 1.2 1.4Deflection (in.)

Mom

ent (

kips

-in.)DF4C

VF4C

Figure 6.22. Moment-Deflection Relationship for #4 CFRP FRC Specimens

172

0

5

10

15

20

25

30

35

40

45

0 5 10 15 20 25 30 35 40Deflection (mm)

Mom

ent (

kN.m

)

0

50

100

150

200

250

300

350

0 0.2 0.4 0.6 0.8 1 1.2 1.4Deflection (in.)

Mom

ent (

kips

-in.)

DF4G

VF4G

Figure 6.23. Moment-Deflection Relationship for #4 GFRP FRC Specimens

0

5

10

15

20

25

30

35

40

45

0 5 10 15 20 25 30 35 40

Deflection (mm)

Mom

ent (

kN.m

)

0

50

100

150

200

250

300

350

0 0.2 0.4 0.6 0.8 1 1.2 1.4Deflection (in.)

Mom

ent (

kips

-in.).

VF8G

DF8G

Figure 6.24. Moment-Deflection Relationship for #8 GFRP FRC Specimens

173

disintegration occurred. Thus, it was indicated that the Icr did not change. The value of Icr

is strongly dependent on the rebar properties, including its elastic modulus and rebar area.

Therefore, it can be concluded that the rebar properties, in the elastic modulus, Ef, and

rebar effective area, Af, did not significantly change after being subjected to

environmental conditioning. Similar findings were made by Giernacky et al. (2002).

• Flexural Strength. Tables 6.3 and 6.4 summarize the flexural strengths and

ultimate deflections for all the plain concrete beams and the FRC beams before and after

the environmental conditioning. Generally, the beams showed insignificant changes in

both the flexural strength and the ultimate deflection. In the flexural strength, reductions

ranged from 4% to 16% for the plain concrete beams and from 4% to 8% for the FRC

beams. In ultimate deflection, reduction ranged from -6% to 17% for the plain concrete

beams and from 3% to 18% for the FRC beams.

Table 6.3. Durability Beam Test Results for Plain Concrete Beams

Specimen I.D.

Ultimate Moment MV (kips-in.)

Specimen I.D.

Ultimate Moment MD (kips-in.) V

D

MM

VP4C-1 457 DP4C-1 423 VP4C-2 442

450 DP4C-2 417

420 0.93

VP4G-1 405 DP4G-1 393 VP4G-2 420 413 DP4G-2 401 397 0.96

VP8G-1 448 DP8G-1 339 VP8G-2 449 449 DP8G-2 416 378 0.84

Specimen I.D.

Ultimate Deflection ∆V (in.)

Specimen I.D.

Ultimate Deflection ∆D (in.) V

D

∆∆

VP4C-1 1.19 DP4C-1 0.84 VP4C-2 1.17

1.18 DP4C-2 1.12

0.98 0.83

VP4G-1 1.03 DP4G-1 1.14 VP4G-2 1.02 1.03 DP4G-2 1.04 1.09 1.06

VP8G-1 0.96 DP8G-1 0.83 VP8G-2 0.95 0.96 DP8G-2 0.91 0.87 0.91

174

Table 6.4. Durability Beam Test Results for FRC Beams

Specimen I.D.

Ultimate Moment MV (kips-in.) I.D. Ultimate Moment

MD (kips-in.) V

D

MM

VF4C-1 415 DF4C-1 370 VF4C-2 388

402 DF4C-2 405

388 0.96

VF4G-1 350 DF4G-1 326 VF4G-2 362 356 DF4G-2 338 332 0.93

VF8G-1 371 DF8G-1 341 VF8G-2 361 366 DF8G-2 328 335 0.92

Specimen I.D.

Ultimate Deflection ∆V (in.) I.D. Ultimate

Deflection ∆D (in.) V

D

∆∆

VF4C-1 1.20 DF4C-1 1.01 VF4C-2 1.10

1.15 DF4C-2 1.21

1.11 0.97

VF4G-1 1.19 DF4G-1 0.98 VF4G-2 1.19 1.19 DF4G-2 1.01 1.00 0.82

VF8G-1 0.95 DF8G-1 0.78 VF8G-2 0.87 0.91 DF8G-2 0.76 0.77 0.84

According to the current theory, the flexural strength controlled by the concrete

crushing is determined by the rebar and the concrete. As discussed previously, the

mechanical properties of the rebars were not significantly changed. Thus, the most

plausible reason for the reduction of flexural strength was the degradation of concrete.

The strains in the concrete at the ultimate were decreased slightly after the environmental

conditioning. In the plain concrete beams, the average ultimate concrete strains decreased

from 2,950 microstrains to 2,660 microstrains. In the FRC beams, the average ultimate

concrete strains decreased from 4,500 microstrains to 3,800 microstrains, as shown in

Figures 6.25 to 6.30.

In the previous study, it was found that the flexural strengths predicted by

assuming εcu equal to 0.0035 for the FRC beams have a comparable safety factor as εcu =

0.003 for the plain concrete beams. After the concrete beams were subjected to

175

0

5

10

15

20

25

30

35

40

45

50

55

-4500 -3000 -1500 0 1500 3000 4500 6000 7500 9000 10500 12000Strain (×10^-6 mm/mm)

Mom

ent (

kN.m

)

0

50

100

150

200

250

300

350

400

450

Mom

ent (

kips

-in.)

VP4C

DP4C

DP4C

VP4C

ReinforcementConcrete

Figure 6.25. Strain Distributions of #4 CFRP Plain Concrete Specimens

0

5

10

15

20

25

30

35

40

45

50

-4500 -3000 -1500 0 1500 3000 4500 6000 7500 9000 10500 12000 13500 15000Strain, (×10^-6 mm/mm)

Mom

ent (

kN.m

)

0

50

100

150

200

250

300

350

400

Mom

ent (

kips

-in.)

VP4G

DP4GDP4G

VP4G

ReinforcementConcrete

Figure 6.26. Strain Distributions of #4 GFRP Plain Concrete Specimens

176

0

5

10

15

20

25

30

35

40

45

50

55

-4500 -3000 -1500 0 1500 3000 4500 6000 7500 9000 10500 12000Strain (×10^-6 mm/mm)

Mom

ent (

kN.m

)

0

50

100

150

200

250

300

350

400

450

Mom

ent (

kips

-in.)

VP8G

DP8G

DP8G

VP8G

ReinforcementConcrete

Figure 6.27. Strain Distributions of #8 GFRP Plain Concrete Specimens

0

5

10

15

20

25

30

35

40

45

50

-9000 -6000 -3000 0 3000 6000 9000 12000Strain (×10^-6 mm/mm)

Mom

ent (

kN.m

)

0

50

100

150

200

250

300

350

400

Mom

ent (

kips

-in.)

VF4C

DF4CDF4C

VF4C

ReinforcementConcrete

Figure 6.28. Strain Distributions of #4 CFRP FRC Specimens

177

0

5

10

15

20

25

30

35

40

45

-9000 -6000 -3000 0 3000 6000 9000 12000 15000Strain, (×10^-6 mm/mm)

Mom

ent (

kN.m

)

0

50

100

150

200

250

300

350

Mom

ent (

kips

-in.)

VF4GVF4G

DF4G

DP4G

ReinforcementConcrete

Figure 6.29. Strain Distributions of #4 GFRP FRC Specimens

0

5

10

15

20

25

30

35

40

45

-9000 -6000 -3000 0 3000 6000 9000 12000Strain (×10^-6 mm/mm)

Mom

ent (

kN.m

)

0

50

100

150

200

250

300

350

Mom

ent (

kips

-in.)

DF8G

VF8G

VF8G

DF8G

ReinforcementConcrete

Figure 6.30. Strain Distributions of #8 GFRP FRC Specimens

178

environmental conditioning, the concrete became more brittle, as shown in Figure 6.31.

To reflect this effect in the design, 0.0025 and 0.003 were selected as the ultimate

concrete strains for the plain concrete beams and FRC beams after the environmental

conditioning. By using the new values of ultimate concrete strains, the beams after

environmental conditioning have a comparable safety factor as the unweathered beams,

as shown in Tables 6.5 and 6.6.

Figure 6.31. Comparison of Ultimate Strain of Concrete of ACI Value and Test Results in this Study (Courtesy of Park and Paulay)

Note: × is the values of FRC measured in this study; + is the values of plain concrete measured in this study. is the FRC measured after environmental conditioning;

and is the plain concrete measured after environmental conditioning

6.3.2.3. Ductility. Since ductility is an important parameter in the civil structures,

it is of interest to study the effect of the environmental conditioning on the ductility of

beams. As discussed in Chapter 4, Jaeger’s deformation based approach seems to be most

179

Table 6.5. Predictions of Ultimate Capacities for Plain Concrete Beams

I.D. Mexp. (kips-in.)

MACI (kips-in.) .exp

ACI

MM

VP4C-1 457 VP4C-2 442 450 355 0.79

VP4G-1 405 VP4G-2 420 413 367 0.89

VP8G-1 448 VP8G-2 449 449 401 0.89

Average 0.86 DP4C-1 423 DP4C-2 417 420 331 0.79

DP4G-1 393 DP4G-2 401 397 341 0.86

DP8G-1 339 DP8G-2 416 378 375 0.99

Average 0.88 Note: For the unweathered plain concrete beams, the above calculations were based on

εcu =0.003; for the plain concrete beams after environmental conditioning, the above calculations were based on εcu =0.0025.

appropriate to evaluate the ductility characteristics for FRP reinforced concrete structures.

This approach is adopted in this study.

After being subjected to the environmental conditioning, the ductility indices of

the beams showed small reductions, as shown in Table 6.7. The reduction of the ductility

index was mainly due to the degradation of concrete, which leaded to the reduction of the

ultimate strength and the associated curvature, as shown in Figures 6.32 to 6.37. The

reduction rate between the plain concrete beams and the FRC beams was similar.

However, after environmental conditioning, the FRC beams still showed superior

ductility compared to the plain concrete beams.

180

Table 6.6. Predictions of Ultimate Capacities for FRC Beams

I.D. Mexp. (kips-in.)

MACI (kips-in.) .exp

ACI

MM

VF4C-1 415 VF4C-2 388

402 306 0.76

VF4G-1 350 VF4G-2 362 356 314 0.88

VF8G-1 371 VF8G-2 361 366 338 0.92

Average 0.86 DF4C-1 370 DF4C-2 405

388 290 0.75

DF4G-1 326 DF4G-2 338 332 298 0.90

DF8G-1 341 DF8G-2 328 335 322 0.96

Average 0.87 Note: For the unweathered FRC beams, the above calculations were based on εcu =0.0035;

for the FRC beams after environmental conditioning, the above calculations were based on εcu =0.003.

Table 6.7. Ductility Index by Deformation Based Method

I.D. Mε=0.001 (kips-in.)

ψε=0.001 (1/in.)

Mult (kips-in.)

ψult (1/in.) µE

EV

ED

µµ

VP4C 202 7.82×10⁻⁴ 450 19.46×10⁻⁴ 5.50 1 VP4G 177 6.66×10⁻⁴ 405 17.63×10⁻⁴ 6.05 1 VP8G 190 4.96×10⁻⁴ 449 14.73×10⁻⁴ 7.04 1 VF4C 163 6.15×10⁻⁴ 402 20.78×10⁻⁴ 8.35 1 VF4G 153 5.74×10⁻⁴ 356 22.10×10⁻⁴ 8.94 1 VF8G 157 4.45×10⁻⁴ 366 14.40×10⁻⁴ 7.56 1 DP4C 191 7.09×10⁻⁴ 420 17.07×10⁻⁴ 5.29 0.96 DP4G 180 6.53×10⁻⁴ 397 17.20×10⁻⁴ 5.80 0.96 DP8G 183 4.47×10⁻⁴ 378 12.88×10⁻⁴ 5.95 0.85 DF4C 166 5.44×10⁻⁴ 388 20.09×10⁻⁴ 8.62 1.03 DF4G 139 4.62×10⁻⁴ 332 16.13×10⁻⁴ 8.33 0.93 DF8G 158 4.14×10⁻⁴ 335 13.49×10⁻⁴ 6.89 0.91

Note: µED is the ductility index after environmental conditioning;

µEV is the ductility of the unweathered beams;

181

0

5

10

15

20

25

30

35

40

45

50

55

0 0.00002 0.00004 0.00006 0.00008 0.0001Curvature (1/mm)

Mom

ent (

kN.m

)

0

50

100

150

200

250

300

350

400

450

0 0.0004 0.0008 0.0012 0.0016 0.002 0.0024Curvature (1/in.)

Mom

ent (

kips

-in.)

VP4C

DP4C

Figure 6.32. Typical Moment Curvature Relationship for #4 CFRP Plain Concrete Beams

0

5

10

15

20

25

30

35

40

45

50

0 0.00001 0.00002 0.00003 0.00004 0.00005 0.00006 0.00007 0.00008Curvature (1/mm)

Mom

ent (

kN.m

)

0

50

100

150

200

250

300

350

400

0 0.0002 0.0004 0.0006 0.0008 0.001 0.0012 0.0014 0.0016 0.0018 0.002Curvature (1/in.)

Mom

ent (

kips

-in.)

VF4G

VP4G

Figure 6.33. Typical Moment Curvature Relationship for #4 GFRP Plain Concrete Beams

182

0

5

10

15

20

25

30

35

40

45

50

55

0 0.00002 0.00004 0.00006 0.00008Curvature (1/mm)

Mom

ent (

kN.m

)

0

50

100

150

200

250

300

350

400

450

0 0.0002 0.0004 0.0006 0.0008 0.001 0.0012 0.0014 0.0016 0.0018 0.002Curvature (1/in.)

Mom

ent (

kips

-in.)

VP8G

DP8G

Figure 6.34. Typical Moment Curvature Relationship for #8 GFRP Plain Concrete Beams

0

5

10

15

20

25

30

35

40

45

50

0 0.00002 0.00004 0.00006 0.00008 0.0001 0.00012Curvature (1/mm)

Mom

ent (

kN.m

)

0

50

100

150

200

250

300

350

400

0 0.0005 0.001 0.0015 0.002 0.0025 0.003Curvature (1/in.)

Mom

ent (

kips

-in.)DF4C

VF4C

Figure 6.35. Typical Moment Curvature Relationship for #4 CFRP FRC Beams

183

0

5

10

15

20

25

30

35

40

45

0 0.00002 0.00004 0.00006 0.00008 0.0001 0.00012Curvature (1/mm)

Mom

ent (

kN.m

)

0

50

100

150

200

250

300

350

0 0.0005 0.001 0.0015 0.002 0.0025 0.003Curvature (1/in.)

Mom

ent (

kips

-in.)

DF4G

VF4G

Figure 6.36. Typical Moment Curvature Relationship for #4 GFRP FRC Beams

0

5

10

15

20

25

30

35

40

45

0 0.00002 0.00004 0.00006 0.00008 0.0001Curvature (1/mm)

Mom

ent (

kN.m

)

0

50

100

150

200

250

300

350

0 0.0005 0.001 0.0015 0.002 0.0025Curvature (1/in.)

Mom

ent (

kips

-in.)DF8G

VP8G

Figure 6.37. Typical Moment Curvature Relationship for #8 GFRP FRC Beams

184

Based on the criterion proposed by Jaeger et al. (1995) and the Canadian Highway

Bridge Design Code, both the plain concrete beams and the FRC beams exceeded the

ductility index limit of 4. Therefore all the beams in this study can be considered safe for

design in terms of ductility requirement.

6.4. CONCLUDING REMARKS

Durability performances, in terms of bond and flexural behavior, between the

FRP rebars and fiber-reinforced-concrete were investigated and compared to the

performance of the FRP rebars in the plain concrete. The accelerated aging test was

accomplished by placing specimens in contact with salt solutions and subjecting them to

10 combined environmental cycles, each of which consisted of 20 freezing-and-thawing

cycles and 20 high temperature cycles. The following conclusions can be drawn from this

study:

• Three reasons mainly contributed to the bond degradation: (1) expansion of

solutions in the microvoids at the interface; (2) difference in CTE between the

rebar and concrete; (3) damage of the rebar, especially on the surface. The first

two mechanisms function together and degrade the bond mainly at the interface.

The third reason is through damage of the rebar surface, resulting in separation

between the rebar and concrete.

• With the addition of polypropylene fibers, the bond of weathered specimens

significantly improved due to restriction of the development of cracks at the

interface. The loss of the ultimate bond strength of the FRP rebars in the plain

concrete due to weathering effects was found to be 28% on average, while only

185

6% reduction was observed in the FRC specimens. Similarly, bond stiffness

exhibited a 26% average reduction in plain concrete specimens, while only 10%

reduction was observed in the FRC specimens.

• The larger specimens with longer embedment length and relatively smaller

exposed area to the solution of sodium chloride (NaCl) showed better

performance.

• Under durability effect, the CFRP specimens exhibited superior bond

performance as compared to the GFRP specimens. This may be attributed to the

more durable characteristics of the CFRP rebar.

• Both plain concrete beams and FRC beams exhibited a small reduction in ultimate

flexural strength and ductility in the durability test. The degradation of concrete

was the main reason for the flexural degradation.

• Under environmental conditioning and weathering, all beams included in this

study showed similar performance in terms of ductility requirement. Compared to

the plain concrete beams, FRC beams showed approximately 40% increase in

ductility index based on deformation based approach both before and after the

environmental conditioning.

It should be noted that the above conclusions are drawn based on the tests

conducted in this study, where bond specimens and beam specimens are unstressed. In

the real conditions, the structures are under loading conditions, thus, the above

conclusions may not be suitable. Also, different environmental conditionings may have

different results, cautions should be used when applying the results into different

situation.

186

7. DESIGN RECOMMENDATIONS

7.1. GENERAL

The design recommendations are based on the current design guidelines for the

concrete members reinforced with FRP bars as proposed by ACI 440. Information not

covered in this report, such as material properties, construction, shear design, etc., can be

found in the ACI 440.3R-04 documents.

The reinforcing system proposed in this report consists of the FRP rebar (GFRP

and CFRP) and polypropylene fiber reinforced concrete with a fiber volume fraction Vf of

0.5%. Thus, the design recommendations may not be applicable to other FRP rebar, fiber,

or fiber volume fraction, Vf. Also, the design recommendations for the long-term

performance of the FRP/FRC system are based on the test results obtained from the

environmental conditioning used in this study. They may not be applicable in other

situations.

7.2. DESIGN EQUATIONS

Many design theories and equations for the FRP/plain concrete system are still

applicable to the FRP/FRC system. In the following sections, only the design equations

that are not existent in, or are different from, the ACI 440, including flexural strength,

development of reinforcement, and durability of the system are presented as follows:

• Flexural Strength

The concrete crushing failure mode is more desirable for the concrete member

reinforced with the FRP bars. By experiencing concrete crushing, a flexural member does

187

exhibit some plastic behavior before failure (ACI 440, 2004), as demonstrated in this

study. The same design philosophy is recommended for the FRP/FRC reinforcing system.

The following equations can be used to predict the flexural strength:

2'

59.01 bdf

ffM

c

ffffn ⎟

⎟⎠

⎞⎜⎜⎝

⎛−=

ρρ kips-in. (7.1)

( )fucufcuf

f

ccuff fEE

fEf ≤

⎟⎟⎟

⎜⎜⎜

⎛−+= εε

ρβε

5.085.0

4

'1

2

psi (7.2)

fucu

cu

fu

cbf f

fεε

εβρ

+=

'

185.0 (7.3)

Based on the current testing data, εcu = 0.0035 is suggested for FRC beams and εcu

= 0.003 for plain concrete beams.

• Crack Width

With the addition of fibers, the crack width of the FRC beam is smaller than that

of the plain concrete beams at the service stage, but this phenomenon is not pronounced

at high load level due to the inadequate bond between the fibers and concrete. Thus, the

contribution from fibers is ignored in the prediction of the crack width. Based on the test

data, the following equation proposed by Salib and Abdel-Sayed (2004) is recommended

for both the plain concrete beam and the FRC beam:

3322200 Adf

uu

Ew cf)/(

f,b

s,b

fβ×

⎟⎟

⎜⎜

⎛×= in. (7.4)

where ', 25.6 csb fu = , and

ub,f is the design bond strength for the FRP rebars; and it is equal to 'cs,b f.u 259=

for the FRP rebars used in this study. If the data are unavailable, ub,f can be taken as ub,s.

188

• Development Length

The bond behavior in the pre-peak region does not change with the addition of

fibers. The contribution from the fibers is in the post-peak region. Since the development

length is determined by the bond behavior in the pre-peak region, the same equation is

used for both the plain concrete and the FRC. In this study, the bond strength

corresponding to 0.002 in. slippage at the free-end or 0.01 in. at the loaded end is

recommended as the designing bond strength. A statistical analysis with 95% confidence

was performed on the design bond strength, and the following equation in the format of

current AASHTO expressions is proposed to calculate the development length:

'056.0

c

fufdb

f

fAl = in. (7.5)

• Durability

In the current ACI 440 recommendations, the long-term environmental effect on

the structural behaviors of the FRP reinforced members is reflected in the environmental

reduction factor, CE. However, the flexural strength of the FRP reinforced member is

governed by the property of concrete rather than the property of the FRP rebar when the

member fails by the concrete crushing. Furthermore, the environmental reduction factor,

CE, does not reflect the bond degradation due to the long-term weather exposure. Thus,

new coefficients are needed to account for the long-term environmental effect on the

structural behaviors of the FRP reinforced system.

(a) Long-term flexural strength. The flexural strengths of the FRP reinforced

beams experienced reductions due to the environmental conditioning, which was most

likely due to the degradation of concrete. By adjusting the ultimate concrete strain, the

predictions were in good agreement with the test results. The ultimate concrete strain εcu

189

= 0.0030 for the FRC beams and εcu = 0.0025 for the plain concrete beams are suggested

to account for the more brittle behavior of the concrete after the environmental

conditioning. Again, different environmental conditionings may have different effects on

the ultimate concrete strain. The above values may not be appropriate for the other

conditionings.

(b) Long-term bond strength. Based on the tests of the durability effect on the

bond behavior, the bond degradation effect is closely related to the ratio between the

portions directly exposed to the solution to the whole embedment area. Based on the

ductility test results, the crack spacing was approximately 4 to 5 inches under service

conditions in the beam specimen. The #4 pullout bond specimen had 2.5 inches

embedment length, which was close to half of the crack spacing. Bond stress distribution

along half of the crack spacing in beam specimen is similar to that in pullout bond

specimen, as shown in Figure 3.6. Thus, the degradation rate is expected to be able to

represent the bond degradation in beam. Table 7.1 summarizes the residual design bond

strength for CFRP and GFRP specimens and more details can be found in Chapter 6.3.1.

Table 7.1. Residual Design Bond Strength Based on Experiment

GFRP CFRP Plain Concrete 0.57 0.75

FRC 0.83 0.88 Byars et al. (2003) proposed a reduction coefficient for the bond strength for the

FRP/Plain concrete system as follows:

SLTmoenv,fbb,env f ηηηη ⋅⋅⋅∆−= 1 (7.6)

190

where env,fbf∆ is the standard reduction of bond strength due to environmental influence,

taken as 0.30; and moη , Tη , and SLη , as proposed by Byars et al., are listed in Tables 7.2

to 7.4.

Table 7.2. Correction Factors for Moisture Condition in Concrete Member, moη (Byars, 2003)

Dry (RH app. 50%) Moist (Concrete not

constantly in contact with water, RH app. 80%)

Moist saturated (Concrete constantly in contact with

water, RH app. 100%) 0.65 1.0 1.5

Table 7.3. Correction Factors for Mean Annual Temperature, Tη (Byars, 2003)

MAT <410F 410C< MAT <590F 590F< MAT <770F

0.85 1.0 1.15

Table 7.4. Correction Factors for Required Service Life, SLη (Byars, 2003)

Service life =50 years Service life =100 years

0.85 1.0

The test data from this durability bond test are used to calibrate the Byars’ model.

In the durability bond test, specimens were submerged into a solution. Thus, moη =1.5.

191

Average temperature was approximately 500F. Thus, Tη =1.0. SLη is taken as 1.0 to

represent the 100 service life. Thus,

5500101513011 .....f SLTmoenv,fbb,env =×××−=⋅⋅⋅∆−= ηηηη (7.7)

The Byars’ model was developed to predict the FRP/Plain concrete system. The

value 0.55, as predicted Equation 7.7, is very close to the test result for the GFRP/plain

concrete specimens, which is equal to 0.57. However, the Byars’ model does not consider

the effect of the different rebar types on the bond degradation. As shown in the

experiment, different rebars had different effects on the bond degradation. Also, the

contribution of the fibers to the bond degradation was not reflected in Byars’ model.

Following the same methodology proposed by Byars, some modifications are suggested:

barSLTmoenv,fbb,env f ηηηηη ⋅⋅⋅⋅∆−=1 (7.8)

where the correction factors Tη and SLη are the same as the Byars’ model. Other factors

are listed in Table 7.5 and Table 7.6.

Table 7.5. Correction Factors for Standard Reduction of Bond Strength, env,fbf∆

Plain Concrete FRC

0.3 0.15

Table 7.6. Correction Factors for Rebar Type, barη

GFRP CFRP

1.0 0.70

192

According to Equation 7.8, the reduction coefficients for GFRP and CFRP

embedded in plain concrete and FRC are computed as the followings:

GFRP in Plain concrete:

5500101513011 .....f barSLTmoenv,fbb,env =×××−=⋅⋅⋅⋅∆−= ηηηηη

CFRP in Plain concrete:

6907001513011 .....f barSLTmoenv,fbb,env =×××−=⋅⋅⋅⋅∆−= ηηηηη

GFRP in FRC:

78001015115011 .....f barSLTmoenv,fbb,env =×××−=⋅⋅⋅⋅∆−= ηηηηη

CFRP in FRC:

84070015115011 .....f barSLTmoenv,fbb,env =×××−=⋅⋅⋅⋅∆−= ηηηηη

As shown in Table 7.7, the degradation rates computed by Equation 7.8 are very

close and are conservative compared to the test data. Since the bond degradation rate will

be affected by different environmental conditionings, Cautions should be used when the

environmental conditionings are different with that used in this study.

Table 7.7. Comparison of Test Results and Predictions

GFRP CFRP

Experiment Prediction ExperimentedictionPr

Experiment Prediction ExperimentedictionPr

Plain Concrete 0.57 0.55 0.96 0.75 0.69 0.92

FRC 0.84 0.78 0.93 0.88 0.84 0.95

193

The degradation of the bond results in the necessity to modify the development

length. Thus, Equation 7.5 becomes

'cb,env

fufdb

f

fA.l

η0560= in. (7.9)

where b,envη is the reduction coefficient of bond strength due to the long-term

environmental conditioning.

194

8. CONCLUSIONS

Through this research program on the structural performances of the “steel-free

FRP/FRC hybrid reinforcing system,” a greater understanding of the bond characteristics,

flexural behavior, and durability performance has been achieved.

8.1. BOND TESTS. Based on the bond study, including pullout bond tests and

splitting bond tests, the following conclusions can be made:

• With the addition of fibers, the bond-slip relationship significantly improved in

the post-peak region, while little change was observed for the pre-peak behavior.

The FRC specimens failed in a more ductile fashion with a smooth descending

portion. A large portion of the load could be held, even at large slip. The plain

concrete specimens failed in a very brittle fashion. Once it reached the peak value,

the load dropped suddenly to zero.

• Different bond mechanisms were observed for the CFRP and the GFRP

specimens due to their different surface treatments. Bond strength of the GFRP

specimen was about twice as much as that of the CFRP. The GFRP specimen

failed by concrete splitting; while the bond failure of the CFRP specimen initiated

by the rebar pullout, providing more ductile behavior;

• Fatigue loading, within a working stress range, was shown to increase the bond

stiffness and the bond strength, while causing the bond behavior to be more brittle

and often change the failure mode from rebar pullout to concrete splitting.

• The large amount of slip between the rebar and concrete has occurred during the

fatigue loading. Therefore, the total slip, including the residual slip due to fatigue

195

loading, could be regarded as an inherent property for bond behavior between the

rebar and the concrete, and it has little relationship with the loading history.

• Polypropylene fibers can effectively decrease the rate of bond degradation due to

the fatigue loading.

• Based on analytical derivation and experimental calibration, an equation was

proposed to predict the bond strength for the FRP bars embedded in FRC failed

by concrete splitting.

• Bond value corresponding to 0.002 in. at the free-end slip or 0.01 in. at the loaded

end was recommended as the designing bond strength in previous studies (Mathey

and Watstein, 1961). Based on this criteria, an equation for the basic development

length of the FRP rebar in the FRC was proposed.

8.2. FLEXURAL BEAM TESTS. Based on the flexural ductility study, the

following conclusions can be made:

• The deflection predicted by the current ACI 440 guidelines yield results

consistent with experimental results, especially at the service load stage, and

could be used for both the plain concrete beams and the FRC beams.

• The model proposed by Salib et al. (2004) yields reasonable predictions of the

crack width for both the plain concrete beams and the FRC beams. The

predictions by the ACI 440 were found to be conservative.

• The addition of fibers reduced the crack widths at the service load in the case of

FRC beams as compared to plain concrete beams.

• The compression concrete strain measured at the compression fiber of the FRC

beams was larger than that of the plain concrete beams. It ranged from 4,000

196

microstrains to 5,500 microstrains, with an average of 4,500 microstrains for the

FRC beams, while concrete strains, ranging from 2,700 microstrains to 3,300

microstrains, with an average of 2,950 microstrains, were measured for the plain

concrete beams.

• With the addition of polypropylene fibers, the ductility indices increased by

approximately 40% based on deformation based approach, which takes into

account the strength effect as well as the deflection (or curvature) effect on

determining the ductility. In addition, both plain concrete beams and FRC beams

provided an adequate deformability level, as described by Jaeger. Moreover, FRC

made it slightly more ductile, based on the new definition of ductility for the FRP

reinforced beam.

8.3. DURABILITY TESTS. Based on the accelerated durability study, and

investigating the bond and flexural test of weathered specimens, the following

conclusions can be drawn:

• Three reasons mainly contributed to the bond degradation: (1) expansion of

solutions in the microvoids at the interface; (2) difference in CTE between the

rebar and concrete; (3) damage of the rebar, especially on the surface. The first

two mechanisms function together and degrade the bond mainly at the interface.

The third reason is through damage of the rebar surface, resulting in separation

between the rebar and concrete.

• With the addition of polypropylene fibers, the bond of weathered specimens

significantly improved due to restriction of the development of cracks at the

interface. The loss of the ultimate bond strength of the FRP rebars in the plain

197

concrete due to weathering effects was found to be 28% on average, while only

6% reduction was observed in the FRC specimens. Similarly, bond stiffness

exhibited a 26% average reduction in plain concrete specimens, while only 10%

reduction was observed in the FRC specimens.

• The larger specimens with longer embedment length and relatively smaller

exposed area to the solution of sodium chloride (NaCl) showed better

performance.

• Under durability effect, the CFRP specimens exhibited superior bond

performance as compared to the GFRP specimens. This may be attributed to the

more durable characteristics of the CFRP rebar.

• Both plain concrete beams and FRC beams exhibited a small reduction in ultimate

flexural strength and ductility in the durability test. The degradation of concrete

was the main reason for the flexural degradation.

• Under environmental conditioning and weathering, all beams included in this

study showed similar performance in terms of ductility requirement. Compared to

the plain concrete beams, FRC beams showed approximately 40% increase in

ductility index based on deformation based approach both before and after the

environmental conditioning.

198

BIBLIOGRAPHY

AASHTO LRFD Bridge Design Specifications, American Association of State Highway and Transportation Officials, Washington, D.C., 1998, pp. 5-138.

ACI Committee 201, “Guide to Durable Concrete,” ACI 201.2R-92, American Concrete

Institute, Farmington Hills, Michigan, 1992, 39 pp. ACI Committee 318. “Building Code Requirements for Structural Concrete (318-02) and

Commentary (318R-02),” American Concrete Institute, Farmington Hills, Michigan., 2002, 443 pp.

ACI Committee 408, “State–of–the–Art Report on Bond under Cyclic Loads,” ACI

408.2R-92 (Reapproved 1999), American Concrete Institute, Farmington Hills, Michigan, 1999, 32 pp.

ACI Committee 440, “Guide for the Design and Construction of Concrete Reinforced

with FRP Bars,” ACI 440.3R-04, American Concrete Institute, Farmington Hills, Michigan, 2004, 40 pp.

ACI Committee 544, “State–of–the–Art Report on Fiber Reinforced Concrete,” ACI

544.1R-96, American Concrete Institute, Farmington Hills, Michigan, 1996, 66 pp.

Admi, M.R., Rahman, A.H. and Benmokrane, B., “New Method for Testing Fiber-

Reinforced Polymer Rods under Fatigue,” Journal of Composites for Construction, Vol. 4, No.4, November 2000, pp. 206-213.

Al-Dulaijan S.U., Al-Zahrani, M., Nanni, A., Bakis, C., and Boothby, E., “Effect of

Environmental Pre-Conditioning on Bond of FRP Reinforcement to Concrete,” Journal of Reinforced Plastics and Composites, Vol. 20, No.10, pp. 881-900.

Alsayed, S.H., and Alhozaimy, A.M., “Ductility of Concrete Beams Reinforced with FRP

Bars and Steel Fibers,” Journal of Composite Materials, Vol. 33, No. 19, 1999, pp. 1792-1806.

ASTM C 666-03, “Standard Test Method for Resistance of Concrete to Rapid Freezing

and Thawing in Water,” Annual Book of Standards, American Society for Testing and Materials, West Conshohocken, Pennsylvania, 2003.

ASTM A-944-99, “Standard Test Method for Comparing Bond Strength of Steel

Reinforcing Bars to Concrete Using Beam-End Specimens,” Annual Book of Standards, American Society for Testing and Materials, West Conshohocken, Pennsylvania, 1999.

199

ASTM C 1543-02, “Standard Test Method for Determining the Penetration of Chloride Ion into Concrete by Ponding,” Annual Book of Standards, American Society for Testing and Materials, West Conshohocken, Pennsylvania, 2002.

Bakht, B., and Mufti, A., “FRC Deck Slabs without Tensile Reinforcement,” Concrete

International, Vol.18, No.2, February 1996, pp. 50-55. Bakht, B., and Mufti, A., “Five Steel Bridge Deck Slabs in Canada,” Structural

Engineering International, Vol. 8, No.3, 1998, pp. 196-200. Bakis, C.E., AL-Dulaijan, S.U., Nanni, A., Boothby, T.E., and Al-Zahrani, M.M., “Effect

of Cyclic Loading on Bond Behavior of GFRP Rods Embedded in Concrete Beams,” Journal of Composites Technology & Research, JCTRER, Vol. 20, No. 1, January 1998, pp. 29-37.

Balazs, G.L., and Borosnyoi, A., “Long-term behavior of FRP,” Composites in

construction: a reality, Proceedings of the International Workshop, July 20-21 2001 Capri, (Italy) by Edoardo Cosenza, Gaetano Manfredi, and Antonio Nanni.

Bank, L.C., and Gentry, T.R., “Accelerated Test Methods to Determine the Long-Term

Behavior of FRP Composite Structures: Environmental Effects,” Journal of Reinforced Plastics and Composites, Vol. 14, June 1995, pp. 559-587.

Bank, L.C., Puterman, M., and Katz, A., “The Effect of Material Degradation on Bond

Properties of Fiber Reinforced Plastic Reinforcing Bars in Concrete,” ACI Materials Journal, Vol. 95, No. 3, May-June 1998, pp. 232-243.

Barker, R.M., and Puckett, J.A., Design of Highway Bridges, A Wiley-Interscience

Publication, 1997 Batchelor, B. deV., and Kwun, M., “Shear in RC Beams without Web Reinforcement,”

Journal of the Structural Division, ASCE, Vol. 107, No. 5, May 1981, pp. 907-921.

Belarbi, A., Chandrashekhara, C., and Watkins, S.E., “Performance Evaluation of Fiber

Reinforced Polymer Reinforcing Bar Featuring Ductility and Health Monitoring Capability,” Fourth International Symposium on Fiber Reinforced Polymer for Reinforced Concrete Structures, SP-188, American Concrete Institute, Farmington Hills, Michigan, 1999, pp. 1-12.

Belarbi, A., and Wang, H., “Bond-Slip Response of FRP Reinforcing Bars in Fiber

Reinforced Concrete under Direct Pullout," Proc. of ICFRC--International Conference on Fiber Composites, High Performance Concretes, and Smart Materials, January 8-10, 2004, Chennai, India pp. 409-419, Ed. By V. S. Parameswaran

200

Belarbi, A., and Wang, H., “Bond Splitting Behavior of FRP Reinforcing Bars Embedded in Fiber Reinforced Concrete,” Proceeding for the 84th Transportation Research Board Annual Meeting, 2005, Washington D.C.

Benmokrane, B., Tighiouart, B., and Chaallal, O., “Bond Strength And Load Distribution

of Composite GFRP Reinforcing Bars in Concrete,” ACI Materials Journal. Vol. 93, No. 3, May-June 1996, pp. 246-253.

Berg, A.C., Bank, L.C., Oliva, M.G., and Russell, J.S., “Construction of FRP Reinforced

Bridge Deck on US Highway 151 in Wisconsin,” Proceeding for the 84th Transportation Research Board Annual Meeting, 2004, Washington D.C.

Bradberry, T.E., “Concrete Bridge Decks Reinforced with Fiber-Reinforced Polymer

Bars,” Transportation Research Record 1770, 2001, pp. 97-104. Bresler, B., Reinforced Concrete Engineering, John Wiley & Son, 1974. Byars, E.A., Waldron, P., Dejke, V., Demis, S., and Heddadin, S., “Durability of FRP in

Concrete--Current Specifications and a New Approach,” International Journal of Materials and Product Technology, Vol. 19, No. 1-2, 2003, pp. 40-52.

Cairns, J., and Abdullah, R., “An Evaluation of Bond Pullout Tests and Their Relevance

to Structural Performance,” Structural Engineer, Vol. 73, No. 11, June 1995, pp. 179-185.

Cairns, J., and Plizzari, G., “Towards a Harmonized European Bond Test,” Materials and

Structures, Vol. 36, October 2003, pp. 498-506. Campbell, T. I., Chitnuyanondh, L., and Batchelor B. deV., “ Rigid-Plastic Theory V.

Truss Analogy Method for Calculating the Shear Strength of Reinforced Concrete Beams,” Magazine of Concrete Research. Vol. 32, No. 110, March 1980, pp. 39-44.

CAN/CSA-S6-00, 2000, “Canadian Highway Bridge Design Code,” Canadian Standard

Association, Rexdale, Ontario, Canada, 190 pp. Carrasquillo, R.L., Nilson, A.H., and Slate, F.O., “Properties of High Strength Concrete

Subject to Short-Term Loads,” ACI Journal, Vol. 78, No. 3, May-June 1981, pp. 171-178.

CEB-FIP, Model Code for Concrete Structures: CEB-FIP International

Recommendations, 3rd ed., Comité Euro-International du Béton, Paris, 1978, 348 pp.

201

Chaallal, O., and Benmokrane, B., “Pullout and Bond Glass-Fiber Rods Embedded in Concrete And Cement Grout,” Materials & Structures. Vol. 26, No. 157, April 1993, pp. 167-175.

Chen, Wai-Fah and Duan, Lian, Bridge Engineering Handbook, CRC Press, 1999 Chinn, J., Ferguson, P.M., and Thompson, J.N., “Lapped splices in reinforced concrete

beams,” ACI Journal, Vol. 52, No.10, 1955, pp. 201-213. Choi, O.C., and Lee, W.S., “Interfacial Bond Analysis of Deformed Bars to Concrete,”

ACI Structural Journal, Vol.99 No.6, November-December 2002, pp. 750-756. Clark, C.R., and Johnston, D.W., “Early Loading Effects on Bond Strength,” ACI Journal,

Vol. 80, No. 6, November-December 1983, pp. 532-539. Collins, M.P., and Mitchell, D., Prestressed Concrete Structures, Prentice-Hall, Inc.,

1991, 753 pp. Cosenza, E., Manfredi, G., and Realfonzo, R. “Behavior and Modeling of Bond of FRP

Rebars to Concrete,” Journal of Composites for Construction, Vol. 1, No.2, May 1997, pp. 40-51.

Demers, C.E., “Tension-Tension Axial Fatigue of E-Glass Fiber-Reinforced Polymeric

Composites: Fatigue Life Diagram,” Construction and Building Materials, Vol. 12, No.1, 1998, pp. 303-310.

Demers, C.E., “Fatigue Strength Degradation of E-Glass FRP Composites and Carbon

FRP Composites,” Construction and Building Materials, Vol. 12, No. 5, July 1998, pp. 311-318.

Ehsani, M.R., Saadatmanesh, H., and Tao, S. “Bond Behavior of Deformed GFRP

Rebars,” Journal of Composite Materials, Vol. 31, No. 14, 1997, pp. 1413-1430. El-Salakawy, E. and Benmokrane, A., “Serviceability of Concrete Bridge Deck Slabs

Reinforced with Fiber-Reinforced Polymer Composite Bars,” ACI Structural Journal, Vol. 101, No. 5, September-October 2004, pp. 727-736.

Federal Highway Administration, “Deficient Bridges by State and Highway System,”

http://www.fhwa.dot.gov/bridge/deficient.htm, Accessed in February 2005 Federal Highway Administration, “Innovative Bridge Research and Construction (IBRC)

Program,” http://ibrc.fhwa.dot.gov, Accessed in February 2005. Ferguson, P. M., Breen, J.E., and Thompson, J.N., “Pullout Tests on High Strength

Reinforcing Bars,” ACI Journal, Vol. 62, No. 8, August 1965, pp. 933-950.

202

Ferguson, P. M., and Thompson, J. N., “Development Length of High Strength Reinforcing Bars in Bond,” ACI Journal, Vol. 59, No. 1, January 1962, pp. 887-922.

Gao, D., Benmokrane, B., and Masmoudi, R., “A Calculating Method of Flexural

Properties of FRP-Reinforced Concrete Beam: Part 1: Crack Width and Deflection,” Technical Report, Department of Civil Engineering, University of Sherbrooke, Sherbrooke, Quebec, Canada, 24 pp.

Gergely, P., and Lutz, L.A., “Maximum Crack Width in Reinforced Concrete Flexural

Members,” Causes, Mechanism, and Control of Cracking in Concrete, SP-20, American Concrete Institute, Farmington Hills, Michigan, 1999, pp. 87-117.

Giernacky, R.G., Bakis, C.E., Mostoller, J.D., Boothby, T.E., and Mukherjee, A.,

“Evaluation of Concrete Beams Reinforced With Internal GFRP Bars: A Long-Term Durability Study,” Second International Conference on Durability of Fiber Reinforced Polymer (FRP) Composites for Construction, Ed. Benmokrane, B., and El-Salakawy, E., 2002, Canada, pp. 39-50.

Gopalararatnam, V.S., and Meyer, J.W., “Fatigue Response of Flexural Bond in FRP

Reinforced Concrete,” Proceeding of ICFRC International Conference, 8-10 January 2004, Chennai, India, pp. 363-373.

Goto, Y, “Cracks Formed in Concrete Around Deformed Tension Bars,” Journal of the

American Concrete Institute, Vol. 68, No. 4, April 1971, pp. 244-251. Gupta, S.D., Bridge Manual, Missouri Department of Transportation, 12/19/2001. Gylltoft, K., Cederwall, K., Elfgren, L., and Nilsson., L., “Bond Failure in Reinforcement

Concrete Under Monotonic and Cyclic Loading: A Fracture Mechanics Approach,” Fatigue of Concrete Structures, SP-75, American Concrete Institute, Detroit, 1982, pp. 269-287.

Hamad, B.S., “Comparative Bond Strength of Coated and Uncoated Bars with Different

Rib Geometries,” ACI Material Journal, Vol. 92, No. 6, November-December 1995, pp. 579-591.

Harris, H.G., Somboonsong, W., and Ko, F. K., “New Ductile Hybrid FRP Reinforcing

Bar for Concrete Structures,” Journal of Composites for Construction, Vol. 2, No. 1, February 1998, pp. 28-37.

Laboubi, K., El-Salakawy, E., Pigron, M., and Benmokrane, B., “Behavior of Concrete

Beams Reinforced With GFRP under Sustained Load and Freeze/Thaw Cycles,” Second International Conference on Durability of Fiber Reinforced Polymer (FRP) Composites for Construction, Ed. Benmokrane, B., and El-Salakawy, E., 2002, Canada, pp. 453-464.

203

Jaeger, G.L., Tadros, G., and Mufti, A.A., “Balanced Section, Ductility and Deformability in Concrete with FRP Reinforcement,” Research Report No. 2-1995, Industry Center for Computer-Aided Engineering, Technical University of Nova Scotia, Halifax, Nova Scotia, Canada, 1995, 29 pp.

Katz, A., “Bond to Concrete of FRP Rebars after Cyclic Loading,” Journal of

Composites for Construction, Vol. 4, No. 3, August 2000, pp. 137-144. Katz, A., “Bond Mechanism of FRP Rebars to Concrete,” Materials and Structures, Vol.

32, December 1999, pp. 761-768. Katz, A., Berman, N., and Bank, L., “Effect of high temperature on bond strength of FRP

rebars,” Journal of Composites for Construction, Vol. 3, No. 2, May 1999, pp. 73-81.

Keesler, R.J., and Power, R.G., “Corrosion of Epoxy Coated Rebars--Keys Segmental

Bridge-Monroe County,” Report No. 88-8A, Florida Dept. of Transportation, Materials Office, Corrosion Research Laboratories, Gainesville, Fl, 1988.

Kemp, E.L., “Bond in Reinforced Concrete: Behavior and Design Criteria,” ACI Journal,

Vol. 83, No. 1, January-February 1986, pp. 50-57. Li, V.C., and Wang, S., “Flexural Behaviors of Glass Fiber-Reinforced Polymer (GFRP)

Reinforced Engineered Cementitious Composite Beams,” ACI Materials Journal, Vol. 99, No. 1, January-February 2002, pp. 11-21.

Malvar, L.J., Cox, J.V., and Cochran, K.B., “Bond between Carbon Fiber Reinforced

Polymer Bars and Concrete. 1: Experimental Study,” Journal of Composites for Construction, Vol. 7, No.2, May 2003, pp. 154-163.

Mashima, M., and Iwamoto, K., “Bond characteristics of FRP rod and concrete after

freezing and thawing deterioration,” Fiber-Reinforced-Plastic Reinforcement for Concrete Structures - International Symposium, SP 138, American Concrete Institute, Detroit, 1993, pp. 51-70.

Mathey, R., Wastein, D., “Investigation of Bond in Beam and Pull-Out Specimens with

High-Yield-Strength Deformed Bars,” ACI Journal, Vol. 57, No. 3, March 1961, pp. 1071-1090.

Mays, G.C., and Tilly, G.P., “Long Endurance Fatigue Performance of Bonded Structural

Joints,” International Journal of Adhesion and Adhesives, Vol. 2, No. 2, April 1982, pp. 109-113.

Micelli, F., and Nanni, A., “Durability of FRP Rods for Concrete Structures,”

Construction and Building Materials, Vol. 18, 2004, pp. 491-503.

204

Naaman, A.E., and Jeong, S.M. “Structural Ductility of Concrete Beams Prestressed with FRP Tendons,” Proc., 2nd Int. RILEM Symp. (FRPRXS-2), Non-Metric (FRP) Reinforcement for Concrete Structures, RILEM, Bagneux, France, 1995, pp. 379-386.

Nanni, A., Al-Zaharani, M.M., Al-Dulaijan, S.U., Bakis, C.E., and Boothby, T.E., “Bond

of FRP Reinforcement to Concrete-Experimental Results,” Proceedings of the Second Int. RILEM Symp. (FRPRCS-2), L. Taerwe, ed., 1995, pp. 135-145.

Park, R., and Paulay, T., Reinforced Concrete Structures, John Wiley & Sons, 1976, 769

pp. Potter, R., and Ho, D., “Quality of Cover Concrete and Its Influence on Durability,”

Concrete Durability, Katharine and Bryant Mather, International Conference, SP100, American Concrete Institute, Detroit, 1987.

Rasheeduzzafar, A., Dakhil, F., Basa, M., and Khan, M., “Performance of Corrosion-

Resisting Steels in Chloride-Bearing Concrete,” ACI Materials Journal, Vol. 89, No. 5, September-October 1992, pp. 439-448.

Rehm, G., and Eligehausen, R., “Bond of Ribbed Bars under High Cycle Repeated

Loads,” ACI Journal, Vol. 76, No. 2, February 1979, pp. 297-309. RILEM 7-II-128 (Réunion Internationale des Laboratoires et Experts des Matériaux,

Systèmes de Constructions et Ouvrages), “RC6: Bond Test for Reinforcing Steel. 1. Pull-Out Test,” RILEM Technical Recommendations for the Testing and Use of Construction Materials, E & FN Spon, U.K. 1994, pp.102-105.

Salib, S.R., and Abdel-Sayed, G., “Prediction of Crack Width for Fiber-Reinforced

Polymer-Reinforced Concrete Beams,” ACI Structural Journal, Vol. 101, No. 4, July-August 2004, pp. 532-536.

Schutte, C.L., “Environmental Durability of Glass-Fiber Composites,” Materials Science

and Engineering, Vol. 13, No.7, 1994, pp. 265-324. Sekijima, K., Otsuka, Y., and Konno, T., “Durability of Fiber Reinforced Polymer

Reinforcement Embedded in Concrete,” Fourth International Symposium on Fiber Reinforced Polymer Reinforced Concrete Structures, SP-188, American Concrete Institute, Farmington Hills, Michigan, 1999, pp. 501-513.

Sen, R., Mariscal, D., and Shahawy, M., “Durability of Fiberglass Prestensioned Beams,”

ACI Structural Journal, Vol. 90, No. 5, September-October 1993, pp. 525-533. Sen, R., Shahawy, M., Sukumar, S., and Rosas, J., “Durability of Carbon Fiber

Reinforced Polymer (CFRP) Pretensioned Elements under Tidal/Thermal Cycles,” ACI Structural Journal, Vol. 96, No. 3, May-June 1999, pp. 450-457.

205

Standard Specifications for Highway Bridges, 16th ed., American Association of State Highway and Transportation Officials, Washington, D.C., 1996.

Status of the Nation's Highways, Bridges, and Transit: 2002 Conditions and Performance

Report. http://www.fhwa.dot.gov/policy/2002cpr/highlights.htm. Accessed July, 2004.

Tannous, F.E., and Saadatmanesh, H., “Environmental Effects on the Mechanical

Properties of E-Glass FRP Rebars,” ACI Materials Journal, Vol. 95, No.2, March-April 1998, pp. 87-100.

Theriault, M., and Benmokrane, B., “Effects of FRP Reinforcement Ratio and Concrete

Strength on Flexural Behavior of Concrete Beams,” Journal of Composites for Construction, Vol. 2, No. 1, February 1998, pp. 7-16.

Thorenfeldt, E., Tomaszewicz, A., and Jensen, J.J., “Mechanical Properties of High-

Strength Concrete and Application in Design,” Proceedings of the Symposium “Utilization of High Strength Concrete,” Stavanger, Norway, June 1987, Tapir, Trondheim, pp. 149-159.

Tighiouart, B., Benmokrane, B., and Gao, D., “Investigation of Bond in Concrete

Member With Fiber Reinforced Polymer (FRP) Bars,” Construction and Building Materials, Vol. 12, No. 8, December 1998, pp. 453-462.

Toutanji, H. A., and Saafi, M., “Flexural Behavior of Concrete Beams Reinforced with

Glass Fiber-Reinforced Polymer (GFRP) Bars,” ACI Structural Journal, Vol. 97, No. 5, September-October 2000, pp. 712-719.

Uomoto, T., and Nishimura, T., “Deterioration of Aramid, Glass, and Carbon Fibers Due

to Alkali, Acid, and Water in Different Temperatures,” Fourth International Symposium on Fiber Reinforced Polymer for Reinforced Concrete Structures, SP-188, American Concrete Institute, Farmington Hills, Michigan, 1999, pp. 515-522.

Vijay, P.V., and GangaRao, H.V.S., “Bending Behavior and Deformability of Glass-

Fiber-Reinforced Polymer Reinforced Concrete Members,” ACI Structural Journal, Vol. 98, No. 6, November-December 2002, pp. 834-842.


Recommended