CIES 03-40 Strengthening of Masonry: Opportunities and Challenges in the Use of Composites By Marco Casareto Alessandro Oliveri Alessandro Romelli University of Missouri-Rolla CENTER FOR INFRASTRUCTURE ENGINEERING STUDIES
Transcript
����� �
CIES 03-40
Strengthening of Masonry: Opportunities and Challenges in the Use of Composites
By
Marco Casareto Alessandro Oliveri Alessandro Romelli
University of Missouri-Rolla
CENTER FOR INFRASTRUCTURE ENGINEERING STUDIES
UNIVERSITA’ DEGLI STUDI DI GENOVA
FACOLTA’ DI INGEGNERIA
Dipartimento di Ingegneria Strutturale e Geotecnica
D.I.S.E.G.
U.M.R. - University of Missouri - Rolla, U.S.A.
FACULTY OF ENGINEERING
Center for Infrastructure Engineering Studies
C.I.E.S.
TESI DI LAUREA
Strengthening of Masonry: Opportunities and Challenges in the Use of Composites
- Rinforzo della Muratura: Campi di Applicazione e Prospettive
nell’Utilizzo dei Materiali Compositi Relatori: Chiar.mo Prof. Ing. Sergio Lagomarsino Chiar.mo Prof. Ing. Antonio Nanni Correlatore: Ph.D. Gustavo Jaime Tumialan Candidati: Marco Casareto Aprile 2002 Alessandro Oliveri Alessandro Romelli
2
Disclaimer
The contents of this report reflect the views of the author(s), who are
responsible for the facts and the accuracy of information presented herein. This
document is disseminated under the sponsorship of the Center for Infrastructure
Engineering Studies (CIES), University of Missouri -Rolla, in the interest of
information exchange. CIES assumes no liability for the contents or use thereof.
3
The mission of CIES is to provide leadership in research and education for solving society's problems affecting the nation's infrastructure systems. CIES is the primary conduit for communication among those on the UMR campus interested in infrastructure studies and provides coordination for collaborative efforts. CIES activities include interdisciplinary research and development with projects tailored to address needs of federal agencies, state agencies, and private industry as well as technology transfer and continuing/distance education to the engineering community and industry.
Center for Infrastructure Engineering Studies (CIES) University of Missouri-Rolla
223 Engineering Research Lab 1870 Miner Circle
Rolla, MO 65409-0710 Tel: (573) 341-6223; fax -6215
4.2. Bond Characterization ________________________________________ 82 4.2.1. Test Specimens ____________________________________________ 82 4.2.2. Test Setup ________________________________________________ 87 4.2.3. Test Results_______________________________________________ 89 4.2.4. Strain Data _______________________________________________ 92 4.2.5. Analitycal Work ___________________________________________ 98 4.2.6. Conclusions______________________________________________ 107 4.2.7. Design __________________________________________________ 107
4.3. Durability of Putty and Its Characterizazion With and Without Fillers 109 4.3.1. Background______________________________________________ 109 4.3.2. Test Specimens ___________________________________________ 109 4.3.3. Durability _______________________________________________ 119 4.3.4. Conclusions______________________________________________ 130
4.4. Bond Test Controlling the Thickness of Putty ____________________ 131 4.4.1. Test Specimens ___________________________________________ 132 4.4.2. Test Setup _______________________________________________ 134 4.4.3. Test Results______________________________________________ 135 4.4.4. Conclusions______________________________________________ 136
5. INFLUENCE OF ARCHING MECHANISM IN MASONRY WALLS STRENGTHENED WITH FRP LAMINATES __________________________ 137
7.2. Tensioning and Anchor Devices ________________________________ 215
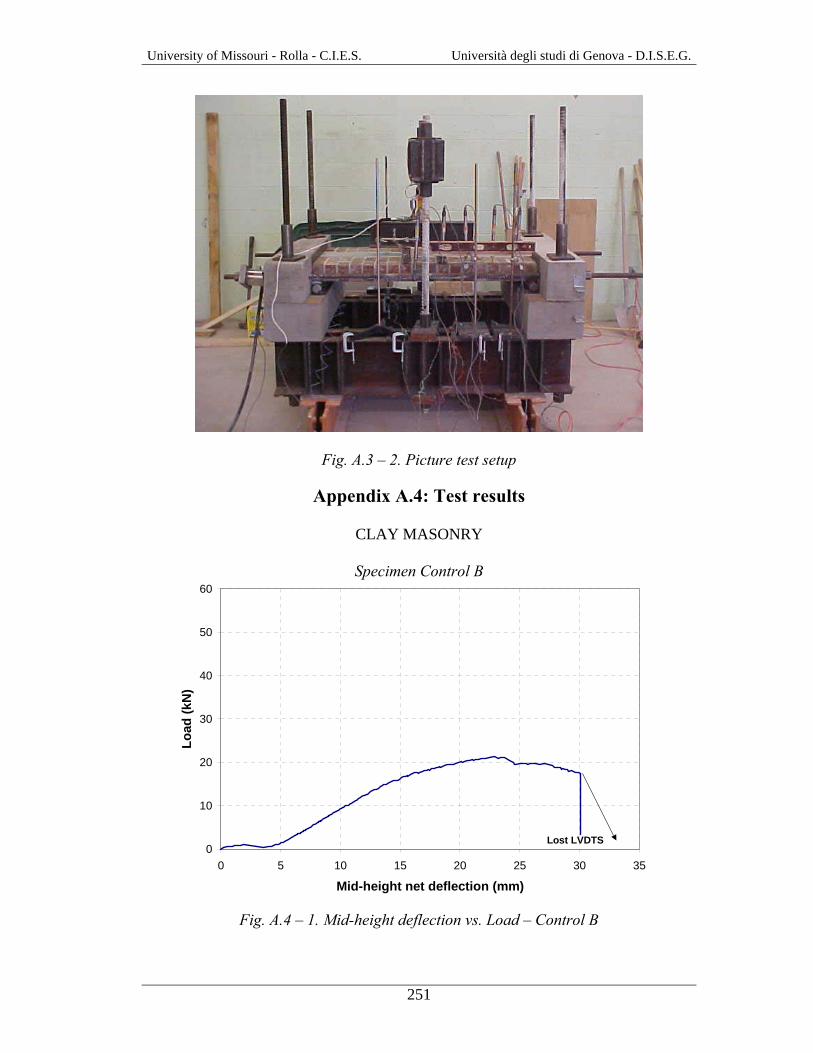
7.3. Test Setup __________________________________________________ 224
7.4. Test Results_________________________________________________ 225
7.5. Validation of the System ______________________________________ 226 7.5.1. Test Setup _______________________________________________ 227 7.5.2. Test Results______________________________________________ 229
University of Missouri - Rolla - C.I.E.S. Università degli studi di Genova - D.I.S.E.G.
III
University of Missouri - Rolla - C.I.E.S. Università degli studi di Genova - D.I.S.E.G.
1
SOMMARIO L’elaborato di tesi dal titolo: “Strengthening of masonry: opportunities and
challenges in the use of composites / Rinforzo della muratura: campi di applicazione
e prospettive nell’utilizzo dei materiali compositi” è stato svolto nell’ambito di un
programma a carattere sperimentale dell’Università del Missouri – Rolla (USA),
utilizzando i laboratori del dipartimento di Ingegneria Civile C.I.E.S. (Center for
Infrastructure Engineering Studies) diretti dal Prof. Ing. Antonio Nanni. Per questo
motivo esso è presentato interamente in lingua inglese.
Con i test sperimentali svolti non ci si è limitati allo studio di una sola problematica
riguardante il rinforzo delle murature, ma si è cercato di sviluppare più argomenti al
fine di fornire una metodologia di progettazione e di realizzazione del rinforzo nel
campo del recupero e del mantenimento delle opere in muratura. Tutto questo è stato
possibile grazie alle enormi potenzialità dell’Università Americana che ha permesso
di disporre appieno di attrezzature, laboratori, materiali e mano d’opera, ma
soprattutto grazie all’appoggio di una organizzazione pressoché perfetta.
La tesi ha avuto quindi un carattere prettamente sperimentale con lo sviluppo di
modelli teorici di interpretazione per i risultati ottenuti. Questo sommario vuole
essere un breve riepilogo del lavoro presentato nei seguenti capitoli.
Sono state affrontate le seguenti problematiche:
• Sperimentazione su murature rinforzate con FRP soggette a forze agenti nel
piano
• Sperimentazione su murature rinforzate con FRP soggette a forze agenti fuori
dal piano
• Invenzione di un nuovo metodo di post-tensione per barre termoplastiche in
fibra di vetro al fine di sostituire, nel campo del rinforzo, le catene in acciaio
• Studio dell’aderenza sviluppata tra gli FRP e la muratura
• Prove di durabilità inerenti i materiali utilizzati per l’applicazione dei
materiali compositi
University of Missouri - Rolla - C.I.E.S. Università degli studi di Genova - D.I.S.E.G.
2
La comunità internazionale degli ingegneri ha individuato nel collasso di murature
non rinforzate una delle maggiori cause di danni materiali e perdite di vite umane in
occasione di eventi sismici. Le convenzionali tecniche di rinforzo sono generalmente
invasive ed apportano un notevole incremento delle masse, aumentando così le forze
sismiche ed il peso complessivo della struttura. Inoltre, queste tecniche, richiedono
tempi di installazione lunghi che non permettono l’immediata messa in sicurezza
dell’edificio. E’ quindi necessario sviluppare metodologie di rinforzo strutturale
affidabili, durabili e di veloce installazione.
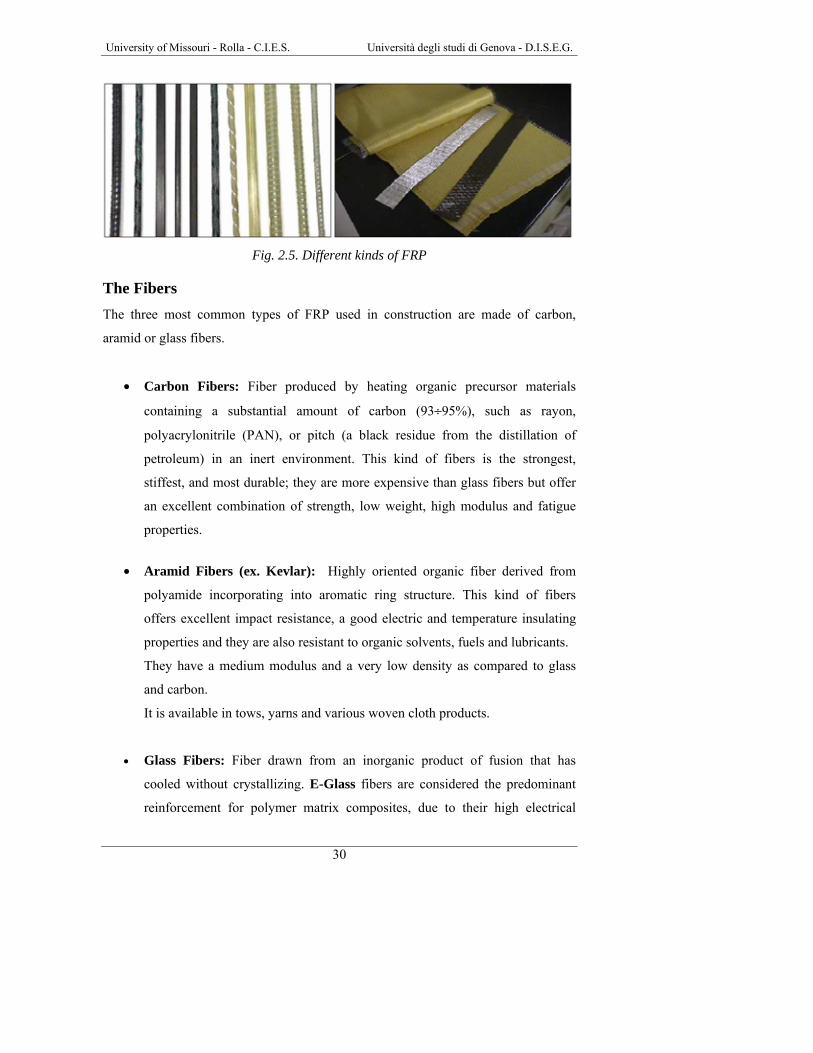
Gli FRP appartengono alla vasta famiglia dei “compositi strutturali”, ossia, di quei
materiali costituiti da due o più fasi di cui almeno una - il rinforzo - è presente in
forma discontinua ed è caratterizzata da elevate prestazioni meccaniche, mentre
l’altra - la matrice - è identificabile come un elemento continuo e meccanicamente
più debole (capitolo 2). Nel settore delle costruzioni si è assistito, nell’ultima decade,
ad un notevole incremento dell’utilizzo di compositi strutturali a matrice polimerica.
In Giappone, paese che per primo ha eseguito sperimentazioni e realizzato
applicazioni pratiche di materiali FRP in edilizia, il consumo delle fibre per uso
strutturale è passato dalle 6 tonnellate del 1993 alle 250 tonnellate del 1997. Analogo
andamento è stato registrato negli ultimi anni negli Stati Uniti, altro paese trainante
nell’utilizzo degli FRP nel campo delle costruzioni. Il maggiore utilizzo degli FRP
nell’edilizia, come si è accennato precedentemente, riguarda essenzialmente il settore
del restauro statico delle strutture degradate o danneggiate e, in particolare, quello
dell’adeguamento sismico. Le fibre più adatte ad essere utilizzate nel restauro delle
strutture in cemento armato sono quelle in carbonio a media-alta resistenza e medio-
alto modulo elastico. Le fibre di aramide e, ancor di più quelle in vetro, trovano un
utilizzo più limitato nelle strutture in cemento armato a causa del loro più basso
modulo elastico e alla conseguente minore capacità di assumere carichi, a parità di
deformazioni impresse. Il loro impiego risulta essere più estensivo ed appropriato nel
campo della riqualificazione degli edifici in muratura dove un modulo elastico
particolarmente elevato non costituisce un’esigenza primaria e può, invece,
rappresentare, in alcuni casi, una problematica. Inoltre, un aspetto non trascurabile, è
che le fibre di aramide e di vetro hanno costi notevolmente inferiori rispetto a quelle
University of Missouri - Rolla - C.I.E.S. Università degli studi di Genova - D.I.S.E.G.
3
in carbonio e sperimentazioni sui muri rinforzati con questo tipo di compositi hanno
mostrato notevoli incrementi in resistenza e duttilità.
I principali vantaggi degli FRP rispetto ai materiali tradizionali si possono riassumere
in: leggerezza, alto rapporto resistenza/peso specifico, durabilità in ambienti umidi ed
aggressivi, velocità di installazione, possibilità di adattarsi a superfici curve (capitolo
2). I compositi strutturali vengono utilizzati nel restauro delle costruzioni sotto forma
di tessuti unidirezionali o pluridirezionali che vengono impregnati direttamente in
opera (wet-lay-up, capitolo 3), oppure sotto forma di elementi rigidi già impregnati
con la resina, ottenuti per mezzo di un processo industriale di estrusione che prende il
nome di pultrusione (capitolo 3). I pultrusi vengono utilizzati sottoforma di piastre o
di barre cilindriche che vengono inserite nella struttura da restaurare mediante metodi
come quello delle Near Surface Mounted Rods (capitolo 3).
Per quanto la letteratura tecnica abbondi di ricerche eseguite in laboratorio e sul
campo, non esiste ancora una conoscenza sufficientemente attendibile sui modelli di
comportamento di elementi compressi o inflessi rinforzati con fasce o barre di FRP,
soprattutto nel campo delle murature. Conoscenza che deve tenere conto di diversi
fattori che possono influenzare gli FRP quali, ad esempio, quelli trattati nel presente
elaborato, ovvero: la delaminazione dei laminati prima della rottura delle fibre stesse
(capitolo 4), l’influenza delle condizioni di vincolo e della snellezza (rapporto
altezza/spessore) delle murature soggette a carichi fuori dal piano (capitoli 1 e 5), le
percentuali di rinforzo in grado di fornire un comportamento duttile ed un
contemporaneo aumento di resistenza alle murature soggette a carichi nel piano
(capitoli 1 e 6), la durabilità degli elementi costituenti la preparazione della superficie
per l’installazione dei laminati (capitolo 4).
L’utilizzo degli FRP può inoltre essere esteso anche ad altri interventi, quali per
esempio la sostituzione di catene in acciaio per operazioni di post-tensione. Il
materiale tradizionalmente usato in questo tipo di applicazioni è appunto l’acciaio, al
cui utilizzo sono connessi problemi legati a fenomeni quali: creep, rilassamento,
invecchiamento e corrosione. La post-tensione richiede la creazione di ancoraggi alle
estremità delle barre per trasmettere lo stato di tensione e nel caso delle barre in FRP
quest’aspetto costituisce il problema principale.
University of Missouri - Rolla - C.I.E.S. Università degli studi di Genova - D.I.S.E.G.
4
La tecnica di post-tensione proposta nella tesi (capitolo 7), utilizza barre
termoplastiche in fibra di vetro (GFRP) mediante particolari dispositivi di ancoraggio
in grado di ridurre i problemi connessi alla durabilità e all’invecchiamento e di
garantire un miglior comportamento strutturale d’insieme grazie al basso modulo di
elasticità, molto più vicino a quello delle murature. L’efficacia di questa tecnica è
stata dimostrata mediante prove sperimentali di laboratorio.
Per ogni argomento affrontato all’interno del seguente elaborato sono fornite
conclusioni e raccomandazioni per lavori futuri.
Nota: Il lavoro esposto nell’elaborato di tesi ha già ottenuto i seguenti riconoscimenti
scientifici:
• 8-11 Giugno 2001: “National Science Foundation Industry meeting”,
University of Missouri Rolla. Esposizione dei lavori svolti e riportati nei
capitoli 4-5 e 7.
• 29-31 Maggio 2002: “Durability of fiber reinforced polymer (FRP)
composites for construction”, Hotel Delta Centre Ville, Montréal Québec
(Canada), esposizione dell’articolo titolato “Tensile Characterization and
Durability of Putty Used for Externally Bonded FRP Strengthening”.
• 10-12 Giugno 2002: “Third international conference on composites in
infrastructure , ICCI 2002”, San Francisco (California), esposizione
dell’articolo titolato “Influence of Arching Mechanism in Masonry Walls
Strengthened with FRP Laminates”.
• Il giornale “L’edilizia” ha chiesto di pubblicare l’articolo dal titolo:
“L’Utilizzo di Barre Termoplastiche in FRP negli Interventi di Riabilitazione
Strutturale” in uno dei suoi prossimi numeri.
• Per il metodo di ancoraggio proposto nel capitolo 7 è stata inoltrata domanda
di brevetto internazionale.
University of Missouri - Rolla - C.I.E.S. Università degli studi di Genova - D.I.S.E.G.
5
ABSTRACT The worldwide engineering community has identified failures of Unreinforced
masonry (URM) walls as one of the major causes of material damage and loss of
human life due to seismic events. Therefore, the development of effective and
affordable retrofitting techniques for masonry members is an urgent need. To date,
previous works on URM and reinforced masonry walls strengthened with fiber
reinforced polymeric (FRP) materials have shown notable increases in capacity and
ductility. Unfortunately, field applications involving the use of FRP laminate on
masonry members may be carried out even if not supported by rigorous experimental
background. The cause of that is the implicit assumption that the high performances
of FRP should always benefit a compromised structural situation. Part of the present
experimental programs (i.e. bond tests, out-of-plane behavior with arching effect, in-
plane behavior) shows the detrimental effects produced by inaccurate design.
Conclusions and recommendations are provided for all the studied issues.
Use of FRP materials is not limited to strengthen walls subjected to out-of-plane and
in-plane loads, but can be in the form of tendons in pre-stressing applications. This
could be a new fronteer for the FRP materials because of advantages over steel
tendons such as light weight, resistance to corrosion, lower or higher elastic modulus
etc. A major problem facing the use of FRP in pre-stressing applications is the
anchorage. The new anchor system showed in section 7 demonstrated that FRP can be
succefully used for the postensioning of masonry in substitution of steel.
A technical obstacle preventing the extended use of FRP materials in construction is a
lack of long-term and durability performance data comparable to the body of
knowledge available for traditional construction materials. A durability test was
conducted as part of this thesis on a type of putty (used to prepare the surface) to
demonstrate the implications of this concern.
University of Missouri - Rolla - C.I.E.S. Università degli studi di Genova - D.I.S.E.G.
6
University of Missouri - Rolla - C.I.E.S. Università degli studi di Genova - D.I.S.E.G.
7
1. INTRODUCTION
1.1. General Masonry is one of the oldest construction materials. For thousand years masonry was
the predominant building material until modern materials such as concrete, steel and
wood appeared in the nineteenth century. Masonry constitutes approximately 70% of
the existing building inventory in the United States. Most of these buildings possess
unreinforced masonry (URM) walls. URM buildings have features that can threaten
human integrity. Structural weakness, overloading, dynamic vibrations, settlement,
in-plane and out-of-plane overstresses can cause failure of masonry structures.
Organizations such as the Federal Emergency Management Agency (FEMA) and The
Masonry Society (TMS) in the United States have identified that failure of URM
walls results in most of the material damage and loss of human life. Figure 1.1
illustrates the collapse of URM walls due to out-of-plane and in-plane loads after the
earthquake in Izmit, Turkey in 1999. These kinds of failure are a potential threat to
bystanders.
(a) Out-of-plane failure (b) In-plane failure
Fig. 1.1. Failure of URM walls In 1986 a building evaluation carried out in the state of California, U.S.ci on URM
buildings showed that 96% of these needed to be retrofitted, which would result in
approximately $4 billion in retrofit expenditures. To date, it has been estimated that
only half of the owners have taken remedial actions, which may be attributed to high
University of Missouri - Rolla - C.I.E.S. Università degli studi di Genova - D.I.S.E.G.
8
retrofitting costs. Thereby, the development of an effective and affordable retrofitting
technique for masonry elements is an urgent need.
In the United States there are three typical masonry walls:
• Panel walls
• Curtain walls
• Bearing walls
Panel walls
Panel walls are single-story walls and are common façade elements in buildings
conformed by frames or steel or reinforced concrete. These kinds of walls consist of
two whytes separated by at least 50.8 mm (2 inches) air space, commonly referred to
as cavity walls. The air space in the cavity improves the thermal performance of the
wall, which can be enhanced by inserting insulation in the cavity. In most
applications the inner wythe supports the weight of floors and the outer is non load
bearing. These walls may also consist of single wythe or multiple wythes in contact
with each other (composite walls).
When built in reinforced concrete (RC) or steel frames, these walls are called infill
walls and they protect the interior from the external environment. Infill walls can be
subjected to in-plane loads caused by their interaction with the surrounding frame.
Due to vertical spans of 3.3 m (11 feet) or less, panel walls can satisfactorily resist
out-of-plane loading and are generally unreinforced. However, during a seismic
event, excessive damage due to in-plane seismic loading can lead to significant
stiffness reduction in the lateral direction making, therefore, these walls susceptible to
out-of-plane collapse.
Curtain walls
Curtain walls are multi-story walls that also resist out-of-plane loads due to
earthquake or wind. If a single wythe is used, horizontal steel, in the form of welded
reinforcement, is placed in the mortar joints to increase the resistance. This kind of
construction is commonly referred to as “partially reinforced”.
University of Missouri - Rolla - C.I.E.S. Università degli studi di Genova - D.I.S.E.G.
9
Bearing walls
Bearing walls are arranged at fairly uniform spacing to resist out-of-plane loads, in-
plane loads and vertical loads from self–weight and upper derived from floor areas.
Cavity and composite walls can also lie on this category. Depending on the load
solicitations, bearing walls can be unreinforced or reinforced.
Masonry in backup walls
Commonly two different masonry units are found in backup or inner walls; clay tiles
and concrete units. A clay tile is a hollow unit, which is characterized by possessing
parallel cores and thin webs and faceshells. Clay materials were mixed with water to
create a homogeneous mass and then formed into brick units by pressing into a mold.
Structural clay tiles have been first manufactured in the United States approximately
since 1875.
In the beginning, structural tile was used in building floors and as fireproofing
material for steel frame constructions. Due to its lightweight, large unit size and ease
of handling during constructions, the use of clay tiles was extended to load-bearing
walls, wall facings, silos, columns, etc.
In the early 1900’s, structural clay tiles were used in infill walls throughout the
United States.
Some notable structures where it is possible to observe this kind of construction are
the New York Chrysler building (New York) and the Los Angeles City Hall Building
(California).
University of Missouri - Rolla - C.I.E.S. Università degli studi di Genova - D.I.S.E.G.
10
Fig. 1.2. Los Angeles City Hall Building (California)
Today, the whole brickmaking process (mining, forming, drying, firing, cooling and
delivery) is highly mechanized and can be completed in less than a week.
Can be observed that the production of clay tiles decreased during the 1960’s, when
concrete units began to be widely used. It is important to point out that the use of
concrete units was not new in the United States. Concrete blocks were first
manufactured in the United States at about the turn of the 20th century in small one-at-
a-time machine that could be operated by hand. Using this kind of machine, the
production was limited to 10 blocks per man-hour. Concrete blocks were not widely
used until the 1920’s when the manufacturing process was improved; however due to
the recession many plants had close or merge. It was not until the 1960’s that the
market started to change. This change is attributed to the automation of plant
equipment, which increased the production capability of concrete blocks. The
manufacturing process of concrete units allowed a better quality control of the
products and also concrete units showed more uniformity since they were not fired
during their fabrication. Also, the brittle characteristics of clay tiles when being
handled and transported increased the demand of concrete units. Modern concrete
blocks are generally manufactured by vibrating a mixture of Portland cement, sand
and aggregate in a mold under pressure, curing with low-pressure or high-pressure
steam and then, in some cases, exposing them to carbon dioxide in the curing
chamber to reduce subsequent shrinkage of the units. To date there is a large use of
concrete blocks inside the USA, for different kinds of buildings.
University of Missouri - Rolla - C.I.E.S. Università degli studi di Genova - D.I.S.E.G.
11
1.2. Problem Statement: Out-of-Plane and In-Plane Behavior of URM Walls Out-of-plane behavior Masonry walls may be subjected to out-of-plane loads. These walls are referred to as
flexural walls since the mode of deformation is primarily flexure with little or no
externally applied load. The load can be permanent, such as earth pressure against a
retaining wall or basement wall or they can be transient, such as wind or earthquake.
Walls must be also sufficiently robust to not cause disproportionate amounts of
damage or failure. In ancient masonry buildings walls were generally thick enough
that flexural stresses from the lateral load were much lower than axial compressive
stresses from self-weight and other gravity loads. To date, the tensile strength of
masonry has become upon to provide flexural resistance to out-of-plane loads.
The load-resisting mechanisms for the unreinforced masonry walls depend on the
tensile strength of masonry, in-plane compressive strength, boundary conditions and
slenderness ratio (height/thickness).
Walls that are simply supported and span in only the vertical direction must resist
lateral action by bending action. The bending capacity is directly related to the axial
compression and the moment capacity is different if the flexural tensile strength of
masonry is taken in account or no. If the tensile strength is neglected (figure 1.3a), the
bending capacity is directly related to the axial compression and the moment capacity
is:
M = fa S
Where:
fa = axial compressive stress = P/An
An = effective mortar bedded area
S = section modulus for out-of-plane bending
If the tensile strength of masonry can be taken in account (figure 1.3b) the
moment capacity becomes:
M = (fa + ft’)S
University of Missouri - Rolla - C.I.E.S. Università degli studi di Genova - D.I.S.E.G.
12
Where:
ft’ = flexural tensile strength normal to bed joints.
Note: fm’ = maximum compressive strength of the masonry Fig. 1.3. Flexural behavior of unreinforced section (linear elastic material)
When the tensile stress reaches the limiting tensile strength, this is usually defined as
the flexural tensile capacity. However, if cracking is allowed additional lateral load
can be applied.
When a wall is built between supports that restrain the outward movement, axial
compressive forces accompanied by the shear forces (Fv and Fh in figure 1.4) are
induced as the wall bends. The in-plane compression forces can delay cracking. After
cracking the so-called arching action can be observed, which in many cases increases
several times the capacity of the wall. Analysis (L.R. Baker, 1978; A.W. Hendry,
1981) have shown that the induced forces can increase the cracking load by a factor
of about 2.5 if the end supports are completely rigid.
(a) (b)
University of Missouri - Rolla - C.I.E.S. Università degli studi di Genova - D.I.S.E.G.
13
Fig. 1.4. Wall subjected to Arching Effect (Scheme)
Investigations have shown that the resultant force between Fv and Fh (Fr in figure 1.4)
could cause the fracture of the corner. It has been reported also that for slenderness
ratio (h/t) larger than 20, the arching action is small (Angel et al., 1994).
Once that the wall has been cracked at mid-height, it can be assumed that the two
resulting segments can rotate as rigid bodies like shown in figure 1.4, forming a three
hinged arch.
Analyzing the top segment of the wall, the following consideration can be derived:
Being BC equal to B’C’ for simple geometric considerations (figure 1.5) the arm for
the resistance moment (figure 1.6) can be assumed, for very small angle θ, equal to:
0a − ∆
University of Missouri - Rolla - C.I.E.S. Università degli studi di Genova - D.I.S.E.G.
14
Fig. 1.5. Geometric considerations for the top segment of the wall
Fig. 1.6. Free body diagram of upper part of the wall Where:
P = out-of-plane-load
Pv = clamping force
PV
P/2
PV
P/2 θ
∆ο
h/2
t
a
b
f 'm
o
University of Missouri - Rolla - C.I.E.S. Università degli studi di Genova - D.I.S.E.G.
15
h = height of the wall
t = thickness of the wall
a = arm distance between clamping forces
b = bearing width
∆0 = wall deflection
fm’ = compressive strength of masonry
Taking moment about “O” can be calculated the equilibrium that is:
v oP h P (a )2 2
⋅ = ⋅ − ∆
So, the out-of-plane force allows on the wall is:
v 04 P (a )Ph
⋅ − ∆=
In general the wall behavior can be controlled by crushing of the mortar joints in the
boundary regions. However, in the case of walls built with masonry units with brittle
characteristics such as clay tiles, the wall behavior can be controlled by fracture of the
units (Tumialan, 2001).
If a masonry wall is separated from the top by a small gap due to poor construction,
wall shrinkage etc., arching can still develop, but to a lesser extent.
University of Missouri - Rolla - C.I.E.S. Università degli studi di Genova - D.I.S.E.G.
16
In-Plane Behavior of Infill Walls Masonry walls are widely used as interior partitions within steel and RC frame
structures as exterior walls to form part of the building envelope. For the latter case,
depending on design considerations, the infill walls may or not may resist to lateral
and vertical loads. In order to simplify the design, the potential interaction between
the infill walls and the structural frame has been ordinarily ignored. Ignoring the
contribution of the masonry infill walls does not always represent a conservative
design. Their presence can lead to stiffening their frames (Sabnis, 1976) and thereby
cause a redistribution of the lateral loads in the building plan.
Fig. 1.7. Load deflection curves of frames with and without infill walls (Sabnis)
Infill walls can be totally enclosed in a surrounding frame of beams and columns, as
typical in a multi story building. These walls can be subjected to high in-plane loads
during exceptional events such as high wind or earthquake. These loads are due to the
interaction between the infill walls and the surrounding structural frames. Previous
investigations (Sabnis, 1976) have demonstrated that the composite action between
the masonry infill and the surrounding frame is depending on the level of the in-plane
load, degree of bond or anchorage at the interfaces and geometric and stiffness
characteristics of the two components. At very low levels of lateral load, a full
composite action between the infill wall and the frame is observed (Figure 1.8).
University of Missouri - Rolla - C.I.E.S. Università degli studi di Genova - D.I.S.E.G.
17
Fig. 1.8. Full composite action between frame and infill panel As the load increases, deformations increase and separation between the wall and the
frame takes place except in the vicinity of the two corners where compression forces
are transmitted through the wall. This leads the formation of a diagonal compression
strut (Figure 1.9).
Fig. 1.9. Diagonal compression strut
Full contact
Diagonal compression
Diagonal tension
University of Missouri - Rolla - C.I.E.S. Università degli studi di Genova - D.I.S.E.G.
18
This resulting structural system is usually analyzed as a truss. The stiffness of the
infill starts decreasing once cracking is developed.
Alternatively, the wall may fail in shear along a bed joint rather than by diagonal
compression. This could happen at a lower load level as compared to the load causing
the latter mentioned failure. The formation of the shear crack separates the panel into
two parts and the behavior in this case is controlled by either the flexural or shear
capacity of the columns. This failure mechanism is commonly know as Knee Brace or
Joint Slip (Figure 1.10).
Fig. 1.10. Joint-Slip failure
1.3. Problem Statement: Post Tensioning of Masonry During their life walls could show cracks due to past seismic events or differential
settlement that compromise the building stability and aesthetic sense. Pre-stressing
forces are used in masonry to reduce or eliminate tensile stresses due to externally
applied loads or to close the cracks caused by passed events by using controlled
University of Missouri - Rolla - C.I.E.S. Università degli studi di Genova - D.I.S.E.G.
19
precompression. The precompression is generated by prestressing tendons, either
bars, wires, or strands, that are contained in openings in the masonry, which may be
grouted. The prestressing tendons can be pre-tensioned (stresses against external
abutments prior to placing the masonry), or post-tensioned (stresses against the
masonry after it has been placed). Internal pre tensioning has been used successfully
to increase strength and provide ductility to existing URM masonry structures. In
situations where internal pre-tensioning is not feasible, post-tensioning of URM
masonry is often a viable option. Most construction application to date have involved
post-tensioned. The prestressing bars or strands can be installed in pairs on opposite
sides of a wall so that out-of-plane bending is not introduced. Figure 1.11 illustrates
an example of the use of external horizontal post-tensioning to improve the structural
integrity and resistance to lateral loads in a masonry building.
Fig. 1.11. Use of external prestressing for strengthening masonry buildings
Effective prestress is not a fixed quantity over time. Research had shown that the the
loss and the gain of prestress in masonry is extensive and it is due to phenomena such
as creep, shrinkage, moisture expansion, deformations of the masonry, and
prestressing-tendon stress relaxation.
University of Missouri - Rolla - C.I.E.S. Università degli studi di Genova - D.I.S.E.G.
20
1.4. Conventional Retrofit Techniques Common retrofitting techniques with conventional methods can include internal
University of Missouri - Rolla - C.I.E.S. Università degli studi di Genova - D.I.S.E.G.
164
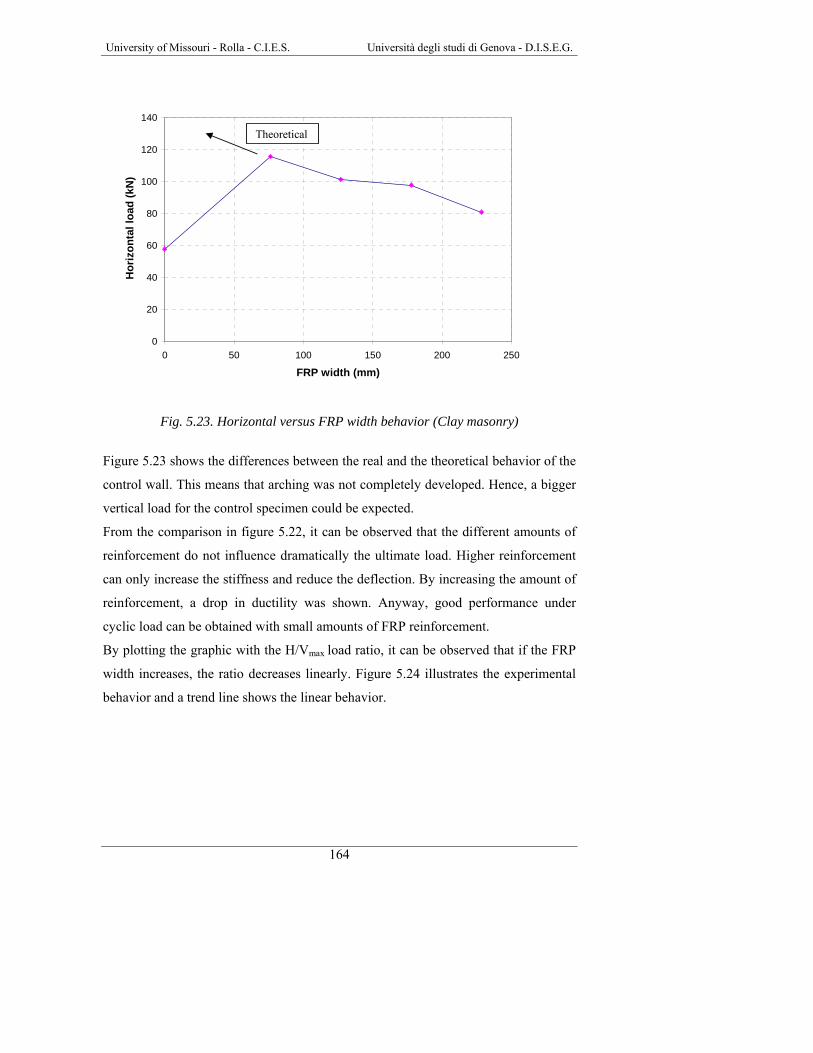
Fig. 5.23. Horizontal versus FRP width behavior (Clay masonry)
Figure 5.23 shows the differences between the real and the theoretical behavior of the
control wall. This means that arching was not completely developed. Hence, a bigger
vertical load for the control specimen could be expected.
From the comparison in figure 5.22, it can be observed that the different amounts of
reinforcement do not influence dramatically the ultimate load. Higher reinforcement
can only increase the stiffness and reduce the deflection. By increasing the amount of
reinforcement, a drop in ductility was shown. Anyway, good performance under
cyclic load can be obtained with small amounts of FRP reinforcement.
By plotting the graphic with the H/Vmax load ratio, it can be observed that if the FRP
width increases, the ratio decreases linearly. Figure 5.24 illustrates the experimental
behavior and a trend line shows the linear behavior.
0
20
40
60
80
100
120
140
0 50 100 150 200 250
FRP width (mm)
Hor
izon
tal l
oad
(kN
)Theoretical
University of Missouri - Rolla - C.I.E.S. Università degli studi di Genova - D.I.S.E.G.
165
Fig. 5.24. H/Vmax ratio in function of FRP width (Clay masonry) However, it can be noted that for H/Vmax ratio equal to 1.52, failure was due to shear-
compression behavior. It is reasonable to think an H/Vmax ratio limit for the reinforced
masonry (It caused by shear-compression failure).
Concrete masonry. Figure 5.25 shows a comparison among the concrete masonry
specimens.
Note: In specimen control C lost LVDTs close to ultimate load
Issues were not encountered to setup the tests. Figure 5.26 illustrates the horizontal
load versus FRP width behavior, close to the theoretical behavior.
Fig. 5.26. Horizontal versus FRP width behavior (Concrete masonry) From the comparison, it can be observed that the reinforcement does not influence
dramatically the ultimate load. By increasing the amount of reinforcement, a drop in
ductility was shown. Anyway, like for the clay masonry, good performance under
cyclic load can be obtained with small amounts of reinforcement. Plotting the graphic
with the H/Vmax load ratio, a linear behavior similar to the one obtained for clay
masonry can be observed (Figure 5.27).
0
20
40
60
80
100
120
140
160
0 50 100 150 200 250
FRP width (mm)
Hor
izon
tal l
oad
(kN
)
University of Missouri - Rolla - C.I.E.S. Università degli studi di Genova - D.I.S.E.G.
167
Fig. 5.27. H/Vmax ratio in function of FRP width (concrete masonry) However, like for clay masonry, it can be noted that for H/Vmax ratio equal to 1.10,
failure was due to shear-compression behavior. It is reasonable to think an H/Vmax
ratio limit for the reinforced masonry (It caused by shear-compression failure).
Comparing the load-deflection curves obtained in the case of simply supported walls
(Morbin, 2001) and walls with the end restrained, a significant influence of boundary
conditions in the wall is observed. Figure 5.28 shows the comparison between several
concrete specimens.
Fig. 5.28. Comp. among simply supported and restrained concrete specimens
0
0,5
1
1,5
2
2,5
3
3,5
4
4,5
0 50 100 150 200 250
FRP width (mm)
H/V
max
h/t ratio = 13.2
0
5
10
15
20
25
30
35
0 5 10 15 20 25 30 35
Mid-height net deflection (mm)
Ver
tical
load
(kN
)
Control (endrestrained)
W=76 mm (simplysupported)
W=127 mm (simplysupported)
W=76 mm (end-restrained)
W=127 mm (end-restrained)
Control (simply supported)
University of Missouri - Rolla - C.I.E.S. Università degli studi di Genova - D.I.S.E.G.
168
If the wall behaves as a simply supported element (i.e. large slenderness ratio or
upper end is not restrained), the FRP reinforcement is very effective since the wall is
in pure flexure and the crack openings are bridged by the reinforcement. In the case
of the simply supported unstrengthened specimens, the URM masonry wall collapsed
when the vertical load was about 3.1 kN (0.7 kips). Figure 5.28 shows that the
increase in the ultimate load for walls strengthened with 75 mm (3 in) and 125 mm (5
in) wide GFRP laminates were about 175 and 325% respectively. If the wall is
restrained (i.e. arching mechanism is observed), the same effectiveness of FRP
reinforcement is not observed because crushing of the masonry units at the boundary
regions controls the behavior. In this case, the increase in the out-of-plane capacity
for strengthened specimens with 75 mm (3 in) and 125 mm (5 in) wide GFRP
laminates was about 25%. Table 5.13 illustrates the effectiveness of FRP
reinforcement compared to the unstrengthened wall. Tab. 5.13. Effectiveness of FRP reinforcement for walls with arching
In order to compare all the values a V/Mmax ratio was chosen. This ratio is
representative of the behavior of the wall.
Figure 5.32 illustrates the behavior for the specimens tested.
Fig. 5.32. Comparison for all the specimens The figure 5.32 shows that there could be a limit for the V/Mmax ratio. It can be said
that there could be a limit of the amount of the FRP reinforcement beyond which the
behavior is governed by shear - compression failure.
0
0.001
0.002
0.003
0.004
0.005
0.006
0.007
0.008
0.009
0.01
0 0.1 0.2 0.3 0.4 0.5 0.6 0.7
ωf
V/M
max
[1/m
m]
DataPoli. (Data)
University of Missouri - Rolla - C.I.E.S. Università degli studi di Genova - D.I.S.E.G.
174
Design considerations
The interaction diagrams were plotted to find the ultimate experimental moment for
each kind of specimen, considering the hollow masonry units.
For design purposes this approach could be excessively rigorous, so, different
solutions were investigated.
In order to maintain the slenderness ratio, two different cross sections were
considered:
− A full section with unchanged dimensions
− An equivalent section with the same thickness and area of the hollow section,
with a reduced base calculated using the following equation:
beq=t
Ah
Where: Ah = area of the hollow cross section
t = thickness of the wall
Figure 5.33 illustrates the comparison among the different kinds of approaches
followed.
Fig. 5.33. Different approaches for design purposes From the figure 5.33 can be seen that the most conservative approach is the one with
the equivalent base.
Moment [Nmm]
Axi
al lo
ad [N
]
University of Missouri - Rolla - C.I.E.S. Università degli studi di Genova - D.I.S.E.G.
175
It must be also taken into account that in designing phase the ultimate strain for the
fiber should be limited to a value of εub = 0.8% (see also section 4) because of
debonding issues.
University of Missouri - Rolla - C.I.E.S. Università degli studi di Genova - D.I.S.E.G.
176
6. IN-PLANE BEHAVIOR OF MASONRY WALLS STRENGTHENED WITH FRP LAMINATES AND RODS
University of Missouri - Rolla - C.I.E.S. Università degli studi di Genova - D.I.S.E.G.
177
6.1. Previous Results
The results presented in this section correspond to previous investigations conducted
to study the in-plane behavior of masonry panels strengthened with FRP composites,
which were intended to represent infill walls.
Schwegler (1995) investigated strengthening methods for masonry shear walls. The
objectives of this study were to increase the system ductility, generate uniform crack
distribution, and increase the load carrying capacity of the system. The dimensions of
the walls were 3.66 m (12 ft) by 1.83 m (6 ft) by 0.2 m (8 in). CFRP sheets were
bonded diagonally to the masonry walls as shown in figure 6.1, and mechanically
anchored to the adjoining slabs.
CFRPLaminates
Fig. 6.1. Strengthened wall (Schwegler, 1995)
Fig. 6.2. Test results (Schwegler, 1995) As observed in figure 6.2, the test results showed that the strengthened wall exhibited
elastic behavior up to 70% of the maximum shear force. It was also observed that the
carrying capacity decreased as a consequence of massive crack formation in the
masonry. By comparing walls strengthened in one side and two sides, it was observed
University of Missouri - Rolla - C.I.E.S. Università degli studi di Genova - D.I.S.E.G.
178
that if only one side of the masonry wall is strengthened, the capacity could be
halved. In addition, the eccentricities caused by this strengthening scheme had a
minimum effect on the shear carrying capacity. In all the strengthened walls fine
cracks were observed perpendicular to the sheets. The crack separation was constant
and the crack widths remained small.
Laursen et.al. (1995) studied the shear behavior of masonry walls strengthened with
CFRP laminates. The walls were built with concrete blocks and were fully grouted.
The overall dimensions were 1.82 x 1.82 m (72 in x 72 in). The walls were internally
reinforced; horizontally with a low shear reinforcement ratio of 0.14%, and vertically
with a ratio of 0.54%. The “original” wall failed in shear. The specimen was re-
tested after being repaired. The repair was performed by closing the large diagonal
shear cracks with epoxy filler and epoxy injection, and repairing the crushed
compression toes with epoxy mortar. The “repaired” wall was then strengthened with
CFRP laminates, which covered the two sides of the wall; an additional layer was
applied in the end regions as confinement. The amount of strengthening in the
“retrofitted” wall was similar to the previous wall but applied to only one side of the
wall.
Fig. 6.3. Test results (Laursen, 1995)
It was observed that the presence of the FRP laminates improved the wall
performance by changing the failure from a shear-controlled failure to a flexural-
controlled failure. This change caused an increase in the capability of deformation of
approximately 100% by preventing a brittle failure mode. The test results of this wall,
shown in Figure 6.3, also proved that even though the wall failed in shear, it could be
University of Missouri - Rolla - C.I.E.S. Università degli studi di Genova - D.I.S.E.G.
179
repaired to restore the initial stiffness and strength compared to the standard of the
“original” and “retrofitted” walls.
Tinazzi et al. (2000) introduced the term Structural Repointing and investigated the
use of FRP rods to increase the shear capacity of masonry panels made of clay bricks.
This technology consisted of placing # 2 GFRP rods in grooved horizontal joints as
shown in Figure 6.4. The rods were embedded in an epoxy-based paste. The nominal
dimensions of the panels were 0.09 m by 0.61 m by 0.61 m (3.5 in by 24in by 24 in).
The failure of unreinforced panels consisted of the joint sliding along the compressed
diagonal. In contrast, strengthened with FRP rods at each joint, showed increases in
capacity of about 45% higher as compared to the unreinforced wall. The failure
mode changed since joint sliding was prevented. The mechanism of failure indicated
the sliding of the masonry-paste interface.
Fig. 6.4. GFRP rods in mortar bed joints (Tinazzi, 2000)
Morbin A. et al. (2001) conducted work on masonry panels built with concrete
masonry blocks strengthened with GFRP laminates and rods at the University of
Missouri - Rolla.
A total of six masonry walls were manufactured for this experimental program, which
were built with 15.24 cm by 20.32 cm by 40.64 cm (6 in by 8 in by 16 in) concrete
blocks following a running bond pattern. One Unreinforced Masonry (URM) wall,
COW1, was the control specimen. COW2 was strengthened with GFRP bars at every
horizontal joint only on one side. Walls COW2 and COW3 had similar amounts of
reinforcement. In the latter specimen, the reinforcement was distributed in the two
University of Missouri - Rolla - C.I.E.S. Università degli studi di Genova - D.I.S.E.G.
180
faces, following an alternate pattern, to observe the influence of the reinforcement
eccentricity. Wall COW4 was strengthened with GFRP bars at every second
horizontal joint to observe the behavior of a wall with half the amount of
strengthening. Wall 5 was strengthened with GFRP laminates; the amount of
strengthening reinforcement was equivalent to that of Wall 2 in terms of axial
stiffness EA (Modulus of Elasticity x Reinforcement Cross Sectional Area). Thus
four GFRP strips, 1.63 m (64 in) long and 0.1 m (4 in) wide, were applied on the
panel surface. Wall 6 was strengthened with a combination of GFRP bars and
laminates. The bars were placed in every horizontal joint, whereas, the laminates
were applied in the vertical direction. The amount of reinforcement for both
directions was similar in terms of EA; as for wall COW5, four strips 1.63 m (64 in)
long and 0.1 m (4 in) wide were cut. The test matrix used in this investigation for
Series COW is summarized in table 6.1. Tab. 6.1. Test matrix for Series COW (Morbin, 2001)
Specimen Strengthening Front Side Back Side Layout
COW1
None
None
None
FRONT F B
COW2
#2 GFRP bars
1HJ
None
F R O N T F B
Tab. 6.1. Test matrix (continued)
Specimen Strengthening Front Side Back Side Layout
University of Missouri - Rolla - C.I.E.S. Università degli studi di Genova - D.I.S.E.G.
181
COW3 #2 GFRP bars 2HJ 2HJ
FRONT F B
COW4 #2 GFRP bars 2HJ None
FRONT F B
COW5
4 in GFRP laminates 4HS None
FRONT F B
COW6 #2 GFRP bars
4 in GFRP laminates
1HJ/4VS None
FRONT F B
LEGEND: 1HJ= every horizontal joint, 2HJ= every second horizontal joint, 4HS=four horizontal glass strips @ 16 in o.c., 4VS= four vertical glass strips @ 16 in o.c.
The average compressive strength of concrete masonry obtained from the testing of
prisms was 16.74 MPa (2430 psi) with a standard deviation of 2.37 MPa (345 psi). In
order to determine the shear stresses along the mortar joints, two series of triplets
were tested. Cohesion and coefficient of friction according to Coulomb criterion,
expressed by the equation τ = τo+ µ σn, were obtained by means of linear
interpolation of the experimental data. Thus for concrete blocks it was found
τ = 57.43+0.6679σn (psi) for σn<216 psi.
Masonry specimens were tested using the test setup illustrated in Figure 6.5 (see also
section 6.3).
University of Missouri - Rolla - C.I.E.S. Università degli studi di Genova - D.I.S.E.G.
182
Fig. 6.5. Test setup (Morbin, 2001)
The load was applied in cycles of loading and unloading except for the control wall.
Table 6.2 illustrates a summary of the load cycles. Tab. 6.2. Load cycles – Morbin, 2001
In figure 6.6 (a), (b) and in table 6.3 are summarized the results for all the specimens
The conclusions are that the masonry panels strengthened with FRP had a remarkable
increase in shear capacity and pseudo-ductility, ranging between 30% and 85%.
It was observed that the mechanism of failure of walls strengthened with GFRP bars
placed at every bed mortar joint consists of two phases. From the test observations,
the in-plane phase was the most critical, and the out-of-plane phase is pronounced in
walls having reinforcement eccentricity.
• In-Plane Phase: When the tensile strength of masonry is overcome, the wall
cracks along the diagonal, following the mortar joints (stepped crack
University of Missouri - Rolla - C.I.E.S. Università degli studi di Genova - D.I.S.E.G.
184
vertical/horizontal). For the reinforcement placed in the horizontal joint, the
crack is typically at the top side. Wall failure occurs only when a second
crack develops below the reinforcement at the epoxy/block interface.
• Out-of-Plane Phase: This phase influences the stability of the wall, which is
observed in specimens strengthened only on one side. Comparing the recorded
crack openings on the front (strengthened) and back (unstrengthened) sides,
the crack growth on the unstrengthened side increased at a higher rate than the
strengthened side.
Moreover, in contrast with URM walls, strengthened walls are stable after failure.
This fact can avoid injuries or loss of human life due to collapse of the wall.
6.2. Test Specimens Infill walls may or not may resist lateral and vertical loads. In order to simplify the
design, the potential interaction between the infill walls and the structural frame has
been ordinarily ignored. Ignoring the contribution of the masonry infill walls does not
always represent a conservative design. Their presence can lead to stiffening their
frames and thereby cause a redistribution of the lateral loads in the building plan.
Infill walls can be totally enclosed in a surrounding frame of beams and columns, as
typical in a multi story building. These walls can be subjected to high in-plane loads
during exceptional events such as high wind or earthquake. These loads are due to the
interaction between the infill walls and the surrounding structural frames.
Controlling shear failure is a key issue in masonry strengthening because after the
wall is cracked due to in-plane loads, it can easily collapse due to movement
perpendicular to the plane and jeopardize human lives. This kind of behavior has been
evident from post-earthquake observations. In this context, FRP composites can
provide viable solutions for the strengthening of URM walls subjected to stresses
caused by wind or earthquake loads. The use of FRP materials offers important
advantages in addition to their mechanical characteristics and ease of installation.
In order to demonstrate the effectiveness of the FRP strengthening of masonry walls
subjected to in-plane loading, a research program was conducted to continue
University of Missouri - Rolla - C.I.E.S. Università degli studi di Genova - D.I.S.E.G.
185
Morbin’s work. The specimens were built using clay bricks and were strengthened
with different patterns and kinds of FRP materials.
This section describes an experimental program on shear strengthening of URM
panels. FRP materials in the form of GFRP laminates, GFRP bars and carbon strips
were used to strengthen the walls. In addition to the use of FRP laminates, a
technique denominated FRP Structural Repointing is investigated. This technique
consists of placing FRP bars in the mortar joints (Tumialan et al., 2000). Repointing
is a traditional retrofitting technique commonly used in the masonry industry, which
consists in replacing missing mortar in the joints. The term “structural” is added
because the proposed method does not merely consist of filling the joints as the
traditional technique, but allows for restoring the integrity and/or upgrading the shear
and/or flexural capacity of walls.
Six specimens were built using light clay bricks (see also the description in section
4.1.4) in a common bond pattern. The nominal dimensions of these walls were
1630 mm (64 in) by 1630 mm (64 in), and the overall thickness was 200 mm (8 in).
Figure 6.7 illustrates the configuration of the walls.
Note: 1 in = 25.4 mm
Fig. 6.7. Configuration of the walls
The engineering properties of masonry and strengthening materials were presented in
section 4.
CLAY BRICK PANEL
64''
64''
8''
FRONT VIEW SIDE VIEW
University of Missouri - Rolla - C.I.E.S. Università degli studi di Genova - D.I.S.E.G.
186
Wall CLW1 was selected as control specimen. For the first strengthened panel,
CLW2, it was decided to put an amount of reinforcement equivalent to that of COW2
(See Section 6.1, Morbin, 2001), using the following equation:
m,clayf,clay f,concrete
m,concrete
AA =A
A⋅ (6.1)
where:
Af,clay = cross area of FRP reinforcement in clay bricks panels
Af,concrete = cross area of FRP reinforcement in concrete block panels
Am,clay = net area of clay brick panels
Am,concrete = net area of concrete block panels
Following this procedure CLW2 was reinforced placing GFRP bars in the two faces,
following an alternate pattern.
The testing of this wall showed that the amount of reinforcement calculated with
equation 6.1 was not sufficient to increase the shear performance of the wall. It was
observed that the wall failed suddenly right after the development of the first crack.
This was attributed to the large amount of energy accumulated by the wall.
In light of this result, for the other specimens, the amount of FRP was decided in
terms of ratio of the axial stiffness, which was defined as:
ρ = f f
m m
A EA f '
⋅⋅
(6.2)
where:
Af = cross area of FRP reinforcement
Am = net area of masonry
Ef = modulus of elasticity of FRP reinforcement
f‘m = compressive strength of masonry
For design considerations, according to MSJC Code (1999), the compressive strength
of masonry must be at least 17.0 MPa (2500 psi) for clay masonry and 10.4 MPa
(1500 psi) for concrete masonry.
Thus, CLW3 was reinforced placing GFRP rods and laminates on both sides of the
panel in a symmetrical configuration. The strengthening layout consisted of GFRP
rods every two joints and four vertical GFRP strips 1630 mm (64 in) long and 100
University of Missouri - Rolla - C.I.E.S. Università degli studi di Genova - D.I.S.E.G.
187
mm (4 in) wide. The amount of vertical reinforcement was the same used for the
concrete block panel COW6 (see section 6.1, Morbin, 2001) considering that an
amount of vertical reinforcement equal in terms of axial stiffness (Ef⋅Af) to the
horizontal one would have been excessive. CLW4 presented the same amount of
vertical GFRP laminates as CLW3 but half of the horizontal FRP reinforcement.
Thus GFRP rods were placed every four mortar joints. The purpose was to observe
the efficiency of the horizontal strengthening with the same amount of vertical. The
last two specimens were strengthened with carbon strips. Because of its flat shape this
kind of reinforcement is particularly suitable for old masonry building in which the
joints are thin. The cross section is equivalent to that of a #2 rod. The amount of
reinforcement was equivalent to that of CLW3 in terms of axial stiffness, but this was
placed with two different patterns. For CLW5, seven horizontal strips were placed on
one side of the wall and seven vertical strips were placed on the other side. For
CLW6, five strips on each face were oriented diagonally equally spaced from the
diagonal. The text matrix for series CLW is summarized in table 6.4.
Tab. 6.4. Test matrix for Series CLW
Specimen Strengthening Front Side Back Side Layout
CLW1 None None None
FRONT F B
CLW2 #2 GFRP bars 4HJ 4HJ
CLW3 #2 GFRP bars
4 in GFRP laminates
2HJ/4VS 2HJ/4VS
FRONT/BACK F B
FRONT/BACK F B
University of Missouri - Rolla - C.I.E.S. Università degli studi di Genova - D.I.S.E.G.
188
Tab. 6.4. Test matrix (continued)
Specimen Strengthening Front Side Back Side Layout
CLW4 #2 GFRP bars
4 in GFRP laminates
4HJ/4VS 4HJ/4VS
FRONT/BACK F B
CLW5 Carbon strips 3/4HC 3/4VC
BACK F B
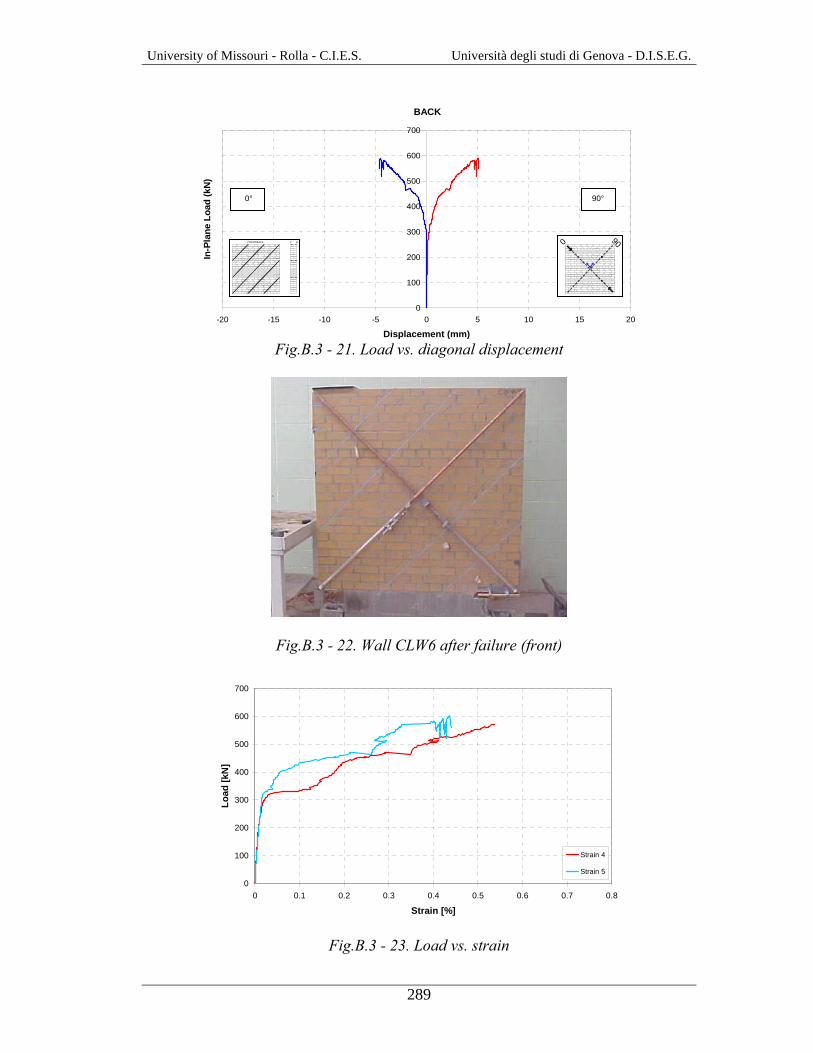
CLW6 Carbon strips 5D 5D
FRONT/BACK F B
LEGEND: 2HJ=every second mortar joint, 4HJ= every fourth mortar joint, 4VS= four vertical glass strips @ 16 in o.c., 3/4VC= vertical carbon strips every third/fourth mortar joint, 3/4HC= horizontal carbon strips every third/fourth mortar joint, 5D= five diagonal carbon strips simmetrically spaced from the diagonal
All the FRP strips (both glass and carbon) and rods were installed following the
manual lay-up and NSM rods technique as described in Section 3.
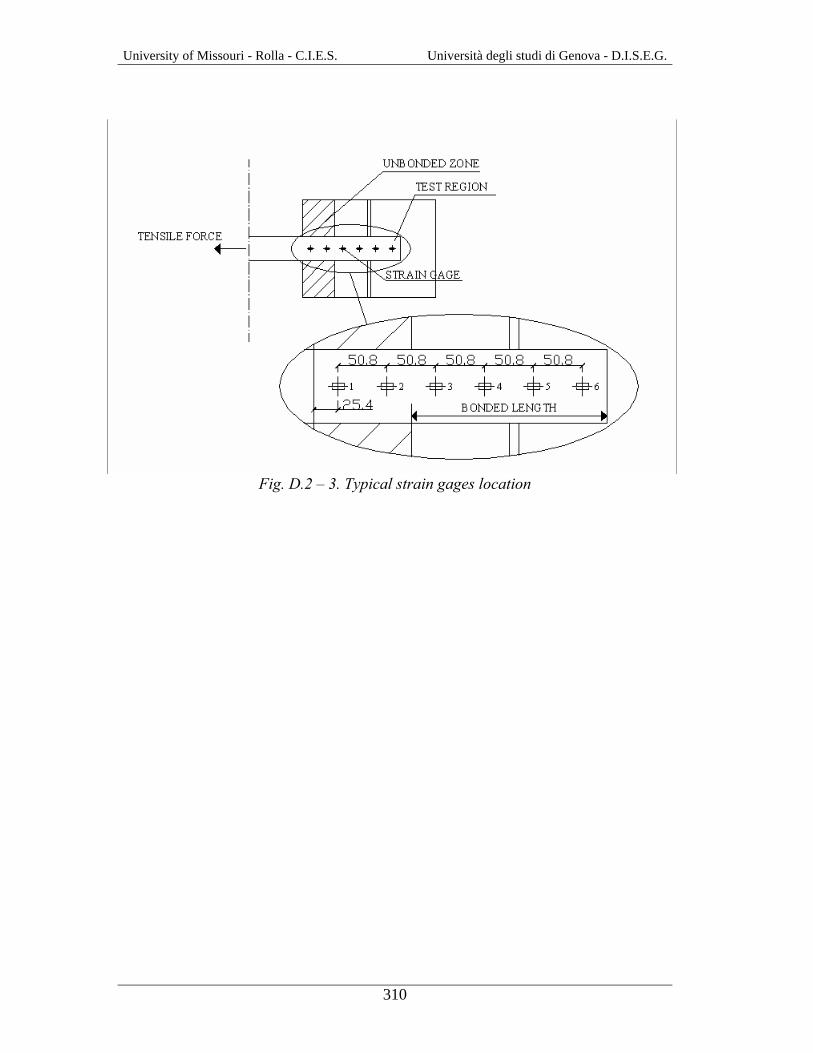
Five strain gages were applied to the FRP reinforcement to monitor the strain
distribution along the strip and the laminates in correspondence to the loaded diagonal
of the panels. All the strain gages had a gage length of 12.7 mm (1/2 in) to ensure
localized strain measurement. The surfaces on which they were applied were
smoothed and conditioned to assure a perfect bond between strain gage and
deformable support. Figure 6.8 indicate the typical strain gages location on the FRP
reinforcement for the specimen CLW6 (see also Appendix B).
University of Missouri - Rolla - C.I.E.S. Università degli studi di Genova - D.I.S.E.G.
189
FRONT BACK
1
2
3
4
5
LVDT 1
LVDT 2
LVDT 4
LVDT 3
Fig. 6.8. Typical strain gages and LVDT’s location
6.3. Test Setup
The specimens were tested in a close loop fashion, following the ASTM E518
standard protocol (Standard Test Method for Diagonal Tension in Masonry
Assemblages). Two 30-ton-capacity hydraulic jacks activated by a manual pump
were used to load the specimen along one diagonal. The force was applied to the wall
by steel shoes placed at the top corner, and transmitted to similar shoes at the bottom
corner through high-strength steel rods. Figures 6.9 (a) and (b) illustrate the test setup.
(a) Test setup scheme (b) Test setup
Fig. 6.9. Test setup
University of Missouri - Rolla - C.I.E.S. Università degli studi di Genova - D.I.S.E.G.
190
The load was applied in cycles of loading and unloading, except for the control walls.
An initial cycle for a low load was performed in every wall to verify that both the
mechanical and electronic equipment was working properly. The data acquired by a
200 kip load cell and the Linear Variable Differential Transducers (LVDTs) were
collected by a Daytronic Data Acquisition System at a frequency of one Hz. A total of
four LVDTs were used to register displacements in the walls along the wall
diagonals. Two LVDTs were placed on each side of the walls: one oriented along the
force line to measure the wall shortening, and the other perpendicular to the force line
to record the crack opening. Table 6.5 illustrates a summary of the load cycles. Tab. 6.5. Test cycles
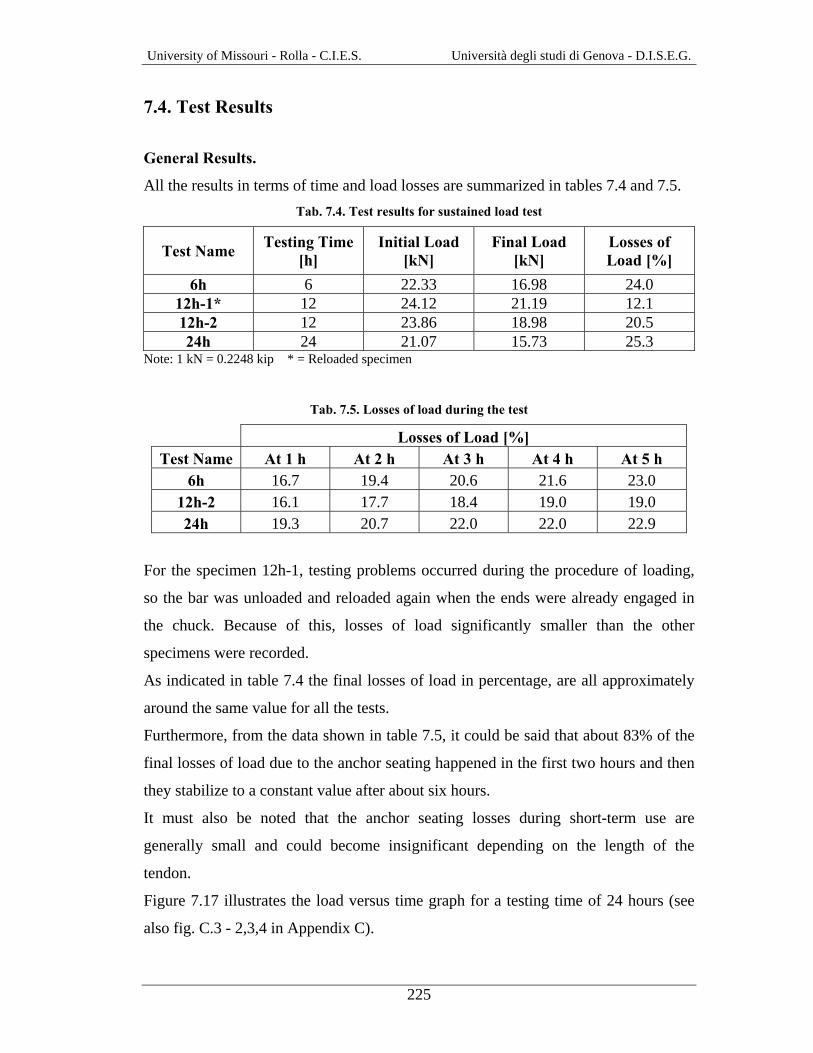
For the specimen 12h-1, testing problems occurred during the procedure of loading,
so the bar was unloaded and reloaded again when the ends were already engaged in
the chuck. Because of this, losses of load significantly smaller than the other
specimens were recorded.
As indicated in table 7.4 the final losses of load in percentage, are all approximately
around the same value for all the tests.
Furthermore, from the data shown in table 7.5, it could be said that about 83% of the
final losses of load due to the anchor seating happened in the first two hours and then
they stabilize to a constant value after about six hours.
It must also be noted that the anchor seating losses during short-term use are
generally small and could become insignificant depending on the length of the
tendon.
Figure 7.17 illustrates the load versus time graph for a testing time of 24 hours (see
also fig. C.3 - 2,3,4 in Appendix C).
University of Missouri - Rolla - C.I.E.S. Università degli studi di Genova - D.I.S.E.G.
226
Fig. 7.17. Load vs. time for testing time equal to 24 hours
7.5. Validation of the System
The main area of application of this system is the structural rehabilitation of damaged
concrete, masonry, timber members; it consists of restoring the original structure
function and closing the cracks due to different causes such as seismic events or
differential settlements.
The application of tensioned FRP bars to a damaged structure induces a state of
compression and can close existing cracks.
Figure 7.18 shows a schematic drawing of the post-tensioned tendons used to close
cracks in a masonry structure.
0
5
10
15
20
25
30
35
0 3 6 9 12 15 18 21 24
Time [hours]
Load
[kN
]
University of Missouri - Rolla - C.I.E.S. Università degli studi di Genova - D.I.S.E.G.
227
Fig. 7.18. Post-tensioning of a cracked masonry wall
7.5.1. Test Setup
In order to validate the system and to calibrate the load on the GFRP bar as a function
of the torque furnished by a torque wrench, additional tests in the laboratory were
performed.
A reinforced concrete beam with dimensions 267 mm (10.5 in) by 419 mm (16.5 in)
by 2134 mm (84 in) long was casted.
The steel cage consisted of a 9.5 mm (3/8 in) diameter steel rebar and of stirrups with
the same size at 254 mm (10 in).
A PVC pipe with the internal diameter equal to 38.1 mm (1.5 in) was positioned
directly above the steel rebar, to allow the positioning of the threaded pipe during the
post-tensioning procedure.
Two kinds of tests were performed using this RC beam: the first one (test 1) to check
the variations of the mid span deflection during a certain amount of time while the
beam was subjected to the post-tensioning load, and the second one (test 2) to find the
ultimate load for this kind of device, loading the rod until reaching failure.
Figure 7.19 shows the RC beam used for the tests.
POST-TENSIONED TENDONS
University of Missouri - Rolla - C.I.E.S. Università degli studi di Genova - D.I.S.E.G.
228
(b) RC beam after curing
(a) Steel cage and PVC pipe
Fig. 7.19. RC beam used for validation test and detail of the construction After 28 days of curing, 10 grooves were done on both sides of the beam and were
filled with weak mortar in order to see, as well as possible, the opening and closing of
the cracks during the procedures of respectively loading and post-tensioning.
The beam was cracked using the Baldwin Universal Testing Machine with a four
point flexural test, according with the standards dictated by the ASTM E 72-98.
Once the cracks were opened, the post-tensioning device was used to reduce the mid
span deflection due to the vertical load previously applied.
In order to measure the midspan deflection and the load, an LVDT and a pressure
transducer were used. The load was applied to the rod using a torque wrench that was
calibrated after the tests.
Figure 7.20 shows the test setup and a detail of the dead end of the device.
(a) Test setup: general view (b) Dead end and pressure transducer
Fig. 7.20. Test setup
University of Missouri - Rolla - C.I.E.S. Università degli studi di Genova - D.I.S.E.G.
229
7.5.2. Test Results General Results.
The results of the two kinds of tests (test1 and test 2) are summarized in figures 7.21
and 7.22.
Fig. 7.21. Test 1: load vs. recovery of deflection
Fig. 7.22. Test 2: load vs. time: loading to failure
0
10
20
30
40
50
60
0 5 10 15 20 25 30
Time [hours]
Load
[kN
]
0
5
10
15
20
25
30
35
40
0 5 10 15 20 25 30 35 40
Recovery of deflection [mm]
Load
[kN
]
University of Missouri - Rolla - C.I.E.S. Università degli studi di Genova - D.I.S.E.G.
230
In figure 7.21, once reached a value of load of 35 kN (7.87 kips), two different
regions can be recognized: the very first part of the curve after the loading branch is
due to the anchor seating losses that represent the main part (66% of the total loss in
about an hour). The second part represent the decreasing of load due to the recovery
of deflection obtained by means of the sustained load carried by the post-tensioned
rod. This second loss occurred in about five hours.
The recovery of deflection is obtained as difference between the value recorded in a
moment and the value recorded at the beginning of the test with no load in the rod.
Figure 7.23 shows the position of the LVDT during the test and the recovery of
deflection measured in a generic moment.
FINAL SHAPE AFTER RECOVERY INITIAL DEFORMED SHAPEOF DEFLECTION
PRE-STRESSING
VERTICAL LOAD
LOAD
LVDT
FINAL DEFLECTION
INITIAL DEFLECTION
REC
OV
ERY
DETAIL A
DETAIL A Fig. 7.23. LVDT position and detail of the valuation of recovery of deflection
During the whole test a total recovery of deflection of 38.1 mm (1.5 in) was recorded
by the LVDT, and the cracks opened on the sides of the beam were totally closed.
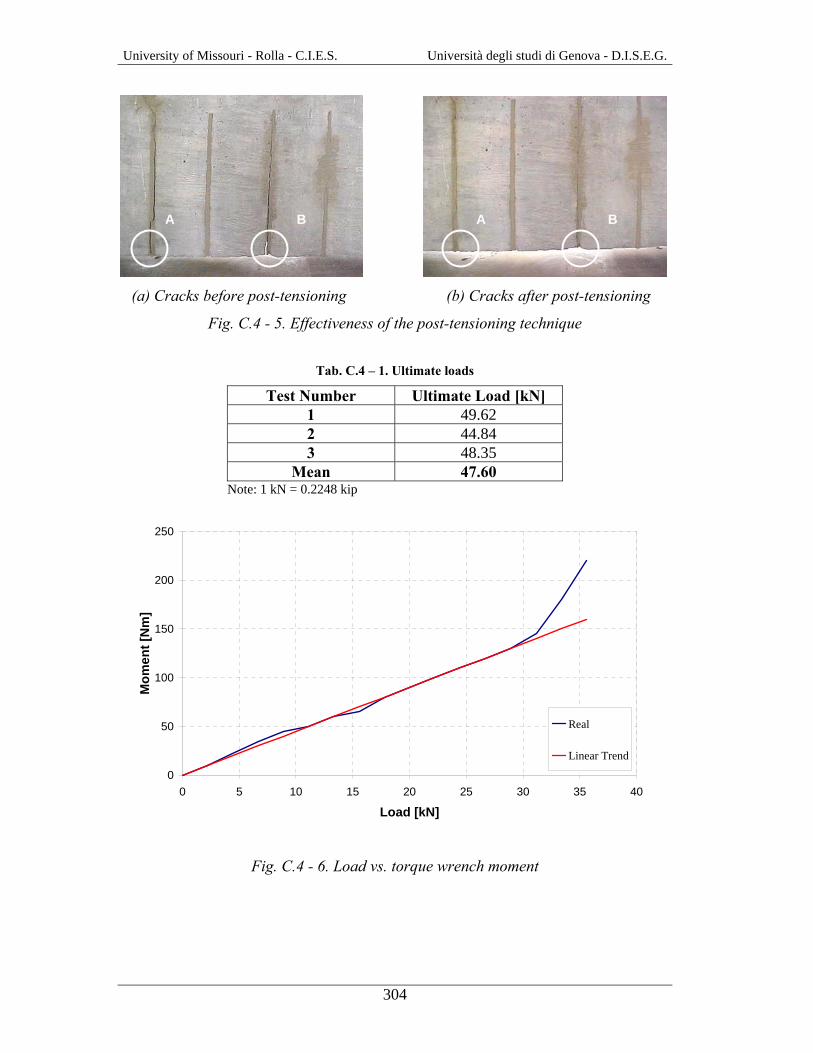
Figure 7.24 illustrates the crack before and after the post-tensioning procedure.
(a) Cracks before post-tensioning (b) Cracks after post-tensioning
Fig. 7.24. Effectiveness of the post-tensioning technique
A AB B
University of Missouri - Rolla - C.I.E.S. Università degli studi di Genova - D.I.S.E.G.
231
Figure 7.22 shows the different loading cycles of a GFRP bar loaded up to failure.
The bar was loaded during a period of time of about 26 hours, increasing the load
after six different periods of time, to check which was the ultimate capacity of the
device and determine if the prestressing load would be maintained..
It can be noticed from the collected data that the ratio between the losses of load in
percentage and the time during which they occur, was decreasing.
This phenomenon can be explained with a first contribution to the losses of load due
to the anchor seating and a second one due to the recovery of deflection at mid span
that decreased during the test because of the closing of the cracks.
The contribution due to the anchor seating losses affected the first three cycles of
loading during a period of time which lasted about eleven hours, whereas the last part
of the test was affected mainly by the decreasing recovery of deflection.
It can be noticed that during the very last cycle, the losses of load were very low
meaning that the aforementioned contributions were almost completely developed.
Once the load of 49.62 kN (11.15 kips) was reached, the failure of the bar due to
creep-rupture effects occurred in the part of the bar just outside the chuck.
Two additional tests of this type (test 2) were performed to define the ultimate
capacity of the device and to collect the data in order to calibrate the torque wrench.
The test results in terms of ultimate load are summarized in table 7.6. Tab. 7.6. Ultimate loads
Test Number Ultimate Load [kN] 1 49.62 2 44.84 3 48.35
Mean 47.60 Note: 1 kN = 0.2248 kip
In order to calibrate the load on the GFRP bar as a function of the torque furnished by
a torque wrench, additional data were collected during the tests, to find a relationship
between the load measured by the pressure transducer and the moment read on the
scale of the wrench.
University of Missouri - Rolla - C.I.E.S. Università degli studi di Genova - D.I.S.E.G.
232
The relationship is illustrated in figure 7.25.
Fig. 7.25. Load vs. torque wrench moment graph
In figure 7.24 two different regions can be recognized: in the first part of the graph,
up to 30 kN (7 kips), the behavior obtained from the data recorded during the test is
very close to the linear trend, but in the second branch, the gap between the two
curves increases with the increasing of the load in the rod.
This phenomenon can be explained by the increasing of the friction between the nut
and the threaded pipe due to the damage that occur in the screw devices when the
load increases to high values.
This problem can be avoided by using tough steel for the devices and suitable grease
during the loading operation. In many cases, the torque wrench can be used up to
loads two times bigger than the admissible value stated by the ACI code.
The following equation can be used to determine the value of the moment that must
be read on the scale of the wrench used to load the rod in the field applications:
10M = N2.224
⋅ rod with: 0 ≤ Nrod ≤ 30 kN (7 kips)
Where: Nrod is the design load to apply at the rod [kN]
M is the value of the moment that must be read on the wrench [N⋅m]
0
50
100
150
200
250
0 5 10 15 20 25 30 35 40
Load [kN]
Mom
ent [
Nm
]
Real
Linear Trend
University of Missouri - Rolla - C.I.E.S. Università degli studi di Genova - D.I.S.E.G.
233
7.6. Conclusions
Several different kinds of tests were run to verify the effectiveness of the devices and
the applicability of the method in the real field.
The results of the work done in the laboratory demonstrate that the post-tensioning
devices allow for loading the rod up to loads almost three times larger than the
threshold stated by the ACI code.
The anchors are also able to carry a steady load for the period of time needed to fully
embed the rod in the member with the use of an epoxy-based paste.
The tests with the RC beam shows that the technique is capable of solving the
problems concerning the structural rehabilitation such as damage and cracks due to
seismic events or differential settlements, maintaining the integrity of structural
assemblages while preserving aesthetics.
Furthermore, due to the light weight of the material and the devices involved, site
equipment and handling requirements are reduced and simplified.
For these particular technique and devices, a patent disclosure was filed (see
Appendix C.5).
University of Missouri - Rolla - C.I.E.S. Università degli studi di Genova - D.I.S.E.G.
234
University of Missouri - Rolla - C.I.E.S. Università degli studi di Genova - D.I.S.E.G.
235
8. CONCLUSIONS AND FUTURE WORKS
8.1. Conclusions
The present investigation has demonstrated that FRP composites offer benefits for the
strengthening of masonry elements. FRP systems have been proven to increase
flexure and shear capacities of URM elements. Analytical studies were presented for
determining the flexural capacity limit of the strengthened walls and the effective
bonded length of the AFRP laminates.
The new anchor system showed in Section 7 demonstrated that FRP can be succefully
used also for the post-tensioning of masonry with composites in substitution of steel
tendons.
Results on durability tests on putty are a warning with respect to long-term durability.
An in-depth investigation of this and other types of putty may be warranted.
Specific conclusions and recommendations for both engineering and installation
procedures have been presented in all the sections of this thesis.
8.2. Future works Bond
Debonding of the FRP laminate from the masonry surface is the controlling
mechanism of failure. The previous work intended to establish a limit for the FRP
strain and for the minimum bonded length but is not sufficient for the calibration of
the model since debonding has a direct relationship with the porosity of the masonry,
the type of masonry, the humidity, the type of fiber, the quantity of saturant used, etc.
Different representative types of masonry, FRP and other parameters would be
investigated.
University of Missouri - Rolla - C.I.E.S. Università degli studi di Genova - D.I.S.E.G.
236
Out-of-plane with arching effect
In order to develop a design protocol for the flexural strengthening of URM walls
subjected to arching effect, different types of FRP materials and different values of
slenderness ratio would be studied. University of Missouri - Rolla is ready to build
full-scale walls to evaluate all these parameters.
Arching effect appeared to influence significantly RC beams in concrete frames. This
aspect could change ACI guidelines in terms of beam design.
In-plane behavior of masonry walls
For this behavior, it is important to investigate the interaction of strengthened walls
with the surrounding structural elements (i.e. beams and columns) since the
effectiveness of the strengthening may be dangerously overestimated due to
premature failures in the masonry or structural elements. For FRP structural
repointing, more economical embedding materials to encapsulate the FRP rods in the
mortar joints need to be explored. These materials might be mortars with improved
bond properties, which can transfer tensile stresses to the reinforcement.
Post-tensioning
University of Missouri – Rolla is ready to test the anchor system for the thermoplastic
bars in the field to validate the effectiveness and the speed of installation.
Note: a general issue is represented to a lack of material standardization that cause
many design difficulties because of large differences between the same type of FRP
materials.
University of Missouri - Rolla - C.I.E.S. Università degli studi di Genova - D.I.S.E.G.
237
8.3. New frontiers for FRP composites (Blast upgrading)
Terrorist attacks have shown to be a dangerous threat for civilian and military
facilities. Because of the high casualties experienced in the Oklahoma City and
Khobar Towers (Saudi Arabia) bombings, and in the Pentagon with aerial attack,
force protection is considered by the US Department of Defense (DOD) to be a
critical mission parameter. In particular, the blast scenario from a structural point of
view can be subdivided in three phases. In the first phase, exterior walls and columns
and windows are affected, in the second phase floor slabs and roofs, and in the third
and last phase, the lateral load-resisting frame. Amongst building components,
masonry walls possess a reduced capacity against out-of-plane blast loading. Their
capacity can be upgraded by placing internal or external steel reinforcement.
However, these procedures require significant labor during installation. An
alternative is to attach FRP composite materials to the surfaces of the walls to
increase the blast capacity. University of Missouri – Rolla is working in collaboration
with Fort Leonard Wood (Missouri) in a project consisting of design, verification and
upgrade with FRP composites.
University of Missouri - Rolla - C.I.E.S. Università degli studi di Genova - D.I.S.E.G.
238
University of Missouri - Rolla - C.I.E.S. Università degli studi di Genova - D.I.S.E.G.
239
APPENDIX A: ARCHING EFFECT
University of Missouri - Rolla - C.I.E.S. Università degli studi di Genova - D.I.S.E.G.
240
Appendix A.1: Beams design
Testing frame
Material Properties: Concrete: fcu = 23.4 N/mm2 = 3400 psi
fctd = 3.6 N/mm2 = 525 psi
εu = 0.0035
Steel: fyd = 359 N/mm2 = 52.2 ksi
εyd = 0.002 εu = 0.01
Bottom Beam
Top BeamP
University of Missouri - Rolla - C.I.E.S. Università degli studi di Genova - D.I.S.E.G.
241
BOTTOM BEAM DESIGN
Load on bottom beam
30 Kips
15 Kips 15 Kips P = kN 200 kips 455.130 ≅=⋅
VA = VB = kips 22.5 kN 1002
200 ==
Load sketch for bottom beam:
q = 22.5/L Kips
A B
L
L = 0.8128 m = 32”
q = kips/in 0.703 kN/m 1238128.0
100000 ==
Shear and flexure diagram:
DC
Smax
Mmax
University of Missouri - Rolla - C.I.E.S. Università degli studi di Genova - D.I.S.E.G.
242
Vc = Vd = kips 11.25 kN 502
8128.01232
==⋅=qL
Smax = kips 11.25 kN 502
8128.01232
==⋅=qL
Mmax = inkips 90 mkN 16.1088128.0123
8
22
⋅=⋅=⋅=qL
The design is influenced from the frame’s dimensions FLEXURE DESIGN:
H=8
"
B=11" d=
7"
Af
• B = 279.4 mm = 11”
• H = 203.2 mm = 8”
• D = 177.8 mm = 7”
Af = 2 2
yd
max in 0.27 mm 1767.3598.1779.0
10157400fd0.9
M ==⋅⋅
=⋅⋅
• N° 3 Rebars #3 Af = 213 mm2 = 0.33 in2
ωs = a"" 0658.04.238.1774.279
7.359213 fieldfdB
fA
cu
yds ==⋅⋅
⋅=⋅⋅
⋅
ξ= 0.066 + 0.924ϖs = 0.127
x = ξ d = 0.127⋅ 177.8 = 22.6 mm = 0.89”
β 527.0127.0)127.01(
127.010.1157.4)1(10.1157.4
22 =⋅−
⋅−=⋅−
⋅−= ξξ
ξ
k 359.0127.01
127.013.033.01
13.033.0 =−
⋅−=−
⋅−=ξ
ξ
University of Missouri - Rolla - C.I.E.S. Università degli studi di Genova - D.I.S.E.G.
Nu α fmu⋅ b h⋅ bb hb⋅−( )⋅:= rx N 0( ) Nu, Nu..:= ry rx( )
M 0( ) rx⋅N 0( ) Nu−
Nu− M 0( )⋅N 0( ) Nu−
+:=
εm 0 0.000001, 0.0025..:=
α1 εm( ) 2− εm⋅ 3− εmu⋅ εm+( )2⋅
3 4− εmu⋅ εm+( ) εmu2
⋅:=
β1 εm( ) 1 4− εmu εm+( )⋅
2 3− εmu⋅ εm+( ):=
cm εm( ) εm h⋅εfu εm+
:=
University of Missouri - Rolla - C.I.E.S. Università degli studi di Genova - D.I.S.E.G.
275
Real section: Na1 εm( ) α1 εm( ) fmu⋅ β1 εm( )⋅ cm εm( )⋅ b⋅ Af εfu⋅ Ef⋅−:= Ma1 εm( ) α1 εm( ) fmu⋅ β1 εm( )⋅ cm εm( )⋅ b⋅ h β1 εm( ) cm εm( )
2⋅−⎛⎜
⎝⎞⎠
⋅ Na1 εm( ) h2
⋅−:=
Full section: Nap εm( ) α1 εm( ) fmu⋅ β1 εm( )⋅ cm εm( )⋅ b⋅ Af1 εfu⋅ Ef⋅−:= Map εm( ) α1 εm( ) fmu⋅ β1 εm( )⋅ cm εm( )⋅ b⋅ h β1 εm( ) cm εm( )
2⋅−⎛⎜
⎝⎞⎠
⋅ Nap εm( ) h2
⋅−:=
Equivalent section: Nac εm( ) α1 εm( ) fmu⋅ β1 εm( )⋅ cm εm( )⋅ b1⋅ Af1 εfu⋅ Ef⋅−:= Mac εm( ) α1 εm( ) fmu⋅ β1 εm( )⋅ cm εm( )⋅ b1⋅ h β1 εm( ) cm εm( )
2⋅−⎛⎜
⎝⎞⎠
⋅ Nac εm( ) h2
⋅−:=
Fig. A.5 – 6. Different approaches for design purposes
Moment [Nmm]
Axi
al lo
ad [N
]
University of Missouri - Rolla - C.I.E.S. Università degli studi di Genova - D.I.S.E.G.
276
University of Missouri - Rolla - C.I.E.S. Università degli studi di Genova - D.I.S.E.G.
277
APPENDIX B: IN - PLANE
University of Missouri - Rolla - C.I.E.S. Università degli studi di Genova - D.I.S.E.G.
278
APPENDIX B.1: Test Specimens
Note: 1 in = 25.4 mm
Fig.B.1 - 1. Configuration of the walls
Tab. B.1 - 1. Test matrix for Series CLW
Specimen Strengthening Front Side Back Side Layout
CLW1 None None None
FRONT F B
CLW2 #2 GFRP bars 4HJ 4HJ
CLW3 #2 GFRP bars
4 in GFRP laminates
2HJ/4VS 2HJ/4VS
FRONT/BACK F B
CLAY BRICK PANEL
64''
64''
8''
FRONT VIEW SIDE VIEW
FRONT/BACK F B
University of Missouri - Rolla - C.I.E.S. Università degli studi di Genova - D.I.S.E.G.
279
Tab. B.1 - 1. Test matrix (continued)
Specimen Strengthening Front Side Back Side Layout
CLW4 #2 GFRP bars
4 in GFRP laminates
4HJ/4VS 4HJ/4VS
FRONT/BACK F B
CLW5 Carbon strips 3/4HC 3/4VC
BACK F B
CLW6 Carbon strips 5D 5D
FRONT/BACK F B
LEGEND: 2HJ=every second mortar joint, 4HJ= every fourth mortar joint, 4VS= four vertical glass strips @ 16 in o.c., 3/4VC= vertical carbon strips every third/fourth mortar joint, 3/4HC= horizontal carbon strips every third/fourth mortar joint, 5D= five diagonal carbon strips simmetrically spaced from the diagonal
FRONT BACK
1
2
3
4
5
LVDT 1
LVDT 2
LVDT 4
LVDT 3
Fig.B.1 - 2. Typical strain gages and LVDT’s location
University of Missouri - Rolla - C.I.E.S. Università degli studi di Genova - D.I.S.E.G.
280
APPENDIX B.2: Test Setup
(a) Test setup scheme (b) Test setup Fig.B.2 - 1. Test setup
University of Missouri - Rolla - C.I.E.S. Università degli studi di Genova - D.I.S.E.G.
299
APPENDIX C.2: Tensile Tests
(a) Universal testing machine (b) Positioning of the anchors
Fig. C.2 - 1. Universal testing machine and anchor positioning
FIRST CHUCK
3
3364 to 9
16
1+3 4
1+3 4
364 to 5
64
1+1 64
39 64
REDESIGNED CHUCK
364 to 5
64
1+3 4
1+3 4
2332
3
12
39 64 1+1 64
1+ 164 to 1+ 1
16
Fig. C.2 - 2. Chuck drawings
(a) Test with the first chuck (b) Test with the redesigned chuck
Fig. C.2 - 3. Bar after failure
WEDGE
STEEL PLATE
CROSSHEAD
CHUCK
CROSSHEADS
University of Missouri - Rolla - C.I.E.S. Università degli studi di Genova - D.I.S.E.G.
300
APPENDIX C.3: Long Term Tests
Test Setup
(a) Test setup: general view (b) Detail of the pressure transducer
Fig. C.3 - 1. Test setup
Test Results
Fig. C.3 - 2. Load vs. time for testing time equal to 6 hours
0
5
10
15
20
25
30
35
0 1 2 3 4 5 6
Time [hours]
Load
[kN
]
DATA ACQUISITION SYSTEM
University of Missouri - Rolla - C.I.E.S. Università degli studi di Genova - D.I.S.E.G.
301
Fig. C.3 - 3. Load vs. time for testing time equal to 12 hours
Fig. C.3 - 4. Load vs. time for testing time equal to 24 hours
0
5
10
15
20
25
30
35
0 3 6 9 12
Time [hours]
Load
[kN
]
0
5
10
15
20
25
30
35
0 3 6 9 12 15 18 21 24
Time [hours]
Load
[kN
]
University of Missouri - Rolla - C.I.E.S. Università degli studi di Genova - D.I.S.E.G.
302
APPENDIX C.4: Validation of the System
Test Setup
(a) Test setup: general view (b) Dead end and pressure transducer
Fig. C.4 - 1. Test setup
Test Results
Fig. C.4 - 2. Load vs. mid span deflection
0
5
10
15
20
25
30
35
40
0 5 10 15 20 25 30 35 40
Deflection [mm]
Load
[kN
]
University of Missouri - Rolla - C.I.E.S. Università degli studi di Genova - D.I.S.E.G.
303
Fig. C.4 - 3. Load vs. time: loading to failure
FINAL SHAPE AFTER RECOVERY INITIAL DEFORMED SHAPEOF DEFLECTION
PRE-STRESSING
VERTICAL LOAD
LOAD
LVDT
FINAL DEFLECTION
INITIAL DEFLECTION
REC
OV
ERY
DETAIL A
DETAIL A
Fig. C.4 - 4. Position of the LVDT and detail of the valuation of recovery of deflection
0
10
20
30
40
50
60
0 5 10 15 20 25 30
Time [hours]
Load
[kN
]
University of Missouri - Rolla - C.I.E.S. Università degli studi di Genova - D.I.S.E.G.
304
(a) Cracks before post-tensioning (b) Cracks after post-tensioning
Fig. C.4 - 5. Effectiveness of the post-tensioning technique
Tab. C.4 – 1. Ultimate loads
Test Number Ultimate Load [kN] 1 49.62 2 44.84 3 48.35
Mean 47.60 Note: 1 kN = 0.2248 kip
Fig. C.4 - 6. Load vs. torque wrench moment
A AB B
0
50
100
150
200
250
0 5 10 15 20 25 30 35 40
Load [kN]
Mom
ent [
Nm
]
Real
Linear Trend
University of Missouri - Rolla - C.I.E.S. Università degli studi di Genova - D.I.S.E.G.
305
APPENDIX C.5: Patent Disclosure UMUW FORM 16C UP&L DISCLOSURE NO: CAMPUS DATE RECEIVED UP&L:
UNIVERSITY OF MISSOURI SYSTEM
PROPRIETARY INFORMATION/INVENTION DISCLOSURE NOTE: This statement shall be treated as confidential information except for specific sections as noted. Except for individuals engaged in the evaluation and approval process, the information will not be divulged to others without proper confidentiality agreements in place, except as required by law. The objective of the form is to obtain the information necessary to determine whether to pursue patent protection for your invention.
SECTION I NONCONFIDENTIAL INFORMATION
1. Nonconfidential title of the work:
ANCHOR SYSTEM FOR THE TENSIONING OF FIBER-REINFORCED POLYMER BARS USED FOR STRUCTURAL STRENGHTENING
2. Nonconfidential lay abstract of invention:
This invention addresses the solution of the tensioning problems of Fiber-Reinforced Polymer (FRP) bars used to take the place of steel rods for structural strengthening. The bars can be manufactured with any fiber type embedded in a thermoplastic resin. The idea is based on the thermoplastic properties of the resin and consists of creating two temporary anchorages at the end of the bar; with these anchors and a screw device the proper amount of tension can be introduced into the bar.
After this tensioning operation, one can bond the bar to the structure with any method used for composite materials (e.g. Near Surface Mounted (NSM) rods or drilled hole through transverse walls filled with epoxy-based paste).
After bonding is completed, one can remove the anchors and the screw device to use them for another bar. In this way, one can cut the bars in situ as desired, and the tendon can be hidden inside the structure. This feature is very important particularly for historical masonry buildings, in which the strengthening system must be the least visible as possible.
3. Nature of work: Machine Process Utility Software____
University of Missouri - Rolla - C.I.E.S. Università degli studi di Genova - D.I.S.E.G.
306
If Software: Have proper copyright markings been utilized? Yes__No__
UNIVERSITY PATENTS & LICENSING OFFICE
509 LEWIS HALL COLUMBIA, MO 65211
(573)882-2821
University of Missouri - Rolla - C.I.E.S. Università degli studi di Genova - D.I.S.E.G.
307
APPENDIX D: MATERIALS AND BOND CHARACTERIZATION
University of Missouri - Rolla - C.I.E.S. Università degli studi di Genova - D.I.S.E.G.
308
APPENDIX D.1: Specimens Preparation (Bond Tests)
(a) Application of primer (b) Application first coat of saturant
(c) Application of AFRP sheets (d) Application of second coat of saturant
(e) Specimens ready (e) Test regions
Fig. D.1 – 1. Specimens preparation
University of Missouri - Rolla - C.I.E.S. Università degli studi di Genova - D.I.S.E.G.
309
APPENDIX D.2: Test Setup (Bond Tests)
Fig. D.2 – 1. Test setup
Fig. D.2 – 2. Picture test setup
University of Missouri - Rolla - C.I.E.S. Università degli studi di Genova - D.I.S.E.G.
310
Fig. D.2 – 3. Typical strain gages location
University of Missouri - Rolla - C.I.E.S. Università degli studi di Genova - D.I.S.E.G.
311
APPENDIX D.3: Test Results (Bond Tests)
Series CA
Fig. D.3 – 1. Strain vs. location – Test CA3-4
Fig. D.3 – 2. Strain vs. location – Test CA3-8
0
0.2
0.4
0.6
0.8
1
1.2
1.4
1.6
-40 0 40 80 120 160 200 240 280 320
distance [mm]
stra
in [%
]
5.3 KN10.0 KN15.0 KN20.1 KN22.2 KN23.8 KN
Unbonded region
0
0.2
0.4
0.6
0.8
1
1.2
1.4
1.6
-40 0 40 80 120 160 200 240 280 320
distance [mm]
stra
in [%
]
5.0 KN10.0 KN15.1 KN20.0 KN22.1 KN24.0 KN26.5 KN
Unbonded region
University of Missouri - Rolla - C.I.E.S. Università degli studi di Genova - D.I.S.E.G.
University of Missouri - Rolla - C.I.E.S. Università degli studi di Genova - D.I.S.E.G.
333
Fig. D.8 – 11. Absorption behavior of putty with beads of 0.8 mm
Fig. D.8 – 12. Absorption behavior of putty with beads of 1 mm
-1
-0.5
0
0.5
1
1.5
2
2.5
0 50 100 150 200 250
Square root of time (min)
Moi
stur
e co
nten
t (%
) P 0P 0.8-1P 0,8-2P 0,8-3P 0,8-4P 0,8-5P 0,8-8P 0,8-10
-1
-0.5
0
0.5
1
1.5
2
2.5
0 50 100 150 200 250
Square root of time (min)
Moi
stur
e co
nten
t (%
)
P 0P 1-1P 1-2P 1-3P 1-4P 1-5P 1-8P 1-10
University of Missouri - Rolla - C.I.E.S. Università degli studi di Genova - D.I.S.E.G.
334
-1
-0.5
0
0.5
1
1.5
2
2.5
0 50 100 150 200 250
Square root of time (min)
Moi
stur
e co
nten
t (%
)
P 0P 1,25-1P 1,25-2P 1,25-3P 1,25-4P 1,25-5P 1,25-8P 1,25-10
Fig. D.8 – 13. Absorption behavior of putty with beads of 1.25 mm
Fig. D.8 – 14. Absorption behavior of putty with beads of 1.75 mm
-1
-0.5
0
0.5
1
1.5
2
2.5
0 50 100 150 200 250
Square root of time (min)
Moi
stur
e co
nten
t (%
)
P 0P 1,75-1P 1,75-2P 1,75-3P 1,75-4P 1,75-5P 1,75-8P 1,75-10
University of Missouri - Rolla - C.I.E.S. Università degli studi di Genova - D.I.S.E.G.
335
-1
-0.5
0
0.5
1
1.5
2
2.5
0 50 100 150 200 250
Square root of time (min)
Moi
stur
e co
nten
t (%
)
P 0P 2,25-1P 2,25-2P 2,25-3P 2,25-4P 2,25-5P 2,25-8P 2,25-10
Fig. D.8 – 15. Absorption behavior of putty with beads of 2.25 mm
Fig. D.8 – 16. Absorption behavior of putty with sand
-1
-0,5
0
0,5
1
1,5
2
2,5
0 50 100 150 200 250
Square root of time (min)
Moi
stur
e co
nten
t (%
)
P S-0
P S-5
P S-10
P S-15
P S-20
University of Missouri - Rolla - C.I.E.S. Università degli studi di Genova - D.I.S.E.G.
336
APPENDIX D.9: Test Specimens (Controlling the Putty)
Tab. D.9 - 1. Thickness of putty for each specimen Specimens Thickness of the
putty [mm] P-0-1 0
P-0-2 0
P-0-3 0
P-0.8-1 0.8
P-0.8-2 0.8
P-0.8-3 0.8
P-1.75-1 1.75
P-1.75-2 1.75
P-1.75-3 1.75
Note: 1 mm = 0.03937 in
(a) (b)
(c) (d)
University of Missouri - Rolla - C.I.E.S. Università degli studi di Genova - D.I.S.E.G.
337
(e) (f)
Fig. D.9 – 1. Preparation of the specimens
APPENDIX D.10: Test Setup (Controlling the Putty)
FRP WIDTH
CLAY BRICKS
AFRP SHEETTEST REGION
Fig. D.10 – 1. .Scheme of the generic test specimens
(a) (b)
Fig. D.10 – 2. Preparation of the setup
University of Missouri - Rolla - C.I.E.S. Università degli studi di Genova - D.I.S.E.G.
338
Fig. D.10 – 3. Generic test configuration
APPENDIX D.11: Test Results (Controlling the Putty)
Tab. D.11 – 1. Values for the specimens
Specimens Load [kN] Load Average [kN]
P-0-1 13,5
P-0-2 n.d.
P-0-3 10,1
11.8
P-0.8-1 12,7
P-0.8-2 12,3
P-0.8-3 13,5
11.7
P-1.75-1 12,5
P-1.75-2 11,9
P-1.75-3 14,1
12.8
Note: 1kN = 0.228 kip
University of Missouri - Rolla - C.I.E.S. Università degli studi di Genova - D.I.S.E.G.
339
(a) (b)
Fig. D.11 – 1. Failure of the specimens
Fig. D.11 – 2. behavior of the load in function of the thickness of putty
10
11
12
13
14
0 0.2 0.4 0.6 0.8 1 1.2 1.4 1.6 1.8
thickness of putty [mm]
Load
[kN
]
University of Missouri - Rolla - C.I.E.S. Università degli studi di Genova - D.I.S.E.G.
340
University of Missouri - Rolla - C.I.E.S. Università degli studi di Genova - D.I.S.E.G.
341
BIBLIOGRAPHY American Concrete Institute (ACI), Committee 440 (2001). “Guide for the design and
construction of concrete reinforced with FRP bars”. American Concrete Institute (ACI), Committee 440 (2001). “Guide for the design and
construction of externally bonded FRP system for strengthening concrete structures” (document under review).
American Concrete Institute, Masonry Standard Joint Committee (1999). “Code,
Specifications and Commentaries, ACI-530-99/ASCE 5-99/ TMS 402-99”, American Concrete Institute, American Society of Civil Engineering, The Masonry Society, Detroit, New York and Boulder, 1999.
Angel R., Abrams D.P., Shapiro D., Uzarski J. Webster M. (1994). “Behavior of
reinforced concrete frames with masonry infills”. Structural research series report No. 589, Department of Civil Engeneering, University of Illinois at Urbana-Champaign, March 1994.
ASTM D3039 (1987), American Society for Testing and Materials, "Tensile
Properties of Advanced Composites Materials”. ASTM C1019 (1993), American Society for Testing and Materials, “Test Method
of Sampling and Testing Grout”. ASTM E111 (1997), American Society for Testing and Materials, “Standard Test
Method for Young’s Modulus, Tangent Modulus, and Chord Modulus”. ASTM C1314 (1998), American Society for Testing and Materials, "Standard
Test Method for Constructing and Testing Masonry Prisms Used to Determine Compliance with Specified Compressive Strength of Masonry."
ASTM C270 (1998), American Society for Testing and Materials, "Standard
Specification of Mortar for Unit Masonry". ASTM E518 (2001), American Society for Testing and Materials, “Test Method
E518-00a Standard Test Methods for Flexural Bond Strength of Masonry”. ASTM 638 (2000), American Society for Testing and Materials, “Standard Test
Method for Tensile Properties of Plastics”. Baker L.R., Franken G.L. (1978). “Precracking behavior of laterally loaded
brickwork panels with In-Plane restraints”. Proceedings of the British Ceramic Society, No. 27, 1978.
University of Missouri - Rolla - C.I.E.S. Università degli studi di Genova - D.I.S.E.G.
342
Bank, L.C., (1993) “Properties of FRP Reinforcements for Concrete: Fiber-Reinforced-Plastic (FRP) Reinforcement for Concrete Structures: Properties and Applications”, A.C. Nanni, ed., Elsevier Science Publishers B.V., Amsterdam, 1993.
Burgoyne, C.J., (1993) “Advanced Composites in Construction”, lecture given at the
Pennsylvania State University, 26 August 1993. C.I.E.S. report – University of Missouri Rolla. Chajes, M.J., Finch W.W.Jr, Januszka T.F., and Thomson T.A. (1996). “Bond and
force transfer of composite materials plates bonded to concrete”, ACI Structural Journal, ACI, Vol. 93, No. 2.
De Lorenzis L., A. Nanni (2000). “Strengthening of RC structures with near surface
mounted rods”, C.I.E.S. report – University of Missouri Rolla.
De Lorenzis L., Miller B. and Nanni A. (2000). “Bond of FRP laminates to concrete”, ACI Structures Journal, July 2000.
Devalapura, R.K., Gauchel, J.V., Greenwood, M.E., Hankin, A., and Humphrey, T.
(1997), “Long-Term Durability of GFRP Composites in Alkaline Environments”, Proc. 3rd Non-Metallic (FRP) Reinforcement for Concrete Structures, International Symposium, Sapporo, Japan, October 14-16th 1997, Sapporo Japan, Vol.2.
Dixon Troy O. (1994). “Behavior of Anchor/Tendon Systems for Prestressed FRP
Construction”, Pennsylvania State University thesis.
Drysdale G. R., Hamid A. A., Baker R. L. (1999). “Masonry Structures – Behavior and design”, The Masonry Society, Boulder, Colorado.
Ehsani M.R. and Saadatmanesh H. (1996), “Repair and Strengthening of Earthquake-
Damaged Concrete and Masonry Walls with Composite Fabrics”, First International Conference on Composites in Infrastructure ICCI’96, Tucson, Arizona, January 1996.
Erki, M.A. and S.H. Rizkalla, “Anchorages for FRP Reinforcement” Concrete International, ACI, June 1993b.
Franke, L. and Overback, E., (1987), “Loss in strength and damage to glass fibers in
alkaline solutions and cement extracts”, Dur. Build. Mat., No.5, 1987. Gabrielsen B.L., Kaplan K., Wilton C. (1975). “A study of arching in non-reinforced
masonry walls”. SSI 748-1, Scientific Services, Inc., Redwood City, CA, 1975.
University of Missouri - Rolla - C.I.E.S. Università degli studi di Genova - D.I.S.E.G.
343
Ganga Rao, H.V.S., and, Vijay P.V., (1997), “Aging of Structural Composites Under Varying Environmental Conditions”, Proc. 3rd Non-Metallic (FRP) Reinforcement for Concrete Structures, International Symposium, Sapporo, Japan, October 14-16th 1997, Sapporo Japan, Vol.2,
Gerritse, A., and J. Werner, (1988). “ARAPREE: The Prestressing Element
Composed of Resin Bonded Twaron® Fibres”, Manufacturer’s Report, Rijswijk, Netherlands.
Gilstrap J.M., Dolan C.W. (1998). “Out-of-plane bending of FRP reinforced masonry
walls”, Composites science and technology, 1998. Hamilton H.R. III, Holberg A., Caspersen J., and Dolan C.W. (1999), “Strengthening
Concrete Masonry with Fiber Reinforced Polymers”, Fourth International Symposium on Fiber Reinforced Polymer (FRP) for Reinforced Concrete Structures, Baltimore, Maryland, November 1999.
Hendry H.W. (1981), Structural Brickwork. The Macmillan Press Ltd.m London,
1981. Holte, L.E., C.W. Dolan, and R.J. Schmidt, (1993). “Epoxy Socketed Anchors for
Non-Metallic Prestressing Tendons”, ACI SP 138-26, Proceedings of the International Symposium on FRP Reinforcement for Concrete Structures, A.C. Nanni and C.W. Dolan, editors, Vancouver, BC, Canada, 28-31 March 1993.
K. Roko, T.E. Boothby, C.F. Bakis (1999). “Failure modes of sheet bonded fiber
reinforced to brick masonry”, Fourth international symposium on fiber reinforced polymer for RC structures, 1999 (editing by: Charles W. Dolan, Sami H. Rizkalla, and Antonio Nanni).
Laursen P.T., Seible F., Hegemier G.A., and Innamorato D., „Seismic Retrofit and
Repair of Masonry Walls with Carbon Overlays,“ Non-Metallic (FRP) Reinforcement for Concrete Structures, edited by L. Taerwe, RILEM, 1995.
Litherland, K.L., Oakley, D.R., and Proctor, B.A., (1981), “The Use of Accelerated
Ageing Procedures to Predict the Long Term Strength of GRF Composites”, Cement and Concrete Research, Vol. 11
Maeda T., Asano Y., Sato Y., Ueda T., and Kakuta Y. (1997). “A study on bond
mechanism of carbon fiber sheet”, Non-metallic (FRP) reinforcement for concrete structures, Vol. 1, Japan Concrete Institute.
MBrace composite strengthening system engineering design guidelines second
edition (1998). Master Builders, Inc. and Structural Preservation Systems.
University of Missouri - Rolla - C.I.E.S. Università degli studi di Genova - D.I.S.E.G.
344
MDA Composites industries website. www.mdacomposites.org Micelli F., Nanni A. (2001). “Mechanical Properties and Durability of FRP Rods”.
C.I.E.S. report, University of Missouri – Rolla. Miller B. (1999). “Bond between carbon fiber reinforced polymer sheets and
concrete”, UMR thesis, 1999. Morbin A. (2001), “Strengthening of Masonry Elements with FRP Composites”,
C.I.E.S. report, University of Missouri – Rolla. Mukae, K., S. Kumagai, H. Nakai, and H. Asai, (1993). “Characteristics of Aramid
FRP Rod,” ACI SP 138-26, Proceedings of the International Symposium on FRP Reinforcement for Concrete Structures, A.C. Nanni and C.W. Dolan, editors, Vancouver, BC, Canada, 28-31 March 1993.
Nanni A. (1999). “Composites: coming on strong”, Concrete construction, vol. 44,
1999. Pei-Chang H., Nanni A. (1999). “Dapped-end strengthening of precast prestressed
concrete double tee beams with FRP composites”, C.I.E.S. Report – University of Missouri – Rolla.
Post-tensioning institute web site. www.post-tensioning.org. Randy M., Nanni A., Watkins S., Barker M., Bootby T. (1999). “Strengthening of
bridge G-270 with externally bonded CFRP”, C.I.E.S. Report – University of Missouri – Rolla.
Sabnis G.M. (1976). “Interaction between masonry walls and frames in multistory
structures”. First Canadian Masonry Symposium, Calgary, Alberta, 1976. Santoh, Norihiko, (1993). “CFCC (Carbon Fiber Composite Cable): Fiber-
Reinforced-Plastic (FRP) Reinforcement for Concrete Structures: Properties and Applications”, A.C. Nanni, ed., Elsevier Science Publishers B.V., Amsterdam, 1993.
Schwegler G., “Masonry Costruction Strengthened with Fiber Composites in
Seismically Endangered Zones,” Proceedings of the Tenth European Conference on Earthquake Engineering, Rotterdam, 1995.
Taghdi M., Bruneau M., Saatcioglu M. (2000). “Seisming retrofitting of low-rise
masonry and concrete walls using steel strips”. ASCE Journal of Structural Engineering, September 2000.
University of Missouri - Rolla - C.I.E.S. Università degli studi di Genova - D.I.S.E.G.
345
Taljsten B. (1994). “Plate bonding. Strengthening of existing structures with epoxy bonded plates of steel or reinforced plastics”, Doctoral thesis, Lulea University of technology, Sweden.
Tamura, Tomio (1993). “FiBRA: Fiber-Reinforced-Plastic (FRP) Reinforcement for
Concrete Structures: Properties and Applications”, A.C. Nanni, ed., Elsevier Science Publishers B.V., Amsterdam, 1993.
Tinazzi D., Nanni A. (2000). “Assessment of technologies of masonry retrofitting
with FRP”, C.I.E.S. Report – University of Missouri – Rolla. Tumialan G. (2001). “Strengthening of masonry structures with FRP composites”,
Doctoral thesis, University of Missouri – Rolla. Uomoto T., Nishimura T. (1999). “Deterioration of aramid, glass, and carbon fibers
due to alkali, acid and water in different temperature”, Fourth international symposium on fiber reinforced polymer for RC structures, 1999 (editing by: Charles W. Dolan, Sami H. Rizkalla, and Antonio Nanni).
Van Gemert D., Vandewalle L. (2001). “Anchorage of externally bonded steel plates
and CFRP laminates for strengthening of concrete elements”, Doctoral thesis, Katholieke Universiteit Leuven (May 2001).
Velazquez Dimas J.I, Ehsani M.R., and Saadatamtanesh H. (2000). “Out-of-plane
behavior of brick masonry walls strengthened with fiber composites”, ACI Structural Journal, May-June 2000.
Velazquez Dimas J.I, Eshani M.R. (2000). “Modeling out-of-plane behavior of UR
walls retrofitted with fiber composites”, Journal of composites for construction, November 2000.
Vijay, P.V., and Ganga Rao H.V.S., (1999), “Accelerated and Natural Weathering of
Glass Fiber Reinforced Plastic Bars”, Proc. FRPRCS-4, November 1-4th, 1999, Baltimore.
University of Missouri - Rolla - C.I.E.S. Università degli studi di Genova - D.I.S.E.G.
ACKNOWLEDGEMENTS We would like to express our appreciations to all the CIES members for their support
throughout our thesis program. It has been an honour and we are very proud to have
worked with Dr. Antonio Nanni for his availability and extreme intelligence. We
would also acknowledge Jaime Gustavo Tumialan, he has been not only a guide with
all his advises, but also a friend with whom share good times. We would recognize
also the support of Harold Martin from Rolla Technical Institute, Mr. Jason Cox, Jeff
Thomas, Steve Gable, Nestore Galati, Sinaph Namboorimadathil, Danielle Stone,
Antonio Morbin, Dr. J. Myers, Dr. P. Silva, Jeff Bradshaw and also Tong Li, Khaled
El-Domiaty, Xianlin Shen, Anand Khataukar, Sharath Murthy, Xinbao Yang and Yumin
Yang.
Special thanks to “the” Parretti, Jason, Nestore, Danielle, Paolo, Sinaph and Antonio
for the beautiful moments spent together.
Thanks to the CIES staff, Mrs. Ravonda McGauley, Mrs. Gayle Spitzmiller, Mrs.
Susan Tripp, and to all our colleagues.
A special thanks to the National Science Foundation Industry/University Cooperative
Research Center, Repair of Buildings and Bridges with Composites at the University
of Missouri-Rolla for providing the financial and material assistance for the
completion of our research as visiting scholars.
We would like to express also our sincere gratitude to Prof. Sergio Lagomarsino from
the University of Genoa - Italy, who gave us the opportunity to do this fantastic
experience in the United States.
Marco, Olly e Ale
University of Missouri - Rolla - C.I.E.S. Universita’ degli studi di Genova - D.I.S.E.G.
1
BIBLIOGRAPHY American Concrete Institute (ACI), Committee 440 (2001). “Guide for the design and
construction of concrete reinforced with FRP bars”. American Concrete Institute (ACI), Committee 440 (2001). “Guide for the design and
construction of externally bonded FRP system for strengthening concrete structures” (document under review).
American Concrete Institute, Masonry Standard Joint Committee (1999). “Code,
Specifications and Commentaries, ACI-530-99/ASCE 5-99/ TMS 402-99”, American Concrete Institute, American Society of Civil Engineering, The Masonry Society, Detroit, New York and Boulder, 1999.
Angel R., Abrams D.P., Shapiro D., Uzarski J. Webster M. (1994). “Behavior of
reinforced concrete frames with masonry infills”. Structural research series report No. 589, Department of Civil Engeneering, University of Illinois at Urbana-Champaign, March 1994.
ASTM D3039 (1987), American Society for Testing and Materials, "Tensile
Properties of Advanced Composites Materials”. ASTM C1019 (1993), American Society for Testing and Materials, “Test Method
of Sampling and Testing Grout”. ASTM E111 (1997), American Society for Testing and Materials, “Standard Test
Method for Young’s Modulus, Tangent Modulus, and Chord Modulus”. ASTM C1314 (1998), American Society for Testing and Materials, "Standard
Test Method for Constructing and Testing Masonry Prisms Used to Determine Compliance with Specified Compressive Strength of Masonry."
ASTM C270 (1998), American Society for Testing and Materials, "Standard
Specification of Mortar for Unit Masonry". ASTM E518 (2001), American Society for Testing and Materials, “Test Method
E518-00a Standard Test Methods for Flexural Bond Strength of Masonry”. ASTM 638 (2000), American Society for Testing and Materials, “Standard Test
Method for Tensile Properties of Plastics”. Baker L.R., Franken G.L. (1978). “Precracking behavior of laterally loaded
brickwork panels with In-Plane restraints”. Proceedings of the British Ceramic Society, No. 27, 1978.
University of Missouri - Rolla - C.I.E.S. Universita’ degli studi di Genova - D.I.S.E.G.
2
Bank, L.C., (1993) “Properties of FRP Reinforcements for Concrete: Fiber-
Reinforced-Plastic (FRP) Reinforcement for Concrete Structures: Properties and Applications”, A.C. Nanni, ed., Elsevier Science Publishers B.V., Amsterdam, 1993.
Burgoyne, C.J., (1993) “Advanced Composites in Construction”, lecture given at the
Pennsylvania State University, 26 August 1993. C.I.E.S. report – University of Missouri Rolla. Chajes, M.J., Finch W.W.Jr, Januszka T.F., and Thomson T.A. (1996). “Bond and
force transfer of composite materials plates bonded to concrete”, ACI Structural Journal, ACI, Vol. 93, No. 2.
De Lorenzis L., A. Nanni (2000). “Strengthening of RC structures with near surface
mounted rods”, C.I.E.S. report – University of Missouri Rolla. De Lorenzis L., Miller B. and Nanni A. (2000). “Bond of FRP laminates to concrete”,
ACI Structures Journal, July 2000. Devalapura, R.K., Gauchel, J.V., Greenwood, M.E., Hankin, A., and Humphrey, T.
(1997), “Long-Term Durability of GFRP Composites in Alkaline Environments”, Proc. 3rd Non-Metallic (FRP) Reinforcement for Concrete Structures, International Symposium, Sapporo, Japan, October 14-16th 1997, Sapporo Japan, Vol.2.
Dixon Troy O. (1994). “Behavior of Anchor/Tendon Systems for Prestressed FRP
Construction”, Pennsylvania State University thesis. Drysdale G. R., Hamid A. A., Baker R. L. (1999). “Masonry Structures – Behavior
and design”, The Masonry Society, Boulder, Colorado. Ehsani M.R. and Saadatmanesh H. (1996), “Repair and Strengthening of Earthquake-
Damaged Concrete and Masonry Walls with Composite Fabrics”, First International Conference on Composites in Infrastructure ICCI’96, Tucson, Arizona, January 1996.
Erki, M.A. and S.H. Rizkalla, “Anchorages for FRP Reinforcement” Concrete
International, ACI, June 1993b. Franke, L. and Overback, E., (1987), “Loss in strength and damage to glass fibers in
alkaline solutions and cement extracts”, Dur. Build. Mat., No.5, 1987. Gabrielsen B.L., Kaplan K., Wilton C. (1975). “A study of arching in non-reinforced
masonry walls”. SSI 748-1, Scientific Services, Inc., Redwood City, CA, 1975.
University of Missouri - Rolla - C.I.E.S. Universita’ degli studi di Genova - D.I.S.E.G.
3
Ganga Rao, H.V.S., and, Vijay P.V., (1997), “Aging of Structural Composites Under
Varying Environmental Conditions”, Proc. 3rd Non-Metallic (FRP) Reinforcement for Concrete Structures, International Symposium, Sapporo, Japan, October 14-16th 1997, Sapporo Japan, Vol.2,
Gerritse, A., and J. Werner, (1988). “ARAPREE: The Prestressing Element
Composed of Resin Bonded Twaron® Fibres”, Manufacturer’s Report, Rijswijk, Netherlands.
Gilstrap J.M., Dolan C.W. (1998). “Out-of-plane bending of FRP reinforced masonry
walls”, Composites science and technology, 1998. Hamilton H.R. III, Holberg A., Caspersen J., and Dolan C.W. (1999), “Strengthening
Concrete Masonry with Fiber Reinforced Polymers”, Fourth International Symposium on Fiber Reinforced Polymer (FRP) for Reinforced Concrete Structures, Baltimore, Maryland, November 1999.
Hendry H.W. (1981), Structural Brickwork. The Macmillan Press Ltd.m London,
1981. Holte, L.E., C.W. Dolan, and R.J. Schmidt, (1993). “Epoxy Socketed Anchors for
Non-Metallic Prestressing Tendons”, ACI SP 138-26, Proceedings of the International Symposium on FRP Reinforcement for Concrete Structures, A.C. Nanni and C.W. Dolan, editors, Vancouver, BC, Canada, 28-31 March 1993.
K. Roko, T.E. Boothby, C.F. Bakis (1999). “Failure modes of sheet bonded fiber
reinforced to brick masonry”, Fourth international symposium on fiber reinforced polymer for RC structures, 1999 (editing by: Charles W. Dolan, Sami H. Rizkalla, and Antonio Nanni).
Laursen P.T., Seible F., Hegemier G.A., and Innamorato D., „Seismic Retrofit and
Repair of Masonry Walls with Carbon Overlays,“ Non-Metallic (FRP) Reinforcement for Concrete Structures, edited by L. Taerwe, RILEM, 1995.
Litherland, K.L., Oakley, D.R., and Proctor, B.A., (1981), “The Use of Accelerated
Ageing Procedures to Predict the Long Term Strength of GRF Composites”, Cement and Concrete Research, Vol. 11
Maeda T., Asano Y., Sato Y., Ueda T., and Kakuta Y. (1997). “A study on bond
mechanism of carbon fiber sheet”, Non-metallic (FRP) reinforcement for concrete structures, Vol. 1, Japan Concrete Institute.
MBrace composite strengthening system engineering design guidelines second
edition (1998). Master Builders, Inc. and Structural Preservation Systems.
University of Missouri - Rolla - C.I.E.S. Universita’ degli studi di Genova - D.I.S.E.G.
4
MDA Composites industries website. www.mdacomposites.org Micelli F., Nanni A. (2001). “Mechanical Properties and Durability of FRP Rods”.
C.I.E.S. report, University of Missouri – Rolla. Miller B. (1999). “Bond between carbon fiber reinforced polymer sheets and
concrete”, UMR thesis, 1999. Morbin A. (2001), “Strengthening of Masonry Elements with FRP Composites”,
C.I.E.S. report, University of Missouri – Rolla. Mukae, K., S. Kumagai, H. Nakai, and H. Asai, (1993). “Characteristics of Aramid
FRP Rod,” ACI SP 138-26, Proceedings of the International Symposium on FRP Reinforcement for Concrete Structures, A.C. Nanni and C.W. Dolan, editors, Vancouver, BC, Canada, 28-31 March 1993.
Nanni A. (1999). “Composites: coming on strong”, Concrete construction, vol. 44,
1999. Pei-Chang H., Nanni A. (1999). “Dapped-end strengthening of precast prestressed
concrete double tee beams with FRP composites”, C.I.E.S. Report – University of Missouri – Rolla.
Post-tensioning institute web site. www.post-tensioning.org. Randy M., Nanni A., Watkins S., Barker M., Bootby T. (1999). “Strengthening of
bridge G-270 with externally bonded CFRP”, C.I.E.S. Report – University of Missouri – Rolla.
Sabnis G.M. (1976). “Interaction between masonry walls and frames in multistory
structures”. First Canadian Masonry Symposium, Calgary, Alberta, 1976. Santoh, Norihiko, (1993). “CFCC (Carbon Fiber Composite Cable): Fiber-
Reinforced-Plastic (FRP) Reinforcement for Concrete Structures: Properties and Applications”, A.C. Nanni, ed., Elsevier Science Publishers B.V., Amsterdam, 1993.
Schwegler G., “Masonry Costruction Strengthened with Fiber Composites in
Seismically Endangered Zones,” Proceedings of the Tenth European Conference on Earthquake Engineering, Rotterdam, 1995.
University of Missouri - Rolla - C.I.E.S. Universita’ degli studi di Genova - D.I.S.E.G.
5
Taghdi M., Bruneau M., Saatcioglu M. (2000). “Seisming retrofitting of low-rise masonry and concrete walls using steel strips”. ASCE Journal of Structural Engineering, September 2000.
Taljsten B. (1994). “Plate bonding. Strengthening of existing structures with epoxy
bonded plates of steel or reinforced plastics”, Doctoral thesis, Lulea University of technology, Sweden.
Tamura, Tomio (1993). “FiBRA: Fiber-Reinforced-Plastic (FRP) Reinforcement for
Concrete Structures: Properties and Applications”, A.C. Nanni, ed., Elsevier Science Publishers B.V., Amsterdam, 1993.
Tinazzi D., Nanni A. (2000). “Assessment of technologies of masonry retrofitting
with FRP”, C.I.E.S. Report – University of Missouri – Rolla. Tumialan G. (2001). “Strengthening of masonry structures with FRP composites”,
Doctoral thesis, University of Missouri – Rolla. Uomoto T., Nishimura T. (1999). “Deterioration of aramid, glass, and carbon fibers
due to alkali, acid and water in different temperature”, Fourth international symposium on fiber reinforced polymer for RC structures, 1999 (editing by: Charles W. Dolan, Sami H. Rizkalla, and Antonio Nanni).
Van Gemert D., Vandewalle L. (2001). “Anchorage of externally bonded steel plates
and CFRP laminates for strengthening of concrete elements”, Doctoral thesis, Katholieke Universiteit Leuven (May 2001).
Velazquez Dimas J.I, Ehsani M.R., and Saadatamtanesh H. (2000). “Out-of-plane
behavior of brick masonry walls strengthened with fiber composites”, ACI Structural Journal, May-June 2000.
Velazquez Dimas J.I, Eshani M.R. (2000). “Modeling out-of-plane behavior of UR
walls retrofitted with fiber composites”, Journal of composites for construction, November 2000.
Vijay, P.V., and Ganga Rao H.V.S., (1999), “Accelerated and Natural Weathering of
Glass Fiber Reinforced Plastic Bars”, Proc. FRPRCS-4, November 1-4th, 1999, Baltimore.