CENTER FOR SOCIAL SERVICES RESEARCH School of Social Welfare, UC Berkeley Black/White and Black/Hispanic Racial Disparity in Child Welfare: Controlling for Poverty Status and Findings from Linkages to Birth Record Data Barbara Needell, PhD, MSW Emily Putnam-Hornstein, PhD, MSW Center for Social Services Research University of California at Berkeley We gratefully acknowledge the support of the California Department of Social Services, the Stuart Foundation, & Casey Family Programs
Transcript
CENTER FOR SOCIAL SERVICES RESEARCH School of Social Welfare, UC Berkeley
Black/White and Black/Hispanic Racial Disparity in Child Welfare:
Controlling for Poverty Statusand
Findings from Linkages to Birth Record Data
Barbara Needell, PhD, MSWEmily Putnam-Hornstein, PhD, MSWCenter for Social Services Research University of California at Berkeley
We gratefully acknowledge the support of the California Department of Social Services, the Stuart Foundation, & Casey Family Programs
CENTER FOR SOCIAL SERVICES RESEARCH School of Social Welfare, UC Berkeley
poverty data
• 2005-2010 estimates of the population of children (ages 0-17) living in poverty by race/ethnicity
• using the U.S. Census Bureau's 2005-2009 American Community Survey (ACS) 5-Year Estimates, poverty multipliers were calculated by race/ethnicity for California and each of its 58 counties
• multiplier applied to the California Department of Finance Population Estimates for the years 2005-2010http://cssr.berkeley.edu/ucb_childwelfare/population.aspx
CENTER FOR SOCIAL SERVICES RESEARCH School of Social Welfare, UC Berkeley
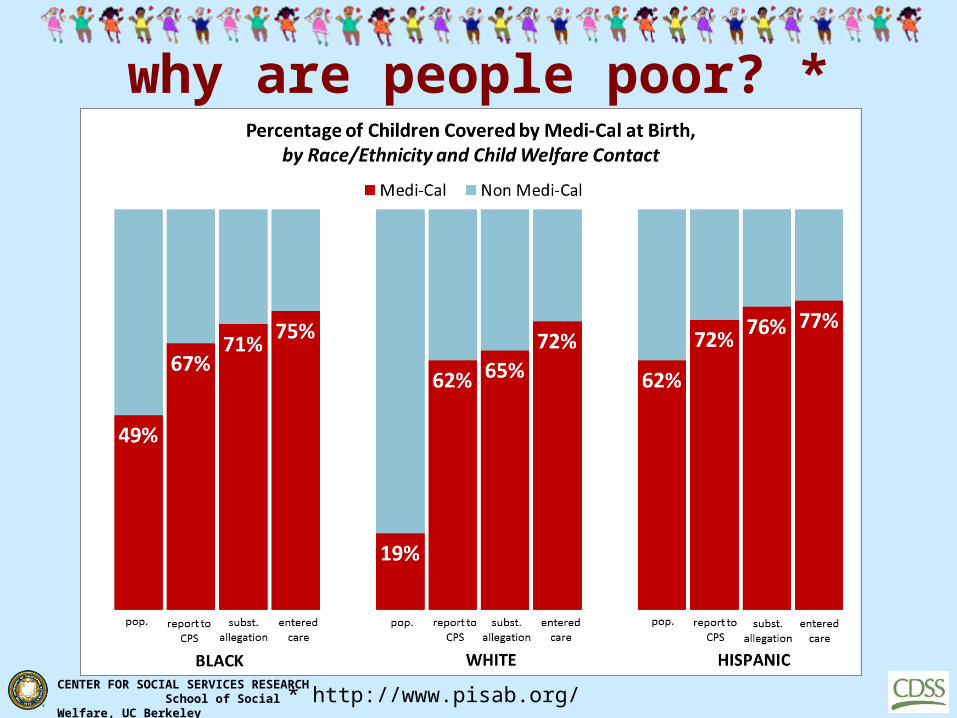
why are people poor? *2010 Estimates of CA Children in Poverty • Black 28%• White 8%• Hispanic 26%• Asian/PI 11%• Native American 25%
* http://www.pisab.org/
CENTER FOR SOCIAL SERVICES RESEARCH School of Social Welfare, UC Berkeley
CENTER FOR SOCIAL SERVICES RESEARCH School of Social Welfare, UC Berkeley
CENTER FOR SOCIAL SERVICES RESEARCH School of Social Welfare, UC Berkeley
definitionsdisproportionality: when a group makes up a proportion of those
experiencing some event that is higher or lower than that group’s proportion of the population
disparity: a comparison of one group (e.g, regarding disproportionality, services, outcomes) to another group
population in poverty: disproportionality calculated using the population of children in poverty rather than the general population (census)
CENTER FOR SOCIAL SERVICES RESEARCH School of Social Welfare, UC Berkeley
%%
white
black
disproportionality disparity
% %
% %
Ratio
white
black
CENTER FOR SOCIAL SERVICES RESEARCH School of Social Welfare, UC Berkeley
Population (9,989,397)
Entries (30,442)
0%
10%
20%
30%
40%
50%
60%
70%
80%
90%
100%
5.918.9
31.5
27.0
51.4
50.2
10.72.70.5 1.2
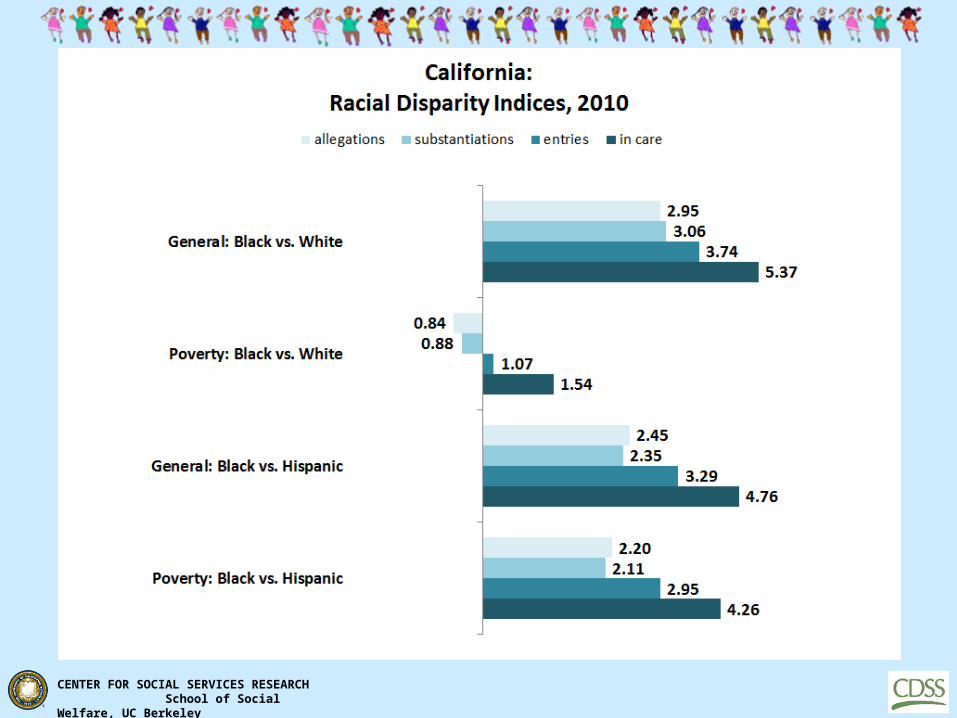
California: General Population Disparity Index
Entry Disparity (relative to overall population)
Native American
Asian/PI
Hispanic
White
Black
Black Disproportionality 18.9% 5.9% = 3.21
White Disproportionality 27.0% 31.5% = 0.86
Hispanic Disproportionality 50.2% 51.4% = 0.98
Black vs. White Disparity Index 3.21 0.86 = 3.74
Black vs. Hispanic Disparity Index 3.21 0.98 = 3.29
CENTER FOR SOCIAL SERVICES RESEARCH School of Social Welfare, UC Berkeley
Black Disproportionality 18.9% 9.0% = 2.11
White Disproportionality 27.0% 13.7% = 1.97
Hispanic Disproportionality 50.2% 70.2% = 0.72
Black vs. White Disparity Index 2.11 1.97 = 1.07
Black vs. Hispanic Disparity Index 2.11 0.72 = 2.95
CENTER FOR SOCIAL SERVICES RESEARCH School of Social Welfare, UC Berkeley
CENTER FOR SOCIAL SERVICES RESEARCH School of Social Welfare, UC Berkeley
data• Unique dataset constructed by linking children reported for
maltreatment during the first five years of life to their birth record– state CWS/CMS records linked to vital birth records– probabilistic methods (84% of child welfare records matched)
• 530,843 children born alive in CA in 2002– 14% reported for maltreatment (N=74,182)– 6% substantiated as a victims (N=27,805)– 0.8% entered foster care (N=4,388)
• Racial disparities?– examined aggregate Black vs. White and Black vs. Hispanic disparity
across decision points– estimated child level risk at each decision point, after adjusting for
other risk factors
CENTER FOR SOCIAL SERVICES RESEARCH School of Social Welfare, UC Berkeley
why are people poor? *
* http://www.pisab.org/
CENTER FOR SOCIAL SERVICES RESEARCH School of Social Welfare, UC Berkeley
95% Confidence Interval Black vs. Hispanic Risk Ratio
Risk
Rati
os(p
lott
ed o
n lo
garit
hmic
scal
e)California's 2002 Birth Cohort
Black vs. Hispanic Disparities
CENTER FOR SOCIAL SERVICES RESEARCH School of Social Welfare, UC Berkeley
the problem with summary statistics:
The average human has one breast and one testicle. *
* ~Des McHale www.quotegarden.com/statistics.html
CENTER FOR SOCIAL SERVICES RESEARCH School of Social Welfare, UC Berkeley
what is hidden beneath the summary statistics?
• Significant racial variations in the presence of risk factors that are associated with disparities…
• In multivariate models, we adjusted for twelve sociodemographic and biomedical risk factors for contact with child protective services:
• child’s sex (n.s.), low birth weight, birth abnormality, prenatal care, maternal birth place, maternal race/ethnicity, birth payment method, maternal age, maternal education, abortion history, paternity information, birth order
• Significant interactions between a number of covariates and Medi-Cal coverage led us to stratify models
CENTER FOR SOCIAL SERVICES RESEARCH School of Social Welfare, UC Berkeley
2.25
1.15 1.10
0.91
2.62
1.47
Full Birth Cohort Medi-Cal Non Medi-Cal
crude
adj*crude
adj*
crude
adj*
Risk
Rati
os(p
lott
ed o
n lo
garit
hmic
scal
e)
95% Confidence Interval Black vs. White RR
*includes adjustments for other risk factors at birthCalifornia's 2002 Birth Cohort
Black vs. White Referral Disparities
N=530,843 N=226,904 N=302,259
CENTER FOR SOCIAL SERVICES RESEARCH School of Social Welfare, UC Berkeley
2.46
0.99 1.03
0.78
3.03
1.41
crude
adj* crude
adj*
crude
adj*
Risk
Rati
os(p
lott
ed o
n lo
garit
hmic
scal
e)
95% Confidence Interval Black vs. White RR
*includes adjustments for other risk factors at birthCalifornia's 2002 Birth Cohort
Black vs. White Substantiation Disparities
N=530,843 N=226,904 N=302,259Full Birth Cohort Medi-Cal Non Medi-Cal
CENTER FOR SOCIAL SERVICES RESEARCH School of Social Welfare, UC Berkeley
2.55
0.971.07
0.79
3.64
1.39
crude
adj*
crude
adj*
crude
adj*
Risk
Rati
os(p
lott
ed o
n lo
garit
hmic
scal
e)
95% Confidence Interval Black vs. White RR
*includes adjustments for other risk factors at birthCalifornia's 2002 Birth Cohort
Black vs. White Foster Care Entry Disparities
N=530,843 N=226,904 N=302,259Full Birth Cohort Medi-Cal Non Medi-Cal
CENTER FOR SOCIAL SERVICES RESEARCH School of Social Welfare, UC Berkeley
2.10
1.46
2.45
1.35
1.89
1.60
crude
adj*
crude
adj*
crude
adj*
Full Birth Cohort Medi-Cal Non Medi-Cal
Risk
Rati
os(p
lott
ed o
n lo
garit
hmic
scal
e)
95% Confidence Interval Black vs. Hispanic RR
*includes adjustments for other risk factors at birthCalifornia's 2002 Birth Cohort
Black vs. Hispanic Referral Disparities
N=530,843 N=266,904 N=302,259
CENTER FOR SOCIAL SERVICES RESEARCH School of Social Welfare, UC Berkeley
2.61
1.51
3.30
1.38
2.18
1.70
crude
adj*
crude
adj*
crude
adj*
Full Birth Cohort Medi-Cal Non Medi-Cal
Risk
Rati
os(p
lott
ed o
n lo
garit
hmic
scal
e)
95% Confidence Interval Black vs. Hispanic RR
*includes adjustments for other risk factors at birthCalifornia's 2002 Birth Cohort
Black vs. Hispanic Substantiation Disparities
N=530,843 N=266,904 N=302,259
CENTER FOR SOCIAL SERVICES RESEARCH School of Social Welfare, UC Berkeley
3.21
1.49
3.95
1.37
2.65
1.75
crude
adj*
crude
adj*
crude
adj*
Full Birth Cohort Medi-Cal Non Medi-Cal
Risk
Rati
os(p
lott
ed o
n lo
garit
hmic
scal
e)
95% Confidence Interval Black vs. Hispanic RR
*includes adjustments for other risk factors at birthCalifornia's 2002 Birth Cohort
Black vs. Hispanic Foster Care Entry Disparities
N=530,843 N=266,904 N=302,259
CENTER FOR SOCIAL SERVICES RESEARCH School of Social Welfare, UC Berkeley
1.15
0.99 0.970.91
0.78 0.79
1.47 1.41 1.39
full cohortreferral
disparity
full cohortsubst.
disparity
full cohortentry
disparity
medi-calreferral
disparity
medi-calsubst.
disparity
medi-calentry
disparity
nonmedi-calreferral
disparity
nonmedi-cal
subst.disparity
nonmedi-cal
entrydisparity
95% Confidence Interval Black vs. White RR
Risk
Rati
os(p
lott
ed o
n lo
garit
hmic
scal
e)after adjusting for other risk factors at birthCalifornia's 2002 Birth Cohort
Black vs. White Disparities
CENTER FOR SOCIAL SERVICES RESEARCH School of Social Welfare, UC Berkeley
1.46 1.51 1.491.35 1.38 1.37
1.601.70 1.75
full cohortreferral
disparity
full cohortsubst.
disparity
full cohortentry
disparity
medi-calreferral
disparity
medi-calsubst.
disparity
medi-calentry
disparity
nonmedi-calreferral
disparity
nonmedi-cal
subst.disparity
nonmedi-cal
entrydisparity
95% Confidence Interval Black vs. Hispanic RR
Risk
Rati
os(p
lott
ed o
n lo
garit
hmic
scal
e)after adjusting for other risk factors at birth
California's 2002 Birth CohortBlack vs. Hispanic Disparities
CENTER FOR SOCIAL SERVICES RESEARCH School of Social Welfare, UC Berkeley
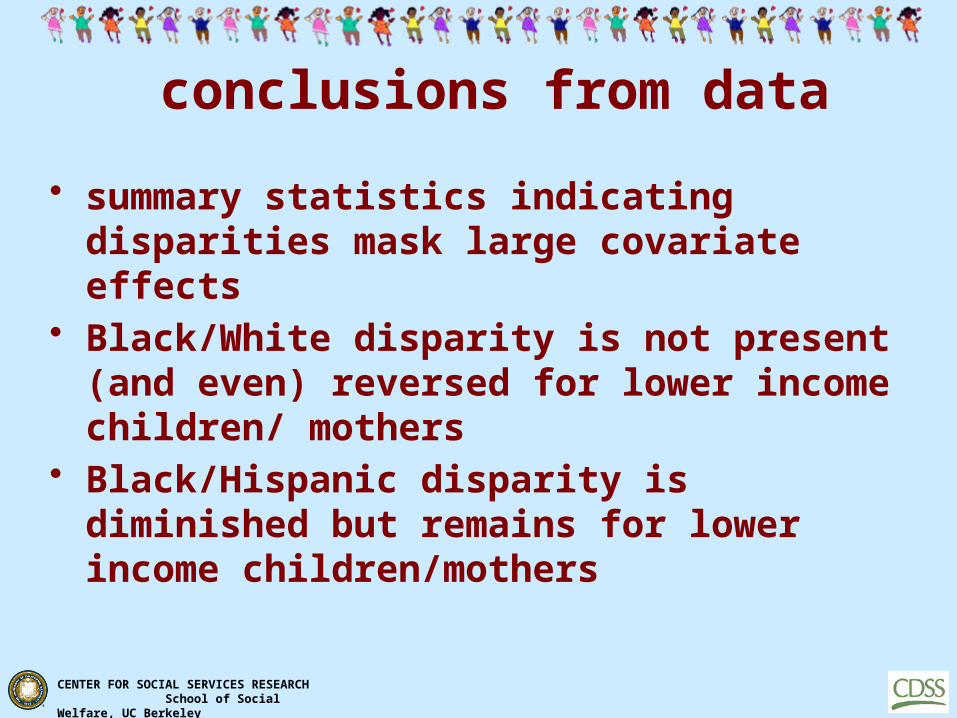
conclusions from data
• summary statistics indicating disparities mask large covariate effects
• Black/White disparity is not present (and even) reversed for lower income children/ mothers
• Black/Hispanic disparity is diminished but remains for lower income children/mothers
CENTER FOR SOCIAL SERVICES RESEARCH School of Social Welfare, UC Berkeley
more questions than answers…
• Are the service needs of Black, Hispanic, and White children and families being addressed?
• Are “thresholds” the same for Black, Hispanic, and White children and families?
• What are the appropriate rates for Black, Hispanic, and White children (and children of other race/ethnicities)?
CENTER FOR SOCIAL SERVICES RESEARCH School of Social Welfare, UC Berkeley
Needell, B., Webster, D., Armijo, M., Lee, S., Dawson, W., Magruder, J., Exel, M., Cuccaro-Alamin, S., Putnam-Hornstein, E., Williams, D., Simon, V., Hamilton, D., Lou, C., Peng, C., Moore, M., Jacobs, L., & King, B. (2011). Child Welfare Services Reports for California. Retrieved 7/4/2011, from University of California at Berkeley Center for Social Services Research website. URL: http://cssr.berkeley.edu/ucb_childwelfare.