Central Oregon Regional Transit Master Plan | Volume II: Surveys and Market Research Central Oregon Intergovernmental Council Central Oregon Intergovernmental Council CENTRAL OREGON REGIONAL TRANSIT MASTER PLAN Volume IV: Service Plan Appendices A-B July 2013
Transcript
Central Oregon Regional Transit Master Plan | Volume II: Surveys and Market Research
Central Oregon Intergovernmental Council
Nelson\Nygaard Consulting Associates Inc. | i
Central Oregon Intergovernmental Council
CENTRAL OREGON REGIONAL TRANSIT MASTER PLAN
Volume IV: Service Plan
Appendices A-B
July 2013
Regional Transit Master Plan| Volume IV Service Plan
Central Oregon Intergovernmental Council
Nelson\Nygaard Consulting Associates Inc. | i
Table of Contents
Page
APPENDIX A Transit Demand Estimates Methodology ..................................................... A-1
APPENDIX B Service Planning Data ...................................................................................B-1 Overall Performance Data ................................................................................................................... B-1 Community Connector ............................................................................................................................ B-2 Local Public Bus (General Public Dial-A-Ride) ............................................................................... B-14
Table of Figures
Page
Figure A-1 Data Sources .......................................................................................................................... A-2
Figure A-2 Explanation of Adjustment Factors and Rating Methodology ..................................... A-5
Figure A-3 Local Adjustments .................................................................................................................. A-6
Figure A-4 Supporting Data for Local Adjustments and Projected 2030 Baseline Ridership ................................................................................................................................. A-6
Figure B-4 Daily Boardings by Community Connector Route, October 2012 ............................... B-4
Figure B-5 Daily Boardings by Community Connector Route, January 2013 ............................... B-4
Figure B-6 Daily Boardings by Trip, Route 24 Bend-Redmond, October 2012 ........................... B-5
Figure B-7 Daily Boardings by Trip, Route 24 Bend-Redmond, January 2013 ........................... B-5
Figure B-8 Daily Boardings by Trip, Route 26 Redmond-Prineville, October 2012 ................... B-6
Figure B-9 Daily Boardings by Trip, Route 26 Redmond-Prineville, January 2013 .................... B-6
Figure B-10 Daily Boardings by Stop, Route 26 Redmond-Prineville, October 2012 (AM) .......................................................................................................................................... B-7
Figure B-11 Daily Boardings by Stop, Route 26 Redmond-Prineville, January 2013 (AM)......... B-7
Figure B-12 Daily Boardings by Stop, Route 26 Redmond-Prineville, October 2012 (PM) ........ B-8
Figure B-13 Daily Boardings by Stop, Route 26 Redmond-Prineville, January 2013 (PM) ......... B-8
Figure B-14 Daily Boardings by Trip, Route 30 Bend-La Pine, October 2012............................... B-9
Figure B-15 Daily Boardings by Trip, Route 30 Bend-La Pine, January 2013 ............................... B-9
Figure B-16 Daily Boardings by Trip, Route 22 Redmond-Madras, October 2012 ................... B-10
Figure B-17 Daily Boardings by Trip, Route 22 Redmond-Madras, January 2013 ................... B-10
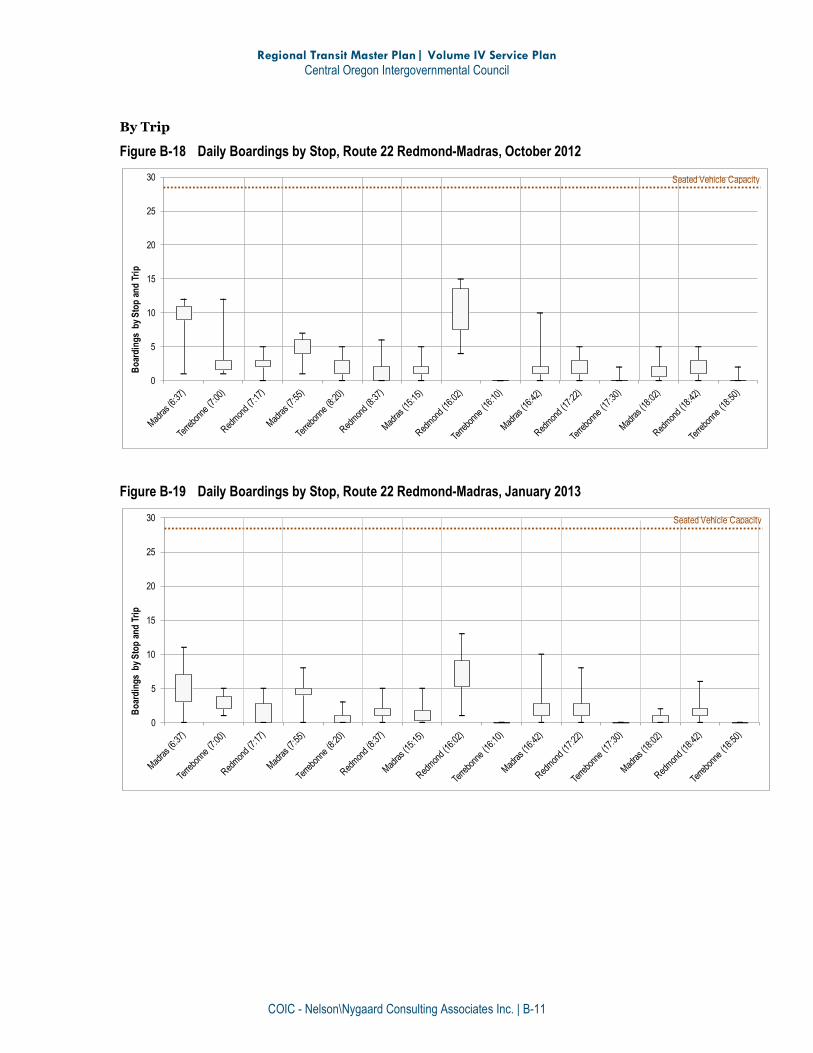
Figure B-18 Daily Boardings by Stop, Route 22 Redmond-Madras, October 2012 ................. B-11
Figure B-19 Daily Boardings by Stop, Route 22 Redmond-Madras, January 2013 .................. B-11
Figure B-20 Daily Boardings by Trip, Route 28 Redmond-Sisters, October 2012 ..................... B-12
Figure B-21 Daily Boardings by Trip, Route 28 Redmond-Sisters, January 2013 ...................... B-12
Figure B-22 Daily Boardings by Stop, Route 28 Redmond-Sisters, October 2012 .................... B-13
Figure B-23 Daily Boardings by Stop, Route 28 Redmond-Sisters, January 2013 ..................... B-13
Figure B-24 Redmond Local Public Bus Vehicles by Time, Daily Average 11/5 - 11/9/2012 ......................................................................................................................... B-14
Regional Transit Master Plan| Volume IV Service Plan
Central Oregon Intergovernmental Council
Nelson\Nygaard Consulting Associates Inc. | ii
Figure B-25 Redmond Local Public Bus Rides by Time, Daily Average 11/5 - 11/9/2012 (Table) ........................................................................................................... B-15
Figure B-26 Redmond Local Public Bus Rides by Time, Daily Average 11/5 - 11/9/2012 (Chart)............................................................................................................ B-15
Figure B-27 La Pine Local Public Bus Rides by Time, Daily Average 11/5 - 11/9/2012 (Table) ................................................................................................................................... B-16
Figure B-28 La Pine Local Public Bus Rides by Time, Daily Average 11/5 - 11/9/2012 (Chart) ................................................................................................................................... B-16
Figure B-29 Madras-Culver-Metolius Local Public Bus Rides by Time, Daily Average 11/5 - 11/9/2012 (Table) ............................................................................................. B-17
Figure B-30 Madras-Culver-Metolius Local Public Bus Rides by Time, Daily Average 11/5 - 11/9/2012 (Chart) .............................................................................................. B-17
Figure B-31 Prineville Local Public Bus Rides by Time, Daily Average 11/5 - 11/9/2012 (Table) ........................................................................................................... B-18
Figure B-32 Prineville Local Public Bus Rides by Time, Daily Average 11/5 - 11/9/2012 (Chart)............................................................................................................ B-18
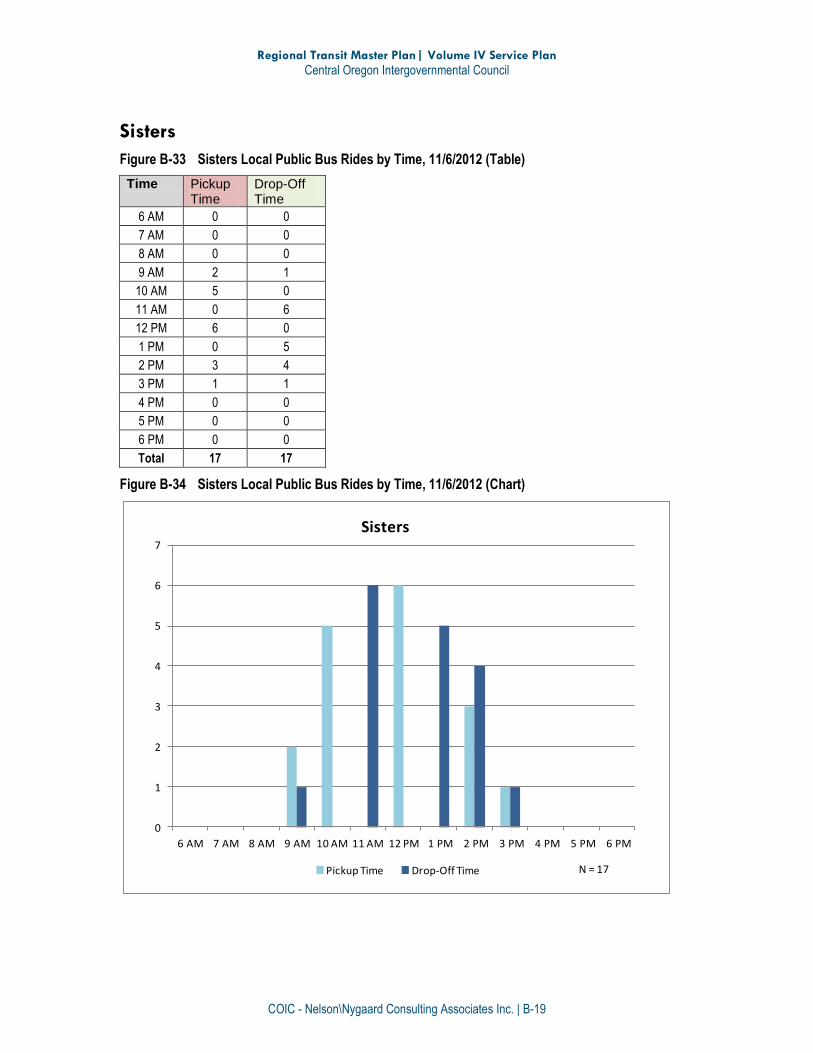
Figure B-33 Sisters Local Public Bus Rides by Time, 11/6/2012 (Table) ..................................... B-19
Figure B-34 Sisters Local Public Bus Rides by Time, 11/6/2012 (Chart) ...................................... B-19
Figure B-35 Terrebonne Local Public Bus Rides by Time, Daily Average 11/5 - 11/9/2012 (Table) ........................................................................................................... B-20
Figure B-36 Terrebonne Local Public Bus Rides by Time, Daily Average 11/5 - 11/9/2012 (Chart)............................................................................................................ B-20
Regional Transit Master Plan| Volume IV Service Plan
Central Oregon Intergovernmental Council
COIC - Nelson\Nygaard Consulting Associates Inc. | A-1
APPENDIX A TRANSIT DEMAND ESTIMATES METHODOLOGY
This appendix describes the approach taken to assess future transit market potential for both
local intra-community trips and regional inter-city trips. The purpose of this assessment was to
identify those transit markets in the CET service area that have strong potential for future service
enhancements. Based on the results of the assessment, potential service types were identified
that are appropriate for serving intra-community and inter-community trips in these transit
markets and service concepts were developed.
Methodology
Demand/Ridership Estimation Approach
The project team used the following approach1 to develop estimates of future transit demand in
and between the communities in the CET service area:
The regional travel demand model provided the number of
daily trips within and between cities in both current and
future years.
The 2003 base year for the model was adjusted to the
current year (2012), assuming constant annual
growth.
Other sources were be used to validate/supplement
the model, e.g., work trips (U.S. Census LEHD).
Existing ridership data (2012) was used to determine the
existing transit mode split (the travel demand model does
not address transit).
Market potential was evaluated qualitatively based on a
series of adjustment factors (see below).
The existing mode split was adjusted and used to estimate
future (2030) transit market potential.
1 In the initial version of this memo, a “population segmentation” method was planned for the intra-community demand estimates, anticipating that travel demand model data would not be available for intra-community trips. This method utilizes population data from the U.S. Census, broken out by age, and per-capita transit trip rates from the National Household Travel Survey (NHTS). These broad average trip rates would then need to be adjusted for local conditions. However, regional travel demand model data was available for all local communities and this alternative method was not required.
Total Trips(Travel Demand Model)
Transit Trips(CET Ridership Data)
Actual Transit Mode Split
Potential Transit Trips (including latent demand)
Potential Transit Trips (including latent demand)
Assign Low, Medium, or High rating
Assess Market Potential
Adjust Mode SplitAdjust Mode Split
Regional Transit Master Plan| Volume IV Service Plan
Central Oregon Intergovernmental Council
COIC - Nelson\Nygaard Consulting Associates Inc. | A-2
Data Inputs
Figure A-1 summarizes the key data inputs and identifies whether they were used to estimate local
and/or regional transit demand.
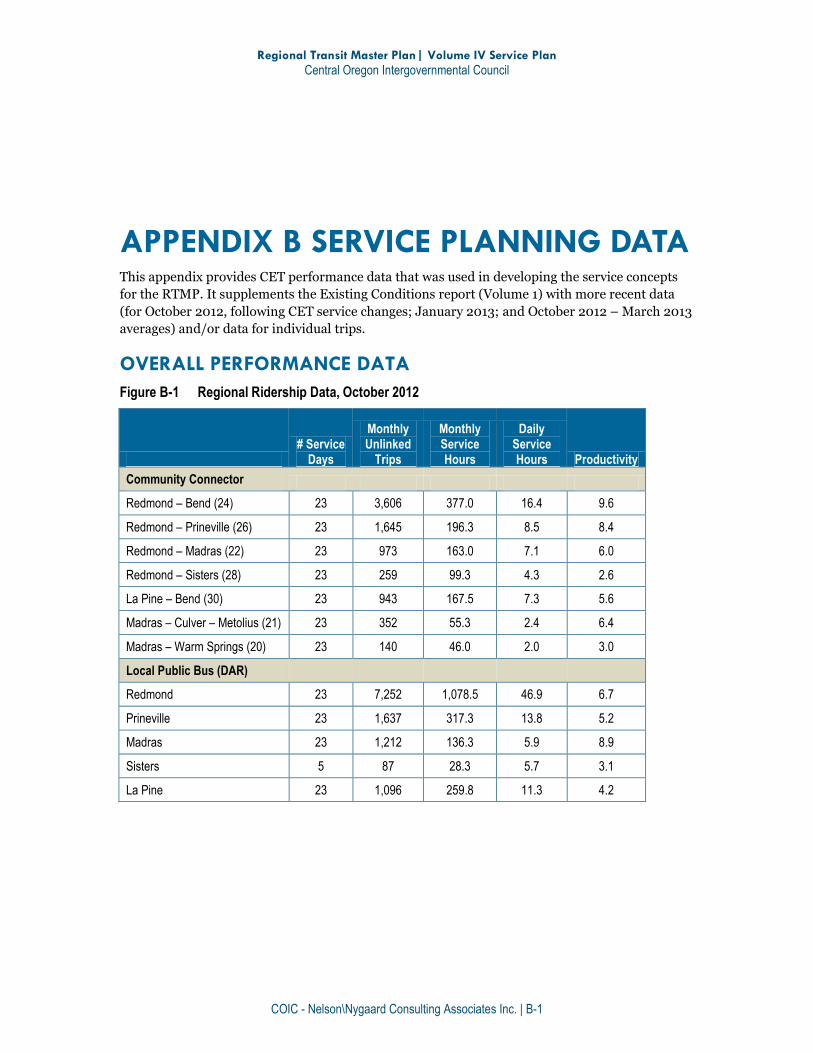
Figure A-1 Data Sources
Data Source Local Regional
Travel demand model, current (2003) and future (2030) years, by trip purpose X X
Work-based travel flows, LEHD, 2010 X X
Existing transit ridership (Community Connector and Local Public Bus), CET, 2012 X X
Community preferences survey (conducted region-wide) in 2012 X X
On-board passenger surveys (Community Connector and Local Public Bus) – trip purpose, origin-destination, transfer patterns, etc.)
X X
Population, 2010 Census, by age X
Mode Split Adjustments
When people choose to use transit they must weigh a number of complex and inter-related factors
before deciding it is the right mode for them. For example, people must consider the cost, time,
and convenience of all of their travel options before making a decision. While people are adept at
making these complex decisions, and can do so with relative ease, it is much more difficult to
predict future transit travel behavior based solely on model data. Still, model data is the best
place to start and provides planners with a basis from which to estimate how many of those trips
could potentially be made on transit.
To help refine the demand estimation process, a number of “adjustment factors” (first column of
Figure A-2) were used to make an assessment of the future market potential for transit. Each
factor was assessed on a Low-Medium-High rating scale, based on data and/or local knowledge,
and each local community or regional travel corridor was assessed as having either a Low,
Medium or High potential for future transit enhancements. A rating of Low does not necessarily
mean that transit demand is low, but rather that the potential for enhancements over what is
currently being provided is low.
Figure A-2 identifies the data source for each adjustment factor and describes how these factors
were evaluated within each community and for each regional connection (origin-destination pair).
The project team developed an initial assessment, requested that TAC members provide input
and/or modify/refine the initial assessment based on their knowledge and understanding of each
community and the region, and revised the assessment based on feedback received.
Figure A-3 provides an assessment table for local communities; Figure A-4 provides supporting
quantitative data for intra-community travel that can be used as reference for the adjustments in
Figure A-3.
Figure A-5 provides an assessment table for regional connections; Figure A-6 provides supporting
quantitative data for inter-community travel that can be used as reference for the adjustments in
Figure A-5
Regional Transit Master Plan| Volume IV Service Plan
Central Oregon Intergovernmental Council
COIC - Nelson\Nygaard Consulting Associates Inc. | A-3
2012 Estimated Transit Mode Split and 2030 Baseline Transit Ridership
Figure A-4 (intra-community) and Figure A-6 (inter-community) include the following estimates.
Existing (2012) ridership and mode split2. For inter-community trips, it should be
emphasized that transit ridership represents linked trips, i.e., a trip from Prineville to
Bend is counted as a single linked trip, but represents two unlinked trips — one on the
Prineville – Redmond and one on the Redmond – Bend Community Connector routes.3
For each transit market (origin-destination for the linked transit trip), the 2012 mode
split was calculated as 2012 linked transit trips divided by the 2012 number of total trips,
from the travel demand model.4 The Existing Conditions Volume and Appendix B of this
volume provide additional background on existing use of the Community Connector
service, including unlinked trips, productivity, and existing vehicle capacity.
Unadjusted baseline 2030 transit ridership estimate. This represents projected
2030 travel demand assuming the estimated 2012 mode split. It does not reflect response
to potential service changes, which could help attract unmet demand. Although this
estimate is a useful data point, it reflects a degree of uncertainty in existing linked transit
trips and total trips, as described in footnotes. Its primary use is for comparing ridership
estimates for specific service enhancements to the baseline level (no enhancements) in
each transit market, i.e., on a relative rather than absolute basis.
2 Mode split is the share of all trips for a particular travel mode. It is differentiated from mode share, which typically describes use of a particular mode for work trips, such as in the American Community Survey. The transit mode split is typically lower than the transit mode share.
3 The number of linked trips was estimated based on the on-board survey conducted on Community Connector routes, which provided a sample of passenger origin-destination patterns over an approximately week-long period. A more comprehensive survey that captures origin-destination patterns of all Community Connector riders on a given day would allow a more accurate estimate of linked trips to be developed.
4 The number of total trips in 2012 was a straight-line estimate assuming a constant rate of growth between 2003 and 2030 (the base and future years for the model). Due to the economic downturn, this likely overstates actual 2012 travel demand (particularly for work trips), and therefore results in a lower mode split.
Regional Transit Master Plan| Volume IV Service Plan
Central Oregon Intergovernmental Council
COIC - Nelson\Nygaard Consulting Associates Inc. | A-4
Summary
In summary, for each community or travel corridor, the travel demand model and existing
ridership data were used identify the number of overall trips, projected growth in overall travel
demand, the number of transit trips, the existing transit mode split (transit’s share of each travel
market). Based on this data, an assessment of individual transit market factors and overall transit
market potential was developed. The overall assessment of future market potential was primarily
used to:
Identify the transit markets with the greatest future potential.
Identify potential future service types for each community or travel corridor.
Serve as the basis for developing local and regional service options.
.
Regional Transit Master Plan| Volume IV Service Plan
Central Oregon Intergovernmental Council
COIC - Nelson\Nygaard Consulting Associates Inc. | A-5
Figure A-2 Explanation of Adjustment Factors and Rating Methodology
Method for Adjustments - Relative Rating Scale
Adjustment Factor Data Source Local Community Regional (O-D Pair) Explanation of Low-Medium-High Rating Scale
Existing Transit Ridership (Regional) or Utilization (Local)
CET ridership data and 2010 Census
Quantitative - relative ranking of intra-community transit ridership
Quantitative - relative ranking of inter-community transit ridership
A high rating indicates the presence of existing transit demand. For local communities this is considered relative to population.
Growth in Travel Demand (2012-2030)
Travel demand model Quantitative - relative ranking of intra-community travel demand growth
Quantitative - relative ranking of inter-community travel demand growth
A high rating is related to the projected rate of future travel growth in a local or inter-community travel market. It also requires the presence of a minimum level of overall travel demand.
Worker flows U.S. Census Bureau Longitudinal Employer-Household Dynamics (LEHD) commute patterns data and/or local knowledge
Quantitative - relative ranking of intra-community work flows
Can be adjusted qualitatively based on future expectations for 2030
Quantitative - relative ranking of inter-community work flows
Can be adjusted qualitatively based on adjustments to the local community rating
A high rating indicates the presence of a large number of workers (i.e., potential transit riders) in a local or regional travel market.
Presence of major regional activity centers and non-work generators
Activity centers map and local knowledge
Qualitative assessment for each community
Assigned based on the local rating for the destination community
A high rating indicates that a local community has activity centers that would attract non-work trips, such as medical facilities, community college, social service agency, etc.
Travel distance and/or congestion (monetary cost and time constraints)
Local knowledge and/or travel demand model
Qualitative assessment for each community
Qualitative assessment for each O-D pair
A high rating implies long travel distances and therefore a higher cost of driving (e.g., cost of gas). It is assumed based on the travel demand model that no significant congestion constraints will develop on intercity travel corridors.
Parking constraints, e.g., availability, time limits, monetary cost, etc.
Local knowledge Qualitative assessment for each community – may include future (2030) expectations
Assigned based on the local rating for the destination community
A moderate rating indicates that parking constraints are present today (e.g., time limited parking in downtown Bend or constrained availability at COCCC), or are expected to develop by 2030. High parking constraints are not anticipated in any community by 2030.
Local transit connections
Existing transit service Qualitative assessment for each community – may include future (2030) expectations
Assigned based on the local rating for the destination community
A high rating is related to the quality and availability of transit service, e.g., fixed-route service six days per week in Bend vs. local Dial-A-Ride only one day per week in Sisters.
Community support Local knowledge and community preferences survey data
Qualitative assessment for each community
Assigned based on the local rating for the destination community
A high rating reflects perceived community support for service within a community or on a particular connection.
Overall assessment of future market potential
- Qualitative assessment for each community
Qualitative assessment for each O-D pair
A high rating indicates strong overall potential for future growth in a local or regional travel market.
Regional Transit Master Plan| Volume IV Service Plan
Central Oregon Intergovernmental Council
COIC - Nelson\Nygaard Consulting Associates Inc. | A-6
Figure A-3 Local Adjustments
Adjustment Factors for Transit Mode Share (Current and/or Future Conditions) – Relative to Region
Notes: Letters for quantitative data sources refer to columns in Figure A-4.
Figure A-4 Supporting Data for Local Adjustments and Projected 2030 Baseline Ridership
Notes: (A/B) For city. CET local service area may extend beyond city limits, e.g., La Pine. (D) Extrapolated based on average 2003-2030 growth rate. (H) Limited to Home-Based Work (HBW) trips, extrapolated to 2010 based on the change in LEHD primary jobs between 2003-2010. (I) Represents twice the number of LEHD primary jobs in 2010 (for comparison to model data, which represents one-way trips). (M) Assumes 2012 mode split in 2030.
Regional Transit Master Plan| Volume IV Service Plan
Central Oregon Intergovernmental Council
COIC - Nelson\Nygaard Consulting Associates Inc. | B-3
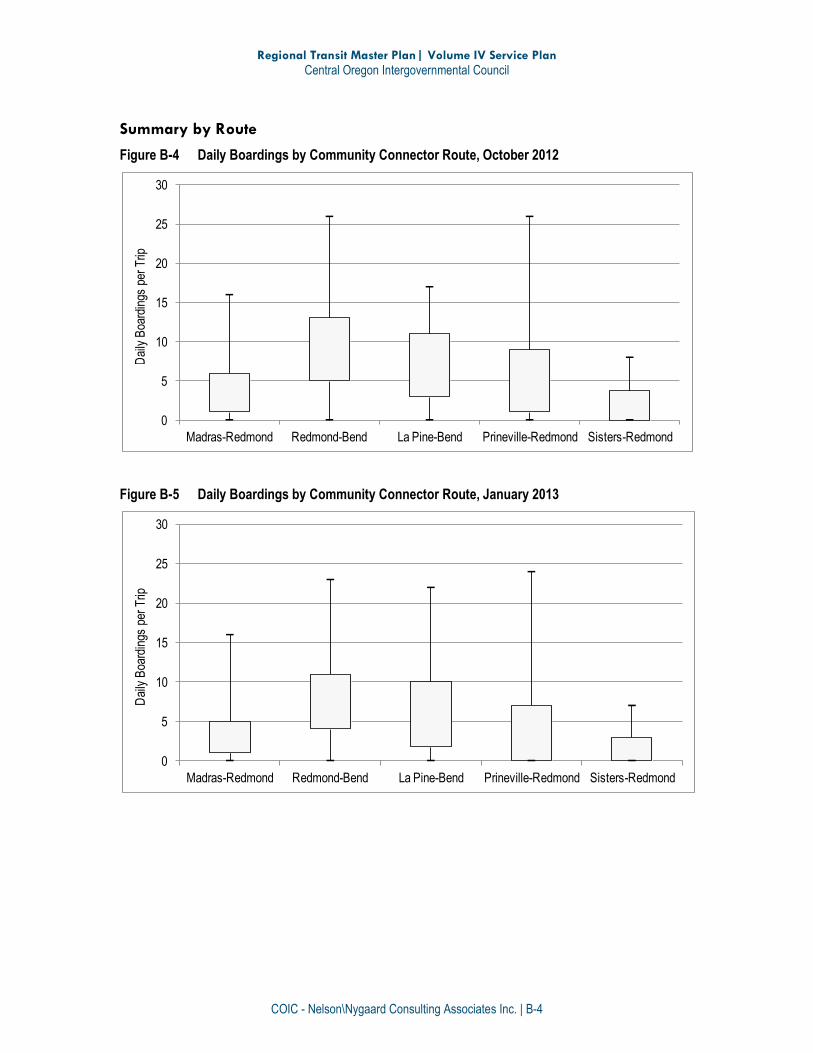
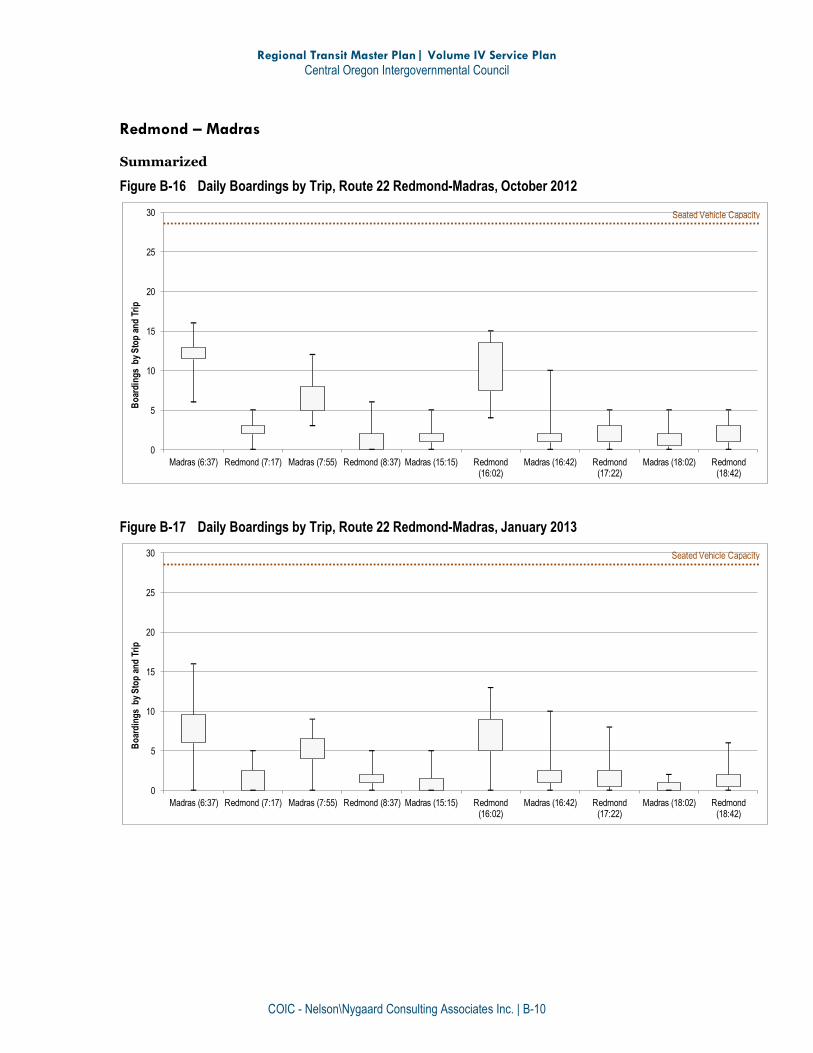
Interpreting “Box Plot” Graphics
The charts below show data for individual Community Connector routes (summarized by route, by trip, or by stop) over two one month periods (October 2012 and January 2013). Each vertical bar represents the range of data over a month-long period:
Top of vertical line = Maximum ridership
Top of vertical box = 75th percentile ridership
Middle of vertical box = Median ridership
Bottom of vertical box = 25th percentile ridership
Bottom of line = Minimum ridership
Horizontal lines across some of the graphics represent the seated passenger capacity of typical vehicles used on the route (based on Figure B-3).
The graphics were used to inform planning decisions about each route, particularly for the short-term time frame.
Regional Transit Master Plan| Volume IV Service Plan
Central Oregon Intergovernmental Council
COIC - Nelson\Nygaard Consulting Associates Inc. | B-4
Summary by Route
Figure B-4 Daily Boardings by Community Connector Route, October 2012
Figure B-5 Daily Boardings by Community Connector Route, January 2013
0
5
10
15
20
25
30
Madras-Redmond Redmond-Bend La Pine-Bend Prineville-Redmond Sisters-Redmond
Bo
ard
ing
s b
y S
top
an
d T
rip
Dai
ly B
oard
ings
per
Trip
0
5
10
15
20
25
30
Madras-Redmond Redmond-Bend La Pine-Bend Prineville-Redmond Sisters-Redmond
Bo
ard
ing
s b
y S
top
an
d T
rip
Dai
ly B
oard
ings
per
Trip
Regional Transit Master Plan| Volume IV Service Plan
Central Oregon Intergovernmental Council
COIC - Nelson\Nygaard Consulting Associates Inc. | B-5
Bend - Redmond
Figure B-6 Daily Boardings by Trip, Route 24 Bend-Redmond, October 2012
Figure B-7 Daily Boardings by Trip, Route 24 Bend-Redmond, January 2013
0
5
10
15
20
25
30
Redmond (6:02)
Bend (6:45)
Redmond (7:22)
Bend (8:02)
Redmond (8:37)
Bend (9:27)
Redmond (10:02)
Bend (10:42)
Redmond (13:22)
Bend (14:02)
Redmond (14:37)
Bend (15:17)
Redmond (16:02)
Bend (16:37)
Redmond (17:22)
Bend (18:02)
Rid
ers
per
Tri
p
Seated Vehicle Capacity
0
5
10
15
20
25
Redmond (6:02)
Bend (6:45)
Redmond (7:22)
Bend (8:02)
Redmond (8:42)
Bend (9:27)
Redmond (10:02)
Bend (10:42)
Redmond (13:22)
Bend (14:02)
Redmond (14:37)
Bend (15:17)
Redmond (16:02)
Bend (16:37)
Redmond (17:22)
Bend (18:02)
Rid
ers
per
Tri
p
Seated Vehicle Capacity
Regional Transit Master Plan| Volume IV Service Plan
Central Oregon Intergovernmental Council
COIC - Nelson\Nygaard Consulting Associates Inc. | B-6
Redmond-Prineville
Summarized
Figure B-8 Daily Boardings by Trip, Route 26 Redmond-Prineville, October 2012
Figure B-9 Daily Boardings by Trip, Route 26 Redmond-Prineville, January 2013
Note: Bus returns to Redmond at end of day
0
5
10
15
20
25
30
Redmond (6:02)
Stryker (6:36) Redmond (7:22)
Stryker (7:56) Redmond (8:37)
Stryker (9:11) Redmond (14:42)
Stryker (15:18)
Redmond (16:02)
Stryker (16:38)
Redmond (17:22)
Stryker (17:58)
Rid
ers
by
Sto
p a
nd
Tri
p
Seated Vehicle Capacity
0
5
10
15
20
25
30
Redmond (6:02)
Prineville (Stryker)
(6:36)
Redmond (7:22)
Prineville (Stryker)
(7:56)
Redmond (8:37)
Prineville (Stryker)
(9:11)
Redmond (14:42)
Prineville (Stryker)
(15:18)
Redmond (16:02)
Prineville (Stryker)
(16:38)
Redmond (17:22)
Prineville (Stryker)
(17:58)
Rid
ers
by
Sto
p a
nd
Tri
p
Seated Vehicle Capacity
Regional Transit Master Plan| Volume IV Service Plan
Central Oregon Intergovernmental Council
COIC - Nelson\Nygaard Consulting Associates Inc. | B-7
By Stop (AM)
Figure B-10 Daily Boardings by Stop, Route 26 Redmond-Prineville, October 2012 (AM)
Figure B-11 Daily Boardings by Stop, Route 26 Redmond-Prineville, January 2013 (AM)
0
5
10
15
20
25
30
Redmond (6:02)
Stryker (6:36) Park & Ride (6:50)
Powell Butte (7:01)
Redmond (7:22)
Stryker (7:56) Park & Ride (8:05)
Powell Butte (8:16)
Redmond (8:37)
Stryker (9:11) Park & Ride (9:20)
Powell Butte (9:33)
Rid
ers
by
Sto
p a
nd
Tri
p
Seated Vehicle Capacity
0
5
10
15
20
25
30
Redmond (6:02)
Prineville (Stryker)
(6:36)
Park & Ride (6:50)
Powell Butte (7:01)
Redmond (7:22)
Prineville (Stryker)
(7:56)
Park & Ride (8:05)
Powell Butte (8:16)
Redmond (8:37)
Prineville (Stryker)
(9:11)
Park & Ride (9:20)
Powell Butte (9:33)
Rid
ers
by
Sto
p a
nd
Tri
p
Seated Vehicle Capacity
Regional Transit Master Plan| Volume IV Service Plan
Central Oregon Intergovernmental Council
COIC - Nelson\Nygaard Consulting Associates Inc. | B-8
By Stop - PM
Figure B-12 Daily Boardings by Stop, Route 26 Redmond-Prineville, October 2012 (PM)
Figure B-13 Daily Boardings by Stop, Route 26 Redmond-Prineville, January 2013 (PM)
0
5
10
15
20
25
30
Redmond (14:42)
Powell Butte (14:55)
Stryker (15:18)
Park & Ride (15:27)
Redmond (16:02)
Powell Butte (16:15)
Stryker (16:38)
Park & Ride (16:47)
Redmond (17:22)
Powell Butte (17:35)
Stryker (17:58)
Park & Ride (18:08)
Rid
ers
per
Tri
p
Seated Vehicle Capacity
0
5
10
15
20
25
30
Redmond (14:42)
Powell Butte (14:55)
Prineville (Stryker)
(15:18)
Park & Ride (15:27)
Redmond (16:02)
Powell Butte (16:15)
Prineville (Stryker)
(16:38)
Park & Ride (16:47)
Redmond (17:22)
Powell Butte (17:35)
Prineville (Stryker)
(17:58)
Park & Ride (18:08)
Rid
ers
per
Tri
p
Seated Vehicle Capacity
Regional Transit Master Plan| Volume IV Service Plan
Central Oregon Intergovernmental Council
COIC - Nelson\Nygaard Consulting Associates Inc. | B-9
Bend-La Pine
Figure B-14 Daily Boardings by Trip, Route 30 Bend-La Pine, October 2012
Figure B-15 Daily Boardings by Trip, Route 30 Bend-La Pine, January 2013
0
5
10
15
20
25
30
LaPine (6:55) Bend (7:40) LaPine (8:25) Bend (15:42) LaPine (16:27) Bend (17:20)
Rid
ers
per
Tri
p
Seated Vehicle Capacity
0
5
10
15
20
25
30
LaPine (6:55)
DRW (8:23)
Bend (7:40)
LaPine (8:25)
DRW (8:53)
Bend (15:42)
DRW (15:54)
LaPine (16:27)
Bend (17:20)
DRW (17:32)
Rid
ers
per
Tri
p
Seated Vehicle Capacity
Regional Transit Master Plan| Volume IV Service Plan
Central Oregon Intergovernmental Council
COIC - Nelson\Nygaard Consulting Associates Inc. | B-10
Redmond – Madras
Summarized
Figure B-16 Daily Boardings by Trip, Route 22 Redmond-Madras, October 2012
Figure B-17 Daily Boardings by Trip, Route 22 Redmond-Madras, January 2013
0
5
10
15
20
25
30
Madras (6:37) Redmond (7:17) Madras (7:55) Redmond (8:37) Madras (15:15) Redmond (16:02)
Madras (16:42) Redmond (17:22)
Madras (18:02) Redmond (18:42)
Bo
ard
ing
s b
y S
top
an
d T
rip
Seated Vehicle Capacity
0
5
10
15
20
25
30
Madras (6:37) Redmond (7:17) Madras (7:55) Redmond (8:37) Madras (15:15) Redmond (16:02)
Madras (16:42) Redmond (17:22)
Madras (18:02) Redmond (18:42)
Bo
ard
ing
s b
y S
top
an
d T
rip
Seated Vehicle Capacity
Regional Transit Master Plan| Volume IV Service Plan
Central Oregon Intergovernmental Council
COIC - Nelson\Nygaard Consulting Associates Inc. | B-11
By Trip
Figure B-18 Daily Boardings by Stop, Route 22 Redmond-Madras, October 2012
Figure B-19 Daily Boardings by Stop, Route 22 Redmond-Madras, January 2013
0
5
10
15
20
25
30
Bo
ard
ing
s b
y S
top
an
d T
rip
Seated Vehicle Capacity
0
5
10
15
20
25
30
Bo
ard
ing
s b
y S
top
an
d T
rip
Seated Vehicle Capacity
Regional Transit Master Plan| Volume IV Service Plan
Central Oregon Intergovernmental Council
COIC - Nelson\Nygaard Consulting Associates Inc. | B-12
Redmond – Sisters
By Trip
Figure B-20 Daily Boardings by Trip, Route 28 Redmond-Sisters, October 2012
Figure B-21 Daily Boardings by Trip, Route 28 Redmond-Sisters, January 2013