CDE Centre for Development Economics , ! 0 WORKING PAPER SERIES The Great Depression and Brazil's Capital Goods Sector: A Re-examination Bishnupriya Gupta. Delhi School of Economics Working Paper No: 5 Centre for Development Economics Delhi School of Economics Delhi 110007 INDIA
Transcript
CDE
Centre for Development Economics 0
WORKING PAPER SERIES
The Great Depression and Brazils Capital Goods Sector
A Re-examination
Bishnupriya Gupta Delhi School of Economics
Working Paper No 5
Centre for Development Economics Delhi School of Economics
I am grateful to Patrick OBrien David Goodman and especially to
Rosemary Thorp for their commen~s on an earlier version of this paper
Errors remain mine alone
2
1~lnttoductiQn
The effect of trade upon the industrialisation of developing
fCOnOmieB hfta been an enduring source of controversy VJews on th~A
subject range from orthodox trade theory which sees the effect as
essentially beneficial to that of dependency theory which argues that
disruption of trade relations is essential for industrial development The
Great Depression tias been seen as a testing ground for many of these
theories - many primary producing developing countries were subject to
a severe terms of trade shock and thereby suffered an involuntary
contl1ction in their trade possibilities Alternative interpretations of this
experience are available for many of the developing countries This
paper sheds additional light on this issue by examining the development
of an important sector- that producing capital goods - in Brazil in the
1920s and 1930s Our findings question the accepted view in the
existing literature that the Depression was unambiguo~sly helpful for
the sector and accelerated ita development By using new data sources
we Rho~ that the decline of the export sector in the Depression had an
adverse imPlct upon the capital goods sector Our findings also suggest
that the consumer and capital goods sectors behaved very differently in
this period and further that the impact of the disruption of
international trade upon them was also very different
2Jrazil s Interwat-lnduairiaLDexelQPment
In the 1920s Brazil was archetypal primary commodity exporter
Coffee wag the main export crop and the 1920s were good years for
coffee Industrial growth was however rather slow for moat of the 1920s
- 36 per annum between 1920 and 1929 However recovery from the
Depression began early and growth in the 1930s was much faster shy
113 per annum between 1933 and 19392
The debate on the question of the role of the Depression in the
industrialisation of Brazil has involved two issues (1) did the
Depression result in Brazils transition from a primary producer to an
industlializing economy and (2) whtlt has been the role of economic
poliey in fostering industrial growth in the 1910s
In the classical ECLA literature (Furtado 1963) the Depression WaRmiddot
RI(~I 10 I)(~ the CllUBe of a structural brenk in Brazilian development
However subBequent writings have emphasised the link between the
cxputlsion on the export sector and industrial development through the
rise in income and the expansion of the domestic market The writings of
Fishlow (1972) Villela and Suzigan (1973) Versiani (1982) Suzigan (1984)
and Leff (1989) have thrown light on the development of industries
prior to the Depression It has been argued that this early development
allowed Braziliufl industry to take advantage of the trade dislocation
after 1929 The evidence presented in Leff (1989) shows that despite the
domination of the coffee sector the government did follow policies which
were conducive to industrial growth These included expansionary
monetary and fiscal policies high tariffs and the depreciation of the
currency However it is necessary to point out that despite the
favourable effect of various policies on industry the interventions do
not appenr lo be specifically designed to foster industrial growth For
example periods of high industrial growth in Brazil alternated with
periods of high capital formation When the currency appreciated
imports became cheaper and the demand for import su bstitutes declinedmiddot
on the othe) hand import of machinery was encouraged The situation
was reversed when the currency depreciated
A second controversy in this debate has bee n on the role of
government policy intervention in stimulating the upswing In pursuit of
coffee pt-ice support the government purchased excess supplies of
coffee This maintained incomes and had a counter-cyclical effect in a
period of decline in economic activity_ In a situation of f decline in
importing capacity arising from a foreign exchange con-gttraint it led to
import substituting industrialisation (see Furtado (1963 The countershy
cyclicaJ effect of the coffee vrice support policy has been disputed by
Pelaez (1972) who argues that the taxes levied upon coffee exports to
4
finance the stock-piling reduced domestic coffee incomes and
expenditures However Fishlow (1972) Bu~gests that the export duties
WI~ Jln~nly pnRR~d on to foreigners t 3
This paper disscusses the development of capital goods prodUction
in the context of the trade dislocation of the 1930s The debate on
Hrllzils industrialisation has implicitly assumed that industria
performance in the 1930s was uniformly Buperior to that in the 1920s In
amiddotddition it has been specifically argued (Baer 1983pp49-50 Lago et al
1979 chapter I Leff 1968 pp 11-12) that the machinery producing
aedOI also followed the pattern of development of the industrial sector
as a whole The first piece of evidence which is used to support this
conclusion is the rise in the share of machinery in manufacturing value
added between the industrial censuses of 1920 and 1940 (see Table 1)
However the absence of an industrial census in 1930 makes it extremely
difficult to understand how industry evolved in the two rather different
decades the 19208 and the 1930s
There is a need to consider the two decades Repnrately I in order to
understand the dynamics of the transition The industrial development in
the context of an export boom as in the 19208 and import substitution
following from trade dislocation as in the 1930s are two different
economic scenarios It seems possible that the consumer and capital
goods industries were affected diffrerently as we shall argue in the
following section An important question is how did a capital goods
seetor catering to the export economy adjust to the new economic
environment of the 193081 To ~address this question the data mu~t
relate to the post 1929 decade The picture that emerges by a
comparison of 1919 and 1939 the years of industrial census may be
distorted as it fails to consider 1929 as a possible structural break
(INSERT TABLE 2 ABOUT HERE]
5
Ftllther insi1ht can be had by considering a disaggreguted picture
fnhlc 2 prmlcnts ~rowth rates in two sectors texUlos and metallunty
The formel was the most important sector and domhmted the iudex of
industrial production whereas the latter includes (but is larger than)
the machinery producing sector While the 1920s witnessed sluggish
growth in textiles metallurgy grew relatively rapidly Indeed Villela and
Suzignn (Hl77) show that moat sectors expanded faster than textiles in
the period 1920-29 This is not surprising After 1924 the pattern of
development in the textile industry has diverged from that of other
industries SLains classic study (1951) of the cotton textile industry
show that the industry was suffering from over production in this
period This together with the appreciation of the currency and
deflationary policies followed by the government created insufficient
demand and the average price declined between 1925-27 But despite the
elsxistence of excess capacity there was increased investment either to
rebuild new capacity or to modernise in the face of competition This
as facilitated by the exchange rate (Versiani 1982) After 1929 textile
plodudion recovered early and the industry boomed in the 1930s
The history of the metallurgy industry is somewhat different The
slump in metallurgy production in 1929-32 was significant The years
1933-39 saw rapid growth in both sectors with metallurgy leading
We shaH middotshow in the next sections that the performance of the
capital goods sub-category within metallurgy shows a even greater bull
divergence from the trajectory of the textile industry But what reason
could there be for this differential impact of a boom or slump in the
primary producing sector An export boom had two implications - higher
incomes in the export sector and therefore higher demaud for industrial
products and a buoyant balance of payments permitting cheaper
imports We distinguish between two types of industrial products - those
which ale susceptible to international competition and those which have
a high weight-cost ratio and high transport costs and could be
UI
ag
Br
~H
Wo
pt(
in
che
loea
who
11
cI(H~sifi(gtd as non-tradnhJe The cntegoo non-tlndllble algo includls
infnliol ~oods The concept of inferior ~ood io consumpLon is well
k JlOwu vith an increase in illeome a consume) demand for theslt
PIotiIlCLH d~cHne Simitlry the demand for illf(~rior cllpital goods comes
fom tlsetS whose purchasing power is limiU~d and will therefoe switch
to IwU~I productgt IlS their financinl situntion imIov~s The two Lypes
of indUfitries would be differentially affected by an export boom In the
fil case the effed would he contradictory - while the increase hl
I~XpOlt ealnings nnd illcome would stimulate demand the improvement in
the balance of payments would cause an appreciation of the currency or
PllllIil 1lloe Iibelnl imports of competillg produelR On the other hand 8
good which is non-tradable wiH only experience a favourable increase in
deUloitd Further the currency appreciation wOl~d cheapen capitAl
fOIIll1lLion in the sector
Ttw t(~xLile indushy exemplified tbe firRL type of product since it
fticed stiff international competition The machinery producing sector
lJIainly ~roduced inferior quality equipment and machinery with a high
weight-cost ratio When transport costs are high import of products
which ale heavy lJIay prove to be uneconomical This appears to be
ill predominantly agrarian economies using relatively
unsophisticated machinery for example rice threshers presses and
water wheels Examples of indegenous prqductiqn of equipment for
agriculture date back to the first half of the nineteenth century in
Brazil The difficulties involved in transporting bulky equipment to
i-IGlas Gellli~ led to the substitution of imports by local manufacture
WoJlUhOPR were Sf up by local a~ wcll fiB fmei~n entreprencurs 10
ploduce C4uiplllcuL locally using imported raw matelial and component~
in Bahia Rio de Janeiro and Rio Grande do Sul4
ImpmLs were also displaced by inferior substitutes The demand for
cheaper though inferior quality sugar mill machinery manufactured by a
local entrepreneur in Sao Paulo in the 1920s came from small producers
who had limited access to finance s Since the demand for capital goods
7
in Drazil was to a large extent from the primar sector it WDS
stimulated hy an expolt boom and suffered durinfS the Depression Hnd
thetcfolc needs to be distinguished from the demand fot conRlnH~I
gOO(J Jilw I(~xliles The d iffcl(Hlce in the IIlli-ure of tllf ptoductmiddot of tllI~
capital Dnd the consumer goods sectors implies that the effect of the
dep(~fj()11 lIIay laave diffcJ(~d on the two sectors and that thclc iR R
need to study the two sectors separately dUtin~ the period of
LransiLioJl
3 Dtita OIl date of establishment of surviving firms
Oil finmiddot ROUP of more detailed information on tJCndR in thp
capital goods sector is the 1940 census which tells us the dale of
establirhment of firms This may be used in order to estimate the entJY
of firms into the capital goods sector for various sub-periods This
source has indeed been used in the literature for this very purpose
(see foJ example Lago 1979 pp63-67) However the existing literature
has not in making inferences made allowances for the fact that the
1940 data do not tell us the number of firms established in any given
earlier period but only the number of those established which survived
11 pLo 1940 I n order to make inferences about the rate at which firms
were founded in different periods one has to make some allowance for
the fact that some of the firms have not survived until 1940 This point
is lelevant in the context of comparisons of the rates of entry of firms
into the industry in different decades If firms have a positive
vrobuhility of going out of business in any period Ow Jute of cut ) of
firms would be sytematically understated and the degree of
understatement ould be greater the earlier the sub-period
Consequently a reliance upon the uncorrected census figures would
tend to downplay the rate of expansion of the industry in the e~rlier
decades slich as the 1900s as compared to the 1930s
In order to correct for this bias let us assume that in each year
a firm has a probability p of continuing in business and a probability
(l-p) of exiting Hence if Nkt) is the number of firms founded in
(
e
iI
fi
87
~)(tI II whkh survive 10 year t und N(ltld is the number of firms
fOlllld(d in yellt I~ which we would like Lo estillwte w(~ have
N(kL) N(Iltld p(trk) (0
From equation (1) we can derive N(kk) the number of firms
esLHldished in )-cm k fom the datil on N(ltt ie the yelU It firms
observed ill yeti l piovided thut we have some estimate of p the
plobabiliLy of survival We can obtain an eslimlite of p provided that we
have dllLa 011 the yeur It firms fit two dislincl poillts of time Suppose
that we have a census of the number of firms eslablished in year k
talwn at veilS F and yetu t where tgts We have
N(kt) N(ks) p(tr-6) (2)
Since we have data on N(kt) and N(ks) our estimate of p is given
by
P IN (It t) IN (k8) Illf(lgt-R)J
Dur estimates of p are derived by combining the data on the
foundation of firms in the 1920 census and the 1940 census Both these
cenSHses report lhe number of firms founded in the period 1900-1909
and lhe period 1910-1919 As the preceding argumen~ would lead us to
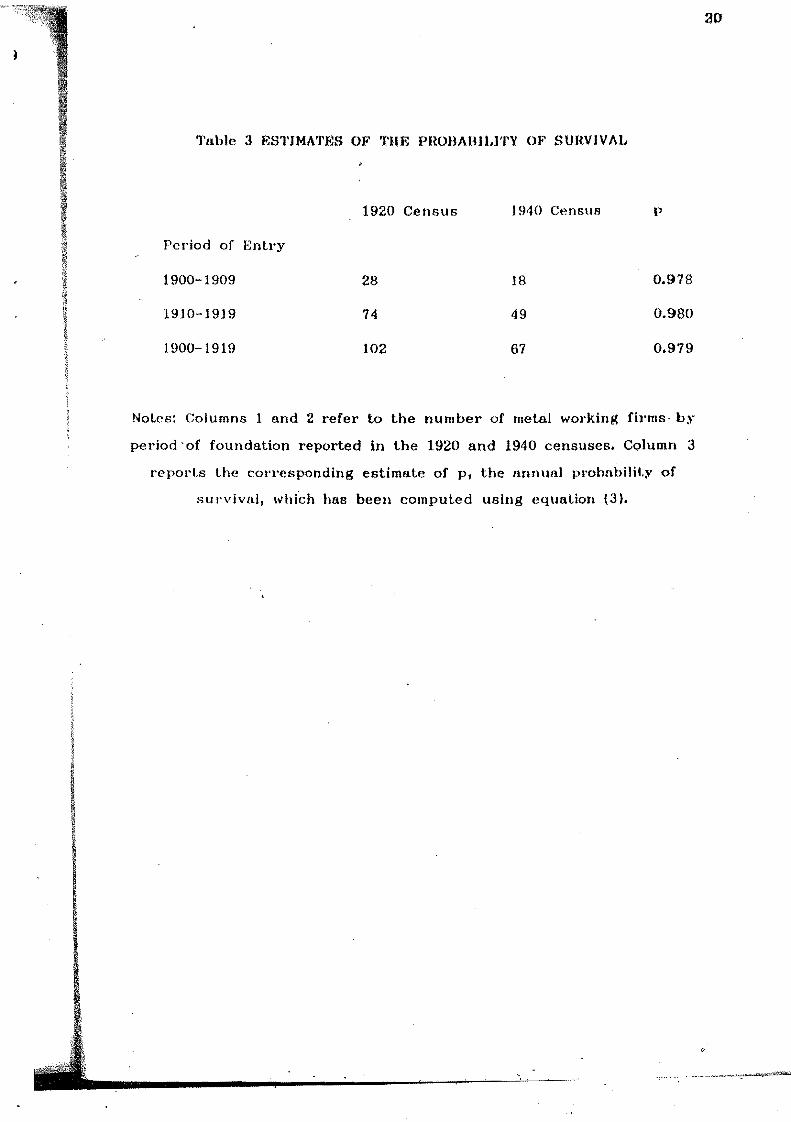
expect the number of firms in each category is lower in the 1940
census as compared to the 1920 census Table 3 reports these figures
and the estimates of p the survival probability which have been
computed using these figures The different estimates we have are
relilarkllblY close differing only in the third decimal place by ilt most
0002 Th~ ~stimate of p we use is 0979 which is obtained by using the
dalu on all the firms founded between 1900 and 1919
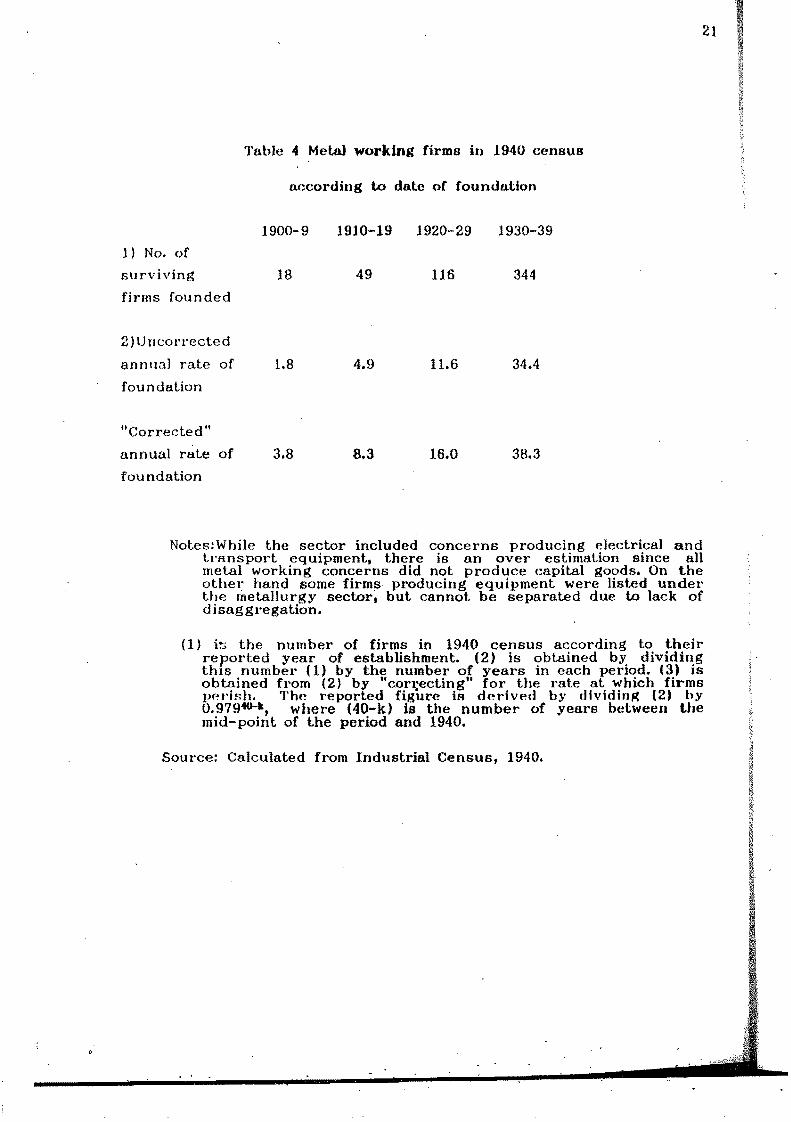
By using our estimate of p and the 1940 census data on the -Humber of surviving firms by year of foundation we arrh-c at an
estimate of the corrected lt annual rate of foundation This is reported
in Table 4 which also reports the raw data on the number of surviving
firms aecording to their year of foundation The figures show that the
9
rate of enlrr increased steadily over the Y(~llrS mOle 01 lesR doublill~
f)om on~ decude to the other The figures nevertheless sho
considelllble growth in the industry in the period befole IH29 Helillllce
II POll the ItrlcolIected nnnual rate of foundation vould suggest that
fewer firms entered the industry in the early years of the century
[INSERT TABIJES 3 AND 4 ABOUT JlEHB I
4 Machinery impoJts
Lugo et al (1979 p67) use the rate of growth of imports of capital
goods to make inferences about the growth of the sector the argument
tHillo( thuL low(t imports are likely to imply greater growth of the
domestic sector Comparing the indices of imporL of capital goods Lago
el HI couclude that while imports of capital goods increased in the
1920s the rate of growth was low compared to the period before the
first world war Since both periods saw high capital formation Lago et
al argue that this indicates relatively fast growth in domestic production
of capital goods in the 1920s However this argument is likely to be
misleudillg since it muy fail to control sufficiently for variations in the
level of investment It is quite likely that imports of machinery fluctuate
in Iesponse to the overall demand for machinery for investment so that
it is quite possible that periods of high imports are also periods of high
domestic production of machinery A second problem is that machines are
also lequired to make machines and the aggregate data does not
distinguish between machinery used in the production of COlUmnaeI
good~ Gild UIOfiC in the production of capital goods Hence it is difficult
to use aggregate import data to infer about trends in capital formation
in the machinery industry To the extent that investment goods for the
production of capital goods are not domestically produced at all a
declille in imports could would have an adverse effect In the 1920s
whell imports entered on favourable terms as a esult of the
10
appr(~eiaUon of the currency many sectors experienced a sustained
period of capital formation This may well be the case for thn capital
~OOdB seetor producing equipment for the booming coffee (~COllomy
lienee ill the abseuce of disnggregnled ltlilLa infelcllces dlIlWIl Oil the
basis of an aggregate index may be questionable
1010111 thin point of view Suzigans data (1UH) on the 41111lItlllll of
eXJlort of maehinelY to Brazil from France Germauy the United Kingdom
alld the United States are more useful since they me rlisaggregaled hy
sedorS Such exports of metal-working machinelY has been used to
mlimate the quantum of imports by Brazil and this can be an indjcator
of the 1evel of investment in the metallurg~ and Cllpital goods sectors
[INSERT TABLE 5 ABOUT HERE]
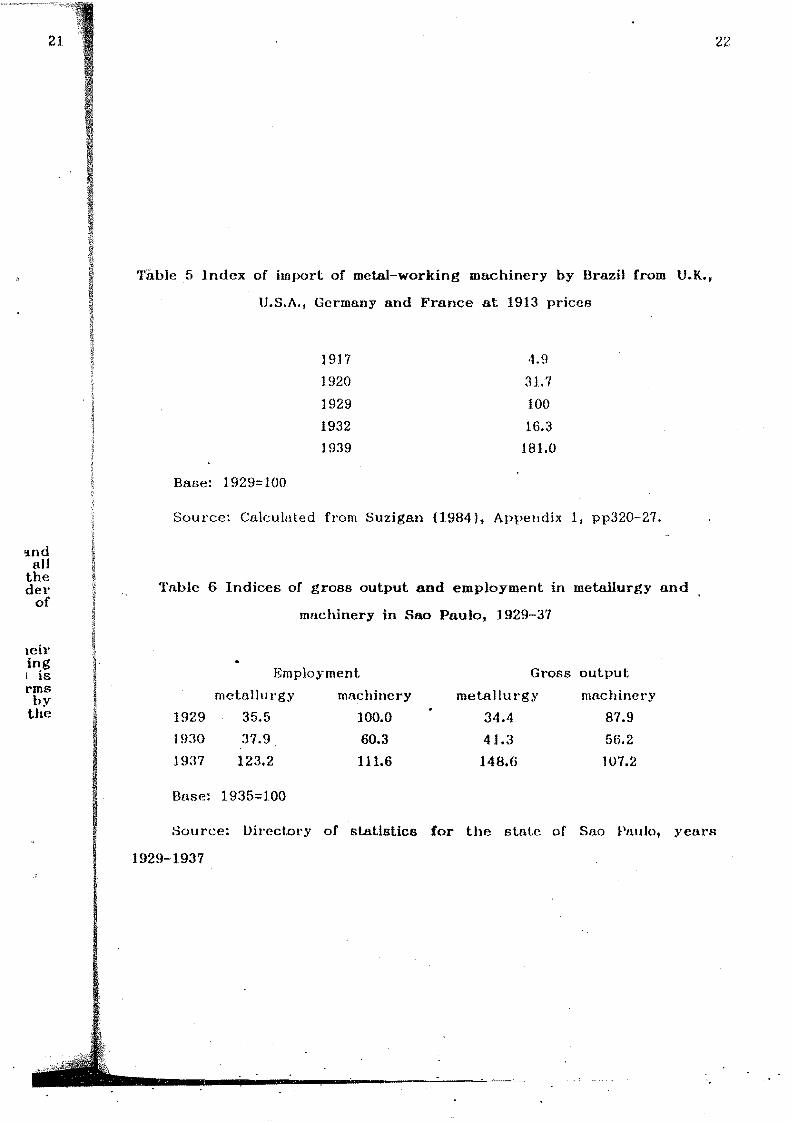
Table 5 sllows that after the disruption caused by the First World
War imports of metal-working machinery by Brazil increased rapidly in
the 19206 trebling in volume between 1919 to 1929 With the Depression
there is f1 d lasLie fall and it is only in 1935 that the 1929 level is reshy
established (see the complete tab1e presented in Gupta 1989) The
subsequent years show rapid growth However at the end of the 1930s
illlports of metal-working machinery were on average double of the level
of 1929 a smallel~ order of increase over the decade as a whole as
eomp(ll(~d to tht 19208 However as Suzigan points out they iuclude
machinery for metallurgical operations which would meet the investment
metallurgy sector was larger than the sector producing machinerybull Consequently movements in the former may obscure or outweigh that of
th(~ latter We shall see that data from Sao Paulo show that in the period
1929-37 growth in metallurgy was much faster than in machinery
11
S Steel Consumption
Leff (1968) analysis of the Brazilian capital goodE sector is based
elltirely on Uw consumption of iron and steel for the period 1929-40
Referring to the metallurgical and equipment industries he writes (pp
11-]2)
These industries already had a significant portion of value added in Brazilian manufacturing as early as 1920 By 1940 however they had grown rapidly enough to double their share The equipment industry grew at a particularly disptOpOItionlite Iale almost trebling the percentage The growth of equipment production seems to have been especially Iapid in the period 1933-40 Output statistics are not defined for available for those years but the table shows data on the nra7jlillTl consumption of iron and steel Because this was befole the extensive use of iron and steel either in construction or in consumer durables these input figures are an indication of the extent of equipment productionbullbullThe aBllllal compound growth rate was 104 percent
Again Leffs arguments are based firstly upon a comparison of the
1920 nlld 1910 censuses find secondly upon the rapid growth in
consumption of iron and steel between 1933 and 1940 As we have
already argued themiddot first comparison does not allow us to disentangle
the changes before 1929 and those taking place afterwards Regarding
the second it is somewhat misleading to compute growth rates from
1933 a point where steel consumption had fallen substantially A part of
the 104 growth attributed to this period does not reflect any additions
to capacity but merely a recovery to earlier levels of production If
illstead we compute the annual rate of growth between 1929 and 1940
the figure is only 58 Further due to the use of iron and steel the
eOlll~lrllction industry for railway construction and other infrastructurlll
development inferring trends in capital goods production from steel
ltuJlsullIpLion is problematic These remarks also apply to Lago et al 0979 p63) who use the figures on the demand for iron and steel in
Otder to draw similar inferences
6 Firm-level data from Sao Paulo
Given the weakness of the aggregate and indit-ecl datn sources
We turn to some firm level data on machinery producers in the state of
J2
Slw Pilulo By 1919 SlO Paulo had become the leading industrinl ce nte
in the country It accounted for 353 of the tou) industrial value
tldclld nlldl h lUHl Uw fil(ul(~ Itel Iift1U 10 101) Ihn illtlllRtJinl
cOllecuttalion in the slate was particularly noticeable in the category
machinery electrical and transport equipment II The share of the slate
in the nntional value added had been 48 in 19t9 In 1939 it stood at
78 Moreover lhe state of Sao Paulo in the 1920s was the centre of
the eXpolt boom and industrial growth was mainly in response to
expansion in the export sector
The duta used in our analysis comprise a list of firms producing
machinery for agriculture and industry between 1928 and 19377 This
(ategory is a sub-sector of the metaJIurgy inrlustry which inclu des
foundries and wol1tshops producing metal products workshops
producing transport and electrical equipment and parts fOr these and
valjolls tngtes of repair workshops Thus whiJe U pUJl of lhe seewr
would approximate the category metallurgy as defined in the IndustliaJ
Census of 1940 another part represents the sector metal working We
distingush between the two since the output of the metallurgy sectoi
comprise of intermediate goods while the metal working sector prduces
capital goods Our analysis relates to the capital goods industry and
consequently we select the sub-sector machinery for agriculture and
industtmiddoty as the closest approximation However machinery was also
produced in foundries and in repair workshops but it is impossible to
sepIllate out the magnitude of such production from the oulput oC
intelmediate goods and repairwork Our category excludes production oC
(~llt~ctlical and transport equipment as well as machinery produced in
workshops mainly engaged in repair-work and lhose produced in
foundries and consequently underestimates the extent of capital goods
production lIowever there are considelable advantages in usiug lhis
source It plovides information about the types of products
manufactured by these firms the level of employment in each fitm und
13
the toud value of output in the sector This is the only source of
output statistics within the capital goods seelor
In 1929 the metuUurgy sector as a whole hud 486 estublishmentr
and employed 15160 workers The sub-sector producing machinery
accounted for approximately one-fifth the number of establishments
Hilder metallurgy II third of employment a quurter of output and about
30 of the capital invested The sector produced primarily agricultural
machillery which included equipment for processing coffee cotton sugar
and rice and various types of farming equipment Among the firms in
the category employing over 50 workers fourteen produced machinery
for agricullure and agro-industries while there were single firms
specializing in producing machinery for saw mills bakeries and the hat
IndustrY und purts for textile machinery One fitlll lIIunufuctured
elevators This confirms the picture of a capital goods industry
developing in response to an expansion in the export sector The
industry produced mainly equipment for the export sector and only
certain types of simple machinery required in the production of
consumer goods
[INSERT TABLE 6 ABOUT HERE]
Table 6 shows the changes in employment and output in the
metallurgy sector and in the sub-sector machinery between 1929 and
1937 While real output and employment in metallurgymiddot tripled in this
peljod growth in the machinery industry was much slowe - CU) output
increased by only 142 and employment by 216 This contrast is
striking and particularly relevant since other indirect estimates of
machinery production are often forced to rely upon the assumption that
maehinery production moves in line with metallurgy For instance
Suzigans use of the exports of metal working machinery to Brazilmiddot has
the problem that such machines may be used either in metalhugy or in
mnchinmt ploduetion proper Our dutu indkute that at lellst fOI the
period 192$-17 in the premiltt state of Suo Paulo trends in the two
f
This data also allows us to analyse the process of stJuctural
Chflll~(~ wilhin the sector Table 7 shows the Rize-distribution of fhms
lin terms of employment) over the period There was a decline in the
nu~bel of fitms in the sector between 1929 and 1937 mainly due to 1I1e
exit or small firms The number of firms employing Jess than 20 workers
declined from 92 to 54 due to the disappearance of many small
wOIkhoPR catering to the export sector There is also a major change
in output composition Of the 19 firms employing more than 50 workers
in 1929 11 ploduced mfchinery for agriculture and agro-indtUdries
whereas in 1937 only 10 of the 23 firms in this category did so the
rCRt producing industrial machinery There was also 8 diversification of
output with fillllS entering the production of machinery for metallurgy
chelJlicaL and paper industries and well as equipment for power
generalion and transmission The contrast is best expressed in a single
statislic - ~mployment in the large firms (with more than 50middot workers)
producing for agriculture and agro-industries rose by only 84 between
1929 and 1937 but rose by 84 in large firms producing industrial
machinery
[INSERT TABLE 7 ABOUT HERE]
OVfr Uw J9UJR there emerged a great dlverflificntiofl in BJIl7i1s
capital goods industry Not only did production of industrial machinery
assume greater importance but it was also the firms producing
industrial machinery which showed greater dynamism The gains in the
production of equipment for the textile industry were most significant
The number of firms producing machinery for other consumer goods was
fewer but here too there was an expansion over this period In the mid
15
19306 finus began to produce machinery fat meLnllurgical and chemical
wOIks os well as equipment for printing Their successful tlansition depfHH](~d Oil the ahility to diversify and cater more und IJlOr~l to HIP
dynamic seclolS of the economy as is also seen flolll a histolY of fit-ms
within the sector (see Gupta 1989 pp 47-60) Romi which used to repair
uutolliouileR amI Ilgliclliturlll machinery entercd Into the ploducUon of
machine tools Similarly Bardella diversified into industrial machinery in
respollsc to the changing structure of demand Dedini conlinllnd to he
Hnked to the primary sector but produced machinery for the expanding
fingal economy Anddghetli and Villares were involved ill the ploduction
of industrial machinelY from the 1920s
AI the beginning of the depression the Brazilian capital goods
industry had essentially catered to the export economy By the eud of
the next decade it showed greater diversity Although the main souree
of demand was sU)) the primary sector production of equipmeut for
consumer and intetmediate goods industries had begun It was the
scctor ploducing industrial machinery which proved to be most dynamic
in this period N~vertheless its i)hare in ttIe domestic production of
capital goods remained small and the dynamism of this segment of the
capital goods sector was not reflected in the data on aggregate output
and employment The more important segment of the capita] goods
industry catered to agriculture and and was advetsely affected by the
decline in the export economy Although cotton production expanded
rupidly in the middotstate of Sao Paulo the export boom was over and the
emergence of cotton as the second largest export crop merely reduced
Uw impaet of the crisis The 1930s needs to be seen as a period of
structural change within the capital goods industry
An examination of various data sources suggests that the impact of
the Great Depression upon the capital goods sector in Brazil was not as
positive as has been suggested Capital goods production catered to a
large extent to the primary producing export sector and was adversely
d
16 5
nfflleted by the trade shock This contrasts with the behaviour of the
consumer goods sedol especially textiles which witnessed more rapid
1llble 2 Annual rate oC growth of industrial output
1920-29 1929-32 1933-9
Textiles 19 84 111
t-1etallur~y 75 -34 204
All industries 36 13 113
Source Villela and Suzigan (1977) pp 130164166
Note The growth rates have been calculated from quantum indices of industrial production in each sub-sector and the weights used are the average of the shares -in value-added in 19J 9 and 1939 of each product in that group The index for all industries is similarly weighted by the relative weight of the sub- sectorsBefore 1923 the estimation of industrial outputWllR hllRed on tax paid on sllles Aftm 19 t 9 infolmlltion on ploducUon WI1S also coJIected through tht lnx f~~H1ls IIH~S there remams some inconsistency in the datu reiatlllg to Uusperiod
s
20
(able 3 ESlJMA1ES OF IHE PllOBABlLIrV OF SUltVlVA1
1920 Census ) ~)40 Census p
Period of Entry
1900-1909 28 18 0978
1910-1919 74 49 0980
1900-1919 102 67 0979
Notes Columns 1 and 2 refer to the number of metal working firms- by
period of foundation reported in the 1920 and 1940 censuses Column 3
reports the corresponding estimate of p the annual pronnbility of
sUlvlval which has been computed using equation (3)
21
TabJe 4 MeW working firms in 1940 census
according to dale of foundation
1900-9 1910-19 1920-29 1930-39 1) No of
surviving 18 49 l16 344 firms founded
2) Unconccted
annnal rate of 18 49 116 344
foundation
Correrted
annual rate of 38 83 160 383 foundation
NotesWhile the sector included concerns producing electrical and llansport equipment there is an over estimation since all metal working concerns did not produce capital goods On the other hand some firmsmiddot producing equipment were listed under the metallurgy sector but cannot be separated due to lack of disaggregation
(1) i~gt the number of firms in 1940 census according to their reported year of establishment (2) is obtained by dividingthIS number (1) by the number of years in each period (3) is obtained from (2) by cortectingtt for the rate at which firms peJiRh The reported figure iA derived by dlvidlnF( (2) hy 097940- where (40-k) is the number of years between the mid-point of the period and 1940
Source Calculated from Industrial Census 1940
21 22
lnd all
the der
of
leir ing I is rms hy
the
Table 5 Index of import of metal-working machinery by Brazil from UK
USA Germany and France at 1913 prices
1917 49
1920 317
1929 100
1932 163 1~)39 1810
Base 1929=100
Source CalculaLed from Suzigan (1984 Appendix 1 pp320-27
Table 6 Indices of gross output and employment in metallurgy and
machinery in Sao Paulo 1929-37
Employment Gross output
metallurgy machinery metallurgy machinery
1929 355 1000 344 879
lH30 379 603 413 562
1937 1232 1116 1486 1072
Base 1935=100
Source lJilectory of statistics for the stale of Sao Paulo years
1929-1937
23
Tllblc 7 Distribution of firms in the mnchinery seelor in Sao Paulo
I am grateful to Patrick OBrien David Goodman and especially to
Rosemary Thorp for their commen~s on an earlier version of this paper
Errors remain mine alone
2
1~lnttoductiQn
The effect of trade upon the industrialisation of developing
fCOnOmieB hfta been an enduring source of controversy VJews on th~A
subject range from orthodox trade theory which sees the effect as
essentially beneficial to that of dependency theory which argues that
disruption of trade relations is essential for industrial development The
Great Depression tias been seen as a testing ground for many of these
theories - many primary producing developing countries were subject to
a severe terms of trade shock and thereby suffered an involuntary
contl1ction in their trade possibilities Alternative interpretations of this
experience are available for many of the developing countries This
paper sheds additional light on this issue by examining the development
of an important sector- that producing capital goods - in Brazil in the
1920s and 1930s Our findings question the accepted view in the
existing literature that the Depression was unambiguo~sly helpful for
the sector and accelerated ita development By using new data sources
we Rho~ that the decline of the export sector in the Depression had an
adverse imPlct upon the capital goods sector Our findings also suggest
that the consumer and capital goods sectors behaved very differently in
this period and further that the impact of the disruption of
international trade upon them was also very different
2Jrazil s Interwat-lnduairiaLDexelQPment
In the 1920s Brazil was archetypal primary commodity exporter
Coffee wag the main export crop and the 1920s were good years for
coffee Industrial growth was however rather slow for moat of the 1920s
- 36 per annum between 1920 and 1929 However recovery from the
Depression began early and growth in the 1930s was much faster shy
113 per annum between 1933 and 19392
The debate on the question of the role of the Depression in the
industrialisation of Brazil has involved two issues (1) did the
Depression result in Brazils transition from a primary producer to an
industlializing economy and (2) whtlt has been the role of economic
poliey in fostering industrial growth in the 1910s
In the classical ECLA literature (Furtado 1963) the Depression WaRmiddot
RI(~I 10 I)(~ the CllUBe of a structural brenk in Brazilian development
However subBequent writings have emphasised the link between the
cxputlsion on the export sector and industrial development through the
rise in income and the expansion of the domestic market The writings of
Fishlow (1972) Villela and Suzigan (1973) Versiani (1982) Suzigan (1984)
and Leff (1989) have thrown light on the development of industries
prior to the Depression It has been argued that this early development
allowed Braziliufl industry to take advantage of the trade dislocation
after 1929 The evidence presented in Leff (1989) shows that despite the
domination of the coffee sector the government did follow policies which
were conducive to industrial growth These included expansionary
monetary and fiscal policies high tariffs and the depreciation of the
currency However it is necessary to point out that despite the
favourable effect of various policies on industry the interventions do
not appenr lo be specifically designed to foster industrial growth For
example periods of high industrial growth in Brazil alternated with
periods of high capital formation When the currency appreciated
imports became cheaper and the demand for import su bstitutes declinedmiddot
on the othe) hand import of machinery was encouraged The situation
was reversed when the currency depreciated
A second controversy in this debate has bee n on the role of
government policy intervention in stimulating the upswing In pursuit of
coffee pt-ice support the government purchased excess supplies of
coffee This maintained incomes and had a counter-cyclical effect in a
period of decline in economic activity_ In a situation of f decline in
importing capacity arising from a foreign exchange con-gttraint it led to
import substituting industrialisation (see Furtado (1963 The countershy
cyclicaJ effect of the coffee vrice support policy has been disputed by
Pelaez (1972) who argues that the taxes levied upon coffee exports to
4
finance the stock-piling reduced domestic coffee incomes and
expenditures However Fishlow (1972) Bu~gests that the export duties
WI~ Jln~nly pnRR~d on to foreigners t 3
This paper disscusses the development of capital goods prodUction
in the context of the trade dislocation of the 1930s The debate on
Hrllzils industrialisation has implicitly assumed that industria
performance in the 1930s was uniformly Buperior to that in the 1920s In
amiddotddition it has been specifically argued (Baer 1983pp49-50 Lago et al
1979 chapter I Leff 1968 pp 11-12) that the machinery producing
aedOI also followed the pattern of development of the industrial sector
as a whole The first piece of evidence which is used to support this
conclusion is the rise in the share of machinery in manufacturing value
added between the industrial censuses of 1920 and 1940 (see Table 1)
However the absence of an industrial census in 1930 makes it extremely
difficult to understand how industry evolved in the two rather different
decades the 19208 and the 1930s
There is a need to consider the two decades Repnrately I in order to
understand the dynamics of the transition The industrial development in
the context of an export boom as in the 19208 and import substitution
following from trade dislocation as in the 1930s are two different
economic scenarios It seems possible that the consumer and capital
goods industries were affected diffrerently as we shall argue in the
following section An important question is how did a capital goods
seetor catering to the export economy adjust to the new economic
environment of the 193081 To ~address this question the data mu~t
relate to the post 1929 decade The picture that emerges by a
comparison of 1919 and 1939 the years of industrial census may be
distorted as it fails to consider 1929 as a possible structural break
(INSERT TABLE 2 ABOUT HERE]
5
Ftllther insi1ht can be had by considering a disaggreguted picture
fnhlc 2 prmlcnts ~rowth rates in two sectors texUlos and metallunty
The formel was the most important sector and domhmted the iudex of
industrial production whereas the latter includes (but is larger than)
the machinery producing sector While the 1920s witnessed sluggish
growth in textiles metallurgy grew relatively rapidly Indeed Villela and
Suzignn (Hl77) show that moat sectors expanded faster than textiles in
the period 1920-29 This is not surprising After 1924 the pattern of
development in the textile industry has diverged from that of other
industries SLains classic study (1951) of the cotton textile industry
show that the industry was suffering from over production in this
period This together with the appreciation of the currency and
deflationary policies followed by the government created insufficient
demand and the average price declined between 1925-27 But despite the
elsxistence of excess capacity there was increased investment either to
rebuild new capacity or to modernise in the face of competition This
as facilitated by the exchange rate (Versiani 1982) After 1929 textile
plodudion recovered early and the industry boomed in the 1930s
The history of the metallurgy industry is somewhat different The
slump in metallurgy production in 1929-32 was significant The years
1933-39 saw rapid growth in both sectors with metallurgy leading
We shaH middotshow in the next sections that the performance of the
capital goods sub-category within metallurgy shows a even greater bull
divergence from the trajectory of the textile industry But what reason
could there be for this differential impact of a boom or slump in the
primary producing sector An export boom had two implications - higher
incomes in the export sector and therefore higher demaud for industrial
products and a buoyant balance of payments permitting cheaper
imports We distinguish between two types of industrial products - those
which ale susceptible to international competition and those which have
a high weight-cost ratio and high transport costs and could be
UI
ag
Br
~H
Wo
pt(
in
che
loea
who
11
cI(H~sifi(gtd as non-tradnhJe The cntegoo non-tlndllble algo includls
infnliol ~oods The concept of inferior ~ood io consumpLon is well
k JlOwu vith an increase in illeome a consume) demand for theslt
PIotiIlCLH d~cHne Simitlry the demand for illf(~rior cllpital goods comes
fom tlsetS whose purchasing power is limiU~d and will therefoe switch
to IwU~I productgt IlS their financinl situntion imIov~s The two Lypes
of indUfitries would be differentially affected by an export boom In the
fil case the effed would he contradictory - while the increase hl
I~XpOlt ealnings nnd illcome would stimulate demand the improvement in
the balance of payments would cause an appreciation of the currency or
PllllIil 1lloe Iibelnl imports of competillg produelR On the other hand 8
good which is non-tradable wiH only experience a favourable increase in
deUloitd Further the currency appreciation wOl~d cheapen capitAl
fOIIll1lLion in the sector
Ttw t(~xLile indushy exemplified tbe firRL type of product since it
fticed stiff international competition The machinery producing sector
lJIainly ~roduced inferior quality equipment and machinery with a high
weight-cost ratio When transport costs are high import of products
which ale heavy lJIay prove to be uneconomical This appears to be
ill predominantly agrarian economies using relatively
unsophisticated machinery for example rice threshers presses and
water wheels Examples of indegenous prqductiqn of equipment for
agriculture date back to the first half of the nineteenth century in
Brazil The difficulties involved in transporting bulky equipment to
i-IGlas Gellli~ led to the substitution of imports by local manufacture
WoJlUhOPR were Sf up by local a~ wcll fiB fmei~n entreprencurs 10
ploduce C4uiplllcuL locally using imported raw matelial and component~
in Bahia Rio de Janeiro and Rio Grande do Sul4
ImpmLs were also displaced by inferior substitutes The demand for
cheaper though inferior quality sugar mill machinery manufactured by a
local entrepreneur in Sao Paulo in the 1920s came from small producers
who had limited access to finance s Since the demand for capital goods
7
in Drazil was to a large extent from the primar sector it WDS
stimulated hy an expolt boom and suffered durinfS the Depression Hnd
thetcfolc needs to be distinguished from the demand fot conRlnH~I
gOO(J Jilw I(~xliles The d iffcl(Hlce in the IIlli-ure of tllf ptoductmiddot of tllI~
capital Dnd the consumer goods sectors implies that the effect of the
dep(~fj()11 lIIay laave diffcJ(~d on the two sectors and that thclc iR R
need to study the two sectors separately dUtin~ the period of
LransiLioJl
3 Dtita OIl date of establishment of surviving firms
Oil finmiddot ROUP of more detailed information on tJCndR in thp
capital goods sector is the 1940 census which tells us the dale of
establirhment of firms This may be used in order to estimate the entJY
of firms into the capital goods sector for various sub-periods This
source has indeed been used in the literature for this very purpose
(see foJ example Lago 1979 pp63-67) However the existing literature
has not in making inferences made allowances for the fact that the
1940 data do not tell us the number of firms established in any given
earlier period but only the number of those established which survived
11 pLo 1940 I n order to make inferences about the rate at which firms
were founded in different periods one has to make some allowance for
the fact that some of the firms have not survived until 1940 This point
is lelevant in the context of comparisons of the rates of entry of firms
into the industry in different decades If firms have a positive
vrobuhility of going out of business in any period Ow Jute of cut ) of
firms would be sytematically understated and the degree of
understatement ould be greater the earlier the sub-period
Consequently a reliance upon the uncorrected census figures would
tend to downplay the rate of expansion of the industry in the e~rlier
decades slich as the 1900s as compared to the 1930s
In order to correct for this bias let us assume that in each year
a firm has a probability p of continuing in business and a probability
(l-p) of exiting Hence if Nkt) is the number of firms founded in
(
e
iI
fi
87
~)(tI II whkh survive 10 year t und N(ltld is the number of firms
fOlllld(d in yellt I~ which we would like Lo estillwte w(~ have
N(kL) N(Iltld p(trk) (0
From equation (1) we can derive N(kk) the number of firms
esLHldished in )-cm k fom the datil on N(ltt ie the yelU It firms
observed ill yeti l piovided thut we have some estimate of p the
plobabiliLy of survival We can obtain an eslimlite of p provided that we
have dllLa 011 the yeur It firms fit two dislincl poillts of time Suppose
that we have a census of the number of firms eslablished in year k
talwn at veilS F and yetu t where tgts We have
N(kt) N(ks) p(tr-6) (2)
Since we have data on N(kt) and N(ks) our estimate of p is given
by
P IN (It t) IN (k8) Illf(lgt-R)J
Dur estimates of p are derived by combining the data on the
foundation of firms in the 1920 census and the 1940 census Both these
cenSHses report lhe number of firms founded in the period 1900-1909
and lhe period 1910-1919 As the preceding argumen~ would lead us to
expect the number of firms in each category is lower in the 1940
census as compared to the 1920 census Table 3 reports these figures
and the estimates of p the survival probability which have been
computed using these figures The different estimates we have are
relilarkllblY close differing only in the third decimal place by ilt most
0002 Th~ ~stimate of p we use is 0979 which is obtained by using the
dalu on all the firms founded between 1900 and 1919
By using our estimate of p and the 1940 census data on the -Humber of surviving firms by year of foundation we arrh-c at an
estimate of the corrected lt annual rate of foundation This is reported
in Table 4 which also reports the raw data on the number of surviving
firms aecording to their year of foundation The figures show that the
9
rate of enlrr increased steadily over the Y(~llrS mOle 01 lesR doublill~
f)om on~ decude to the other The figures nevertheless sho
considelllble growth in the industry in the period befole IH29 Helillllce
II POll the ItrlcolIected nnnual rate of foundation vould suggest that
fewer firms entered the industry in the early years of the century
[INSERT TABIJES 3 AND 4 ABOUT JlEHB I
4 Machinery impoJts
Lugo et al (1979 p67) use the rate of growth of imports of capital
goods to make inferences about the growth of the sector the argument
tHillo( thuL low(t imports are likely to imply greater growth of the
domestic sector Comparing the indices of imporL of capital goods Lago
el HI couclude that while imports of capital goods increased in the
1920s the rate of growth was low compared to the period before the
first world war Since both periods saw high capital formation Lago et
al argue that this indicates relatively fast growth in domestic production
of capital goods in the 1920s However this argument is likely to be
misleudillg since it muy fail to control sufficiently for variations in the
level of investment It is quite likely that imports of machinery fluctuate
in Iesponse to the overall demand for machinery for investment so that
it is quite possible that periods of high imports are also periods of high
domestic production of machinery A second problem is that machines are
also lequired to make machines and the aggregate data does not
distinguish between machinery used in the production of COlUmnaeI
good~ Gild UIOfiC in the production of capital goods Hence it is difficult
to use aggregate import data to infer about trends in capital formation
in the machinery industry To the extent that investment goods for the
production of capital goods are not domestically produced at all a
declille in imports could would have an adverse effect In the 1920s
whell imports entered on favourable terms as a esult of the
10
appr(~eiaUon of the currency many sectors experienced a sustained
period of capital formation This may well be the case for thn capital
~OOdB seetor producing equipment for the booming coffee (~COllomy
lienee ill the abseuce of disnggregnled ltlilLa infelcllces dlIlWIl Oil the
basis of an aggregate index may be questionable
1010111 thin point of view Suzigans data (1UH) on the 41111lItlllll of
eXJlort of maehinelY to Brazil from France Germauy the United Kingdom
alld the United States are more useful since they me rlisaggregaled hy
sedorS Such exports of metal-working machinelY has been used to
mlimate the quantum of imports by Brazil and this can be an indjcator
of the 1evel of investment in the metallurg~ and Cllpital goods sectors
[INSERT TABLE 5 ABOUT HERE]
Table 5 sllows that after the disruption caused by the First World
War imports of metal-working machinery by Brazil increased rapidly in
the 19206 trebling in volume between 1919 to 1929 With the Depression
there is f1 d lasLie fall and it is only in 1935 that the 1929 level is reshy
established (see the complete tab1e presented in Gupta 1989) The
subsequent years show rapid growth However at the end of the 1930s
illlports of metal-working machinery were on average double of the level
of 1929 a smallel~ order of increase over the decade as a whole as
eomp(ll(~d to tht 19208 However as Suzigan points out they iuclude
machinery for metallurgical operations which would meet the investment
metallurgy sector was larger than the sector producing machinerybull Consequently movements in the former may obscure or outweigh that of
th(~ latter We shall see that data from Sao Paulo show that in the period
1929-37 growth in metallurgy was much faster than in machinery
11
S Steel Consumption
Leff (1968) analysis of the Brazilian capital goodE sector is based
elltirely on Uw consumption of iron and steel for the period 1929-40
Referring to the metallurgical and equipment industries he writes (pp
11-]2)
These industries already had a significant portion of value added in Brazilian manufacturing as early as 1920 By 1940 however they had grown rapidly enough to double their share The equipment industry grew at a particularly disptOpOItionlite Iale almost trebling the percentage The growth of equipment production seems to have been especially Iapid in the period 1933-40 Output statistics are not defined for available for those years but the table shows data on the nra7jlillTl consumption of iron and steel Because this was befole the extensive use of iron and steel either in construction or in consumer durables these input figures are an indication of the extent of equipment productionbullbullThe aBllllal compound growth rate was 104 percent
Again Leffs arguments are based firstly upon a comparison of the
1920 nlld 1910 censuses find secondly upon the rapid growth in
consumption of iron and steel between 1933 and 1940 As we have
already argued themiddot first comparison does not allow us to disentangle
the changes before 1929 and those taking place afterwards Regarding
the second it is somewhat misleading to compute growth rates from
1933 a point where steel consumption had fallen substantially A part of
the 104 growth attributed to this period does not reflect any additions
to capacity but merely a recovery to earlier levels of production If
illstead we compute the annual rate of growth between 1929 and 1940
the figure is only 58 Further due to the use of iron and steel the
eOlll~lrllction industry for railway construction and other infrastructurlll
development inferring trends in capital goods production from steel
ltuJlsullIpLion is problematic These remarks also apply to Lago et al 0979 p63) who use the figures on the demand for iron and steel in
Otder to draw similar inferences
6 Firm-level data from Sao Paulo
Given the weakness of the aggregate and indit-ecl datn sources
We turn to some firm level data on machinery producers in the state of
J2
Slw Pilulo By 1919 SlO Paulo had become the leading industrinl ce nte
in the country It accounted for 353 of the tou) industrial value
tldclld nlldl h lUHl Uw fil(ul(~ Itel Iift1U 10 101) Ihn illtlllRtJinl
cOllecuttalion in the slate was particularly noticeable in the category
machinery electrical and transport equipment II The share of the slate
in the nntional value added had been 48 in 19t9 In 1939 it stood at
78 Moreover lhe state of Sao Paulo in the 1920s was the centre of
the eXpolt boom and industrial growth was mainly in response to
expansion in the export sector
The duta used in our analysis comprise a list of firms producing
machinery for agriculture and industry between 1928 and 19377 This
(ategory is a sub-sector of the metaJIurgy inrlustry which inclu des
foundries and wol1tshops producing metal products workshops
producing transport and electrical equipment and parts fOr these and
valjolls tngtes of repair workshops Thus whiJe U pUJl of lhe seewr
would approximate the category metallurgy as defined in the IndustliaJ
Census of 1940 another part represents the sector metal working We
distingush between the two since the output of the metallurgy sectoi
comprise of intermediate goods while the metal working sector prduces
capital goods Our analysis relates to the capital goods industry and
consequently we select the sub-sector machinery for agriculture and
industtmiddoty as the closest approximation However machinery was also
produced in foundries and in repair workshops but it is impossible to
sepIllate out the magnitude of such production from the oulput oC
intelmediate goods and repairwork Our category excludes production oC
(~llt~ctlical and transport equipment as well as machinery produced in
workshops mainly engaged in repair-work and lhose produced in
foundries and consequently underestimates the extent of capital goods
production lIowever there are considelable advantages in usiug lhis
source It plovides information about the types of products
manufactured by these firms the level of employment in each fitm und
13
the toud value of output in the sector This is the only source of
output statistics within the capital goods seelor
In 1929 the metuUurgy sector as a whole hud 486 estublishmentr
and employed 15160 workers The sub-sector producing machinery
accounted for approximately one-fifth the number of establishments
Hilder metallurgy II third of employment a quurter of output and about
30 of the capital invested The sector produced primarily agricultural
machillery which included equipment for processing coffee cotton sugar
and rice and various types of farming equipment Among the firms in
the category employing over 50 workers fourteen produced machinery
for agricullure and agro-industries while there were single firms
specializing in producing machinery for saw mills bakeries and the hat
IndustrY und purts for textile machinery One fitlll lIIunufuctured
elevators This confirms the picture of a capital goods industry
developing in response to an expansion in the export sector The
industry produced mainly equipment for the export sector and only
certain types of simple machinery required in the production of
consumer goods
[INSERT TABLE 6 ABOUT HERE]
Table 6 shows the changes in employment and output in the
metallurgy sector and in the sub-sector machinery between 1929 and
1937 While real output and employment in metallurgymiddot tripled in this
peljod growth in the machinery industry was much slowe - CU) output
increased by only 142 and employment by 216 This contrast is
striking and particularly relevant since other indirect estimates of
machinery production are often forced to rely upon the assumption that
maehinery production moves in line with metallurgy For instance
Suzigans use of the exports of metal working machinery to Brazilmiddot has
the problem that such machines may be used either in metalhugy or in
mnchinmt ploduetion proper Our dutu indkute that at lellst fOI the
period 192$-17 in the premiltt state of Suo Paulo trends in the two
f
This data also allows us to analyse the process of stJuctural
Chflll~(~ wilhin the sector Table 7 shows the Rize-distribution of fhms
lin terms of employment) over the period There was a decline in the
nu~bel of fitms in the sector between 1929 and 1937 mainly due to 1I1e
exit or small firms The number of firms employing Jess than 20 workers
declined from 92 to 54 due to the disappearance of many small
wOIkhoPR catering to the export sector There is also a major change
in output composition Of the 19 firms employing more than 50 workers
in 1929 11 ploduced mfchinery for agriculture and agro-indtUdries
whereas in 1937 only 10 of the 23 firms in this category did so the
rCRt producing industrial machinery There was also 8 diversification of
output with fillllS entering the production of machinery for metallurgy
chelJlicaL and paper industries and well as equipment for power
generalion and transmission The contrast is best expressed in a single
statislic - ~mployment in the large firms (with more than 50middot workers)
producing for agriculture and agro-industries rose by only 84 between
1929 and 1937 but rose by 84 in large firms producing industrial
machinery
[INSERT TABLE 7 ABOUT HERE]
OVfr Uw J9UJR there emerged a great dlverflificntiofl in BJIl7i1s
capital goods industry Not only did production of industrial machinery
assume greater importance but it was also the firms producing
industrial machinery which showed greater dynamism The gains in the
production of equipment for the textile industry were most significant
The number of firms producing machinery for other consumer goods was
fewer but here too there was an expansion over this period In the mid
15
19306 finus began to produce machinery fat meLnllurgical and chemical
wOIks os well as equipment for printing Their successful tlansition depfHH](~d Oil the ahility to diversify and cater more und IJlOr~l to HIP
dynamic seclolS of the economy as is also seen flolll a histolY of fit-ms
within the sector (see Gupta 1989 pp 47-60) Romi which used to repair
uutolliouileR amI Ilgliclliturlll machinery entercd Into the ploducUon of
machine tools Similarly Bardella diversified into industrial machinery in
respollsc to the changing structure of demand Dedini conlinllnd to he
Hnked to the primary sector but produced machinery for the expanding
fingal economy Anddghetli and Villares were involved ill the ploduction
of industrial machinelY from the 1920s
AI the beginning of the depression the Brazilian capital goods
industry had essentially catered to the export economy By the eud of
the next decade it showed greater diversity Although the main souree
of demand was sU)) the primary sector production of equipmeut for
consumer and intetmediate goods industries had begun It was the
scctor ploducing industrial machinery which proved to be most dynamic
in this period N~vertheless its i)hare in ttIe domestic production of
capital goods remained small and the dynamism of this segment of the
capital goods sector was not reflected in the data on aggregate output
and employment The more important segment of the capita] goods
industry catered to agriculture and and was advetsely affected by the
decline in the export economy Although cotton production expanded
rupidly in the middotstate of Sao Paulo the export boom was over and the
emergence of cotton as the second largest export crop merely reduced
Uw impaet of the crisis The 1930s needs to be seen as a period of
structural change within the capital goods industry
An examination of various data sources suggests that the impact of
the Great Depression upon the capital goods sector in Brazil was not as
positive as has been suggested Capital goods production catered to a
large extent to the primary producing export sector and was adversely
d
16 5
nfflleted by the trade shock This contrasts with the behaviour of the
consumer goods sedol especially textiles which witnessed more rapid
1llble 2 Annual rate oC growth of industrial output
1920-29 1929-32 1933-9
Textiles 19 84 111
t-1etallur~y 75 -34 204
All industries 36 13 113
Source Villela and Suzigan (1977) pp 130164166
Note The growth rates have been calculated from quantum indices of industrial production in each sub-sector and the weights used are the average of the shares -in value-added in 19J 9 and 1939 of each product in that group The index for all industries is similarly weighted by the relative weight of the sub- sectorsBefore 1923 the estimation of industrial outputWllR hllRed on tax paid on sllles Aftm 19 t 9 infolmlltion on ploducUon WI1S also coJIected through tht lnx f~~H1ls IIH~S there remams some inconsistency in the datu reiatlllg to Uusperiod
s
20
(able 3 ESlJMA1ES OF IHE PllOBABlLIrV OF SUltVlVA1
1920 Census ) ~)40 Census p
Period of Entry
1900-1909 28 18 0978
1910-1919 74 49 0980
1900-1919 102 67 0979
Notes Columns 1 and 2 refer to the number of metal working firms- by
period of foundation reported in the 1920 and 1940 censuses Column 3
reports the corresponding estimate of p the annual pronnbility of
sUlvlval which has been computed using equation (3)
21
TabJe 4 MeW working firms in 1940 census
according to dale of foundation
1900-9 1910-19 1920-29 1930-39 1) No of
surviving 18 49 l16 344 firms founded
2) Unconccted
annnal rate of 18 49 116 344
foundation
Correrted
annual rate of 38 83 160 383 foundation
NotesWhile the sector included concerns producing electrical and llansport equipment there is an over estimation since all metal working concerns did not produce capital goods On the other hand some firmsmiddot producing equipment were listed under the metallurgy sector but cannot be separated due to lack of disaggregation
(1) i~gt the number of firms in 1940 census according to their reported year of establishment (2) is obtained by dividingthIS number (1) by the number of years in each period (3) is obtained from (2) by cortectingtt for the rate at which firms peJiRh The reported figure iA derived by dlvidlnF( (2) hy 097940- where (40-k) is the number of years between the mid-point of the period and 1940
Source Calculated from Industrial Census 1940
21 22
lnd all
the der
of
leir ing I is rms hy
the
Table 5 Index of import of metal-working machinery by Brazil from UK
USA Germany and France at 1913 prices
1917 49
1920 317
1929 100
1932 163 1~)39 1810
Base 1929=100
Source CalculaLed from Suzigan (1984 Appendix 1 pp320-27
Table 6 Indices of gross output and employment in metallurgy and
machinery in Sao Paulo 1929-37
Employment Gross output
metallurgy machinery metallurgy machinery
1929 355 1000 344 879
lH30 379 603 413 562
1937 1232 1116 1486 1072
Base 1935=100
Source lJilectory of statistics for the stale of Sao Paulo years
1929-1937
23
Tllblc 7 Distribution of firms in the mnchinery seelor in Sao Paulo
1937 54 23 10 8 5 ~ Source Directory of statistics for the state of Sao Paulo years
1929-1937
CENrRE FOR DEVELOPMENT ECONOMICS WORKING PAPER SERIES
AYthQr(s) Title
1 Kaushik Basu The Babu and The Boxwallsecth Arghya Ghosh Managerial Incentives and Government Tridip Ray Intervention
2 M N Murty optimal Taxation and Resource Ranjan Ray Transfers in a Federal Nation
3 v Bhaskar Privatization and Employment A Mushtaq Khan study of The Jute Industry in
Bangladesh
4 V Bhaskar Distributive Justice and The Control of Global Warming
5 Bishnupriya Gupta The Great Depression and Brazils Capital Goods Sector A Re-examination
11
S Steel Consumption
Leff (1968) analysis of the Brazilian capital goodE sector is based
elltirely on Uw consumption of iron and steel for the period 1929-40
Referring to the metallurgical and equipment industries he writes (pp
11-]2)
These industries already had a significant portion of value added in Brazilian manufacturing as early as 1920 By 1940 however they had grown rapidly enough to double their share The equipment industry grew at a particularly disptOpOItionlite Iale almost trebling the percentage The growth of equipment production seems to have been especially Iapid in the period 1933-40 Output statistics are not defined for available for those years but the table shows data on the nra7jlillTl consumption of iron and steel Because this was befole the extensive use of iron and steel either in construction or in consumer durables these input figures are an indication of the extent of equipment productionbullbullThe aBllllal compound growth rate was 104 percent
Again Leffs arguments are based firstly upon a comparison of the
1920 nlld 1910 censuses find secondly upon the rapid growth in
consumption of iron and steel between 1933 and 1940 As we have
already argued themiddot first comparison does not allow us to disentangle
the changes before 1929 and those taking place afterwards Regarding
the second it is somewhat misleading to compute growth rates from
1933 a point where steel consumption had fallen substantially A part of
the 104 growth attributed to this period does not reflect any additions
to capacity but merely a recovery to earlier levels of production If
illstead we compute the annual rate of growth between 1929 and 1940
the figure is only 58 Further due to the use of iron and steel the
eOlll~lrllction industry for railway construction and other infrastructurlll
development inferring trends in capital goods production from steel
ltuJlsullIpLion is problematic These remarks also apply to Lago et al 0979 p63) who use the figures on the demand for iron and steel in
Otder to draw similar inferences
6 Firm-level data from Sao Paulo
Given the weakness of the aggregate and indit-ecl datn sources
We turn to some firm level data on machinery producers in the state of
J2
Slw Pilulo By 1919 SlO Paulo had become the leading industrinl ce nte
in the country It accounted for 353 of the tou) industrial value
tldclld nlldl h lUHl Uw fil(ul(~ Itel Iift1U 10 101) Ihn illtlllRtJinl
cOllecuttalion in the slate was particularly noticeable in the category
machinery electrical and transport equipment II The share of the slate
in the nntional value added had been 48 in 19t9 In 1939 it stood at
78 Moreover lhe state of Sao Paulo in the 1920s was the centre of
the eXpolt boom and industrial growth was mainly in response to
expansion in the export sector
The duta used in our analysis comprise a list of firms producing
machinery for agriculture and industry between 1928 and 19377 This
(ategory is a sub-sector of the metaJIurgy inrlustry which inclu des
foundries and wol1tshops producing metal products workshops
producing transport and electrical equipment and parts fOr these and
valjolls tngtes of repair workshops Thus whiJe U pUJl of lhe seewr
would approximate the category metallurgy as defined in the IndustliaJ
Census of 1940 another part represents the sector metal working We
distingush between the two since the output of the metallurgy sectoi
comprise of intermediate goods while the metal working sector prduces
capital goods Our analysis relates to the capital goods industry and
consequently we select the sub-sector machinery for agriculture and
industtmiddoty as the closest approximation However machinery was also
produced in foundries and in repair workshops but it is impossible to
sepIllate out the magnitude of such production from the oulput oC
intelmediate goods and repairwork Our category excludes production oC
(~llt~ctlical and transport equipment as well as machinery produced in
workshops mainly engaged in repair-work and lhose produced in
foundries and consequently underestimates the extent of capital goods
production lIowever there are considelable advantages in usiug lhis
source It plovides information about the types of products
manufactured by these firms the level of employment in each fitm und
13
the toud value of output in the sector This is the only source of
output statistics within the capital goods seelor
In 1929 the metuUurgy sector as a whole hud 486 estublishmentr
and employed 15160 workers The sub-sector producing machinery
accounted for approximately one-fifth the number of establishments
Hilder metallurgy II third of employment a quurter of output and about
30 of the capital invested The sector produced primarily agricultural
machillery which included equipment for processing coffee cotton sugar
and rice and various types of farming equipment Among the firms in
the category employing over 50 workers fourteen produced machinery
for agricullure and agro-industries while there were single firms
specializing in producing machinery for saw mills bakeries and the hat
IndustrY und purts for textile machinery One fitlll lIIunufuctured
elevators This confirms the picture of a capital goods industry
developing in response to an expansion in the export sector The
industry produced mainly equipment for the export sector and only
certain types of simple machinery required in the production of
consumer goods
[INSERT TABLE 6 ABOUT HERE]
Table 6 shows the changes in employment and output in the
metallurgy sector and in the sub-sector machinery between 1929 and
1937 While real output and employment in metallurgymiddot tripled in this
peljod growth in the machinery industry was much slowe - CU) output
increased by only 142 and employment by 216 This contrast is
striking and particularly relevant since other indirect estimates of
machinery production are often forced to rely upon the assumption that
maehinery production moves in line with metallurgy For instance
Suzigans use of the exports of metal working machinery to Brazilmiddot has
the problem that such machines may be used either in metalhugy or in
mnchinmt ploduetion proper Our dutu indkute that at lellst fOI the
period 192$-17 in the premiltt state of Suo Paulo trends in the two
f
This data also allows us to analyse the process of stJuctural
Chflll~(~ wilhin the sector Table 7 shows the Rize-distribution of fhms
lin terms of employment) over the period There was a decline in the
nu~bel of fitms in the sector between 1929 and 1937 mainly due to 1I1e
exit or small firms The number of firms employing Jess than 20 workers
declined from 92 to 54 due to the disappearance of many small
wOIkhoPR catering to the export sector There is also a major change
in output composition Of the 19 firms employing more than 50 workers
in 1929 11 ploduced mfchinery for agriculture and agro-indtUdries
whereas in 1937 only 10 of the 23 firms in this category did so the
rCRt producing industrial machinery There was also 8 diversification of
output with fillllS entering the production of machinery for metallurgy
chelJlicaL and paper industries and well as equipment for power
generalion and transmission The contrast is best expressed in a single
statislic - ~mployment in the large firms (with more than 50middot workers)
producing for agriculture and agro-industries rose by only 84 between
1929 and 1937 but rose by 84 in large firms producing industrial
machinery
[INSERT TABLE 7 ABOUT HERE]
OVfr Uw J9UJR there emerged a great dlverflificntiofl in BJIl7i1s
capital goods industry Not only did production of industrial machinery
assume greater importance but it was also the firms producing
industrial machinery which showed greater dynamism The gains in the
production of equipment for the textile industry were most significant
The number of firms producing machinery for other consumer goods was
fewer but here too there was an expansion over this period In the mid
15
19306 finus began to produce machinery fat meLnllurgical and chemical
wOIks os well as equipment for printing Their successful tlansition depfHH](~d Oil the ahility to diversify and cater more und IJlOr~l to HIP
dynamic seclolS of the economy as is also seen flolll a histolY of fit-ms
within the sector (see Gupta 1989 pp 47-60) Romi which used to repair
uutolliouileR amI Ilgliclliturlll machinery entercd Into the ploducUon of
machine tools Similarly Bardella diversified into industrial machinery in
respollsc to the changing structure of demand Dedini conlinllnd to he
Hnked to the primary sector but produced machinery for the expanding
fingal economy Anddghetli and Villares were involved ill the ploduction
of industrial machinelY from the 1920s
AI the beginning of the depression the Brazilian capital goods
industry had essentially catered to the export economy By the eud of
the next decade it showed greater diversity Although the main souree
of demand was sU)) the primary sector production of equipmeut for
consumer and intetmediate goods industries had begun It was the
scctor ploducing industrial machinery which proved to be most dynamic
in this period N~vertheless its i)hare in ttIe domestic production of
capital goods remained small and the dynamism of this segment of the
capital goods sector was not reflected in the data on aggregate output
and employment The more important segment of the capita] goods
industry catered to agriculture and and was advetsely affected by the
decline in the export economy Although cotton production expanded
rupidly in the middotstate of Sao Paulo the export boom was over and the
emergence of cotton as the second largest export crop merely reduced
Uw impaet of the crisis The 1930s needs to be seen as a period of
structural change within the capital goods industry
An examination of various data sources suggests that the impact of
the Great Depression upon the capital goods sector in Brazil was not as
positive as has been suggested Capital goods production catered to a
large extent to the primary producing export sector and was adversely
d
16 5
nfflleted by the trade shock This contrasts with the behaviour of the
consumer goods sedol especially textiles which witnessed more rapid
1llble 2 Annual rate oC growth of industrial output
1920-29 1929-32 1933-9
Textiles 19 84 111
t-1etallur~y 75 -34 204
All industries 36 13 113
Source Villela and Suzigan (1977) pp 130164166
Note The growth rates have been calculated from quantum indices of industrial production in each sub-sector and the weights used are the average of the shares -in value-added in 19J 9 and 1939 of each product in that group The index for all industries is similarly weighted by the relative weight of the sub- sectorsBefore 1923 the estimation of industrial outputWllR hllRed on tax paid on sllles Aftm 19 t 9 infolmlltion on ploducUon WI1S also coJIected through tht lnx f~~H1ls IIH~S there remams some inconsistency in the datu reiatlllg to Uusperiod
s
20
(able 3 ESlJMA1ES OF IHE PllOBABlLIrV OF SUltVlVA1
1920 Census ) ~)40 Census p
Period of Entry
1900-1909 28 18 0978
1910-1919 74 49 0980
1900-1919 102 67 0979
Notes Columns 1 and 2 refer to the number of metal working firms- by
period of foundation reported in the 1920 and 1940 censuses Column 3
reports the corresponding estimate of p the annual pronnbility of
sUlvlval which has been computed using equation (3)
21
TabJe 4 MeW working firms in 1940 census
according to dale of foundation
1900-9 1910-19 1920-29 1930-39 1) No of
surviving 18 49 l16 344 firms founded
2) Unconccted
annnal rate of 18 49 116 344
foundation
Correrted
annual rate of 38 83 160 383 foundation
NotesWhile the sector included concerns producing electrical and llansport equipment there is an over estimation since all metal working concerns did not produce capital goods On the other hand some firmsmiddot producing equipment were listed under the metallurgy sector but cannot be separated due to lack of disaggregation
(1) i~gt the number of firms in 1940 census according to their reported year of establishment (2) is obtained by dividingthIS number (1) by the number of years in each period (3) is obtained from (2) by cortectingtt for the rate at which firms peJiRh The reported figure iA derived by dlvidlnF( (2) hy 097940- where (40-k) is the number of years between the mid-point of the period and 1940
Source Calculated from Industrial Census 1940
21 22
lnd all
the der
of
leir ing I is rms hy
the
Table 5 Index of import of metal-working machinery by Brazil from UK
USA Germany and France at 1913 prices
1917 49
1920 317
1929 100
1932 163 1~)39 1810
Base 1929=100
Source CalculaLed from Suzigan (1984 Appendix 1 pp320-27
Table 6 Indices of gross output and employment in metallurgy and
machinery in Sao Paulo 1929-37
Employment Gross output
metallurgy machinery metallurgy machinery
1929 355 1000 344 879
lH30 379 603 413 562
1937 1232 1116 1486 1072
Base 1935=100
Source lJilectory of statistics for the stale of Sao Paulo years
1929-1937
23
Tllblc 7 Distribution of firms in the mnchinery seelor in Sao Paulo
1937 54 23 10 8 5 ~ Source Directory of statistics for the state of Sao Paulo years
1929-1937
CENrRE FOR DEVELOPMENT ECONOMICS WORKING PAPER SERIES
AYthQr(s) Title
1 Kaushik Basu The Babu and The Boxwallsecth Arghya Ghosh Managerial Incentives and Government Tridip Ray Intervention
2 M N Murty optimal Taxation and Resource Ranjan Ray Transfers in a Federal Nation
3 v Bhaskar Privatization and Employment A Mushtaq Khan study of The Jute Industry in
Bangladesh
4 V Bhaskar Distributive Justice and The Control of Global Warming
5 Bishnupriya Gupta The Great Depression and Brazils Capital Goods Sector A Re-examination
21
TabJe 4 MeW working firms in 1940 census
according to dale of foundation
1900-9 1910-19 1920-29 1930-39 1) No of
surviving 18 49 l16 344 firms founded
2) Unconccted
annnal rate of 18 49 116 344
foundation
Correrted
annual rate of 38 83 160 383 foundation
NotesWhile the sector included concerns producing electrical and llansport equipment there is an over estimation since all metal working concerns did not produce capital goods On the other hand some firmsmiddot producing equipment were listed under the metallurgy sector but cannot be separated due to lack of disaggregation
(1) i~gt the number of firms in 1940 census according to their reported year of establishment (2) is obtained by dividingthIS number (1) by the number of years in each period (3) is obtained from (2) by cortectingtt for the rate at which firms peJiRh The reported figure iA derived by dlvidlnF( (2) hy 097940- where (40-k) is the number of years between the mid-point of the period and 1940
Source Calculated from Industrial Census 1940
21 22
lnd all
the der
of
leir ing I is rms hy
the
Table 5 Index of import of metal-working machinery by Brazil from UK
USA Germany and France at 1913 prices
1917 49
1920 317
1929 100
1932 163 1~)39 1810
Base 1929=100
Source CalculaLed from Suzigan (1984 Appendix 1 pp320-27
Table 6 Indices of gross output and employment in metallurgy and
machinery in Sao Paulo 1929-37
Employment Gross output
metallurgy machinery metallurgy machinery
1929 355 1000 344 879
lH30 379 603 413 562
1937 1232 1116 1486 1072
Base 1935=100
Source lJilectory of statistics for the stale of Sao Paulo years
1929-1937
23
Tllblc 7 Distribution of firms in the mnchinery seelor in Sao Paulo