Page 1
Purdue UniversityPurdue e-Pubs
International Compressor Engineering Conference School of Mechanical Engineering
2014
Centrifugal Compressor Performance Deviationswith Various Refrigerants, Impeller Sizes and ShaftSpeedsYuanjie WuIngersoll Rand -Trane, United States of America, [email protected]
Chris ThilgesIngersoll Rand -Trane, United States of America, [email protected]
Follow this and additional works at: https://docs.lib.purdue.edu/icec
This document has been made available through Purdue e-Pubs, a service of the Purdue University Libraries. Please contact [email protected] foradditional information.Complete proceedings may be acquired in print and on CD-ROM directly from the Ray W. Herrick Laboratories at https://engineering.purdue.edu/Herrick/Events/orderlit.html
Wu, Yuanjie and Thilges, Chris, "Centrifugal Compressor Performance Deviations with Various Refrigerants, Impeller Sizes and ShaftSpeeds" (2014). International Compressor Engineering Conference. Paper 2286.https://docs.lib.purdue.edu/icec/2286
Page 2
1225, Page 1
International Compressor Engineering Conference at Purdue, July 14-17, 2014
Centrifugal Compressor Performance Deviations with Various Refrigerants,
Impeller Sizes and Shaft Speeds
Yuanjie Wu1*, Chris Thilges
2
Ingersoll Rand - Trane
Compressor Development and Technology
3600 Pammel Creek Road; La Crosse, WI 54601 USA
1Email: [email protected] , Phone: 608-787-3765
2 Email: [email protected] , Phone: 608-787-2768
*Corresponding Author
ABSTRACT
Under the pressure of the Montreal Protocol originally written in 1987 (UNEP, 1987), the current popularly used
HCFC and HFC refrigerants for comfortable air conditioning, such as low pressure refrigerant R123, will have to be
phased out in the near future. This forces companies in centrifugal chiller industry to redesign and retest new
centrifugal compressors which can accommodate alternative refrigerants. Keeping the present flow path designs is
an economic design process for the alternative refrigerants, and is well adapted by companies in this industry. In
addition extensively employ the flow similitude theory is also an effective way to minimize the cost of lab tests.
However employing similitude in compressible flow does not forecast the content in which compressors meet the
uncontrollable situations such as choke and surge. Conclusions can only be drawn from experimental data. (Dixon,
1998) and (Ferguson, 1963) .
This paper will present the theory and experimental verification for a low cost method to predict the compressor
performance under an alternative refrigerant based on existing compressor maps. A few factors that affect
compressor performance maps, but whose effects cannot be predicted by similitude theory are also analyzed by
reviewing large amount of tested data.
1. INTRODUCTION
Centrifugal compressors applied in commercial air conditioning compress refrigerant vapor to raise its pressure and
temperature by converting kinetic energy into potential energy, i.e. pressure. Their pressure ratio or equivalently
isentropic enthalpy rise mainly depends upon the saturation temperatures of condenser and evaporator which both
are heat exchangers to exchange heat from/to refrigerant. Different geographic locations may indicate much
different maximum temperature lift from evaporator to condenser, which requires centrifugal compressor to have
either different size impellers or variable speed capability to provide the proper amount of refrigerant enthalpy rise.
In addition, caused by environmental protection pressure, some environment friendly alternative refrigerants have
been gradually replacing the current HCFC refrigerants. A lot of such applications are retrofit process (Brasz, 1996)
which means the alternative refrigerant is just simply dropped into centrifugal chillers designed for old HCFC
refrigerants. This requires accurate performance prediction of the centrifugal compressors based on their HCFC
performance maps.
The performance map of the centrifugal compressor refers to the specified compressor discharge energy with given
fluid path geometry when it passes a specific flow rate. Specific work delivered from rotor to operating gas can be
given by Euler turbine equation:
(1)
Page 3
1225, Page 2
International Compressor Engineering Conference at Purdue, July 14-17, 2014
From Euler equation different head can be reached through adjusting the amount of inlet pre-swirl. The inlet guide
vane (IGV) thus is typically employed for a compressor stage to set proper pre-swirl. Therefore on compressor
head-flow and efficiency-flow maps, It shows a 2D zone rather than a single line to reflect variable geometry
characteristic. (Brasz, 2008 )
Usually the compressor performance characteristics are expressed as dimensionless variables employing the flow
similitude theory to minimize the cost for lab test. Both (Dixon, 1998) and (Ferguson, 1963) gave the theory about
the dimensionless maps as below:
(2)
The definitions are described as:
Head coefficient or pressure coefficient: (3)
Flow coefficient: (4)
Reynolds number: (5)
Impeller blade Mach number: (6)
Here µ, ρ01and a01 are viscosity, gas density and speed of sound at stage inlet, respectively; N is impeller shaft speed
usually measured as revolution per minute (RPM); D is impeller blade diameter; ∆h0s is the isentropic enthalpy rise
of compressor stage; γ is the isentropic exponent and is the mass flow rate.
However similitude in compressible flow does not forecast the extent to which performance depends upon Reynolds
number, isentropic exponent (γ) and blade (tip) Mach number. Conclusions can only be drawn from experimental
data(Dixon, 1998) and (Ferguson, 1963). Moreover these theories do not explain compressor stage working at
irregular status such as during choke and surge. This paper investigates various factors that affect the compressor
maps based on both similitude and the large amount of experimental data which were tested by Ingersoll Rand (IR)
climate solution division (Trane). The prediction method is also provided to predict the performance of untested gas
from available tested data.
2. EXPERIMENTAL APPARATUS
The tests were conducted on CenTraVac units, CVHG1100/CVHH1550, CVHF1300/CVHH1700, and
CVHF870/CVHH1200 which are Ingersoll Rand-Trane’s water cooled chiller products. The centrifugal compressor
of CVHG1100/CVHH1550 chiller has three stages, works at 50 Hz commercial electricity while two stages, 60 Hz
for the other two chillers. All chillers are directly motor driven. The nominal impeller shaft thus are 3000 RPM and
3600 RPM for 50 Hz and 60 Hz , respectively. In addition an Adjustable Frequency Drive (AFD) was also
installed to drive the motor, which enables compressors to work at variable speeds. The operating gas passing
through compressor are refrigerant R123, R245fa, FLUID-A and FLUID-B. (FLUID-A and FLUID-B are Ingersoll
Rand internal names standing for Experimental Refrigerant A and B.) A series of impellers which possess same
throat area and inlet and exit blade angle designs, but different blade diameters are tested for each unit as well.
Some tests also consider different IGV openings, in which 90° stands for full opening or no inlet pre-swirl. The
experiment matrix is listed in Table 1.
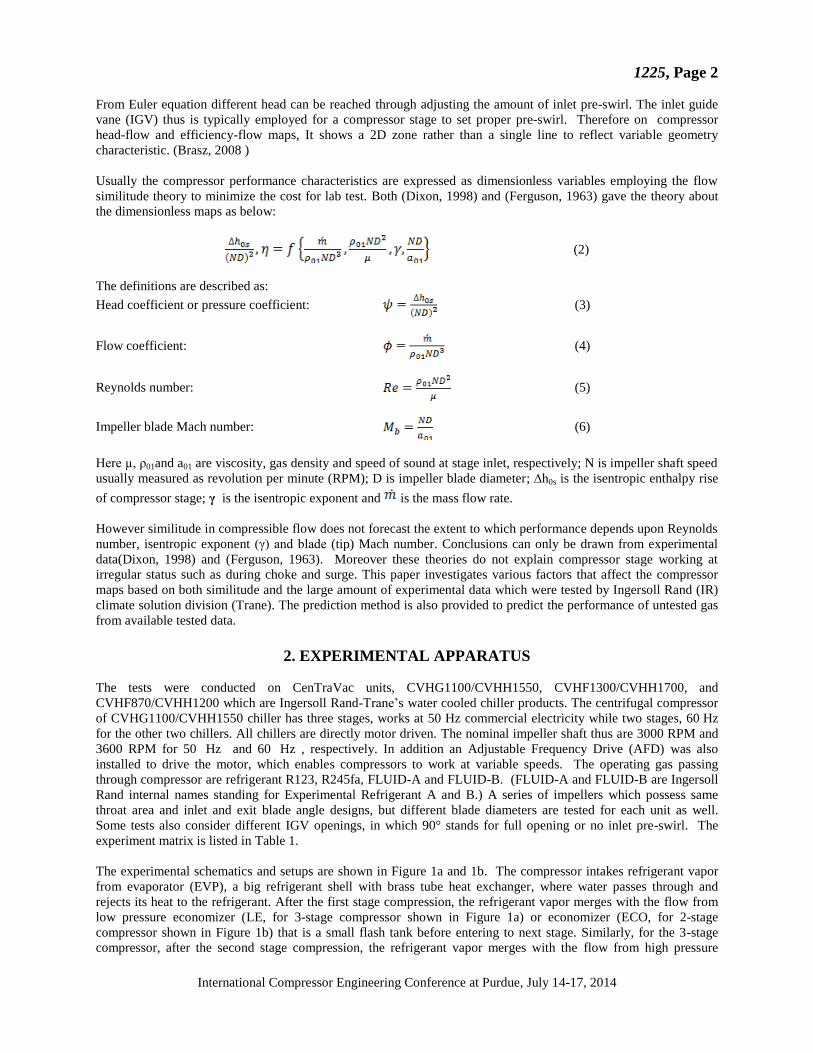
The experimental schematics and setups are shown in Figure 1a and 1b. The compressor intakes refrigerant vapor
from evaporator (EVP), a big refrigerant shell with brass tube heat exchanger, where water passes through and
rejects its heat to the refrigerant. After the first stage compression, the refrigerant vapor merges with the flow from
low pressure economizer (LE, for 3-stage compressor shown in Figure 1a) or economizer (ECO, for 2-stage
compressor shown in Figure 1b) that is a small flash tank before entering to next stage. Similarly, for the 3-stage
compressor, after the second stage compression, the refrigerant vapor merges with the flow from high pressure
Page 4
1225, Page 3
International Compressor Engineering Conference at Purdue, July 14-17, 2014
economizer(HE) that is, again, a small flash tank, shown in Figure 1a. The condenser (CDN), a big refrigerant shell
similar to the evaporator, collects all compressed refrigerant vapor discharged from compressor volute conical
exhauster, shown in both Figure 1a and 1b. Compressor head and flow can be adjusted by controlling water flow
rate and temperature in both evaporator and condenser tubes. At each station indicated in both Figure 1a and 1b,
five or six groups of total temperature, total pressure and static pressure probes are installed around the
circumference. Their acquisitions, together with the refrigerant property definitions, are used to calculate the
compressor performance maps. In this paper only the first stage performances are discussed, since the inlet flow of
late stages are always messed up by the merging flow from economizers, which causes the results to be not typical.
Table1: Experiment matrix
Test ID Unit
Impeller
Gas RPM Test ID Unit
Impeller
Gas RPM Dia. (") Dia. (")
A-R2D34-30
CV
HG
11
00
/CV
HH
15
50
34.25 FLUID-A
3000 C-R2D34-36
CV
HF
13
00
/CV
HH
17
00
34.25 FLUID-A
3600
A-R2D34-27 2700 C-R2D34-33 3300
A-R2D34-23 2300 C-R2D34-30 3000
A-R3D34-30
34.25 R245fa
3000 C-R2D34-27 2700
A-R3D34-27 2700 C-R2D34-23 2300
A-R3D34-23 2300 C-R1D34-36
34 R123
3600
A-R1D34-30
34 R123
3000 C-R1D34-33 3300
A-R1D34-27 2700 C-R1D34-30 3000
A-R1D34-23 2300 C-R1D34-27 2700
A-R1D32-30 32.5 R123 3000 C-R1D34-23 2300
A-R1D29-30 29 R123 3000 C-R1D31-36 31 R123 3600
A-R1D27-31 27 R123 3000 C-R1D28-36 28.25 R123 3600
B-R1D34-36
CV
HF
87
0/C
VH
H1
20
0
34
R123 3600 B-R1D30-30
CV
HF
87
0/C
VH
H1
20
0
30
R123 3000
B-R1D34-33 R123 3300 B-R1D30-27 R123 2700
B-R1D34-30 R123 3000 B-R1D30-23 R123 2300
B-R1D34-27 R123 2700 B-R1D28-36
28.25
R123 3600
B-R1D34-23 R123 2300 B-R1D28-33 R123 3300
B-R4D34-36 34 FLUID-B 3600 B-R1D28-30 R123 3000
B-R1D30-36
30
R123 3600 B-R1D28-27 R123 2700
B-R1D30-33 R123 3300 B-R1D28-23 R123 2300
a) Three-stage centrifugal unit
Page 5
1225, Page 4
International Compressor Engineering Conference at Purdue, July 14-17, 2014
b) Two-stage centrifugal unit
Figure 1: Experimental schematics and setups (Ingersoll Rand, 2008)
3. RESULTS AND DISCUSSIONS
3.1 Effects of isentropic exponent (γ) and Reynolds number
Isentropic exponent (γ) is a gas property and defined as the ratio between specific heat at constant pressure and
that of at constant volume (Dixon, 1998) and ( Brasz 1996) . At inlet condition, typically 38°F for our tests, the
values for isentropic exponent are 1.1028, 1.1047, 1.1004 for R123, R245fa, and FLUID-A respectively. The
difference of the γ value is too small and its effect on the aerodynamics performance is hard to be detected.
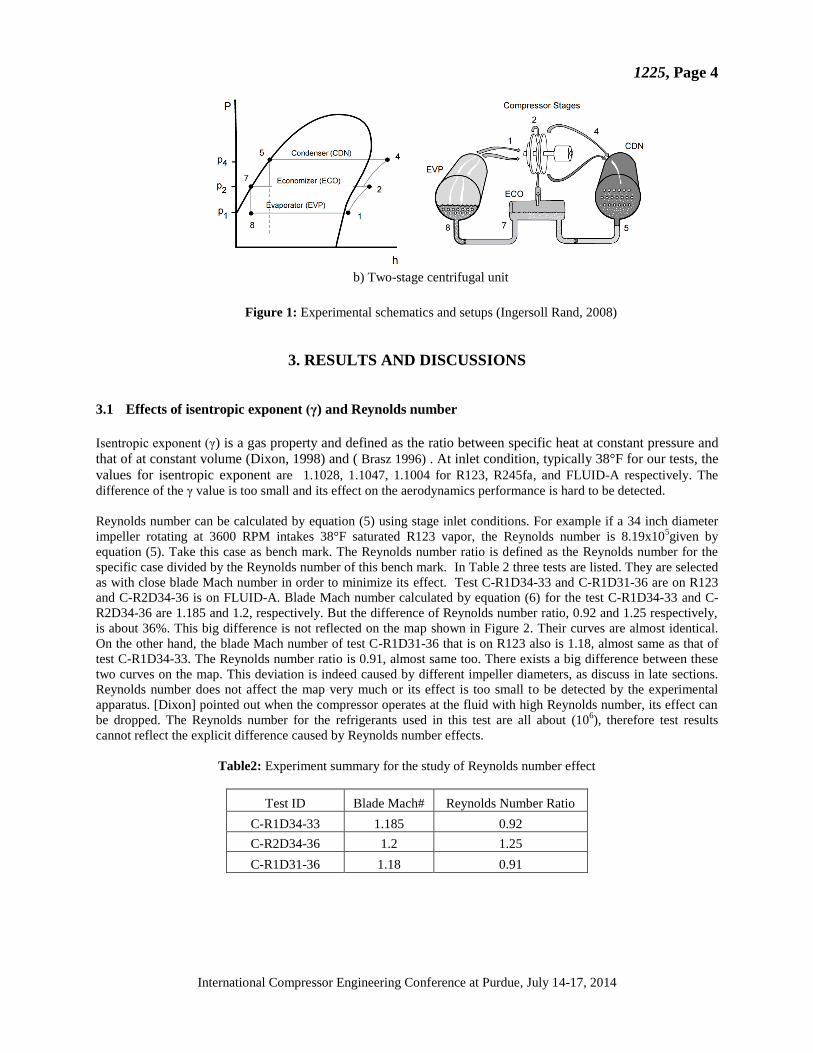
Reynolds number can be calculated by equation (5) using stage inlet conditions. For example if a 34 inch diameter
impeller rotating at 3600 RPM intakes 38°F saturated R123 vapor, the Reynolds number is 8.19x10⁵given by
equation (5). Take this case as bench mark. The Reynolds number ratio is defined as the Reynolds number for the
specific case divided by the Reynolds number of this bench mark. In Table 2 three tests are listed. They are selected
as with close blade Mach number in order to minimize its effect. Test C-R1D34-33 and C-R1D31-36 are on R123
and C-R2D34-36 is on FLUID-A. Blade Mach number calculated by equation (6) for the test C-R1D34-33 and C-
R2D34-36 are 1.185 and 1.2, respectively. But the difference of Reynolds number ratio, 0.92 and 1.25 respectively,
is about 36%. This big difference is not reflected on the map shown in Figure 2. Their curves are almost identical.
On the other hand, the blade Mach number of test C-R1D31-36 that is on R123 also is 1.18, almost same as that of
test C-R1D34-33. The Reynolds number ratio is 0.91, almost same too. There exists a big difference between these
two curves on the map. This deviation is indeed caused by different impeller diameters, as discuss in late sections.
Reynolds number does not affect the map very much or its effect is too small to be detected by the experimental
apparatus. [Dixon] pointed out when the compressor operates at the fluid with high Reynolds number, its effect can
be dropped. The Reynolds number for the refrigerants used in this test are all about (106), therefore test results
cannot reflect the explicit difference caused by Reynolds number effects.
Table2: Experiment summary for the study of Reynolds number effect
Test ID Blade Mach# Reynolds Number Ratio
C-R1D34-33 1.185 0.92
C-R2D34-36 1.2 1.25
C-R1D31-36 1.18 0.91
Page 6
1225, Page 5
International Compressor Engineering Conference at Purdue, July 14-17, 2014
Figure 2: Maps at IGV=90° for the study of Reynolds number effect
3.2 Blade Mach Number Effect
Blade Mach number calculated by equation (6) describes how fast the blade tip linear velocity is. Obviously it
affects the compressor performance map very much. Our tests show that there exists a range of blade Mach number
within which the performance does not have much effect. This range can be as big as 0.2. Figure 3 shows three tests,
C-R2D34-30, C-R1D34-30 and C-R1D34-27, that are done on CVHF1300/CVHH1700 unit and whose summary
can be found in Table 3. The blade Mach number ranges from 0.97 to 1.077, while on the head coefficient-flow
coefficient map, their curves are almost identical.
However shown in Figure 3, the curve for C-R1D28-36 whose blade Mach number, 1.074, is within this range
shifted towards increasing of flow coefficient by about 45%. Moreover the curve is flatter, i.e. less head coefficient
achieved on surge end. This is from the relatively small impeller used in the test. See Table 1 for test parameters. If
the blade Mach number is same, the small impeller must rotate fast and thus to allow more flow passing through it.
The impeller throat areas are same in our tests. Therefore the maximum volumetric flow rate passing through
impellers should be same or independent of the impeller blade diameters at specified shaft RPM. The flow
coefficient defined as volumetric flow rate divided by the cubic power of impeller blade diameter, see equation 4, is
not applied to the situation that involves different impeller size. Figure 3b is same data as those in Figure 3a but
plotted as head coefficient –Q/N (Volumetric flow/RPM), which clearly show the flow capacity for C-R1D28-36 is
close to other tests. Similar situation can also be found in Figure 5a and 5b, same data plotted with respect to
different non-dimensional flow parameters. Figure 5b plotted as Head coefficient- Q/N reflects clearer centrifugal
compressor characteristics than Figure 5a plotted as head coefficient –flow coefficient. In this paper the unit for Q/N
is [CFM/RPM], unless otherwise specified.
If the blade Mach number is high, the head drops fast when the flow increases to near choke limit. Or the choke
characteristic becomes more apparently, see Figure 4 a, b, and d. For Ingersoll-Rand centrifugal compressors choke
usually occurs in impeller throat area where the local gas velocity exceeds the speed of sound. Therefore the
maximum volumetric flow passing through the throat is proportional to the speed of sound. All tested impellers for
each unit are with same blade designs and thus same throat area. This provides designers an effective way to predict
the aero performance of different operating gas based on the current data.
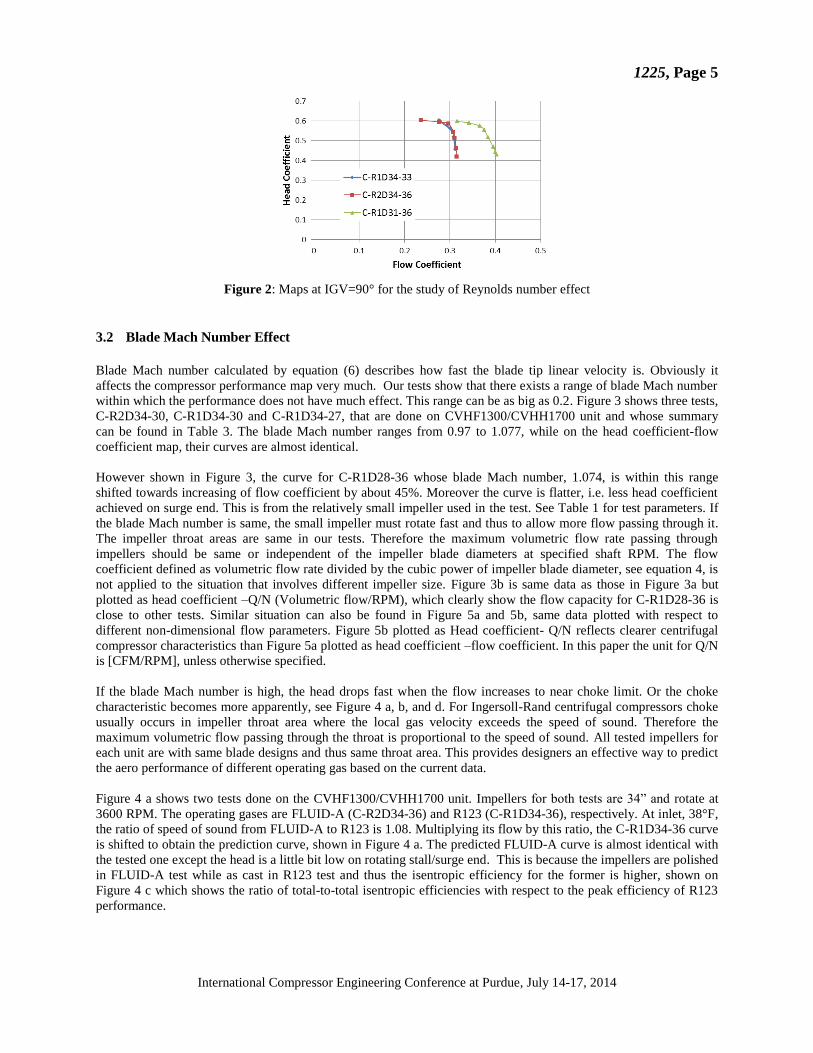
Figure 4 a shows two tests done on the CVHF1300/CVHH1700 unit. Impellers for both tests are 34” and rotate at
3600 RPM. The operating gases are FLUID-A (C-R2D34-36) and R123 (C-R1D34-36), respectively. At inlet, 38°F,
the ratio of speed of sound from FLUID-A to R123 is 1.08. Multiplying its flow by this ratio, the C-R1D34-36 curve
is shifted to obtain the prediction curve, shown in Figure 4 a. The predicted FLUID-A curve is almost identical with
the tested one except the head is a little bit low on rotating stall/surge end. This is because the impellers are polished
in FLUID-A test while as cast in R123 test and thus the isentropic efficiency for the former is higher, shown on
Figure 4 c which shows the ratio of total-to-total isentropic efficiencies with respect to the peak efficiency of R123
performance.
Page 7
1225, Page 6
International Compressor Engineering Conference at Purdue, July 14-17, 2014
Figure 4 b show two tests whose configurations are exactly same as those tests shown in Figure 4 a except the shaft
speeds are 3300 RPM. Multiplying the flow of R123 curve (C-R1D34-33) by the ratio of speed of sound, 1.08, one
gets the FLUID-A prediction curve that is again close to the FLUID-A tested performance (C-R2D34-33).
Table3: Experiment summary for the study of blade Mach number effect
Test ID Blade Mach# Test ID Blade Mach#
C-R2D34-30 1 C-R1D28-36 1.074
C-R1D34-30 1.077 C-R1D34-27 0.97
a) Plotted as head coefficient v.s. flow coefficient b) Plotted as head coefficient v.s. Q/N
Figure 3: Map comparisons at IGV = 90° for blade Mach number effect study
This can be furthered validated by tests done on CVHF870/CVHH1200 unit shown in Figure 4 d. The impellers of
both tests are still 34 inch but different design compared to tests on CVHF1300/CVHH1700. Both tests are in same
shaft speed, 3600RPM. In addition different IGV openings are also considered. The operating gases are FLUID-B
(B-R4D34-36) and R123 (B-R1D34-36). At inlet, 38°F, the ratio of speed of sound from FLUID-B to R123 is 0.957.
The prediction curve on Figure 4 d is obtained via shifting B-R4D34-36 curve by multiplying its flow by the ratio,
0.957. The predicted map is almost identical with the tested R123 performance, even for partially opened IGV.
When its opening is low, the throttle effect of the Inlet Guide Vane becomes more apparent. There exists a big
pressure drop across the IGV. Compressor impeller thus has to intake low pressure gas, which, from stage
perspective, gives rise to a very low or even negative head coefficient. However compressor works properly.
Cambio explained more details to explain this in literature (Cambio, 2000).
a) Prediction at IGV=90° and nominal RPM b) Prediction at IGV=90° and reduced RPM
Page 8
1225, Page 7
International Compressor Engineering Conference at Purdue, July 14-17, 2014
c) Efficiency Map at IGV=90° and nominal RPM d) Prediction at various IGV and nominal RPM
(Note: test was forced to stop because of AFD power
limit )
Figure 4: Performance predition for tests with high blade mach number.
3.3 Impeller Size Effect
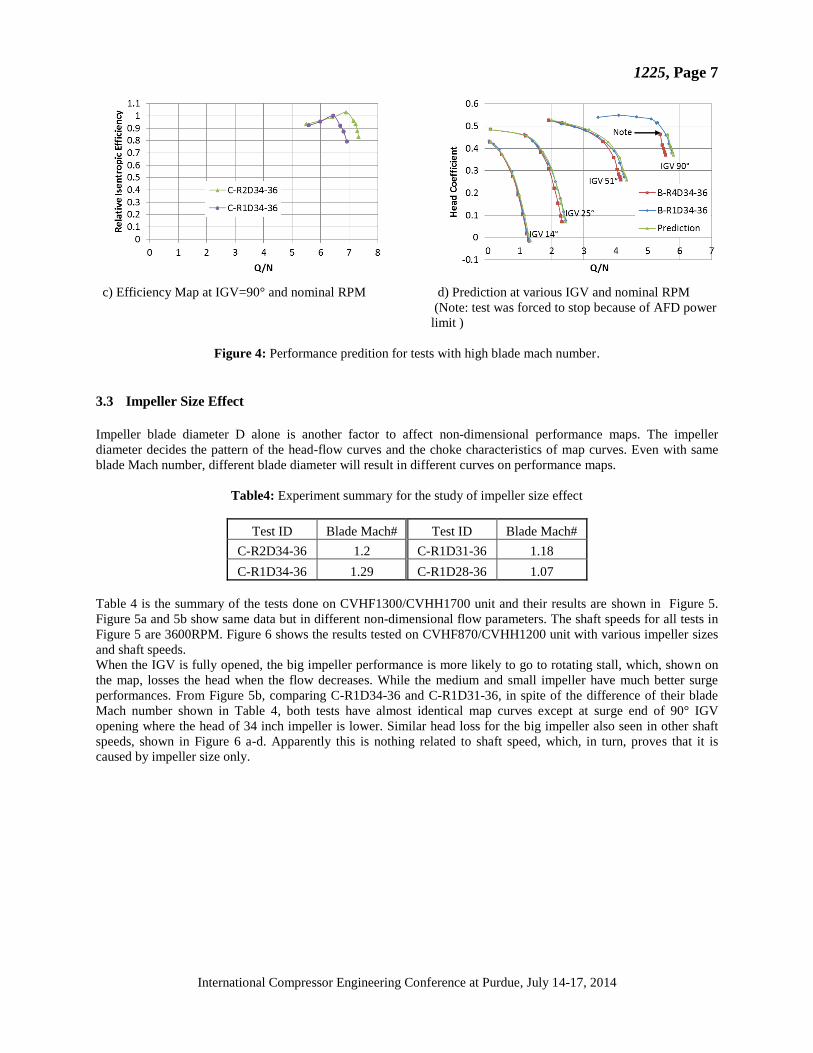
Impeller blade diameter D alone is another factor to affect non-dimensional performance maps. The impeller
diameter decides the pattern of the head-flow curves and the choke characteristics of map curves. Even with same
blade Mach number, different blade diameter will result in different curves on performance maps.
Table4: Experiment summary for the study of impeller size effect
Test ID Blade Mach# Test ID Blade Mach#
C-R2D34-36 1.2 C-R1D31-36 1.18
C-R1D34-36 1.29 C-R1D28-36 1.07
Table 4 is the summary of the tests done on CVHF1300/CVHH1700 unit and their results are shown in Figure 5.
Figure 5a and 5b show same data but in different non-dimensional flow parameters. The shaft speeds for all tests in
Figure 5 are 3600RPM. Figure 6 shows the results tested on CVHF870/CVHH1200 unit with various impeller sizes
and shaft speeds.
When the IGV is fully opened, the big impeller performance is more likely to go to rotating stall, which, shown on
the map, losses the head when the flow decreases. While the medium and small impeller have much better surge
performances. From Figure 5b, comparing C-R1D34-36 and C-R1D31-36, in spite of the difference of their blade
Mach number shown in Table 4, both tests have almost identical map curves except at surge end of 90° IGV
opening where the head of 34 inch impeller is lower. Similar head loss for the big impeller also seen in other shaft
speeds, shown in Figure 6 a-d. Apparently this is nothing related to shaft speed, which, in turn, proves that it is
caused by impeller size only.
Page 9
1225, Page 8
International Compressor Engineering Conference at Purdue, July 14-17, 2014
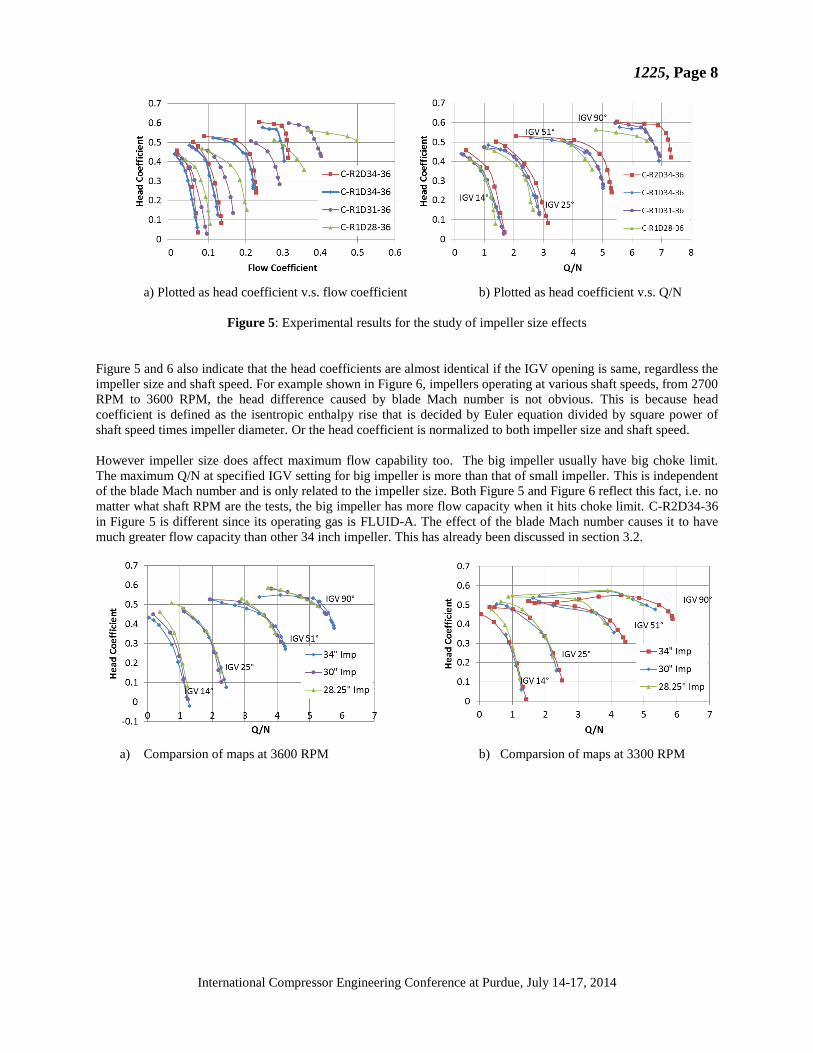
a) Plotted as head coefficient v.s. flow coefficient b) Plotted as head coefficient v.s. Q/N
Figure 5: Experimental results for the study of impeller size effects
Figure 5 and 6 also indicate that the head coefficients are almost identical if the IGV opening is same, regardless the
impeller size and shaft speed. For example shown in Figure 6, impellers operating at various shaft speeds, from 2700
RPM to 3600 RPM, the head difference caused by blade Mach number is not obvious. This is because head
coefficient is defined as the isentropic enthalpy rise that is decided by Euler equation divided by square power of
shaft speed times impeller diameter. Or the head coefficient is normalized to both impeller size and shaft speed.
However impeller size does affect maximum flow capability too. The big impeller usually have big choke limit.
The maximum Q/N at specified IGV setting for big impeller is more than that of small impeller. This is independent
of the blade Mach number and is only related to the impeller size. Both Figure 5 and Figure 6 reflect this fact, i.e. no
matter what shaft RPM are the tests, the big impeller has more flow capacity when it hits choke limit. C-R2D34-36
in Figure 5 is different since its operating gas is FLUID-A. The effect of the blade Mach number causes it to have
much greater flow capacity than other 34 inch impeller. This has already been discussed in section 3.2.
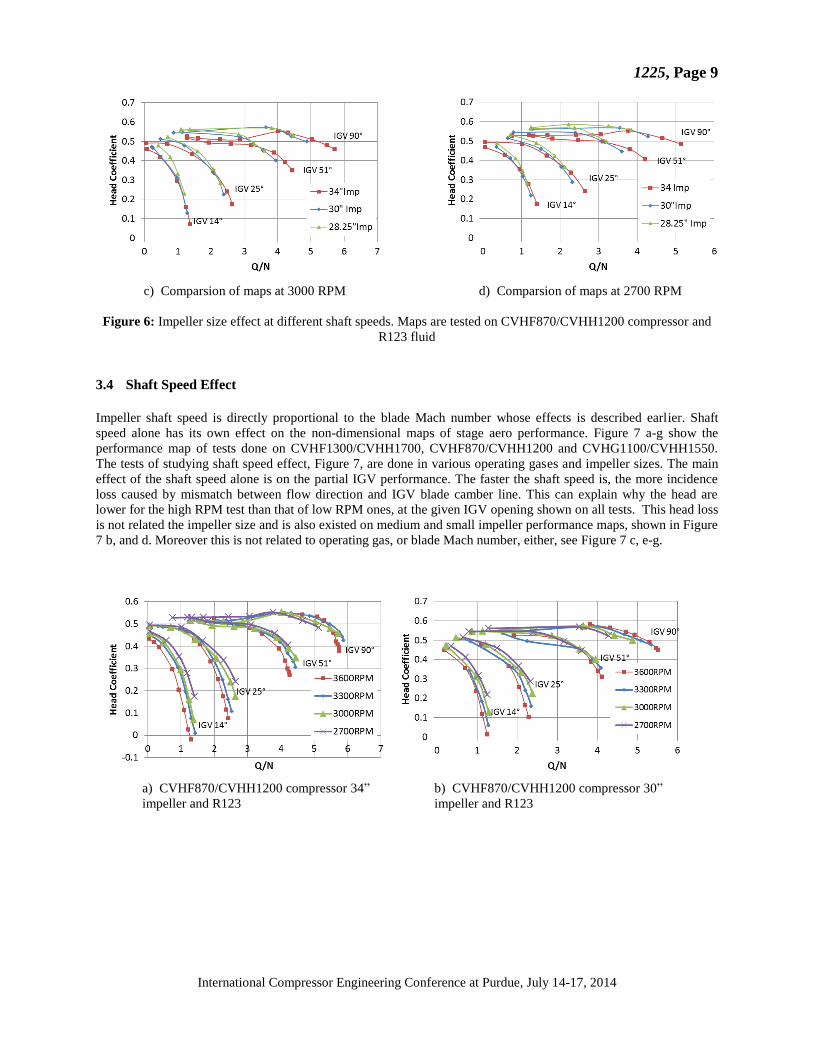
a) Comparsion of maps at 3600 RPM b) Comparsion of maps at 3300 RPM
Page 10
1225, Page 9
International Compressor Engineering Conference at Purdue, July 14-17, 2014
c) Comparsion of maps at 3000 RPM d) Comparsion of maps at 2700 RPM
Figure 6: Impeller size effect at different shaft speeds. Maps are tested on CVHF870/CVHH1200 compressor and
R123 fluid
3.4 Shaft Speed Effect
Impeller shaft speed is directly proportional to the blade Mach number whose effects is described earlier. Shaft
speed alone has its own effect on the non-dimensional maps of stage aero performance. Figure 7 a-g show the
performance map of tests done on CVHF1300/CVHH1700, CVHF870/CVHH1200 and CVHG1100/CVHH1550.
The tests of studying shaft speed effect, Figure 7, are done in various operating gases and impeller sizes. The main
effect of the shaft speed alone is on the partial IGV performance. The faster the shaft speed is, the more incidence
loss caused by mismatch between flow direction and IGV blade camber line. This can explain why the head are
lower for the high RPM test than that of low RPM ones, at the given IGV opening shown on all tests. This head loss
is not related the impeller size and is also existed on medium and small impeller performance maps, shown in Figure
7 b, and d. Moreover this is not related to operating gas, or blade Mach number, either, see Figure 7 c, e-g.
a) CVHF870/CVHH1200 compressor 34”
impeller and R123
b) CVHF870/CVHH1200 compressor 30”
impeller and R123
Page 11
1225, Page 10
International Compressor Engineering Conference at Purdue, July 14-17, 2014
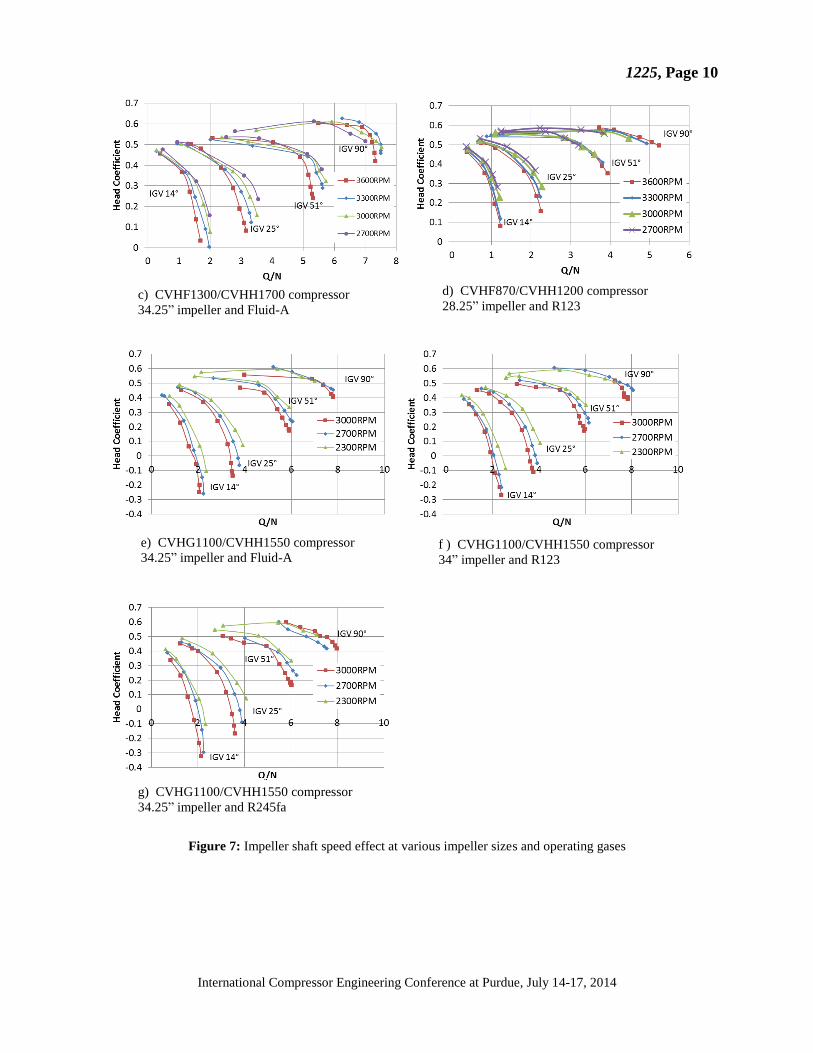
Figure 7: Impeller shaft speed effect at various impeller sizes and operating gases
c) CVHF1300/CVHH1700 compressor
34.25” impeller and Fluid-A
d) CVHF870/CVHH1200 compressor
28.25” impeller and R123
e) CVHG1100/CVHH1550 compressor
34.25” impeller and Fluid-A f ) CVHG1100/CVHH1550 compressor
34” impeller and R123
g) CVHG1100/CVHH1550 compressor
34.25” impeller and R245fa
Page 12
1225, Page 11
International Compressor Engineering Conference at Purdue, July 14-17, 2014
4. CONCLUSIONS
The non-dimensional performance maps for centrifugal compressor stages are affected by many factors such as fluid
properties of operating gas, impeller blade tip Mach numbers, impeller size and shaft speed.
The values of isentropic exponent for low pressure refrigerants, such as R123, R245fa, FLUID-A and FLUID-B are
almost identical and thus do not show much effect on compressor maps. The effect of unit related fluid property,
Reynolds number, is negligible too, since all tested low pressure refrigerant vapors are with high Reynolds number.
Impeller blade Mach number affects performance map. But there exists a value rang within which blade Mach
number shows limited effect on performance maps. In addition blade Mach number also decides stage choke
character. It is possible to predict the performance for unknown operating gas based on the values of speed of sound
when the blade Mach number is high.
Impeller blade diameter alone affects the performance maps too. The size of impeller decides pattern of map curves
and flow capacity. The impeller shaft speed alone shows much effect on partially opened IGV performance maps,
indicated by incident loss on IGV blades.
NOMENCLATURE
a Speed of sound (foot/sec)
D Impeller blade tip diameter (inch)
Mass flow rate (lbm/sec)
Mb Impeller blade Mach number (-)
N Impeller shaft speed (RPM)
Q Volumetric flow rate (foot3/sec)
Re Reynolds number (-)
U Impeller tangential velocity (foot/sec)
V Impeller absolute velocity (foot/sec)
w Euler work (foot2/sec
2)
γ Isentropic exponent (-)
∆h Enthalpy rise (BTU/lbm)
η Isentropic efficiency (-)
µ Gas viscosity (lbm/(foot*sec))
ρ Gas density (lbm/foot3)
φ Flow coefficient (-)
ψ Head coefficient (-)
Subscript
0 Stagnation condition
1 Location of centrifugal compressor stage inlet
2 Location of centrifugal compressor stage exit
s Isentropic condition
θ Tangential direction
REFERENCES
Brasz, Joost, J., Centrifugal Compressor Behavior with Alternate Refrigerants, ASME International Mechanical
Engineering Congress & Exhibition, Atlanta Ga 1996.
Brasz, Joost, Tetu, Lee, Variable-Speed Centrifugal Chiller Control for Variable Primary Flow(VPF) Applications,
Proceedings of International Compressor Engineering Conference, Purdue University, West Lafayette, IN,
USA – July 2008.
Dixon, S.L. Fluid Mechanics , Thermodynamics of Turbomachinery, 4th
Edition Pergamon Press Ltd 1998.
Page 13
1225, Page 12
International Compressor Engineering Conference at Purdue, July 14-17, 2014
Ferguson, T.B., The Centrifugal Compressor Stage. Butterworth & Co. Ltd, 1963
Ingersoll Rand, Installation, Operation, and Maintenance Guide for CVHE, CVHF, CVHG Water-Cooled
CenTraVac™ Chillers, La Crosse Wi, January 2008
Matt Cambio, Performance Analysis of a Two-Stage Refrigeration Centrifugal Compressor with Variable Inlet
Guide Vanes on Both Stage, Proceedings of International Compressor Engineering Conference, Purdue
University, West Lafayette, IN, USA – July 2000.
United Nations Environment Programme (UNEP), The 1987 Montreal Protocol on Substances that Deplete the
Ozone Layer, 1987