First Version: October, 2001 This version: May, 2002 CEO Interviews on CNBC J. Felix Meschke * Arizona State University * Felix Meschke can be reached at Office: 480-965-8074, Fax: 480-965-8539, e-mail: [email protected], mail: ASU, Dept. of Finance, P.O. Box 873906, Tempe, AZ 95287-3906, USA. I thank Brian Adams, Ana Balcarcel, Scott Bauguess, John Cesta, Jeff Coles, Dan Deli, Mike Hertzel, John Griffin, Ying Huang, Swami Kalpathy, Patrick Kelly, Jennifer Juergens, Spencer Martin, Federico Nardari, Tod Perry, Muku Santhanakrishnan, Dirk Schiereck, and seminar participants at Arizona State University for their helpful comments and discussions. Any remaining errors are mine.
Transcript
First Version: October, 2001
This version: May, 2002
CEO Interviews on CNBC
J. Felix Meschke* Arizona State University
* Felix Meschke can be reached at Office: 480-965-8074, Fax: 480-965-8539, e-mail: [email protected], mail: ASU, Dept. of Finance, P.O. Box 873906, Tempe, AZ 95287-3906, USA. I thank Brian Adams, Ana Balcarcel, Scott Bauguess, John Cesta, Jeff Coles, Dan Deli, Mike Hertzel, John Griffin, Ying Huang, Swami Kalpathy, Patrick Kelly, Jennifer Juergens, Spencer Martin, Federico Nardari, Tod Perry, Muku Santhanakrishnan, Dirk Schiereck, and seminar participants at Arizona State University for their helpful comments and discussions. Any remaining errors are mine.
CEO Interviews on CNBC Abstract This paper examines price and volume reactions to CEO interviews broadcast on CNBC between 1999 and 2001. Since interviews per se are nonevents, an analysis of the market response can be viewed as a simple test of the conjecture that enthusiastic public attention alone may move stock prices away from fundamentals. I document a significant mean price increase of 1.65 percent accompanied by higher trading volume on the day of the interview. Prices exhibit strong mean reversion of minus 2.78 percent during the 10 trading days following the interview. These price dynamics suggest that the financial news media is able to generate transitory buying pressure by catching the attention of enthusiastic investors. Keywords: CEO interviews; Financial news media; Investor behavior. JEL classification: G14; G12.
1
In a recent study, Huberman and Regev (2001) analyze the puzzling case of a New York
Times article (Kolatka, 1998) that caused a dramatic rise in the stock price of the small
biotechnology company EntreMed, although the article did not contain any new information. The
authors define incidents like this, which appear to be news events where in fact no new
information is released, as “nonevents”. They attribute the astounding market reaction to the fact
that the article appeared in the upper left corner of the front page, accompanied by the label “A
special report” and suggest that enthusiastic public attention may move stock prices in the
absence of new information.
This paper investigates whether media attention systematically impacts stock prices by
analyzing CEO interviews on CNBC. On average, these CEO interviews should not contain new
information for several reasons. First, those interviews are usually triggered by some preceding
event. For example, 25% of the interviews in our sample appear on the day of a company’s
earnings announcement or on the following day and can be understood as CEOs’ comment or
clarification of news that are already presented. Second, CEO interviews have to be scheduled
prior to broadcast and are announced on CNBC’s website one day prior to the interview. It is
likely that at least some market participants learn of the interview and even of the topics
discussed ahead of time. Finally, CEOs have a vital interest in appearing optimistic and putting a
positive spin on every question they face due to their career concerns and often substantial stock
and option holdings in their own company1. Not surprisingly, leading academics discredit the
information content of such interviews2. CEO interviews on CNBC are therefore viewed as
nonevents in the sense of Huberman and Regev (2001)3.
Rashes (2001) presents an example of investor confusion between the well-known stock
MCI Communications (MCIC) and the lesser-known Massmutual Corporate Investors (MCI). He
demonstrates that ticker confusion leads to an unusual amount of co-movement between the
stocks of these companies and argues that a large proportion of MCI transaction is due to
2
approximately one percent of the trades that small investors intend to make in MCIC but
erroneously enter as trades for MCI. He states: “If this trivial group of noise traders can
persistently impact the price of MCI, one could only imagine what would occur if a group of
correlated noise traders experienced a change in sentiment regarding a group of stocks” (Rashes,
2001, p.1924).
This study examines the price impact of a group of correlated noise traders who watch
CNBC, the financial cable network that is prominently blamed for fueling the “Wall Street Hype
Machine.4 5” CNBC claims that due to Internet and cable television the informational advantage
of professional traders has disappeared, that its viewers get information as fast as the pros and
urges its viewers to “profit from it.6” If CNBC viewers believe that they can make money by
trading on news, then these viewers must react very quickly because in efficient markets
information is quickly incorporated into stock prices. Busse and Green (in press) find that
CNBC’s audience indeed responds within seconds to analyst’s stock recommendation on
CNBC’s Morning Call and Midday Call segments. The necessity to react immediately in order to
profit from a news release does not leave time to analyze and validate the information, which the
following incident of June 30, 2000 exemplifies:
A mistake Friday on financial-news cable channel CNBC ran up shares of MACC Private Equities MACC almost 80%. The ticker of the private investment firm was mistakenly displayed in place of the ticker for chipmaker Applied Micro Circuits, AMCC which had received an analyst upgrade. Shares of MACC Private Equities closed 6% higher at 9 13/16, on more than 300% of its normal volume, or 336,000 shares. Shares at one point traded at 17 1/2, about 50% higher than its previous 52-week high. Applied Micro Circuits rose 2% to 98 3/4 (Anderson, 2000).
The initial assumptions of this study are that CEO interviews are on average nonevents exclusive
to CNBC, and that a significant fraction of CNBC’s audience believes in making money by
trading on news. The market response to these interviews can therefore be viewed as a direct test
the conjecture that enthusiastic public attention alone may move stock prices away from
3
fundamentals, thereby shedding more light on the price impact of the financial news media
[Merton (1987); Shiller (2000); Huberman and Regev (2001)].
Specifically, this study considers four hypotheses. The null hypothesis assumes that
financial markets do not react to CEO interviews because these interviews do not reveal new
information. Merton’s (1987) investor recognition hypothesis suggests that CEO interviews,
even without revealing new information, may impact firms’ investor base, thereby permanently
affecting stock prices: “a newspaper or other mass media story about the firm or its industry that
reaches a large number of investors who are not currently shareholders, could induce some of
this number to incur the set-up costs and follow the firm. Having done so, in our model, these
investors would evaluate the detailed substantive information about the firm, become new
shareholders, and the value of the firm would rise. It should be stressed that the current
shareholders may already know all the information contained in such stories” (Merton, 1987, p.
500). The price pressure hypothesis states that enthusiastic public attention creates temporary
price pressure in response to the interview. Merton (1987, p. 503) notes that “media coverage,
public relations and other investor marketing activities could play an important causal role in
creating and sustaining speculative bubbles and fads among investors.” Similar, Shiller (2000, p.
29) argues that “enhanced business reporting leads to increased demand for stocks, just as
advertisements for a consumer product make people more familiar with the product, remind them
of the option to buy, and ultimately motivate them to buy.” Finally, the information hypothesis
also predicts a permanent change in stock prices, but instead of attributing the price impact to an
increase in investor base, it relaxes the notion of CEO interviews being nonevents on average
and assumes that CEOs reveal new information7. Hence, this study investigates whether prices
change at all (null hypothesis), and if they do change, whether the price changes are transitory
(due to price pressure) or permanent (due to an increased shareholder base or because CEOs
disclose new information) 8.
4
My results can be summarized as follows. First, I find a significant abnormal return of
1.86 percent and higher trading volume over the two days prior to the interview. Market
participants seem to react either to a confounding event that triggers the interview, or
information about the CEO interview itself is incorporated within this time period. Second, I
document a significant mean abnormal return of 1.65 percent and a 169 percent increase in mean
abnormal turnover on the day of the interview. Third, prices exhibit strong mean reversion of
negative 2.78 percent over the 10 trading days following the interview. Fourth, a simple measure
of the “limelight effect” suggests that almost all of the price increase during the two days prior to
the interview and on the day of the interview itself is in fact due to media attention. I discuss
whether rational traders who expect an option-like payoff from a small subsample of CEO
interviews or asymmetric information can explain these findings. However, the empirical
evidence and the fact that I cannot find support for alternative explanations leads me to conclude
that on average, the appearance of CEOs on CNBC creates transitory buying pressure by
enthusiastic investors. This conclusion is in line with Huberman and Regev’s (2001) conjecture
that enthusiastic public attention can move stock prices away from the fundamentals. But in
contrast to their case study, I find that the price impact of CEO interviews is only transitory and
prices quickly mean revert. Because a strategy that tries to take advantage of this transitory price
pressure involves on average short sells, it may take some time for market participants to verify
that the observed stock increase is just due to media hype and not to new information. This may
explain why we observe mean reversion from the day following the interview.
The findings are also are consistent with several studies reporting short-term overreaction
in the initial price response to analyst recommendations that are subsequently followed by price
reversals. Stickel (1985) documents positive abnormal returns for two days after the publication
of the Value Line rankings followed by a reversal on day three. Barber and Loeffler (1993) and
Liang (1999) report a similar pattern for stock picks in the Wall Street Journal’s “Dartboard”
5
column. Busse and Green (in press) use intra-daily data to examine the market reaction to
analyst’s stock recommendation on CNBC’s Morning Call and Midday Call segments. They find
that prices respond within seconds of the initial mention, with positive reports fully incorporated
within one minute. This one-minute response (41 basis points during Midday Call and 6.8 basis
points during Morning Call) is then followed by a small reversal during the next three minutes.
The remainder of the paper proceeds as follows. Section 2 describes the CEO interview
data and provides summary statistics. Section 3 examines the price dynamics and trading activity
around CEO interviews and presents the main empirical findings. Section 4 investigates the
robustness of the results by analyzing various subsamples, decomposing the price dynamics into
effects due to information and media attention, and discussing alternative explanations of the
findings. Section 5 summarizes and discusses some important implications of the results. Details
about sample selection procedure and event study methodology are included in the Appendix.
I. Sample Description
A. Sample Selection
Since its creation on April 17, 1989, CNBC has become the world’s most popular
business television channel. 77 million households in the U.S. and Canada (160 million
households worldwide) can watch it. Viewership during trading days approaches 500,000
households (Nielsen Media Research). CNBC’s regular programming features several interviews
with CEOs of publicly traded companies during the day. After extracting this interview data
from CNBC’s website and merging the interview sample with the stock database of the Center
for Research in Security Prices (CRSP), and the Standard & Poor’s COMPUSTAT database, I
obtain a final sample of 3641 interviews from CEOs of 1491 different companies. A detailed
description of the selection process is provided in Appendix A.
6
The sample period consists of the years 1999 through 2001. Figure 1 shows that during
this period the NASDAQ Composite Index experienced substantial volatility: The index rose
from 2207.54 on January 4, 1999 to its all-time high of 5132.52 on March 10, 2000.
Subsequently, it decreased by over 50 percent. On the other hand, the New York Stock Exchange
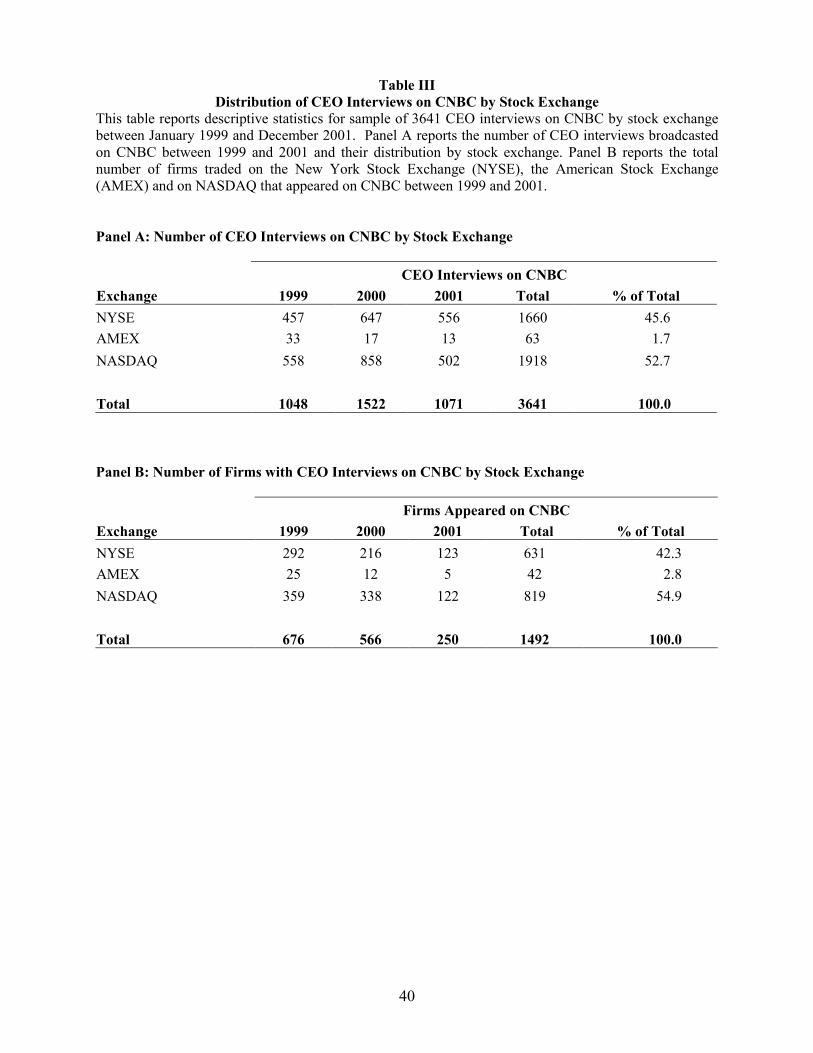
(NYSE) Index remained relatively stable over the sample period. As reported in Table III, 52
percent of the interviews deal with firms traded on NASDAQ while 46 percent of the interviews
concern firms traded on the NYSE; this sample period therefore provides an interesting setting to
examine the price impact of CEO appearances on CNBC9.
Although transcripts and videotapes are available for many of the interviews in the
sample, a content analysis of these interviews would be a very challenging task. The language
used in the interviews is very casual, which makes the categorization by keywords highly
unreliable. Additionally, viewers might trade on nonverbal signals like the posture of the CEO
interviewed. Finally, the character of many interviews is primarily evaluative and predictive,
which would require a highly subjective scaling of those qualitative predictions. For all these
reasons, I do not attempt to analyze the content of the interviews. However, 104 merger-related
interviews and 898 earnings-related interviews are identified because they occur within one
trading day to the merger or earnings announcement, respectively.
B. Timing of CEO Interviews
Table I contains summary statistics for the 3641 CEO Interviews on CNBC along the
time dimension. Panel A reports the monthly distribution of CEO interviews throughout the
sample period between January 1999 and December 2001. It shows that in 2000, CNBC aired 50
percent more CEO interviews then in 1999 or 2001. A strong monthly patter, however, is not
apparent. Panel B shows that the number of CEO interviews is lowest on Mondays and Fridays
and highest on Wednesdays.
7
Panel C shows the distribution of interviews across CNBC’s daily broadcasting schedule.
Today's Business reports on overnight developments and major business stories abroad and
previews key issues which could potentially move the market. Squawk Box is designed as a “pre-
game” jump on the business day with live reports from major investment banks and the floor of
the New York Stock Exchange. It contains the segment “CEO Call” where host Mark Haines
interviews CEOs prior to market opening. Market Watch reports economic and corporate news
during the morning. Segments include “Global Market Watch”, “Stocks to Watch”, Morning
Call”, Winners & Losers” and “The Market Watcher”. 33.5 percent of the CEO interviews take
place during Power Lunch, which is hosted by Bill Griffeth and produced by Joel Franklin.
Market Wrap analyzes the day’s business news, reports extended hours updates and includes in-
studio interviews. Business Center is CNBC’s signature evening business newscast that reviews
the day’s top business and financial market headlines. CEO interviews take place as part of the
segment “CEO Spotlight”. The hosts and producers of these shows are likely to have quite an
impact on the amount and quality of information that is disseminated during CEO interviews as
well as the timing of the interviews.
While the timing of CEO interviews is in part determined by CNBC’s broadcasting
schedule, the distribution of these interviews seems to correspond also to the overall flow of
public information. Mitchell and Mulherin (1994) and Berry and Howe (1994) find that the flow
of financial news seems to be higher on Tuesdays, Wednesdays, and Thursdays, and the
distribution of CEO appearances on CNBC across weekdays reflects this pattern10. Berry and
Howe (1994) also report the average number of information observations by time of day. They
find a significant increase of stories 90 minutes prior to market opening, even more stories
during the morning trading hours and a decrease during lunchtime. Most of the daily news
arrives during the first 90 minutes after the market has closed. Consistent with their findings,
Figure 2 shows a large number of interviews just prior to market opening at 9:30 a.m. and during
8
the 90 minutes following market closing. However, 34 percent of the CEO interviews air during
lunchtime. CNBC might choose to interview most of the CEOs during lunchtime because CEOs
may be more available, viewership is higher and less new information is arriving.
In summary, while the intra-daily distribution of interviews seems to be driven by
CNBC’s broadcasting schedule, the distribution of interviews across weekdays reflects the
overall number of financial news stories as documented in earlier studies.
C. Popular Firms and Industries
Table II reports descriptive statistics for the sample of 1491 firms whose CEO appeared
on CNBC between January 1999 and December 2001. Panel A describes the frequency
distribution of CEO interviews for the sample firms. The average (median) number of interview
is 2.44 (1); the distribution is clearly skewed to the right. Panel B examines the right tail of the
distribution by listing the 15 companies whose CEO appeared most often on CNBC during the
sample period. If two different CEOs represented the same company during the time period, the
table reports both names. Panel B shows that James Morgan (Applied Materials), Philip Condit
(Boing), Jeff Bezos (Amazon.com) and other popular CEOs appeared on CNBC regularly and
that Nasdaq and computer stocks (SIC Code 737) are particularly popular.
Panel C describes the frequency distribution of CEO interviews by three-digit Standard
Industry Classification (SIC) Code. The mean (median) number of interviews per industry is
17.2 (4), but this distribution too is skewed to the right. Panel D therefore lists the top 10
industries by number of CEO interviews during the sample period. The 726 interviews with
firms from the “Computer Programming and Data Processing Industry” (SIC Code 737) account
for approximately 20 percent of total interviews. Panel E shows the distribution of CEO
interviews by size and book-to-market ratio. Each observation is ranked into deciles by its
9
market capitalization six trading days prior to the interview, and its recent book-to-market ratio,
provided that the last fiscal year has been completed for at least 4 months11. In Table V, the
lowest three deciles (1-3) are labeled ‘Small Cap’, while the largest three deciles (8-10) are
labeled ‘Large Cap’. The four deciles in between are labeled “Mid Cap’. 57 percent of the
interviews are from ‘Large Cap’ companies, while almost 40 percent of interviews are with firms
that rank in the lowest book-to-market decile.
D. Stock Exchanges, Merger & Acquisition and Earnings Announcements
Table III shows that CNBC interviewed more Nasdaq than NYSE firms during 1999 and
2000. In 2001, however, as many NYSE firms as Nasdaq firms were interviewed. For all stock
exchanges, the total number of firms interviewed declined over the sample period, thereby
increasing the average appearance per firm from 1.55 in 1999 to 4.28 in 2001.
In order to determine which interviews are related to companies’ earnings
announcements, the number of trading days is calculated between each interview and the closest
earnings announcement as recorded in the I/B/E/S Actual dataset. 898 interviews are aired within
a day of the earnings announcement. Merger-related interviews are classified analogously. 104
interviews are broadcasted within one trading day of a merger or acquisition announcement as
recorded on the Securities Data Corpopration’s (SDC) Merger and Acquisition database.
II. Price Dynamics and Trading Activity around CEO Interviews
A. Price Dynamics
In order to assess the impact of CEO interviews on security prices of sample firms, this
study employs standard event study methodology. During the estimation period of an event
study, the expected (normal) returns of the sample securities are estimated. These estimated
10
returns are then compared to actual returns in the event period surrounding the firm’s CEO
appearance on CNBC.
Results are based on the market model, which relates the return of any given stock i to the
return of the market portfolio. However, because every day CNBC broadcasts several interviews,
and a given company’s CEO can appear several times on CNBC, an event consists of a unique
date-firm combination. Therefore, the index i does not just refer to a particular firm, but to a
particular firm at a particular date where the firm’s CEO appears on CNBC. The term ‘event’ is
used in this sense.
Hence, for any stock at a given interview date i,
,itmtiiit RR εβα ++= (1)
where Rit and Rmt are the period-t returns on stock at a given interview date and the market
portfolio, respectively, and εit is the stochastic error term for event i on day t. This methodology
treats the stock return of sample firm i, Rit, as conditional on the market’s overall performance
and controls for systematic risk via the estimate of βi for each security.
For each event i, prediction errors, PEit, are calculated for each day in the event period,
).ˆˆ( mtiiitit RRPE βα +−= (2)
The prediction errors are estimates of the abnormal returns to the stockholders of the
sample firms for each of the 61 days centered around the day of the interview. Average
prediction errors, APEt, across all observations (N) are calculated for each day in the event
period. These averages are cumulated, CAPEk, to provide a series of cumulative average
prediction errors in the event period,
∑=
=N
iitt PE
NAPE
1,1
(3)
11
∑−=
=k
ttk APECAPE
20. (4)
A more detailed discussion of this event study methodology is provided in Appendix B.
Average prediction errors for intervals around the CEO interviews are presented in Table
IV. CEO interviews on CNBC tend to be preceded by positive prediction errors, especially
during the two days prior to the interview day. After the interview prediction errors become
negative. Using the CRSP value-weighted index as proxy for the market portfolio, the
cumulative average abnormal return prior to CEO interviews is 1.86 for the window [-2, -1] and
1.65 percent for the event day [0]. In contrast, the cumulative average abnormal return for the
window [+1, +10] is negative 2.78 percent. t-statistics are calculated using several different
methods, which are also described in Appendix B. However, the results are robust to different
adjustments.
B. Trading Activity
Price change, as Beaver (1968) points out, reflects the average change in traders’ beliefs
due to an announcement, whereas trading volume reflects the sum of the differences in traders’
reactions to this announcement. The stock price evidence described in the previous section
suggests that traders revise their beliefs in response to the interview on CNBC. Trading volume
captures differential belief revisions among traders. When all traders’ belief revisions are the
same, the price movement is parallel and there is no volume reaction12. Also, Barber and Odean
(2002) use abnormally high volume to proxy for investor attention.
Growth in volume around some CEO appearances could be the result of an increase in
the number of shares outstanding. One way to disentangle the effect of growth in outstanding
shares from higher volume due to differential belief revision is to compute share turnover, the
ratio of daily volume to the number of shares outstanding (Miller, 1977) 13.
12
Define average turnover ∑−
−==
6
106,
1001
titi TAT (5)
as the sum of share-weighted turnover during the estimation period (day – 106 through day – 6).
Daily excess turnover, DETik, is defined as the difference between average turnover and daily
turnover for every day k of the event period. Average daily excess turnover, ADETk equals the
sum of daily excess turnover across observations:
,iikik ATTDET −= (6)
∑=
=N
iikk DETADET
1. (7)
Figure 3 shows that the average (median) daily excess turnover around CEO interviews on
CNBC increases from 16 (-11) percent two days prior to interviews to 56 (0) percent one day
prior. Average (median) daily excess turnover increases by 169 (59) percent on the day of the
CEO appearance and 65 (12) percent one day after the interview.
The increase in trading volume prior to the time when CNBC publishes its broadcasting
schedule accompanies a positive abnormal return of 1.86% for the two days preceding the
interview. This run-up could be due to the fact that many interviews are in fact a reaction to
confounding events that precedes the interview, such as earnings announcements. In that case,
increased trading volume and price run-up are not caused by the CEO interview. On the other
hand, market participants may learn about upcoming CEO interviews before CNBC releases this
information and trade on this news. Further analysis needs to be done to distinguish between
these two possibilities.
. On aggregate, the appearance of CEOs on CNBC seems to capture the attention of
CNBC’s audience. The documented price dynamics are consistent with transitory buying
pressure due to increased media attention.
13
III. Robustness
This section investigates whether the findings presented in the previous section are robust
across subsamples and proposes a simple decomposition of the observed price dynamics into an
information effect due to information release and a limelight effect due to media attention. It also
discusses whether rational traders who expect an option-like payoff from the announcement of
CEO appearances on CNBC could drive the documented price dynamics. Finally, the price
dynamics surrounding CEO interviews are related to characteristics commonly associated with
asymmetric information.
A. Significance and Robustness of the Results
Every event study has to make distributional assumptions about abnormal returns in order
to test whether these returns are significantly different from zero. If these assumptions are not
met in applied work, tests of significance may be misspecified and potentially reject the null-
hypothesis of zero abnormal return too often. The test-statistic that appears least likely to be
misspecified in the context of this study is due to Boehmer, Musumeci, and Poulsen (1991) and
corrects for serial correlations, event clustering, and event-induced heteroskedasticity. However,
this study verifies that the choice of different tests of significance does not alter the reported
findings. The specifics of the different tests employed are discussed in Appendix B, the results
are documented in Table IV.
To further investigate whether a particular group of stocks drives these results, event
studies are conducted for several subsamples. Summary results of these studies are reported in
Table V and document that the described pattern of positive abnormal returns prior to the
interview and negative abnormal returns afterwards prevails throughout all subsamples except
NYSE firms in 2000. The magnitude of these price dynamics is larger for Nasdaq firms then for
NYSE firms and also larger for small cap stocks then for large cap stocks. The pattern also
14
prevails for CEO interviews that are confounded by an earnings- or M&A-announcement within
one trading day of the interview. The results hold when using the value-weighted CRSP index or
the equal-weighted CRSP index as proxies for the market. In conclusion, the documented price
dynamics are robust to the choice of test-statistics and prevail throughout almost all subsamples.
B. Decomposition of Information Effect and Limelight Effect
This subsection further discusses the initial assumption of CEO interviews being
nonevents on average. Suppose instead that CEOs on average reveal information. As soon as the
market learns about an upcoming CEO interview, traders gather additional information and
update their believes about potential news being announced in the near future. While individual
CEOs may either exceed or do not meet market expectations once they actually appear on
television, the market’s expectations should be correct on average, because systematic over- or
underreaction results in a profitable investment opportunity. According to the information
hypothesis, prices should not exhibit drift on average after the new information has been
incorporated into prices.
Under this premise, it is possible to decompose the price dynamics into an information
effect due to information release and a limelight effect due to media attention. Results in Table
IV suggest that the market reaction during the two days prior to the CEO interview and on the
interview date itself captures the total effect of both the price dynamics due to information
release and due to media attention. The information effect measures the degree of permanence in
the market reaction to CEO interviews. The limelight effect measures the degree to which price
dynamics are transient and is calculated as follows:
( )1
12
1
1
2 1
1
effect Limelight r
rr
rrr +−=
+
−= (8)
15
where 1r is the abnormal return due to the total effect, 1
1
1 rr+
is the return necessary to
completely undo the total effect, and 2r is the actual price dynamic following the interview. The
negative sign accounts for the fact that the total effect and the actual price dynamic following the
interview usually have opposite signs. A limelight measure of 1 signifies a nonevent because is
suggests that the price dynamics are completely transitory and hence no information were
revealed. In contrast, a limelight measure close to zero suggests a permanent price change due to
the information content of an announcement. This approach is potentially biased against
identifying all price dynamics due to media attention if the news media has in fact a permanent
price impact, as documented by Huberman and Regev (2001).
Table V reports the limelight measure for the complete sample and various subsamples.
As a proxy for the total effect, 1r , the cumulative abnormal return over the 2 days prior to the
interview and on the interview date itself, CAR[-2,0] is used. The abnormal cumulative return
during the following 10 trading days, CAR[+1,+10], proxies for 2r , the price dynamics due to
media attention. For the whole sample, the limelight measure suggests that 82 (98) percent of the
initial price response is due to media attention, when the value-weighted (equally-weighted)
CRSP index is used to proxy for the market portfolio. The limelight effect is stronger for large
cap companies then for mid cap and small cap companies. The subsamples by weekday reveal
that although both the abnormal return on the interview day and the number of CEO interviews
are highest on Wednesdays, the limelight effect is actually weaker compared to the beginning
and the end of the week. This finding suggests that the informativeness of CEO interviews
increases slightly during the week, which may be due to the fact that the overall flow of
information increases as well (Mitchell and Mulherin, 1994 and Berry and Howe, 1994). While
only NYSE stocks in 2000 do not exhibit a limelight effect, Nasdaq stocks in 2000 and large cap
16
stocks actually have a limelight measure that is greater than one, signifying a reversal stronger
than the initial increase.
Even under the restrictive assumption that the entire price impact of increased media
attention disappears within 10 trading days following the CEO interviews, results based on the
limelight measure suggests that, on average, CEO interviews come pretty close to being
nonevents. However, a small fraction of the observed price dynamics may be due to information
disclosure. The next subsection examines whether information content of interviews can help
explaining the documented pattern.
D. Information Content of CEO Interviews
Assume that most CEO interviews are nonevents, but that a certain percentage of
interviews contain information that permanently increases stock prices by a large magnitude. If
traders cannot assess which interviews will cause a large price increases until they analyze the
actual interview, it may be rational to buy the stock of every firm whose CEO is expected to
appear on CNBC in order to capture the option-like payoff of a few high-magnitude price
increases. The increased demand would drive up prices prior to the interview. Because most
interviews do not contain information, most stocks would exhibit a price reversal as the option
expires valueless.
To examine the validity of such reasoning, all interviews are sorted into bins based on
whether they exhibit positive or negative abnormal returns prior to the event [-2,-1], on the event
date [0], and over the following ten trading days [+1,+10]. Table VI reveals that for 461
interviews, abnormal returns are indeed positive over the entire period [-2,+10]. For these
interviews, the average (median) abnormal return over the ten days following the interview is
8.07 (5.49) percent. However, Table VI also indicates that even after conditioning on pre-event
and event abnormal returns, more interviews exhibit price reversals then price continuation and
17
that the average and median magnitude of the negative abnormal return is larger than the average
and median magnitude of the positive abnormal return. These results suggest that the observed
price dynamics cannot be explained by rational traders anticipating an option-like payoff from a
subsample of CEO interviews.
E. Asymmetric Information
If the price dynamics surrounding CEO interviews on CNBC are driven by information
disclosure, one might expect that firms that choose CNBC as a venue for voluntary disclosure
share some cross-sectional characteristics commonly associated with a larger degree of
informational asymmetry between management and market participants.
To investigate this possibility, this section reports results from a simple OLS regression
of the two 2-day cumulative abnormal returns surrounding the interview, CAR[-2,-1] and
CAR[+,1+2], as well as the abnormal return on the interview day, AR[0], to examine whether
companies with high asymmetric information drive the results. All abnormal returns are
estimated using the CRSP value weighted index as a proxy for the market model. The
independent variables are the following. LN_AGE is the natural logarithm of 1 plus the number
of years the firm is listed on the CRSP files. LN_SIZE is the natural logarithm of the market
capitalization 6 trading days prior to the interview. TURNOVER is the average turnover over
100 trading days 6 trading days prior to the interview. RESEARCH and ADVERTISING are
research and advertising expenditures scaled by sales, respectively. BTM is the book-to-market
ratio. FORBES is a dummy variable equal to 1 if the firm is part of the Forbes 500 list14.
EARNINGS and MERGER are dummy variables equal to one if the interview is earnings- or
merger and acquisition-related, respectively. NASDAQ is a dummy variable equal to one if the
firm is trading on Nasdaq. NEGBTM is a dummy variable equal to one if the firm has negative
book value. ADR is a dummy variable equal to one if a foreign firm’s American Depository
18
Receipts or American Depository Shares are traded on an American exchange. The regression
controls for the six industry groups that had the largest number of interviews during the sample
period. Because the White-Heteroskedasticity Test rejects the null hypothesis of
homoskedasticity, t-statistics are computed with heteroskedasticity consistent standard errors.
Table VII reports the results of the three regressions. The Adjusted R2 are very low and
most coefficients commonly associated with higher asymmetric information are insignificant.
Overall, these preliminary results are in line with the notion that the price and turnover dynamics
observed are due to an increase in attention rather than to CEOs appearing on television to
reduce asymmetric information.
IV. Summary and Conclusion
While financial markets seem to underreact to corporate events, one can observe large
stock price movements without any apparent news. Since Shiller’s (1981) classic account of a
mismatch between news and stock price movements, the apparent “excess volatility” in asset
prices has been attributed to noise trading, suggesting that investors may overreact to unobserved
stimuli. Although the financial news media has long been suspected of stimulating noise traders,
accounts that document media hype by relating the financial news media to excess volatility,
have been rare and mostly anecdotal.
To analyze the role of the media on the price formation of stock prices, this paper takes a
closer look at how the market reacts to CEO appearances on CNBC, which are taken as
nonevents that do not contain new information. Consistent with price pressure, this study
documents a significant mean price increase of 1.65 percent and higher trading volume on the
day of the interview. Prices exhibit strong mean reversion of negative 2.78 percent over the 10
trading days following the interview. These findings suggest that the increased attention due to
CEO interviews creates transitory buying pressure by enthusiastic investors. These results
19
support the conjecture that enthusiastic public attention may move stock prices away from
fundamentals and are consistent with the popular notion of media hype. But in contrast to
Huberman and Regev’s (2001) case study, the price impact of CEO interviews is only transitory
and prices quickly mean revert. Because a strategy that tries to take advantage of this transitory
price pressure involves on average short sells, it may take some time for market participants to
verify that the observed stock increase is just due to media hype and not to new information. This
may explain why we observe mean reversion from the following day on.
A great part of CNBC’s success is probably due to the fact that viewers consider it to be
an important source for breaking news. CNBC claims that viewers get the latest financial news
as they occur, that CNBC has leveled the playing field between individual and institutional
investors by even-handedly providing real-time information to its viewers. However, the
documented price dynamics around CEO interviews are consistent with the notion that, on
average, these interviews do not contain any new information. In addition, the substantial price
and volume dynamics prior to these interviews may indicate that even if CEOs would be willing
to disclose new information live to the public, CNBC is actually unable to prevent information
leakage prior to CEO appearances on television. Further analysis is required to reliably attribute
the price dynamics prior to CEO interviews to either a confounding event or to information
leakage, but investors may be cautioned by these findings when considering whether to trade on
supposedly breaking news.
Recent behavioral asset pricing models assume that individuals underreact to public news
and overreact to private information [i.e., Daniel, Hirshleifer, and Subrahmanyam (1998); Hong
and Stein (1999)]. In contrast, the findings in this paper suggest that investors overreact to CEO
interviews on CNBC. It may be worthwhile examining whether the reported price dynamics are
specific to CNBC’s broadcast or whether other media outlets cause overreaction as well. If
20
markets in fact underreact to corporate events and overreact to media-transmitted nonevents, one
may find interesting implications for the behavioral models mentioned above.
Huberman (2001) documents that investors prefer investing in assets they feel familiar
with and Barber and Odean (2002) find that individual investors are more likely to be net buyers
of attention-grabbing stocks than are institutional investors. Cohen, Gompers and Vuolteenaho
(2001) show that individual investors underreact to positive cash-flow news while institutions
exploit the underreaction pattern by buying shares from individual investors. An interesting
question for future research could be to investigate whether individual investors (e.g., day
traders) overreact to CEO appearances, thus driving up stock prices, while institutional investors
sell off (or even short) stocks after interviews, thereby causing the price reversal.
21
Appendix A: Sample Selection Procedure
From January 1999 until March 2001, CNBC’s programming schedule was available on
CNBC’s website. For the period from January 1999 until December 2000, the schedule lists
13,886 entries, 3,835 of which are concerned with publicly traded companies (interviews,
reports, analyst recommendations). 3,051 are CEO interviews, and 526 are interviews with non-
CEO executives and CEOs of subsidies (i.e., interviews with Bob Wright, CEO of NBC, which
is owned by General Electric).
In 2001 CNBC changed its database provider, and thereby the format of its website. First,
time stamps are unavailable for all interviews between April and December 2001. Second, the
complete programming schedule is no longer available. Instead, CNBC classifies all interviews,
and “CEO Interview” is one of the categories. Hence, 347 CEO interviews from January through
March 2001 were extracted from the programming schedule and 896 interviews between April
and December 2001 where downloaded using CNBC’s classification. To keep the sample clean,
this study focuses exclusively on interviews with CEOs.
For the entire sample period from January 1999 through December 2001, 4,294 CEO
interviews are available. 4,183 could be matched with the stock database of the Center for
Research in Security Prices (CRSP). Stock price data are required to be available for the 300
trading days prior to the interview in order to estimate the parameters of the market model over
one year (255 trading days), which reduces the sample to 3,945 interviews. After intersecting
these interviews with the Standard & Poor’s COMPUSTAT database. The final sample consists
of 3,641 interviews with CEOs from 1,491 different companies. While these requirements
eliminate several hundred observations, they ensure that the results reported in this study are not
driven by very small stocks or newly listed companies.
22
Appendix B: Event Study Methodology
This appendix discusses the event study methodology employed in this paper in more
detail. An examination of the impact of CEO Interviews on the price dynamics of sample firms
requires a measure of abnormal return. The abnormal return, τiAR , is the actual return of the
security i, τiR , minus the normal return, )|( ττ XRE i , where normal return is defined as the
expected return without conditioning on the CEO interview:
)|( ττττ XRERAR iii −= (A1)
Models for measuring normal performance can be categorized as statistical and economic. While
both categories require statistical assumptions, economic models use economic restrictions to
calculate more precise measures of normal returns. The two common economic models are the
Capital Asset Pricing Model (CAPM) and the Arbitrage Pricing Theory (APT). However, the
empirical evidence of deviations CAPM implies that restrictions imposed by the CAPM are
questionable. Adding additional economic factors to the market factor within an APT framework
adds little explanatory power (Brown and Weinstein, 1985). Therefore, most event studies
employ statistical models for modeling the abnormal return. The two common choices are the
constant mean return model and the market model. The constant mean return model assumes that
the mean return of a given security i, itR , is constant through time (indexed by t):
itiitR ξµ += , where 0)( =itE ξ and 2)var(tit ξσξ = (A2)
The market model assumes a stable linear relationship between the market return, mtR ,
and the security return, itR :
,itmtiiit RR εβα ++= where 0)( =itE ε and 2)var(tit εσε = (A3)
By removing the portion of the return itR that is related to variation in the market’s return,
mtiRβ , the variance of the abnormal return is reduced. The gain from using the market model
23
instead of the constant mean return model depends upon the R2 of the market model regression
(A3). Chandra, Moriarty and Willinger (1990) find that tests with the constant mean return
model are less powerful than tests with the market model. Recent event studies employ the
Fama-French 3-factor model (i.e., Barber and Odean, 2002) to further reduce the variance of the
abnormal return. However, MacKinlay (1997) argues that the marginal explanatory power of
additional factors is small unless sample firms share a common characteristic.
This paper uses the market model (A3) to measure normal performance. For each sample
observation, calendar time is converted to event time by defining the date of the CEO interview
as event day 0. The regression coefficients αi and βi are estimated in an ordinary least squares
(OLS) regression during the estimation period one year (255 trading days) prior to the event
period (event days – 300 through – 46). The event period consists of 61 trading days centered on
the telecast (– 30 through + 30). However, the paper reports abnormal returns only for the 21
trading days centered on the telecast (– 10 through + 10) and the discussion focuses on the
symmetric 5-day window (– 2 through + 2). As proxy for the market portfolio mtR , both the
CRSP value-weighted index, and the CRSP equal-weighted index are used.
Under standard assumptions, OLS is a consistent estimation procedure for the market model
parameter. Under the assumption that asset returns are jointly multivariate normal and
independently and identically distributed (iid.), OLS is also efficient. The prediction errors, itPE ,
of the market model are simply the OLS residuals, itε̂ ,
)ˆˆ(ˆ ττττ βαε miiiii RRPE +−=≡ (A4)
with
( )246
299
2 ˆˆ2255
1ˆ ∑−
−=−−
−=
t
tmiiit
RRτ
ττε βασ (A5)
24
which is used as an estimator of the abnormal return, τiAR . In other words, the abnormal
return is the residual term of the market model calculated on an out of sample basis. Let τiAR , τ
= t – 30, t – 29, …, t + 29, t + 30, be the sample of 61 abnormal returns for firm i in the event
window. Under the null hypothesis, conditional on the event window market returns, the
abnormal returns will be jointly normally distributed with a zero conditional mean and
conditional variance:
( ))(,0~ 2ττ σ ii ARNAR (A6)
The conditional variance )(2τσ iAR has two components. The first component is the disturbance
2ˆtεσ from (A5), and the second component is additional variance due to the sampling error in
estimating the market model parameters αi and βi:
−++= 2
222
ˆ)(1
2551)(
m
mmti
RRARσ
σσ τετ where ∑
−
−==
46
2992551 t
tmm RR
ττ (A7)
Because we have chosen the estimation window to be large (255 trading days), we assume that
the contribution of the second component to )(2τσ iAR is zero.
To draw inferences about the average price impact of an event, abnormal return observations
have to be aggregated across securities and through time. Average abnormal returns τAAR are
formed by aggregating abnormal returns τiAR for each event period, τ = t – 30, t – 29, …, t + 29,
t + 30. Given N events,
∑=
=N
iiAR
NAAR
1
1ττ (A8)
Under the assumption that average abnormal returns are independent across securities, the
asymptotic variance equals to
( ) ∑=
=N
itN
AAR1
22
1var ετ σ (A9)
25
For part of the analysis, these average abnormal returns are aggregated through time
∑=
=2
121 )(
τ
τττττ ii AARCAAR (A10)
Under the assumption the event windows of the N securities do not overlap, the covariance terms
are set to zero and the variance equals to
( ) ( )∑=
=N
ii AARCAAR
121 var)(var τττ (A11)
Hypothesis Testing
Under the assumption described above,
( )( ))(var,0~)( 2121 ττττ ii CAARNCAAR (A12)
can be used to test the null hypothesis that the abnormal returns are zero. Because 2tεσ is
unknown, it has to be estimated. One possible choice is the sample variance measure of 2tεσ from
the market model regression in the estimation window, (A5). Using 2ˆtεσ in (A9), test statistics
can be constructed using
( ) ( )1,0~)(var
)(
21
211 N
CAARCAAR
i
i
ττττθ = (A13)
However, (A13) is not appropriate if securities’ abnormal returns are cross-sectionally
correlated, which may be the case if the securities have a common event date. Because every day
several CEOs appear on CNBC, this could cause a potential problem. Brown and Warner (1985)
suggest a ‘crude dependence adjustment’ which uses the variance of portfolio residuals from the
estimation period rather than the sum of the variances of residuals for individual securities.
Therefore, the estimated variance of τAAR is
( )
2255ˆ
46
299
2
2
−
−=
∑−
−=
t
tAAR
AARAARτ
τσ where
255
46
299∑−
−==
t
tAAR
AAR ττ
. (A14)
26
The portfolio test statistic for day τ in event time is
2ˆ AAR
AARtσ
τ= (A15)
T-statistics in Table IV with the column header Standard-t are calculated based on (A15).
Assuming time-series independence, the test statistic for )( 21ττiCAAR is
( ) AAR
iCAARtσττ
ττˆ1)(
12
21
+−= (A16)
If clustering is present, this portfolio approach will impound any residual cross-sectional
correlation in its estimate of portfolio residual’s standard deviation.
However, besides being cross-sectionally correlated, the abnormal return estimators often
have different variances across firms. A common way of addressing this problem is the
standardized residual method (Patell, 1976). Define the standardized abnormal return, τiSAR as
τ
ττ σ
iMLE
ii
ARSARˆ
= (A17)
where
( )( )
−−++=
∑−
−=46
299
22 11ˆˆ
tt mm
mmtiMLE RR
RRT τ τ
τετ σσ (A18)
is the maximum likelihood estimate of the variance. Under the null hypothesis each τiSAR
follows a Student’s t distribution with T – 2 degrees of freedom. Summing the τiSAR across the
sample yields
∑=
=N
iii SARASAR
1ττ where ( )ττ QNASARi ,0~ (A19)
The Z-test statistic for the null hypothesis that 0)( 21 =ττiCAAR is
27
∑=
=N
iiZ
NZ
12121 )(1)( ττττ where
( )∑=
−−+−
=2
112
21
421
1)(τ
τττ
ττττ ii SAR
TT
Z (A20)
Table IV reports test statistics based on (A20) under the column header Standard Z.
The two test statistics so far discussed use the variance estimate from the market model during
the estimation period to estimate the variance of the abnormal return estimator. But frequently
events increase the variance of returns, so that the event-period variance is greater than the
estimation-period variance. Two common proposals for coping with event-induced variance are
the cross-sectional standard deviation method proposed by Brown and Warner (1985) and the
standardized cross-sectional test developed by Boehmer, Musumeci, and Poulsen (1991). The
cross-sectional standard deviation method substitutes a daily cross-sectional standard deviation
for the portfolio time-series standard deviation. The portfolio test statistic for day t in event time
is
N
AARttAAR
t
σ̂= where
2
1 1
2 11
1ˆ ∑ ∑= =
−−
=N
i
N
iiitAAR AR
NAR
N ττσ (A21)
The results of using (A21) are reported in Table IV under the column header Adjusted-t. The
standardized cross-sectional method is a hybrid of the standardized-residual and the cross-
sectional approach:
N
ASARZtSAR
tt σ̂= where
2
1 1
2 11
1ˆ ∑ ∑= =
−−
=N
i
N
iiitSAR SAR
NSAR
N ττσ (A21)
Table IV reports test statistics based on (A21) under the column header Adjusted-Z. Boehmer,
Musumeci, and Poulsen (1991) use simulations to document the empirical properties of (A21).
They find that (A21) has more power than (A20) and is essentially unaffected by the presence of
event-date clustering.
28
References
Abarbanell and Lehavy, 2000, Commercial database adjustments to earnings and forecasts: Implications for research on analyst forecast rationality, earnings management and earnings response coefficient, Working Paper, UNC/UC-Berkeley.
Anderson, Mark W., 2000, Stocks on the move: 06/30/00, http://news.morningstar.com/doc/news/ 0,2,7535,00.html
Barber, Brad M. and Douglas Loeffler, 1993, The “Dartboard” column: Second-hand information and price pressure, Journal of Financial and Quantitative Analysis 28, 273-284.
Barber, Brad M. and Terrance Odean, 2002, All that glitters: The effect of attention and news on the buying behavior of individual and institutional investors, Working Paper, UC Davis/UC Berkeley
Bartiromo, Maria and Catherine Fredman, 2001, Use the News: How to separate the noise from the investment nuggets and make money in any economy, New York, NY: HarperCollins
Beaver, William H., 1968, Market prices, financial ratios, and the prediction of failure, The Journal of Accounting Research, 179-192.
Beltz, Jess and Robert Jennings, 1997, “Wall Street Week with Louis Rukjeyser” Re-commendations: Trading activity and performance, Review of Financial Economics 6, 15-27.
Beneish, Messod D., 1991, Stock prices and the dissemination of analysts’ recommendation, Journal of Business 64, 393-416.
Bernard, Victor L., 1992, Stock price reactions to earnings announcements, in: Richard Thaler (ed.), Advances in Behavioral Finance, New York, Sage.
Bernstein, Richard, 2001, Navigate the Noise: Investing in the New Age of Media and Hype, New York, NY: Wiley
Berry, Thomas D. and Keith M. Howe, 1994, Public information arrival, Journal of Finance 49, 1331-1346.
Black, Fischer, 1986, Noise, in: Richard H. Thaler (ed.), Advances in Behavioral Finance, New York, NY: Sage.
Boehmer, Ekkehart, Jim Musumeci, and Annette B. Poulsen, 1991, Event-Study methodology under conditions of event-induced variance, Journal of Financial Economics 30, 253-272.
Busse, Jeffrey A. and T. Clifton Green, in press, Market efficiency in real-time, Journal of Financial Economics, forthcoming.
Byrd, John, Johnson, Marilyn F. and Mark S. Johnson, 1997, CEO presentation strategies and the investor base, Working Paper, University of Michigan
Campbell, John Y. and Albert S. Kyle, 1993, Smart money, noise trading, and stock price behaviour, Review of Economic Studies 60, 1-34.
Chan, Wesley S., 2001, Stock price reaction to news and no-news: Drift and reversal after headlines, M.I.T. Working Paper
29
Cohen, Randolph B., Gompers Paul A. and Tuomo Vuolteenaho, 2001, Who underreacts to cash-flow news? Evidence from trading between individuals and institutions, Working Paper, NBER and Harvard University.
Daniel, Kent, David Hirshleifer, and Avanidhar Subrahmanyam, 1998, Investor psychology and security market under- and overreactions, Journal of Finance 53, 1839–86.
De Long, J. Bradford, Andrei Shleifer, Lawrence H. Summers, and Robert J. Waldmann, 1990, Noise trader risk in financial markets, in: Richard H. Thaler (ed.), Advances in Behavioral Finance, New York, NY: Sage.
French, Kenneth R. and Richard Roll, 1986, Stock return variances: The arrival of information and the reaction of traders, Journal of Financial Economics 17, 5-26.
Gompers, Paul, and Josh Lerner, 1998, Venture capital distributions: Short-run and long-run reactions, Journal of Finance 53, 2161-83.
Hong, Harrison, and Jeremy C. Stein, 1999, A unified theory of underreaction, momentum trading and overreaction in asset markets, Journal of Finance 54, 2143–84.
Huberman, Gur and Tomer Regev, 2001, Contagious speculation and a cure for cancer: A nonevent that made stock prices soar, Journal of Finance 56, 387-396.
Ikenberry, David L., Josef Lakonishok, and Theo Vermaelen, 1995, Market underreaction to open market share repurchases, Journal of Financial Economics, 39, 301-39.
Ikenberry, David L., and Sundaresh Ramnath, 2001, Underreaction to self-selected news events: The case of stock splits, Working Paper, Rice University
Kolata, Gina, 1998, Hope in the lab: A special report; A cautious awe greets drugs that eradicate tumors in mice, New York Times, May 3, 1:1.
Kurtz, Howard, 2000, The Fortune Tellers: Inside Wall Street’s Game of Money, Media, and Manipulation, New York, NY: Free Press.
Liang, Bing, 1999, Price pressure: Evidence from the “Dartboard” Column, Journal of Business 72, 119-134.
Lloyd Davies, Peter and Michael Canes, 1978, Stock prices and the publication of second-hand information, Journal of Business 51, 42-56.
Loughran, Tim, and Jay R. Ritter, 1995, The new issues puzzle, Journal of Finance 50, 23-52.
Merton, Robert C., 1987, A simple model of capital market equilibrium with incomplete information, Journal of Finance 42, 483-510.
Michaely, Roni, Thaler, Richard H. and Kent L. Womack, 1995, Price reactions to dividend initiations and omissions: Overreaction or Drift? Journal of Finance 50, 573-608.
Mikkelson, Wayne H. and M. Megan Partch, 1988, Withdrawn security offerings, Journal of Financial and Quantitative Analysis 23, 119-134; Errata, JFQA 23, 487.
Miller, Edward M., 1977, Risk, uncertainty, and divergence of opinion, Journal of Finance 32, 1151 – 1168.
30
Mitchell, Mark L. and J. Harold Mulherin, 1994, The impact of public information on the stock market, Journal of Finance 49, 923-950.
Patell, James M., 1976, Corporate forecasts of earnings per share and stock price behavior: Empirical tests, Journal of Accounting Research 14, 246-274.
Philbrick, Donna R., and William Ricks, 1991, Using value line and IBES analyst forecasts in accounting research, Journal of Accounting Research 29, 397-417.
Rashes, Michael S., 2001, Massively confused investors making conspicuously ignorant choices (MCI-MCIC), Journal of Finance 56, 1911-1927.
Roll, Richard, 1977, A critique of the asset pricing theory’s tests, Journal of Financial Economics 6, 349-357.
Salinger, Michael, 1992, Standard errors in event studies, Journal of Financial and Quantitative Analysis 27, 39-53.
Shiller, Robert J., 2000, Irrational Exuberance, Princeton, NJ: Princeton University Press
, 1984, Stock prices and social dynamics, in: Richard H. Thaler (ed.), 1993, Advances in Behavioral Finance, New York, NY: Sage.
, 1981, Do stock prices move too much to be justified by subsequent changes in dividends?, American Economic Review 71, 421-498.
Shleifer, Andrei, 2000, Inefficient Markets, New York, NY: Oxford University Press
Stickel, Scott E., 1985, The effect of value line investment survey rank changes on common stock prices, Journal of Financial Economics 14, 121-143.
Strauss, Robert, 2001, As markets yo-yo, CNBC steadily rises, Los Angeles Times, April 24, 2001
Thaler, Richard H., editor, 1993, Advances in Behavioral Finance, New York, NY: Sage.
Thompson, Robert B., Olsen, Chris and J. Richard Dietrich, 1987, Attributes of news about firms: Firm-specific news reported in the Wall Street Journal Index, Journal of Accounting Research 25, 245-74.
Vickers, Marcia and Gary Weiss, 2000, Wall Street’s hype machine, BusinessWeek, April 3, 2000.
Womack, Kent L., 1996, Do brokerage analysts’ recommendations have investment value? Journal of Finance 51, 137-167.15
31
Footnotes 1 CNBC’s anchor Maria Bartiromo communicates this to her audience as follows: “So a
publicly traded company’s agenda is, simply, to make money and get its stock price up.
Consequently, it wants to deliver information that makes the company look good so that
more money is raised for the company and the best talent wants to work for the
company.” (Bartiromo and Fredman, 2001, p.134)
2 For example, Wharton Professor Jeremy Siegel recently told the LA Times: “I generally
stop listening when I see a CEO on [CNBC].” Robert Strauss, 2001, As Markets Yo-Yo,
CNBC Steadily Rises, LA Times, Tuesday, April 24, 2001
3 On can, of course, always argue that an event may contain new information without
revealing new facts. Hearing previously known facts strait from the CEO may serve as
certification, while simply repeating facts may be seen as validation. The litmus test for
information content will be the degree of permanence in the market reaction to CEO
interviews. Underreaction or overreaction alone would not signify a nonevent. But if one
finds, on average, no permanence at all in the price response, the definition of a nonevent
applies. Section 4.2 proposes a simple measure to decompose information and
“limelight” effect.
4 Vickers, Marcia and Gary Weiss, 2000, Wall Street’s hype machine, Business Week,
April 3, 2000.
5 Geert De Lombaerde, 2000, CNBC appearance sent shares of MedPlus skyrocketing,
briefly, Business Courier September 22, 2000.
6 CNBC’s tag line is: “CNBC – Profit from it”. CNBC’s credo is reflected in the opening
paragraph of Maria Bartiromo’s book Use the News: “We live in an extraordinary time
for ordinary investors. Wall Street has gone from an institutional club admitting only
32
select professionals to a game that’s wide open to individuals.” (Bartiromo and Fredman,
2001, p.1)
7 Merton’s (1987) investor recognition hypothesis also predicts a permanent shift in
security prices. But in contrast to the information hypothesis, his “model is consistent
with the observation that stock price sometimes reacts to a broad and widely-circulated
report about the firm, even when all the substantive information in the report has been
previously announced” (Merton, 1987, p. 501).
8 Price pressure and information hypothesis also have been tested in the context of
analysts’ recommendations, see, i.e., Barber and Loeffler (1993) and Liang (1999).
Merton (1987, Footnote 24) suggests that one can distinguish between the investor
recognition hypothesis and the “fads hypothesis by determining whether the price
changes are transient or permanent, provided, of course, that the half-lives of fads are not
too long.”
9 Only one percent of the interviews concern stocks traded on the American Stock
Exchange (AMEX). This may be due to the fact that AMEX stocks account for 10
percent of all stocks, but for less than one percent of total market capitalization.
10 Mitchell and Mulherin (1994) and Berry and Howe (1994) analyze the effect of public
information on market activity. While Mitchell and Mulherin (1994) use the number of
stories per day reported by Dow Jones on the Broadtape and in the Wall Street Journal,
Berry and Howe (1994) use the number of stories per day sent via the North American
wire by Reuter’s News Service for information proxies. Both report significant fewer
news stories on Mondays and Fridays and the most stories on Tuesdays and Thursdays.
Thompson, Olsen, and Dietrich (1987) analyze firm-specific news reported in the Wall
Street Journal Index for all stocks listed on the New York Stock Exchange (NYSE) and
33
American Stock Exchange (AMEX). They also find significantly fewer news items on
Mondays. Due to the time lag of the print medium, however, they do not report fewer
news items on Fridays.
11 Monthly size and annual book-to-market breakpoints are based on the New York Stock
Exchange and where downloaded from Ken French’s website.
12 For example, Jain (1988) reports that the announcements of certain macroeconomic
variables such as money supply and consumer price index induce significant abnormal
returns but no abnormal volume.
13 Turnover can be computed either on a dollar-weighted basis, by dividing the dollar value
of trading by the market capitalization of outstanding shares, or on a share-weighted
basis, by dividing the number of shares traded by the number of shares outstanding. This
paper uses share-weighted turnover.
14 Sales is COMPUSTAT data item 6, research expenditure is data item 46, advertising is
data item 45, book value of equity is data item 60, and the FORBES ranking is data item
279. For every interview, the most recent accounting data available are used, provided
that at least four months have passed between companies’ fiscal yearend and the
interview in question. This ensures that the accounting information is available to
investors by the time of the interview.
34
Figure 1 NASDAQ and NYSE Index
This figure plots the NASADAQ Composite index and the New York Stock Exchange (NYSE) index for the three years between 1999 and 2001. Both indices are normalized to a value of 100 for the beginning of the sample period by dividing each index value by the index value of the first trading day of 1999 and multiplying by 100.
Figure 2 Frequency Distribution of CEO Interviews on CNBC by Time of the Day
This figure plots the number of interviews broadcast on CNBC by time of the day for 3039 interviews where time stamps are available. Time is measured in five minutes intervals as CNBC reports its time stamps for CEO interviews in five minutes increments.
0
50
100
150
200
250
5:45
6:35
7:00
7:25
7:45
8:05
8:25
8:45
9:05
9:25
9:50
10:1
5
10:4
5
11:1
0
11:3
5
11:5
5
12:1
5
12:3
5
13:0
0
13:2
0
13:4
0
14:0
5
14:3
0
14:5
0
15:1
0
15:3
5
16:1
0
16:4
0
17:0
0
17:2
0
17:4
0
18:0
5
18:3
0
18:5
0
19:1
0
19:3
5
Time of Date
0
50
100
150
200
250
01/0
4/99
03/0
4/99
05/0
4/99
07/0
4/99
09/0
4/99
11/0
4/99
01/0
4/00
03/0
4/00
05/0
4/00
07/0
4/00
09/0
4/00
11/0
4/00
01/0
4/01
03/0
4/01
05/0
4/01
07/0
4/01
09/0
4/01
11/0
4/01
D at e
Nasdaq NY SE
35
Figure 3 Average Daily Excess Turnover around CEO Interviews on CNBC
This figure plots average daily excess turnover, ADETk, around CEO interviews on CNBC. Average turnover, ATi, is defined as the sum of share-weighted turnover, Tit, during the estimation period (day – 105 through day – 6):
∑−
−==
6
105.
1001
titi TAT
Daily excess turnover, DETik, is defined as the difference between average turnover and daily turnover for every day k of the event period. Average daily excess turnover, ADETk equals the sum of daily excess turnover across observations:
,iikik ATTDET −= and ∑=
=N
iikk DETADET
1.
-50.00%
0.00%
50.00%
100.00%
150.00%
200.00%
-5 -4 -3 -2 -1 0 1 2 3 4 5
D ays R elative to In terview
M ean M edian
36
Table I Descriptive Statistics of CEO Interviews on CNBC Across Time
This table reports summary statistics for 3641 CEO Interviews on CNBC by 1491 Firms between January 1999 and December 2001. Panel A reports the distribution of interviews by month. Panel B reports the distribution of interviews by weekday. Panel C reports how CEO interviews between January 1999 and March 2001 are distributed across CNBC’s daily program schedule (no time stamps are available for the remainder of the sample, which reduces the sample size in Panel C to 3039 observations). Column five reports the total number of CEO interviews broadcast during the time slot reported in column one. 9 interviews were broadcast after 19:30 when CNBC’s program schedule varies by weekday and hence do not show up in this table. The three programs Market Watch, Street Signs, and Market Wrap each consist of two hours. Because the hosts change after an hour (and in the case of Market Wrap even the producer), this table reports the two segments of each of the shows as separate program items. Panel A: Distribution of CEO Interviews by Month CEO Interviews On CNBC Month 1999 2000 2001 Total % of Total January 54 124 115 293 8.0 February 110 106 98 314 8.6 March 56 119 82 257 7.1 April 88 118 123 329 9.0 May 78 169 119 366 10.1 June 82 123 101 306 8.4 July 104 149 63 316 8.7 August 101 158 107 366 10.1 September 68 126 45 239 6.6 October 118 167 122 407 11.2 November 95 89 49 233 6.4 December 94 74 47 215 5.9 Total 1048 1522 1071 3641 100.0 % of Total 28.8 41.8 29.4 100.0 Panel B: Distribution of CEO Interviews by Weekday
CEO Interviews On CNBC Weekday Number % of Total Monday 619 17.0 Tuesday 787 21.6 Wednesday 900 24.7 Thursday 784 21.5 Friday 551 15.1 Total 3641 100.0
37
Panel C: Distribution of CEO Interviews across CNBC’s Programming Schedule
Time Program Host(s) Producer
Total No. of CEO
Interviews % of Total
5:00 - 7:00 Today's Business Bob Sellers Liz Claman Gary Kanofsky 36 1.2
7:00 - 10:00 Squawk Box Mark Haines Matt Quale 922 30.3
10:00 - 11:00 Market Watch I Tyler Mathisen Martha MacCallum Karin Annus 118 3.9
11:00 - 12:00 Market Watch II Bob Sellers Consuelo Mack Karin Annus 192
6.3
12:00 - 14:00 Power Lunch Bill Griffeth Joel Franklin 1018 33.5 14:00 – 15:00 Street Signs I Maria Bartiromo Andy Hoffman 91 3.0
15:00 - 16:00 Street Signs II Ted David Andy Hoffman 70 2.3
16:00 - 17:00 Market Wrap I Bill Griffeth Liz Claman Dan Clark 133 4.4
17:00 - 18:00 Market Wrap II Maria Bartiromo Tyler Mathisen Rich Fisherman 174 5.7
18:00 - 19:30 Business Center Ron Insana Sue Herera Rob Contino 285 9.4
Total Number of CEO Interviews 3039 100.0
38
Table II Descriptive Statistics Across Firms Whose CEO Appeared On CNBC
This table reports descriptive statistics for the sample of 1491 firms with 3641 CEO interviews on CNBC between January 1999 and December 2001. Panel A reports the frequency of CEO interviews by sample firms. Panel B reports top 15 companies whose CEO (or CEOs) appeared 14 times or more on CNBC between January 1999 and December 2001. If two CEO names appear in column eight, then the company was represented by two different CEOs during the time period. Panel C reports the frequency of CEO interviews per sample industries. Panel D reports top 10 industry groups ranked by number of CEO appearances on CNBC between January 1999 and December 2001. Industries are classified by three-digit Standard Industry Classification (SIC) code. Panel E reports the distribution of CEO interviews by size.
Panel A: Frequency of CEO Interviews per Sample Firm CEO Interviews on CNBC Firms Mean Median Std. Dev. Min Max 3641 1491 2.44 1 2.59 1 22 Panel B: Top 15 Companies Ranked by CEO Appearance on CNBC between January 1999 and December 2001 CEO Interviews on CNBC Rank Ticker 1999 2000 2001 Total Company Name CEO Name SIC Exchange 1 AMAT 6 7 9 22 Applied Materials James Morgan 3550 NASDAQ 1 BA 3 9 10 22 Boeing Philip Condit 3721 NYSE 3 AMZN 3 8 9 20 Amazon.com Jeff Bezos 7370 NASDAQ
8 RHAT 2 7 6 15 Red Hat Software Matthew Szulik Robert Young 7372 NASDAQ
8 SUNW 5 2 8 15 Sun Microsystems Scott McNealy 3570 NASDAQ
14 HGSI 2 7 5 14 Human Genome Sciences
William Haseltine 2830 NASDAQ
14 RNWK 4 5 5 14 Realnetworks Inc. Rob Glaser 7370 NASDAQ
39
Panel C: Frequency of CEO Interviews per Sample Industry CEO Interviews on CNBC Industry Mean Median Std. Dev. Min Max 3641 212 17.2 4 57.1 1 726
Panel D: Distribution of CEO Interviews across the 10 largest Industry Groups CEO Interviews on CNBC Rank SIC Industry Group 1999 2000 2001 Total % Total1 737 Computer Programming, Data Processing 201 321 204 726 19.9 2 283 Drugs 45 101 74 220 6.0 3 357 Computer and Office Equipment 67 85 53 205 5.6
10 371 Motor Vehicles and Motor Vehicle Equipment 12 27 15 54 1.5
Total 518 851 536 1905 52.3
Panel E: Distribution of CEO Interviews by Size Company Size Book to Market Size Size Rank Interviews % of Total Interviews % of Total 1 67 1.8 1411 38.8 2 134 3.7 541 14.9 3 186 5.1 314 8.6 4 254 7.0 243 6.7 5 261 7.2 226 6.2 6 328 9.0 170 4.7
Table III Distribution of CEO Interviews on CNBC by Stock Exchange
This table reports descriptive statistics for sample of 3641 CEO interviews on CNBC by stock exchange between January 1999 and December 2001. Panel A reports the number of CEO interviews broadcasted on CNBC between 1999 and 2001 and their distribution by stock exchange. Panel B reports the total number of firms traded on the New York Stock Exchange (NYSE), the American Stock Exchange (AMEX) and on NASDAQ that appeared on CNBC between 1999 and 2001. Panel A: Number of CEO Interviews on CNBC by Stock Exchange CEO Interviews on CNBC Exchange 1999 2000 2001 Total % of Total NYSE 457 647 556 1660 45.6 AMEX 33 17 13 63 1.7 NASDAQ 558 858 502 1918 52.7 Total 1048 1522 1071 3641 100.0 Panel B: Number of Firms with CEO Interviews on CNBC by Stock Exchange Firms Appeared on CNBC Exchange 1999 2000 2001 Total % of Total NYSE 292 216 123 631 42.3 AMEX 25 12 5 42 2.8 NASDAQ 359 338 122 819 54.9 Total 676 566 250 1492 100.0
41
Table IV Percentage Average Prediction Errors to Stocks whose CEOs Appear on CNBC
This table reports average and median prediction errors (PE) as a proxy for average and median abnormal returns to CEO appearances on CNBC. The sample consists of 3641 interviews broadcasted on CNBC between January 1999 and December 2001. The day of the CEO interview is day 0. Percentage average and median prediction errors are calculated from the market model using both the CRSP equally weighted market index (columns 2 to 7) and the CRSP value weighted market index (columns 8-13). Columns 14 to 17 report average and median unadjusted raw returns. The alphas and betas for the market model are estimated during a 100-day estimation period from day – 300 to day – 46. Standard t-Statistics are based on the ‘crude dependence adjustment’ methodology of Brown and Warner (1985). Standard Z-Statistics are calculated by using the standardized residual method (Patell, 1976). Adjusted t-Statistics are calculated using the cross-sectional standard deviation method (Brown and Warner, 1985). Adjusted Z-Statistics are based on the standardized cross-sectional test of Boehmer, Musumeci, and Poulsen (1991).
$ Significant at the 10% level, * Significant at the 5% level, ** Significant at the 1% level, *** Significant at the 0.1% level.
Table V Percentage Cumulative Average Prediction Error to Stocks whose CEOs Appear on CNBC
This table reports cumulative average prediction errors (as proxies for cumulative mean abnormal returns) to CEO interviews on CNBC for the complete sample and various sub samples. The day of the CEO interview is day 0 and the three windows [-2,-1], [0], and [+1,+2] indicate the number of trading days relative to day 0. Percentage cumulative average prediction errors (PCAPE) in the three windows are calculated from the market model using both the CRSP equally weighted market index (columns 2 to 4) and the CRSP value weighted market index (columns 5-7). Columns 8 to 10 report cumulative average unadjusted raw returns. The alphas and betas for the market model are estimated during a 255-day estimation period from day – 300 to day –46. Test-statistics are corrected for serial correlations, event clustering and event-induced heteroskedasticity according to Boehmer, Musumeci, and Poulsen (1991).
$ Significant at the 10% level, * Significant at the 5% level, ** Significant at the 1% level, *** Significant at the 0.1% level.
Market Model, EW Index Market Model, VW Index Unadjusted Raw Return Type of Event Study N [-2, -1] [0] [+1, +2] [+1,+10] Limelight [-2, -1] [0] [+1, +2] [+1,+10] Limelight [-2, -1] [0] [+1, +2] [+1,+10] Limelight All Interviews 3641 1.77 1.68 -0.97 -3.27 0.98 1.86 1.65 -0.87 -2.78 0.82 2.36 1.94 -0.49 -0.97 0.24 8.69*** 9.28*** -7.63*** -10.96*** 9.13*** 9.05*** -7.02*** -7.9*** 11.21*** 10.39*** -3.76*** -3.74***
$ Significant at the 10% level, * Significant at the 5% level, ** Significant at the 1% level, *** Significant at the 0.1% level.
Market Model, EW Index Market Model, VW Index Unadjusted Raw Return Type of Event Study N [-2, -1] [0] [+1, +2] [+1,+10] Limelight [-2, -1] [0] [+1, +2] [+1,+10] Limelight [-2, -1] [0] [+1, +2] [+1,+10] Limelight
Table VI Percentage Cumulative Average and Median Prediction Error to Stocks whose CEOs Appear on CNBC
This table reports cumulative average and median prediction errors (as proxies for cumulative mean abnormal returns) to CEO interviews on CNBC for the complete sample. Pre-Event indicates the two days preceding the interview [-2,-1], Event indicates the event data [0], and Post-Event indications the ten days following the event [+1,+10]. The day of the CEO interview is day 0 and the six windows [-2,-1], [0], [+1,+2], [+1,+3], [+1,+5], and [+1,+10] indicate the number of trading days relative to day 0. Percentage cumulative average prediction errors (PCAPE) in the six windows are calculated from the market model using the CRSP value weighted market index. The alphas and betas for the market model are estimated during a 255-day estimation period from day – 300 to day –46. Panel A: Mean Abnormal Returns
N = 1641 N = 698 negative 400 -3.509% -3.604% -2.149% -2.869% -4.234% -8.037%
45
Table VII Asymmetric Information and Abnormal Returns
This table presents results from cross-sectional regressions of (cumulative) abnormal returns on variables commonly assumed to be associated with the degree of asymmetric information between companies and investors. Columns 2 and 3 show results from a regression on the cumulative abnormal returns during the two days preceding the interview. Columns 4 and 5 show results from a regression on the abnormal return of the interview date. Columns 6 and 7 show results from a regression on the cumulative abnormal returns during the two days following the interview. LN_AGE is the natural logarithm of 1 plus the number of years the firm is listed on the CRSP files. LN_SIZE is the natural logarithm of the market capitalization 6 trading days prior to the interview. TURNOVER is the average turnover over 100 trading days 6 trading days prior to the interview. RESEARCH and ADVERTISING are research and advertising expenditures scaled by sales, respectively. BTM is the book-to-market ratio. FORBES is a dummy variable equal to 1 if the firm is part of the Forbes 500 list. EARNINGS and MERGER are dummy variables equal to one if the interview is earnings- or merger&acquisition-related, respectively. NASDAQ is a dummy variable equal to one if the firm is trading on Nasdaq. NEGBTM is a dummy variable equal to one if the firm has negative book value. ADR is a dummy variable equal to one if a foreign firm’s American Depository Receipts or American Depository Shares are traded on an American exchange. The regression controls for the six industry groups that had the largest number of interviews during the sample period. Because the White-Heteroskedasticity Test rejects the null hypothesis of homoskedasticity, t-statistics are computed with heteroskedasticity consistent standard errors. CAR(-2,-1) AR(0) CAR(+1,+2) Dependent Variable Coefficient t-Statistic Coefficient t-Statistic Coefficient t-StatisticConstant 0.213136 6.434381 0.160068 6.24738 -0.042449 -3.248134LN_AGE 0.0008 0.309667 0.002082 0.944098 0.002962 1.880259LN_SIZE -0.014357 -5.833693 -0.010613 -5.959246 0.002259 2.478212TURNOVER 0.000183 1.040033 -5.30E-05 -0.471657 -0.000177 -2.203803RESEARCH 8.57E-06 0.029263 -0.000151 -0.979739 -0.000176 -1.589842ADVERTISE -0.001617 -1.654079 0.003466 1.143181 6.82E-05 0.074711BTM -5.92E-05 -1.319971 1.92E-07 0.007355 2.50E-05 1.009399FORBES 0.021154 3.895567 0.013444 2.698535 -0.000862 -0.268514EARNINGS 0.00192 0.387356 -0.003534 -0.912881 0.005582 1.957865MERGER 0.015535 1.221029 0.036797 1.749563 -0.009796 -0.922978NASDAQ 0.010802 2.562917 0.003425 0.808232 -0.006614 -2.152329NEGBTM 0.014562 1.331779 -0.005332 -0.528667 -0.006182 -0.738954ADR -0.015934 -1.782793 -0.004134 -0.376707 0.017167 2.326386SIC283 -0.003662 -0.401648 0.014334 1.1219 -0.003778 -0.639761SIC357 0.000874 0.124707 0.011819 1.5258 0.000154 0.026827SIC366 0.008658 0.784356 0.012943 1.432302 -0.015354 -2.299667SIC367 -0.008051 -0.705115 0.015248 1.74188 0.008839 1.436852SIC481 0.041769 1.639284 0.001975 0.211774 -0.003553 -0.614223SIC737 0.009325 1.430359 0.017114 2.758765 -0.002022 -0.445585 Adjusted R-squared 0.040842 0.025549 0.020497 White Heteroskedasticity Test: