52
| Date post: | 02-Jul-2018 |
| Category: |
Documents |
| Upload: | phungnguyet |
| View: | 214 times |
| Download: | 0 times |


CEO REMUNERATION STUDY 2016 EXECUTIVE REMUNERATION RESEARCH CENTRE

© Vlerick Business School
WHAT’S NEW ABOUT THIS YEAR’S EDITION?
3
Sweden included Banks & financial services included Market capitalisation as measure of firm size (instead of total assets) Bonus deferral operationalised and included CEO remuneration in high performing firms: what is different?

1 SAMPLE

© Vlerick Business School
SAMPLE – NUMBER OF FIRMS PER STOCK MARKET INDEX
5

Nano cap: < 50 m
Micro cap: 50-300 m
Small cap: 300 m – 2 bn
Mid cap: 2 bn – 10 bn
Big cap: 10 bn – 200 bn
Mega cap: +200 bn

© Vlerick Business School
FIRM SIZE IN LARGEST STOCK MARKET INDEXES PER COUNTRY – MARKET CAP > 10 BN

© Vlerick Business School
DEFINITIONS
Total remuneration = Fixed remuneration + Short-term incentives (‘bonus’) + Long-term incentives
Contribution in pension plan

2 TOTAL REMUNERATION AND ITS COMPOSITION

© Vlerick Business School
TOTAL REMUNERATION – MARKET CAP
0
500.000
1.000.000
1.500.000
2.000.000
2.500.000
3.000.000
3.500.000
4.000.000
4.500.000
Nano cap Micro cap Small cap Mid cap Big cap Mega cap
240.000 380.000 765.000
2.285.000
4.395.000
Overall median: 1.315.000 €

© Vlerick Business School
THE DATA: TOTAL REMUNERATION & PENSION CONTRIBUTION

© Vlerick Business School
TOTAL REMUNERATION – MARKET CAP

© Vlerick Business School
COMPARING TOTAL REMUNERATION – 3 GROUPS BASED ON MARKET CAPITALISATION
300 m – 1 bn Small cap
1 bn – 3 bn Small-Mid cap
10 bn – 50 bn Big cap
Belgium 670.000 (24) 725.000 (18) 3.655.000 (5)
France 565.000 (57) 1.465.000 (26) 3.860.000 (29)
Germany 1.000.000 (21) 1.520.000 (34) 4.145.000 (20)
Netherlands 760.000 (10) 1.170.000 (17) 3.040.000 (10)
Sweden 890.000 (14) 2.545.000 (11)
UK 6.175.000 (25)

© Vlerick Business School
WHAT DRIVES TOTAL REMUNERATION?
-0,1
0
0,1
0,2
0,3
0,4
0,5
0,6
0,7
0,8
CEO age CEO tenure*
Local CEO* Gender Market cap*
EBITDA margin
0,038 -0,071 -0,082 0,005
0,783
-0,045
Sta
ndar
dise
d be
ta c
oeffic
ient
Explained variance = 66%

© Vlerick Business School
WHAT DRIVES TOTAL REMUNERATION? A VIEW FROM THE NETHERLANDS
-0,1
0
0,1
0,2
0,3
0,4
0,5
0,6
0,7
0,8
0,116 -0,082 0,041
-0,1
-0,033 0,036 -0,049 -0,069
-0,012
0,702
-0,049
Sta
ndar
dise
d be
ta c
oeffic
ient
Explained variance = 69%

© Vlerick Business School
EVOLUTION IN TOTAL REMUNERATION
0%
10%
20%
30%
40%
50%
60%
Decrease Stable Increase
34%
14%
52%

© Vlerick Business School
EVOLUTION IN TOTAL REMUNERATION COUNTRY DIFFERENCES – MATCHED SAMPLE
33% 32%
40% 45%
26%
17% 18% 12%
3% 4%
50% 50% 48% 52%
70%
0%
10%
20%
30%
40%
50%
60%
70%
80%
Belgium France Germany Netherlands UK
% o
f fir
ms
with
incr
ease
Decrese Stable Increase

© Vlerick Business School
CEO REMUNERATION STRUCTURE PERCENTAGE VARIABLE (STI + LTI)
Belgium (67%)
France (65%)
Sweden (59%)
Nether-lands (47%)
Germany (41%)
UK (25%)

© Vlerick Business School
WHAT DRIVES THE PROPORTION OF VARIABLE REMUNERATION?
-0,2
-0,1
0
0,1
0,2
0,3
0,4
0,5
0,6
CEO age CEO tenure*
Local CEO Gender Market cap*
EBITDA margin
0,078
-0,155 -0,077 0,01
0,522
0,062
Sta
ndar
dise
d be
ta c
oeffic
ient
Explained variance = 38%

© Vlerick Business School
WHAT DRIVES THE PROPORTION OF VARIABLE REMUNERATION? A VIEW FROM THE NETHERLANDS
-0,2
-0,1
0
0,1
0,2
0,3
0,4
0,5
0,063 -0,066 -0,027
-0,103
-0,195
0,053
-0,146
-0,068
0,003
0,497
0,05
Sta
ndar
dise
d be
ta c
oeffic
ient
Explained variance = 42%

© Vlerick Business School
CEO REMUNERATION STRUCTURE % OF TOTAL REMUNERATION
Fixed STI LTIBel 20 48% 24% 28%Bel Mid 54% 30% 15%Bel Small 68% 22% 11%
CAC40 29% 33% 38%CACMid 39% 26% 35%CACS 52% 21% 27%
DAX 33% 33% 34%MDAX 41% 33% 27%SDAX 44% 28% 28%
AEX 32% 29% 39%AMX 44% 27% 29%AScX 53% 25% 22%
OMXS60 53% 23% 24%
FTSE100 27% 31% 42%

© Vlerick Business School
CEO REMUNERATION STRUCTURE % OF FIXED REMUNERATION
STI LTI STI+LTIBel 20 56% 82% 138%Bel Mid 59% 30% 89%Bel Small 33% 16% 49%
CAC40 125% 163% 288%CACMid 88% 165% 253%CACS 49% 84% 133%
DAX 96% 120% 216%MDAX 87% 84% 171%SDAX 67% 77% 144%
AEX 102% 149% 251%AMX 57% 66% 123%AScX 42% 34% 76%
OMXS60 49% 42% 91%
FTSE100 126% 200% 326%

3 FIXED REMUNERATION

© Vlerick Business School
COMPARING FIXED REMUNERATION – 3 GROUPS BASED ON MARKET CAPITALISATION
300 m – 1 bn Small cap
1 bn – 3 bn Small-Mid cap
10 bn – 50 bn Big cap
Belgium 485.000 (24) 395.000 (18) 1.045.000 (5)
France 350.000 (57) 600.000 (26) 1.000.000 (29)
Germany 500.000 (21) 570.000 (34) 1.245.000 (20)
Netherlands 465.000 (10) 600.000 (17) 910.000 (10)
Sweden 595.000 (14) 1.495.000 (11)
UK 1.328.000 (25)

© Vlerick Business School
EVOLUTION IN FIXED REMUNERATION
0%
5%
10%
15%
20%
25%
30%
35%
40%
45%
50%
Decrease Stable Increase
10%
48%
42%

© Vlerick Business School
EVOLUTION IN FIXED REMUNERATION COUNTRY DIFFERENCES – MATCHED SAMPLE
17% 12% 10%
5% 2%
56% 56% 47% 50%
0%
27% 32%
43% 45%
98%
0%
10%
20%
30%
40%
50%
60%
70%
80%
90%
100%
Belgium France Germany Netherlands UK
% o
f fir
ms
with
incr
ease
Decrese Stable Increase

4 SHORT-TERM INCENTIVES

© Vlerick Business School
COMPARING SHORT-TERM INCENTIVES – 3 GROUPS BASED ON MARKET CAPITALISATION
300 m – 1 bn Small cap
1 bn – 3 bn Small-Mid cap
10 bn – 50 bn Big cap
Belgium 160.000 (24) 320.000 (18) 1.230.000 (5)
France 170.000 (57) 590.000 (26) 1.300.000(29)
Germany 255.000 (21) 590.000 (34) 1.175.000 (20)
Netherlands 180.000 (10) 386.000 (17) 980.000 (10)
Sweden 285.000 (14) 365.000 (11)
UK 1.910.000 (25)

© Vlerick Business School
EVOLUTION IN SHORT-TERM INCENTIVES
0%
10%
20%
30%
40%
50%
60%
Decrease Stable Increase
35%
13%
52%

© Vlerick Business School
KPIS UNDERLYING VESTING OF SHORT-TERM INCENTIVES
0% 10% 20% 30% 40% 50% 60% 70% 80% 90%
Stock price
R&D, innovation
Environment & CSR
Efficiency/safety
Employee/customer
Sales
Profit
5%
5%
12%
15%
15%
16%
88%
% of firms
Number of KPIs: 3 (median)

© Vlerick Business School
SHORT-TERM INCENTIVES DESIGN
Type: shares (75%), cash (17%), options (5%), mix (3%)
Term: 3y
% deferral: 33-50%

5 LONG-TERM INCENTIVES

© Vlerick Business School
COMPARING LONG-TERM INCENTIVES – 3 GROUPS BASED ON MARKET CAPITALISATION
300 m – 1 bn Small cap
1 bn – 3 bn Small-Mid cap
10 bn – 50 bn Big cap
Belgium 85.000 (24) 140.000 (18) 1.405.000 (5)
France 275.000 (57) 425.000 (26) 1.505.000 (29)
Germany 460.000 (21) 400.000 (34) 1.560.000 (20)
Netherlands 225.000 (10) 400.000 (17) 1.445.000 (10)
Sweden 185.000 (14) 440.000 (11)
UK 3.105.000 (25)

© Vlerick Business School
EVOLUTION IN LONG-TERM INCENTIVES
0%
10%
20%
30%
40%
50%
60%
70%
Decrease Stable Increase
32%
6%
62%

© Vlerick Business School
LONG-TERM INCENTIVES TYPOLOGY
LTI type % firms
Performance shares 30% Options – performance vest 9% Cash LTI 8% Phantom stock 4% Options – time vest 4% Free shares 3% Restricted shares 2%

© Vlerick Business School
OCCURRENCE OF SHARE-BASED REMUNERATION
0%
10%
20%
30%
40%
50%
60%
70%
80%
90%
100%
UK Netherlands Belgium Germany France
92%
58%
36%
32% 30%

© Vlerick Business School
OCCURRENCE OF SHARE-BASED REMUNERATION
0%
5%
10%
15%
20%
25%
30%
35%
40%
45%
2013 2014 2015
32%
23%
42%

© Vlerick Business School
OCCURRENCE OF SHARE-BASED REMUNERATION
% granting share-‐based remuneration
Bel 20 65%Bel Mid 28%Bel Small 25%
CAC40 77%CACMid 51%CACS 13%
DAX 43%MDAX 42%SDAX 14%
AEX 71%AMX 68%AScX 36%
OMXS60 29%
FTSE100 91%

© Vlerick Business School
TYPOLOGY OF LONG-TERM INCENTIVES
B F D NL UK Options – time vest 26% 1% 0% 6% 2%
Options – performance vest 9% 7% 6% 9% 24%
Restricted shares 3% 1% 2% 0% 3%
Performance shares 10% 21% 23% 51% 73%
Phantom stock 1% 2% 14% 4% 0%
Cash LTI 4% 1% 37% 4% 0%
Free shares 1% 5% 0% 1% 5%

© Vlerick Business School
TYPOLOGY OF LONG-TERM INCENTIVES
AEX AMX AScX Options – time vest 0% 9% 8%
Options – performance vest 13% 9% 4%
Restricted shares 0% 0% 0%
Performance shares 71% 55% 28%
Phantom stock 0% 9% 4%
Cash LTI 4% 9% 0%
Free shares 4% 0% 0%
© Vlerick Business School
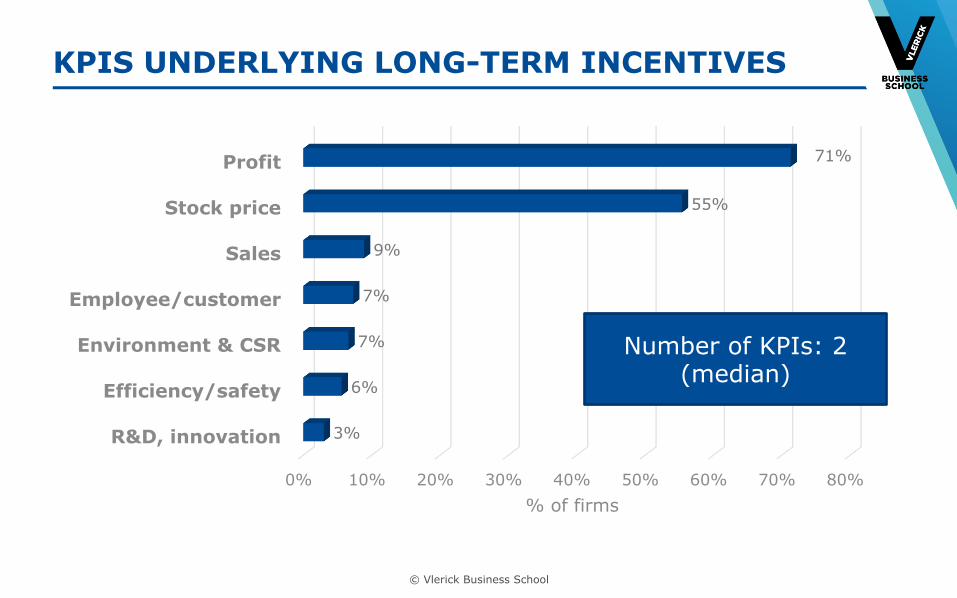
KPIS UNDERLYING LONG-TERM INCENTIVES
0% 10% 20% 30% 40% 50% 60% 70% 80%
R&D, innovation
Efficiency/safety
Environment & CSR
Employee/customer
Sales
Stock price
Profit
3%
6%
7%
7%
9%
55%
71%
% of firms
Number of KPIs: 2 (median)

© Vlerick Business School
KPI TYPOLOGY FOR STI AND LTI
STI LTI
Financial 98% 99%
Non-financial 49% 21%

6 PENSIONS

© Vlerick Business School
TYPE OF PENSION PLAN
Defined benefits, 36%
Defined contribution,
50%
Mix, 14%

© Vlerick Business School
TYPE OF PENSION PLAN PER COUNTRY
Defined benefits
Defined contri-‐bution
Mix
Belgium 12% 79% 9%France 40% 32% 27%Germany 50% 34% 16%Netherlands 24% 76% 0%Sweden 15% 79% 6%United Kingdom 46% 49% 5%

© Vlerick Business School
PENSION PLAN CONTRIBUTION IN TERMS OF FIXED REMUNERATION
Country Pension contribution (% fixed rem.)
Germany 43% Sweden 34% Belgium 16% Netherlands 16% UK 16% France 5%

© Vlerick Business School
PENSION PLAN CONTRIBUTION IN TERMS OF FIXED REMUNERATION
Pension in % fixed
remunerationBel 20 19%Bel Mid 16%Bel Small 12%
CAC40 22%CACMid 2%CACS 4%
DAX 48%MDAX 43%SDAX 19%
AEX 23%AMX 13%AScX 16%
OMXS60 34%
FTSE100 16%

© Vlerick Business School
PENSION PLAN CONTRIBUTION IN TERMS OF FIXED REMUNERATION
7%
20%
37%
0%
5%
10%
15%
20%
25%
30%
35%
40%
Q25 Q50 Q75

7 CEO REMUNERATION IN HIGH PERFORMING FIRMS

© Vlerick Business School
WHAT IS A HIGH PERFORMER?
EBITDA
Total revenue ≥ 20%
2013 2014 2015

© Vlerick Business School
EBITDA MARGIN IN RELATION TO COUNTRY
EBITDA margin (median)
% high performers
Belgium 17% 10% France 10% 16% Germany 15% 21% Netherlands 8% 0% Sweden 13% 11% UK 22% 34%

© Vlerick Business School
WHAT MAKES HIGH PERFORMING FIRMS DIFFERENT IN THE FIELD OF CEO REMUNERATION?
Remuneration aspect High performing firms
Other firms
Remuneration level • Positioning (% positioned above
stock market index median)
43%
50%
Remuneration structure • Proportion variable remuneration
59%
45%
Remuneration design • % of firms granting share-based LTI • % of firms granting performance
shares
48% 42%
40% 28%


