37
ISSN 2042-2695 CEP Discussion Paper No 1052 May 2011 The Impact of Chernobyl on Health and Labour Market Performance Hartmut Lehmann and Jonathan Wadsworth

ISSN 2042-2695
CEP Discussion Paper No 1052
May 2011
The Impact of Chernobyl on Health and Labour Market Performance
Hartmut Lehmann and Jonathan Wadsworth

Abstract Using longitudinal data from Ukraine we examine the extent of any long-lasting effects of radiation exposure from the Chernobyl disaster on the health and labour market performance of the adult workforce. The variation in the local area level of radiation fallout from the Chernobyl accident is considered as a random exogenous shock with which to try to establish its causal impact on poor health, labour force participation, hours worked and wages. There appears to be a significant positive association between local area-level radiation dosage and perception of poor health, though much weaker associations between local area-level dosage and other specific self-reported health conditions. There is also some evidence to suggest that those more exposed to Chernobyl-induced radiation have significantly lower levels of labour market performance twenty years on. Keywords: Chernobyl, health, labour market performance JEL Classifications. H00, J00 This paper was produced as part of the Centre’s Labour Markets Programme. The Centre for Economic Performance is financed by the Economic and Social Research Council. Acknowledgements We thank Lenina Akkineni for valuable research assistance and Natalia Kharchenko at KIIS for most helpful advice on the dataset. We are grateful to Carlos Bozzoli, John Earle, Andrea Ichino, Martin Kahanec, participants at the IZA workshop on “Analysis of Labour Market Adjustment in Transition and Emerging Economies Using Large Micro-Data Sets”, the ESCIRRU conference in Moscow and at seminars at the LSE, Bologna and DIW, Berlin for helpful comments. We are grateful for financial support from the European Commission within the project “Economic and Social Consequences of Industrial Restructuring in Russia and Ukraine” (ESCIRRU). Hartmut Lehmann is Professor of Economic Policy in the department of economics at the University of Bologna and Program Director of the IZA research area "Labor Markets in Emerging and Transition Countries". Jonathan Wadsworth is a Senior Research Fellow at the Centre for Economic Performance and Professor of Economics at Royal Holloway College University of London. Published by Centre for Economic Performance London School of Economics and Political Science Houghton Street London WC2A 2AE All rights reserved. No part of this publication may be reproduced, stored in a retrieval system or transmitted in any form or by any means without the prior permission in writing of the publisher nor be issued to the public or circulated in any form other than that in which it is published. Requests for permission to reproduce any article or part of the Working Paper should be sent to the editor at the above address. © H. Lehmann and J. Wadsworth, submitted 2011

1
Introduction On 26th April 1986, engineers at the Chernobyl1 nuclear power plant in Ukraine began a series of tests on one of the reactors that lead to the world’s worst civil nuclear disaster. The amount of radiation released as a consequence of the accident was far in excess of that released from the air bursts of the Hiroshima or Nagasaki atomic bombs, hitherto the focus of much research and knowledge about the consequences of radiation fallout. Yet, while much has been written, and argued, about the medical and physical consequences of Chernobyl2, less attention has been given to the social and economic consequences of the disaster, despite recent urgings along this line from the United Nations, (UNDP 2002). Fears of the consequences of a nuclear accident have surfaced again recently, given the uncertainty and anxiety caused by the explosion at the Fukushima nuclear power plant in Japan, following the 2011 earthquake and tsunami. Since there are now movements in many industrialised countries aimed at considering building a new generation of nuclear power facilities, it seems important to acquire knowledge of any long-term economic consequences of such rare, low frequency events as an accident in a nuclear power plant.
Understanding the link between environmental shocks, health and economic performance may be helpful in establishing an appropriate policy response. Faced with a large-scale accident, state resources are almost certainly diverted away from other programmes in order to deal with the immediate consequences of the disaster and this may affect the future pattern of development and growth, even if mitigated by international aid. Equally, the subsequent performance of individuals may have been impaired directly in some way by the disaster. Investigating the relationship between this, health and economic performance then helps illuminate the costs of the accident.
There is also a growing literature concerned with the long-term consequences of environmental shocks on later health and other economic outcomes, summarised recently in Almond (2006) or Maccini and Yang (2008). The Chernobyl accident certainly raises the issues of long latency of certain radiation-related conditions and potential “at-risk” populations that can only be observed with data taken some years after the initial event. Health has also long been considered to be a potentially significant determinant of labour market outcomes, such as wages, hours of work and employment3, with much of the literature being concerned with the difficulty of establishing a causal link between health and performance.
In what follows, we examine the relationship between exposure to radiation as a result of the Chernobyl accident and both subsequent health and economic performance some twenty years later using longitudinal data on a representative sample of working age individuals from Ukraine. Since the intensity of radiation fallout was rather randomly distributed across Ukraine, given the prevailing wind patterns at the time and the fact that mobility was strictly controlled under the Soviet Union, we treat radiation exposure as an exogenous, unavoidable shock and first look to see whether there is any association between the level of radiation dosage in the local area of residence at the time of the disaster and a variety of self-reported health measures some seventeen years or more after the event.
One important existing study uses a similar exogenous source of environmental variation to identify causal effects. Almond, Edlund and Palme (2009) use regional variation 1 “Chornobyl” in Ukrainian transliteration. 2 For example, Chernobyl Forum (2005) puts the total number of Chernobyl cancer related deaths at 4000. Greenpeace (2006) cites a figure of around 90,000 cancer related deaths with an additional 100,000 from other radiation-related illnesses. 3 See the references in Currie (2009), Lleras-Muney (2005), Currie and Madrian (1999), Strauss and Thomas (1998), Kahn (1998).

2
in Chernobyl-related radiation dosage across Sweden to look at the differences in school outcomes at age 18, identifying an effect through differential exposure to the fallout of those who were in utero at the time of the accident. They find evidence indicative that cognitive ability of those in utero and subject to higher doses of radiation may well have been impaired as a result. Our study takes longitudinal data to look for evidence of radiation associated longer-term effects on a variety of health outcomes of individuals across all ages living in the country at the source of the accident, where, arguably, awareness and the environmental legacy were most profound and where relatively high radiation levels affected a larger share of the population than any other country with the possible exception of Belarus. To this day, more than half of the adult Ukrainian population appears to be still concerned over the consequences of this event.4 One in six prime-age Ukrainian adults also report being in poor health, a much higher figure than comparable estimates from many western industrialised countries.5 However, as Rahu (2003) notes, while the long latency period of many radiation-related illnesses means that it is important to take a long-run view of the consequences of the accident, equally Soviet secrecy about it and the lack of general awareness of the effects of radiation created a fertile ground for persistent fears and rumours attributing any health problem to Chernobyl. So perceptions may also have changed as a result of the accident. As such this paper can be seen as an attempt to identify a causal effect of the accident on both health outcomes, health perceptions while widening the issue to the study of Chernobyl’s effect on other outcomes.
Unlike other related studies, we have access to longitudinal data on individuals that can facilitate identification of any causal examination of the effects of early shocks on later socio-economic achievement. Ukraine is fortunate in this regard since there is a panel data set, the Ukrainian Longitudinal Monitor Survey (ULMS), which has self-reported health and socio-economic data for a representative sample of individuals at, currently, three points in time, 2003, 2004 and 2007, and which also allows us to establish the place of residence of respondents at the time of the Chernobyl accident. Since radiation dosage differed across areas, we use this area variation as part of the identification process. The set of covariates allow us to control for a set of possible observable confounders. The longitudinal nature of the data allows us to control for unobserveable characteristics.
Other studies have looked at longer-term direct effects of environmental shocks on individual economic performance. Almond (2006) exploits the 1918 influenza epidemic to examine long run consequences for individual educational attainment and labour market performance using US census data. Meng and Xiang (2006) and Chen and Zhou (2007) both use regional level variation in the 1959-61 Great Famine in China as an exogenous shock to identify different health effects on individual economic performance. Miguel & Roland (2006) look at how variation in area-level bombing in the Vietnam war, using distance from the 17th parallel as an instrument for the intensity of bombing, affected area-level consumption, literacy and economic performance thirty years on. Concerns over the exogeneity of any shock have been addressed by others analysing different events. Chay and Greenstone (2003) use the recession-induced variation in area level pollutants to try to identify the effects on child mortality. Maccini and Yang (2008) look at the consequences of geographical variation in early-life rainfall on the subsequent health and educational attainment of individuals across Indonesian birth cohorts.
4 The ULMS data used in this study show that in 2003, 58 percent of the adults in the sample believed that their health or that of a family member had been affected by Chernobyl. 5 Subject to the concerns that ordered responses on health questions may differ across populations (eg Lindeboom and van Doorslaer (2004) ), the US National Health Interview Survey suggests that 3% of individuals aged 16 and over reported their health as “poor” in 2006. The 2006 Health Survey for England suggests an estimate of 5%.

3
One advantage of our approach is that we are given information on an individual’s settlement of residence in Ukraine around the time of the accident. There are no national surveys of individual measures, either perceived or realised, of radiation dosage received, but it is possible to assign a settlement-level radiation dosage, based on monitoring data conducted by the authorities at the time of the accident and subsequently compiled by the European Commission (1998). We map this area-level radiation data to the individual health data to establish the association between this dosage and the subsequent health of the adult workforce.
There was widespread variation in the amount of radiation areas received. Some areas in Ukraine received little more radiation then normal background levels, while other areas received more than ten times the usual background level dosage. The first step then is to establish whether there is a link between local area level radiation dose received and the list of illnesses recorded in the ULMS. The second step is to see whether radiation dose itself is correlated with other observable socio-economic outcomes over the next twenty years. Finally we look to use whether local area level radiation dosage can be considered as an instrument for the effect of health on a range of labour market and income generating outcomes that are important for daily life in Ukraine.
We then proceed to look whether knowledge of radiation dosage can help identify the causal effect of health on labour market performance. Better health may allow better quality of education and productivity at work. Equally, better education may facilitate better health. As such it has long been known that OLS estimation of the effects of poor health on economic performance would tend to be biased down if there is a negative correlation between unobservables that determine productivity at work and poor health.6 Strauss and Thomas (1998) suggested that local environmental conditions can act as a potential instrument for health, since conditional on health, individual productivity and performance should not be affected by environmental conditions.
Our results show that there is a significant positive effect of residence in radiation affected areas at the time of the accident and self-assessed poor health. Adults living in areas considered to have received sufficiently high radiation fallout as to be continually monitored are up to 10 percentage points more likely to report being in poor health. However, there is a less obvious manifestation of such an effect on a variety of specific self-reported health conditions, measures of obesity or height. Taken together, these results therefore suggest that the most common association between Chernobyl and health related outcomes some twenty years later appears to be manifesting itself mainly through a negative effect on the health perceptions of individuals now working age adults rather than through any of the other demonstrable health outcomes available in the data set. In the second half of the paper we explore whether area of residence at the time of Chernobyl affects labour market performance twenty years later. We also discuss whether area of residence (or radiation dosage) can be used as an instrument on health that would help us to pin down a causal effect of health on labour market performance.
The next section outlines the methodology used in this study along with details of the Chernobyl accident. Section 3 describes the data, while Section 4 discusses the results, namely the OLS estimates of the effect of exposure to Chernobyl on self-perceived measures of health measures and on the probability of working, the likelihood of home production of foodstuffs, of informal working, on hours worked and on wages. A final section concludes.
6 This would be offset by any measurement error in the measure of health.

4
2. Methodology If the environment is an input in an individual’s health production function, then an adverse environmental shock would be expected to affect health negatively, other things equal. The transmission of this negative shock could work directly, because of affects of radiation experienced while in utero, in childhood or as an adult. Equally there could be indirect effects of a shock because of effects of the accident on the provision of nutrition or education or the effect of poor health in other family members or subsequent interventions by the authorities. Similarly, environmental shocks may affect individual economic performance in the longer term either directly or indirectly through health, fertility, mobility or a range of other variables affected by the accident that also influence economic performance.
In what follows, we argue that exposure to radiation from Chernobyl constitutes an exogenous “treatment”. The treatment depends partly on the distance from the reactor - though not monotonically since there are several radiation “hotspots” at varying distances from the reactor caused by changes in the wind direction, differential rainfall levels and local topography across areas. In practice, the proxy for this treatment that we focus on is based on the local area radiation level exceeding a specific threshold. The treatment level may also depend on the individual’s age at the time of the accident. For example, children who were 0-4 years old at the time of the accident are known to have been particularly vulnerable to thyroid cancer from exposure to radioactive iodine. Indeed the rising incidence of thyroid cancer amongst children has been one of the main demonstrable health impacts of Chernobyl (WHO 2006). We use interaction terms in the estimates that follow to determine whether groups, such as young children, with high radiation exposure have different subsequent outcomes to other individuals in the same groups but with low exposure.
UNDP (2002) shows however that the range of radiation related illnesses is not restricted to cancers. Reports of lung diseases (bronchitis, emphysema), digestive and blood disorders, birth defects, immune deficiencies, fertility problems are all reported to be correlated with exposure to the irradiated areas7. Moreover, exposure to Chernobyl induced radiation can be chronic for many due to continued internal irradiation from consumption of foodstuffs grown in contaminated ground or from leakage of radio-nuclides into ground water from the “graveyards” used to store intermediate waste immediately after the disaster, but unmarked and untreated subsequently. In short, continued exposure to radiation and the long latency period of many of these illnesses suggest the potential existence of long-term “at-risk” populations in the affected areas.
Any study that tries to identify the effects of Chernobyl by comparing groups exposed to more radioactivity than others has to address possible confounding issues. The treatment may generate an endogenous response because, as with the Chernobyl disaster, governments put resources into the most affected areas and individuals (MNS 1991). It is true that the authorities did engage in environmental amelioration in heavily irradiated areas outside the immediate evacuation zone. Fesenko et al (2007) note, that restrictions on agricultural output imposed on the contaminated areas by the authorities may have reduced output and by extension labour market opportunities in some of the affected areas. The Ukrainian government did indeed enact a series of sliding scale interventions regarding compensation, pension, health, housing and education for those deemed to have undergone severe exposure to radiation, namely residents within the 30km evacuation zone around the plant, along with clean-up workers, (“liquidators”) and their immediate family. It is conceivable therefore that these interventions may have influenced the development of these areas, the movement of
7 See also Greenpeace (2006).

5
capital or labour in or out and, hence, the subsequent economic performance of the individuals residing in these areas, so influencing any outcome effects.
In short, it is possible that later-life outcomes may be affected by the subsequent interventions connected to the accident as well as the initial exogenous treatment. However the random pattern of radiation makes it less likely that fallout, for the majority of individuals, was concentrated in areas that had worse employment prospects relative to others. While the number of areas subject to active intervention and the populations therein are small, we can in principle identify these areas in our data.
There may also be concerns over sorting of individuals across high and low radiation areas. If those better able to react were concentrated in high radiation areas this may bias any Chernobyl effect on health downward. The rather random nature and control over residency makes sorting and residential choice before the event less likely, but it is true that individuals may have moved away from the irradiated areas after restrictions on mobility were relaxed following the fall of the Soviet Union in 1991. However this will only affect chronic exposure to radiation and not the initial exposure. If anything this will work to bias any health effects downward.
Comparing treatment effects across cohorts can be problematic because of the difficulty of separating the effect of the treatment from other events over time. However we do have area variation across any given cohort that should facilitate identification. In what follows we control for a variety of exclusion restrictions, individual and area characteristics in an effort to minimise these confounding effects. The use of longitudinal data may also allow us to control for unobservable effects that could otherwise bias the estimation process. Measuring fallout Radiation fallout from Chernobyl has been measured mainly (see Ministry of Emergencies of Ukraine 2006) by the presence of the two radioactive isotopes of most concern to the monitoring authorities – radioiodine (131I ) and radiocaesium-137 ( 137C ). The dispersion of these two isotopes was initially thought to be highly correlated geographically. However later work has shown that their relative dispersion does vary geographically, largely because of the relative concentrations of the two isotopes produced at the different stages of the leak from the reactor and changes in the daily weather patterns responsible for dispersing the fallout over the wider area, IAEA (2006). However since it has a half-life of only 8 days the population at risk is likely to vary from that exposed to 137C , which has a half-live of around 30 years and as such carries a more persistent legacy. Young children were thought to be particularly at risk of developing thyroid problems following exposure to 131I, found initially in the air and then in contaminated milk and other foodstuffs . Consequently, and also because of the fact that its persistence makes it easier to measure, 1986 area-level concentrations of the 137C isotope form the basis of the radiation dosage that we use in our analysis. This is the only measure of radiation deposits that is available both nationally and at local area level for the year 1986. The principal source for the radiation dose each local area is estimated to have received at the time of the accident is the atlas compiled by the European Commission (1998). This provides detailed “contour maps” of 137C deposits in May 1986 for each country in Europe, based on measurements conducted by national authorities shortly after the accident.
Background levels of 137C in the region before the accident, principally the legacy of nuclear weapons testing by the Soviets in neighbouring Kazakhstan after the Second World War, were estimated at 2 kilo Becquerel (kBq/m3). Almost all areas of Ukraine received Chernobyl-related radiation doses in excess of levels observed before the accident, (see Table 1 for the ULMS sample estimates). Areas where exposure levels to 137C were in excess of 1480 kBq/m3 were subject to immediate evacuation.

6
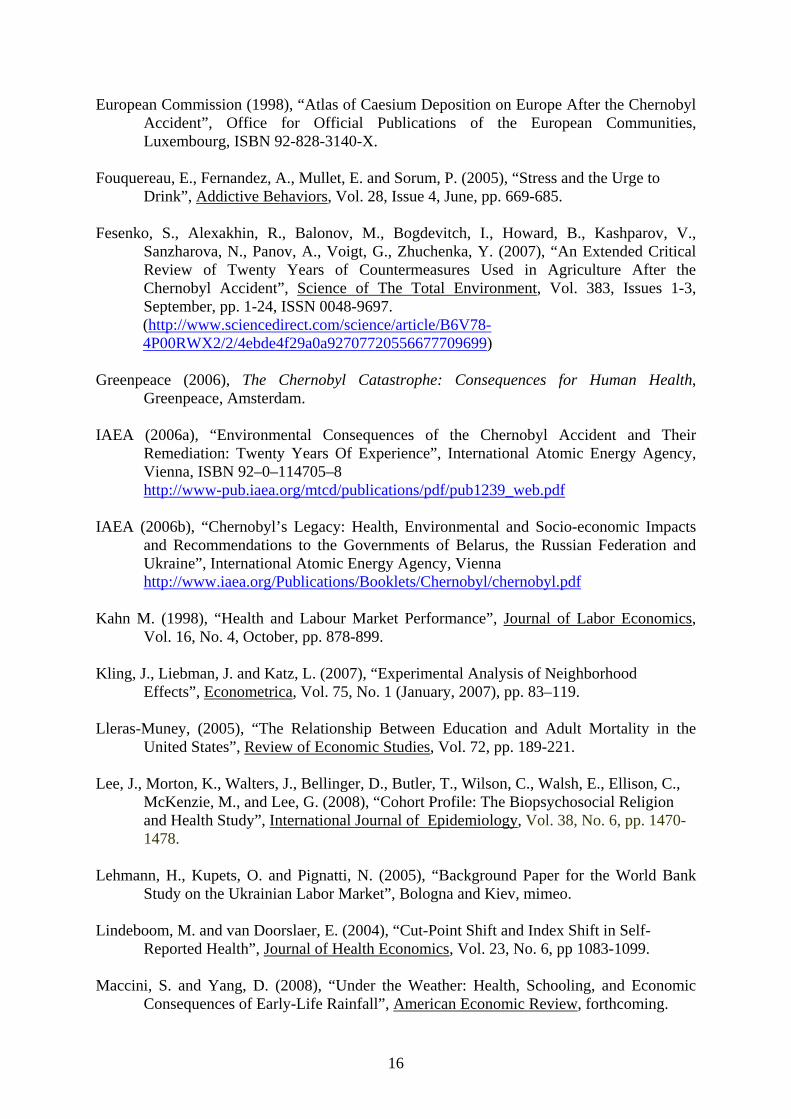
Following the accident, changes in wind direction, wind speed, local rainfall, allied to the degree of forestation, urbanisation and topography in the locality all contributed to the variation in fallout as documented by the pattern of 137C deposits in Figure 1. This pattern of dispersal was rather random, making it less likely that radiation was concentrated in areas of worse economic performance. If anything, the fact that many of the affected areas are in the vicinity of Kiev where all measures of labour market performance are far better than in the rest of the country (Lehmann, Kupets and Pignatti 2005) would suggest the opposite. Nevertheless, Figure 2 makes clear that exposure to fallout was rather more random than a simple measure of distance from Chernobyl would suggest.
Some 50,000 individuals living in Pripyat, the town next to the Chernobyl plant, were evacuated within a week of the accident. A further 70,000 inhabitants within areas of the 3 Soviet Union territories with radiation greater than 1480 kBq/m3 were evacuated within two months of the accident, (IAEA (2006), UNDP (2002), WHO(2006)). The majority of evacuees were sent to Kiev, Zhitomir and Chernigov, areas which themselves had received much lower, but non-negligible, radiation doses. Individuals resident in other “highly contaminated territories” – those that received between 555 and 1480 kBq/m3 - were not moved to purpose built towns such as Slavutich until after 1986 (IAEA 2006a), which because of the pattern of disposition were again also contaminated by (lower but significant levels of ) fallout from Chernobyl. It is this population and these areas that were eligible for government assistance. However, even exposure in excess of 37 kBq/m3 was considered to be of radiological significance (IAEA 2006) and areas of contamination that received such dosages were subject to monitoring by the Soviet Authorities and continued to be so by the Ukrainian successor governments (European Commission 1998).
In total, government assistance schemes were targeted at an estimated 800,000 adults, comprising “liquidators” – often military conscripts, but sometimes volunteers from within the emergency services – who were involved in the clean-up process, the Chernobyl plant workers, the evacuees from the 30km exclusion zone, those living in highly contaminated territories and any children of these adult populations. The liquidators and plant workers were the group estimated to be exposed to the highest radiation dosages, followed by the inhabitants of the 30km exclusion zone, (IAEA 2006a). We can, in principle, separate out these different groups in the data.
Since 1986 it has become apparent that radiation dosages have fluctuated both across and within areas over time because of differences in topography or climate.8 As a result some areas where the initial dosage was relatively light have received larger cumulative dosages than areas where the initial exposure was relatively high. Its particular concentration in forested areas has consequences for those consuming mushrooms, berries and game taken from contaminated areas.9 Potential health risks, over and above background radiation from direct exposure to the radiation cloud, include continued inhalation/consumption of contaminated particles/foodstuffs, consumption of forest food and time spent outdoors. In short, continued exposure to radiation and the long latency period of many of these illnesses suggest the existence of potential long-term “at-risk” populations. Our measure of radiation might be thought of as intending to capture exposure to a combination of these acute and chronic effects.
8 Effective radiation doses are measured in millisieverts, (mSv). The average annual worldwide dose of background radiation is around 2.4mSv (IAEA (2006)). The IAEA estimates that liquidators received accumulated doses of around 100mSV over three years and residents of the monitored areas received, on average, between 10-30 mSV over twenty years. This represents an annual effective radiation dose around 1mSV over and above normal background doses. 9 The cumulative doses are only measured in the designated contaminated zones and not elsewhere, IAEA (2006) making it difficult to separate out potential different radiation related influences.

7
3. Data We use in our analysis the 2003, 2004 and 2007 waves of the Ukrainian Longitudinal Monitor Survey (ULMS), a longitudinal survey of initially 4,300 households and approximately 8,800 individuals aged 16 and over, undertaken for the first time in the spring of 2003.10 As far as we are aware, these are the only available individual data for any country that allow us to measure both contemporaneous health outcomes and personal characteristics along with the individual’s location in 1986. A household questionnaire contains items on the demographic structure of the household, its income and expenditure patterns together with living conditions. An individual questionnaire elicits detailed information concerning both the labour market experience of workers in Ukraine and on, self-defined, health status and specific health conditions, height and weight.11
Alongside detailed socio-demographic and income information, the ULMS data also contain responses to a basic question on health status which appears in all surveys “How would you evaluate your health?”, to which the possible responses are: very good, good, average, and bad. There is a long-standing debate about the efficacy of using self-reported health measures, particularly ordinal variables which purport to measure an individual’s overall perception of their health. Issues of comparability of subjective measures across individuals abound alongside the “justification” hypothesis that sees these variables as rationalisations for a given economic status, such as absence from work. There is however longstanding evidence to suggest that self-reported health is related to subsequent health outcomes (Mossey and Shapiro 1982). Furthermore, IAEA (2006a) suggests that the psychological rather than the physical legacy of Chernobyl may ultimately be more important. In this way the determinants of self-reported health status may be a relevant variable to examine.
Individuals could have been exposed to radioactive material from the accident through a combination of external and internal dosages from the radiation cloud itself and from subsequent external and internal dosages from contaminated surfaces and foodstuffs, IAEA (2006). Conditions known to be associated with radiation exposure include cancers, birth defects, heart disease, respiratory illness, digestive problems and cognitive development, WHO (2006). The ULMS asks individuals to report whether they have any of fourteen specific health conditions,12 together with an assessment of whether they have had any health problems in the last 3 months. Some of these conditions will be more or less associated with the health outcomes known to be correlated to radiation exposure. We let the empirical estimation indicate which conditions, if any, appear to be associated with exposure to Chernobyl induced radiation. In addition it is conceivable that risk-inducing activity may be exacerbated by exposure, perceived or real, to a threat of radiation. Activities like obesity, drinking or smoking may be outcomes that could be associated with stress responses brought on by exposure (or perception of exposure) to radiation over and above that of the control group living in other areas.13 We therefore add measures of drinking, smoking and obesity alongside the self-reported health status measures.
10 This constitutes a 0.02% sample of the adult population of 40 million. Information on the number, age and gender of all children under 16 in the household is also contained in the ULMS. 11 See Table 4 for the full set of self-reported conditions available in the survey. Baker et al. (2004) offer evidence to suggest that specific self-reported health conditions suffer from much the same measurement error and justification biases as self-reported overall health. 12 The conditions are heart problems, a heart attack, kidney, gastro-intestinal, spine, tuberculosis, diabetes, blood pressure, stroke, anaemia or “other”. 13 On smoking as a possible response to stress events see for example McKee, Maciejewski, Falba and Mazure (2003). On alcohol see for example, Fouquereau, Fernandez, Mullet and Sorum (2003).

8
With regard to Chernobyl, there is a question in the 2003 ULMS which asks respondents where they were living in December 1986, the year of the Chernobyl disaster. The responses allow us to pinpoint the location to the nearest village. Some 760 settlements are identified among the list of responses.14 Given this information we can map in the radiation dose the settlement is estimated to have received by May 1986 according to data compiled by the European Commission (1998). While there has been continued monitoring of radiation levels in the evacuation areas, since the time of the accident to the preset, there have been no national (or international) surveys, after this time that would allow us to map local area residence to changing levels of radioactivity. This precludes an analysis of changes in health outcomes across areas with differential changes in radiation levels.15 Our use of 1986 local area radiation levels is, however, exogenous to any subsequent radiation-induced location changes.
There may be non-linearities in health outcomes and individual responses by dosage. As discussed above there are also area-level radiation thresholds that trigger different levels of interventions by the authorities. We therefore also generate dummy variables to group radiation dosages into very high (in excess of 37 137C kBq/m3) and the rest.16 We can also identify individuals living in the monitoring zones at the time of the accident and generate a dummy variable to denote residence in these areas in 1986. We also compute a variable measuring the linear distance of the 1986 settlement from Chernobyl.
Since we only have information from December 1986, we miss sampling the area of residence of the estimated 50,000 or so residents who were living within 30km of the plant and who were evacuated before the end of 1986, (IAEA 2006a). However residence in the Soviet Union was strictly controlled and as such it is unlikely that other individuals could have moved without permission from the authorities. Nevertheless, the behaviour of the group subject to evacuation and subsequent attempts at compensation, may be different from those not evacuated, it is important that we can isolate the two groups in our data set. For example, it is known that special treatment was given to both evacuees and liquidators including extra schooling, welfare supplements, additional health care checks and assisted holidays, (Ministry Of Ukraine of Emergencies (2006)) all of which may affect subsequent outcomes of interest. To help address these issues, the 2007 wave of the ULMS does contain information that allows us to identify anyone who was evacuated because of Chernobyl and whether this was in 1986 or later. We can therefore separate out 1986 evacuees from others in the data, though as we show in Table 1, the sample numbers are small.
Similarly we can identify the liquidators, for whom area of residence at the time of Chernobyl is less important than the radiation dose they received as a consequence of the clean-up operations. Again, the sample sizes for this group and that of their offspring are too small for separate behavioural analysis using anything other than a dummy variable control. We can also identify those in receipt of “Chernobyl assistance” welfare payments. The proportion of the sample in receipt of this payment is less than 1 per cent, the majority of whom are evacuees or liquidators. Because of concerns that these groups will confound the analysis we separate out from the sample those we know to have been on military service, liquidators, Chernobyl pensioners or who were evacuated in 1986. 17 The data is however 14 This includes residence outside the Ukraine. Some 5% of the adult sample were living outside the boundaries of present-day Ukraine in 1986. 15 There is some information IAEA (2006) on the cumulative dosage, taken at discrete intervals, for certain areas at the level of the raion, the next level of area aggregation up, akin to a local authority government. However this is not available for every raion in Ukraine only those subject to monitoring by the authorities. 16 Note that the 1986 dosage variable is by construction time invariant. 17 The correlation between poor health and Chernobyl pension receipt is negative and that between poor health and liquidator status is positive. The median, tenth and ninetieth percentiles of the age distribution are not statistically significantly different across the contaminated and other zones.

9
subject to any survivor bias that may be caused by early deaths in the contaminated zones. A recent United Nations backed report (IAEA 2006b) estimated that the number of extra deaths resulting from Chernobyl across Ukraine, Belarus and Russia at 4000. While this number is disputed, (Greenpeace 2006), it, nevertheless, seems unlikely that survivor bias will influence our results unduly. While though there is no way to identify reasons for attrition in the data, attrition from the panel does not appear to be associated significantly with residence in the contaminated zone, (see Table A7).
We then observe these individuals and their children 17 to 21 years later and examine their circumstances conditional on the radiation dose received around the time in which they were living at the time of the accident. Since the young, and those in the womb appear to be more vulnerable to radiation exposure, (Almond et al, 2009), we can interact the dosage with age at the time of the accident. We can, in principle, identify those who were in utero at the time of the accident, but the sample size for this group is small (144 and just 11 in the monitored raions) and the set of labour market related potential outcomes that can be measured is limited given that none of these children will have graduated from high school by 2003. Instead we focus on the adult population as a whole, in particular those of prime age since we are interested in the association between health, the accident and labour market outcomes. Since, as we show below, self-reported poor health rises with age, those who were younger at the time of the accident may be less likely to report poor-health twenty years later than those who were adults at the time. We therefore also look to see whether individuals who were children living in the affected areas at the time of the accident have different health outcomes either to adults in the affected areas or to those who children at the time living in less affected areas.
Table 1 documents the dispersion of estimated dosages. Most individuals in the sample (66%) were living in areas that received an (immediate) dose of less than 10 kBq/m3 of 137C. The median settlement-level dosage is 7 kBq/m3. Just over 4% of the sample was resident in areas that exceeded the 37kBq/m3 monitoring threshold and 8% were resident in the monitor zones. Around 22% of adults in the sample and some 17% of the working age adults say that they are in poor health. These estimates are very high compared to those from the industrialised West. The persistence of the poor health variable is outlined in Tables A1 and A2 of the appendix. While the proportion reporting poor health is quite stable over time, the persistence of poor health status is somewhat lower. Around 50% of the sample report being in poor health in two successive waves and around 40% are in poor health in both 2003 and 2007. Most of those initially in poor health in the 2003 wave who report a change in status move into the average health category, though, interestingly, the reverse movement does not appear to hold over time.
The labour market related data contained in the ULMS also allow us to observe whether an individual is in employment, the number of weekly hours worked, the log of monthly wages and whether the individual is engaged in growing foodstuff for consumption.18 Mean values of these and some of the other covariates used as controls in the analysis are also given in Table 1. Around 60% of the prime age adult sample is in work and working, on average, some 41 hours a week. Around 38% of the working age sample are engaged in production of own foodstuffs, indicative of the legacy of the transition economy on individual activity. Around 3% of the sample work in the informal sector. Some 0.8% of the sample of adults in 2003 appear as liquidators and 0.6% of the sample classify themselves as evacuees.19 18 We make no attempt to control for the effect of wage arrears on monthly wages. There is no evidence from our data that living in the contaminated zone is correlated with the 12% incidence of wage arrears among those in work. 19 0.2% of the sample were evacuated in 1986.

10
4. Results We begin by examining whether there is a link between self-reported poor health and earlier Chernobyl-related radiation exposure. Table 2 gives probit marginal effects estimates of the effect on a binary outcome variable, self-reported poor health, of five different Chernobyl-related variables – a measure of the distance in kilometres of the 1986 settlement from the Chernobyl reactor, a dummy variable for 1986 residence in a settlement within 110 kilometres of the reactor, settlement level dosage, a dummy variable for residence in an area where the dosage exceeds the 37KbQm2 threshold, and a dummy variable for residence in a designated contaminated area. The distance and monitor zone dummy variables both contain around 7% of the sample. Each estimate is net of a set of controls, all known correlates with health, that consist of a quadratic in age, dummies for educational attainment of both the individual and that of their parents, controls for gender, ethnicity, whether the individual is left handed, foreign language proficiency and religion. 20 Left-handedness has been associated in the medical and epidemiological literatures with higher rates of breast cancer, (Ramadhani et al 2005) mental illness, and early menopause. Language proficiency is used as a control for otherwise unobserved characteristics that may be correlated with health, access to health care or work related outcomes. Religious practice is also known to be associated with more positive health outcomes (Lee et al. (2008) and greater measured well-being (Clark and Lelkes (2008)).
To account for any systematic area effects that may be correlated with the pattern of fallout and area economic performance, there are also dummy variables for current residence in the capital, its outlying oblast and residence in the south, east and west of the country.21 The top panel presents estimates for the first year of the survey, 2003 and the bottom panel gives the estimates from a random effects regression for the pooled three year sample. Since the radiation dosage variables we have are, by construction, fixed at their 1986 values over time, we are obliged to use random effects probit estimation to control for unobserved heterogeneity outcomes on our dataset.22 Random effects estimation relies of course on an assumption of exogeneity with the regressors. We present estimates for all adults aged 16 and over and a set of prime-age adults, who have finished their education, aged 23 to 59.23 To reduce concerns regarding exposure versus assistance effects, the results exclude liquidators, evacuees and Chernobyl pension recipients.24
For both samples of adults, there is a significant positive association in 2003 between poor health and area level dosage – whether measured by settlement-level dosage, the dummy variable for residence in 1986 in a designated contaminated zone or by the dummy variable for residence in 1986 in areas that received in excess of 37 137C kBq/m3. The effects are strongest for the designated contaminated zone dummy and for prime age adults. The estimated coefficient on the dosage variable suggests that residence in an area that received 70KBqm3 – the top 5th percentile of dosage – would be some 6 points more likely to report 20 The point estimates on the radiation variables are not very sensitive to changes in the control set vector, which again suggests that the observable characteristics of those living in the contaminated zones was not very different from those living elsewhere. 21 The default region is therefore the North excluding Kyiv. 22 For the non-binary outcome variables we use OLS in the cross-section estimates and GLS random effects in the panel estimates. Fixed effects estimation, in our dataset, could only allow identification of any change in the effect over the sample period– produced by an interaction term of dosage and sample year - not the dosage level effect. 23 The official retirement age for pension receipt in the Ukraine is 55 for women and 60 for men, though individuals in certain occupations can retire earlier than this. 24 We also exclude anyone who was living in an area that received in excess of 1500 B qm3, who should have been subject to evacuation in 1986. In practice this is a sub-set of the sample of evacuees.

11
being in poor health than someone living in an area that received a zero dosage. Prime age adults living in a monitored raion in 1986 were some twelve percentage points more likely to report being in poor health in 2003 than those who were living elsewhere in 1986.25 The pooled random effects estimates of the Chernobyl variables are still positive and significant, particularly for the prime age sample, but somewhat attenuated. Interactions of time with the radiation variable, available on request, confirm that the positive effect is attenuated over time. This attenuation does not come about because the incidence of poor health falls in the sample population, since this is broadly stable between 2003 and 2007. Instead, sample respondents change their self-reported health status frequently, notably from self-reported bad to average health for those initially in bad health, (see Table A2 in the appendix), and this seems to underlie the attenuation effect. The measures of distance from the Chernobyl plant are generally less strongly associated with self-declared poor health. The 110 km distance dummy variable is significant for the prime age sample in the cross-section, but becomes insignificant in the panel.26 Table A3 in the appendix gives estimates when the liquidators, evacuees and Chernobyl welfare recipients are included in the sample. Liquidators, the group exposed to most radiation at the time of the accident, aside from those working at the plant on the day, are significantly more likely to report being in poor health than other groups in the data. The point estimates suggest liquidators are around 17 percentage points more likely to report being in poor health than others living outside the monitoring-zones at the time of the accident. The results for the other groups most directly affected by the accident and its aftermath are poorly determined. The central findings with respect to 1986 residence in contaminated areas are, however, unchanged when these additional groups are included.
There may of course be heterogeneity around these average estimates. The dispersal of the fallout was such that different groups of the population were exposed to different levels of radiation that varied by geography, population density and age. Table 3 therefore reports the results from adding interactions of different variables with the Chernobyl area radiation measure to the model. Since there are documented medical conditions among those who were children at the time of the accident, the first column reports the results from the interaction of the monitoring zone dummy with a dummy variable indicating whether the individual was less that thirteen at the time of the accident. The results suggest that this sub-group, now in their twenties, are significantly less likely, around 9 percentage points in the panel, to report being in poor health than others living in the radiated areas at the time. The sum of the point estimates on the monitor zone dummy and the interaction term in the panel estimates of column 2 are also negative, suggesting that there is little difference in self-reported health among those who were young children at the time of the accident, irrespective of the radiation dosage received in the 1986 area of residence. The average poor health share gap for those who were adults at the time living in and outside the contaminated areas is, according to the panel estimates, some 7.5 points. The interactions of the contaminated zone dummy with a quadratic in age, (columns 3 to 4), while confirming that self-reported poor health rises with age, do not suggest that differences in perception of poor health between those in and those outside the contaminated zones at the time of the accident vary with age.
25 The full set of covariate estimates are given in Table A6 in the appendix. The estimates for different working age samples , available on request, lie between the estimates for 16+ and ages 23-59. 26 If we classify individuals who report “average” alongside those who report “poor” health, then the significant radiation area effect goes away in the regression estimates. If we include both the monitor and distance dummies together in the same regression, the monitor dummy is always positive and statistically significant and the distance dummy statistically insignificant. If we include both the contaminated and distance dummies together in the same regression, both the monitor dummy and the distance dummy are positive and statistically significant, but the point estimate on the monitoring zone dummy is larger.

12
Individuals living in contaminated zones at the time of the accident may not have remained there forever. Although everyone in one area will have received, broadly, the same radiation dose at the time of the accident, lifetime exposure will depend, among other things, on length of residence in the contaminated area. While the data do give a complete set of residential moves over the period there are no disaggregated area-level time series data on levels of radiation with which to map to subsequent location. We therefore generate a single dummy variable for any change of residence and interact this with the Chernobyl variable. The results are given in the last two columns of Table 3 and show no significant difference in the reporting of poor health status between movers and stayers. Other results, not shown here, indicate that there are no differential effects of the Chernobyl-related variable if the sample is split by distance from Chernobyl, rural or urban location, level of educational attainment or by gender.27 Other health outcomes Tables 4a and 4b replace the self-reported poor health dependent variable with the set of other health conditions identifiable in the ULMS data set, using the same controls as in Table 2. We also add measures of height, BMI, smoking and drinking behaviour to the set of outcome variables. Once again we present estimates from the first cross-section of the survey and from the pooled three year random effects model. Each entry in the Table represents the coefficient on residence in the contaminated zone from a regression on the outcome given. Without exception the estimates for the radiation related variable are statistically insignificant in the 2003 cross-section.28 Since it may be argued that the self-reported poor health variable is proxying an accumulation of illnesses rather than a single complaint, we check to see whether the contaminated zone variable is associated with proxies for the aggregation of the set of illnesses in the data.29 Again we find no significant effect of residence whether the outcome variable is “any health problems” or when we add all the health conditions from heart problems to tuberculosis. Nor does obesity, being underweight, BMI, drinking or smoking seem to be related to the Chernobyl variables.
The random effects estimates however do give a significant positive effect of residence in the contaminated zone on anaemia and gastro-intestinal illness and a significant negative effect on heart disease. In order to check the robustness of these results we repeat the random effects estimation for heart disease, anaemia and gastro-intestinal illness using the other radiation-related measures reported in Table 2. The results, given in Table A4, show no significant association when these other radiation measures are used. However Table A5 shows that the liquidators are significantly more likely to report experiencing a variety of specific health conditions, relative to the rest of the sample population. If the random effects estimation allows for the effects of unobserveables that may be correlated any self-selection into this group caused by there being volunteers among the liquidators, then it seems that there may be demonstrable health effects for this group that arise from the consequences of the accident.
Taken together however, these results therefore suggest that the most common association between Chernobyl and health related outcomes some twenty years later appears 27 Results for other sample splits are available on request. 28 In work done subsequent to this study, Danzer and Weisshaar (2009) report a significant negative association in a cross-section data between a measure of individual well-being and their 2003 assessment that “their health or that of a family member” had been affected by Chernobyl. 29 A similar strategy is used by Kling, Lieberman and Katz, (2007) in their analysis of long-term health effects following a random assignment of children across neighbourhoods with differing levels of economic performance. They find no physical health effects, but positive mental health effects of assignment to advantaged neighbourhoods.

13
to be manifesting itself mainly through a negative effect on the health perceptions of individuals now working age adults rather than through any of the other demonstrable health outcomes available in the data set.30 Reduced form estimation We next look to see whether experience of Chernobyl is associated with later life labour market outcomes and specifically whether individuals who were living in more contaminated areas in 1986 perform differently from those who were living in less contaminated areas. For the majority of individuals in our sample – since we exclude evacuees, liquidators and Chernobyl pensioners - it is unlikely that direct Chernobyl-related interventions by the state on education, income and health will underlie subsequent performance. Nevertheless, it is possible that the “health capital” of some individuals was affected by Chernobyl, even if through health perceptions, and this could be one possible channel affecting subsequent labour market performance.
Table 5 presents the results of the reduced form estimates, again both single cross-section and random effects, of the impact of Chernobyl-related radiation on employment, wages, hours of work, and the probabilities of being in informal work or of growing agricultural produce at home. We present estimates for both residence in a contaminated zone and residence in a designated monitoring area. In the 2003 cross-section, while the point estimates on the Chernobyl variables are generally of the expected sign, in the same direction as those for poor health in Table 2, the estimates are not always significant. There do appear to be statistically significant negative effects of residence in the contaminated zone on hours of work. Residents in these areas work around two to three hours less than others. The random effects estimates do show significant negative effects on the probability of being in work and on the likelihood of informal work in addition to the negative effects on hours revealed in the cross-section estimates. The panel estimates suggest that residents living in the affected areas in 1986 are some six to seven percentage points less likely to be in work and around 3 percentage points less likely to be engaged in informal activities than those living elsewhere at the time of the accident.
Having set out the estimates of the direct effect of Chernobyl-related residence on labour market performance, we next look to see whether radiation-related variables are associated with other known potential correlates of labour market performance. If we are to consider using radiation exposure either as in instrument for self-reported poor health in an employment or wage equation or to identify the causal channel of residence in a contaminated area, it is helpful to try to establish that self-reported health is the main effect through which radiation exposure would affect labour supply or wages, since it could conceivably affect other variables known to be associated with labour market performance such as fertility, marital status or education.31 Any correlation between the intended instrument and these other potential explanatory factors may compromise the validity of the identification exercise.
To this end, Table 6 presents the estimated effects of residence in the contaminated zone in 1986 on educational attainment, number of children, marital status and mobility history for 2003 and for the panel from 2003 to 2007. There is no evidence that residence in the contaminated zone is associated significantly with marital status, educational attainment
30 Another instance of perception appearing to influence behaviour despite the absence of widespread real health effects can be found in Anderberg, Chevalier and Wadsworth (2011). They show that increased fears over the perceived safety of the MMR vaccine in the UK appear to be associated with reductions in infant vaccination rates, despite the source of the vaccine scare being subsequently discredited. 31 The OLS estimates of self-reported bad health in both employment and wage equations using our sample are negative and significant.

14
or number of children. However residence in the contaminated zone, but not in the high dosage areas, does appear to be negatively associated with subsequent mobility, both any move, and between-region mobility. This suggests that individuals are therefore not moving away from any perceived danger, rather the contrary. Indeed the system of residential control imposed under Soviet times would render it highly unlikely that individuals could have moved without permission from the authorities. As such the documented evacuations are the only major sources of mobility likely to have been undertaken in the first few years following the accident at Chernobyl.32
This latter result suggests that the Chernobyl-variable may be influencing average behaviour not just through its apparent effect on the health perception of the working age population. The fact that the dummy variable related to radiation dosage does not only work through the channel of self-perceived health but also through the channel of subsequent mobility renders IV regressions of labour market outcomes on our health measure problematic. Consequently, we limit our analysis of the long-term effects of the Chernobyl accident on labour market outcomes to the reduced form estimations. 5. Conclusion The evidence presented above appears to suggest that the Chernobyl accident carries a long lasting legacy for many residents of Ukraine, notably because of its effect on the perception of their health. One in six prime-age Ukrainian adults report being in poor health; a much higher figure than comparable estimates from many western industrialised countries. Adults living in areas considered to have received sufficiently high radiation fallout as to be continually monitored are up to 12 percentage points more likely to report being in poor health. However, there is a less obvious manifestation of such an effect on a variety specific other self-reported health conditions or risky behaviours. While the Chernobyl liquidators, much more exposed to radiation than other members of the population do appear to have experienced more long-term health problems, it seems that the main long-term health effect of Chernobyl for the majority of the current adult population may be working through perceptions.
There do appear to be significant associations with Chernobyl related residence and subsequent labour market performance. There is also some evidence to suggest that those more exposed to Chernobyl-induced radiation have significantly lower levels of labour market performance twenty years on. If residence in the monitoring zone works through health perceptions only this could be used to identify the effect of self-reported poor health on the probability of employment, wages or other activities that generate income and/or subsistence for the Ukrainian population. While there is also little evidence from the data used here that residence in a contaminated zone has influenced fertility, marriage behaviour or educational attainment, there is some evidence to suggest that mobility may be reduced among those living in areas that received higher doses of radiation in 1986. As such it may be harder to argue that poor health perception is the sole channel through which Chernobyl manifests itself.
32 The only significant predictor of mobility out of the contaminated areas among the list of covariates used in our health regressions is age, which indicates that older individuals were much less likely to leave the contaminated zones. Results are available on request.

15
References Almond, D. (2006), “Is the 1918 Influenza Pandemic Over? Long-Term Effects of In Utero
Influenza Exposure in the Post-1940 U.S. Population”, Journal of Political Economy, 2006, Vol. 114, No. 4, pp. 672-712.
Almond, D., Edlund, L. and Palme, M. (2009), “Chernobyl's Subclinical Legacy: Prenatal
Exposure to Radioactive Fallout And School Outcomes In Sweden”, Quarterly Journal of Economics, Vol. 124, No. 4 (November), pp. 1729–1772.
Anderberg, D., Chevalier, A. and Wadsworth, J. (2008) “Anatomy of a Health Scare:
Education, Income and the MMR Controversy in the UK”, forthcoming Journal of Health Economics.
Baker, M., Stabile. M. and Deri, C. (2004), “What Do Self-Reported, Objective, Measures of
Health Measure?”, Journal of Human Resources Vol. 39, No. 4 (Fall), pp. 1067-93. Baum, C., Schaffer, M. and Stillman, S. (2007), “Enhanced Routines for Instrumental
Variables/GMM Estimation and Testing”, CERT Discussion Paper No. 2007/06. Case, A., Fertig, A. and Paxson, C. (2004). “The Lasting Impact of Childhood Health and
Circumstances”, Center for Health and Wellbeing Discussion Paper, Princeton University, April.
Chay, K. and Greenstone, M. (2003), “The Impact of Air Pollution ion Infant Mortality:
Evidence from Geographic Variation in Pollution Shocks Induced by a Recession”, Quarterly Journal of Economics, Vol. 118, No. 3, August, pp. 1121-1167.
Chen, Y. and Zhou, L. (2007), “The Long-Term Health and Economic Consequences of the
1959-61 Famine in China”, Journal of Health Economics, Vol. 26, No. 4, pp. 659-681.
Clark, A. and Lelkes, O. (2009), “Let Us Pray. Religious Interactions in Life Satisfaction”,
Paris School of Economics Working Paper No. 2009-01. Currie, J. (2009), “Healthy Wealthy and Wise: Is there a Causal relationship Between Child
Health and Human Capital Development?”, Journal of Economic Literature, Vol. 47, No. 1, March, pp. 87-122.
Currie, J. and Madrian, B. (1999), “Health, Health Insurance and the Labor Market”, in O.
Ashenfelter and D. Card (eds.), Handbook of Labor Economics, Vol. 3c, Chapter 50, pp. 3309-3415.
Danzer, A. and Weisshaar, N. (2009), “The Long Run Consequences of the Chernobyl
Catastrophe on Subjective Well-Being and Health in Ukraine. Evidence from a New Panel Data Set”, EALE conference paper http://www.eale.nl/Conference2009/PapersE/Weisshaar.pdf
16
European Commission (1998), “Atlas of Caesium Deposition on Europe After the Chernobyl Accident”, Office for Official Publications of the European Communities, Luxembourg, ISBN 92-828-3140-X.
Fouquereau, E., Fernandez, A., Mullet, E. and Sorum, P. (2005), “Stress and the Urge to
Drink”, Addictive Behaviors, Vol. 28, Issue 4, June, pp. 669-685. Fesenko, S., Alexakhin, R., Balonov, M., Bogdevitch, I., Howard, B., Kashparov, V.,
Sanzharova, N., Panov, A., Voigt, G., Zhuchenka, Y. (2007), “An Extended Critical Review of Twenty Years of Countermeasures Used in Agriculture After the Chernobyl Accident”, Science of The Total Environment, Vol. 383, Issues 1-3, September, pp. 1-24, ISSN 0048-9697. (http://www.sciencedirect.com/science/article/B6V78-4P00RWX2/2/4ebde4f29a0a92707720556677709699)
Greenpeace (2006), The Chernobyl Catastrophe: Consequences for Human Health,
Greenpeace, Amsterdam. IAEA (2006a), “Environmental Consequences of the Chernobyl Accident and Their
Remediation: Twenty Years Of Experience”, International Atomic Energy Agency, Vienna, ISBN 92–0–114705–8 http://www-pub.iaea.org/mtcd/publications/pdf/pub1239_web.pdf
IAEA (2006b), “Chernobyl’s Legacy: Health, Environmental and Socio-economic Impacts
and Recommendations to the Governments of Belarus, the Russian Federation and Ukraine”, International Atomic Energy Agency, Vienna http://www.iaea.org/Publications/Booklets/Chernobyl/chernobyl.pdf
Kahn M. (1998), “Health and Labour Market Performance”, Journal of Labor Economics,
Vol. 16, No. 4, October, pp. 878-899. Kling, J., Liebman, J. and Katz, L. (2007), “Experimental Analysis of Neighborhood
Effects”, Econometrica, Vol. 75, No. 1 (January, 2007), pp. 83–119. Lleras-Muney, (2005), “The Relationship Between Education and Adult Mortality in the
United States”, Review of Economic Studies, Vol. 72, pp. 189-221. Lee, J., Morton, K., Walters, J., Bellinger, D., Butler, T., Wilson, C., Walsh, E., Ellison, C.,
McKenzie, M., and Lee, G. (2008), “Cohort Profile: The Biopsychosocial Religion and Health Study”, International Journal of Epidemiology, Vol. 38, No. 6, pp. 1470-1478.
Lehmann, H., Kupets, O. and Pignatti, N. (2005), “Background Paper for the World Bank
Study on the Ukrainian Labor Market”, Bologna and Kiev, mimeo. Lindeboom, M. and van Doorslaer, E. (2004), “Cut-Point Shift and Index Shift in Self-
Reported Health”, Journal of Health Economics, Vol. 23, No. 6, pp 1083-1099. Maccini, S. and Yang, D. (2008), “Under the Weather: Health, Schooling, and Economic
Consequences of Early-Life Rainfall”, American Economic Review, forthcoming.

17
McKee, S., Maciejewski, P., Falba, T. and Mazure, C. (2003), “Sex Differences in the Effects of Stressful Life Events on Changes in Smoking Status”, Addiction, Vol. 98, No. 6, pp. 847–855.
Meng, X. and Qian, N. (2006), “The Long Run Health and Economic Consequences of
Famine on Survivors: Evidence from China’s Great Famine”, IZA Discussion Paper No. 2471.
Miguel, E. and Roland, G. (2006), “The Long-Run Impact of Bombing Vietnam”, NBER
Working Paper No. 11954. Ministry of Ukraine of Emergencies (2006), Twenty Years After Chernobyl Accident. Future
Outlook, Kiev, ISBN 966_326_172_2. MNS Ukraine (1991), On the Status and Social Protection of Citizens who Suffered from the
Chernobyl Disaster http://old.mns.gov.ua/showplaintext.php?/doc=laws/laws/zak796-XII
Mossey, J. and Shapiro, E. (1982), “Self-rated Health: A Predictor of Mortality Among the
Elderly”, American Journal of Public Health, Vol. 72, No. 8, pp. 800-808. Ramadhani, M., Elias S., van Noord P., Grobbee D., Peeters P. and Uiterwaal, C. (2005),
“Innate Left Handedness and Risk of Breast Cancer: Case-Cohort Study”, British Medical Journal, Vol. 331, October, pp. 882-883.
Rahu, M. (2003), “Health Effects of the Chernobyl Accident: Fears, Rumors, and the Truth”,
European Journal of Cancer, 39: 295-299. Strauss, J. and Thomas, D. (1998), “Health, Nutrition and Development”, Journal of
Economic Literature, Vol. 36, No. 2, June, pp. 766-817. UNDP (2002), The Human Consequences of the Chernobyl Nuclear Accident WHO (2006), “Health Effects of the Chernobyl Accident and Special Health Care
Programmes”, WHO, Geneva, ISBN 978 92 4 159417 2.

18
Figure 1. Distribution of Radiation Fallout Across Ukraine, April 1986
Source: Office for Official Publication of the European Community 2001.
19
Figure 2: Settlement –Level Initial Dosage (137C k/Bq m3) ULMS Sample
020
4060
8010
012
014
0D
osag
e 13
7C k
Bq/
m3
0 200 400 600 800 1000Distance fromChernobyl (Km)

20
Table 1: Sample Means of Local Area Radiation Dosage and Individual Characteristics, 2003 Percent Percent Dosage 137C kBq/m3 <4 22.2 In Work (Age 16+) 42.9 4-10 46.2 In Work (Age 23-59) 66.1 11-34 27.4 35-99 3.7 In Bad Health (Age 16+) 22.1 99+ 0.5 In Bad Health (Age 23-59) 16.9 Monitor Area 7.5 Actual Weekly Hours>=0 26.2 (22.6) Monitor Area*Age<13
2.2 Actual Weekly Hours>0 41.8 (12.9)
Liquidator 0.8 Evacuee 0.6 Gross Monthly Wage (Hrv) 309 (220) Female 56.8 Informal Work 3.4 Self Employed 5.3 Age 16-24 17.9 Own agricultural prodn. 38.2 Age 25-44 33.7 Age 45-60 27.7 Age 61+ 20.7 Mother_graduate 8.2 Mother_High school 29.2 Kyiv 5.0 Father_graduate 9.8 Father_ high school 28.1 University 12.8 Technical Diploma 40.0 Orthodox 61.6 High School 18.5 Other religion 19.3 Russian 16.7 Bilingual 73.8 Other 3.8 Note: Sample ULMS 2003. Standard errors in brackets.

21
Table 2: Self-Reported “Bad” Health and Chernobyl Exposure Age 16+ Age 23-59 1 2 3 4 5 1 2 3 4 5 2003 Distance in 1986 (100 Km)
-0.00055 (0.00096)
-0.00028 (0.00095)
Distance in 1986 <110KM
0.040 (0.032)
0.082 (0.041)*
Dosage (KBqm2)
0.00055 (0.00029)
0.00078 (0.00030)*
Area Dosage>37 KBqm2
0.061 (0.025)*
0.079 (0.031)*
Monitor Area 1986
0.085 (0.025)*
0.128 (0.033)*
Random Effects
Distance (100 Km)
-0.00075 (0.00065)
-0.0001 (0.0005)
Distance in 1986 <110KM
0.010 (0.020)
0.028 (0.023)
Dosage (KBqm2)
0.00042 (0.00018)*
0.00068 (0.00020)*
Area Dosage>37 KBqm2
0.036 (0.017)*
0.058 (0.018)*
Monitor Area 1986
0.036 (0.015)*
0.066 (0.017)*
Source: ULMS. Notes: Each regression controls for age, gender, religion, education, education of parents, ethnicity and region. Pooled data are random effects probit estimates. *= significant at the 5% level. Standard errors on distance and dosage clustered at settlement level. Sample sizes are 8363 Age 16+ 2003, 5286 Age 23-59 2003, 19257 age 16+ panel, 12363 age 23-59 panel. Binary outcomes estimated using probit (levels) or random effects probit (panel). Marginal effects evaluated at the mean of the independent variables are given in the Table. Bootstrapped standard errors on the panel estimates.

22
Table 3: Estimated Effects on Poor Health by Sub-Group (marginal effects) 2003 Panel 2003 Panel 2003 Panel 1 2 3 4 5 6 Monitor Area_1986
0.137 0.076 Monitor Area
-0.155 -0.148 Monitor Area
0.141 0.065
(0.034)*
(0.020)*
(0.073)*
(0.058)*
(0.037)*
(0.020)*
Monitor Area *Under 13 in 1986
-0.069 -0.079 Monitor Area *Age
0.020 0.017 Monitor Area *Moved since 1987
-0.036 0.022 (0.043)
(0.030)*
(0.017) (0.012) (0.036) (0.044)
Under 13 in 1986
0.006 0.047 Monitor Area *Age2
-0.00023
-0.0002 Moved since 1987
-0.008 -0.015
(0.031)
(0.023)*
(0.00019)
(0.0002)
(0.011) (0.011)
Source: ULMS. Notes: Sample Age 23-59. See Table 2. Regressions include same controls as in Table 2. Interaction terms adjusted to account for cross-partial derivative in non-linear models.

23
Table 4: Probit Estimates of Health Conditions and Chernobyl Exposure 2003 (Age 23-59) Health
Status (1=v. good, 5=poor)
Any health problems in last 3 months
Heart problems
Heart Attack
Lung Liver
Monitor Area_1986
0.045 0.025 -0.035 0.001 0.006 0.010
(0.048) (0.035) (0.018) (0.002) (0.013) (0.017) Kidney Gastroint
estinal Spine Tuberculo
sis Diabetes Blood
Pressure Monitor Area_1986
0.022 0.039 0.008 0.002 0.007 -0.017
(0.019) (0.024) (0.021) (0.002) (0.007) (0.021) Stroke Anemia Other
∑=
.other
heartiihealth
Monitor Area_1986
0.007 0.007 0.013 0.100
(0.006) (0.008) (0.025) (0.080) Height
(cm) BMI Obese
(BMI>30) Underweight (BMI<19)
Monitor Area_1986
-0.004 0.032 0.003 0.014
(0.005) (0.324) (0.023) (0.011) Smoke Drink Amount
Drink Amount Smoke
Monitor Area_1986
-0.059 -0.023 0.002 -0.862
(0.031) (0.034) (0.112) (0.470) Source: ULMS. Notes: See Table 2. Sample restricted to ages 23-59. Means of dependent variables are 0.468 (any health problems), 0.327 (smoke), 0.667 (drink), 0.144 (heart problems), 0.051 (lung problems), 0.084 (liver), 0.074 (kidney), 0.131 (gastrointestinal), 0.119 (spine), 0.013 (diabetes), 0.168 (“other”), 0.010 (heart attack), 0.150 (blood pressure), 0.010 (stroke), 0.036 (anaemia), 0.006 (tuberculosis), , 25.5 (BMI), 1.69m (Height), 0.155 (obese), 0.041 (underweight).

24
Table 4b: Panel Random Effects Probit Estimates of Health Conditions and Chernobyl Exposure, 2003, 2004, 2007 (Age 23-59) Health
Status (1=v. good, 5=poor)
Any health problems in last 3 months
Heart Heart Attack
Lung Liver
Monitor Area_1986
-0.003 0.025 -0.032 -0.001 -0.010 0.005
(0.041) (0.023) (0.012)* (0.001) (0.007) (0.012) Kidney Gastroint
estinal Spine Tubercul
osis Diabetes Blood
Pressure Monitor Area_1986
0.019 0.035 -0.010 0.001 0.006 -0.031
(0.011) (0.015)* (0.013) (0.001) (0.005) (0.015)* Stroke Anaemia Other
∑=
.other
heartiihealth
Monitor Area_1986
0.004 0.009 0.014 0.070
(0.004) (0.004)* (0.017) (0.067) Height
(cm) BMI Obese
(BMI>30) Underweight (BMI<19)
Monitor Area_1986
-0.005 0.131 0.004 0.002
(0.004) (0.304) (0.017) (0.006) Smoke Drink Amount
Drink Amount Smoke
Monitor Area_1986
-0.041 -0.046 -0.008 -1.031
(0.023) (0.024) (0.100) (0.434)* Source: ULMS. Notes: See Table 2. Sample restricted to ages 23-59.

25
Table 5: Reduced Form Estimates of Residence in Contaminated Zone on Labour Market Outcomes (marginal effects) 2003 Pooled random effects, 2003, 4,
7 In Work Log Monthly
Wage In Work Log Monthly
Wage i) Area Dosage>37 KBqm2
-0.030 -0.050 -0.060 -0.048
(0.037) (0.054) (0.027)* (0.061) ii) Monitor Area_1986 -0.042 -0.041 -0.079 -0.052 (0.035) (0.049) (0.026)* (0.049) Hours>=0 Hours>0 Hours>=0 Hours>0i) Area Dosage>37 KBqm2
-2.177 -0.496 -3.298 -1.493
(1.641) (1.259) (1.323)* (0.941) ii) Monitor Area_1986 -3.478 -2.390 -4.244 -1.798 (1.379)* (0.888)* (1.201)* (0.787)* Informal
Work Growing Produce
Informal Work
Growing Produce
i) Area Dosage>37 KBqm2
-0.015 -0.011 -0.029 -0.032
(0.008) (0.036) (0.004)* (0.023) ii) Monitor Area_1986 -0.015 0.027 -0.025 -0.014 (0.007)* (0.036) (0.005)* (0.025) Source: ULMS. Notes; see Table 2. Sample restricted to ages 23-59. Sample restricted to ages 23-59. Sample sizes in 2003 are 5302 (total), 3041 (women), 2261 (men) for working age population, 2968 (total), 1611 (women), 1367 (men) for in work population. *= significant at the 5% level. Binary outcomes estimated using probit (levels) or random effects probit (panel). Explanatory variable of interest appears in column one. These alternative Chernobyl variables are used in separate regressions, not together. Controls as in Table 2. Marginal effects evaluated at the mean of the independent variables are given in the Table.

26
Table 6: Probit Estimates of Effect of Residence in Contaminated Zones on Other Outcomes (marginal effects) 2003 Pooled random effects, 2003, 4,
7 Single Divorced Single Divorced i) Area Dosage>37 KBqm2
-0.019 -0.005 -0.002 -0.015
(0.012) (0.019) (0.010) (0.010) ii) Monitor Area_1986 -0.010 0.034 -0.009 -0.007 (0.014) (0.021) (0.009) (0.009) No. of
Children Years of Education
No. of Children
Years of Education
ii) Area Dosage>37 KBqm2
0.078 -0.032 0.084 -0.006
(0.067) (0.070) (0.071) (0.096) iii) Monitor Area_1986 -0.015 -0.058 -0.063 0.052 (0.059) (0.061) (0.064) (0.092) Any Move Move region Any Move Move regionii) Area Dosage>37 KBqm2
-0.027 -0.016 0.015 -0.021
(0.036) (0.021) (0.013) (0.013) iii) Monitor Area_1986 -0.090 -0.048 -0.018 -0.024 (0.032)* (0.016)* (0.010) (0.010)* Source: ULMS. Notes: See Table 2. Sample restricted to ages 23-59.

27
Figure A1: Employment Rate by Age, Gender and Health Status, Ukraine 2003/4 0
.2.4
.6.8
rate
20 30 40 50 60 70 80AGE
Men Women
0.2
.4.6
.81
rate
20 30 40 50 60 70 80AgeMen
Other Poor Health
0.2
.4.6
.8ra
te
20 30 40 50 60 70 80Age
WomMen
Other Poor Health

28
Table A1: Self-reported Health Status 2003 Pooled Total male female Total male female All Adults Very Good 1.7 2.7 0.9 1.7 2.6 1.0 Good 22.6 30.0 17.1 23.2 29.9 18.4 Average 53.0 50.0 55.2 52.4 49.8 54.2 Bad 22.8 17.3 26.8 21.9 17.7 26.4 Age 23-59 Very Good 1.4 2.4 0.6 1.5 2.5 0.8 Good 23.7 32.2 17.3 25.2 32.6 19.9 Average 58.0 52.3 62.4 57.1 52.0 60.8 Bad 16.9 13.2 19.7 16.2 13.0 18.6 Source: ULMS. Table A2. Self-reported Health Across Waves Age 23-59 2004 2007 Very
Good Good Average Bad Very
Good Good Average Bad
Very Good
17.7 56.5 22.6 3.2 10.4 56.3 29.2 4.2
2003 Good 3.1 49.6 42.9 3.8 3.0 46.6 42.5 7.8 Average 0.5 17.4 71.6 10.3 0.8 20.8 63.1 15.2 Bad 0.4 3.5 44.4 51.0 0.3 8.5 41.3 42.2 Source: ULMS. Entries are estimated percentage in each cell.

29
Table A3: Probit Estimates of Self-Reported “Bad” Health and Chernobyl Exposure by Groups Age 16+ Age 23-59 2003 2003-2097
Panel 2003 2003-2097 Panel
Monitor Area in 1986
0.063 0.062 0.129 0.053
(0.017)** (0.004)** (0.033)** (0.021)** Liquidator 0.172 0.179 0.187 0.169 (0.036)** (0.003)** (0.066)** (0.045)** Evacuee 0.006 0.016 0.046 0.019 (0.033) (0.017) (0.064) (0.049) Chernobyl Benefits receipt
-0.032 -0.026 -0.084 -0.030
(0.031) (0.010)* (0.040)** (0.059) Controls Yes Yes Source: ULMS. Notes: See Table 2.

30
Table A4: Random Effects Probit Estimates of Chernobyl-Related Variables on Gastro-intestinal illness and Heart Disease (Age 23-59) Gastro-Intestinal 1 2 3 4 Distance (100 Km) 0.0018
(0.0007)*
Distance in 1986 <110KM
-0.002 (0.0017)
Dosage (KBqm2) 0.0001 (0.0002)
Area Dosage>37 KBqm2 0.001 (0.016)
Anaemia Distance (100 Km) 0.0001
(0.0002)
Distance in 1986 <110KM
-0.004 (0.003)
Dosage (KBqm2) 0.0001 (0.0002)
Area Dosage>37 KBqm2 0.001 (0.004)
Heart Problems Distance (100 Km) -0.0001
(0.0006)
Distance in 1986 <110KM
-0.028 (0.015)
Dosage (KBqm2) -0.0001 (0.0003)
Area Dosage>37 KBqm2 0.005 (0.016)
Source: ULMS. Notes: See Table 2. All regressions include same controls as in Table 2.

31
Table A5: Random effects Linear Probability Estimates of Health Conditions and Chernobyl Exposure Including Liquidators (Age 23-59) Health
Status (1=v good 5=v bad)
Any Health last 3 months
Heart Heart Attack
Lung Liver
2003, 2004, 2007
-0.001 0.003
Monitor Area -0.018 0.028 -0.032 (0.001) -0.010 (0.012) (0.041) (0.023) (0.012) 0.020 (0.007) 0.039 Liquidator 0.329 0.131 0.155 (0.010)* 0.003 (0.024) (0.082)** (0.051)* (0.041)* (0.017) Kidney Gastroint
estinal Spine Tuberculosi
s Diabetes
Blood Pressure
Monitor Area 0.018 0.035 -0.010 0.001 0.006 -0.028 (0.012) (0.017)* (0.012) (0.001) (0.005) (0.013)* Liquidator 0.018 0.025 0.165 0.001 0.051 0.115 (0.024) (0.031) (0.038)* (0.003) (0.029) (0.049)* Stroke Anaemia Other
∑=
.tuberc
heartiihealth
Height (cm)
BMI
Monitor Area 0.004 0.009 0.011 0.039 -0.008 0.305 (0.004) (0.005) (0.018) (0.069) (0.004)* (0.310) Liquidator 0.008 0.031 0.136 0.729 0.014 1.091 (0.008) (0.025) (0.036)* (0.191)** (0.008) (0.615) Obese
(BMI>30)
Underweight (BMI<19)
Drink Amount Drink
Amount Smoke
Monitor Area 0.012 0.002 -0.041 0.008 -0.873 (0.018) (0.005) (0.024) (0.111) (0.472) Liquidator 0.106 -0.016 0.017 0.110 -0.534 (0.043)* (0.002)* (0.051) (0.217) (1.015) Source: ULMS. Notes: See Table 2.

32
Table A6: Full Set of Linear Probability Estimates of Poor Health Bad Health Amount drunk Heart Problems Monitor zone in 1986 0.108 0.009 -0.039 (4.04)** (0.09) (1.74) AGE -0.004 -0.037 -0.010 (0.97) (1.91) (2.68)** AGE squared 0.001 0.001 0.001 (2.89)** (2.62)** (4.44)** Female 0.063 1.416 0.100 (6.31)** (28.92)** (11.19)** Russian 0.021 -0.204 0.006 (1.48) (3.01)** (0.47) Other ethnicity -0.019 0.100 0.010 (0.79) (0.81) (0.42) Orthodox 0.016 -0.015 0.038 (1.25) (0.24) (3.25)** Other religion 0.002 0.254 -0.003 (0.12) (3.03)** (0.22) Village -0.003 0.119 0.012 (0.22) (2.20)* (1.09) Kyiv -0.110 -0.620 0.034 (3.81)** (4.81)** (1.21) Kyivskaya -0.066 0.228 0.072 (1.78) (1.40) (2.09)* West -0.073 -0.207 -0.024 (4.15)** (2.79)** (1.49) East -0.053 0.118 -0.007 (3.30)** (1.78) (0.46) South -0.062 0.069 -0.037 (3.37)** (0.84) (2.24)* University graduate -0.139 -0.063 -0.041 (7.00)** (0.71) (2.13)* Technical school -0.079 -0.112 -0.037 (4.54)** (1.54) (2.36)* High school diploma -0.033 -0.003 -0.019 (1.65) (0.04) (1.04) mother_graduate 0.001 0.068 -0.020 (0.05) (0.62) (1.06) Mother_high school -0.003 0.038 -0.007 (0.24) (0.67) (0.64) Father_graduate -0.008 -0.039 0.019 (0.51) (0.42) (1.10) Bilingual -0.004 -0.127 -0.017 (0.30) (2.35)* (1.56) Left handed 0.016 -0.163 0.071 (0.47) (1.05) (2.06)* Constant 0.152 5.855 0.146 (1.68) (14.66)** (1.97)* Note: Sample size 5203. t statistics in brackets.

33
Table. A7: Estimated Sample Attrition Probabilties (marginal effects) Drop Out Drop Out Monitor zone in 1986 0.030 -0.035 (0.021) (0.022) AGE -0.006 (0.004) AGE squared 0.0001 (0.0001) Female -0.028 (0.011)** Russian -0.003 (0.014) Other ethnicity -0.030 (0.022) Orthodox -0.066 (0.014)** Other religion -0.060 (0.015)** Village -0.112 (0.011)** Kyiv 0.215 (0.043)** Kyivskaya 0.138 (0.050)** West 0.157 (0.024)** East 0.016 (0.018) South 0.260 (0.027)** University graduate 0.032 (0.022) Technical school 0.008 (0.017) High school diploma 0.009 (0.019) Mother_graduate -0.049 (0.018)** Mother_high school -0.022 (0.012) father_graduate 0.016 (0.020) Bilingual 0.005 (0.012) Left-handed -0.129 (0.017)** Note: Marginal effects from probit estimates. Robust standard errors in brackets. ** significant at 5%. Mean of dependent variable is 0.192. Sample age 23-59.

CENTRE FOR ECONOMIC PERFORMANCE Recent Discussion Papers
1051 Jörn-Steffen Pischke Money and Happiness: Evidence from the Industry Wage Structure
1050 Tim Leunig Joachim Voth
Spinning Welfare: the Gains from Process Innovation in Cotton and Car Production
1049 Francesca Cornaglia Andrew Leigh
Crime and Mental Wellbeing
1048 Gianluca Benigno Hande Küçük-Tuger
Portfolio Allocation and International Risk Sharing
1047 Guy Mayraz Priors and Desires: A Model of Payoff-Dependent Beliefs
1046 Petri Böckerman Alex Bryson Pekka Ilmakunnas
Does High Involement Management Lead to Higher Pay?
1045 Christos Genakos Tommaso Valletti
Seesaw in the Air: Interconnection Regulation and the Structure of Mobile Tariffs
1044 Giordano Mion Luca David Opromolla
Managers’ Mobility, Trade Status and Wages
1043 Javier Ortega Gregory Verdugo
Immigration and the Occupational Choice of Natives: A Factor Proportions Approach
1042 Nicholas Bloom Benn Eifert Aprajit Mahajan David McKenzie John Roberts
Does Management Matter? Evidence from India
1041 Joshua D. Angrist Stacey H. Chen Brigham R. Frandsen
Did Vietnam Veterans Get Sicker in the 1990s? The Complicated Effects of Military Service on Self-Reported Health
1040 Tanvi Desai Felix Ritchie
Effective Researcher Management
1039 Ralf Martin Mirabelle Muûls Laure B. de Preux Ulrich J. Wagner
Anatomy of a Paradox: Management Practices, Organisational Structure and Energy Efficiency
1038 Giordano Mion Linke Zhu
Import Competition from and Outsourcing to China: A Curse or Blessing for Firms?

1037 William Brown David Marsden
Individualisation and Growing Diversity of Employment Relationships
1036 John Van Reenen Does Competition Raise Productivity through Improving Management Quality?
1035 Florence Kondylis Marco Manacorda
School Proximity and Child Labor Evidence from Rural Tanzania
1034 Lars Boerner Albrecht Ritschl
Communal Responsibility and the Coexistence of Money and Credit under Anonymous Matching
1033 Gianluca Benigno Pierpaolo Benigno Salvatore Nisticó
Second-Order Approximation of Dynamic Models with Time-Varying Risk
1032 Gianluca Benigno Chuigang Chen Christopher Otrok Alessandro Rebucci Eric R. Young
Financial Crises and Macro-Prudential Policies
1031 Dennis Novy International Trade without CES: Estimating Translog Gravity
1030 Alex Bryson John Forth
The Evolution of the Modern Worker: Attitudes to Work
1029 Fabrice Defever The Spatial Organization of Multinational Firms
1028 Elhanan Helpman Oleg Itskhoki Stephen Redding
Trade and Labor Market Outcomes
1027 Nicholas Oulton Long Term Implications of the ICT Revolution: Applying the Lessons of Growth Theory and Growth Accounting
1026 Maarten Goos Alan Manning Anna Salomons
Explaining Job Polarization in Europe: the Roles of Technology, Globalization and Institutions
1025 David H. Autor Alan Manning Christopher L. Smith
The Contribution of the Minimum Wage to U.S. Wage Inequality over Three Decades: A Reassessment
1024 Pascal Michaillat Do Matching Frictions Explain Unemployment? Not in Bad Times
The Centre for Economic Performance Publications Unit Tel 020 7955 7284 Fax 020 7955 7595
Email [email protected] Web site http://cep.lse.ac.uk


![1052 CPP02-CourseIntro.ppt [相容模式]squall.cs.ntou.edu.tw/cpp/1052/slides/1052 CPP02... · 2017. 3. 23. · 17. Constructor / Destructor 18. More Classes 03. Abstract Data Type](https://static.documents.pub/doc/80x56/603dd6525bb3ea7eba60277c/1052-cpp02-csquallcsntouedutwcpp1052slides1052-cpp02.jpg)


