8 Ceramic Coatings for Pigments A.R. Mirhabibi 1 Institute for Materials Research (IMR), Leeds University, 2 Center of Excellence for Advanced Materials and Processes (IUST) 3 Iran University of Science and Technology (IUST) 1 UK 2,3 Iran 1. Introduction Special effect pigments, which can be natural or synthetic, show outstanding qualities of luster, brilliance and iridescent colour effects based upon optically thin layers [1.1–1.4]. This visual impression develops by reflection and scattering of light on thin multiple layers. In nature this is not limited to pearls and mussel shells alone; there are a multitude of birds, fish, precious stones and minerals, even insects, that demonstrate a luster effect. Experiments to understand the optical principles of natural pearl luster demonstrate that the brilliant colours are based upon structured biopolymers and upon layered structures, which are developed by biomineralization. Figure 1.1 illustrates the various optical principles of conventional pigments (A) (absorption pigments), metal effect pigments (B), and pearls (C) and pearl luster pigments (D), the most important group of special effect pigments. In the case of absorption pigments, the interaction with light is based upon absorption and/or diffuse scattering. A completely different optical behavior can be observed with the group of effect pigments including pearl luster and metal effect pigments. Metal effect pigments consist of small metal platelets (for example aluminum, titanium, copper), which operate like little mirrors and almost completely reflect the incident light. Pearl luster pigments simulate the luster of natural pearls. They consist of alternating transparent layers with differing refractive indices. The layers consist of CaCO 3 (high refractive index) and proteins (low refractive index). This difference in refractive indices, arising equally on the interface between an air/oil film or oil film/water, is a prerequisite for the well-known iridescent colour images in these media. Small highly refractive platelets of pearl luster pigments align themselves parallel in optically thin systems such as paints, printing inks, or plastics. Interference effects develop when the distances of the various layers or the thicknesses of the platelets have the right values. Synthetic pearl luster pigments are either transparent or light-absorbing platelet shaped crystals. They can be monocrystalline, as in Pb(OH) 2 . 2PbCO 3 and BiOCl, or possess a multi-layered structure in which the layers have differing refractive indices and light absorption properties. The use of pearls and nacreous shells for decorative purposes goes back to ancient times (e.g., in Chinese wood intarsia). The history of pearl pigments dates back to 1656, when French rosary maker Jaquin isolated a silky lustrous suspension from fish scales (pearl essence) and applied this to small beads to create artificial pearls. www.intechopen.com
Transcript
8
Ceramic Coatings for Pigments
A.R. Mirhabibi 1Institute for Materials Research (IMR), Leeds University,
2Center of Excellence for Advanced Materials and Processes (IUST) 3Iran University of Science and Technology (IUST)
1UK 2,3Iran
1. Introduction
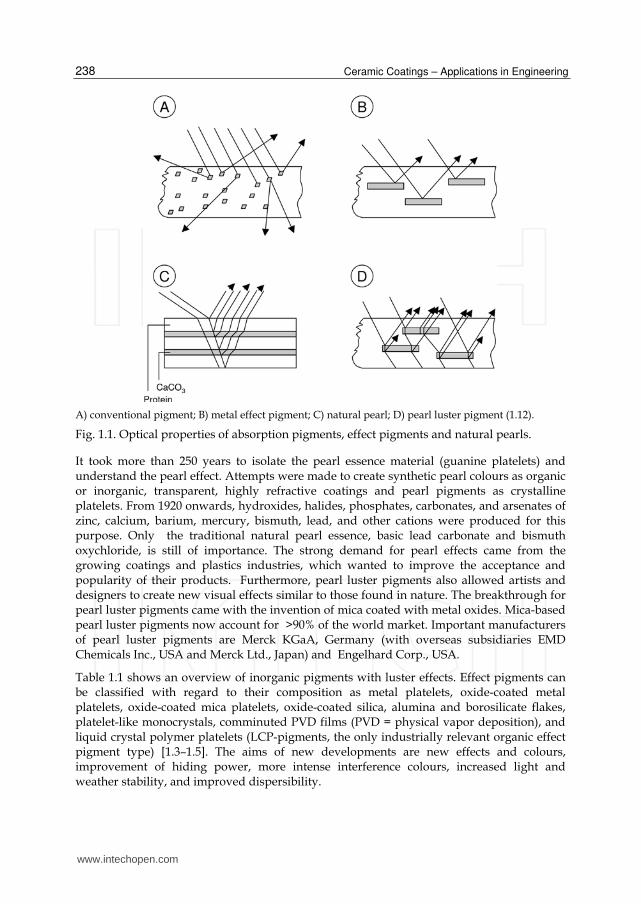
Special effect pigments, which can be natural or synthetic, show outstanding qualities of luster, brilliance and iridescent colour effects based upon optically thin layers [1.1–1.4]. This visual impression develops by reflection and scattering of light on thin multiple layers. In nature this is not limited to pearls and mussel shells alone; there are a multitude of birds, fish, precious stones and minerals, even insects, that demonstrate a luster effect. Experiments to understand the optical principles of natural pearl luster demonstrate that the brilliant colours are based upon structured biopolymers and upon layered structures, which are developed by biomineralization. Figure 1.1 illustrates the various optical principles of conventional pigments (A) (absorption pigments), metal effect pigments (B), and pearls (C) and pearl luster pigments (D), the most important group of special effect pigments. In the case of absorption pigments, the interaction with light is based upon absorption and/or diffuse scattering. A completely different optical behavior can be observed with the group of effect pigments including pearl luster and metal effect pigments. Metal effect pigments consist of small metal platelets (for example aluminum, titanium, copper), which operate like little mirrors and almost completely reflect the incident light.
Pearl luster pigments simulate the luster of natural pearls. They consist of alternating transparent layers with differing refractive indices. The layers consist of CaCO3 (high refractive index) and proteins (low refractive index). This difference in refractive indices, arising equally on the interface between an air/oil film or oil film/water, is a prerequisite for the well-known iridescent colour images in these media. Small highly refractive platelets of pearl luster pigments align themselves parallel in optically thin systems such as paints, printing inks, or plastics. Interference effects develop when the distances of the various layers or the thicknesses of the platelets have the right values. Synthetic pearl luster pigments are either transparent or light-absorbing platelet shaped crystals. They can be monocrystalline, as in Pb(OH)2. 2PbCO3 and BiOCl, or possess a multi-layered structure in which the layers have differing refractive indices and light absorption properties. The use of pearls and nacreous shells for decorative purposes goes back to ancient times (e.g., in Chinese wood intarsia). The history of pearl pigments dates back to 1656, when French rosary maker Jaquin isolated a silky lustrous suspension from fish scales (pearl essence) and applied this to small beads to create artificial pearls.
www.intechopen.com
Ceramic Coatings – Applications in Engineering
238
A) conventional pigment; B) metal effect pigment; C) natural pearl; D) pearl luster pigment (1.12).
Fig. 1.1. Optical properties of absorption pigments, effect pigments and natural pearls.
It took more than 250 years to isolate the pearl essence material (guanine platelets) and understand the pearl effect. Attempts were made to create synthetic pearl colours as organic or inorganic, transparent, highly refractive coatings and pearl pigments as crystalline platelets. From 1920 onwards, hydroxides, halides, phosphates, carbonates, and arsenates of zinc, calcium, barium, mercury, bismuth, lead, and other cations were produced for this purpose. Only the traditional natural pearl essence, basic lead carbonate and bismuth oxychloride, is still of importance. The strong demand for pearl effects came from the growing coatings and plastics industries, which wanted to improve the acceptance and popularity of their products. Furthermore, pearl luster pigments also allowed artists and designers to create new visual effects similar to those found in nature. The breakthrough for pearl luster pigments came with the invention of mica coated with metal oxides. Mica-based pearl luster pigments now account for >90% of the world market. Important manufacturers of pearl luster pigments are Merck KGaA, Germany (with overseas subsidiaries EMD Chemicals Inc., USA and Merck Ltd., Japan) and Engelhard Corp., USA.
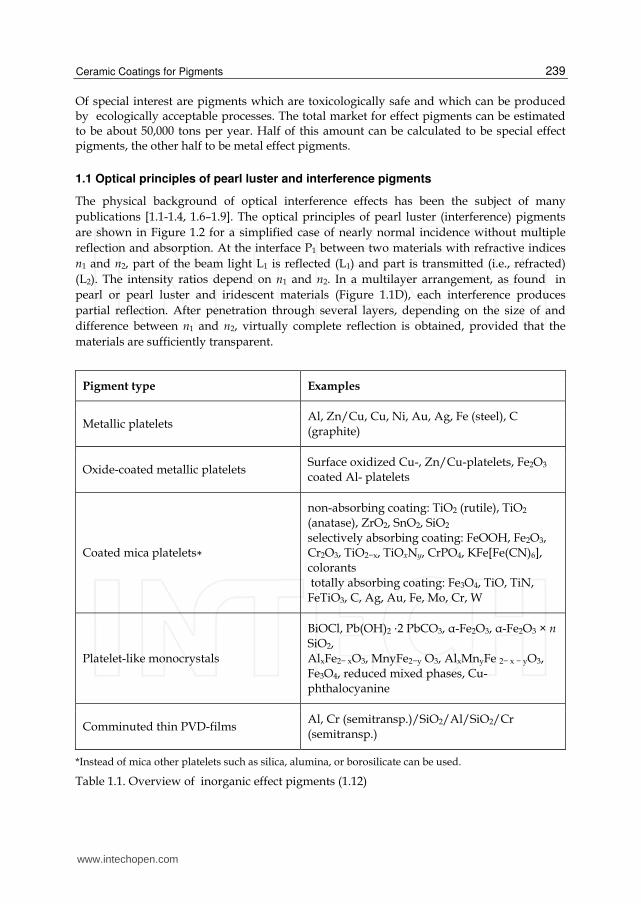
Table 1.1 shows an overview of inorganic pigments with luster effects. Effect pigments can be classified with regard to their composition as metal platelets, oxide-coated metal platelets, oxide-coated mica platelets, oxide-coated silica, alumina and borosilicate flakes, platelet-like monocrystals, comminuted PVD films (PVD = physical vapor deposition), and liquid crystal polymer platelets (LCP-pigments, the only industrially relevant organic effect pigment type) [1.3–1.5]. The aims of new developments are new effects and colours, improvement of hiding power, more intense interference colours, increased light and weather stability, and improved dispersibility.
www.intechopen.com
Ceramic Coatings for Pigments
239
Of special interest are pigments which are toxicologically safe and which can be produced by ecologically acceptable processes. The total market for effect pigments can be estimated to be about 50,000 tons per year. Half of this amount can be calculated to be special effect pigments, the other half to be metal effect pigments.
1.1 Optical principles of pearl luster and interference pigments
The physical background of optical interference effects has been the subject of many
publications [1.1-1.4, 1.6–1.9]. The optical principles of pearl luster (interference) pigments
are shown in Figure 1.2 for a simplified case of nearly normal incidence without multiple
reflection and absorption. At the interface P1 between two materials with refractive indices
n1 and n2, part of the beam light L1 is reflected (L1) and part is transmitted (i.e., refracted)
(L2). The intensity ratios depend on n1 and n2. In a multilayer arrangement, as found in
pearl or pearl luster and iridescent materials (Figure 1.1D), each interference produces
partial reflection. After penetration through several layers, depending on the size of and
difference between n1 and n2, virtually complete reflection is obtained, provided that the
materials are sufficiently transparent.
Pigment type Examples
Metallic platelets Al, Zn/Cu, Cu, Ni, Au, Ag, Fe (steel), C (graphite)
*Instead of mica other platelets such as silica, alumina, or borosilicate can be used.
Table 1.1. Overview of inorganic effect pigments (1.12)
www.intechopen.com
Ceramic Coatings – Applications in Engineering
240
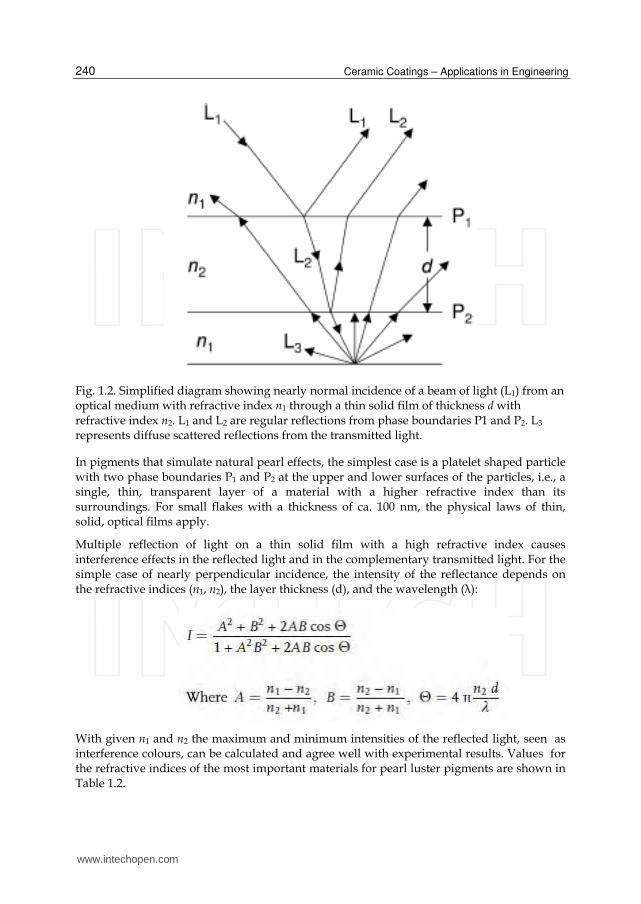
Fig. 1.2. Simplified diagram showing nearly normal incidence of a beam of light (L1) from an optical medium with refractive index n1 through a thin solid film of thickness d with refractive index n2. L1 and L2 are regular reflections from phase boundaries P1 and P2. L3 represents diffuse scattered reflections from the transmitted light.
In pigments that simulate natural pearl effects, the simplest case is a platelet shaped particle with two phase boundaries P1 and P2 at the upper and lower surfaces of the particles, i.e., a single, thin, transparent layer of a material with a higher refractive index than its surroundings. For small flakes with a thickness of ca. 100 nm, the physical laws of thin, solid, optical films apply.
Multiple reflection of light on a thin solid film with a high refractive index causes interference effects in the reflected light and in the complementary transmitted light. For the simple case of nearly perpendicular incidence, the intensity of the reflectance depends on the refractive indices (n1, n2), the layer thickness (d), and the wavelength (λ):
With given n1 and n2 the maximum and minimum intensities of the reflected light, seen as interference colours, can be calculated and agree well with experimental results. Values for the refractive indices of the most important materials for pearl luster pigments are shown in Table 1.2.
In practice, platelet crystals are synthesized with a layer thickness d calculated to produce the desired interference colours (iridescence). Most pearl luster pigments now consist of at least three layers of two materials with different refractive indices.
Thin flakes (thickness ca. 500 nm) of a material with a low refractive index (mica, silica, alumina, glass) are coated with a highly refractive metal oxide (TiO2, Fe2O3, layer thickness ca. 50–150 nm). This results in particles with four interfaces that constitute a more complicated but still predictable thin film system. The behavior of more complex multilayer pigments containing additional, thin, light-absorbing films can also be calculated if appropriate optical parameters are known.
Colour effects depend on the viewing angle. Pearl luster pigment platelets split white light into two complementary colours that depend on the platelet thickness. The reflected (interference) colour dominates under regular (maximum) reflection, i.e., when the object is observed at the angle of regular reflection. The transmitted part dominates at other viewing angles under diffuse viewing conditions, provided that there is a non-absorbing (white) or reflecting background.
Variation of the viewing angle therefore produces a sharp gloss (reflectance) peak, and the
colour changes between two extreme complementary colours. The resulting complex interplay
of luster and colour is measured goniophotometrically in reflection and at different angles. A
pearl luster pigment is characterized by a minimum of three L*a*b* data sets (CIE L*a*b*-
system) measured under different conditions (e.g., 0°/45° black background, 22.5°/22.5° black
background, 0°/45° white background). An analysis of these data specifies a pigment on the
basis of its hiding power, luster, and hue [1.1, 1.10, 1.11, 1.12].
2. Application of the Taguchi method to develop a robust design for the synthesis of mica-SnO2 gold pearlescent pigment
2.1 Introduction
For a long time beautiful and deep pearlescent pigments have attracted human attention and have been used in many cases [2.1]. These pigments consist of thin transparent small
www.intechopen.com
Ceramic Coatings – Applications in Engineering
242
flat surfaces with high reflective index. They reflect most of the radiant light and transmit a bit. Simultaneous reflection of light from small parallel surface layers of pigments causes the effect of deepness and brightness, such as exhibited by a pearl [2.2]. Each layer regularly reflects a part of the light and transmits the rest. The transmissible light is again reflected by other layers. Therefore, the manifestation of lustrous and interfering colours are revealed due to reflection from the interface between layers. This phenomenon is observed in natural pearl, fish scale, pearl body, birds feather, the butterfly wing, etc .
Pearlescent pigments are synthesized via two main methods. In the first, single crystals such as BiOCl or polycrystals like TiO2 are considered as bright and light materials due to their special structure. In the second, the pearlescent state is formed through the coating of materials with a high refractive index, (mainly metal oxide) on a transparent substrate like mica. This group is more important because of higher mechanical stability and brightness [2.3].
One of the most important kinds of these pigments is TiO2 coated mica which due to its high refractive index of TiO2, has high light resistance, low cost, good chemical and heat resistance and nontoxicity has many applications in different industries.
However, a new kind of these pigments is gold pearlescent pigment of mica-tin dioxide which is obtained through coating mica platelets by tin dioxide. This chapter section examines mica-tin dioxide and uses muscovite mica as the substrate and is prepared by laying a particle layer of tin dioxide on its surface. Due to the absorption and reflection of light in this layer, the pigment is termed a colouring pearlescent pigment. This pigment is widely used in many fields such as glass, glaze, automotive, plastics, cosmetics, etc.
The main purpose of this study was to prepare pearlescent pigment and to find the optimum values of process parameters which affect its properties using the Taguchi statistical method.
2.2 Taguchi techniques
The Taguchi technique is a powerful tool for the design of high quality systems developed by Taguchi between 1950 to 1960 [2.4-2.6]. It provides a simple, efficient and systematic approach to optimize designs for performance, quality and cost. The methodology is valuable when design parameters are qualitative and discrete. Taguchi parameter design can optimize the performance characteristics through the setting of design parameters and reduce the sensitivity of the system performance to source of variation [2.6-2.7]. This technique is multi-step process, which follow a certain sequence for the experiments to yield an improved understanding of product or process performance. This design of experiments process is made up of three main phases: the planning phase, the conducting phase and analysis interpretation phase. The planning phase is the most important phase and one must give a maximum importance to this phase. The data collected from all the experiments in the set are analysed to determine the effect of various design parameters. This approach is to use a fractional factorial approach and this may be accomplished with the aid of orthogonal arrays. Analysis of variance is a mathematical technique, which is based on a least square approach. The treatment of the experimental results is based on the analysis of average and analysis of variance [2.8-2.9].
www.intechopen.com
Ceramic Coatings for Pigments
243
2.3 Experimental
2.3.1 Raw materials and reagents
Muscovite mica in bulk state was milled for 1 hour and then sieved and was used as the base. SnCl2 (analytical reagent) was used to produce the metal oxide hydrate on mica flakes and the precipitation was performed by the presence of KClO3 (analytical reagent) as the oxidizing agent. Sorbitan mono-oleate (analytical reagent) was used as the non-ionic surfactant. Also, NaOH (chemical reagent) and HCl (chemical reagent) were used for adjustment of pH.
2.3.2 Design of experiments
The experiments were conducted by standard orthogonal array. The selection of the
orthogonal array is based on the condition that the degrees of freedom for the orthogonal
array should be greater than or equal to sum of those lightness and reflective percent
parameters [2.6-2.9]. In the present investigation, an L16 orthogonal array was chosen,
which has 5 rows and 16 columns as shown in Table 2.1. Table 2.2 indicates the factors and
their level. The experiment consists of 16 tests (each row in the L16 orthogonal array) and
the columns were assigned with parameters. The first row was pH, second row was reaction
temperature (T), third row was concentration of SnCl2 solution (C), fourth row was reaction
time (t) and fifth row was stirring rate (R). The response to be studied was the lightness and
reflective percent with the objective of the bigger the better. The experiments were
conducted by orthogonal array with level of parameters given in each array row. The l test
results were subject to the analysis of variance.
Experiment number
1 2 3 4 5 6 7 8 9 10 11 12 13 14 15 16
pH 1 1 1 1 2 2 2 2 3 3 3 3 4 4 4 4
T 1 2 3 4 1 2 3 4 1 2 3 4 1 2 3 4
C 1 2 3 4 2 1 4 3 3 4 1 2 4 3 2 1
t 1 2 3 4 3 4 1 2 4 3 2 1 2 1 4 3
R 1 2 3 4 4 3 2 1 2 1 4 3 3 4 1 2
Table 2.1. Orthogonal array L16(45) of Taguchi [2.4]
Parameters Levels
1 2 3 4
pH 1 2 2.5 3
T (°C) 60 65 70 75
C (g/lit) 10 20 40 60
t (h) 5 7 8.5 10
R (r.p.m) 100 200 300 400
Table 2.2. Process parameters with their values at four levels
www.intechopen.com
Ceramic Coatings – Applications in Engineering
244
2.3.3 Analysis
The spectral reflectance of the pigment was measured using a Colour Quest Goniospectrophotometer (CE-741-GL-Gretag Macbet Co). The SEM photomicrographs were obtained using an electron microscope (LEO-1455VP) and SEM studies were performed using this microscope equipped with EDX (to determine chemical composition of the observed objects). Appearance and colour of the covered mica flakes were observed by reflectance light microscope (Laborlux 11 pol, Leitz matallux 3). Finally, the phase analysis of the resultant pigment powders was determined by X-ray diffractometer (XRD-Philips-Xpert). Density and particle size of resultant pigment were measured by helium pycnometer (Accupyc 1330) and Master sizer 2000 (Mal 100229) respectively.
2.3.4 Preparation method
Firstly, a suitable suspension of 2 g milled and sieved mica (20-60 µm) in 40 ml de-ionized water was prepared. The suspension pH was adjusted with dilute hydrochloric acid (5%) to pH which is shown in table 2.1 and then heated to desired temperature according to table 2.1 experiment plane. The mixture was heated up to desired temperature, then 0.0001 % (based on mica wt%) of nonionic surfactant (sorbitan mono-oleate ) was added to this suspension. Then, potassium chlorate aqueous solution (KClO3) was added to this suspension as an oxidizing agent.
According to the conditions shown in table 2.1, stirring rate, suspension temperature and pH were controlled. In order to coat the mica flake, SnCl2 solution and aluminium chloride (AlCl3) with a constant proportion SnCl2/AlCl3 = 9/1, were added to the mica suspension. The pH of the suspension was kept at desired level by addition of 3% aqueous sodium hydroxide solution. The coating process was stopped after the desired time. Then, the suspension was filtered and the prepared pigments were washed with distilled water until neutral pH was reached and dried at 100ºC. Finally the powders were calcined at 950ºC for 1h to get the pigment powders with pearlescent luster.
2.4 Result and discussion
2.4.1 The colour characteristics of pigments
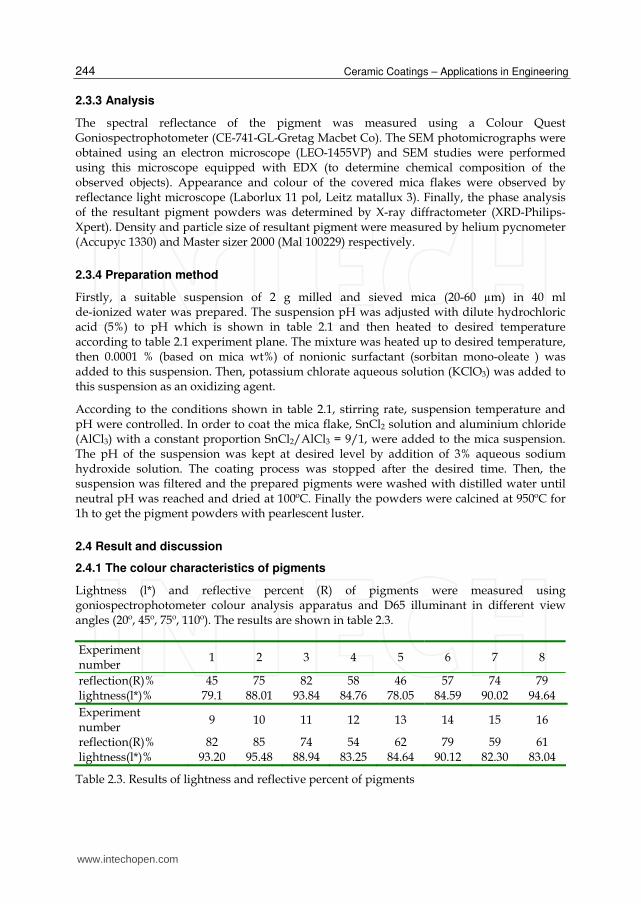
Lightness (l*) and reflective percent (R) of pigments were measured using goniospectrophotometer colour analysis apparatus and D65 illuminant in different view angles (20º, 45º, 75º, 110º). The results are shown in table 2.3.
Table 2.3. Results of lightness and reflective percent of pigments
www.intechopen.com
Ceramic Coatings for Pigments
245
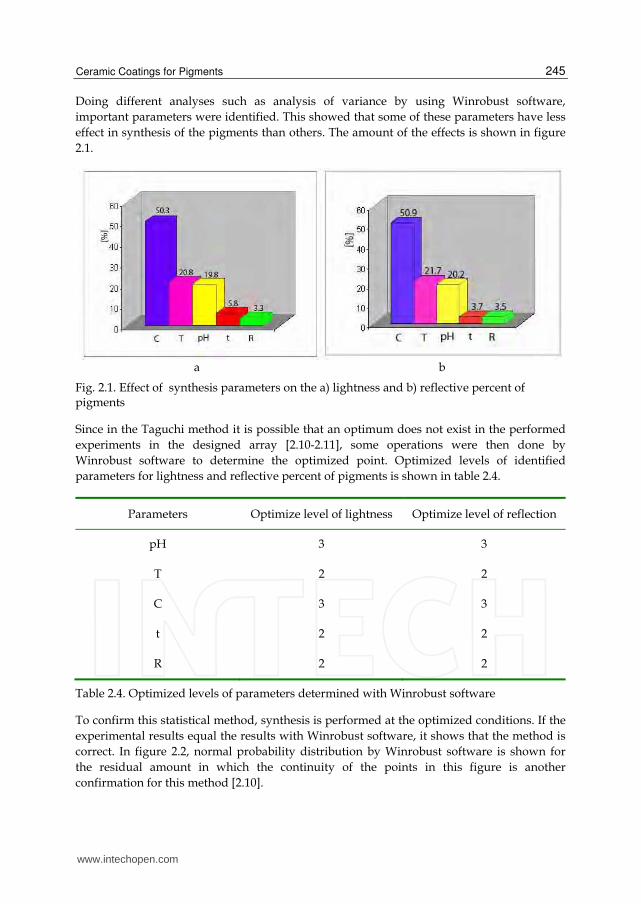
Doing different analyses such as analysis of variance by using Winrobust software,
important parameters were identified. This showed that some of these parameters have less
effect in synthesis of the pigments than others. The amount of the effects is shown in figure
2.1.
a b
Fig. 2.1. Effect of synthesis parameters on the a) lightness and b) reflective percent of pigments
Since in the Taguchi method it is possible that an optimum does not exist in the performed
experiments in the designed array [2.10-2.11], some operations were then done by
Winrobust software to determine the optimized point. Optimized levels of identified
parameters for lightness and reflective percent of pigments is shown in table 2.4.
Parameters Optimize level of lightness Optimize level of reflection
pH 3 3
T 2 2
C 3 3
t 2 2
R 2 2
Table 2.4. Optimized levels of parameters determined with Winrobust software
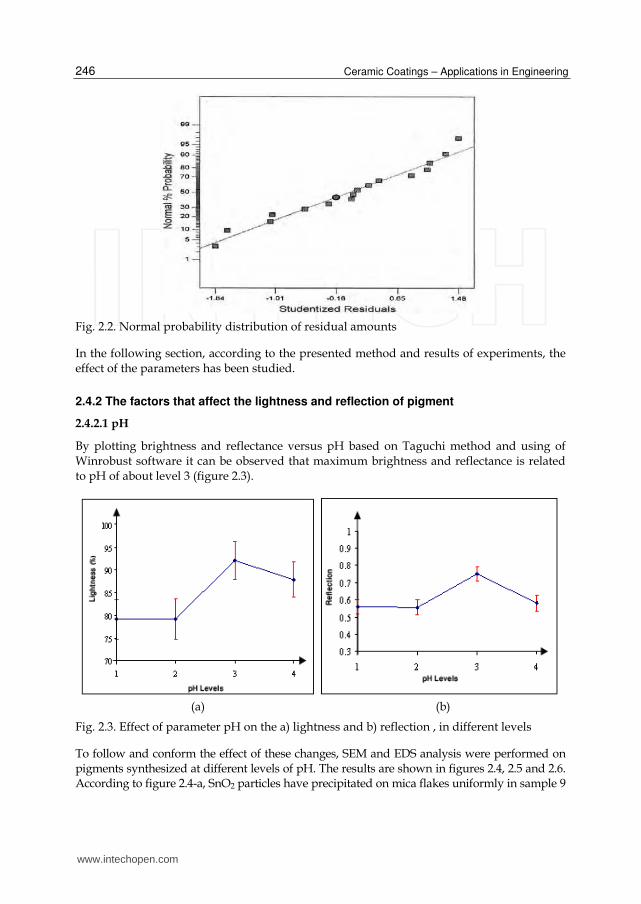
To confirm this statistical method, synthesis is performed at the optimized conditions. If the
experimental results equal the results with Winrobust software, it shows that the method is
correct. In figure 2.2, normal probability distribution by Winrobust software is shown for
the residual amount in which the continuity of the points in this figure is another
confirmation for this method [2.10].
www.intechopen.com
Ceramic Coatings – Applications in Engineering
246
Fig. 2.2. Normal probability distribution of residual amounts
In the following section, according to the presented method and results of experiments, the effect of the parameters has been studied.
2.4.2 The factors that affect the lightness and reflection of pigment
2.4.2.1 pH
By plotting brightness and reflectance versus pH based on Taguchi method and using of Winrobust software it can be observed that maximum brightness and reflectance is related to pH of about level 3 (figure 2.3).
(a) (b)
Fig. 2.3. Effect of parameter pH on the a) lightness and b) reflection , in different levels
To follow and conform the effect of these changes, SEM and EDS analysis were performed on pigments synthesized at different levels of pH. The results are shown in figures 2.4, 2.5 and 2.6. According to figure 2.4-a, SnO2 particles have precipitated on mica flakes uniformly in sample 9
www.intechopen.com
Ceramic Coatings for Pigments
247
which its pH is optimum (pH = level of 3). Figure 4-b (EDS analysis of sample 3) shows a great amount of tin on the mica flakes. In sample 6, only a small quantity of SnO2 particles have been precipitated on mica flakes that its pH is less than optimum pH because hydrolysis process has not been performed completely . The results are shown in figures of 2.5-a and 2.5-b but in sample 15 a great amount of SnO2 particles are not agglomerated on the mica flakes uniformly. The results are illustrated in figures 2.6-a and 2.6-b. It seems that due to the progress of hydrolysis the homogeneity of the SnO2 film can vary and the hydrolysis rate is very fast.
(a) (b)
(c) (d)
(e) (d)
Fig. 2.4. SEM and EDS Images of pigments synthesized at different levels of pH
www.intechopen.com
Ceramic Coatings – Applications in Engineering
248
Therefore, the uniformity of SnO2 coated on mica flakes depends on the hydrolysis rate of SnCl2 solution. The equation of hydrolysis (Equation 1) and rate of hydrolysis (Equation 2) can be considered as follows:
2 2 2
Z Z h
SolvatedhN N hM OH hH O M OH OH hH
(1)
2 621 0 0211 36 0 236 0 08
1 0 41
*
*
. .. . .
.m
m
pH Xh Z N pH
pH X
(2)
Where “h” is the hydrolysis rate, “Z” is the charge of M cation, “N” is the coordination number of M, “X*m” is electronegativity of M. According to the equation (2), if the pH level is less than the optimum level, the hydrolysis process is not performed and SnO2 particles do not precipitated, because the hydrolysis rate is negative. Therefore, brightness and reflectance will decrease. On the other hand, if the pH level is more than the optimum level, the hydrolysis rate increases with pH increasing. Therefore, agglomerated particles are initially formed in suspension and then on the mica flakes. These agglomerated particles cause irregular scattering of light which in turn decrease the brightness and reflectance [2.12, 2.13, 2.14].
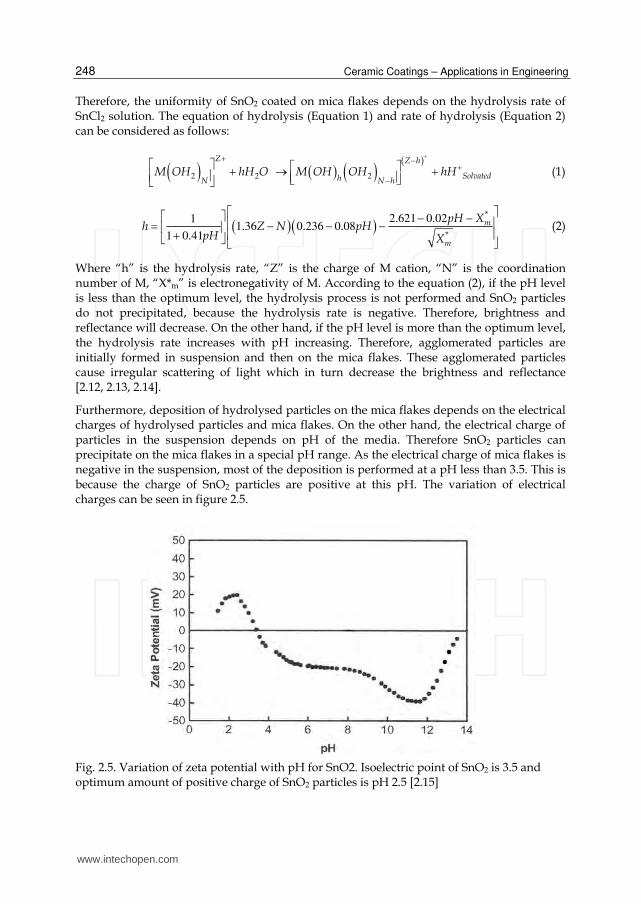
Furthermore, deposition of hydrolysed particles on the mica flakes depends on the electrical charges of hydrolysed particles and mica flakes. On the other hand, the electrical charge of particles in the suspension depends on pH of the media. Therefore SnO2 particles can precipitate on the mica flakes in a special pH range. As the electrical charge of mica flakes is negative in the suspension, most of the deposition is performed at a pH less than 3.5. This is because the charge of SnO2 particles are positive at this pH. The variation of electrical charges can be seen in figure 2.5.
Fig. 2.5. Variation of zeta potential with pH for SnO2. Isoelectric point of SnO2 is 3.5 and optimum amount of positive charge of SnO2 particles is pH 2.5 [2.15]
www.intechopen.com
Ceramic Coatings for Pigments
249
2.4.2.2 Reaction temperature
By observing brightness and reflectance versus reaction temperature based on Taguchi method and the use of Winrobust software it can be observed that the maximum of brightness and reflectance is related to reaction temperature of about level 2 (figure 2.6).
(a) (b)
Fig. 2.6. Effect of parameter temperature on the a) lightness and b) reflection , at different levels
According to SEM analysis observed in figures of 7-a, 7-b and 7-c, when the reaction temperature is low (T = level 1), approximately no SnO2 coating is formed on the mica flakes, thus lightness and reflectance are small (figure 2.7-a). Lightness and reflectance increase with temperature increasing until level of 2. SnO2 particles coated on the mica flakes are uniform at temperature of level 2 (figure 2.7-b). Increasing temperature causes the flocculation of the colloid particles, the particles become larger, and the membrane on substrate surface becomes loosen and SnO2 particles irregularly deposit on the mica flakes (figure 2.7-c).
(a) (b) (c)
Fig. 2.7. SEM images of pigments synthesized at different levels of reaction temperature
As the hydrolysis process is a precipitation reaction, precipitation decreases with temperature decreasing. This seems to be due to the solubility of tin hydroxide increasing with temperature increasing. So, the precipitate reduces and the coating becomes uneven.
www.intechopen.com
Ceramic Coatings – Applications in Engineering
250
Also increasing temperature causes the weakening of hydrogen bonding between SnO2 particles and mica flakes [2.13].
2.4.2.3 Concentration of SnCl2 solution
By observing brightness and reflectance versus concentration of SnCl2 solution, based on Taguchi method and the use of Winrobust software it can be observed that the maximum of brightness and reflectance is related to concentration of about level 3 (figure 2.8). It can be seen that with the increase in the concentration of SnCl2 solution, to a level higher than 3 causes the lightness and reflectance of the pigment to decrease.
The relationship between the intensities of reflected light, transmitted light, scattered light, absorbed light and the intensity of incident light is I = S+T+D+A [2.16], where S, T, D and A represent the strength of reflecting light, transmitting light, scattering light and absorbing light respectively. These are function of tin chloride concentration. When I is fixed, the thicker the membrane layer, the larger the value of A, while the smaller the value of S and T. As T decreasing, there is less incident light traveling through the coating layer and arriving at the surface of the mica substrate. Thus, the intensity of reflecting light generated at the surface decreases, the reflection and interference action becomes weaker, and the lightness decreases.
Figure 2.9 shows SEM images of a great thickness of SnO2 layer at a great concentration of SnCl2 solution. This figure is related to the SEM photo of sample of 2.7 in that the lightness and reflectance are small, because the thickness of SnO2 layer is so high.
(a) (b)
Fig. 2.8. Effect of concentration parameter on the a) lightness and b) reflection , at different levels
www.intechopen.com
Ceramic Coatings for Pigments
251
Fig. 2.9. SEM image of pigment synthesized at great concentration
2.4.2.4 Reaction time
By observing brightness and reflectance versus reaction time based on the Taguchi method, it can be observed that the maximum of lightness and reflectance are related to reaction time of about level 2 (Fig. 2.10).
(a) (b)
Fig. 2.10. Effect of time parameter on the a) lightness and b) reflection, at different levels
As SEM analysis show in figures 2.11-a and 2.11-b, when reaction time is low a few coating of SnO2 are formed on the mica flakes, thus lightness and reflectance are decreased (figure 2.11-a). While increase of reaction time, until level of 2, a uniform SnO2 coating is formed on the mica flakes and thus, lightness and reflectance increase as shown in figure 2.13-b. However, increasing time more than level 2 causes decreasing of lightness and reflectance, because the SnO2 coatings formed on the mica flakes are separated gradually.
www.intechopen.com
Ceramic Coatings – Applications in Engineering
252
(a) (b)
Fig. 2.11. SEM images of pigments synthesized at different levels of reaction time
2.4.2.5 Stirring rate
By observing brightness and reflectance versus stirring time based on (Figures 2.12-a and
2.12-b) Taguchi method, it can be seen that the maximum of lightness and reflectance are
related to a stirring rate of about level 2.
(a) (b)
Fig. 2.12. Effect of stirring rate parameter R on the a) lightness and b) reflection at different levels
The stirring rate affects the densification of the membrane layer directly. If the stirring rate is too low, the reaction solution can not form sufficient turbulence [2.17], then the microscopic mixture is uneven, and the generated crystal particles of SnO2 are of various sizes. On the other hand, if the stirring rate is too high, it will affect the rate of growing of the crystal nucleus, with the result that some tiny colloidal micro-particles enter the solution through the filter paper rather than depositing on the surface of mica flakes, which will cause the light to scatter. Therefore, the stirring rate in this reaction should be of level 2.
www.intechopen.com
Ceramic Coatings for Pigments
253
2.4.2.6 Surfactant effect
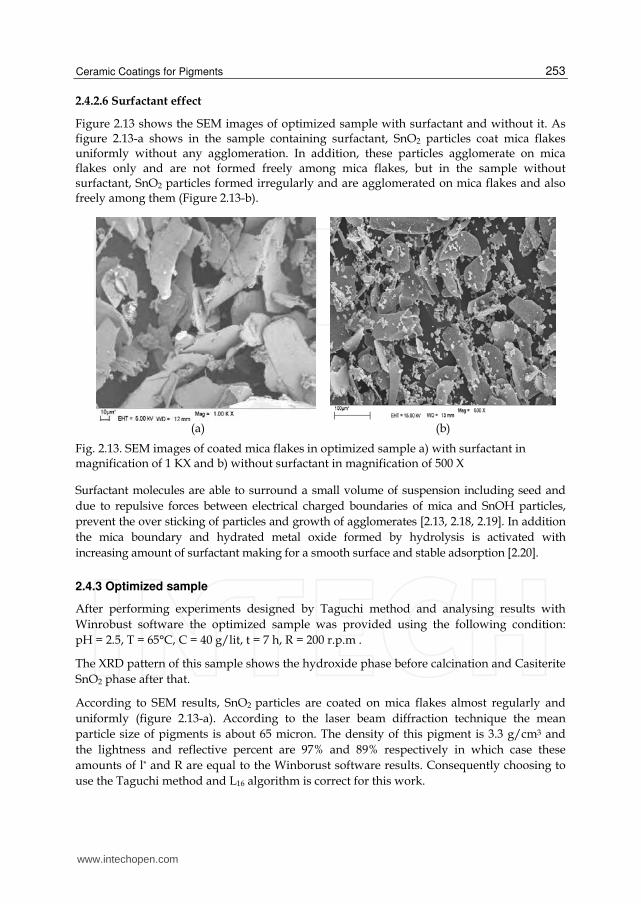
Figure 2.13 shows the SEM images of optimized sample with surfactant and without it. As figure 2.13-a shows in the sample containing surfactant, SnO2 particles coat mica flakes uniformly without any agglomeration. In addition, these particles agglomerate on mica flakes only and are not formed freely among mica flakes, but in the sample without surfactant, SnO2 particles formed irregularly and are agglomerated on mica flakes and also freely among them (Figure 2.13-b).
(a) (b)
Fig. 2.13. SEM images of coated mica flakes in optimized sample a) with surfactant in magnification of 1 KX and b) without surfactant in magnification of 500 X
Surfactant molecules are able to surround a small volume of suspension including seed and
due to repulsive forces between electrical charged boundaries of mica and SnOH particles,
prevent the over sticking of particles and growth of agglomerates [2.13, 2.18, 2.19]. In addition
the mica boundary and hydrated metal oxide formed by hydrolysis is activated with
increasing amount of surfactant making for a smooth surface and stable adsorption [2.20].
2.4.3 Optimized sample
After performing experiments designed by Taguchi method and analysing results with
Winrobust software the optimized sample was provided using the following condition:
pH = 2.5, T = 65°C, C = 40 g/lit, t = 7 h, R = 200 r.p.m .
The XRD pattern of this sample shows the hydroxide phase before calcination and Casiterite
SnO2 phase after that.
According to SEM results, SnO2 particles are coated on mica flakes almost regularly and
uniformly (figure 2.13-a). According to the laser beam diffraction technique the mean
particle size of pigments is about 65 micron. The density of this pigment is 3.3 g/cm3 and
the lightness and reflective percent are 97% and 89% respectively in which case these
amounts of l* and R are equal to the Winborust software results. Consequently choosing to
use the Taguchi method and L16 algorithm is correct for this work.
www.intechopen.com
Ceramic Coatings – Applications in Engineering
254
Table 2.5 shows the results of Goniospectrophotometery of the optimized sample. Figure 2.14 shows the amount of optimized sample reflection from different angle views.
Colorimetery parameters
Angle view
20° 45° 75° 110°
a* 0.81 0.74 0.73 0.67
b* 13.04 14.20 14.34 13.78
l* 96.76 87.57 87.03 86.99
R 570 nm 0.89 0.64 0.56 0.55
Table 2.5. R results of goniospectrophotometery of optimized sample
Fig. 2.14. Amount of optimized sample reflection from different angle views
According to table 2.5 and figure 2.14 parameters l* and R in the different angle views have different values, and also these values are higher in smaller angle views. Therefore the optimized sample has lightness and reflection [2.21, 2.22]. In addition since the maximum value of reflection is in the range of yellow light wavelength (570-600 nm), the pigment is yellow. So it is possible to say that the optimized pigment is gold pearlescent pigment.
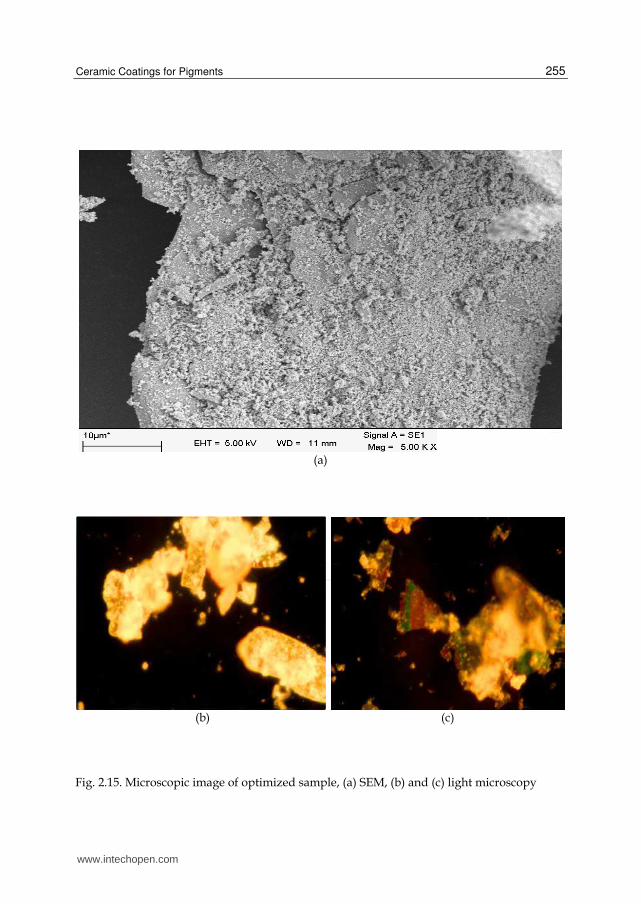
Figure 2.15 shows the microscopic image of the optimized sample. As can be seen from Fig. 2.14 and Fig. 2.15, most of mica flakes coated with SnO2 have a golden colour. However, in this sample, flakes with other colors can be seen as well, which might be due to different thickness of coating on the mica flakes.
www.intechopen.com
Ceramic Coatings for Pigments
255
(a)
(b) (c)
Fig. 2.15. Microscopic image of optimized sample, (a) SEM, (b) and (c) light microscopy
www.intechopen.com
Ceramic Coatings – Applications in Engineering
256
2.5 Chapter conclusions
1. The results obtained in this research according to the Taguchi method, provide optimum values for pH, temperature, concentration of SnCl2 solution, time and stirring velocity of 2.5, 65 ºC, 40 g/lit, 7h and 200 rpm respectively.
2. According to SEM investigation, a relatively good and homogenously flat coating is formed on the mica platelet at the optimum conditions.
3. The effects of using surfactant are: formation of a homogenous thickness of coating, specifically on the flakes surfaces and absence of intra particles agglomerations of SnO2. This is not the case without using the surfactant.
4. XRD analysis of the optimum sample before and after calcination show the amorphous and crystalline phase of SnO2 and Casiterite respectively.
5. Colourimetry measurements show a bright golden appearance of the optimum pigment.
6. Light microscopic observation of the coated flakes using a polarized filter shows that the majority of the flakes have the golden colour, implying the final interference pigment colour of the optimum synthesized pigment is a golden one [2.23].
3. Acknowledgement
Thanks are due to Mrs M. Esfidari who helped for preparation of second part of this chapter.
4. References
4.1 Part one references
[1.1] Glausch, R., Kieser, M., Maisch, R., Pfaff, G., Weitzel, J., Special Effect Pigments, Vincentz Verlag, Hannover, 1998.
[1.2] Pfaff, G., Franz, K.-D., Emmert, R., Nitta, K., Ullmann’s Encyclopedia of Industrial Chemistry: Pigments, Inorganic, see Section 4.3, 6th edn. (electronic release), VCH Verlagsgesellschaft, Weinheim, 1998.
[1.3] Pfaff, G., Chem. Unserer Zeit 31, (1997), p. 6. [1.4] Pfaff, G., High Performance Pigments (Ed.: Smith, H. M., Wiley-VCH, Weinheim, 2002,
p. 77. [1.5] Ostertag, W., Nachr. Chem. Tech. Lab. 42 (1994), p. 849. [1.6] Bäumer, W., Farbe + Lack 79 (1973), p. 747. [1.7] Greenstein, L. M., Pigment Handbook, Part 1, Wiley, New York, 1988, p. 829. [1.8] Schmidt, C., Friz, M., Kontakte (Darmstadt) 2 (1992), p. 15. [1.9] Pfaff, G., Reynders, P., Chem. Rev. 99 (1999), p. 1963. [1.10] Hofmeister, F., Eur. Coat. J. 3 (1990), p. 80. [1.11] Hofmeister, F., Pieper, H., Farbe + Lack, 95 (1989), p. 557. [1.12] Buxbaum, G. and Pfaff, G., Industrial Inorganic Pigments, Third, Completely Revised,
_c WILEY-VCH Verlag GmbH & Co KGaA, Weinheim, 2005.
4.2 Part two references
[2.1] Buxbaum, G. and Pfaff, G., Industrial Inorganic Pigments, Third, Completely Revised, _c WILEY-VCH Verlag GmbH & Co KGaA, Weinheim, 2005.
www.intechopen.com
Ceramic Coatings for Pigments
257
[2.2] S. Hanchisu, “Nacreou Pigments”, Prog. Org. Coat. 3:191-220 (1975). [2.3] K.Othmer, “Encyclopedia of Chemical Technology”, 3rd ed., 17, J.Wiley & sons,
NewYork, 1978-1984, PP. 78-838. [2.4] G. Taguchi and S. Konishi, Taguchi methods, orthogonal arrays and linear graphs, tools
for quality engineering, American Supplier Institute, Dearborn, MI (1987) p. 35-38. [2.5] G. Taguchi, Taguchi on robust technology development methods, ASME Press, New
York, NY (1993) p. 1-40. [2.6] Phillip J. Ross, Taguchi Technique for quality engineering, McGraw-Hill, New York
(1988). [2.7] K. Roy Ranjit, A Primer on Taguchi method, Van Nostrad Rainhold, New York
(1990). [2.8] J. Paulo Davim, An experimental study of tribological behaviour of the brass/steel pair,
J Mater Process Technol 100 (2000), p273-279. [2.9] J. Paulo Davim, Design optimization of cutting parameters for turning metal matrix
composites based on the orthogonal arrays, J Mater Process Technol 132 (2003), p. 340-344.
[2.10] Genechi Taguchi, “System of Experimental Design” Vol. 1, 1987, KRAUS International Publication.
[2.11] Yeow Nam Ng, Don Black, Khanh Luu, “Taguchi Methods”, 1995, Curtin University Handout Notes for Computer Aided Engineering.
[2.12] T. Junru, Sh. Lazhen, F. Xian song, H. Wenxiang, “Preparation of Nanometer – Sized (1-x) SnO2. xsb2O3 Conductive Pigment Powders and the Hydrolysis Behavior of Urea”, Dyes and pigments 61 (2004) 31-38.
[2.13] J. P. Jolivet, “Metal Oxide Chemistry and Synthesis”, John Wiley & Sons, (2002). [2.14] M. Yamamoto, A. Ando, “Pearlescent Pigment, and Paint Composition, Cosmetic
Material, Ink and Plastics Blended with the New Pearlescent Pigment”, U.S. Patent 5741 355 (1998).
[2.15] H.R.Castro, B.S.Murad, D.Gouvea, “Influence of the Acid-Basic Character of Oxide Surfaces in Dispersants Effectiveness” Ceramics International 30 (2004) 2215-2221.
[2.16] Miller HA. Optical property of pearl pigment GFR. Farbe lack 1987; 12:93. [2.17] Xiong Y, Zhou X, Hu L. Study on the process of the ultrafine α-FeOOH synthesis by
dripping method. Journal of East china university of science and technology 1996; 22(5): 541-7.
[2.18] K. Matsui, M. Ohgai, “Formation Mechanism of Hydrous Zirconia Particle Produced by Hydrolysis of ZrCL2 Solution, Kinetics Study for Nucleation and Crystal Growth Processes of Primary Particle”, J. Am. Ceram. Soc. 84: 2203-2313 (2001).
[2.19] M.R. Porten, “Hand book of Surfactan”, Chapter 4, Chapter 8, Hall (1994). [2.20] K.Chang, etal, “A Method for Preparing a Pearlescency Pigment”, U.S. Patent. APPL.
Germany, (2002). [2.22] L.M. Greenteain, “Pigment Handbook”, Vol. 1, Chapter III-D-d-2, John Wiley & Sons
NewYork (1998).
www.intechopen.com
Ceramic Coatings – Applications in Engineering
258
[2.23] M. Esfidari, “Preparation of Pearlescent Pigments for Low Temperature Glazes”, MSc Thesis, Ceramic Department, Iran University Of Science and Technology, Tehran, Iran 2005.
www.intechopen.com
Ceramic Coatings - Applications in EngineeringEdited by Prof. Feng Shi
ISBN 978-953-51-0083-6Hard cover, 286 pagesPublisher InTechPublished online 24, February, 2012Published in print edition February, 2012
InTech ChinaUnit 405, Office Block, Hotel Equatorial Shanghai No.65, Yan An Road (West), Shanghai, 200040, China
Phone: +86-21-62489820 Fax: +86-21-62489821
The main target of this book is to state the latest advancement in ceramic coatings technology in variousindustrial fields. The book includes topics related to the applications of ceramic coating covers in enginnering,including fabrication route (electrophoretic deposition and physical deposition) and applications in turbineparts, internal combustion engine, pigment, foundry, etc.
How to referenceIn order to correctly reference this scholarly work, feel free to copy and paste the following:
A.R. Mirhabibi (2012). Ceramic Coatings for Pigments, Ceramic Coatings - Applications in Engineering, Prof.Feng Shi (Ed.), ISBN: 978-953-51-0083-6, InTech, Available from: http://www.intechopen.com/books/ceramic-coatings-applications-in-engineering/ceramic-coatings-for-pigments