Ceramic Composites, Inc. 1110 Benfield Blvd, Ste Q, Millersville, MD 21108 A subsidiary of Technology Assessment and Transfer, Inc. 410-987-3435 fax 410-987-7172 www.techassess.com AGENCY: DOE / NETL CONTRACT: DE-FG02-03ER83627 TITLE: Enhanced Performance Carbon Foam Heat Exchanger for Power Plant Cooling REPORT: Final Technical Report PERIOD: 21 July 2003 – 13 July 2007 TPOC: Barbara Carney [email protected]PHONE: 304-285-4671 PI: Steven Seghi [email protected]PHONE: 410-987-3435 COMPANY: Ceramic Composites, Inc. 133 Defense Hwy, Ste 212 Annapolis, MD 21401 SBIR/STTR Rights Notice These SBIR/STTR data are furnished with SBIR/STTR rights under Grant No. DE-FG02- 03ER83627. For a period of 4 years after the acceptance of all items to be delivered under this grant, the Government agrees to use these data for Government purposes only, and they shall not be disclosed outside the Government (including disclosure for procurement purposes) during such period without permission of the grantee, except that, subject to the foregoing use and disclosure prohibitions, such data may be disclosed for use by support contractors. After the aforesaid 4-year period the Government has a royalty-free license to use, and to authorize others to use on its behalf, these data for Government purposes, but is relieved of all disclosure prohibitions and assumes no liability for unauthorized use of these data by third parties. This Notice shall be affixed to any reproductions of these data in whole or in part. (End of Notice) Executive Summary The purpose of this program was to demonstrate that high thermal conductivity carbon foam is an economically viable and/or efficiency improving technology to replace for aluminum fins in power plant air cooled steam condensers. Ceramic Composites, Inc. of Millersville, MD, a woman owned small business, teamed with Marley Cooling Technologies (MCT) of Kansas City, MO, a subsidiary of SPX Corporation, the world’s largest cooling tower manufacturer. Large-scale carbon foam heat exchangers were constructed and thermal performance tested. The thermal performance data for both the carbon foam and a state of the art aluminum heat exchanger was analyzed and compared. Analysis of the data showed that neither a thermal performance advantage nor a cost advantage could be found for the optimized strength enhanced POCO-HTC carbon foam fin compared with the aluminum fin for the application of power plant air-cooled steam condensers (ACC). The high material costs and fragility of high thermal conductivity carbon foam presented economic and durability concerns making it an unsuitable heat transfer media for the tested application. 1
Transcript
Ceramic Composites, Inc. 1110 Benfield Blvd, Ste Q, Millersville, MD 21108 A subsidiary of Technology Assessment and Transfer, Inc. 410-987-3435 fax 410-987-7172 www.techassess.com
AGENCY: DOE / NETL CONTRACT: DE-FG02-03ER83627 TITLE: Enhanced Performance Carbon Foam Heat Exchanger for
Power Plant Cooling REPORT: Final Technical Report PERIOD: 21 July 2003 – 13 July 2007 TPOC: Barbara Carney [email protected] PHONE: 304-285-4671 PI: Steven Seghi [email protected] PHONE: 410-987-3435 COMPANY: Ceramic Composites, Inc.
133 Defense Hwy, Ste 212 Annapolis, MD 21401
SBIR/STTR Rights Notice
These SBIR/STTR data are furnished with SBIR/STTR rights under Grant No. DE-FG02-03ER83627. For a period of 4 years after the acceptance of all items to be delivered under this grant, the Government agrees to use these data for Government purposes only, and they shall not be disclosed outside the Government (including disclosure for procurement purposes) during such period without permission of the grantee, except that, subject to the foregoing use and disclosure prohibitions, such data may be disclosed for use by support contractors. After the aforesaid 4-year period the Government has a royalty-free license to use, and to authorize others to use on its behalf, these data for Government purposes, but is relieved of all disclosure prohibitions and assumes no liability for unauthorized use of these data by third parties. This Notice shall be affixed to any reproductions of these data in whole or in part.
(End of Notice)
Executive Summary The purpose of this program was to demonstrate that high thermal conductivity carbon foam is an economically viable and/or efficiency improving technology to replace for aluminum fins in power plant air cooled steam condensers. Ceramic Composites, Inc. of Millersville, MD, a woman owned small business, teamed with Marley Cooling Technologies (MCT) of Kansas City, MO, a subsidiary of SPX Corporation, the world’s largest cooling tower manufacturer. Large-scale carbon foam heat exchangers were constructed and thermal performance tested. The thermal performance data for both the carbon foam and a state of the art aluminum heat exchanger was analyzed and compared. Analysis of the data showed that neither a thermal performance advantage nor a cost advantage could be found for the optimized strength enhanced POCO-HTC carbon foam fin compared with the aluminum fin for the application of power plant air-cooled steam condensers (ACC). The high material costs and fragility of high thermal conductivity carbon foam presented economic and durability concerns making it an unsuitable heat transfer media for the tested application.
1
Ceramic Composites, Inc.
1. HEAT EXCHANGER (HX) DESIGN OPTIMIZATION 1.1 Design Development MCT selected a 6” square HX sample size as suitable for the subscale testing of various heat exchanger fin configurations. The carbon foam was bonded to a ¼” thick 3003 aluminum substrate into which tapped holes and thermocouple access holes were drilled. These samples were mounted into the test system shown in Figure 1. The system was designed to control and monitor the air flow rate, power input to cartridge heaters, heater and air temperatures, and pressure differentials. The first sample mounted into the test system was the Hamon-Balckedurr crimped aluminum fin (Figure 2) used in commercial air cooled condensers. These fins have a nominal performance of 450 W/m·°C at an airflow rate of 2.2 m/s as compared to a typical straight finned aluminum radiator with a performance closer to 300 W/m·°C. The crimping of the fins can clearly be seen in the photograph and aides in disruption of the airflow down the channels, thereby increasing the heat transfer.
MCT was able to develop a model of the aluminum fin’s performance which closely matched the
Figure 1: MCT heat exchanger test system with detail of sample insertion area.
Figure 2: Hamon-Balckedurr crimped aluminum fin on an aluminum substrate.
2
Ceramic Composites, Inc.
performance found in large scale heat exchangers. They subsequently tuned the test system to achieve similar measured performance.
Figure 4: Wavy fin design.
1.2 Development of Foam HX Model Early in the program, ratios of fin width to channel widths were evaluated to gain an understanding of the impact upon pressure drop. The maximum pressure drop allowable for the air cooled condenser application is 1-inch of water and the selected nominal sizes of a 0.050” fin width and 0.100” channel width provides a pressure drop of 1.15 inches – sufficiently close at this point in development. Initial specimens, composed of straight fins of aluminum (Harmon optimized design) and of carbon foam were fabricated and tested. It was determined that adding a base thickness of 0.1 to 0.2” to the carbon foam fins improved both the bonding and the heat transfer performance to the fins.
3
Following the initial straight fin designs, two new designs were modeled, fabricated, and tested. The two are described as the Wavy design and the Chevron design. The Wavy design (Figure 4) is a series of serpentine fins that force the air to smoothly change direction as it passes along the HX, increasing turbulence and reducing surface barrier layer effects. The Wavy design also creates a pressure differential across the fin, promoting air flow through the fin which has been demonstrated by Oak Ridge National Laboratory to greatly increase the overall heat transfer coefficient (OHTC). The initial problem with the design was the cost of machining the Wavy configuration, which was effectively resolved during the program by identification of the optimal machining technique and equipment.
Figure 3: Chevron fin design.
As an affordable alternative, the Chevron alternative (Figure 3) was developed. Rather than needing a CNC system to machine the wavy fins, the Chevron uses straight cuts. This HX was fabricated from twelve 1” x 3” sections.
Ceramic Composites, Inc.
Thermal modeling of the straight aluminum fin results in the graphical performance shown in Figure 5 where the exit air has been heated to a uniform temperature of about 316°K. The modeled performance advantage of the wavy fin design is illustrated in Figure 6 where the exit temperature of the air reaches temperatures between 321 and 328°K. 1.3 Validation Testing
Figure 5: Thermal performance model of the optimized aluminum fin design illustrating temperature distribution of the air flow (left) and of the fin itself (right).
Figure 6: Thermal performance model of the carbon foam wavy fin design illustrating temperature distribution of the air flow (left) and of the fin itself (right).
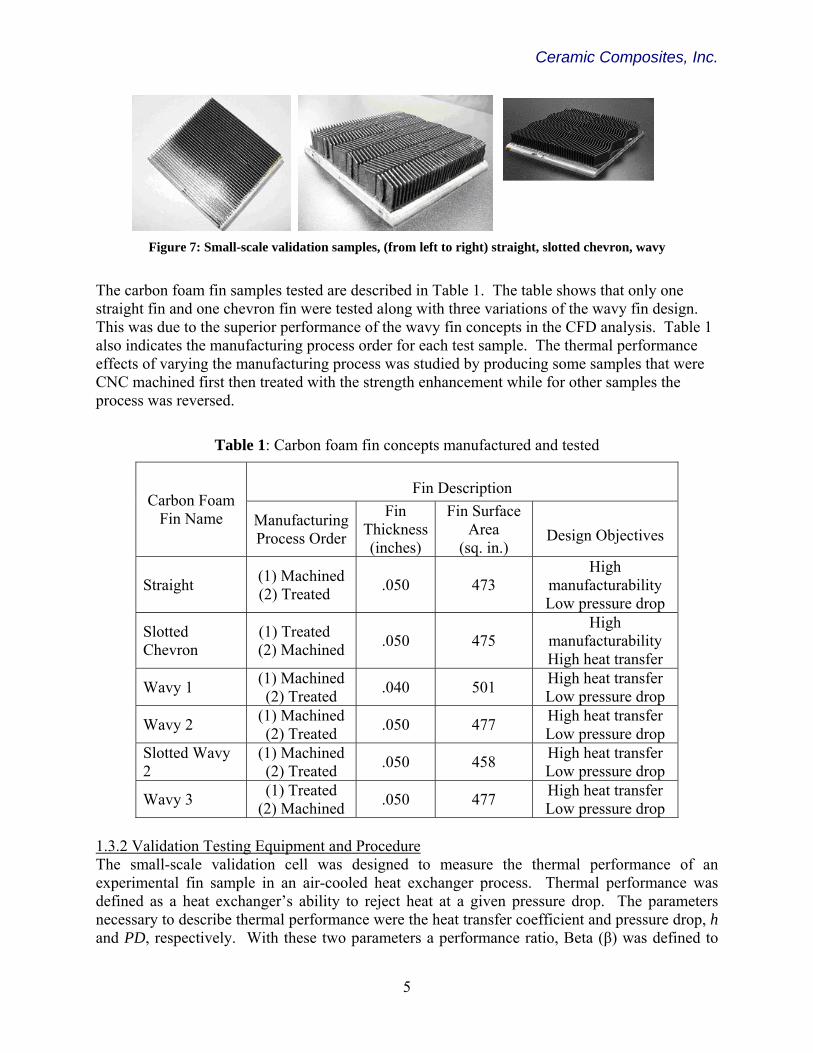
1.3.1 Validation Testing Geometries Validation testing was used to verify the results of the Computational Fluid Dynamics (CFD) work performed in the modeling effort and determine which fin concept would perform highest in an actual physical test and should therefore be selected for the large-scale heat exchanger test. Approximately thirty fin design concepts were analyzed using CFD software including various ribbed, pin, chevron, wavy, scalloped, straight and other innovative fin designs. Of these fin concepts only the optimized straight, chevron and wavy fins shown in Figure 7 were selected for small-scale validation testing. These selections were based on CFD predicted thermal performance data coupled with the cost of prototype manufacturing.
4
Ceramic Composites, Inc.
Figure 7: Small-scale validation samples, (from left to right) straight, slotted chevron, wavy
The carbon foam fin samples tested are described in Table 1. The table shows that only one straight fin and one chevron fin were tested along with three variations of the wavy fin design. This was due to the superior performance of the wavy fin concepts in the CFD analysis. Table 1 also indicates the manufacturing process order for each test sample. The thermal performance effects of varying the manufacturing process was studied by producing some samples that were CNC machined first then treated with the strength enhancement while for other samples the process was reversed.
Table 1: Carbon foam fin concepts manufactured and tested
Fin Description Carbon Foam
Fin Name Manufacturing Process Order
Fin Thickness(inches)
Fin Surface Area
(sq. in.) Design Objectives
Straight (1) Machined (2) Treated .050 473
High manufacturability Low pressure drop
Slotted Chevron
(1) Treated (2) Machined .050 475
High manufacturability High heat transfer
Wavy 1 (1) Machined (2) Treated .040 501 High heat transfer
Low pressure drop
Wavy 2 (1) Machined (2) Treated .050 477 High heat transfer
Low pressure drop Slotted Wavy 2
(1) Machined (2) Treated .050 458 High heat transfer
Low pressure drop
Wavy 3 (1) Treated (2) Machined .050 477 High heat transfer
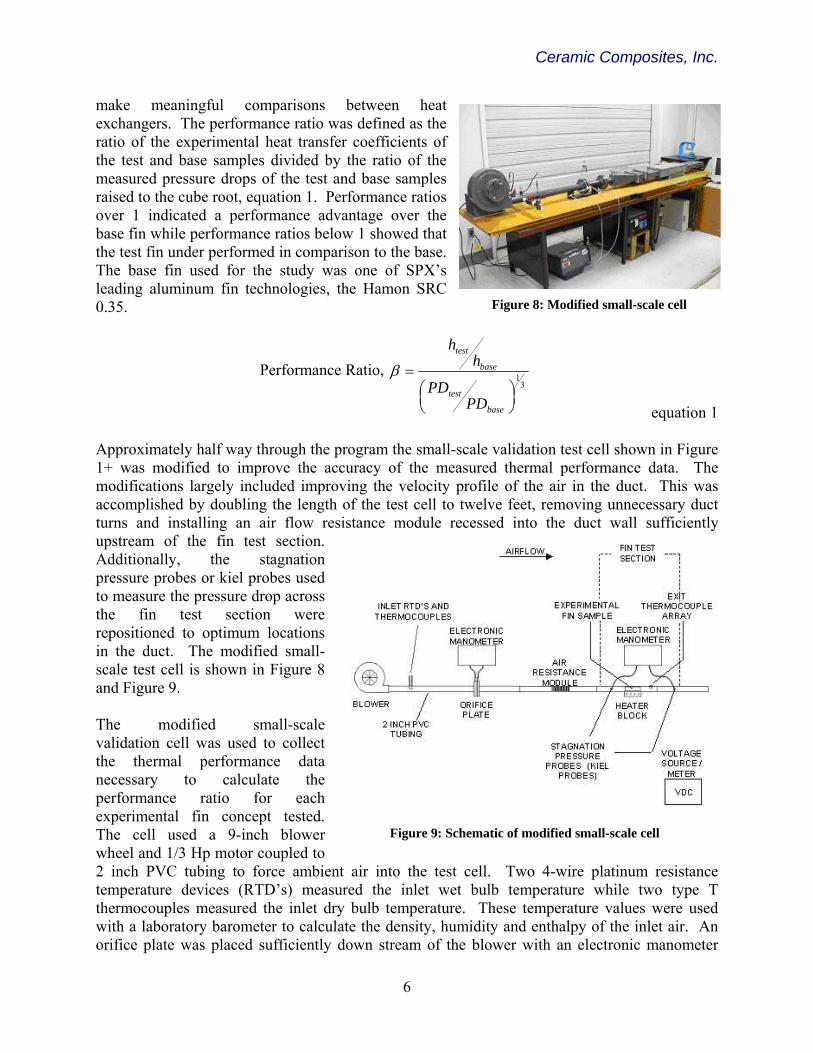
Low pressure drop 1.3.2 Validation Testing Equipment and Procedure The small-scale validation cell was designed to measure the thermal performance of an experimental fin sample in an air-cooled heat exchanger process. Thermal performance was defined as a heat exchanger’s ability to reject heat at a given pressure drop. The parameters necessary to describe thermal performance were the heat transfer coefficient and pressure drop, h and PD, respectively. With these two parameters a performance ratio, Beta (β) was defined to
5
Ceramic Composites, Inc.
make meaningful comparisons between heat exchangers. The performance ratio was defined as the ratio of the experimental heat transfer coefficients of the test and base samples divided by the ratio of the measured pressure drops of the test and base samples raised to the cube root, equation 1. Performance ratios over 1 indicated a performance advantage over the ase fin while performance ratios below 1 showed that
the test fin under performed in comparison to the base. The base fin used for the study was one of SPX’s leading alu ies, the Hamon SRC 0.35.
Performance Ratio
b
minum fin technolog
,
F
⎜⎝⎛ testPD
Approximately half way through the program the small-sc1+ was modified to improve the accuracy of the measmodifications largely included improving the velocity accomplished by doubling the length of the test cell toturns and installing an air flow resistance module recesseupstream of the fin test section. Additionally, the stagnation pressure probes or kiel probes used to measure the pressure drop across the fin test section were repositioned to optimum locations in the duct. The modified small-scale test cell is shown in Figure 8 and Figure 9. The modified small-scale
alidation cell was used to collect
ba
bas
test
PD
hh
ale ured
profile twelv
=β
vthe thermal performance data necessary to calculate the performance ratio for each experimental fin concept tested. The cell used a 9-inch blower wheel and 1/3 Hp motor coupled to 2 inch PVC tubing to force ambient air into the test cell. temperature devices (RTD’s) measured the inlet wet bulbthermocouples measured the inlet dry bulb temperature. Thwith a laboratory barometer to calculate the density, humidityorifice plate was placed sufficiently down stream of the blo
6
igure 8: Modified small-scale cell
31
⎟⎠⎞
d into the duct wall sufficiently
se
e
equation 1
validation test cell shown in Figure thermal performance data. The of the air in the duct. This was e feet, removing unnecessary duct
l
Figure 9: Schematic of modified small-scale cel
Two 4-wire platinum resistance temperature while two type T ese temperature values were used and enthalpy of the inlet air. An
wer with an electronic manometer
Ceramic Composites, Inc.
(EM) to measure the volumetric airflow. As the airflow approached the fin test section an open-celled foam air resistance module flattened out the velocity profile of the air. Periodic traverses of the duct’s cross-section with a hot wire anemometer verified that the velocity profile was within tolerance for valid test conditions. The airflow entered the fin test section after the inlet air properties were measured and the velocity profile was uniform.
The fin test section is shown in greater detail in Figure 10. An experimental fin sample was bolted to the heater block with a thin layer of thermal grease applied to the
amples at heat loadings of 150, 225 and 325 W ov
he performancehe heat transfer coefficient was calculated for each
interface of the fin sample plate and heater block to ensure efficient heat transfer from the block to the sample. Ten type T thermocouples wbase of the fin sample plate approximately 0.02thermocouples were positioned in the plate of the finalong the bottom of the fin as well as the temperaturesystem was powered the heater block then transferredresistance heaters placed within an oxygen free copppower into the heaters was produced and measured bytype T thermocouples were placed in the airflow behdry bulb temperature. The pressure drop across thelocated approximately five inches in front of and fifte A total of twenty-one tests were run for each experim
n
s1000 ft/min. Test data was collected for thirty stabilized and the energy or heat balance was 90% or inlet and exit air properties, airflow rate, power inpumonitored and recorded in one minute intervals by a D(DAS) and test program. The program used the intemperatures recorded off the fin sample to calcu(LMTD) of the heat transfer process. With the performance data recorded tTproduct of the fin sample footprint area (6 inches byproduced a heat transfer coefficient for each fin samppressure drop for each sample’s test run was correcft3/lbm. With the heat transfer coefficient and correvelocity the data set was curve fitted so that the perf
7
Figure 10: Schematic of fin test sectio
ed testing the er seven airflow rates ranging from 200 to
ratios for each fin sample were calculated. test run by dividing the power input by the
ere wired through the heater block into the inches below the base of a fin. The sample to measure the temperature profile s at the front and rear of the fin. When the heat, generated by four 150 W cylindrical er block, to the fin sample. The electrical an external voltage source and meter. Six ind the test fin sample to measure the exit sample was measured by the kiel probes en inches behind the fin test sample.
ental fin sample. This includ
minutes after the system had completely above. During this thirty minute period the t, pressure drop and fin temperatures were oric Digitrend 235 data acquisition system let and exit air properties along with the
late the log mean temperature difference
6 inches) and the LMTD. The calculation le that varied with velocity. The measured ted to a standard specific volume of 14.2 cted pressure drop defined as functions of ormance ratio as a function of velocity was
Ceramic Composites, Inc.
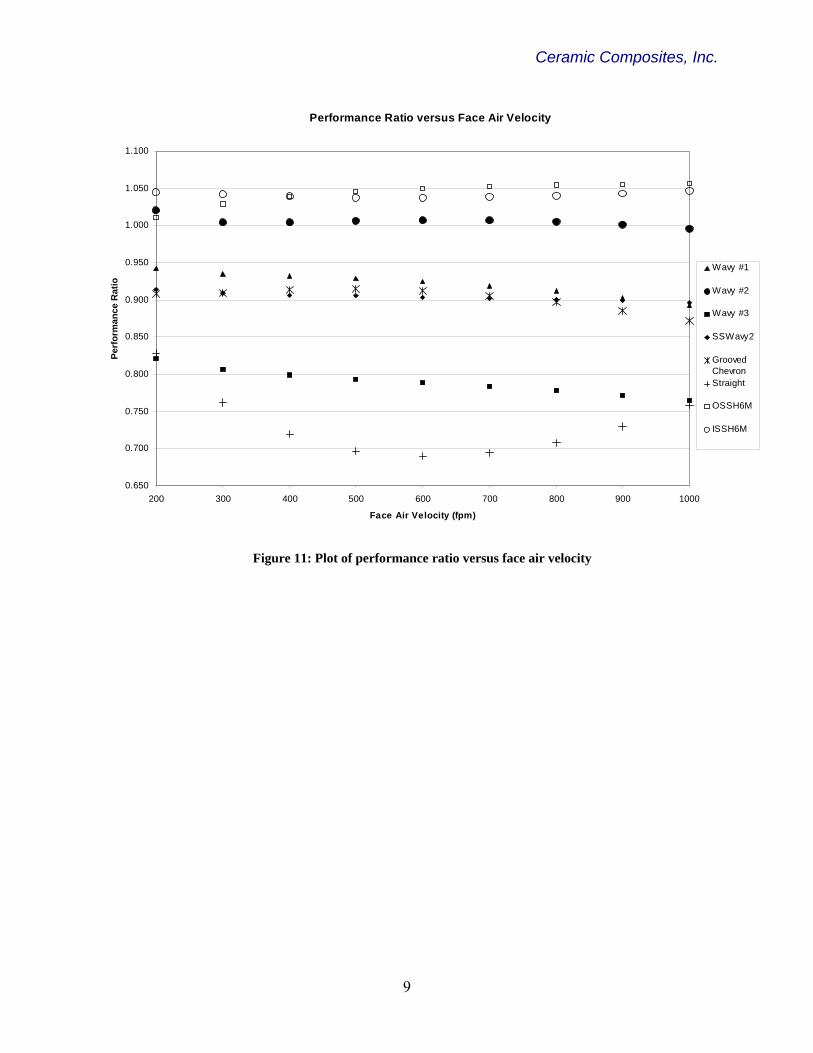
known for each fin sample. The performance ratios are plotted as a function of face air velocity in Figure 11. As illustrated in Figure 11 the Wavy 2 experimental fin sample demonstrated a slight
erformance advantage over the Hamon SRC 0.35 with values ranging from 1.021 to 0.996. The e
ficients
pplot also indicates that for geometrically identical fin samples, Wavy 2 and Wavy 3, thmanufacturing process order that produced the highest performance ratios was CNC machining first followed by strength enhancement. The test data revealed that the heat transfer coeffor fins Wavy 2 and Wavy 3 were nearly identical, however the values of the pressure drop for Wavy 3 exceeded those of Wavy 2 from 35% to 50%. The most likely explanation is that the strength enhancing coating after machining greatly reduced the surface roughness of the carbon foam fin. Based on the results of the validation testing detailed above, CCI and SPX Cooling Technologies selected the Wavy 2 fin configuration and manufacturing process as the heat transfer media for the large-scale heat exchanger.
8
Ceramic Composites, Inc.
Performance Ratio versus Face Air Velocity
0.650
0.700
0.750
0.800
0.850
0.900
0.950
1.000
1.050
1.100
200 300 400 500 600 700 800 900 1000
Face Air Velocity (fpm)
Perf
orm
ance
Rat
io
Wavy #1
Wavy #2
Wavy #3
SSWavy2
GroovedChevronStraight
OSSH6M
ISSH6M
Figure 11: Plot of performance ratio versus face air velocity
9
Ceramic Composites, Inc.
10
2. MANUFACTURING OPTIMIZATION CCI monitored the quality and consistency of the carbon foam billets delivered by POCO Graphite during the entire duration of this program. The bulk density of the first seventy-two is shown in Figure 2. Five stand out as being under the typical density value of 0.857 gm/cc. These were set aside for developmental tasks. Despite POCO having agreed to set a minimum bulk density specification of 0.8 gm/cc for the HTC billets after the first fifty billets, one of the last set of 22 was received under the specified bulk density.
0.720
0.740
0.760
0.780
0.800
0.820
0.840
0.860
0.880
0.900
0.920
A4-2-1
A4-2-13
A2-4-2
A4-2-11
A2-4-10
A2-4-16
A2-4-22
A4-2-16
A2-4-6
A6-1- 4
A6-2-12
A6-1-22
A6-1-12
A6-1-13
A6-2-24
A6-1-18
A6-2-16
A6-2-18
A6-1-10
A6-2-15
A6-1-24
A6-2-14
A6-2-5
A6-1-15
A6-1-23
A6-1-9
A6-2-6
A6-1-17
A6-1-11
A6-2-17
A6-1-1
A6-2-23
A6-2-9
A6-1-2
A6-1-6
A6-2-1
A6-1-21
A6-1-8
A6-1-5
A6-1-20
A6-1-7
A6-2-20
A6-2-10
A6-1-14
A6-2-11
A6-2-7
A6-1-16
A6-2-19
A6-2-8
A6-2-2
A7-1- 1
2
A7-1- 1
3
A7-2- 1
0
A7-1- 1
A7-2- 1
5
A7-1- 1
4
A7-1- 2
2
A7-1- 6
A7-2- 4
A7-2- 1
9
A7-1- 2
A7-2- 1
2
A7-1- 7
A7-2- 8
A7-2- 9
A7-2- 2
4
A7-1- 9
A7-1- 1
1
A7-2- 1
7
A7-1- 1
6
A7-2- 1
3
A7-2- 1
BULK DENSITY DATAAVG = 0.856 gm/ccSTD DEV = 0.023
Figure 12: Density data on as received POCO HTC billets.
2.1: Optimization of Structural Enhancement In the Phase I program, CCI evaluated single and multiple coatings of full concentration pre-ceramic polymers. In Phase II, this approach was changed to evaluate diluted polymers applied with single infiltrations. CCI repeated the infiltration process for carbon foam to obtain incremental improvements to the technique and also to provide additional samples for testing. Figure 13 illustrates the relationship between the KiON VL20 concentration level and the portion of silicon carbide formed following thermal processing. At the lower concentration levels, a dramatic rate of increase is noted while at higher concentrations, the rate of silicon carbide formation is more stagnant.
Ceramic Composites, Inc.
R2 = 0.87
0.10%
1.00%
10.00%
1% 10% 100%
Concentration of KiON VL20 in Infiltrant
SiC
CO
NTE
NT
(%)
Figure 13: Developed relationship between KiON VL20 infiltration and the amount of silicon carbide created.
This provides CCI with the ability to dilute the VL20 with a solvent to achieve a sufficient silicon carbide deposition. The majority of infiltrations were at the 2.5% concentration level as this has provided a sufficient amount of silicon carbide material (~½ vol%) and also an increase in compressive strength as illustrated in Figure 14. Figure 15 illustrates the dramatic loss in thermal conductivity of the samples as the silicon carbide content increases. This is expected to be related to both increased thermal diffusivity and broken ligaments. Figure 16 is a summary
4.0
4.5
5.0
5.5
6.0
6.5
0 20 40 60 80 100 120
Temperature Drop (°K)
Ulti
mat
e C
ompr
essi
ve S
tren
gth
(MPa
)
KionStarfireAs ReceivedKionStarfireKion 2Kion 3
Figure 14: Summary comparison of strength and thermal data.
11
Ceramic Composites, Inc.
4
4.5
5
5.5
6
6.5
0.0% 0.1% 1.0% 10.0% 100.0%
SILICON CARBIDE CONTENT (vol%)
Ulti
mat
e C
ompr
essi
ve S
tren
gth
(Mpa
)
Kion
Starfire
AsReceivedKion 2
comparison of the strength and temperature drop data with better properties appearing in the upper left. Based on this data, samples infiltrated with 2.5 to 5% concentrations of KiON VL20 produced the better results. The material was fired to 1100°C, compared to 900°C during the Phase I program, providing increased strength. The final heat treatment temperature difference has been found to influence the strength, but not the bonding or thermal properties.
Figure 15: Correlation of silicon carbide content with ultimate compressive strength.
0
20
40
60
80
100
120
0.0% 0.1% 1.0% 10.0% 100.0%
SILICON CARBIDE CONTENT (vol%)
Tem
pera
ture
Dro
p (°
C)
Kion
As Received
Kion 2
Figure 16: The influence of increased silicon carbide and temperature drop using the guarded hot plate method.
12
Ceramic Composites, Inc.
2.2 Optimization of Bonding The expense of bonding the carbon foam to the metal was costly early in the program with S-Bond having chosen to perform all pre-metalizing in house. They were experiencing excessive bond failures with their product when customers were performing the metalizing. The expense of having S-Bond perform the metalizing on 60 square feet of carbon foam needed for the large heat exchanger was not only excessive, but the schedule would not allow for the additional time. Instead, CCI purchased a Sunbonder USM-28 (Figure 17), a portable ultrasonic soldering device which operates like a conventional soldering iron, but without using flux for soldering of glass, ceramic and hard to solder metals. This unit pre-heats the 2” x ½” soldering tip and applies an ultrasonic force to wet the pre-heated carbon foam with the solder. Soldering takes place about 10°C above the melting temperature of the solder.
Figure 17: Kuroda Ultrasonic Bonder “Sunbonder”.
Initial work was performed with the S-Bond solder, but continued development work with the Edison Welding Institute changed the solder to a less expensive composition. CCI purchased 99.5% Sn/0.5%Al solder (MP = 230°C) from EWI and used it to bond the majority of the validation samples and all the foam for the final heat exchanger. A commercially available soldering pot was also purchased to pre-melt and hold the solder. Two 12” x 24” used hot plates were purchased to pre-heat the aluminum tubing as was a 12” x 48” x ½” copper slab.
To determine the largest sample of carbon foam that could be soldered to an aluminum plate, several samples were prepared. The concern here was the difference in thermal expansion between the carbon foam and the metal plate. 3” wide samples, 3”, 6”, 9” and 12” long were soldered together and allowed to cool. The contraction of the metal plates forces the carbon foam to arch. The degree of bend is 0.11” over the 12” span, or 0.01 inches per inch, documented in Figure 18. Via stress analysis it was determined that the largest acceptable size for bonding of carbon blocks was 4 inches. 2.3 Optimization of Machining During the course of the program CCI identified a machining house which possesses the CNC controlled router identified early in the program as a strong candidate for machining the fin pattern into the carbon foam. As expected, this equipment worked extremely well for the machining efforts, producing first test samples, the majority of the validation specimens, and all the carbon foam required for the final heat exchanger. The cost of the machining effort was significantly lower than previous quotes and the machining performed on the earlier validation specimens (which used a significantly more simple geometry). The cost of machining was factored into the economic analysis.
13
Ceramic Composites, Inc.
Figure 18: Bending of carbon foam on aluminum caused by differential CTE.
14
Ceramic Composites, Inc.
3. HEAT EXCHANGER FABRICATION AND TEST 3.1 Carbon Foam HX Design The initial heat exchanger design was a 10 row, 5 pass air-cooled coil using hot water as the process fluid. The design allowed for both the Hamon and carbon foam coils to be installed between the manifolds. The coils had face areas approximately 2’ by 5’ allowing for air flow rates of 250 to 800 feet per minute (fpm). The coils were installed inside of an insulated sheet metal shell and piped to allow for water flow rates between 50 to 500 gallons per minute (gpm). The test set up was instrumented to measure the heat input and water flow rate, air flow rate, inlet and outlet wet bulb and dry bulb and air side pressure drop. These were the necessary parameters to make meaningful comparisons between the aluminum and carbon foam heat exchangers. During the final year of the program, prior to the fabrication of the aluminum or carbon foam HX, the heat exchanger coil was modified from a 10-row, 5-pass configuration to an 8-row, 4-pass configuration. The design modification was motivated by the internal pressure limit of the single row condenser (SRC) tube at the water flow rate necessary for valid test conditions. By reducing the effective length of the coil to 8 rows less pressure is required to pump the process fluid through the system. The large-scale test cell shown in Figure 19 was designed to measure the thermal performance of an air-cooled heat exchanger coil. The test cell was approximately ten feet in length and six feet in height at the coil section. With the exception of the Plexiglas windows and CPVC piping the test cell was constructed entirely from stainless steel sheet metal and plate parts. The test cell allowed for the aluminum Hamon coil and the carbon foam coil to be interchanged without manufacturing significant numbers of new and expensive stainless steel parts. The test cell was designed to facilitate thermal performance testing in the following manner. Water pumped from a boiler system at 150°F and 80 GPM enters the top of the coil at the inlet manifold. The hot process water serpentines vertically through the coil by means of customized stainless steel u-bends that connect the SRC tubes to one another. As the water travels the length of the coil it was cooled by indirect contact of ambient air that was forced through the test cell by a large blower. Twenty-seven feet of duct including a venturi to measure
Figure 19: Solid Edge model of large-scale test cell
15
Ceramic Composites, Inc.
the airflow rate separated the exit of the blower and the test cell inlet.
3.2 Aluminum and Carbon Foam Heat Exchanger Fabrication The aluminum large-scale test set-up underwent a series of tests covering burner operation and controls, flow controls, internal coil pressure monitoring, air leak and water leak tests. Other tasks that were completed include modifying the current DAS program and instrumenting the test cell with RTD’s, thermocouples and pressure probes necessary for collecting thermal performance data. The
st cell is shown in Figures 20, 21 and 22.
esting and erformance Assessment
.3.1 Large-Scale Heat Exchanger Testing
late
at n Figure 2
strum
n aluminum fin-tube bundle manufactured by SP
te
3.3 Carbon Foam HX TP 3 A large-scale test cell was designed to simua direct dry cooled mechanical draft ACC process like the one shown in Figure 23. The goal of the test cell was to provide the test datanecessary to make a performance comparison between the aluminum and carbon foam heexchangers. The test cell shown below iventuri, removable fin-tube bundle section, inOne exception to the ACC simulation was that horather than steam. This substitution was logical anplaced on the evaluation and comparison of the aiside pressure drop and the air-side heat transfer. Afirst bundle tested. Shown in Figures 25, 26, and tube, eight-pass heat exchanger with a face area mplaced in the duct of the test cell in direct contact flow. A burner and CPVC pipe system brought hinlet header of the fin-tube bundle at flow rates beResistance temperature devices (RTD’s) were pla
16
Figure 20: Assembled aluminum 8-row coil made from Hamon SRC tubes
4 consisted of a centrifentation (DAS).
ndles
X Cooling Technologies (SPX CT) was the t-
t water circulated through the fin-tube bud valid for this study as the emphasis was
r-side thermal performance, namely, the air-
Figure 21: Large-scale test cell
ugal fan (blower), and a data acquisition system
27, the aluminum fin-tube bundle was an eigheasuring 48 x 18 inches. The bundle was with the air stream but perpendicular to theot water ranging from 125 to 150°F into the tween 40 and 70 gallons per minute (GPM). ced sufficiently upstream of the inlet header to
Ceramic Composites, Inc.
measure the bulk temperature of the water at the inlet. The hot water flowed through the bundle, circulating vertically through the tubes by stainless steel u-bends connected to the bundle’s top and bottom manifold covers. RTD’s sufficiently downstream of the outlet header measured the bulk temperature of the exiting water. The sides of the bundle and the downstream duct walls ofthe test cell were insulated with 0.5 inch thick rigid PVC foam sheets ensuring acceptable heat balances.
bient air
the
ce grid was
e fin-tube
was
leted
let water and air temperatures. A test was
On the air-side, the blower forced amthrough the test cell at air velocities between 200 and 800 ft/min. RTD’s located within the duct measured the wet and dry bulb temperatures of the inlet air necessary for the calculation ofair density and moisture content. To create a more uniform air profile an air resistanmade of 1 inch thick open-celled foamplaced at the exit of the venturi. The cooler ambient air entered the fin-tube bundle test section impinging upon the face of thbundle, cooling the circulating hot water. The hot air passed through the fin-tube bundle wherethe temperature profile of the air streammeasured by a grid of sixteen, type - Tthermocouples. The pressure drop across the bundle was measured by Kiel probes located in front of and behind the bundle. A total of twenty-one valid tests were compfor the aluminum bundle covering a range of inconsidered valid if the heat balance was between
calmetem10insmeresaccpreforpostawo
Figure 22: Face area of coil seen through exitduct
95 and 105%. The heat balance was a culation of what percent of the heat lost by the water was heat transferred to the air by a asured increase in the exiting air perature. Ideally, each test would have a
0% heat balance but heat losses through the ulation and uncertainties in the asurements of the RTD’s and thermocouples ulted in imperfect heat balances. With eptable heat balances, the heat transfer and ssure drop characteristics were determined the aluminum bundle at each operating int. This performance data was used as the ndard that the carbon foam fin-tube bundle uld be measured against.
Figure 23: Direct Dry Cooled ACC Process
17
Ceramic Composites, Inc.
Figure 24: Schematic of Large-Scale Test Set-Up
Figure 26: Aluminum Finned Condensing Tube
Figure 25: Aluminium Fin-Tube
Bundle
Figure 27: Aluminium Fin-Tube Bundle
The carbon foam fin-tubes required a considerable amount of work before the tubes could be ssembled into a bundle for testing. CCI produced the carbon foam tubes by soldering machined
carbon foam billets measuring approximately 3” x 4” x 1” to the bare condensing tubes provided a
18
Ceramic Composites, Inc.
by SPX CT. Each side of the bare condensing tubes had the optimized wavy carbon foam fins, shown in Figure 30, soldered 48 inches down the length of the tube, 8 inches across the width or air travel direction and at a fin height of 1 inch. Once the carbon foam tubes were completed they were shipped to SPX CT’s Development Center (D/C) for bundle assembly and thermal performance testing (shown in Figures 28 and 29). Thermal performance testing of the carbon foam fin-tube bundle was carried out in the same manner as the aluminum bundle. Twenty-one valid sets of test data were collected over a range
f inlet water and air temperatures. Particular attention was given to the condition of the carbon ofoam fins at the higher air-flow rates. Very small sections of the carbon foam fins were easily damaged during the assembly of the bundle and it was thought that the dynamic pressure of the high velocity air might damage the fins as well. Another concern associated with the carbon foam fins during thermal testing was the possibility of contamination of the discharge air with carbon foam particles. The amount of airborne particles, if any, was unknown as were the inhalation hazards. As a precautionary measure a system of HEPA filters was installed at the exit of the test cell to filter the discharged air.
Figure 29: Carbon Foam Fin-Tube
Bundle
Figure 28: Carbon Foam Fin-Tube
Bundle Figure 30: Carbon Foam Wavy Billets
19
Ceramic Composites, Inc.
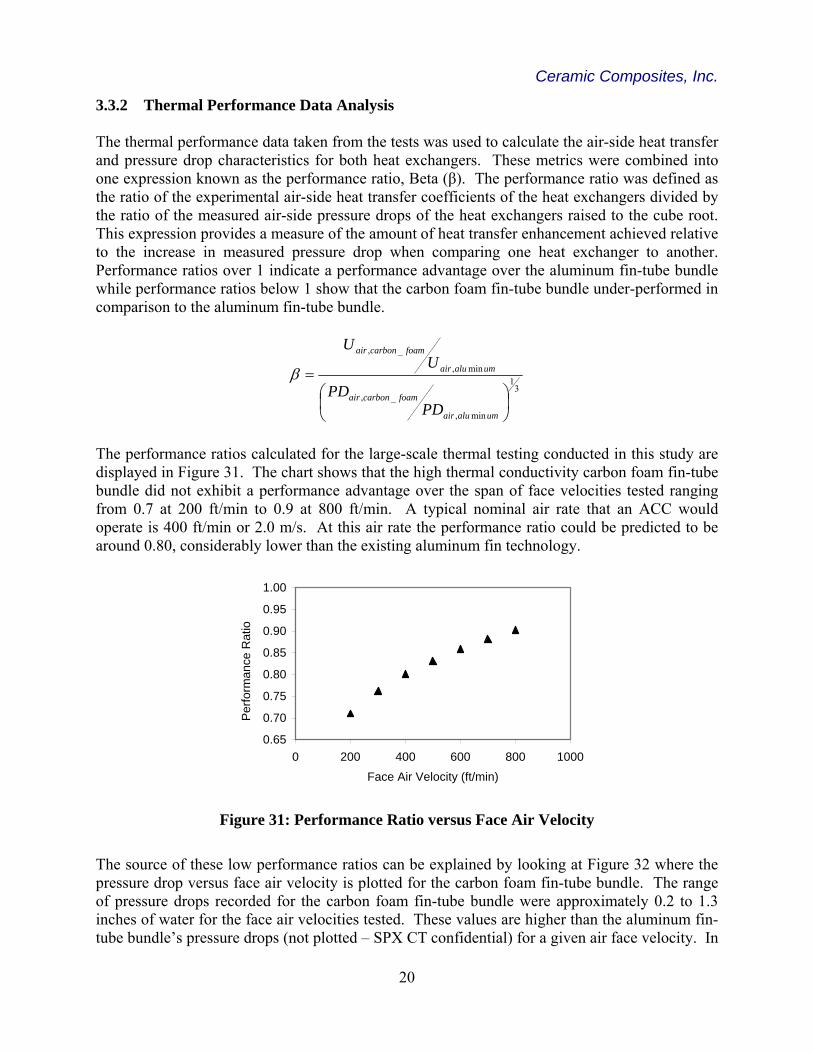
3.3.2 Thermal Performance Data Analysis The thermal performance data taken from the tests was used to calculate the air-side heat transfer and pressure drop characteristics for both heat exchangers. These metrics were combined into one expression known as the performance ratio, Beta (β). The performance ratio was defined as the ratio of the experimental air-side heat transfer coefficients of the heat exchangers divided by the ratio of the measured air-side pressure drops of the heat exchangers raised to the cube root. This expression provides a measure of the amount of heat transfer enhancement achieved relative to the increase in measured pressure drop when comparing one heat exchanger to another. Performance ratios over 1 indicate a performance advantage over the aluminum fin-tube bundle while performance ratios below 1 show that the carbon foam fin-tube bundle under-performed in comparison to the aluminum fin-tube bundle.
31
min,
_,
min,
_,
⎟⎠⎞
⎜⎝⎛
=
umaluair
foamcarbonair
umaluair
foamcarbonair
PDPD
UU
β
The performance ratios calculated for the large-scale thermal testing conducted in this study are displayed in Figure 31. The chart shows that the high thermal conductivity carbon foam fin-tube bundle did not exhibit a performance advantage over the span of face velocities tested ranging from 0.7 at 200 ft/min to 0.9 at 800 ft/min. A typical nominal air rate that an ACC would op air rate the performance ratio could be predicted to be around 0.80, considerably lower than the existing aluminum fin technology.
erate is 400 ft/min or 2.0 m/s. At this
0.85
0.65
0.70
0.75
0.80
0 200 400 600 800 1000
Face Air Velocity (ft/min)
Perf
Figure 31: Performance Ratio versus Face Air Velocity
he source of these low performance ratios can
0.90
0.95
1.00
orm
ance
Rat
io
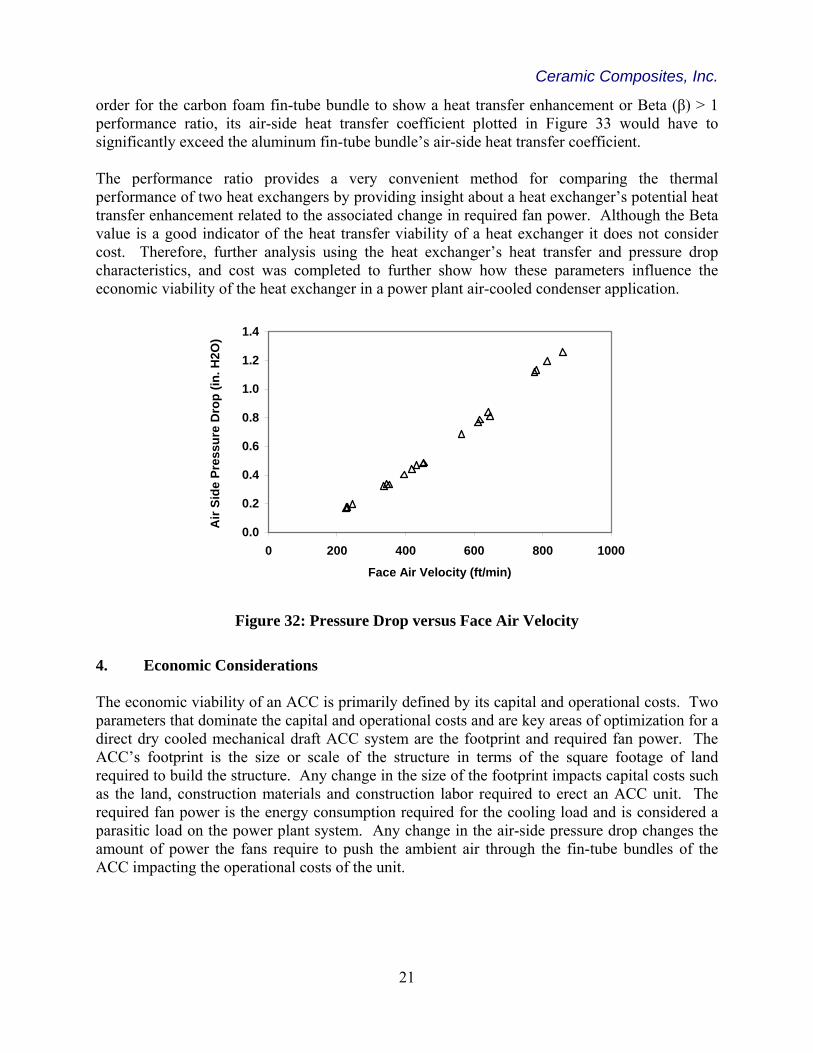
be explained by looking at Figure 32 where the p versus face air velocity is plotted for the carbon foam fin-tube bundle. The range
of pressure drops recorded for the carbon foam fin-tube bundle were approximately 0.2 to 1.3 inches of water for the face air velocities tested. These values are higher than the aluminum fin-tube bundle’s pressure drops (not plotted – SPX CT confidential) for a given air face velocity. In
Tpressure dro
20
Ceramic Composites, Inc.
order for the carbon foam fin-tube bundle to show a heat transfer enhancement or Beta (β) > 1 performance ratio, its air-side heat transfer coefficient plotted in Figure 33 would have to significantly exceed the aluminum fin-tube bundle’s air-side heat transfer coefficient. The performance ratio provides a very convenient method for comparing the thermal
erformance of two heat exchangers by providing insight about a heat exchanger’s potential heat ptransfer enhancement related to the associated change in required fan power. Although the Beta value is a good indicator of the heat transfer viability of a heat exchanger it does not consider cost. Therefore, further analysis using the heat exchanger’s heat transfer and pressure drop characteristics, and cost was completed to further show how these parameters influence the economic viability of the heat exchanger in a power plant air-cooled condenser application.
0.0
0.2
0.4
0.6
0.8
1.0
1.2
1.4
0 200 400 600 800 1000
Face Air Velocity (ft/min)
Air
Side
Pre
ssur
e D
rop
(in. H
2O)
e of land quired to build the structure. Any change in the size of the footprint impacts capital costs such
Figure 32: Pressure Drop versus Face Air Velocity 4. Economic Considerations The economic viability of an ACC is primarily defined by its capital and operational costs. Two parameters that dominate the capital and operational costs and are key areas of optimization for a direct dry cooled mechanical draft ACC system are the footprint and required fan power. The ACC’s footprint is the size or scale of the structure in terms of the square footagreas the land, construction materials and construction labor required to erect an ACC unit. The required fan power is the energy consumption required for the cooling load and is considered a parasitic load on the power plant system. Any change in the air-side pressure drop changes the amount of power the fans require to push the ambient air through the fin-tube bundles of the ACC impacting the operational costs of the unit.
21
Ceramic Composites, Inc.
2000
2500
3000
3500
4000
4500
5000
5500
0 200 400 600 800 1000
Face Air Velocity (ft/min)
U air (
W/m
2 -K
)
Figure 33 Velocity
s that exist for the footprint on the air-side heat transfer oefficient and the dependency of the required fan power on the air-side pressure drop
ACC. At the maximum air elocity, close to twice the typical air rate ACC’s operate, the carbon foam ACC demonstrated
impressive heat rejection potential resulting in a footprint size 10% smaller than the aluminum ACC but also demonstrated the highest fan power requirements in the analysis more than doubling the fan requirements of the aluminum ACC. At the typical air velocity of 400 ft/min the carbon foam ACC edged the aluminum ACC with a 0.5% reduction in footprint size but with a marked 50% increase in required fan power. Overall, the plot in Figure 34 can be used to quickly determine the difference in footprint or fan power needed for the aluminum and carbon foam ACC’s at the given duty. This is accomplished by keeping one parameter constant and observing the resulting differential in the other parameter. For example, for the given operating condition displayed in Table 2 and a fixed footprint area of 21,000 ft2 the required fan power for the aluminum ACC is approximately 450 Hp and close to 850 Hp for the carbon foam ACC. Since the curve of the carbon foam ACC falls to the right of the aluminum ACC curve (or in the direction of increasing fan power) an increase in the operating cost for the required fan power is observed for fixed footprints. For fixed fan power, the curve of the carbon foam ACC is above the aluminum ACC curve (or in the direction
: Air-Side Heat Transfer Coefficient versus Face Air Fortunately, there are strong dependencieccorrelation. These correlations can be seen in Figure 34 where the minimum footprint area of each ACC configuration is plotted against the minimum possible fan power required to condense steam at the duty shown in Table 2. This plot is the result of a rating analysis performed using the air-side thermal performance characteristics of each ACC configuration at a nominal operating point in a typical ACC application. The first observations that can be made from Figure 34 are the limitations of the thermal performance parameters on footprint and fan power. At the minimum air velocity, about half the typical air rate, the aluminum ACC demonstrated a 5% reduction in footprint size and a 40% reduction in required fan power compared to the carbon foamv
22
Ceramic Composites, Inc.
of increasing footprint size) indicating that an increase in the capital costs associated with a larger footprint size will be experienced.
12000
15000
18000
21000
24000
27000
30000M
inim
um P
ossi
ble
AC
C F
ootp
rint A
rea
(ft 2 ) Aluminum
Carbon FoamAluminum TypicalCarbon Foam Typical
ACC Optimization1) smaller scale2) lower energy cost
Max air velocity
Minimum air velocity
90000 1000 2000 3000 4000 5000
Minimum Possible Fan Power
Figure 34: Footprint versus Fan Power
Table 2: Rating Input for Typical ACC Application
English Units
SI Units
AIR-SIDE Ambient temperature 77 °F 25 C Relative humidity 50% 50% Face velocity range 200 to 800 ft/min 1.0 to 4.0 m/s Fan static efficiency 60% 60%
STEAM-SIDE Heat rejection 341 MBtuH 100 MW
To simplify the capital cost comparison associated with each ACC’s unit footprint cost a cost ratio between the aluminum and carbon foam ACC’s was developed. The cost ratio compared the cost of the heat exchangers when subjected to the same duty and fan power. The cost ratio accounts for not only the difference in minimum footprint needed for each ACC configuration at
23
Ceramic Composites, Inc.
fixed fan power but also the difference in unit footprint cost. The cost ratio was developed using the current material and production costs for aluminum and carbon foam finned heat exchangers.
he cost of machining the carbon foam was excluded from the calculation, as this was a production cost uniquely associated with this study. For this study the heat exchanger cost ratio varied slightly with air velocity but on average the value was approximately 350 to 1. This means for the typical duty provided in Table 2 and a given fan power, the cost of a carbon foam ACC is 350 times more expensive than the aluminum ACC. Again, this figure reflects the change in the minimum footprint area coupled with the change in unit footprint cost when moving from the aluminum fin technology to the high thermal conductivity carbon foam technology. An analysis was made that demonstrates the impact of the increased pressure drop of the carbon foam fin-tube bundle on an ACC’s annual operating cost. The analysis was conducted for the duty detailed in Table 2 for the smallest and largest footprints shared between the aluminum and carbon foam ACC’s plotted in Figure 34. At these footprints of 10,500 ft2 and 27,500 ft2 the smallest and largest difference in fan power between the two ACC’s is observed. The annual operating cost of powering the fans for each ACC at the smallest and largest footprints is plotted in Figure 35 against the duration of usage. Usage on the horizontal axis is defined in terms of percentage of the year the fans operate. The vertical axis represents the annual cost of operating the ACC’s fans in millions of dollars. This figure was calculated by multiplying the fan power each ACC consumed by the U.S. total average price of $.0877 per kilowatt-hour1. This is the average purchase price of electricity for residential, commercial and industrial users in the Unite
igure 35 illustrates that the increase in pressure drop of the carbon foam fin-tube bundle increases the annual st footprints at 25% usage to over $1.5 m eems counterintuitive but is based on the linear relationship that exists between the volumetric airflow rate and flow area. For a smaller flow area to me volum w rate as a larger f w area the velocity of the air must increase proportionally and will have a higher associat ssure drop.
T
d States as of April 2007. F
operating cost at a minimum of $50k between the largeillion between the smallest footprints at 100% usage. The result s
maintain the sa etric airfloloed system pre
1 Energy Information Administration - Electric Power Monthly (July 2007), pp.105
24
Ceramic Composites, Inc.
2.5
3.0Al. min. footprint
CF min. footprint
Al. max footprint
CF max footprint
0.0
0.5
1.0
0 25 50 75 100
1.5
2.0
Mill
ions
of D
olla
rs
Usage as Percentage of Year Fans Operate
Figure 35: Annual Fan Power Costs 5. Conclusion The results of this study show that strength enhanced POCO-HTC high thermal conductivity arbon foam is not a practical heat transfer media for use in power plant air-cooled steam
ting cost increased at a rate of 2.5 to 1 depending on fan usage. For carbon foam ACC’s to be cost effective the cost per square foot will have to be drastically reduced and researchers will have to continue optimizing the thermal performance by reducing the pressure drop required to force air through carbon foam heat exchangers. Fragility concerns also threaten the carbon foam’s debut into ACC technology. The fragile material is more difficult to work with than aluminum even with significant improvements made to the carbon foam’s compressive strength through the application of coatings. Any impact to the fins permanently fractures the fins leaving a percentage of the effective heat transfer surface area of the heat exchanger damaged and unusable. Further, the carbon foam’s fragility, leading to debris formation, would place special restrictions and considerations to areas such as shipping of the carbon foam bundle, handling during construction, maintenance and cleaning. The strength and durability of carbon foam heat exchangers will have to significantly increase in order to be a viable option for use in power plant ACC’s.
ccondensers due to the overall thermal performance, high material costs, fragility and unknown inhalation hazards of carbon foam. The carbon foam finned ACC demonstrated impressive heat transfer potential at high air flow rates but the associated pressure drops required for the cooling process are overwhelmingly expensive. At these high air flow rates the material exhibited the potential for decreasing the size of an aluminum ACC by 10% but the high material costs of the carbon foam persisted in increasing the capital cost of the carbon foam ACC to 350 times more than the aluminum ACC while opera
25
Ceramic Composites, Inc.
Ultimately a significantly less costly foam would be required that possesses a significantly lower pressure drop. Preferably, the carbon form would have a sufficiently permeable structure to allow for its use as a solid block, removing the need to machine fins into the structure. This would greatly reduce the fragility and possibility of generating particulates in the air flow.