68
CERC‐BEE Task F2 Introduction to U.S. Best Practices in Building Retro‐Commissioning Xiang Liu and Sherry Hu Natural Resources Defense Council June 2013

CERC‐BEE Task F2
Introduction to U.S. Best Practices in Building Retro‐Commissioning
Xiang Liu and Sherry Hu
Natural Resources Defense Council
June 2013

Acknowledgement
This report was sponsored by the U.S.-China Clean Energy Research Center’s Building Energy Efficiency Program funded by the United States Department of Energy.
The authors are especially thankful to the following colleagues for their support, input, and insightful comments and suggestions: David Goldstein (NRDC), Jingjing Qian (NRDC), Laurie Kerr (NRDC), Zhiming Pan (NRDC), Barbara Finamore (NRDC), Nan Zhou (LBNL), Mark Lavine (LBNL), and Adam Hinge (Sustainable Energy Partnerships).
Disclaimer
While this report is believed to contain correct information, neither the sponsors of this work nor any organizations that the authors affiliated with, makes any warranty, express or implied, or assumes any legal responsibility for the accuracy, completeness, or usefulness of any information contained in this report. Reference herein to any specific commercial product, process, or service by its trade name, trademark, manufacturer, or otherwise, does not necessarily constitute or imply its endorsement, recommendation, or favoring by any sponsors of this work and any organizations that the authors affiliated with. The views and opinions expressions in this report are solely those of the authors.

TableofContents
EXECUTIVE SUMMARY 1
INTRODUCTION 5
CHAPTER 1 RETRO-COMMISSIONING PROCESS AND BEST PRACTICES 7
Phase 1: Planning 8
Phase 2: Investigation 9
Phase 3: Implementation 10
Phase 4 and 5: Hand-Off and Implementation of Persistence Strategies 10
RCx Team Members and Their Roles 11
CHAPTER 2 MEASURES COMMONLY IMPLEMENTED IN RETRO-
COMMISSIONING PROJECTS 13
The Easiest RCx Measures 13
More Technical RCx Measures for More Energy Savings 13
Case Studies 14
CHAPTER 3. BENEFITS OUTWEIGH COSTS IN RETRO-COMMISSIONING 19
Benefits 19
Costs 21

CHAPTER 4 MEASURING AND VERIFYING (M&V) SAVINGS OF RETRO-
COMMISSIONING 24
Importance of M&V in Retro-Commissioning 24
Common Risks in Measuring and Verifying Energy Savings 25
Overview of M&V 25
Method 1: Engineering Calculations with Field Verification 30
Method 2: System or Equipment Energy Measurement 32
Method 3: Energy Models Using Interval Data 32
Method 4: Calibrated Simulation 33
Method Selection 34
CHAPTER 5. U.S. SUPPORT POLICIES AND PROGRAMS AND
RECOMMENDATIONS FOR CHINA 44
RCx Policy in the U.S. 45
Recommendations for China 50
REFERENCES 53
ANNEX I. TECHNICAL MEASURES OFTEN USED IN RETRO-COMMISSIONING 55

1
Executive SummaryRetro-commissioning or existing building commissioning (RCx) is a process of to identify and correct the almost inevitable “drift” from how a building should operate and to ensure the building’s optimal performance. RCx has gained much popularities in the U.S., whose experience has demonstrated that RCx can result in impressive energy use efficiency as well as provide multiple benefits to building owners, including lowering utility costs, protecting and enhancing property value, avoiding future liability, and reducing repair and replacement costs. In China, the concept of RCx is still new and its energy saving potential has not been fully studied and recognized. Therefore, this report intends to provide a comprehensive description of U.S. RCx experience to the Chinese policy makers and professionals working in the building energy efficiency business, with an eye towards increasing their attention to this important and largely ignored energy efficiency opportunity and to promoting subsequent adoption of supportive policies for wider RCx practice.
Best Practices in RCx Process A well-planned and fully executed RCx project generally consists of five phases: Planning, Investigation, Implementation, Hand-off, and Ongoing. In the planning phase, the primary tasks for an RCx service provider include screening candidate buildings through reviewing available references, discussions with building owners, making initial site visits, and if data available, analyzing the energy use per square foot and performing an initial benchmarking. Project objectives will be clearly defined; a team of different specialists and stake holders will be assembled; an RCx plan, including projected costs and savings associated with the project, will be developed. In the investigation phase, the objective is to conduct detailed investigations to compare the actual building conditions and system performance with the building owner’s current operational needs and requirements defined by the current facility requirements. The primary focus at this investigation stage is to understand how and why building systems are currently operated and maintained, identify issues and potential improvements, and select the most cost-effective improvements for implementation. The main work in the implementation phase is to carry out the measures selected from the master list of findings and agreed to by pertinent stake holders. It is also an important task in this phase to verify that the predicted results and system performance are achieved. To achieve actual and lasting energy savings, it is important to ensure a smooth hand off and transition from the commissioning process/team to the personnel responsible for long-term operation and maintenance of the building. At the Hand-Off Phase, the team should complete a final report summarizing each improvement; conduct facility staff training; hold a project close-out meeting; and generate a post-RCx energy performance rating. Afterwards, persistence strategies should be designed and used to make sure

2
persistent RCx benefits. A plan should be developed to provide the building personnel with detailed instruction and tools for strategic operational, monitoring and maintenance tasks that help maintain the RCx process’s performance benefits and support continuous improvement.
Common RCx Measures Improving a building’s energy use efficiency will inevitably embrace a range of actions, including the installation of certain energy efficiency measures, which can range from no or low cost behavior changes to capital investments in technological upgrades. The easiest RCx measures include turning off or slow down equipment and systems when not in use. RCx measures for air handling units include adjusting total air flow for constant air volume systems, setting minimum outside air intake correctly, improving static pressure set point and schedule, optimizing supply air temperatures, improving economizer’s operation and control, improving coupled control AHU operation, installing variable frequency drive (VFD) on constant air volume systems, controlling airflow in variable air volume (VAV) systems, and improving terminal box operation. RCx measures for water/steam distribution system include improving building chilled water pump operation, improving secondary loop operation and improving central plant water loop operation. RCx measures for central chiller plants include using the most efficient chillers, resetting the supply and condensing water temperature, increasing chilled water return temperature, using variable flow under partial load conditions, and optimizing chiller staging. RCx measures for central heating plants include optimizing supply water temperature and steam pressure, optimizing airside operation, optimizing boiler staging, and improving multiple heat exchanger operation. Cost-Effectiveness of RCx Case studies from literature show compelling evidence that commissioning is arguably the single-most cost-effective strategy for reducing energy and greenhouse gas emissions in buildings. A 2009 study showed that the value of energy savings ranged from $0.11/ft2 to $0.72/ft2, and the value of non-energy savings ranged from $0.10/ft2 to $0.45/ft2. There are certain economies of scale associated with RCx. For a large and a small building with the same number of systems, per square foot costs of RCx will be lower for the larger building. However, smaller buildings can still achieve cost-effective commissioning with payback times under two years. Improvements that reduce energy costs can also increase a property’s asset value through increasing the building owner’s net operating income (NOI). RCx can also bring indirect benefits, including reduced maintenance costs, extended life of building equipment, improved employee productivity, and better indoor air quality. Even though

3
these benefits may not yield direct monetary paybacks, they can generate associated cost savings. The cost of RCx varies by project. Variables affecting the costs of retro-commissioning include scope of the project, size of the facility, number and complexity of the systems involved, equipment age and condition, service provider’s rates, level of on-site staff’s knowledge, and whether there is an extensive O&M program. Measuring and Verifying RCx Savings Measuring and verifying RCx savings are very important to various stakeholders involved in RCx activities. Major common activities in the RCx and M&V processes include engineering savings estimates (Baseline Period), and operational verification (Post-Installation Period). There are four methods of savings verification 1- engineering calculations with field verification, 2 - system or equipment energy measurement, 3 - energy models using interval data, and 4 - calibrated simulation. Method 1 describes how to use the calculations for estimating savings in a verification process. It describes best practices in selecting estimation methods, and correcting them with post-implementation period data. It is generally the lowest-cost approach. Methods 2, 3, and 4 provide a greater level of saving verification rigor than Method 1 and can be implemented in a manner that satisfies formal M&V procedures. These three methods require measurements of energy use before and after ECMs have been installed. Actual measurements of energy use should increase the accuracy of energy savings estimates. The selection of a verification method most suitable to a particular project generally depends on two main considerations—risk and cost. Before the start of the project, stakeholders should understand how the quantification of savings affects them and if they are at risk of any penalties for either inaccurate savings estimations or for lack of savings persistence. Relative accuracy, quantification of savings uncertainty, granularity of savings, savings interactions, persistence of benefits, and formal method are key metrics that stakeholders should evaluate as part of the program or project. In addition, cost is a constraint that impacts all phases of a project and often limits the ability to apply specific verification approaches. Cost should be considered by the stakeholder on a project-by-project basis while evaluating each constraint. Key constraints that stakeholders should evaluate as part of the program or project include required baseline and post-ECM data type and quantity, tools required, labor (expertise and level of effort), and consistent building operation. To select the appropriate method, a five-step procedure has to be followed: 1) define the project objectives; 2) identify potential constraints, 3) select initial verification method, 4) evaluate the detailed capabilities of the selected verification method, and 5) develop M&V Plan. U.S. Policies to Help Remove Market Barriers

4
Despite the cost-effectiveness of retro-commissioning, there exist certain barriers to its market penetration. On the “demand” side, building owners and managers are not well informed of RCx and also do not pay adequate attention to the benefits of pursuing changes or new initiatives. On the “supply” side, insufficient technical capacity in RCx services significantly hinders the wide application of RCx. In the marketplace, the major barrier is that the environmental and social benefits of RCx are externalities. Policy interventions and incentive programs can help overcome the barriers. Among the various energy-related federal laws of the United States, the three Energy Policy Acts of 1992, 2005, and 2007 have included many provisions for energy conservation, such as the Energy Star program, and included grants and tax incentives for both renewable and non-renewable energy. Federal laws and programs have inspired many state and city governments to provide more direct support to building energy efficiency, including programs specifically targeting RCx. Many utility companies participate in state energy efficiency programs by providing their own incentives. Several states’ programs are given as examples. Recommendations for China In view of the barriers listed above, the Chinese government may consider the following action points to jump start RCx applications in China:
- Support research and evaluation of RCx potential, characteristics, and barriers in China;
- Include RCx in selected demonstration projects on large building energy audits to gain experience and demonstrate its value;
- Develop user-friendly guidelines on RCx; - Establish an interim/testing incentive program to foster the growth of RCx service
providers; - Accelerate the development of a clear and practical M&V system and related
capacities; - Support training and Lead by Example efforts through international cooperation; - Support timely evaluation of the initial efforts to identify best practices and
lessons learned; and - Continue the initiative by developing a formal policy or plan to encourage RCx
practice in all large cities. Many studies and real cases have confirmed that RCx can create huge energy savings, and clearly constitutes a “low-hanging fruit” in the energy performance or energy management field with impressive cost-effectiveness. RCx does not require prohibitively advanced technology or high upfront investment. Therefore, China can realistically be expected to draw upon related international experience and implement RCx initiatives.

5
Introduction Building commissioning is a systematic process that begins at the design phase of a new building and continues through the construction, occupancy and operation phases to ensure that the building is constructed well and performs as designed. From an energy efficiency point of view, the aim of commissioning new buildings is to ensure that they deliver the energy performance promised by their designs, and, for existing buildings, to identify the almost inevitable “drift” from how the building should operate and ensure the building’s optimal performance [1]. Commissioning on existing buildings is often referred to as retro-commissioning (RCx) or existing building commissioning. This is the focus of this report and we use the term retro-commissioning and RCx throughout the report to mean existing building commissioning. The history of building commissioning spans some 35 years. According to the Portland Energy Conservation, Inc. (PECI) [2], the Public Works Canada first began to use commissioning in its building project delivery system in 1977. Other major milestones in the history of building commissioning include in 1988, the American Society of Heating, Refrigerating, Air Conditioning Engineers (ASHRAE) published HVAC Commissioning Guideline; and in 1995, the U.S. Environmental Protection Agency’s Energy Star® Building Partnership Program [2] included commissioning. Soon after, U.S. Federal government-supported RCx demonstration projects were launched in the Northwest and the U.S. Department of Energy’s Oak Ridge National Lab [2] published Practical Guide for Commissioning Existing Buildings in 1998. In 2008, the Oregon-based Building Commissioning Association [3] published Best Practices in Existing Building Commissioning. Past experience has demonstrated that RCx can offer impressive energy use efficiency and also provide multiple benefits to building owners, including lowering utility costs, protecting and enhancing property value, avoiding future liability, and reducing repair and replacement costs. In China, the concept of RCx is still new and its energy saving potential has not been fully studied and recognized [4]. Although there are many energy service companies (ESCOs) in China – 782 companies conducted ESCO projects in 2010 [5] – whole building RCx has been rarely reported (a separate report in the series discusses international and Chinese ESCO experiences). Therefore, this report intends to provide a comprehensive description of U.S. RCx experience to the Chinese policy makers and professionals working in the building energy efficiency business, with an eye towards increasing their attention to this important and largely ignored energy efficiency opportunity and to promoting subsequent adoption of supportive policies for wider RCx practice. The first chapter explains the RCx process and the best practices applied in the U.S. The second and

6
third chapters describe in more detail the technical considerations often given in an RCx process. Chapter four presents available research findings from the literature on the benefits and costs of RCx, while the last chapter summarizes U.S. policies and programs supporting RCx and offers recommendations to China.

7
Chapter 1 Retro-Commissioning Process and Best Practices The simplest definition of RCx, as mentioned at the beginning of this report, is that it is the application of commissioning process to an existing building. A more specific and helpful definition by the California Commissioning Collaborative goes:
Retro-commissioning is a process that seeks to improve how building equipment and systems function together. Depending on the age of the building, RCx can often resolve problems that occurred during design or construction, or address problems that have developed throughout the building’s life. In all, RCx improves a building’s operations and maintenance (O&M) procedures to enhance overall building performance [6].
A well-planned and fully executed RCx project generally consists of five phases: Planning, Investigation, Implementation, Hand-off, and Ongoing as illustrated in Figure 1 [7]. By looking at the figure, one can notice that RCx requires team efforts and coordination among stake holders. It is a process of meticulous “forensic” review of a building’s disposition to identify suboptimal situations or malfunctions and the associated opportunities for energy savings [1]. Without this review and optimization process, the implementation of a series of energy efficiency measures will
Figure 1: Four Phases of Retro-Commissioning Processes
Source: Haasl, T., and K. Heinemeier, California
8
be simply known as retrofits, which are related but not the same thing as RCx. Because buildings have different ages, designs, users, and maintenance standards, they do not face identical problems and do not present same levels of potential energy savings. Therefore, best practices in RCx are not just about specific technologies or technical procedures, but also about logical steps that can help identify opportunities for saving energy and help capture the savings in the most cost-effective ways aimed at maximizing the overall benefits. PECI’s 2007 publication A Retrocommissioning Guide to Building Owners and Building Commissioning Association’s 2008 publication Best Practices in Commissioning Existing Buildings provide comprehensive explanations on RCx processes, which we summarize below.
Phase 1: Planning In Phase 1, the primary tasks for an RCx service provider include:
Screening candidate buildings through reviewing available references, discussions with building owners, making initial site visits, and if data available, analyzing the energy use per square foot and generating an initial benchmark scores using EPA’s energy performance rating system;
Selecting a building based on the screening results by taking into account applicability of potential measures, the attitude and need of the building owner, and financial conditions;
One might also retro-commission because of comfort or health or safety conditions not being met, the goal being better performance without more energy use
Defining project objectives clearly through discussions with all stake holders; Assembling the team of different specialists and stake holders, e.g. designers,
contractors, onsite operations, maintenance staff, and building owners, if possible; and
Developing an RCx plan, including projected costs and savings associated with the project.
Practitioners of RCx say they would be hard-pressed to find buildings that would not benefit from the practice [1]. Therefore, the question is not about how to find a building that has energy saving potential through RCx, but about how to identify applicable RCx measures and plan an RCx project most cost-effectively. Owners and property management firms with building portfolios can look across their holdings and consider factors such as: The age and condition of a building and its equipment; Existing known comfort problems; Utility costs;

9
Lease agreements; Potential for return on investment to owner; and Availability of utility and state incentive programs.
Projects are usually led by a third-party RCx provider with varying degrees of involvement by the building owner and staffs, who know the facility very well and therefore can provide valuable inputs. Some building owners and managers manage their own commissioning projects, bringing in a commissioning expert only for certain tasks. To develop a scope of work, the RCx provider conducts an on-site visit, talks with O&M staff, and reviews current operating conditions at the facility. After gaining a clear understanding of project goals, the RCx provider identifies opportunities for operational improvements in the building. The scope of work is a proposal negotiated between the RCx provider and the owner that provides an outline of the processes and procedures to be undertaken; a schedule of activities; roles of team members; and sample forms and templates that the RCx provider will use to document the RCx activities.
Phase 2: Investigation The objective of Phase 2 is to conduct detailed investigations to compare the actual building conditions and system performance with the building owner’s current operational needs and requirements defined by the current facility requirements. The primary focus at this investigation stage is to: Understand how and why building systems are currently operated and maintained; Identify issues and potential improvements; and Select the most cost-effective improvements for implementation.
The emphasis and effort level of the investigation activities depends on the scope and objectives of the project. Often, the RCx provider looks at all sub-systems of the building and all aspects of the current operations and maintenance (O&M) practices. Also important to understand are the building management structure, policies, and user requirements. Recommended best practices typically include: Convene coordination meetings with stake holders; Review existing documents: all old and new drawings, specifications, test and
balance reports, O&M manuals, and any past commissioning reports; Conduct a thorough and detailed building walk through (maintenance staff
participation is highly desirable);

10
Evaluate the issues identified in the Planning Phase and observed during the drawing and documentation review; information not found during the Documentation Review may need to be recreated during the site survey;
Interview building occupants: owner’s maintenance personnel, utility personnel, occupants, and other relevant parties;
Establish facility performance baseline by collecting and analyzing available energy, non-energy and other system performance data, e.g. utility billing data, sub-metering data, work orders, comfort complaint logs, indoor air quality parameters, occupant satisfaction survey results, building automation system (BAS) trend data;
Develop and execute a diagnostic monitoring plan, including spot testing equipment and controls;
If necessary and possible, perform system testing to evaluate the building systems performance; and
Create a master list of findings that identifies Facility Improvement Measures (FIM).
Phase 3: Implementation Obviously, the main work in Phase 3 is to carry out the FIMs selected from the master list of findings and agreed to by pertinent stake holders. But it is also an important task in this phase to verify that the predicted results and system performance are achieved. Implementation can be carried out by the commissioning provider, building staff, or individual subcontractors. Most commonly, however, there is a mix of individuals involved, depending on staff availability and expertise, existing equipment warranties, existing maintenance contracts, the scope of work, and the budget. Once the selected measures are implemented, the team needs to verify that they are performing as expected. If testing does not show that the improvements were successful, further modifications or refinements to the upgrades should be made to achieve acceptable results. If the results are better than expected, this needs to be studied and explained as well. Plans can also be made for the future testing of the deferred capital improvement projects identified.
Phase 4 and 5: Hand-Off and Implementation of Persistence Strategies To achieve actual and lasting energy savings, it is important to ensure a smooth hand off and transition from the commissioning process/team to the personnel responsible for long-term operation and maintenance of the building. Successful transitions mean that all necessary documentation, knowledge and systems are provided to the O&M personnel, that the O&M personnel demonstrate the effective use of these tools, and that the implemented improvements become a part of the standard operating practice. At the Hand-Off Phase, the team should: Complete a final report summarizing each improvement;

11
Conduct facility staff training; Hold a project close-out meeting; and Generate a post-RCx energy performance rating (e.g. based on the EPA’s Portfolio
Manager). No Hand-Off Phase will be deemed successfully completed if there is no arrangement for ensuring operational sustainability. The term “Persistence Strategies” is often used to convey this last, but not the least, important feature. A plan should be developed to provide the building personnel with detailed instruction and tools for strategic operational, monitoring and maintenance tasks that help maintain the RCx process’s performance benefits and support continuous improvement. The plan may include recommendations and instructions on establishing and monitoring energy and non-energy facility performance benchmarks, energy tracking, preventive and/or predictive maintenance, building automation system trending, training, and procedures for updating the facility requirements and related documents. The plan must also identify resources and management support for the continuing efforts: if senior management thinks they have done their job when the RCx agent leaves, results will likely degrade.
RCx Team Members and Their Roles How smoothly and efficiently a RCx project will proceed is very much dependent on how the RCx team is organized. The building owner or his/her representative should work closely with a selected service provider to put together the RCx team. Table 1 lists common participants of an RCx project and their respective roles and responsibilities.

12
Table 1. Typical Retro-Commissioning Team Member Roles and Responsibilities
Participant Roles and Responsibilities Building Owner or Owner’s Representative
Create and support team, provide information and resources needed for the project, clearly communicate goals and expectations.
Facility Staff Ensure system maintenance is performed (e.g. belts are tight, equipment has been serviced, and sensors are calibrated) before systems are tested. Work with commissioning provider to perform tests and verify system operation.
Commissioning Provider Assist in developing a scope of work. Identify measures and develop report detailing opportunities. Work with facility staff to perform tests and verify system operation. Assist the owner’s team in developing scopes of work for the contractors implementing the measures.
Contractor or Manufacturer Representatives as needed
Perform work as outlined in existing service contracts that cover O&M of the building’s HVAC, controls, and electrical systems. Test equipment and/or implement measures that pertain to the equipment they installed
Controls Contractor Assist in setting trends and modifying the sequence of operations to meet test conditions if commissioning provider (or facility staff) is not familiar with the control system. Assist with implementation of controls-related fixes and improvements.
Design Professionals Provide additional expertise regarding design issues uncovered during investigation. Assist in coordinating retro-commissioning with a retrofit project.
Testing Specialists Assist the commissioning provider with complicated testing or with equipment that requires special expertise.
Source: CEPI, A Retro-Commissioning Guide for Building Owners, 2007

13
Chapter 2 Measures Commonly Implemented in Retro-Commissioning Projects Improving a building’s energy use efficiency will inevitably embrace a range of actions, including the installation of certain energy efficiency measures, which can range from no- or low-cost behavior changes to capital investments in technological upgrades. While RCx is more of a process than a standard action, understanding the technical means that can be used in RCx to reduce energy consumption is necessary for building owners and project managers. Continuous Commissioning Guidebook for Federal Energy Managers[8] discusses the energy conservation measures that are commonly considered in RCx projects, which are summarized below.
The Easiest RCx Measures Some equipment pieces may have been kept on for perceived convenience with no real necessity, causing a waste of energy. It should not be difficult to check whether they are needed and turn them off if not needed. Here are the examples:
Turn off foot heaters, desk fans and other portable office devices when not in use Turn off building’s heating system during the summer Turn off HVAC (heating, ventilation, air conditioning) and AHU systems during
unoccupied hours Slow down the various systems during lightly-occupied hours Limit fan speed during warm-up and cool-down periods.
More Technical RCx Measures for More Energy Savings A typical modern building has four major systems that a thorough RCx process should look at. Rigorous commissioning measures can often bring great energy savings and other benefits. These major systems are: 1) air handling unit; 2) water/steam distribution system; 3) central chiller plant; and 4) central heating plant. This section briefly explains why these systems deserve top attention in an RCx project and what aspects could be considered for optimization. More specific technical measures are presented in Annex I.

14
An air handling unit (AHU) conditions and distributes air inside buildings. It typically consists of a combination of heating and cooling coils, supply and return air fans, filters, humidifiers, dampers, ductwork, terminal boxes and associated safety and control devices, and possibly an economizer. As a building’s load changes, its AHUs change certain parameters to maintain the indoor comfort, such as outside air intake, total air flow, static pressure, supply air temperature, and humidity. In addition, operating schedules and initial system set up can also significantly impact building energy consumption and comfort. In an RCx process, the project engineers shall try to optimize AHU operation and control schedules by adjusting or improving those parameters through one or more measures, such as adjusting the total air flow for constant air volume systems, correcting outside air intake rate, and optimizing the supply air temperature.
A water and steam distribution system consists mainly of pumps, pipes, control valves and variable speed pumping devices. In a modern building, there are usually two distribution systems for providing central air conditioning, one to distribute chilled water and another hot water and steam. The common RCx measures aim to optimize the system’s pressure control, water flow control, and overall condition, such as improving the operation of the chilled water pump and pipe loops’ operation. A central chiller plant includes chillers, cooling towers, a primary water distribution system and the condenser water distribution system. The central chiller plant produces chilled water using electricity, steam, hot water or gas. Commissioning measures vary with the type of chillers. One possible measure is to use more efficient chillers. Other strategies include resetting water temperature and using variable flow rates for various building load conditions A central heating plant produces hot water, steam, or both, typically using natural gas, coal or oil as the fuel. Energy performance and operational reliability can be improved through numerous measures on this system. Those that can be implemented by operating technicians and RCx engineers include optimizing supply water temperature, steam pressure, feed water pump operation, boiler staging, and heat exchanger operation. Overall, maintaining good operating practices on the plant is important.
Case Studies This section introduces several RCx case studies [9] for different types of facilities. High-Tech Company

15
The campus of a high tech company in the US. was retro-commissioned. The campus consisted of a group of buildings ranging from 2 to 19 years old, totaling approximately 800,000 square feet. Two central chiller/boiler plants, 34 major air-handling units and several hundred variable air volume terminal units provide heating and cooling to the buildings. The loads are primarily office areas and computer software development labs. The study identified $130,050 of annual energy savings amounting to 9.3% of annual energy costs. The estimated combined study and implementation costs were $124,200 for a simple payback of 0.8 years. The following discusses three significant findings. Extended surface area filters The air handling systems in the high tech campus were equipped with prefilters and final filters. The purpose of the prefilters is to extend the life of the final filters by removing many of the larger particles. However, prefilters add pressure drop to the system and do nothing to make the air that is supplied to the building any cleaner. This measure required that facility staff eliminate the prefilters and use extended surface area filters with high dust-holding capacity, longer life and lower pressure drops. These filters fit conventional filter framing systems and can be applied to existing systems without retrofit work. They typically cost more than standard filters but have lower life-cycle costs because of their lower pressure drop and longer life. They are also a “greener” choice because they use fewer consumables and generate a smaller waste stream since they can last three years longer than conventional filters under normal conditions. Implementation of this measure needs to be done with care. Prefilters were first eliminated on a selected number of air handlers and system performance was evaluated before removing all the prefilters in the system. In this case, synthetic extended surface area filters were selected because they are more immune to biological activity and the filters can be periodically sent to a lab for testing. Extended surface area filters can be installed on variable speed fans without any further adjustments. However, on constant volume fan systems, the fans require resheaving to produce the design flow rates with the reduced pressure drops of the extended surface area filters. Cost to Implement $10,700 Energy Savings $18,000 (1.3%) Simple Payback 0.6 years Scheduling and flow settings The HVAC systems serving these high-tech buildings operate 24 hours a day, 7 days a week even though the buildings are typically only occupied from 7 am to 8 pm, 5 days a week. In order to accommodate employees working after hours and to maintain temperature and humidity conditions in the computer labs, the HVAC systems were not set back at night. In addition, minimum ventilation rates were based on occupancy projections that no longer reflect the current occupancy level on the site. As a result, the

16
air handling system was moving more air than needed to meet the cooling load causing the space to be reheated most of the time. During the RCx study, the schedules for all terminal zones that do not serve computer lab areas were set to normal operating hours. In addition, the high and low temperature limit strategies were set to prevent space conditions from drifting too far during unoccupied periods. Minimum flow rates were also adjusted to reflect actual occupancy levels during both the occupied and unoccupied cycles. All of these adjustments saved heating, cooling, and fan energy. Cost to Implement $35,000 Energy Savings $86,800 (6.2%) Simple Payback 0.40 years Excessive simultaneous heating and cooling When the computer development labs were remodeled, new stand-alone cooling systems were installed in the computer room to satisfy the cooling and humidity conditions required by the computer labs. Unfortunately, the installation of these new systems was not coordinated with the existing central chiller system that was serving the same area. The central cooling system was trying to maintain a space temperature that was higher than what the stand-alone cooling units were trying to achieve. As a result, air entering the computer labs was being reheated at all times because the central system thought the space was too cold and required reheating. To rectify the problem, the central system minimum flow setting and reheat control was reprogrammed. Overall airflow to the computer room was reduced and the need for reheat virtually eliminated. Cost to Implement $17,300 Energy Savings $23,000 (1.6%) Payback 0.75 years Corporate Office Complex
A demonstration project required RCx of three of five buildings at a corporate office complex. The buildings house primarily office space, although some process and limited laboratory spaces exist. The total facility is over 540,000 square feet and the three buildings investigated represent over 230,000 square feet. They range from 13 to 38 years old. The observation and data analysis revealed that in general, over 70% of the total energy use in the facility was consumed during non-occupied periods (nights and weekends.) Of twenty-three low-cost O&M measures identified, the owners decided to implement 12. Most of the recommendations were operational in nature and relatively easy to implement, requiring only control setpoint changes or minor programming performed by in-house staff. The measures yielded $121,200 in annual estimated savings, reducing energy costs by 17.6%. They cost approximately $2,000 to implement for a payback of 0.02 years.

17
Scheduling of equipment and lights During a night walk-through, investigators found that a DX unit was on when it wasn’t needed. A facilities staff person was present and fixed the program code before the walk-through was over. A list of fan and pump equipment that was on afterhours was also generated. Estimated savings for this measure alone is $21,400 or 3.1% of energy costs. In addition, the study found that employees were circumventing the lighting control system and wasting energy. Originally, the system was set up to allow after-hours employees to dial a code to turn on small (2,000 SF) areas as needed. However, dial-in codes had been misplaced, so security staff were turning on lights on an entire floor. When only five people were working in the building, two full floors of lights were on (216,000 SF). To address this problem, the dial-in codes were redistributed to all staff and posted in the zones where they were applicable. Estimated savings for this measure is $45,000 annually or 6.5% of total energy costs. Cost to Implement: minimum Combined Energy Savings $66,340 (9.6%) Simple Payback Immediate Additional “soft” savings were identified when investigators noticed that half of the computers and printers were left on at night. They recommended that staff be reminded of the value of turning off equipment at night. Turning off this equipment provided an estimated $37,600 in additional cost savings, reducing current energy costs by 5.4%. Economizer settings Some of the air handling units have a restrictive economizer changeover setpoint. They use dewpoint of 50ºF as the economizer changeover. However, dewpoint is not a good measure of heat content. It was recommended that they use enthalpy as a better indicator of the economizing threshold. Since an enthalpy sensor was already in place, in-house staff changed the algorithm in the EMS to allow economizing below 70ºF dry bulb and less than 25 Btu/lb enthalpy. This resulted in approximately 714 hours of additional economizing annually during occupied hours. Cost to Implement $0 Energy Savings $17,000 (2.5%) Simple Payback Immediate Static pressure reset strategy The RCx analysis discovered that air handlers had no reset strategy for the duct static pressure setpoints. Because there was no documented justification for the static pressure setpoints and no reset strategy, the setpoints were probably higher than necessary. The analysis recommended programming the following static pressure reset sequence, based on the condition of the variable air volume (VAV) boxes. The following is a sample static pressure reset sequence recommended by the analysis: “Poll all boxes every 5 minutes. If none are more than or equal to 95% open, reduce duct static pressure set point by 7%. If one or more boxes exceed 95% open, increase

18
static pressure set point by 7%. If one or more boxes are equal to 95% open, and none exceed 95%, then do nothing.” This programming change was implemented within a month of discovery. Cost to Implement $0 Energy Savings $7,500 (1.1%) Simple Payback Immediate

19
Chapter 3. Benefits Outweigh Costs in Retro-Commissioning The specific cases described in the previous chapter show that RCx can be very cost-effective. Indeed, researchers at Lawrence Berkeley National Laboratory analyzed over 640 commissioning projects in commercial buildings spanning 26 U.S. states and found compelling evidence that commissioning is arguably the single-most cost-effective strategy for reducing energy, costs, and greenhouse gas emissions in buildings today[1]. Benefits Direct Savings Potential A comprehensive study in 2009 [11] found the value of energy savings ranged $0.11 - $0.72/ft2, and the value of non-energy savings ranged $0.10 - $0.45/ft2 Significant cost savings from a RCx process are often a result of reduced energy use. The same study aggregated RCx results from 100 buildings and found whole-building electricity savings ranging from five to 15 percent and gas savings ranging from one to 23 percent. Corresponding payback times ranged from 0.2 to 2.1 years. The median project energy savings found through this study were approximately $45,000 per building (in 2003 dollars), and ranged as high as $1.8 million. Payback times typically decline with increasing building size, especially for buildings with floor area above 100,000 square feet (Figure 2). There are certain economies of scale associated with RCx. For example, base costs are linked to the number of systems in a building. Consequently, for a large and a small building with the same number of systems, per square foot costs of RCx will be lower
Figure 2: RCx Payback Time vs. Building Size
Source: Mills, E., Building Commissioning: A Golden Opportunity for Reducing Energy Costs and Greenhouse Gas Emissions, 2009.

20
for the larger building. Although it can be more challenging, smaller building owners can still achieve cost-effective commissioning with payback times under two years. Also, payback periods typically decline with increases in facility energy costs. For example, the LBNL study found that laboratories, which have the highest energy cost per square foot, had the shortest payback periods. In contrast, schools, with relatively low energy costs per square foot, had longer payback periods. Increasing Asset Value of Income-Producing Properties Improvements that reduce energy costs also can increase a property’s asset value, even in cases where property turnover is fairly quick. While the value of energy efficiency investments may not be obvious for a company that regularly buys and sells properties, savvy real estate investors understand that increasing their net operating income (NOI) through RCx is a cost-effective way to raise asset value. Operating expense savings captured by the owner will drive their NOI higher, which in turn supports a higher appraised value of the building. Appraisal value is not only important when a building is sold, but also critical for owners wishing to leverage the property’s accumulated equity. Owners who choose to refinance their properties during the holding period can benefit from the larger amount of capital that can be withdrawn with a higher asset value. While there are several ways to appraise property value, the Income Approach is the most common method used to value income-producing buildings. This approach calculates building value by dividing the property’s NOI by the current market capitalization rate (the market capitalization rate is determined by evaluating financial data for similar properties that have recently sold in a specific market): Asset Value = Net Operating Income/Capitalization Rate RCx can improve NOI through stabilized or increased revenues that result from improved tenant comfort. Specifically, NOI for a given property will increase if: Improved tenant comfort allows the building owner to raise rents (or stabilizes rents
during a down cycle in the leasing market) by making the building a more desirable place to live or work.
As a consequence of improved tenant comfort, occupancy improves (or is maintained in a very competitive leasing environment). Also, owners will likely experience lower tenant turnover when tenants are comfortable and less apt to move.
Both higher rental rates and higher occupancy levels increase rental revenues. Add to this the operating cost savings realized from optimizing the building’s energy-using systems and the result is a higher NOI that easily translates into higher asset value (assuming a stable capitalization rate). Indirect Benefits The benefits of RCx go beyond reduced energy costs. While more difficult to quantify, these benefits should not be overlooked. RCx can reduce maintenance costs, extend the life of building equipment, improve employee productivity, and improve indoor air quality. Even though these benefits may not yield direct monetary paybacks, they can
21
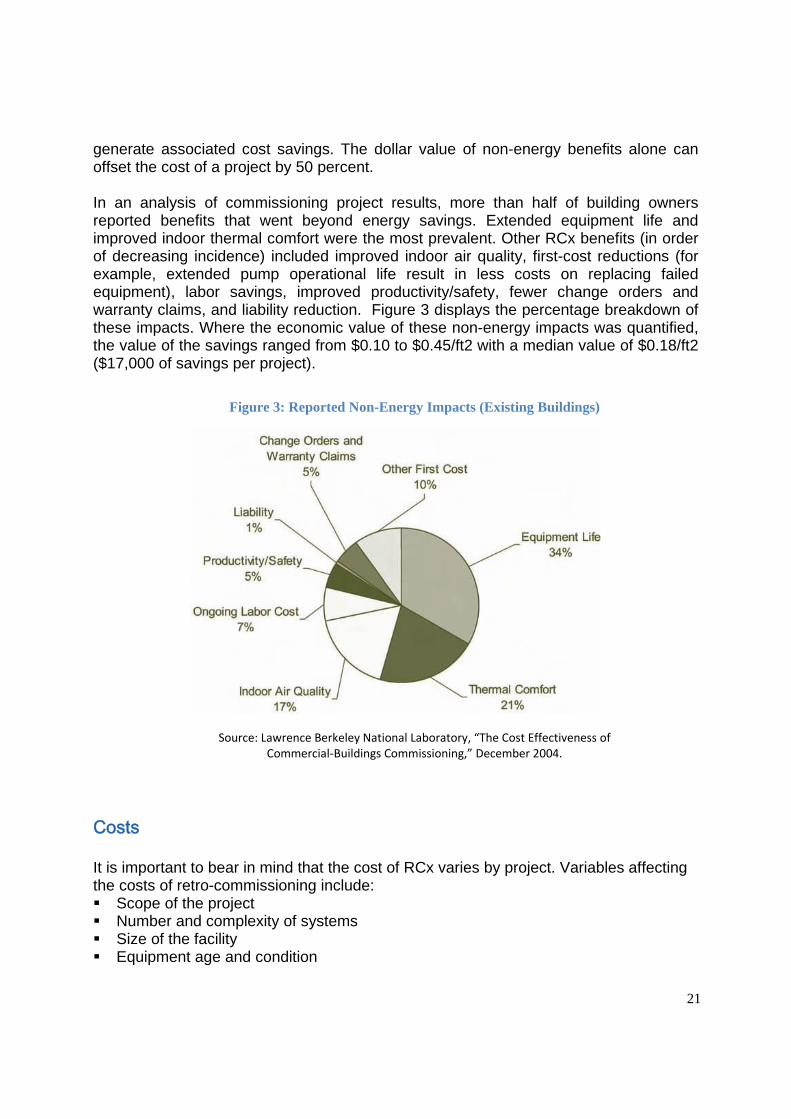
generate associated cost savings. The dollar value of non-energy benefits alone can offset the cost of a project by 50 percent. In an analysis of commissioning project results, more than half of building owners reported benefits that went beyond energy savings. Extended equipment life and improved indoor thermal comfort were the most prevalent. Other RCx benefits (in order of decreasing incidence) included improved indoor air quality, first-cost reductions (for example, extended pump operational life result in less costs on replacing failed equipment), labor savings, improved productivity/safety, fewer change orders and warranty claims, and liability reduction. Figure 3 displays the percentage breakdown of these impacts. Where the economic value of these non-energy impacts was quantified, the value of the savings ranged from $0.10 to $0.45/ft2 with a median value of $0.18/ft2 ($17,000 of savings per project).
Costs It is important to bear in mind that the cost of RCx varies by project. Variables affecting the costs of retro-commissioning include: Scope of the project Number and complexity of systems Size of the facility Equipment age and condition
Figure 3: Reported Non-Energy Impacts (Existing Buildings)
Source: Lawrence Berkeley National Laboratory, “The Cost Effectiveness of Commercial‐Buildings Commissioning,” December 2004.

22
Commissioning service provider rates Level of on-site staff knowledge interfacing with the project Presence of an extensive O&M program
An RCx provider’s fee is the most obvious cost, but sometimes the cost of other team members (internal staff and/or outside contractors) participating in the process and that of correcting the identified problems are also included. Lawrence Berkeley National Laboratory’s study of 100 existing buildings (varying in type and size) found that RCx provider fees ranged from 35 to 71 percent of total RCx costs, with a median value of 67 percent. The largest percentage of costs for a project was for investigation and planning phase activities (69 percent), followed by the actual implementation of measures (27 percent). See Figure 4. For the buildings in this study, the median investment in commercial RCx projects was $33,696, or about $0.27 per square foot in 2003 dollars (see Figure 5). On a square foot basis, total costs ranged from a low of $0.03 to a high of $3.86 per square foot.
Figure 4: Commissioning Cost Allocation (Existing Buildings, N=55)
Source: Lawrence Berkeley National Laboratory, “The Cost Effectiveness of Commercial‐Buildings Commissioning,” December 2004.

23
Figure 5: Existing Buildings Commissioning: Cost, Savings, and Payback Times
Source: Lawrence Berkeley National Laboratory, “The Cost Effectiveness of Commercial‐Buildings Commissioning,” December 2004.

24
Chapter 4 Measuring and Verifying (M&V) Savings of Retro-Commissioning RCx is often applied to improve energy performance and efficiency of large commercial and industrial facilities. Project sponsors and service providers of RCx usually have different perspectives when it comes to quantifying and verifying the energy savings from an RCx project. For examples:
A building owner cares about the actual reduction in energy costs resulting from the investment in retro-commissioning its buildings;
A project manager requires reliable savings reported from the RCx project; and An RCx service provider wants to ensure that the project’s goals have been
achieved. Importance of M&V in Retro-Commissioning Significant confusion may arise about how the energy savings from certain energy conservation measures (ECMs) are quantified and verified. It may not be clear to everyone what distinguishes verified savings from estimated savings. The common but important questions people may ask include:
What data must be measured before and after ECMs are installed to verify savings?
How much data is required? Must individual ECM savings be verified, or may they be verified in aggregate?
This confusion is heightened when verifying savings from RCx improvements. RCx requires that the correct operation of implemented ECMs be verified, while savings verification requires both operational verification and a quantitative check on the estimated energy savings. The two processes overlap. The confusion and the overlapped processes call for standardized measurement and verification (M&V) methods and procedures specific for RCx processes. General procedures are known from The International Performance Measurement and Verification Guideline (IPMVP) [10], and the American Society of Heating, Refrigeration, and Air-conditioning Engineer’s (ASHRAE) Guideline 14-2002: Measurement of Energy and Demand Savings provides technical direction. However, more specific guidance is still needed for RCx projects and programs. Standardized methods are needed to eliminate confusion about verification methods and procedures. By eliminating this confusion and working from the same set of methods and procedures, much time may be saved in conducting RCx projects and in reviewing them on behalf of project sponsors. Documenting these methods and procedures will also help new entrants into the field, as well as commissioning providers who do not normally include savings verification as part of their services.
25
Common Risks in Measuring and Verifying Energy Savings Calculating and verifying the actual savings in an energy-efficiency project assures that the project is successful and yields the expected energy savings. Though building-system operations are improved by RCx, there are risks that the energy savings estimated before implementation may not be realized. These risks include:
Inaccurate or incomplete engineering assumptions, data, and analysis Engineering estimates of savings vary in quality and thoroughness. Such estimates require assumptions about system and equipment operations and assumptions about key parameters in the calculations. Data on key parameters may be absent, or engineering analysis strategies may be faulty. This may lead to erroneous savings predictions in both directions, but the designer of the strategy may be invested in it such that the errors are biased toward high savings.
Inaccurate or incomplete physical understanding of building systems Although the impact on a system may be correctly analyzed, if the ECMs are not installed correctly for any reason, such as incomplete understanding by technicians, incomplete documentation of the ECMs, poor communication of specifications, or other factors, the estimated savings may not result.
ECMs are quickly defeated The change in building operation may be too aggressive and cause problems elsewhere in the building, leading to complete removal rather than an adjustment back to less aggressive settings. This risk is common in RCx projects where many ECMs are implemented through control-system scheduling and programming.
Overview of M&V Energy savings cannot be directly measured. Simple comparisons of energy use before and after an ECM installation are typically insufficient for accurate savings estimations because they do not account for the impacts of routine influencing parameters, such as ambient weather conditions or building occupancy and schedule. However, M&V provides a means to calculate these realized energy savings by making adjustments to account for these influences, thereby comparing the baseline and post-installation energy use under the same conditions. Rigorously applied, M&V methods can provide an estimate of the uncertainty of the resulting savings. This characteristic distinguishes it from the other common practices in that it may provide project sponsors a degree of confidence that the actual savings are within specified limits. However, estimation of the savings uncertainty is not always required by project sponsors. It is important to note that M&V accounts for energy use by individual energy source. For example, electric savings are verified in a separate M&V process than natural-gas savings. The M&V approach need not be the same for all energy sources in a building. A measurement boundary around systems or equipment may be drawn to verify electric savings, while a boundary around a whole building may be used for natural-gas savings.

26
There are comparatively fewer end uses for natural gas than for electricity in a building which often renders submetering natural gas use unnecessary. There are two essential components of M&V for any energy-efficiency-improvement project:
Operational verification, which verifies that the ECMs are installed properly and have the potential to generate savings.
Savings verification, which as described above, uses before and after ECM installation energy measurements to calculate and verify that the installed ECMs are generating the expected savings.
While operational verification ensures that the equipment is operating correctly and more efficiently, it also ensures that the savings are due to the installed improvement and not to other changes in the equipment or building. Operational verification directly addresses the second risk identified in the overview—inaccurate or incomplete physical understanding of building systems. Savings verification verifies the amount of savings that has been realized. Savings verification directly addresses the first identified risk—inaccurate or incomplete engineering assumptions, data, and analysis. Both components address the third risk—ECMs are quickly defeated—operations may be periodically checked to see if ECMs are still working, and savings verification may detect the degradation in energy performance as ECMs are removed. As with the common verification practices, operational verification may be applied with more or less rigor. Figure 6 shows a spectrum of activities, from least to most rigorous, that may be applied under each M&V component.

27
The level of rigor applied under each component need not be the same in every project. A more rigorous operational verification method may be used with a less rigorous savings verification method. The level of rigor required is determined by the project’s involved parties, after assessing a project’s risks. Integrating RCx and M&V Processes
There are several common activities in the RCx and M&V processes. These include: Engineering savings estimates (Baseline Period)
The RCx process makes use of these estimates to weigh the costs and benefits of potential ECMs. The M&V process uses them to identify the proper verification method, assess risks, and to determine the rigor in which M&V activities should be applied.
Operational verification (Post-Installation Period) The RCx process uses operational verification to verify that RCx improvements have been implemented properly and that equipment is performing to
Figure 6: Spectrum of Activities to Verify Operational and Energy Savings
Source: CACx, Guidelines for Verifying Savings from Commissioning Existing Buildings, 2012

28
specifications. The M&V process uses it to verify that the equipment operations have been improved and have the potential to generate savings.
In addition, the data used to verify correct operation is often used in the engineering savings estimates and the savings verification methods. These factors limit additional work required to verify that the RCx project saved energy. As described above, the RCx process provides one of the essential components of M&V—operational verification—as well as other common activities and data. When one of the RCx project’s requirements is to verify how much of the estimated savings were realized, the more rigorous savings verification methods of the M&V process are essentially added as an additional RCx process requirement. Adding M&V to an RCx process should not excessively increase project costs. This cost relationship may in part define the degree of rigor desired for the M&V process. California Commissioning Collaborative (CACx) in its 2012 publication Guidelines for Verifying Savings from Commissioning Existing Buildings, describes four most rigorous methods of M&V. They are:
Method 1: Engineering Calculations with Field Verification Method 2: System or Equipment Energy Measurement Method 3: Energy Models Using Interval Data Method 4: Calibrated Simulation
The rest of this chapter summarizes the main points of the CACx publication. Method 1 describes how to use the calculations for estimating savings in a verification process. It describes best practices in selecting estimation methods, and correcting them with post-implementation period data. It is generally the lowest-cost approach. Methods 2, 3, and 4 provide a greater level of saving verification rigor than Method 1 and can be implemented in a manner that satisfies formal M&V procedures. These three methods require measurements of energy use before and after ECMs have been installed. Actual measurements of energy use should increase the accuracy of energy savings estimates. Figure 7 below shows how the savings verification activities of the four methods during the baseline and post-installation periods align with the activities of the RCx process.

29
To document these M&V activities so that others who become involved in the project later can fully understand the project’s history, the report recommends following additional essential items of documentation in a savings verification plan not already included in typical RCx plans, but which can be easily integrated:
Scope of the RCx effort Describe how many systems or pieces of equipment will be affected.
Responsible Party Identify the parties involved and their roles in verifying savings. For example, the RCx agent may be responsible for verifying improved operations in a system, and an analyst may be responsible for verifying the savings.
Measurement Boundary Define the boundary within which the savings will be verified. This can be the entire building, one or more building subsystems, or specific pieces of equipment.
Figure 7: Comparison of RCx process and savings verification methods
Source: CACx, Guidelines for Verifying Savings from Commissioning Existing Buildings, 2012

30
The chapters on each of the four methods describe how to define measurement boundaries.
Baseline Equipment, Conditions, and Energy Data Document the facility’s baseline systems, equipment configurations, and operational characteristics. This includes equipment inventories, sizes, types, and condition. Describe their operating characteristics or practices, including operation schedule, set points, and actual temperatures and pressures. Describe any significant problems with operating equipment. Include all energy data from spot measurements and short- or long-term monitoring, from each source. Define the baseline period and include all utility data for the facility. Describe any independent variable parameters used and their sources. Much of this information is usually documented as part of the RCx plan, so only the specific items that are relevant to M&V should be added.
Reporting Period Describe the length of the reporting period and the activities that will be conducted during that period.
Analysis Procedure Describe how the baseline and post-installation energy use or demand will be adjusted to a common set of conditions. Describe the procedures used to prepare the data. Describe the procedures used for analyzing the data. Describe how savings uncertainty will be estimated (if required). For mathematical models, describe the range of independent variables for which it is valid. Describe any extrapolations outside this range of data. Describe any extrapolations of energy use or savings beyond the reporting period. Document all assumptions.
Savings Reports Describe what results will be included in the savings reports. Describe when savings will be reported for the project. Indicate the reporting format to be used. Describe what data and calculations will be provided.
Method 1: Engineering Calculations with Field Verification Engineering calculations use fundamental equations and operational data to estimate energy use of systems (chilled water, air distribution, etc) and equipment (pumps, fans, etc). The calculations are used to estimate baseline and post-installation energy use, using information from design documents, equipment nameplates, and data from spot measurements and trend data. Assumptions and fundamental relationships are used to translate the operational data to estimations of actual energy use. Engineering calculations may be simple load and hours-of-use calculations, or use temperature bin methods when parameters are variable. These calculations are typically documented in a spreadsheet. Uncalibrated computer simulations of building systems and equipment may also be used.

31
Energy savings are calculated before any implementation occurs. The collected data is used to calculate baseline energy use. The expected impact of the RCx ECM on the systems and equipment is used in predicting the post-installation energy use. The difference between the baseline and estimated post-installation energy use provides the initial energy savings estimate. Since the energy savings depend on the quality and level of details in the calculation, a third-party review of the calculation approach is required. Field verification is used after the ECM is installed to confirm that the original calculations adequately predicted the ECM’s post-installation energy use. Although verification is required in the RCx process, Method 1 requires a high-rigor approach where actual operational data is collected in order to prove the ECM functions as expected. Post-implementation operational data is used to update the savings estimates when actual post-installation performance differs from the performance modeled in the calculations. This is the most common approach used in utility-sponsored RCx energy-efficiency programs. Method 1 includes best practices in collecting data, calculating baseline and post-installation energy use, preparing the data and calculations for peer review, as well as performance verification approaches for various types of ECMs. Best to use when:
- Specific quantification of energy savings is not as important as demonstrating improved operation.
- Measure-level savings can be determined with fundamental equations, and major interactions between multiple measures can be represented.
Core data required: - Physical data gathered through brief walkthroughs, onsite documents, or short-
term monitored data may be sufficient to model energy use. - The calculation’s accuracy should improve as more measured operational data is
used to create the representations of equipment performance and energy use. Core labor required:
- Engineering labor is required to collect and analyze the operational data. Additional efforts are required to follow best practices in calculations by clearly presenting the calculation process, documenting all assumptions and equations used, and developing calculations in a manner that allows for simple corrections when post-installation monitored data is available.
- Since energy savings depend on the accuracy and completeness of the calculations and assumptions, a third-party review is required.
- Additional labor is required to conduct field verification activities in which data is collected and analyzed to prove the ECM operates as predicted by the original engineering calculations. Time should be allocated to update the energy calculations when the field verification data does not align with the performance modeled in the original calculations.

32
Don’t use when: - High certainty of accurate savings is required. - Measures cannot be adequately represented by any common calculation
techniques.
Method 2: System or Equipment Energy Measurement Method 2 uses similar spreadsheet calculation techniques as Method 1 to estimate energy savings for equipment or end uses. A system’s or equipment’s energy use is characterized into its load and hours-of-use parameters, and these parameters are quantified using more rigorous measurements. Engineering assumptions are not sufficient to quantify energy use from operational data when using Method 2. If energy use is not measured directly, operational data may be used to verify savings only after appropriate measurements are taken to verify the relationship with the energy parameters. Because Method 2 requires measurements for baseline and post-installation periods, energy savings are not quantified until after post-installation data collection is complete. Energy savings estimated before the post-installation data collection does not fulfill the requirement of this approach. This method may be implemented in adherence to IPMVP Retrofit Isolation Options A or B, or in compliance with ASHRAE Guideline 14 retrofit isolation path. Best to use when:
- Stakeholders require a high level of certainty regarding quantification of energy savings.
- Energy use of systems or equipment affected by the measures may be isolated and measured.
Core data required: - Energy measurements in the form of spot measurements or monitored data that
characterize both load and hours of use of specific piece of equipment or end use
Core labor required: - Basic engineering labor is required to collect and use the appropriate energy
data or develop verified proxies. - The requirements for direct energy measurements may increase the labor time
required over Method 1 Do not use when:
- Savings result from multiple complicated measures, spanning multiple systems - Measure level savings are needed and multiple measures impact the same
equipment or end use (this approach cannot isolate measure level savings within the same measurement boundary)
Method 3: Energy Models Using Interval Data

33
Method 3 relies on measurements of energy, and their driving variables, in both the baseline and post-installation periods. Regression-based energy models are developed for energy use using monitored short-time interval energy and independent variable(s), often ambient temperature data. Using the model with actual post-installation conditions, savings are determined from the difference between the adjusted baseline and measured post-installation energy use. Interval data regression modeling may be applied at the whole building level or at a building subsystem when sub-metered data is available. Guidance is provided to identify building subsystems, appropriate modeling equation forms, length of monitoring period, data preparation requirements, and useful tools. This method may be applied in adherence with IPMVP Retrofit Isolation Option B, or Whole-Building Option C. Best to use when:
- Energy use follows predictable patterns that can be represented by an energy regression to a level of accuracy and precision that satisfies the project stakeholders.
- Total savings from multiple measures are detectable at either the whole building or building subsystem level. For example, the total savings should be larger than the variation, or noise, of the energy regression.
- Energy meters and submeters already exist for the desired measurement boundary (whole-building or building subsystem)
Core data required: - Whole building or subsystem energy data in intervals no greater than 15 minutes
over the project timeline - Independent variables that drive energy use over the same period as the energy
data (e.g., ambient temperature, building schedules, and occupied periods) Core labor required:
- Engineering labor is required to develop adequate energy regressions from monitored data in the baseline and post-install periods. Specialized skill with regression analysis is required to develop representative energy models.
Do not use when: - Energy savings for each ECM is required - Regressions of energy use with driving variables are not sufficiently certain to
predict savings
Method 4: Calibrated Simulation Method 4 describes the use of calibrated computer simulations to model energy flows in a building or subsystem. Calibration is a process that assures the simulation output matches actual measured data from the whole building, or system level, energy use within a predefined limit. Once the simulation is calibrated, the model is used to predict both the baseline energy use and ECM impact.

34
This method may be implemented in adherence with IPMVP Option D: Calibrated Simulation. Best to use when:
- The data required for the other verification methods is not available and cannot be obtained
- The building has numerous ECMs that are highly interactive or when the building design is integrated and holistic, rendering isolation and M&V of individual ECMs impractical or inappropriate
- Energy simulations were previously created or are required for another purpose - Savings from each individual ECM need to be quantified for a project with
multiple ECMs - The budget for M&V is large enough to accommodate the hours required to carry
out this procedure Core data required:
- Applicable when building details are known. Access to record documents such as: construction drawings, specifications, TAB reports, mechanical equipment schedule, submittals, architectural floors plans, architectural elevation drawings, envelope characteristics such as R and U values is required to limit the number of assumptions made in the model
- Historical utility data and actual weather data should be available for at least one whole year in monthly format. Hourly or 15-minute interval data will increase accuracy if used
- Historical subsystem data should be used when available. The additional end-use breakdown is beneficial for calibration purposes and helps to increase accuracy.
Core labor required: - The qualifications and experience of the simulator is a key factor so Method 4 is
intended for only the most qualified practitioners Do not use when:
- Savings can be verified using any other method. The software cannot accurately model both the baseline and the ECM conditions, often true when equipment is “broken” or operation is “less than optimal”
Method Selection Selecting the optimal strategy to validate energy savings can be challenging as projects seldom have all the required resources readily available for a particular savings-verification approach. Deliberate planning at the onset of a project is necessary to ensure the desired savings-validation method can meet the desired project objectives. Evaluation Framework The selection of a verification method most suitable to a particular project generally depends on two main considerations—risk and cost. Unfortunately, they are driven by

35
numerous interrelated and interactive factors that vary greatly from project to project. The key metrics that influence both risk and cost are summarized in the table below. This section also describes these key metrics.
Table 1: Key Metrics for Evaluating Methods
Source: CACx, Guidelines for Verifying Savings from Commissioning Existing Buildings, 2012

36
Stakeholder Objectives Before the start of the project, stakeholders should understand how the quantification of savings affects them and if they are at risk of any penalties for either inaccurate savings estimations or for lack of savings persistence. Depending on objectives, some stakeholders might desire a verification approach to demonstrate improvements in system operation only, while others might require significant efforts to quantify actual energy savings as precisely as possible. The following is a list of key metrics that stakeholders should evaluate as part of the program or project. These metrics (bold text) are rated for each approach so that stakeholders can easily make a comparison between their desired needs and the ability of verification approaches to meet those needs.
Relative Accuracy Quantifying energy savings has always been a challenge due to the nature of measuring energy that has not actually been consumed. Savings estimation approaches typically require some assumptions and extrapolation which inherently introduces an unknown amount of uncertainty into the final savings value. Some verification approaches produce very general evidence that savings exist. An example is the “deemed” savings approach, which relies on operational verification strategies to make sure the measures installed are operating correctly, while their energy savings numbers are based on averages of similar measures in other buildings or are calculated from generic building simulations. There is no way to verify the actual savings that have been achieved; only that operations are improved. Other approaches incorporate more rigorous before-and-after comparisons of energy use measurements, factor in the impact of conditions that change between baseline and post-installation periods, and produce an energy savings estimate which may include an estimate of its uncertainty. The rating of accuracy in the Evaluation Framework is based on a relative 1–5 scale with 1 being the least accurate and 5 being the most accurate. The general assumption used to assign a rating is that accuracy improves with an increasing level of rigor in data collection, analysis thoroughness, peer review, and details required to determine the energy savings estimate.
Quantification of Savings Uncertainty As part of risk management, some stakeholders might desire a quantifiable evaluation of the savings uncertainty. Only some of the listed verification approaches are able to provide an estimate of the savings uncertainty. This metric is rated as a simple yes/no.
Granularity of Savings

37
Savings can be reported from a whole building level down to individual measures. A whole building approach will capture the impact of all implemented measures, including any interactive effects. As such, the effects of individual ECMs cannot be independently quantified. A system approach will capture the impact of all measures implemented within that system only. When multiple ECMs are implemented within the system, individual impacts cannot be resolved. Some verification methodologies can verify savings of each individual measure. The desired granularity of savings verification should be established at the start of the project. Once the desired granularity is known, the stakeholder can focus on specific verification approaches that match. This metric is rated with three options, whole building, system, or measure level capability.
Savings Interactions Captured Energy-conservation measures might have interactions across multiple systems where a modification to one system or component impacts the consumption in another. Some stakeholder objectives might require all possible impacts, beneficial or not, be measured and reported. To this end, the verification of savings approaches can differ in the scope and range of measurement. Some approaches can isolate only a single system or piece of equipment and would not capture impacts from other affected systems. Other approaches focus on impacts at the main meter level and inherently capture all associated savings interactions. Savings evaluated at main meters cannot quantify system or measure level impacts accurately. If the stakeholder goals include capturing all possible savings interactions, then the verification approach must be applicable to all affected systems. Some of the verification approaches described in this guide could capture interactive savings with an additional level of effort.
Persistence of Benefits A stakeholder’s needs may require a system or procedure to promote persistence of RCx benefits. Some verification approaches are more readily adaptable to establish continuous feedback on energy performance while others require repetition of the entire verification process. This metric is rated as a “repeat” or “continuous.” It is important to note that repeating efforts or continuous reporting can have a significant impact on costs and budgets.
Formal Method Some stakeholders may require a savings verification approach that is described in published industry standards or guidelines. The approaches evaluated in this project range from informal methods that are commonly used to those described in IPMVP or ASHRAE Guideline 14. Each approach is rated with informal, IPMVP, and ASHRAE GL-14.
Resource Constraints
38
Cost is a constraint that impacts all phases of a project and often limits the ability to apply specific verification approaches. Costs are affected by multiple interactive factors including, but not limited to:
• The ability to obtain data required for verification • The complexity of the equipment or measure • The availability of time savings tools • The level of rigor required by the specific verification method • The budget for M&V activities
Due to the inherent variability of verification costs, it is not realistic to assign a general range. Rather, cost should be considered by the stakeholder on a project-by-project basis while evaluating each constraint. The following is a list of key constraints that stakeholders should evaluate as part of the program or project.
Required Baseline and Post-ECM Data Type The type of data required, both baseline and post-implementation, can vary substantially among and within verification approaches. Typical data types range from energy consumption derived from monthly utility bills, 15-minute interval electric consumption data, system-level monitored energy use, monitored data from key operating parameters trended over time (e.g., temperatures, flow rates, status, etc.). Equipment performance curves may also be required to link performance data with energy use. Monthly consumption data and main meter interval data are typically provided by the utility. Sub-metered interval data might also come from the utility; however, previously installed utility sub-metering at the desired system level is less common. Sub-metered interval data often requires the installation of dedicated meters at the start of the project. Performance data (e.g., set points and schedules, airflows, nameplate info.) is typically collected through BAS trends or portable data loggers. The performance data is used by engineering calculations and simulations software to model the building, system, or equipment energy use. The stakeholder should evaluate the type and availability of data at the project site. If the ability to collect required data is not currently in place, additional capabilities can be incorporated. These additions typically add time and cost to the project. This metric is rated using the options: monthly data, main meter interval data, sub-metered interval data, performance data, physical inputs, or snapshots.
Required Baseline and Post-ECM Data Quantity The quantity of data required for each approach also varies significantly. Where possible, data should be collected over an entire range of operation of the equipment of system being analyzed. Constant applications may only require a simple spot measurement to characterize a complete cycle, while variable applications may take days, weeks, or even longer for a valid characterization. The availability of historical records, such as previous utility billing data or archived trends, might reduce the time and costs related to baseline data
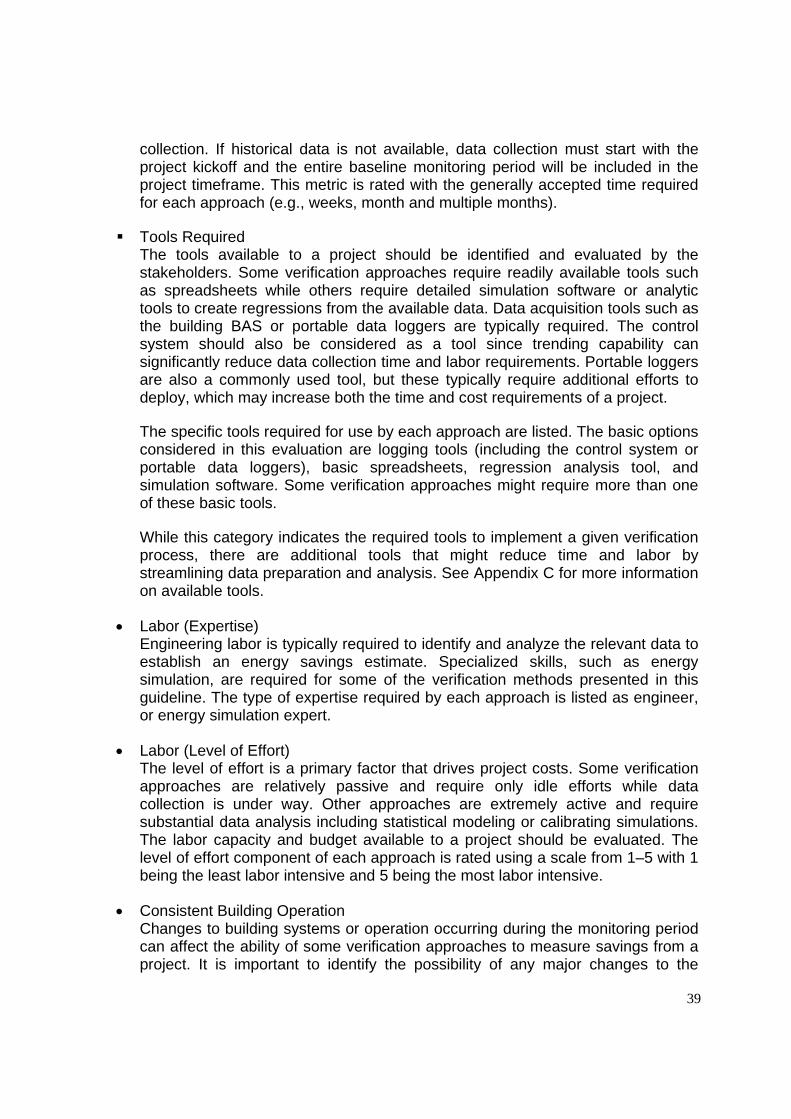
39
collection. If historical data is not available, data collection must start with the project kickoff and the entire baseline monitoring period will be included in the project timeframe. This metric is rated with the generally accepted time required for each approach (e.g., weeks, month and multiple months).
Tools Required The tools available to a project should be identified and evaluated by the stakeholders. Some verification approaches require readily available tools such as spreadsheets while others require detailed simulation software or analytic tools to create regressions from the available data. Data acquisition tools such as the building BAS or portable data loggers are typically required. The control system should also be considered as a tool since trending capability can significantly reduce data collection time and labor requirements. Portable loggers are also a commonly used tool, but these typically require additional efforts to deploy, which may increase both the time and cost requirements of a project. The specific tools required for use by each approach are listed. The basic options considered in this evaluation are logging tools (including the control system or portable data loggers), basic spreadsheets, regression analysis tool, and simulation software. Some verification approaches might require more than one of these basic tools. While this category indicates the required tools to implement a given verification process, there are additional tools that might reduce time and labor by streamlining data preparation and analysis. See Appendix C for more information on available tools.
• Labor (Expertise) Engineering labor is typically required to identify and analyze the relevant data to establish an energy savings estimate. Specialized skills, such as energy simulation, are required for some of the verification methods presented in this guideline. The type of expertise required by each approach is listed as engineer, or energy simulation expert.
• Labor (Level of Effort) The level of effort is a primary factor that drives project costs. Some verification approaches are relatively passive and require only idle efforts while data collection is under way. Other approaches are extremely active and require substantial data analysis including statistical modeling or calibrating simulations. The labor capacity and budget available to a project should be evaluated. The level of effort component of each approach is rated using a scale from 1–5 with 1 being the least labor intensive and 5 being the most labor intensive.
• Consistent Building Operation Changes to building systems or operation occurring during the monitoring period can affect the ability of some verification approaches to measure savings from a project. It is important to identify the possibility of any major changes to the

40
building that have occurred or are planned to occur during the monitoring period when analyzing the potential approaches. The changes can be as simple as a major tenant moving in or out or as extreme as a system retrofit or major renovation. At times, non-routine adjustments can be made to compensate for these changes to the building operation. If significant changes are expected during the monitoring period, it is generally easier to plan ahead and establish procedures for the non-routine adjustments before the project begins. This metric is rated as a simple yes/no to indicate whether the method requires a consistent building operation throughout the monitoring period.
Summary In terms of the key metrics discussed above, each verification method has different capabilities and requirements, which are summarized in Table 2: Evaluation Framework – Objectives and Table
Table 3 by CACx [30]. It is intended to assist stakeholders to quickly interpret the potential benefits and limitations of each verification approach.

41
Table 2: Evaluation Framework – Objectives
Table
Table 3: Evaluation Framework –Constraints

42
Method Selection Process There are five steps recommended by CACx for deciding on what M&V method would be suitable for a specific RCx project. Steps 1 and 2 may be completed without any prior knowledge of the verification approaches. Steps 3 and beyond will require some knowledge of the verification methods and their capabilities. Please refer to Figure 4. Step 1: Define the project objectives Create a list of desired goals of the project, including mitigating risks associated with the energy savings claims. Understanding the desired outcome of the project is critical in selecting the best method. Typical objectives might include:
Ensure equipment operation has improved Validate and obtain a rough estimate of energy savings Validate and obtain a precise estimate of energy savings Report savings for each ECM Report savings for the entire project
Step 2: Identify potential constraints While a given verification approach may satisfy all the identified objectives, the approach may require resources that are not available to the project. Identifying any known constraints at the outset, and comparing those with the key criteria of each method should help focus attention on the most applicable options. Common constraints might include:
Time available for verification Budget Available data sources Available tools Available skills
Step 3: Select initial verification method With the objectives and constraints in mind for a specific project, read though the evaluation framework and identify an initial verification option that strikes the best balance between the objectives and constraints. Step 4: Evaluate the detailed capabilities of the selected verification method At this point, a general idea regarding the type(s) of ECM(s) identified and the resources (budget, labor, time) available to the project are required. Determine if the verification method meets the goals of the project. If the project objectives can be met by a particular method, determine if any known constraints interfere with the core requirements of the method. Keep in mind that cost is a common constraint that may limit the ability to implement a specific approach. If the verification method does not appear feasible after a detailed evaluation, revisit Step 3 and select a different verification option, as illustrated in Figure 8 below. Once an approach is deemed acceptable, proceed to Step 5. Step 5: Develop M&V Plan
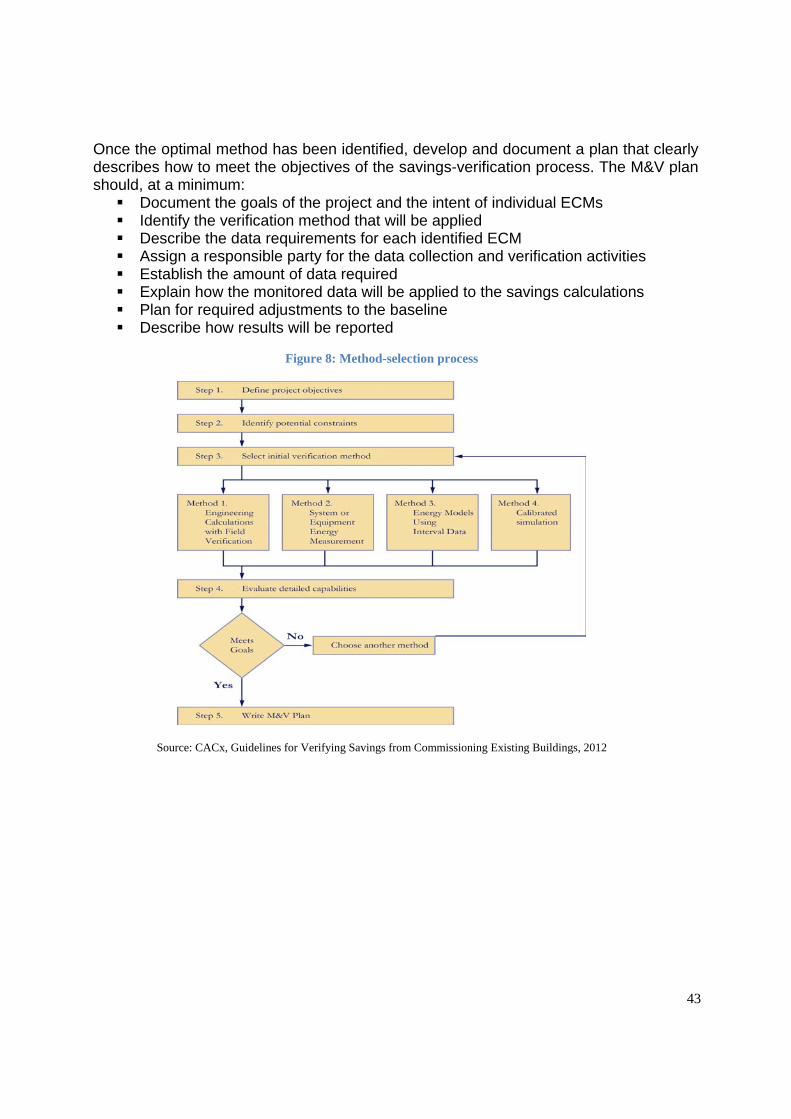
43
Once the optimal method has been identified, develop and document a plan that clearly describes how to meet the objectives of the savings-verification process. The M&V plan should, at a minimum:
Document the goals of the project and the intent of individual ECMs Identify the verification method that will be applied Describe the data requirements for each identified ECM Assign a responsible party for the data collection and verification activities Establish the amount of data required Explain how the monitored data will be applied to the savings calculations Plan for required adjustments to the baseline Describe how results will be reported
Figure 8: Method-selection process
Source: CACx, Guidelines for Verifying Savings from Commissioning Existing Buildings, 2012
44
Chapter 5. U.S. Support Policies and Programs and Recommendations for China Although energy efficiency has huge potential for end-user cost reduction, carbon emissions reduction and other environmental and social benefits, a large gap often exists between what is technically achievable in energy efficiency and what has actually occurred in the marketplace. RCx faces the same paradox; the market does not automatically respond well to lucrative RCx projects, even those that have reasonably short payback periods. The fundamental reason, as many studies [12, 13, 14, 15], have pointed out, are several major market failures. Specifically, we can identify five major issues [16]: Distorted Cost-Effectiveness
Cheap energy prices limit the profit levels and prolong the payback periods of RCx projects;
In some circumstances, initial investments of RCx are challenging for facility owners with tight budgets.
Insufficient Information Building commissioning and RCx is still a relatively new practice and the related
services and benefits are not well known. The value of commissioning services has not been demonstrated enough to inspire a wide range of property owners and managers;
Many misunderstand RCx as being expensive with a long payback period; Lack of strong confidence in the anticipated energy savings from RCx due to lack
of information and knowledge; Lack of reliable information to locate experienced RCx providers.
Inadequate Technical Skills
Experienced staff and service providers are still less than adequate; Training is often not readily available.
Market Misalignment
Internal accounting practices for energy, maintenance, and capital improvement budgets do not align well with incentives;
Split incentives between owners and tenants in lease spaces.
Inertial Behavior and Lack of Motivation Lack of time, short planning horizons, and institutional inertia discourage property
owners and managers from considering new initiatives; O&M staff often feel lack of the necessary time and resources to be pro-active; No pre-established budget and internal responsibility assigned for initiating an
RCx project.

45
In summary, on the “demand” side, building owners and managers are not well informed of RCx and also do not pay adequate attention to the benefits of pursuing changes or new initiatives. On the “supply” side, insufficient technical capacity in RCx services significantly hinders the wide application of RCx. And in the marketplace, the major barrier is that the environmental and social benefits of RCx are externalities. Therefore, focused policies and specifically designed incentive programs are critical to help overcome the barriers. RCx Policy in the U.S. Among the various energy-related federal laws of the United States, the three Energy Policy Acts of 1992, 2005, and 2007 have included many provisions for energy conservation, such as the Energy Star program, and included grants and tax incentives for both renewable and non-renewable energy. Also, the American Recovery and Reinvestment Act of 2009, commonly known as the “stimulus”, has authorized large spending on energy efficiency, such as $5 billion for weatherizing modest-income homes, $3.2 billion toward Energy Efficiency and Conservation Block Grants, $3.1 billion for the State Energy Program to help states invest in energy efficiency and renewable energy, and $602 million to support the use of energy efficient technologies in building and in industry [17]. The Department of Energy and the Environmental Protection Agency are the main federal government arms for promoting energy efficiency. Federal laws and programs have inspired many state and city governments to provide more direct support to building energy efficiency, including programs specifically targeting RCx. Many incentive programs are provided by utility companies which participate in state energy efficiency programs. In fact, state-specific incentive programs play a significant role in the overall energy policy of the United States. Below are just a few examples of local RCx incentive programs. California California's restructuring law provides funding for energy efficiency programs through a non-bypassable Public Goods Charge (PGC). The California Public Utilities Commission approved energy efficiency funding of $3.1 billion for 2010 through 2012. A portion of the budget is funded by the PGC, with the rest is to be recovered through electric rates. Public-purpose-funded energy efficiency programs are administered by the state's investor-owned utilities: Pacific Gas and Electric (PG&E), Southern California Edison (SCE), Southern California Gas (SoCal Gas), and San Diego Gas and Electric (SDG&E) [18]. Through bi-lateral agreements with energy management company EnerNOC, both Southern California Edison (SCE) and Pacific Gas & Electricity offer programs to offset

46
the costs to deploy EfficiencySMART Insight, EnerNOC’s web-based tool for energy data analysis. Southern California Edison[19] SCE has an RCx Program which offers technical and financial assistance for SCE’s customers. The program uses experienced engineers in identifying efficiencies in the buildings. These engineers will work with the County to find the best ways to save money by reducing energy usage and improve occupant comfort. SCE also has resources to identify incentives available for energy that is saved by installing new and more efficient equipment. SCE offers free screening and scoping, a custom investigation of the building operations as well as documentation and training. The RCx Program website also offers Cx and RCx guides, case studies, examples of common measures etc. also offers Cx and RCx guides, case studies, examples of common measures etc. Pacific Gas and Electric Co. [20] PG&E’s incentives are paid directly to the customer based on achieved annual energy savings at the rate of $0.09/annual saved kWh, $1.00/annual saved therm, and $100/on-peak kW*, capped at 50% of the total project cost. PG&E’s engineering resources will also provide limited support to verify that the RCx measures were installed per industry best practices. PG&E can also provide resources to identify and analyze other potential energy saving opportunities involving demand response, retrofitting and benchmarking projects. City of San Francisco: Adopted: 2011; Effective: 2011. Affected Property Types: Nonresidential public and private buildings that are 10,000 ft2 or larger. Key Requirements: Requires nonresidential building owners to obtain energy audits at least once every 5 years and measure and disclose energy performance using the U.S. Environmental Protection Agency’s (EPA) ENERGY STAR® measurement and tracking tool—Portfolio Manager—annually. Requires the stringency of energy audits to be proportionate to building size: Buildings 50,000 ft2 or larger: Whole-building audit that meets or exceeds ASHRAE Level II Buildings 5,000 ft2 to 49,999 ft2: Whole-building audit that meets or exceeds ASHRAE Level I. Requires the energy professional performing the energy efficiency audit to hold third-party credentials (e.g., Association of Energy Engineers Certified Energy Manager, licensed professional engineer) and have a minimum number of years of experience (which varies by credential). Requires the energy professional to include in the audit report information on available RCx and retrofit measures, the estimated implementation costs, and the energy and cost savings.

47
Requires building owners to report compliance with the audit requirements to the city. Reported information must include: A list of RCx and retrofit measures with a simple payback of 3 years or less, or with a beneficial net present value Total estimated implementation costs and energy savings if measures are fully implemented A list of the measures implemented. Requires the city to disclose and update at least annually building-specific compliance status and aggregate energy statistics based on the reported benchmarking and audit data. Establishes a non-compliance penalty of $50 to $100 a day for a maximum of 25 days. City of San Diego: In 2009 the City of San Diego completed an Analysis of Local Government Policy Options and found that RCx in commercial buildings has a low cost of implementation and a medium to low potential to reduce energy use, depending on the population of buildings targeted. A policy was developed and adopted in 2009 that requires RCx in large buildings. Local Law 87 defines large buildings as 50,000 square feet or greater. Lots that have multiple buildings that exceed 100,000 gross square feet are required to receive an efficiency audit as well to identify all “reasonable” RCx needs. The building owner is required to perform all of the RCx needs that are found with certain exclusions e.g. LEED certified or highly efficient buildings. New York The New York State Energy Research and Development Authority (NYSERDA)’s Program Opportunity Notice 1746 offers cost-sharing incentives for customers to offset the cost of a variety of energy efficiency projects—covering 50% of the project costs, up to 10% of annual energy costs or $1 million [21]. New York City NYC passed the Greener Greater Buildings Plan in 2009. Local Law 87 requires building owners to file energy efficiency reports every 10 years (section 28- 308.4) that must include RCx on all of the base building systems. The RCx must be performed under the supervision of an RCx agent within 4 years of submitting the report. The exceptions include LEED buildings that were certified within 2 years of the energy efficiency report. Other detailed information is listed below: Adopted: 2009; Effective: 2013 through 2022. Affected Property Types: Nonresidential and multifamily public and private buildings that are smaller than 50,000 ft2. Key Requirements: Requires affected buildings to undergo an energy audit and RCx every 10 years. Audits must meet the American Society of Heating, Refrigerating, and Air-Conditioning Engineers (ASHRAE) Level II Energy Survey and engineering analysis requirements, and must include: Assessment of all base building systems, including

48
building envelope and HVAC, conveying, domestic hot water, electrical, and lighting systems. Recommended improvements, including imple-mentation costs, cost savings, and simple payback. RCx must include an assessment of operating protocols, equipment calibration, cleaning and repairs, training, and documentation issues. Audits and RCx projects must be conducted by certified professionals (e.g., certified energy manager, certified commissioning professional) with relevant experience (i.e., 3 years relevant experience for auditors, 1 year relevant experience for RCx). Texas CenterPoint Energy This utility company offers an RCx program providing free technical energy analysis by a qualified RCx agent to reduce energy use and operating costs, while improving building performance and comfort. Facilities should have over 150,000 sqft. of conditioned space. Read more about complete program requirements [22]. Illinois [23] The Illinois Department of Commerce and Economic Opportunity (DCEO) Bureau of Energy and Recycling administers the public sector energy efficiency programs required by the Illinois Energy Efficiency Portfolio Standard (EEPS). As part of this larger program and the Illinois EEPS, the DCEO funds the Illinois Smart Energy Design Assistance Center (SEDAC) to administer and execute the Public Sector Building Retro-Commissioning Program throughout Illinois. This program is limited to Commonwealth Edison (ComEd) and Ameren Illinois electric service territories, though entities receiving natural gas from Ameren Illinois, Nicor, North Shore, or Peoples Gas may also be eligible for inclusion of natural gas savings measures. SEDAC is managed by the School of Architecture at the University of Illinois at Urbana-Champaign. Smart Energy Design Assistance Center SEDAC's RCx services are free for local, state, and federal governments; public school districts; community colleges; and universities that receive electricity distribution service from ComEd or Ameren affiliated utilities (AmerenCILCO, AmerenIP, and AmerenCIPS) as a result of Illinois DCEO funding. Clients are required to implement at least $10,000 on building improvements based on recommendations, and must implement the measures within 10 months or by the program year deadline. Wisconsin County of Waukesha Sustainability plan for 2010 to 2014 includes “Objective 2.2 Retro-commissioning of County Facilities.” This is in order to achieve savings in gas, electric demand and energy. RCx will realize savings through the systematic evaluation of facility systems

49
leading to the implementation of “cost effective” projects to improve operations. The County plans to evaluate and initiate action where it is deemed necessary. The goal of this plan is to the combined consumption of electric and natural gas by 20% and to reduce annual water consumption by 5 to 10%. Maryland Baltimore Gas and Electric Co. BGE offers an RCx program for non-residential customers to offset the cost of RCx services—BGE provides incentives up to 75% of the service costs, with a $15,000 project cap. Read more about complete program requirements. Summary As can be seen from the above descrption, US RCx policies have taken two major forms. One type is mandatory RCx requirement for certain buildings (usually large buildings). The other approach is offering subsidies to encourage commissioning and RCx, including providing initial analysis help, RCx investigation, and cost-sharing for certain eligible buildings (usually medium or large buildings). While we have not found targeted studies on the effects of incentives, the trend of gradually increasing commissioning practices is clearly noticeable. For example, Lawrence Berkeley National Laboratory’s database on new and existing building commissioning projects grew from 224 buildings (30 million square feet) in 2004 to 643 buildings (100 million square feet) in 2009 -- all located in the United States, and spanning 26 states [1]. The same study has found that virtually all existing building projects were cost-effective in terms of payback time, first year savings, and cost of avoided carbon emissions.

50
Recommendations for China Although there is no definitive study on the potential of energy savings from building commissioning and RCx in China, by simply looking at the dynamics of China’s building construction, one can feel the immensity of the RCx potential. China already has a huge building stock, totaling some 40 billion square meters (m2), and is gaining 2 billion m2 more every year [24]. The majority of the existing buildings are residential, but the 4 percent of “large non-residential and non-industrial buildings” accounts for approximately 22 percent of the energy that all buildings consume [25]. China’s official term for these buildings is “large public buildings” – defined as those commercial, public, and governmental buildings each having at least 20,000 m2 of total floor area and a central air conditioning system. For convenience, we use “commercial buildings” in this section to loosely correspond to what China calls public buildings. A simple calculation tells us that 4 percent of the 40 billion m2 of existing building floor could mean up to 80,000 large commercial buildings in number, most of which, like other existing buildings in China, have made little use of energy efficiency measures [26]. As a result of China’s three decades of rapid economic growth, the share of energy consumption from the operation of existing buildings has increased steadily. As can be seen from Figure 9, building operation in China consumed over 700 million tons of coal equivalent (20 million terajoules), representing 23% of the total national energy consumption, in 2009.
Figure 9. Energy Consumption Growth by Existing Buildings’ Operation in China (1980-2009)
Source: Dong, Yiting, China Building Energy Use Study, CCED Working Paper Series, Peking University, p. 5, April 2013
Exis
ting
Build
ing
Tot.
Ope
ratio
nal E
nerg
y
(10,
000
ton
SCE)
Energy Percent of Tot. Societal Use

51
Since the mid-1980s, the Chinese government has implemented a range of energy efficiency policies for the building sector, including strengthening energy conservation design standards for new buildings, establishing green building and energy efficiency labeling systems, supporting energy efficiency retrofit demonstrations across the country (which total approximately 4 billion square meters), and piloting energy audits and energy consumption caps for certain commercial buildings. Despite these great efforts, the majority of the existing commercial buildings still experience very high energy use. Commissioning and RCx are rarely considered. China’s current five-year plan on building energy efficiency (2011-2015) has set clear energy conservation goals, one of which is to reduce the energy intensity (energy consumption per square meter of building floor) of “public buildings”, i.e. non-residential and non-industrial buildings, by 10 percent compared to the 2010 level. Furthermore, “large public buildings” will be targeted to lower their energy intensity by 15% [27]. To achieve these challenging goals, the government has vowed to adopt a range of policy measures. For commercial buildings, these measures include advancing energy use data gathering, audit and disclosure, establishing online monitoring platforms, supporting over 10 cities to implement energy retrofit demonstration projects, and promoting energy retrofits by university campuses and government buildings. These measures will be crucial to the successful achievement of China’s efficiency goals and can also provide opportunities to practice RCx in ways that will make additional contributions to energy conservation. For example, pushing for energy audits in large commercial buildings logically also promotes RCx. To begin catalyzing RCx practices in China, the government can design policy interventions based on the theory of how technological innovations diffuse into the market. According to Everett Rogers [28] and as summarized in Table 5, the diffusion of an innovation has five stages. Initially, a new technology, process, or practice will face high barriers and risks when entering the market and will only be tried by a handful of innovative people (innovators). With promotional measures, such as government’s financial help and demonstration projects, more entrepreneurs (early adopters) will gradually adopt the technology. Continued and enhanced policy measures will spur utilization of the innovation by a large number of people constituting an “early majority”. Then mandatory regulations will spur the “late majority”. There will always be some people lagging behind (laggards) who need even more motivation to adopt the technology.

52
Table 5: RCx Market Adopters, Barriers and Motivation Measures Adopter Category
Target Barriers Motivation Measures
Innovators High financial risks Innovative Finance Tools & Incentives
Early Adopters
Lack of technical knowledge; High financial risks
Pilots; Monetary incentives
Early Majority
Lack of technical knowledge; Lack of building energy and efficiency information; Lack of motivation; High financial risks
Business cases; Labeling and benchmarking; Lead by example; Monetary incentives
Late Majority
Lack of motivation Mandatory tools such as codes and standards
Laggards Lack of motivation Mandatory tools such as codes and standards
More specifically, the Chinese government may consider the following action points to jump start RCx applications in China:
Support research and evaluation of RCx potential, characteristics, and barriers in China;
Include RCx in selected demonstration projects on large building energy audits to gain experience and demonstrate its value;
Develop user-friendly guidelines on RCx; Establish an interim/testing incentive program to foster the growth of RCx service
providers; Accelerate the development of a clear and practical M&V system and related
capacities; Support training and Lead by Example efforts through international cooperation; Support timely evaluation of the initial efforts to identify best practices and
lessons learned; and Continue the initiative by developing a formal policy or plan to encourage RCx
practice in all large cities.
As has been explained in this report, many studies and hundreds of real cases have confirmed that RCx can create huge energy savings, and clearly constitutes a “low-hanging fruit” in the energy performance or energy management field with impressive cost-effectiveness. RCx does not require prohibitively advanced technology or high upfront investment. Therefore, China can realistically be expected to draw upon related international experience and implement RCx initiatives. According to a 2009 McKinsey report, in the next 15 years, 5 million new buildings are expected to be built in China, of which 50,000 will be skyscrapers [29]. Commissioning and RCx are urgently needed to help China save the vast energy resources being wasted on a daily basis in existing commercial buildings.

53
References 1. Mills, E., Building Commissioning: A Golden Opportunity for Reducing Energy Costs and
Greenhouse Gas Emissions, Report for California Energy Commission, LBNL, July 21, 2009. 2. PECI, History of Commissioning, as shown at Total Building Commissiong website:
www.totalbuildingcommissioning.com/2010/07/history-of-commissioning/, accessed June 9, 2013. 3. Building Commissioning Association, Best Practices in Commissioning Exhisting Buildings,
http://www.bcxa.org/knowledge-center/bca-public-library/ , accessed June 9, 2013. 4. Authors’ research into Chinese websites and conversations with Chinese experts. 5. Hua-Yan-Zhong-Shang Institute, 2013-2017 Analysis Report on China Energy Management Service
Industry Development Outlook and Investment Strategy Planning (2013-2017 Analysis Report on Development Projection and Investment Strategic Planning of Chinese EMC Industry), January 2013.
6. California Commissioning Collaborative, Retro-Commissioning Fact Sheet, Department of General Services of California Government, www.documents.dgs.ca.gov/green/eeproj/retrocommfactsheet.doc, accessed June 10, 2013
7. Haasl,T., and K. Heinemeier, California Commissioning Guide: Existing Buildings, California Commissioning Collaborative, 2006.
8. Federal Energy Management Program, Continuous Commissioning Guidebook for Federal Energy Managers, Office of Energy Efficiency and Renewable Energy, U.S. Department of Energy, Oct. 2002; www1.eere.energy.gov/femp/program/om_guidebook.html , accessed June 28, 2013.
9. Haasl, T., Potter, A., and etc. 2001. “Retrocommissioning’s Greatest Hits” Proceedings of the First International Conference for Enhanced Building Operations, Austin, Texas, July 16-19, 2001
10. EVO’s website: www.evo-world.org 11. Mills, E., H. Friedman, T. Powell, N. Bourassa, D. Claridge, T. Haasl, and M.A. Piette. 2004. “The
Cost-Effectiveness of Commercial-Buildings Commissioning,” Lawrence Berkeley National Laboratory. http://eetd.lbl.gov/EMills/PUBS/Cx-Costs-Benefits.html
12. MPSC (Maryland Public Service Commission), 2000, Commercial Building Retro-Commissioning Program Manual, Maryland Statewide Three-Year Energy Efficiency Plan
13. SCE (South California Edison), 2008, Retro-Commissioning Program Manual 14. SCE, 2011, Assessment and Planning Report for Developing Commissioning/Retro-Commissioning
Policy and Procedures 15. State & Local Energy Efficiency Action Network, 2012, Retro-Commissioning for State and Local
Governments Fact Sheet 16. X Liu, X Hu, et al., A Policy Review and Comparison of Building Energy Efficiency and Distributed
Renewables in the U.S. and China, Building Research and Information, in review 17. Recovery.gov website: www.recovery.gov/About/Pages/The_Act.aspx 18. Energy Efficiency and Renewable Energy, U.S. Department of Energy, Federal Energy Management
Program’s website: www1.eere.energy.gov/femp/financing/eip_ca.html, accessed June 18, 2013 19. SCE website: http://www.sce-rcx.com/ 20. PG&E website: www.pge.com/en/mybusiness/save/rebates/retrocommissioning/index.page 21. EnerNOC website: www.enernoc.com/for-businesses/efficiencysmart/funding-ee, accessed June 18,
2013.

54
22. CenterPoint website: www.centerpointenergy.com/services/electricity/business/energyefficiencyprograms/retro-commissioning/
23. Energy Efficiency and Renewable Energy, U.S. Department of Energy, Database of State Incentives for Renewables & Efficiency website: www.dsireusa.org/incentives/incentive.cfm?Incentive_Code=IL66F, accessed June 18, 2013.
24. Various Chinese media reports quoted government officials and experts 25. Wu, Yong, Deputy Director-General, Ministry of Housing and Urban-Rural Development, quoted in
Sina.com news, http://finance.sina.com.cn/chanjing/b/20110617/130210008082.shtml, June 17, 2011. 26. Kuang, Ping, member of Chine Political Consultative Conference, quoted in Chongqing Daily,
http://news.dichan.sina.com.cn, March 6, 2012. 27. Department of Energy Efficiency and Science and Technology, Ministry of Housing and Urban-Rural
Development, 12th Five-Year Plan for Building Energy Efficiency, May 2012. 28. Rogers, Everett M. (1962). Diffusion of Innovations. Glencoe: Free Press. ISBN 0-612-62843-4. 29. McKinsey & Co., Preparing for China’s Urban Billion, 2009. 30. Californian Commissioning Collaborative (CACx), Guidelines for Verifying Savings from
Commissioning Existing Buildings, 2012. Available at http://cacx.org/resources/vos-guidelines/

55
Annex I. Technical Measures Often Used in Retro-Commissioning
A typical modern building has four major systems that a thorough RCx process should look at [8].
RCx Measures for Air Handling Unit
An air handling unit (AHU) conditions and distributes air inside buildings. A typical AHU system consists of a combination of heating and cooling coils, supply and return air fans, filters, humidifiers, dampers, ductwork, terminal boxes and associated safety and control devices, and possibly an economizer. As the building load changes, AHUs change one or more of the following parameters to maintain building comfort: outside air intake, total air flow, static pressure, supply air temperature, and humidity. Both operating schedules and initial system set up, such as total air flow and outside air flow, significantly impact building energy consumption and comfort. Ten major ReCx measures for optimizing AHU operation and control schedules are described below: Adjust total air flow for constant air volume systems
Airflow rates are often significantly higher than required in buildings primarily due to system over-sizing. In some large systems, an oversized fan causes over-pressurization in terminal boxes. This excessive pressurization is the primary cause of room noise. The excessive air flow often causes excessive fan energy consumption, excessive heating and cooling energy consumption, humidity control problems and excessive noise in terminal boxes. If the static pressure at the most remote terminal box is higher than necessary, a new fan speed can be considered. The airflow reduction can result in significant fan energy savings and reduced noise level.
Set Minimum Outside Air Intake Correctly
Outside air intake rates are often significantly higher than design values in existing buildings due to a lack of accurate measurement, incorrect design calculation and balancing, and/or operational and maintenance problems. The excessive outside air intake consumes a significant amount of extra heating and cooling energy, typically costing from $1 to $3 per cfm per year depending on location and energy cost. If there is too much outside air intake, the AHU can also lose the ability to control room humidity and temperature.

56
The minimum outside air requirement is dependent on both the occupancy and building exhaust air flow. However, the outside air intake must be slightly higher than the common exhaust air flow in order to maintain positive building pressure. Dynamically adjusting outside air intake based on the occupancy can result in significant building energy savings while maintaining satisfactory indoor air quality. Improve Static Pressure Set Point and Schedule.
The static pressure of supply air is used to control fan speed and to ensure air flow reaches each zone. If the static pressure set point is lower than required, some zones may experience comfort problems due to a lack of air flow. If the pressure set point is too high, fan power will be excessive. In most existing terminal boxes, proportional controllers are used to maintain the airflow set point. The static pressure set point is often determined under the maximum cooling load condition. The value may be determined by the design engineer using a theoretical calculation or a rule of thumb. The operating staff may increase the value to “eliminate” hot spots. The static pressure set point is often significantly higher than required. Field measurements have found that in some cases air flow rates can be 20% higher than necessary. Accurately determining the maximum static pressure set point is critical for both thermal comfort and fan energy consumption. Under partial load conditions, the duct pressure losses are lower due to decreased airflow rate. If the maximum static pressure is used, the terminal box dampers must provide the pressure drop no longer occurring in the duct. This causes higher fan power than necessary and sometimes causes noise problems in the terminal box due to excessive pressure drop. Therefore, the static pressure set point should be reset/decreased when the air flow decreases. When modern control systems are installed on both the AHU and terminal boxes, the fan may be directly controlled by the damper positions in the terminal boxes. The fan speed control should maintain at least one selected terminal box at the maximum open position. When all terminal boxes are functioning properly, this method uses the least fan power. However, when a terminal box is malfunctioning, this method may not produce the expected savings. Optimize Supply Air Temperatures
Supply air temperatures, cooling coil discharge air temperature for single duct systems or cold deck, and hot deck temperatures for dual duct systems, are the most important control parameters for AHUs. If the cold air supply temperature is too low, the AHU may remove excessive moisture during the summer using mechanical cooling. The terminal boxes must then warm the over-cooled air before sending it to each individual diffuser for a single duct AHU. More hot air is required in dual duct air handlers. A lower air temperature consumes more thermal energy in both systems. If the cold air supply temperature is too high, the building may lose comfort control. The fan must supply more air to the building during the cooling season; therefore fan power will be higher than necessary.

57
The goal of optimal supply air temperature schedules is to minimize combined fan power and thermal energy consumption or cost. Although developing optimal reset schedules requires a comprehensive engineering analysis, improved, near optimal, schedules can be developed based on several simple rules. Improve Economizer’s Operation and Control
An economizer is designed to eliminate mechanical cooling when the outside air temperature is lower than the supply air temperature set point and decrease mechanical cooling when the outside air temperature is between the cold deck temperature and a high temperature limit or return air conditions, typically less than 70°F (21.1°C). An economizer should control the supply-air temperature by modulating the o/a damper when the o/a temperature is lower than supply-air temperature set point. However, economizer control is often implemented to maintain mixed air temperature at 55°F (13°C). This control algorithm is far from optimum. It may, in fact, actually increase the building energy consumption.
Improve Coupled Control AHU Operation
Coupled control is often used in single zone, single duct and constant volume systems. Conceptually, this system provides cooling or heating, as needed, to maintain the set point temperature in the zone. It uses simultaneous heating and cooling only when the humidistat indicates that additional cooling, followed by reheat, is needed to provide humidity control. However, the humidistat is often disabled for a number of reasons. To control room relative humidity level, overlap the control signals or spring ranges. Simultaneous heating and cooling occurs almost all the time. Install Variable Frequency Drive (VFD) on Constant Air Volume Systems
The building heating load and cooling load varies significantly with weather and internal occupancy conditions. In constant air volume systems, a significant amount of energy is consumed unnecessarily due to humidity control requirements. Most of this energy waste can be avoided by simply installing a VFD on the fan without a major retrofit effort. Guidelines for VFD installation are presented separately for dual duct, multi-zone and single duct systems. Control Airflow in Variable Air Volume (VAV) Systems
Airflow control of VAV systems has been an important design and research subject since the VAV system was introduced. An airflow control method should: (1) ensure sufficient air flow to each space or zone, (2) control outside air intake properly, and (3) maintain a positive building pressure. These goals can be achieved using the variable speed drive volume tracking (VSDVT) method. The VSDVT method reduces the fan energy by using the improved static pressure reset and decoupling the outside and return air dampers. It implements the volumetric tracking using the VSD speeds and the fan heads, and uses CO2 demand control to

58
minimize outside air intake. The method can result in significant building pressurization control improvement and significant energy savings. Improve Terminal Box Operation
The terminal box is the end device of the AHU system. It directly controls room temperature and air flow. Improving the set up and operation are critical for room comfort and energy efficiency. In large commercial buildings, airflow reset may result in the same amount of savings produced by combined air flow and temperature reset.
RCx Measures for Water/Steam Distribution System
There are usually two distribution systems in a modern building with central air conditioning, one to distribute chilled water and another hot water and steam. These distribution systems consist mainly of pumps, pipes, control valves and variable speed pumping devices. A central chiller plant may have a primary loop and a secondary loop. In the primary loop, pumps are only used to circulate water through the chillers. In the secondary loop, pumps are used to distribute water throughout the buildings. A distribution system can be source-distributed or distributed. A source-distributed system has secondary pumps located only in the central plant. A distributed system has pumps located in buildings but with no secondary pumps. Most central plants are not pure source-distributed nor pure distributed systems. Most have all three types of pumps: primary, secondary, and building pumps. The common RCx measures aim to optimize pressure control, water flow control, and overall condition. Improve Building Chilled Water Pump Operation
Most building chilled water pumping systems are equipped with variable speed devices (VSDs). If a VSD is not installed, retrofit of a VSD is generally recommended. The discussion here is limited to systems where a VSD is installed. The goal of pumping optimization is to avoid excessive differential pressures across the control valves while providing enough water to each building, coil, or other end use. Improve Secondary Loop Operation
The building loop optimization should be performed before the secondary loop optimization. Source Distributed Systems: If there are no building pumps, the secondary pumps must provide the pressure head required to overcome both the secondary loop and the building loop pressure losses. In this case, the secondary loop is called a source distributed system. The secondary loop pumps should be controlled to provide enough pressure head for the most remote coil. If VFDs are installed, the differential pressure can be controlled by modulating pump speed. Otherwise, the differential can be modulated by changing the number of pumps in operation.

59
The source-distributed system is the least efficient distribution system. Installing building pumps can decrease total pumping power by as much as 50% when the pumps are controlled and operated properly. The source distributed system will often have water balance problems because it over-pressurizes the control valves of the buildings nearest to the central plant. Due to excessive water flow through these buildings, often the remote buildings do not receive enough water. Alternatively, the distribution pump at the central plant must pump extra water. It is recommended that building pumps be installed for relatively large complexes with several buildings. Source Distributed Systems with Building Pumps: In most campus settings, both secondary distribution and building pumps are installed. The optimal differential pressure set point should be determined and implemented to minimize the energy consumption of building pumps. Improving Central Plant Water Loop Operation
The central plant loop optimization should be performed after secondary loop optimization. Single Loop Systems: For most heating distribution systems and some chilled water systems, a single loop is used instead of primary and secondary systems. Under partial load conditions, fewer pumps can be used for both chillers and heat exchangers. This can result in less pump power consumption. Primary and Secondary Loop Systems: Primary and secondary systems are the most common chilled water distribution systems used with central chiller plants. This design is based on the assumption that the chilled water flow through the chiller must be maintained at the design level. This is seldom needed. Due to this incorrect assumption, a significant amount of pumping power is wasted in numerous central plants. Design engineers sometimes include an isolation valve on the bypass line of the primary loop. Sometimes, no valve is included. In either scenario, the primary and secondary loop pumps can be optimized based on the fact that the chiller water flow can be changed.
Other Tips
Check the expansion tank frequently and ensure it maintains a positive pressure for the entire system and does not over-pressurize the system. Supply water temperature reset has a significant impact on the differential pressure set point. The differential pressure reset schedule should consider the impact of the temperature reset schedules. Typically, the temperature reset schedule should limit the chilled water flow below 60%. When the water flow is higher than 60% of the design value, the temperature reset significantly increases the pumping power. Frequently check the make-up water to identify any leakage. Make-up water costs money but more importantly, it also causes corrosion and fouling in coils.
RCx Measures for Central Chiller Plants

60
A central chiller plant includes chillers, cooling towers, a primary water distribution system and the condenser water distribution system. Although a secondary pumping system may be physically located inside the central plant, commissioning issues dealing with secondary loops are discussed in the last section. The central chiller plant produces chilled water using electricity, steam, hot water or gas. The detailed commissioning measures vary with the type of chiller. This section briefly describes general commissioning measures that can produce significant energy savings. Use the Most Efficient Chillers
Most central chiller plants have several chillers with different performance factors or efficiencies. The differences in performance may be due to the design, performance degradation, age or operational problems. One chiller may have a higher efficiency at a high load ratio while another may have a higher efficiency at a lower load ratio. The poorer-performing chillers are often older chillers that cannot produce rated capacity and often require more maintenance. However, an old chiller sometimes operates at the manufacturer’s design efficiency, while others will be 20% lower. Measurement of actual chiller performance is very important. The chiller performance measurement involves measuring chilled water production and energy input. The chilled water production can be determined from measured chilled water flow and supply, and return water temperatures. Flow measurement is extremely important and one should not assume the flow is at the design rate if there is a constant speed pump in the chiller primary loop. Measurements can be made accurately using a non-intrusive ultrasonic meter. To reduce the measurement error, chilled water supply and return water temperatures should be measured using the same sensor. Reset the Supply Water Temperature
Increasing the chilled water supply temperature can decrease chiller electricity consumption significantly. The general rule-of-thumb is that a one-degree Fahrenheit increase corresponds to a decrease in compressor electricity consumption of 1.7%. The chilled water supply temperature can be reset based on cooling load or ambient conditions. Increasing chilled water temperature may increase distribution pump (secondary pump) power consumption. The secondary chilled water flow should be less than 60% of the design flow rate before implementing the chilled water supply temperature reset. Supply temperature reset should not increase it above this level. The chilled water supply temperature reset directly impacts the dehumidification capability of the coils. The chilled water supply temperature should not be reset to a higher value until the ambient humidity ratio is less than 0.009 or the ambient dew point temperature is less than 57°F (14°C) for typical facilities. Reset Condenser Return Water Temperature

61
Decreasing cooling tower return water temperature has the same effect as increasing the chilled water supply temperature. The cooling tower return temperature should be reset based on weather conditions. The cooling tower return water temperature reset can be implemented using the building automation system (BAS). If it cannot be implemented using the BAS, operators can reset the set point daily using the daily maximum wet bulb or dry bulb temperature. Decreasing the cooling tower return temperature may increase fan power consumption. However, fan power may not necessarily increase with lower cooling tower return water temperature. Increase Chilled Water Return Temperature
Increasing chilled water return temperature has the same effect as increasing chilled water supply temperature. It can also significantly decrease the secondary pump power because the higher the return water temperature (for a given supply temperature), the lower the chilled water flow. Maximizing chilled water return temperature is much more important than optimizing supply water temperature since it often provides much more savings potential. It is difficult to increase supply temperature 5°F above the design set point. It is often easy to increase the return water temperature as much as 7°F by conducting water balancing and shutting off by-pass and three-way valves. Use Variable Flow under Partial Load Conditions
Typical central plants use primary and secondary loops. A constant speed primary pump is often dedicated to a particular chiller. When the chiller is turned on, the pump is on. Chilled water flow through each chiller is maintained at the design flow rate by this operating schedule. When the building-loop flow is less than the chiller loop flow, part of the chiller flow bypasses the building and returns to the chiller. This practice causes excessive primary pump power consumption and low entering water temperature to the chiller which increases the compressor power consumption. It is the general perception that the chilled water flows have to remain constant for chiller operational safety. Actually, most new chillers allow chilled water flow as low as 30% of the design value. The chilled water flow can be decreased as low as 50% for most existing chillers. Varying chilled water flow through a chiller can result in significant pump power savings. Although the primary pumps are kept on all the time, the secondary pump power consumption is decreased significantly when compared to the conventional primary and secondary system operation. Varying chilled water flow through the chillers will also increase the chiller efficiency when compared to constant water flow with chilled water bypass.

62
Use Variable Flow under Partial Load Conditions
For most chillers, the kW/ton decreases (COP increases) as the load ratio increases from 40% to 80%. When the load ratio is too low, the capacity modulation device in the chiller lowers the chiller efficiency. When the chiller has a moderate load, the capacity modulation device has reasonable efficiency. The condenser and evaporator are oversized for the load under this condition so the chiller efficiency is higher. When the chiller is at maximum load, the evaporator and condenser have a smaller load ratio, reducing the chiller efficiency below its maximum value. Running chillers in the high efficiency range can result in significant electrical energy savings and can improve the reliability of plant operation. If the building bypass cannot be closed, the minimum chiller load ratio should be maintained at 50% or higher. In this case, the primary pump power consumption increases with the number of chillers in operation. Although the compressor power is decreased, the primary pump power increases significantly. The total power consumption is often higher if the chiller load is less than 50%. A single loop may be used for some plants. In this case, a control schedule can be developed to share primary pumps under partial load conditions. For example, when the load is less than 50% for two chillers, a single pump can sometimes be used. If two pumps are used, the central plant may use approximately the same amount of energy as one chiller at peak load. Maintain Good Operating Practices
It is important to follow the operating procedures recommended by the manufacturer. It is important to calibrate the temperature, pressure and current sensors and flow switches periodically. The temperature sensors are especially important for maintaining efficient operation. Control parameters must be set properly, particularly the time delay relay.
RCx Measures for Central Heating Plants
Central heating plants produce hot water, steam, or both, typically using natural gas, coal or oil as fuel. Steam, hot water, or both are distributed to buildings for HVAC systems and other end uses, such as cooking, cleaning, sterilization and experiments. Boiler plant operation involves complex chemical, mechanical and control processes. Energy performance and operational reliability can be improved through numerous measures. The RCx measures discussed here are limited to those that can be implemented by operating technicians, operating engineers, or RCx engineers.
Optimize Supply Water Temperature and Steam Pressure
Steam pressure and hot water temperature are the most important safety parameters for a central heating plant. Reducing the boiler steam pressure and hot water temperature has numerous benefits including:
- Improved plant safety

63
- Increased boiler efficiency and decreased source energy consumption - Increased condensate return from buildings and improved building automation
system performance. Most condensate tanks are open to mechanical rooms. When the steam pressure is decreased, secondary evaporation is significantly decreased and mechanical room relative humidity level is decreased. This also improves the humidity level of the compressed air provided to the pneumatic systems.
- Reduced hot water and steam leakage through malfunctioning valves. For example, 5% hot water leakage at 180°F carries five times more energy into the space than the same amount of water at 90°F.
Optimize Feed Water Pump Operation
The feed water pump is sized based on boiler design pressure. Since most boilers operate below the design pressure, the feed water pump head is often significantly higher than required. This excessive pump head is often dropped across pressure reducing valves and manual valves. Installing a VSD on the feed water pump in these cases can decrease pump power consumption and improve control performance. Trimming the impeller or changing feed water pumps may also be feasible and the cost may be lower. However, the VSD provides more flexibility and can be adjusted to any level. Consequently, it maximizes the savings and can be adjusted to future changes as well. Optimize Airside Operation
The key issues are excessive air flow and flue gas temperature control. Some excess air flow is required to improve the combustion efficiency and avoid having insufficient combustion air during fluctuations in air flow. However, excessive air flow will consume more thermal energy since it must be heated from the outside air temperature to the flue gas temperature. The boiler efficiency decreases as excessive air flow increases. The flue gas temperature should be controlled properly. If the flue gas temperature is too low, acid condensation can occur in the flue. If the flue gas temperature is too high, it carries out too much thermal energy. The airside optimization starts with a combustion analysis that determines the combustion efficiency based on the flue gas composition, flue gas temperature and fuel composition. The typical combustion efficiency should be higher than 80%. Optimize Boiler Staging
Most central plants have more than one boiler. Using optimal staging can improve plant energy efficiency and reduce maintenance cost. Boiler staging involves boiler shut-off, start-up and standby. Because of the large thermal inertial and temperature changes between shut-off, standby and normal operation, precautions must be taken to prevent corrosion and expansion damage. Generally speaking, short-term (monthly) turn on/off should be avoided for steam boilers. Hot water boilers are sometimes operated to provide water temperatures as low as 80°F. This improves distribution efficiency, but may lead to acid condensate in the flue. The hot water temperature must be kept high enough to prevent this condensation.

64
Improve Multiple Heat Exchanger Operation
Heat exchangers are often used in central plants or buildings to convert steam to hot water or high temperature hot water to lower temperature hot water. If more than one heat exchanger is installed, use as many heat exchangers as possible provided the average load ratio is 30% or higher. Maintain Good Operating Practices
Central plant operation involves energy efficiency and safety issues. Proper safety and maintenance guidelines should be followed. The following maintenance issues should be carefully addressed:
- Blowdown: Check blowdown setup if a boiler is operating at partial load most of the time. The purpose of blowdown is to remove the mineral deposits in the drum. The mineral deposit is proportional to the make-up water which is then proportional to the steam or hot water production. The blowdown can often be set back significantly. If the load ratio is 40% or higher, the blowdown can be reset proportional to the load ratio. If the load ratio is less than 40%, keep the blowdown rate at 40% of the design blowdown rate.
- Steam traps: Check steam traps frequently. Steam traps still have a tendency to fail, and leakage costs can be significant. A steam trap maintenance program is recommended. Consult the manufacturer and other manuals for proper procedures and methods.
- Condensate return: Inspect the condensate return frequently. Ensure as much condensate is returned as possible. This is very expensive water. It has high energy content and is treated water. When condensate is lost, make-up water, chemicals, fuel, and in some cases sewage costs, must be paid.


